
An Invitation on Characterization of H2-Reduced Bauxite Residue and Recovering Iron through Wet Magnetic Separation Processes


Abstract
:1. Introduction
2. Materials and Methods
2.1. Sample Preparation
2.2. Characterisation Methods
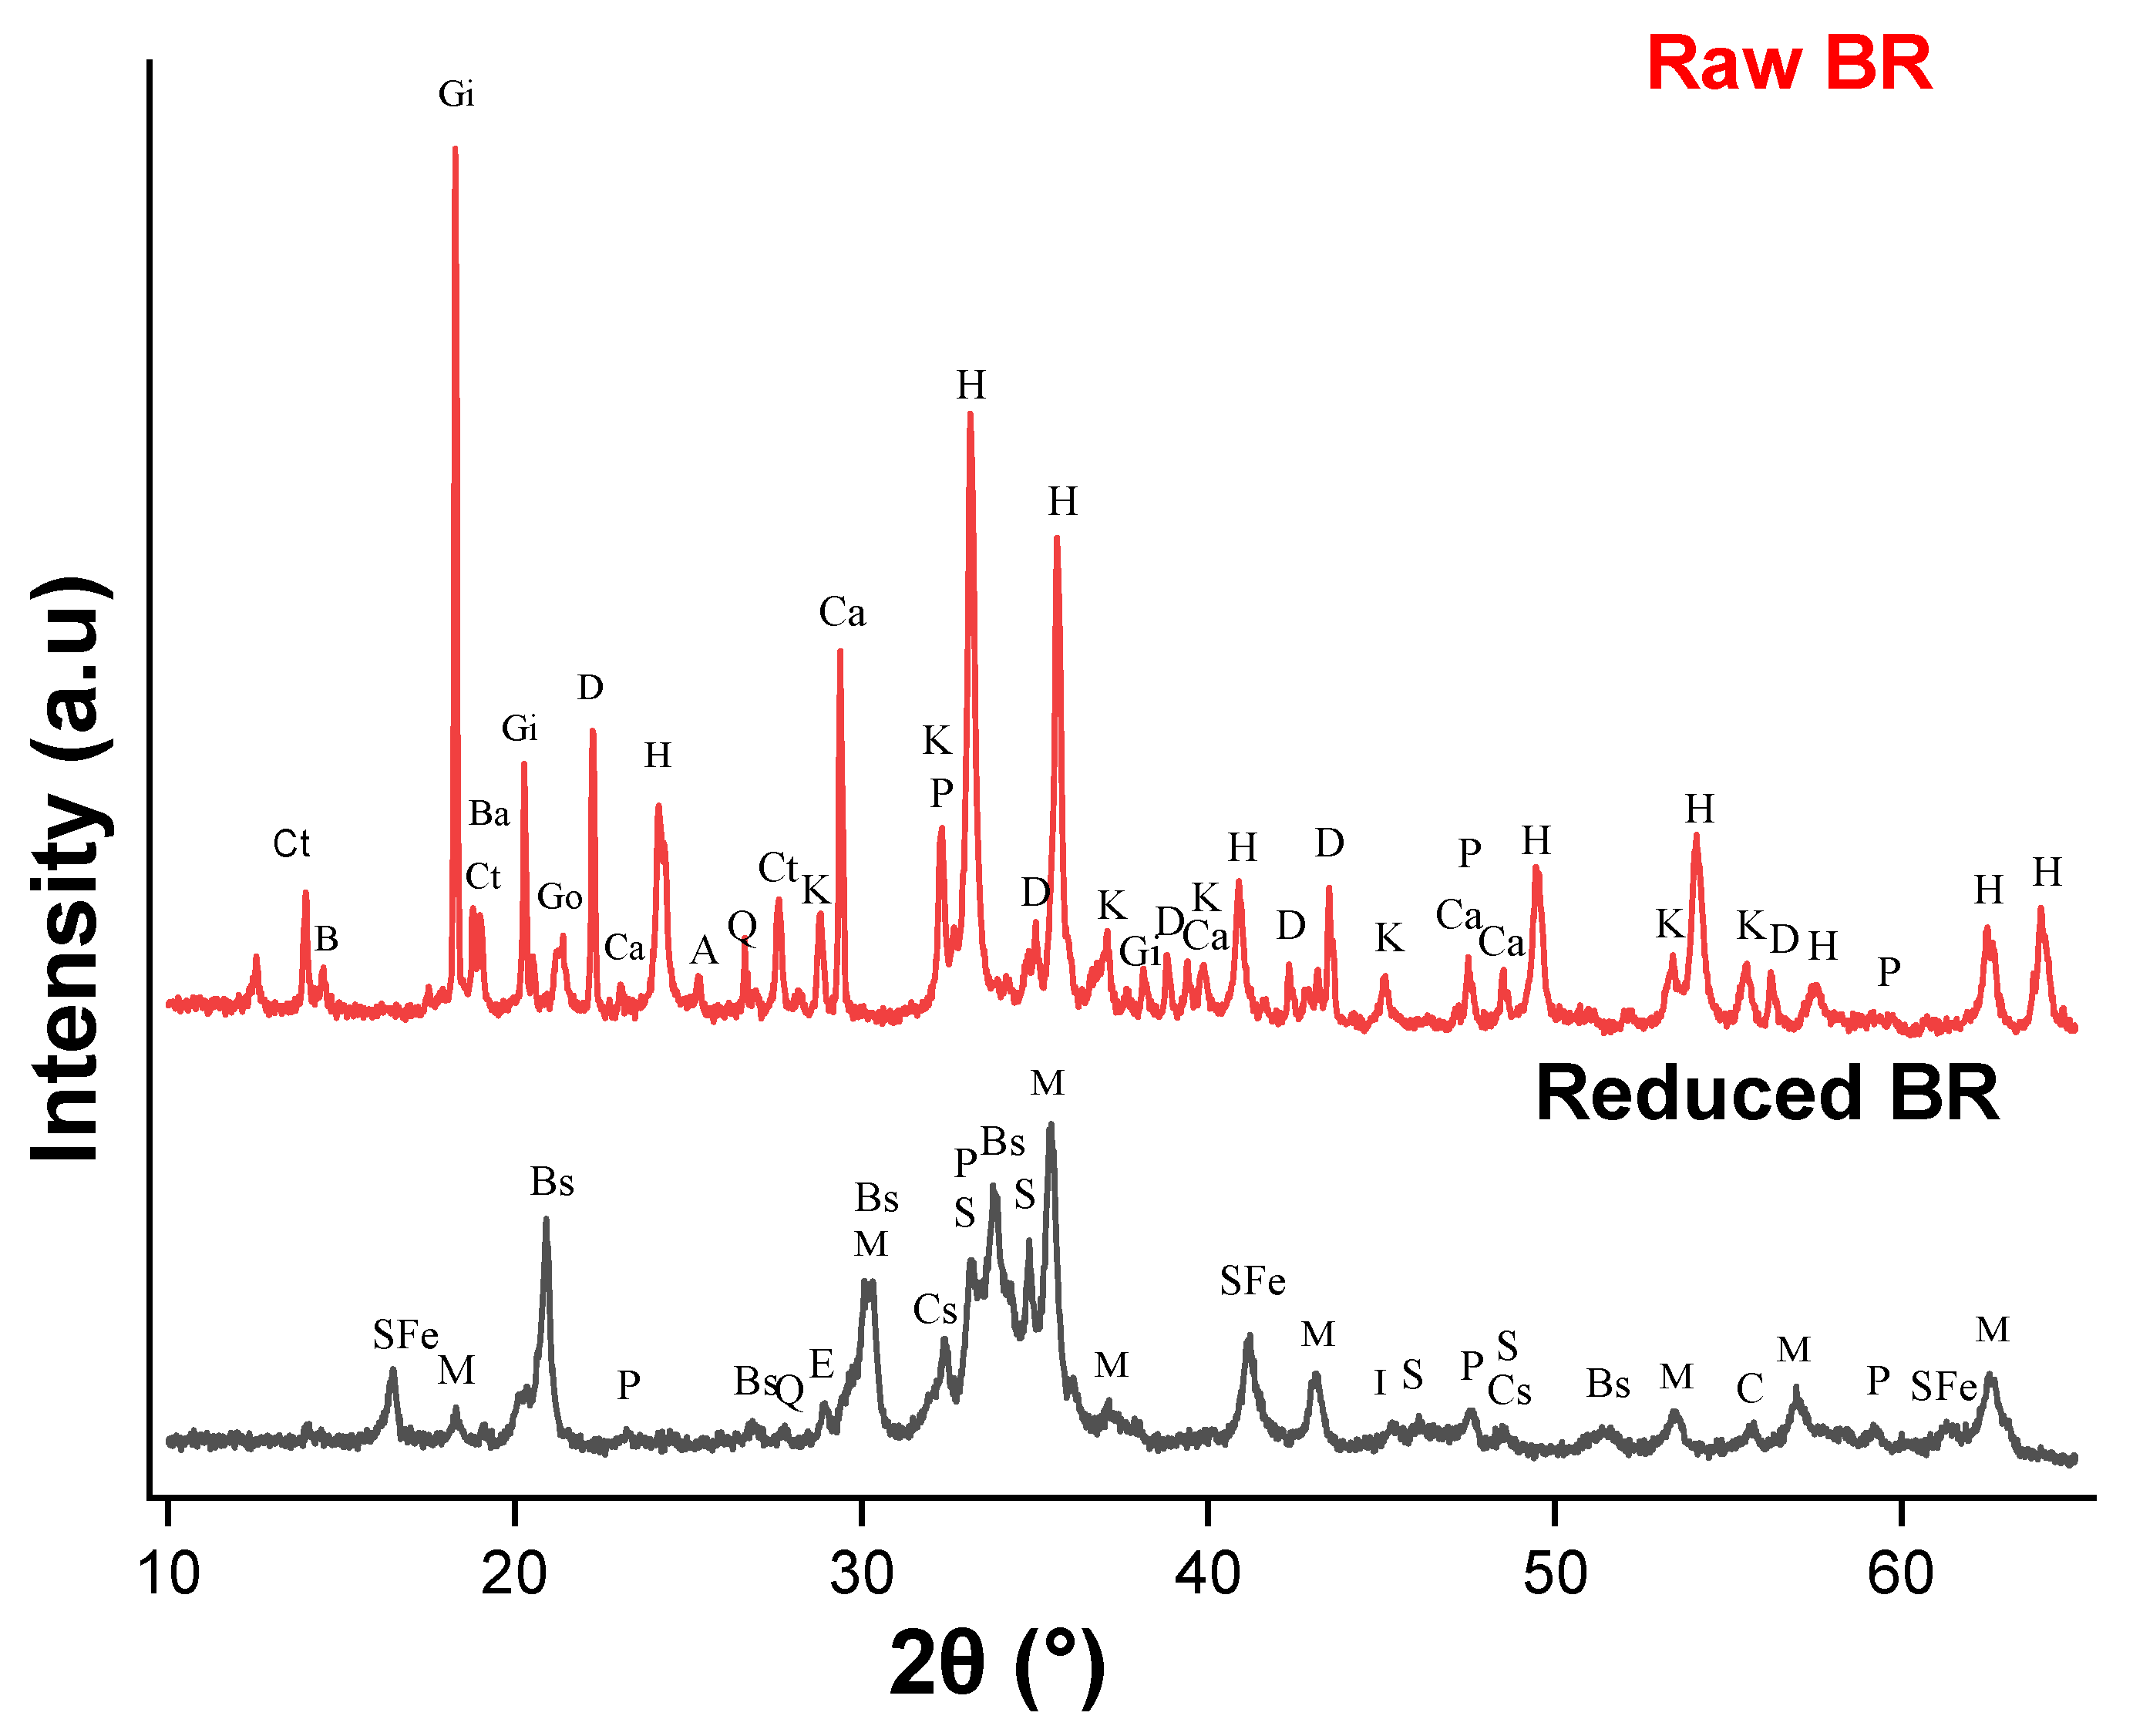
2.2.1. XRD Measurements
2.2.2. XRF Analysis
2.2.3. ICP-MS Analysis
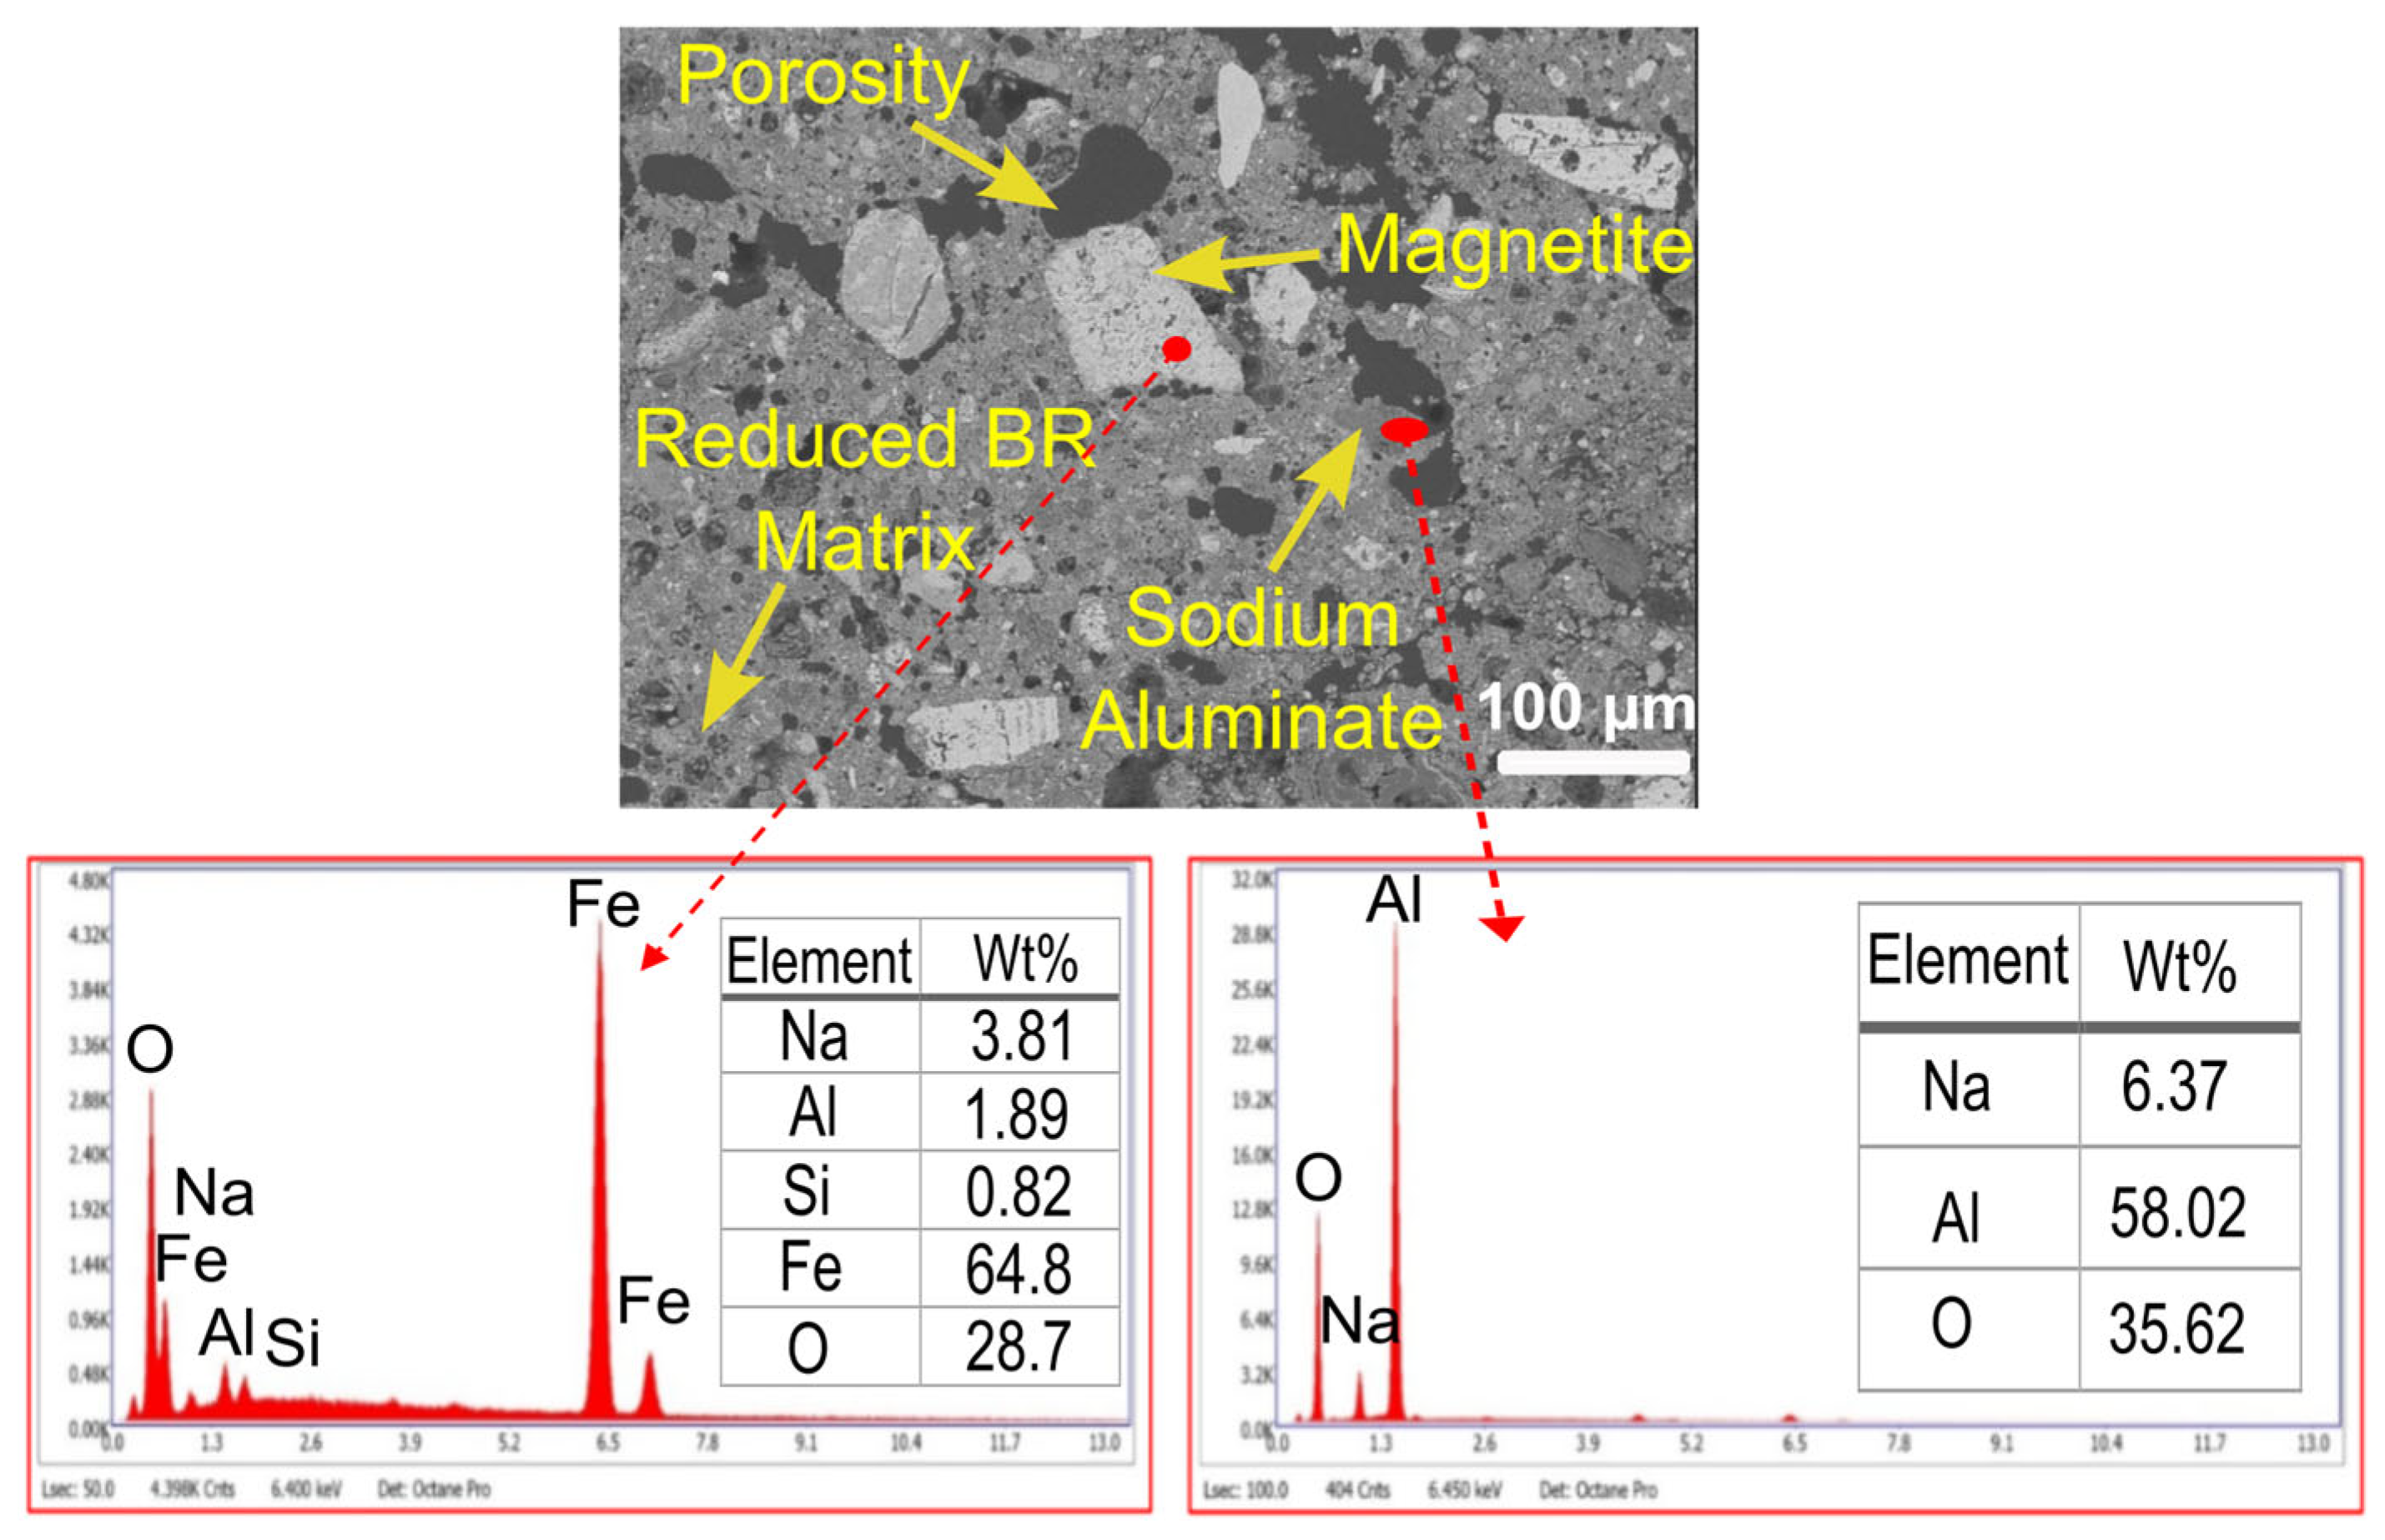
2.2.4. SEM-EDS Measurement
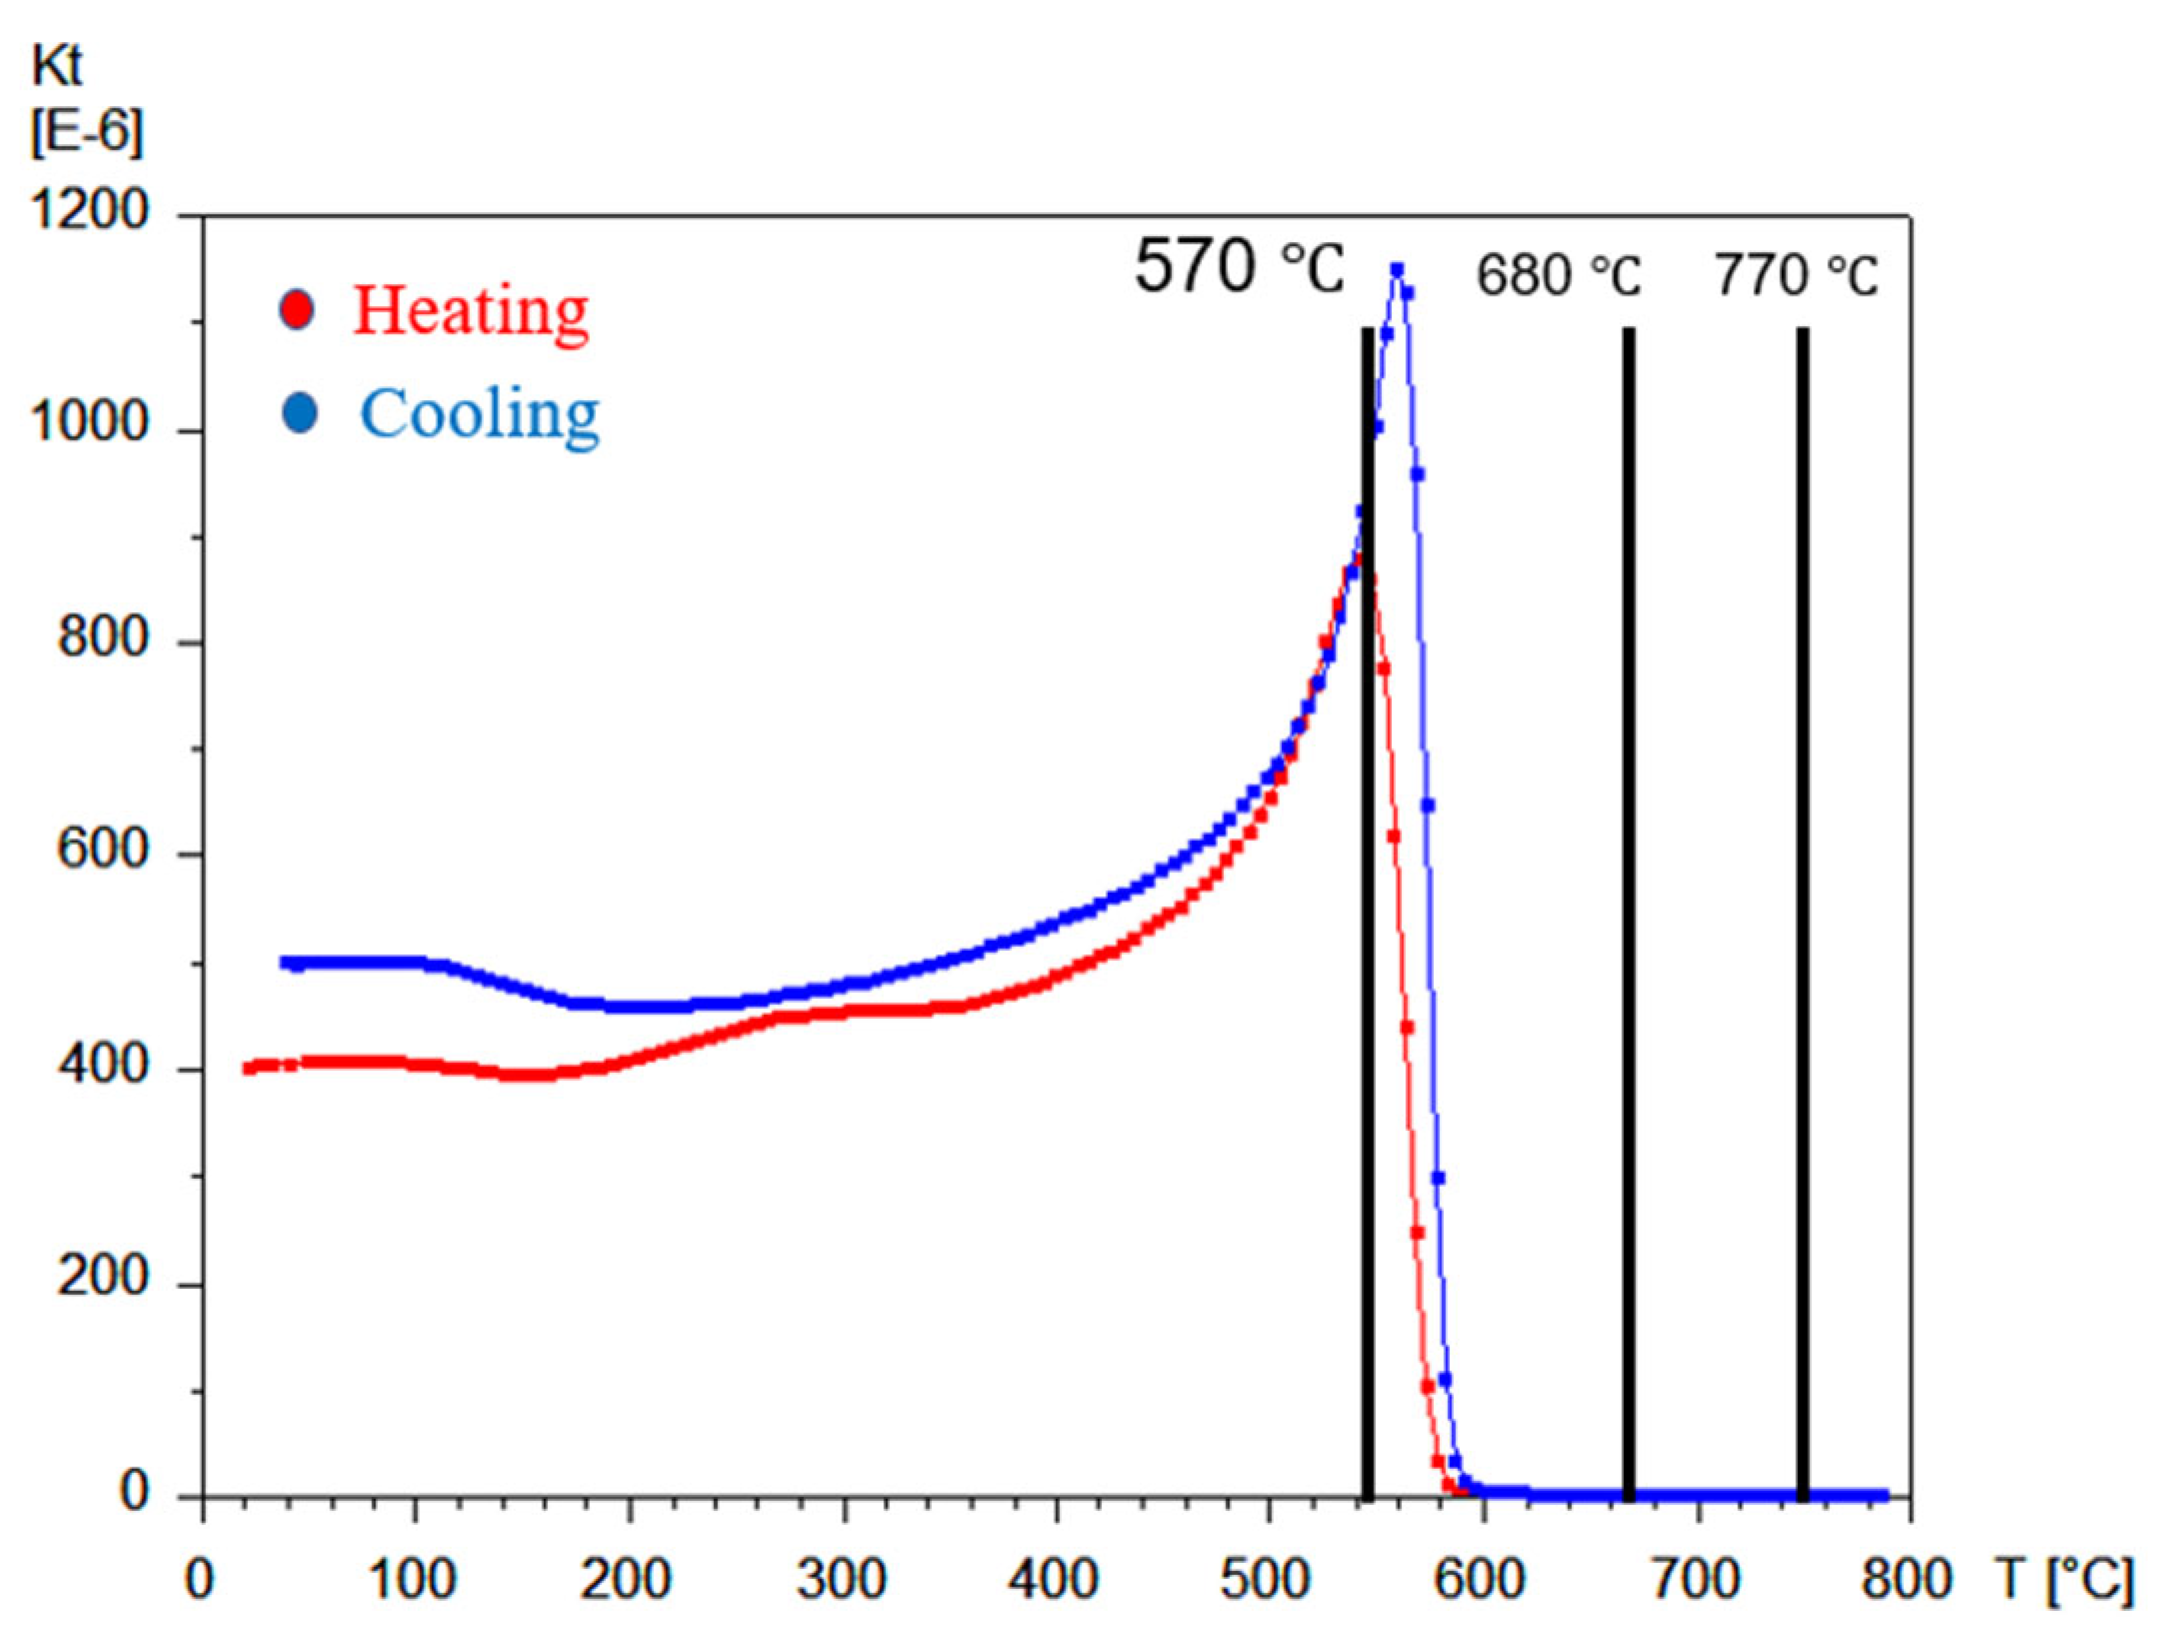
2.2.5. TMA Analysis
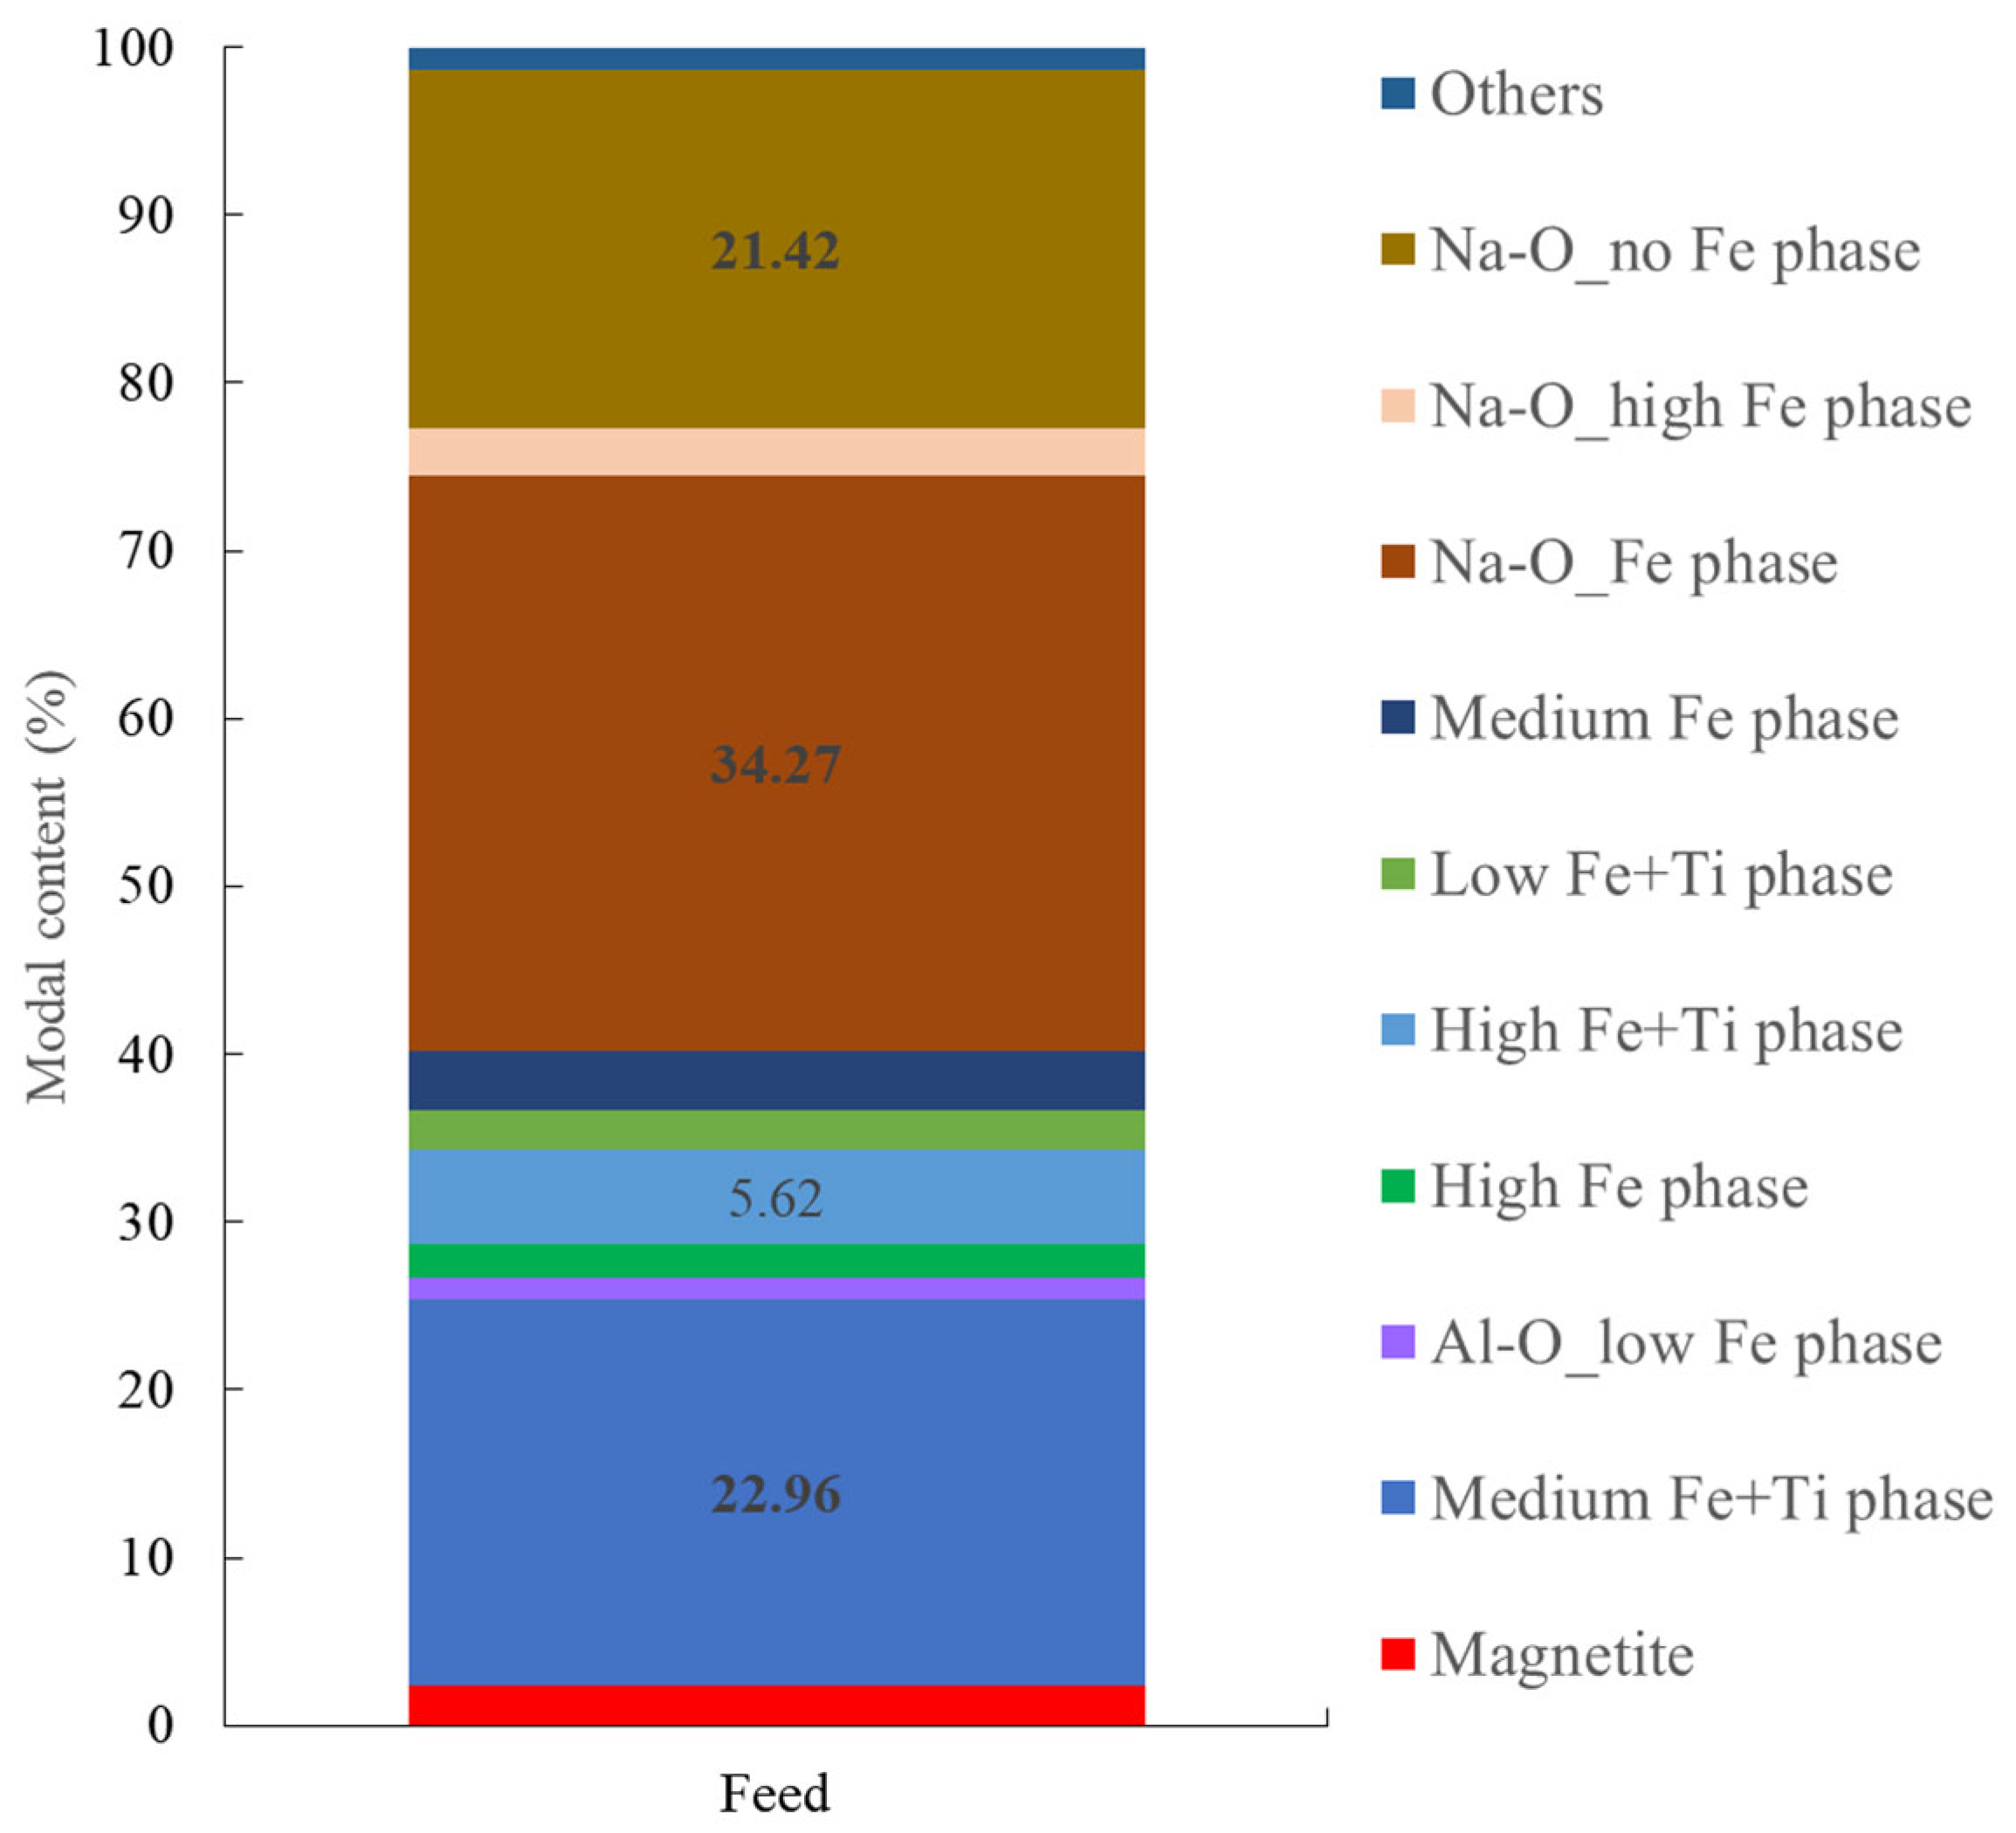
2.2.6. AM Analysis
2.3. Magnetic Separation Tests
2.3.1. Davis Tube Tests
2.3.2. Slon® Tests
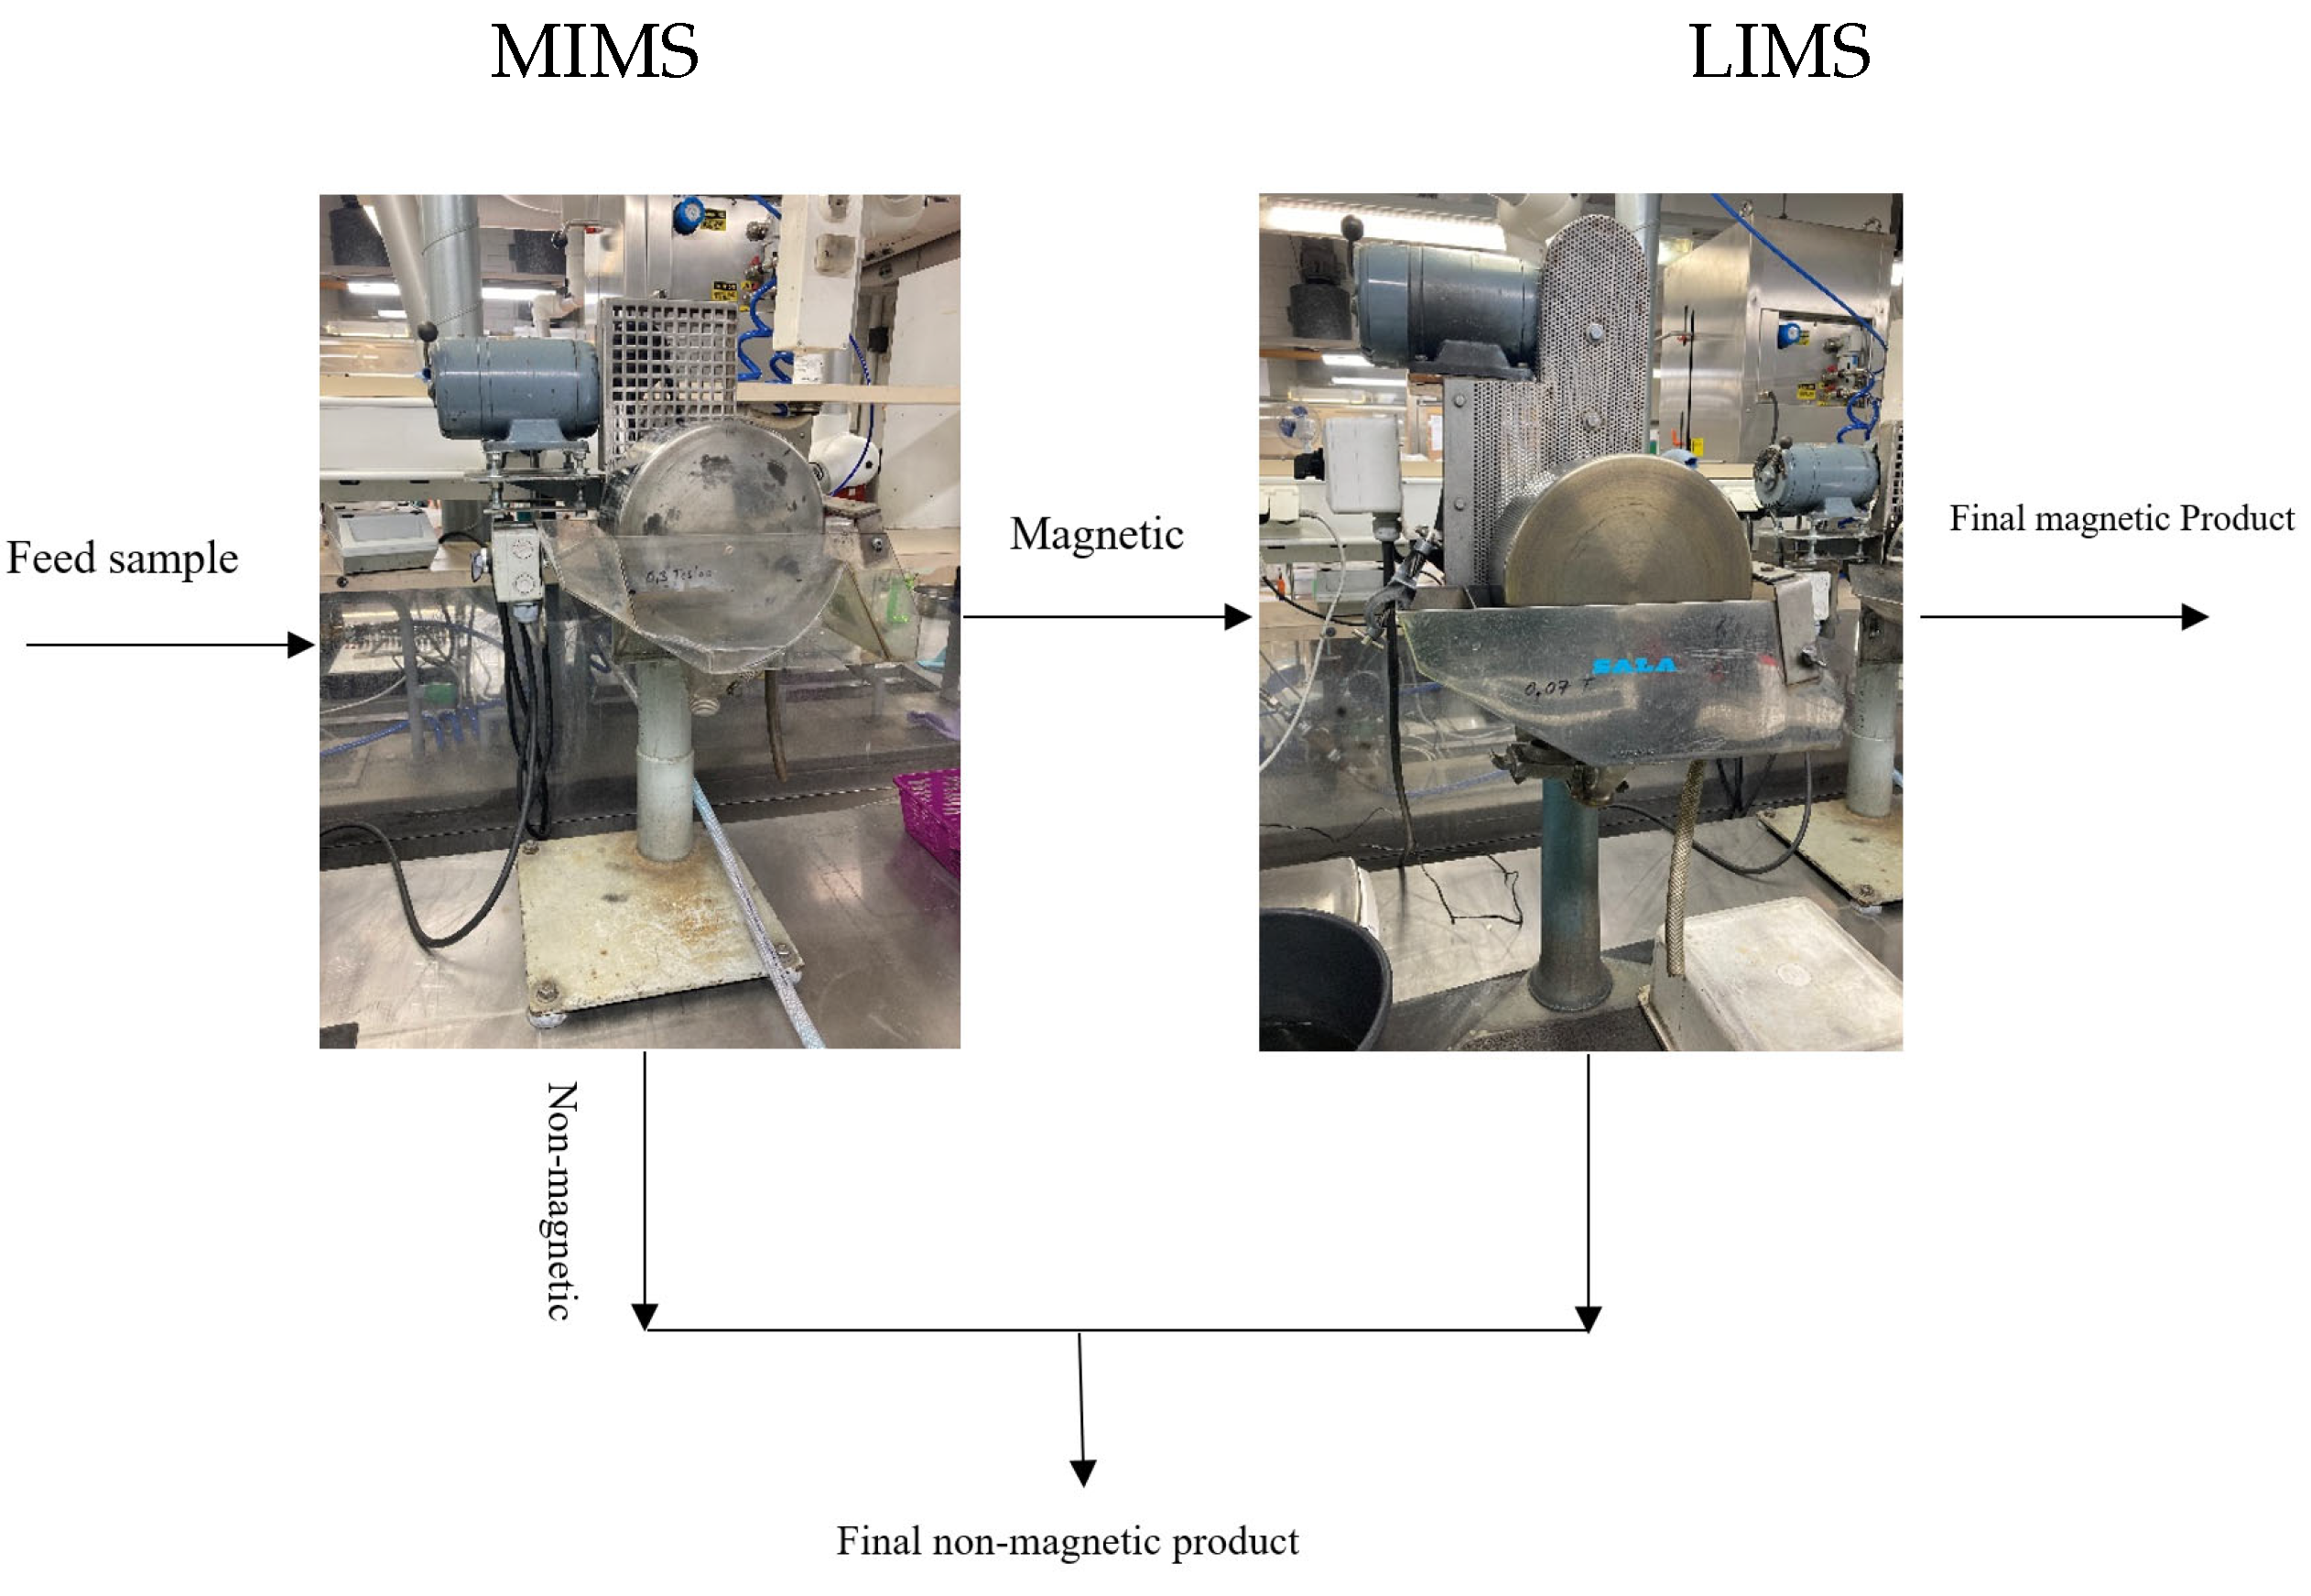
2.3.3. LIMS Trials
3. Results and Discussions
3.1. Sample Characterization
3.2. Magnetic Separation
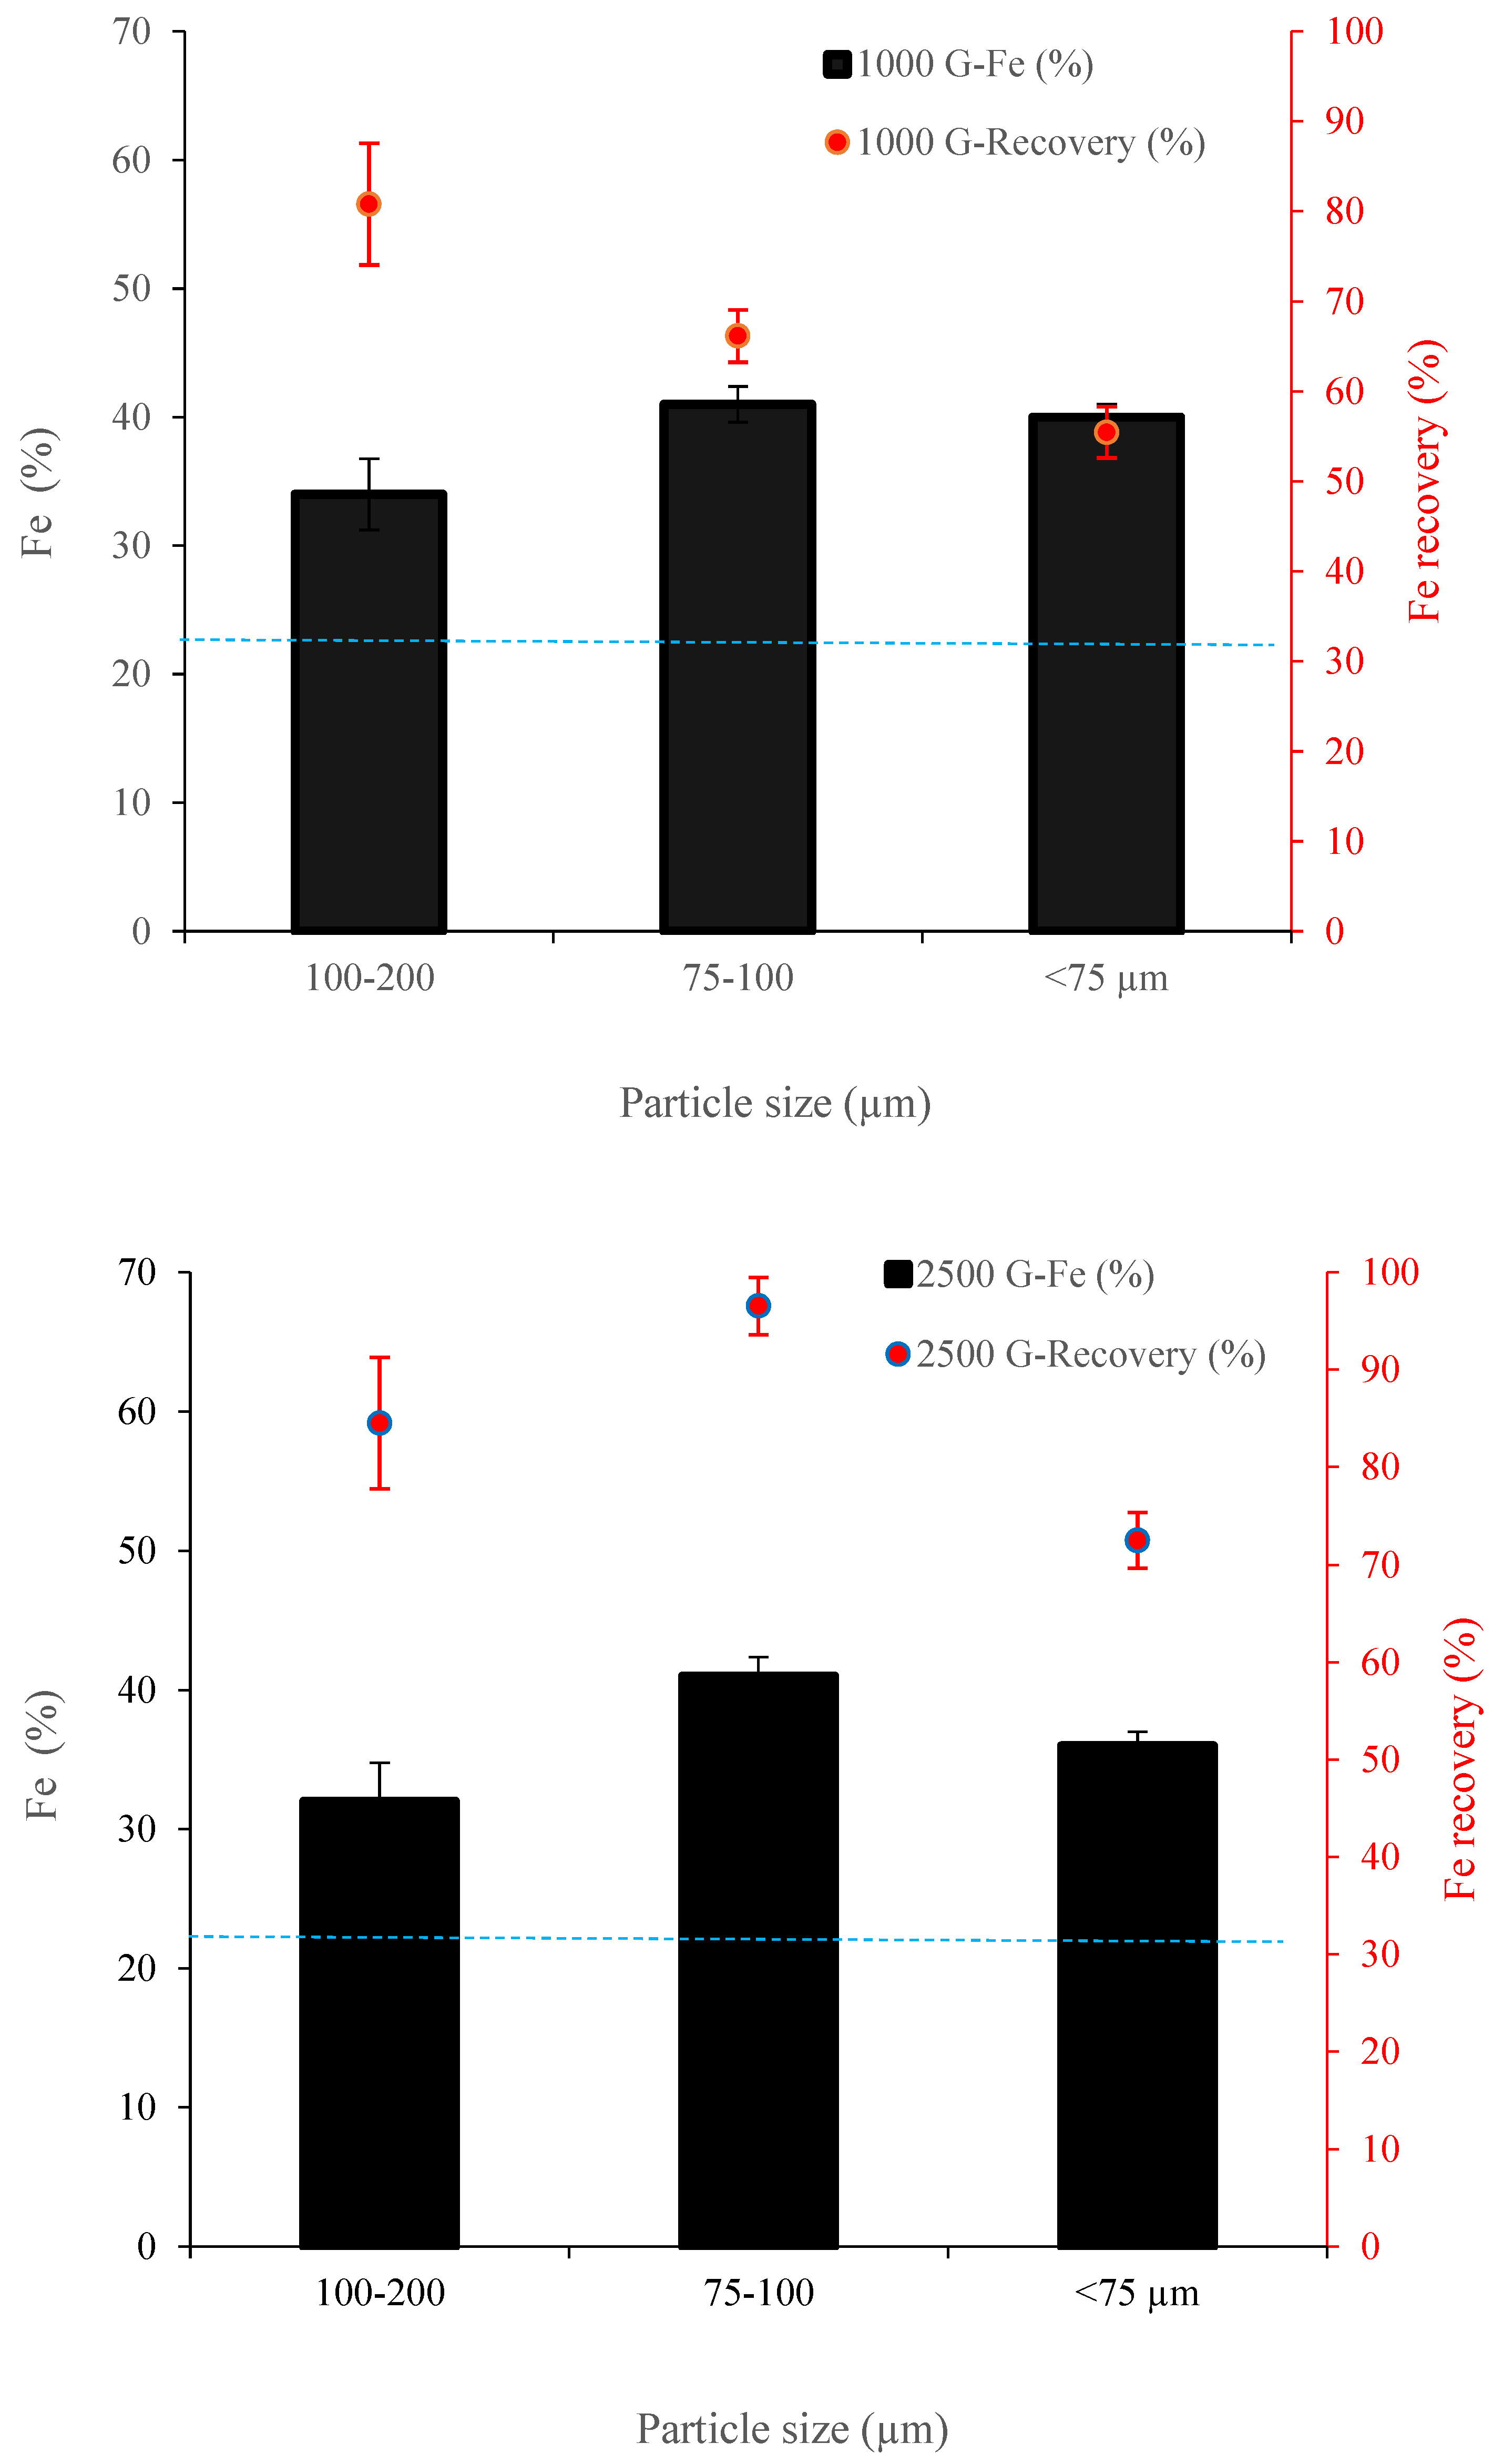
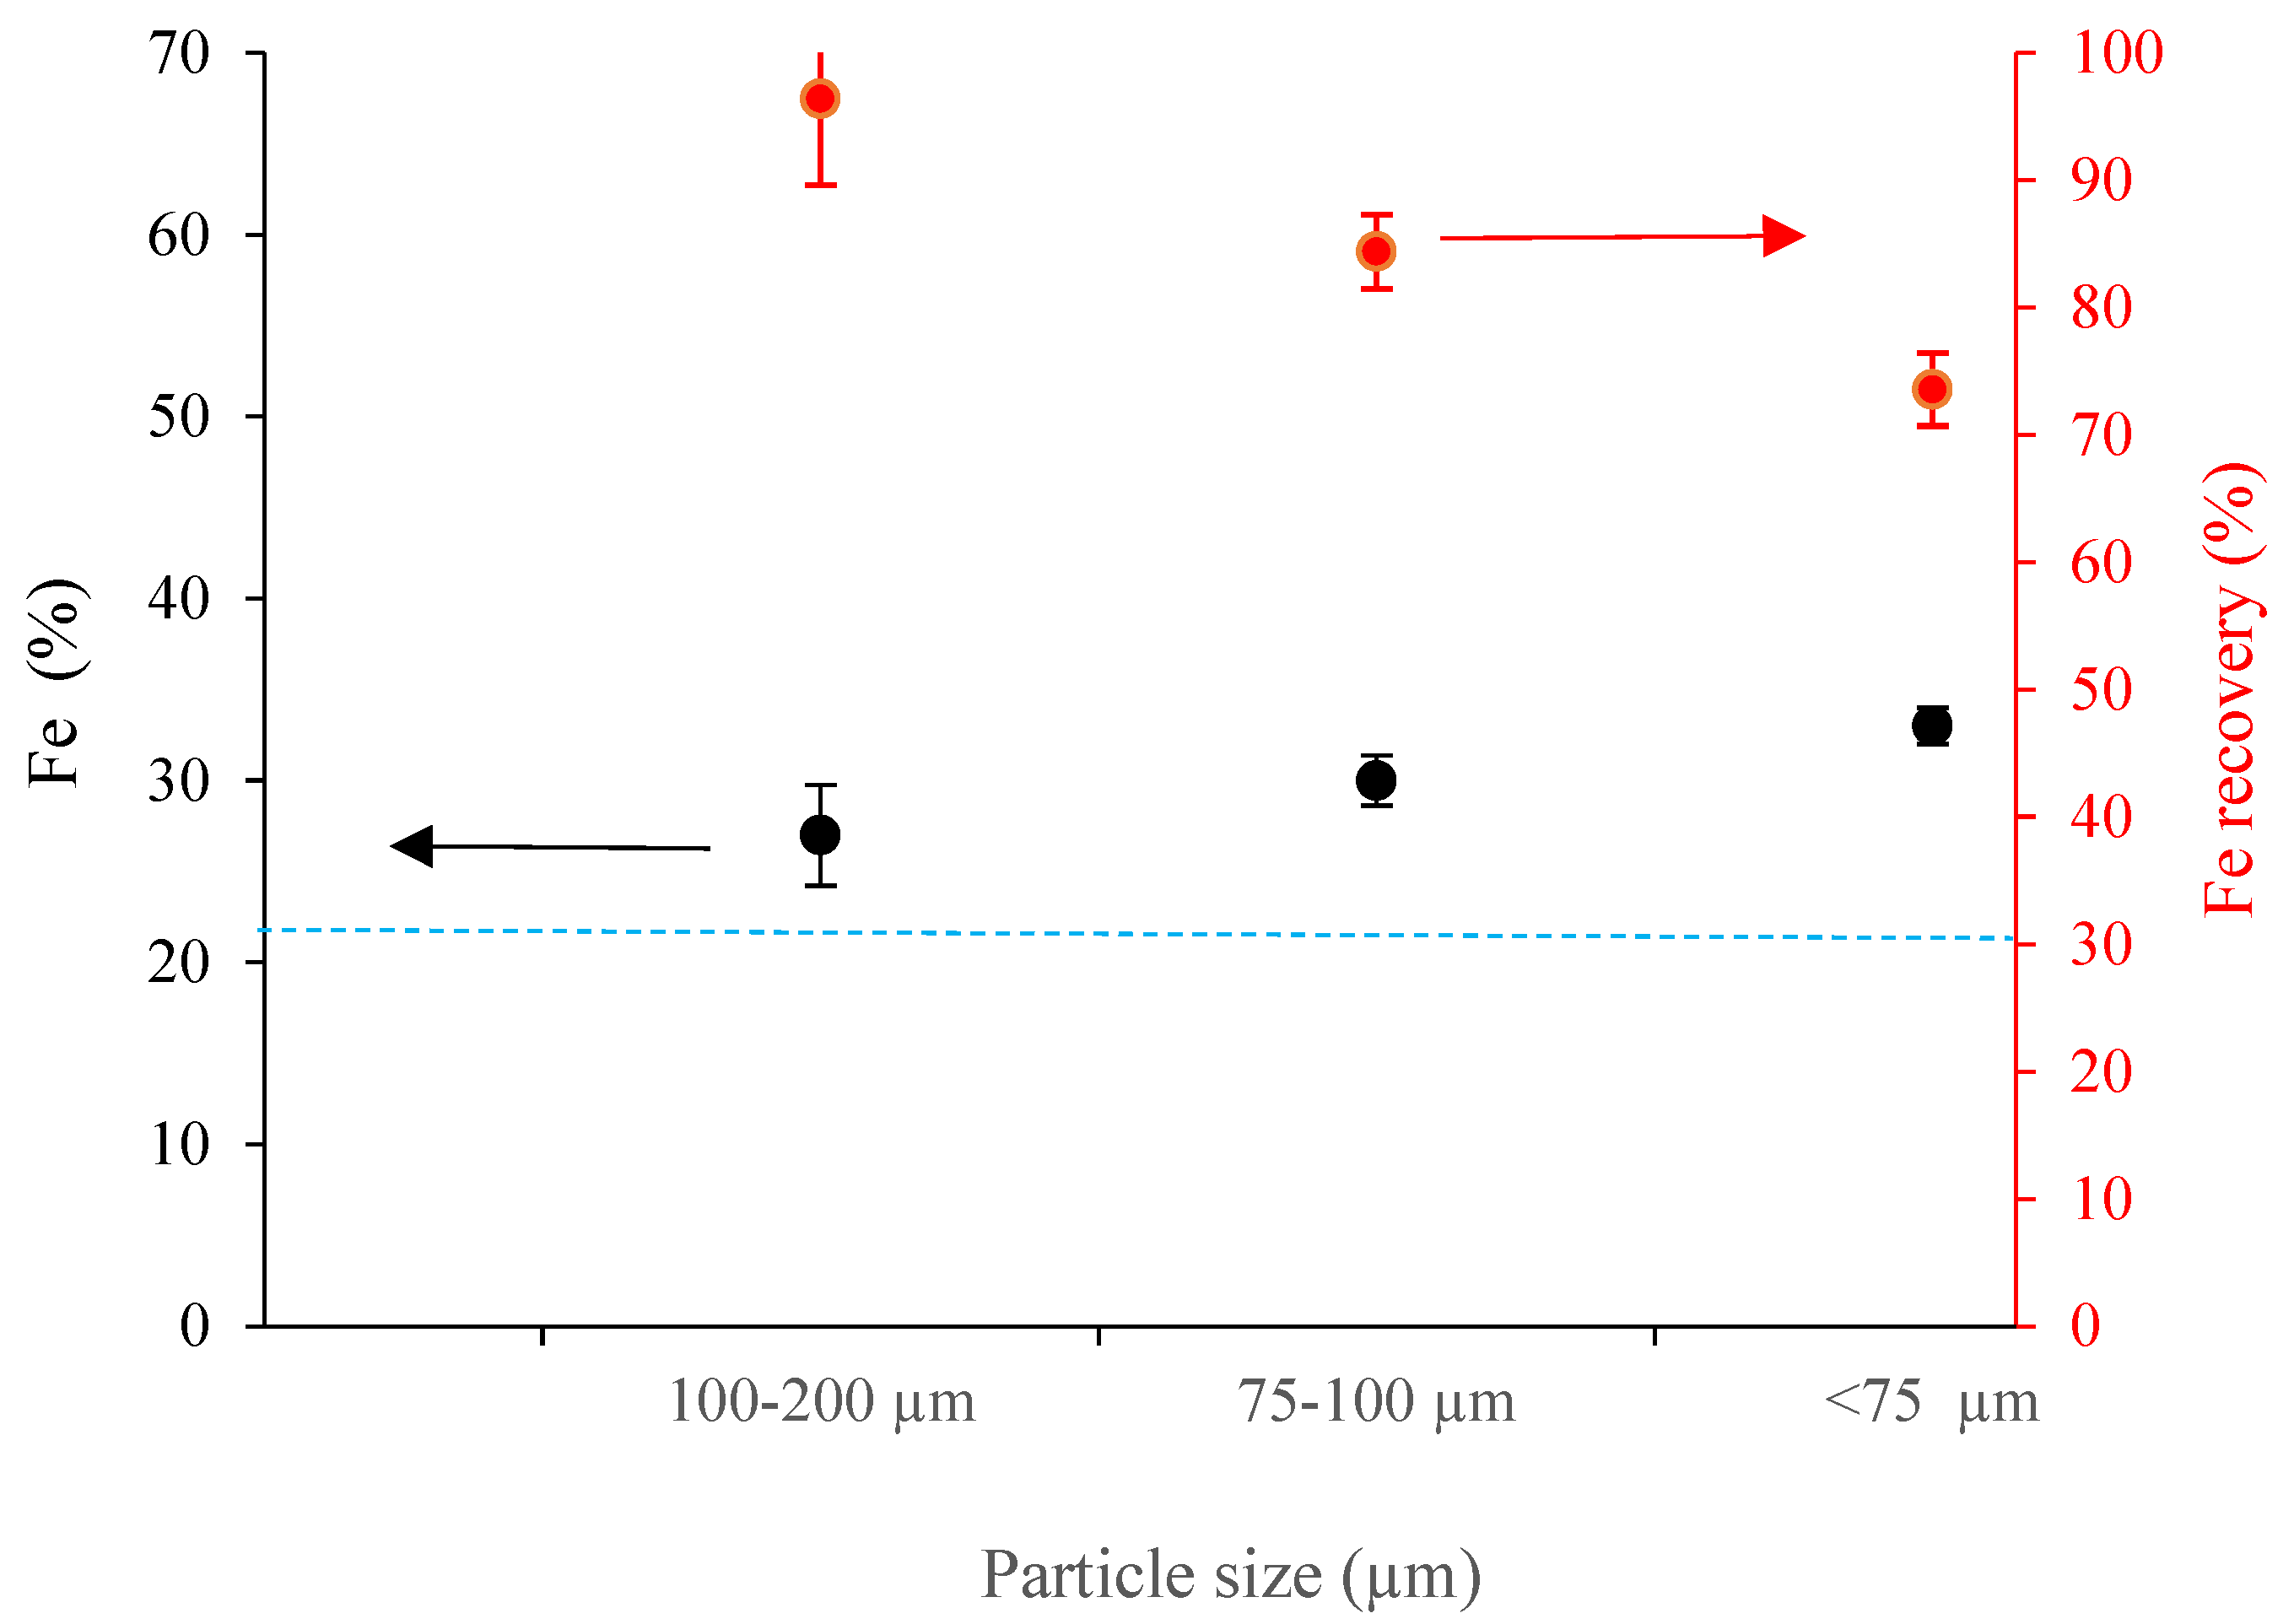
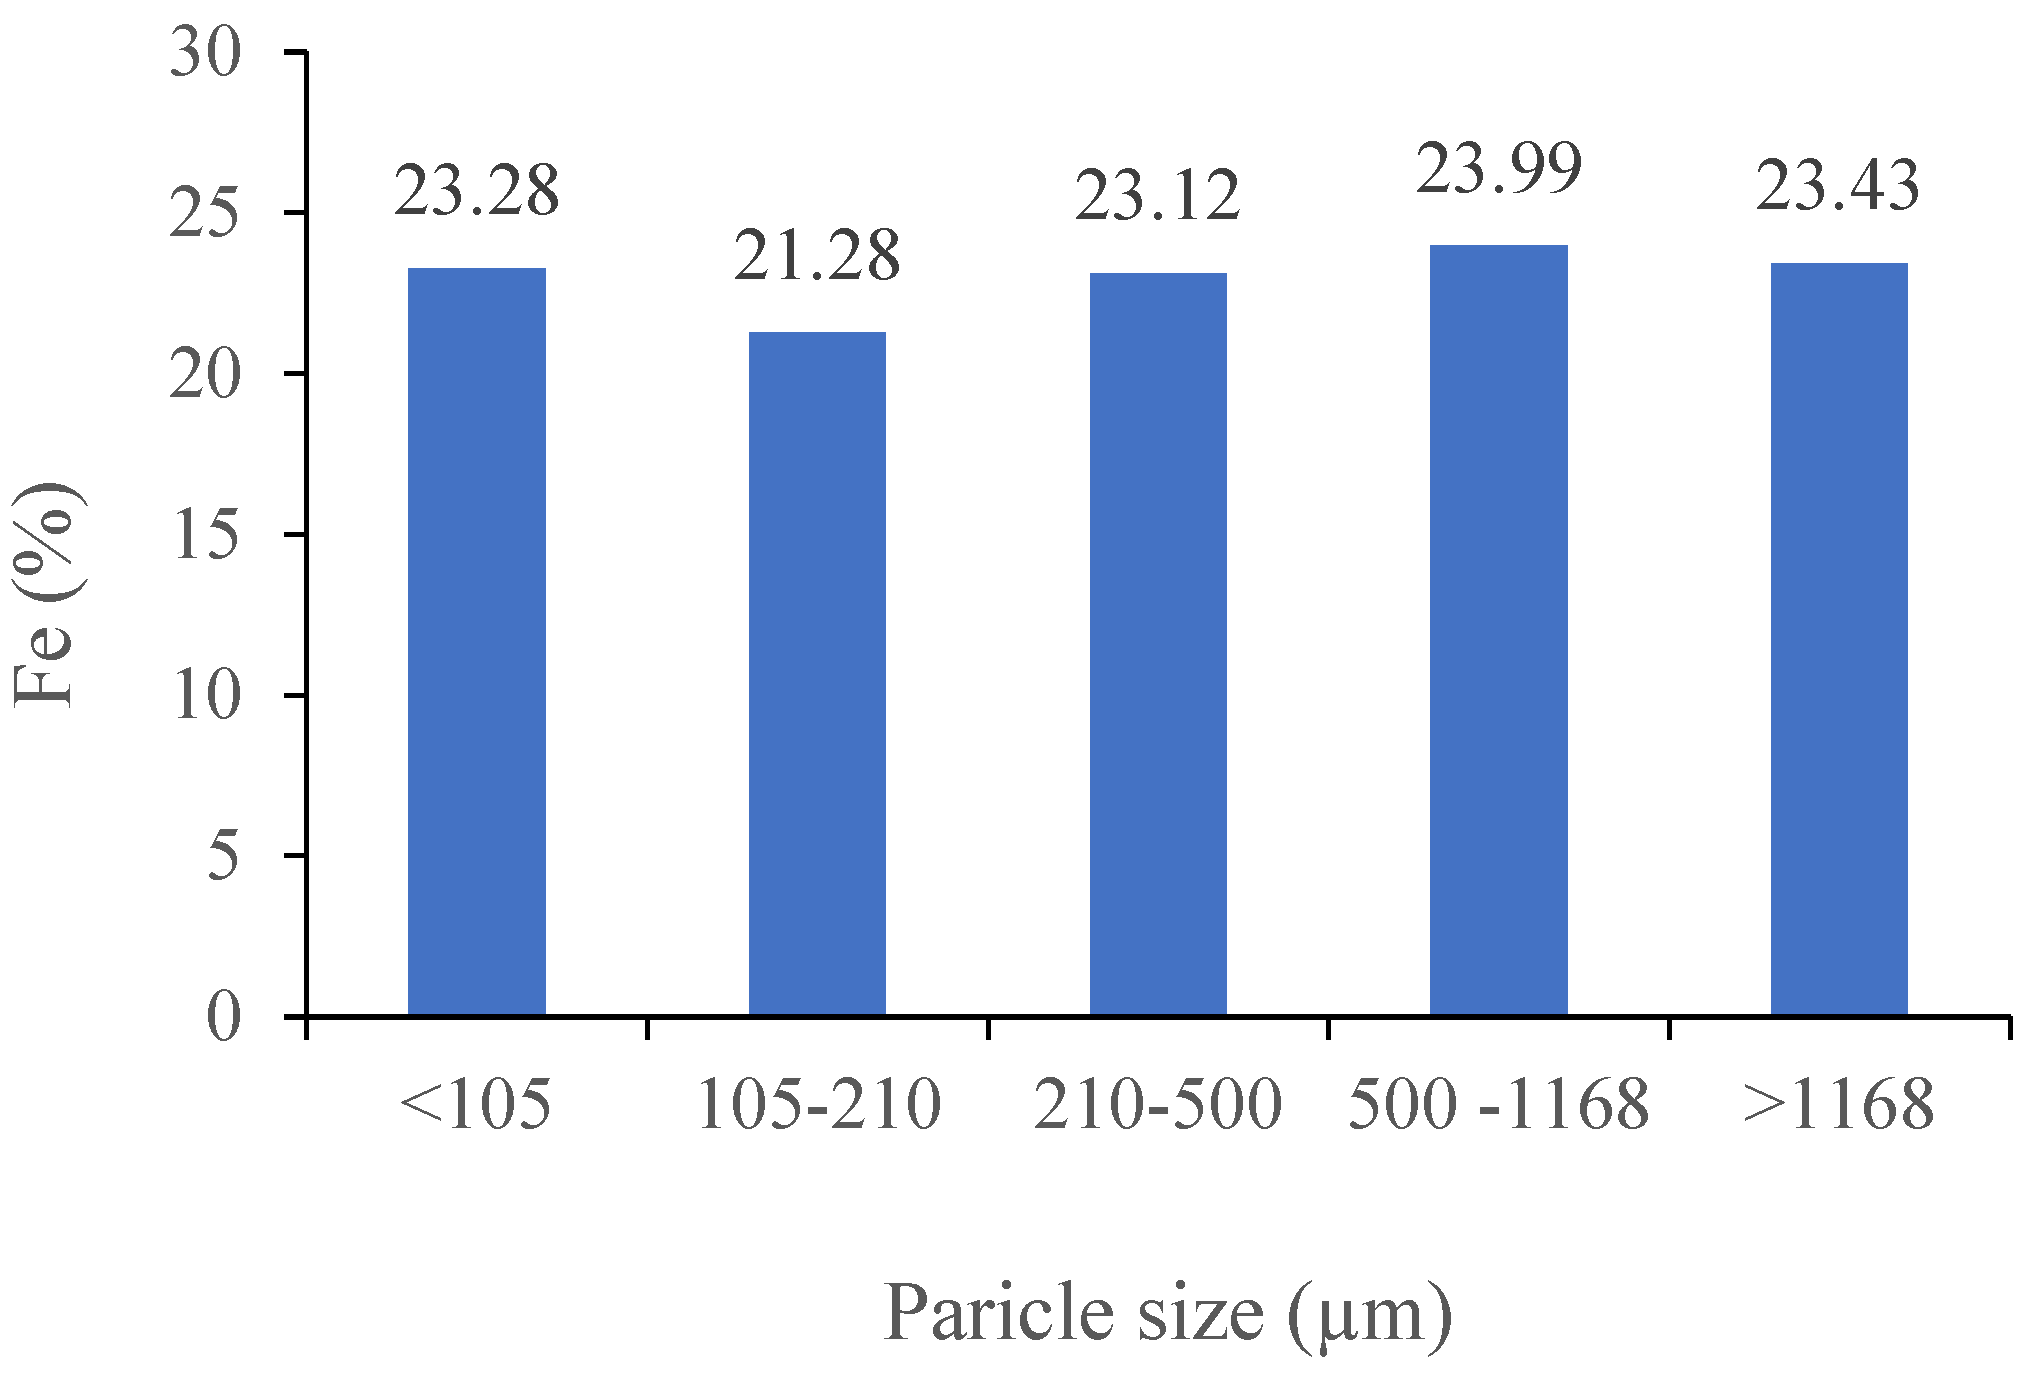
3.2.1. The Impact of Magnetic Intensity and Particle Size (Davis Tube and Slon® Tests)
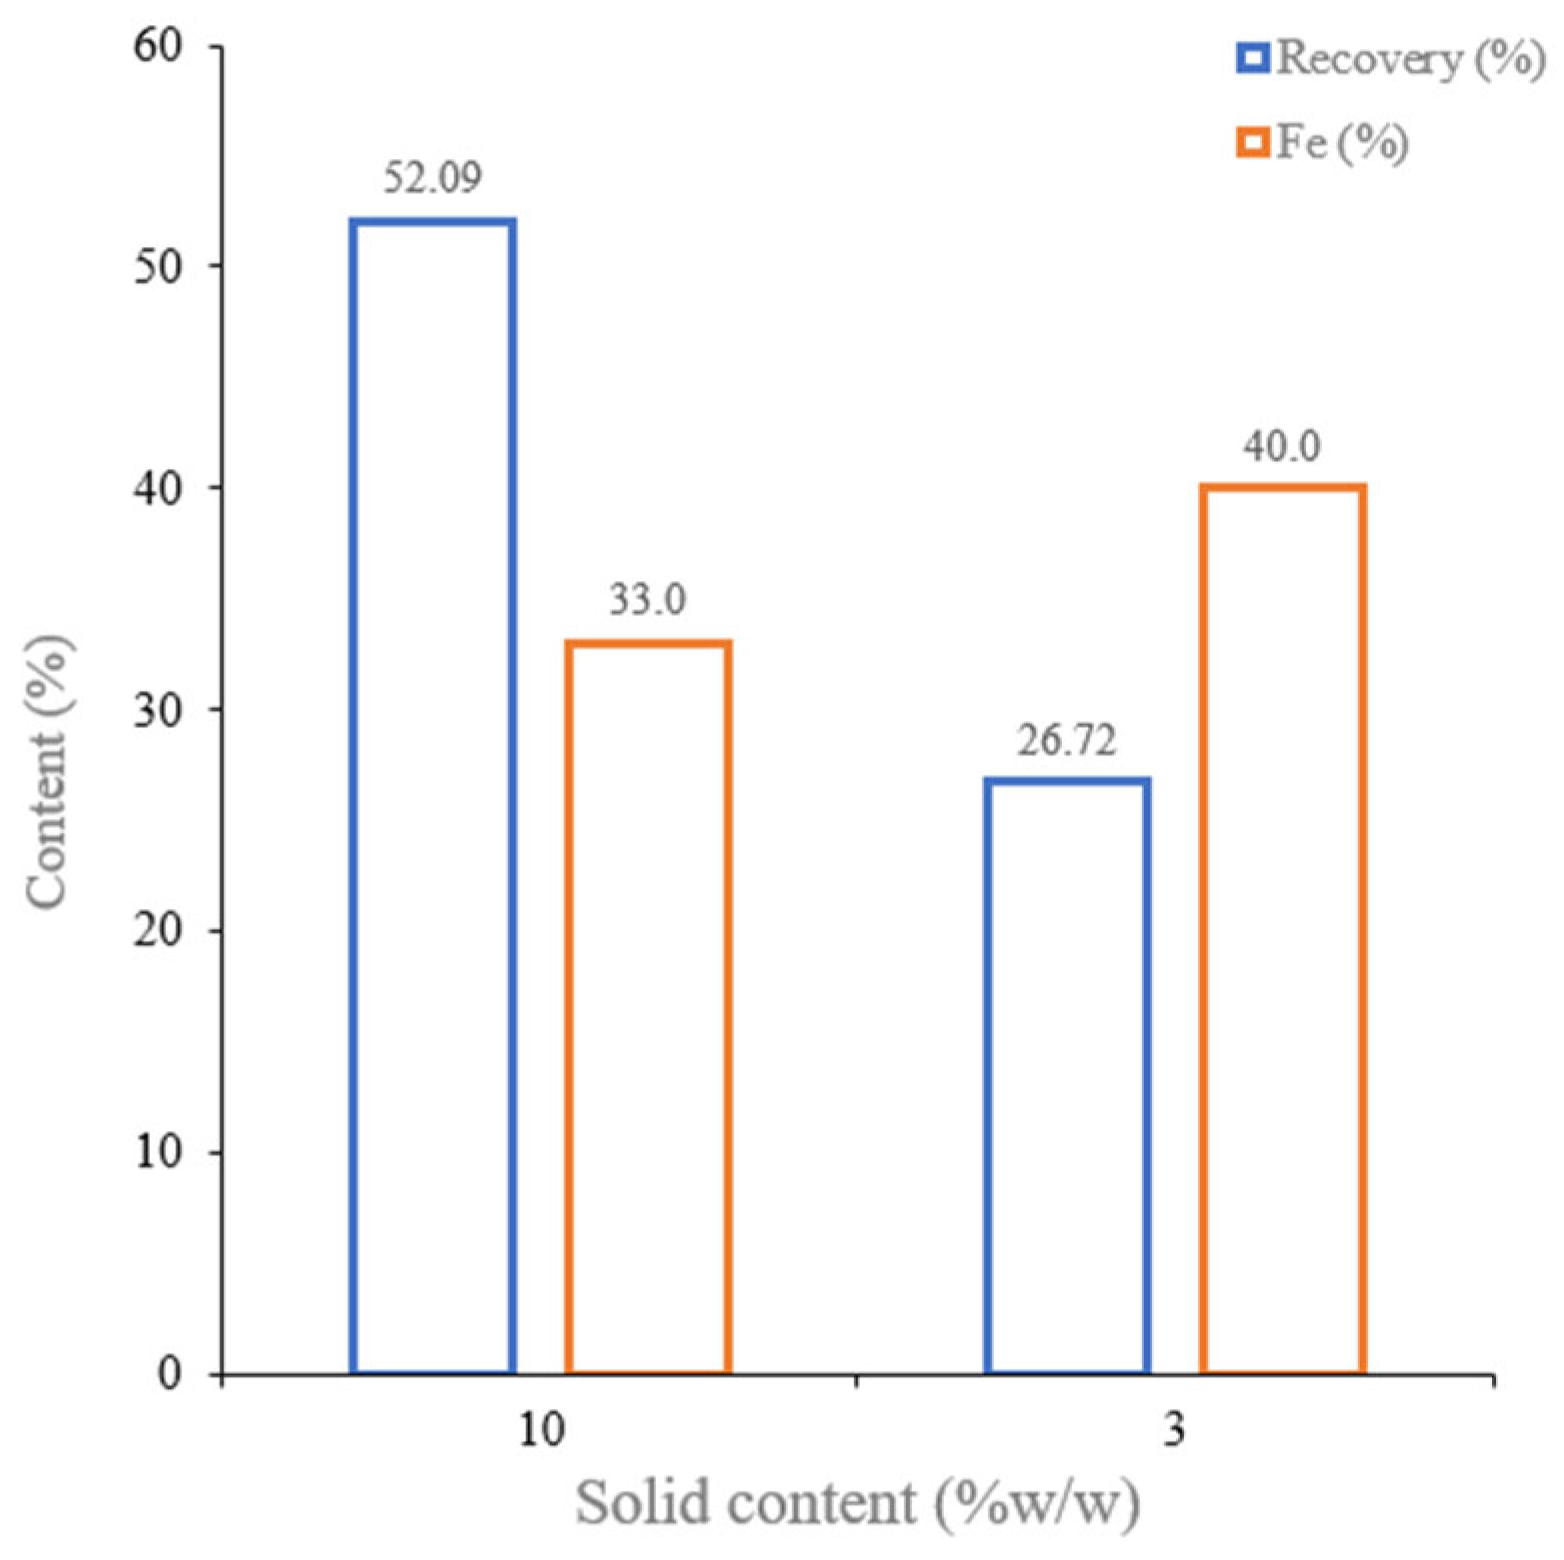
3.2.2. Wet Low-Intensity Magnetic Separation (WLIMS)
4. Conclusions and Future Works
- Further experimental studies to acquire an in-depth understanding of the sample characterization using micro-computed tomography with respect to the significant difference in X-ray adsorption densities between Ti- and Fe-bearing phases and Na, Ca-embedded phases;
- Applying intensive grinding/ultrafine grinding to reach a reasonable liberation degree of magnetite at particle sizes below 20–10 µm;
- Using physicochemical-based approaches such as flocculation, flotation, and flocculation-flotation on ultrafine ground particles;
- Increasing the reduction temperature to above 900 °C in order to coarsen the Fe particles and potentially ease the downstream separation processes.
Author Contributions
Funding
Data Availability Statement
Acknowledgments
Conflicts of Interest
Appendix A

| Component | Mg | S | Ca | Mn | Fe | Co | Ni | Cu | Zn | Sr |
|---|---|---|---|---|---|---|---|---|---|---|
| Concentration * (ng/mL) | 913.49 | 649.37 | 21566.67 | 0.15 | 110.67 | 0.07 | 1.29 | 14.72 | 1.32 | 52.97 |
| Sample Type | Sample 01 | Sample 02 | Sample 03: Feed Sample | |||
|---|---|---|---|---|---|---|
| Element | pXRF * (wt%) | XRF (wt%) | pXRF * (wt%) | XRF (wt%) | pXRF * (wt%) | XRF (wt%) |
| Th | 0.013 | 0.012 | 0.009 | 0.010 | 0.01 | 0.015 |
| Zr | 0.076 | <0.050 | 0.079 | <0.050 | 0.079 | 0.075 |
| Pb | 0.011 | 0.014 | 0.011 | 0.032 | 0.020 | 0.01 |
| Zn | 0.0077 | 0.007 | 0.007 | 0.005 | 0.004 | 0.002 |
| Cu | 0.005 | 0.009 | 0.055 | 0.007 | <LOD | 0.008 |
| Ni | 0.077 | 0.077 | 0.059 | 0.070 | 0.060 | 0.05 |
| Fe | 35.90 | 36.50 | 25.65 | 26.84 | 23.40 | 22.7 |
| Cr | 0.22 | 0.160 | 0.179 | 0.147 | 0.156 | 0.18 |
| Ti | 3.27 | 3.240 | 3.040 | 3.007 | 2.77 | 3.05 |
| Ca | 6.47 | 7.190 | 6.313 | 6.953 | 5.46 | 5.93 |
| Al | 6.8 | 7.319 | 7.900 | 9.052 | 7.31 | 12.48 |
| Si | 3.185 | 4.730 | 2.970 | 4.140 | 2.40 | 3.51 |
| Mg | 1.44 | 0.3 | 0.025 | 0.118 | <LOD ** | 0.12 |
| Phase | Formula | Raw BR (wt%) |
|---|---|---|
| Hematite | Fe2O3 | 32.6 |
| Goethite | FeOOH | 5.2 |
| Cancrinite | Na₆Ca₂[(CO₃)₂|Al₆Si₆O₂₄]·2H₂O | 12.8 |
| Gibbsite | γ-Al(OH)3 | 3.4 |
| Perovskite | CaTiO3 | 2.2 |
| Katoite | Ca3Al2(SiO4)3 | 12.7 |
| Diaspore | α-AlOOH | 15.2 |
| Calcite | CaCO3 | 6.0 |
| Quartz | SiO2 | 0.3 |
| Boehmite | γ-AlOOH | 2.7 |
| Anatase | TiO2 | 0.9 |
| Bayerite | α-Al(OH)3 | 1.4 |
| Amorphous/not detected | - | 4.5 |
| Phase | Formula | H2-Reduced BR (wt%) |
|---|---|---|
| Magnetic | Fe3O4 | 35.5 |
| Quartz | SiO2 | 0.2 |
| Perovskite | CaTiO3 | 5.9 |
| Sodium aluminum silicate | Na12AlSiO5 | 11.9 |
| Sodium aluminate | NaAlO2 | 29.5 |
| Iron | Fe | 0.7 |
| Sodium iron oxide | NaFeO2 | 6.6 |
| Calcium iron silicate | Ca(Fe)SiO3 | 0.5 |
| Sodium calcium silicate | (Na)CaSiO3 | 0.9 |
| Calcium silicate | CaSiO3 | 1.5 |
| Amorphous/not detected | - | 6.6 |
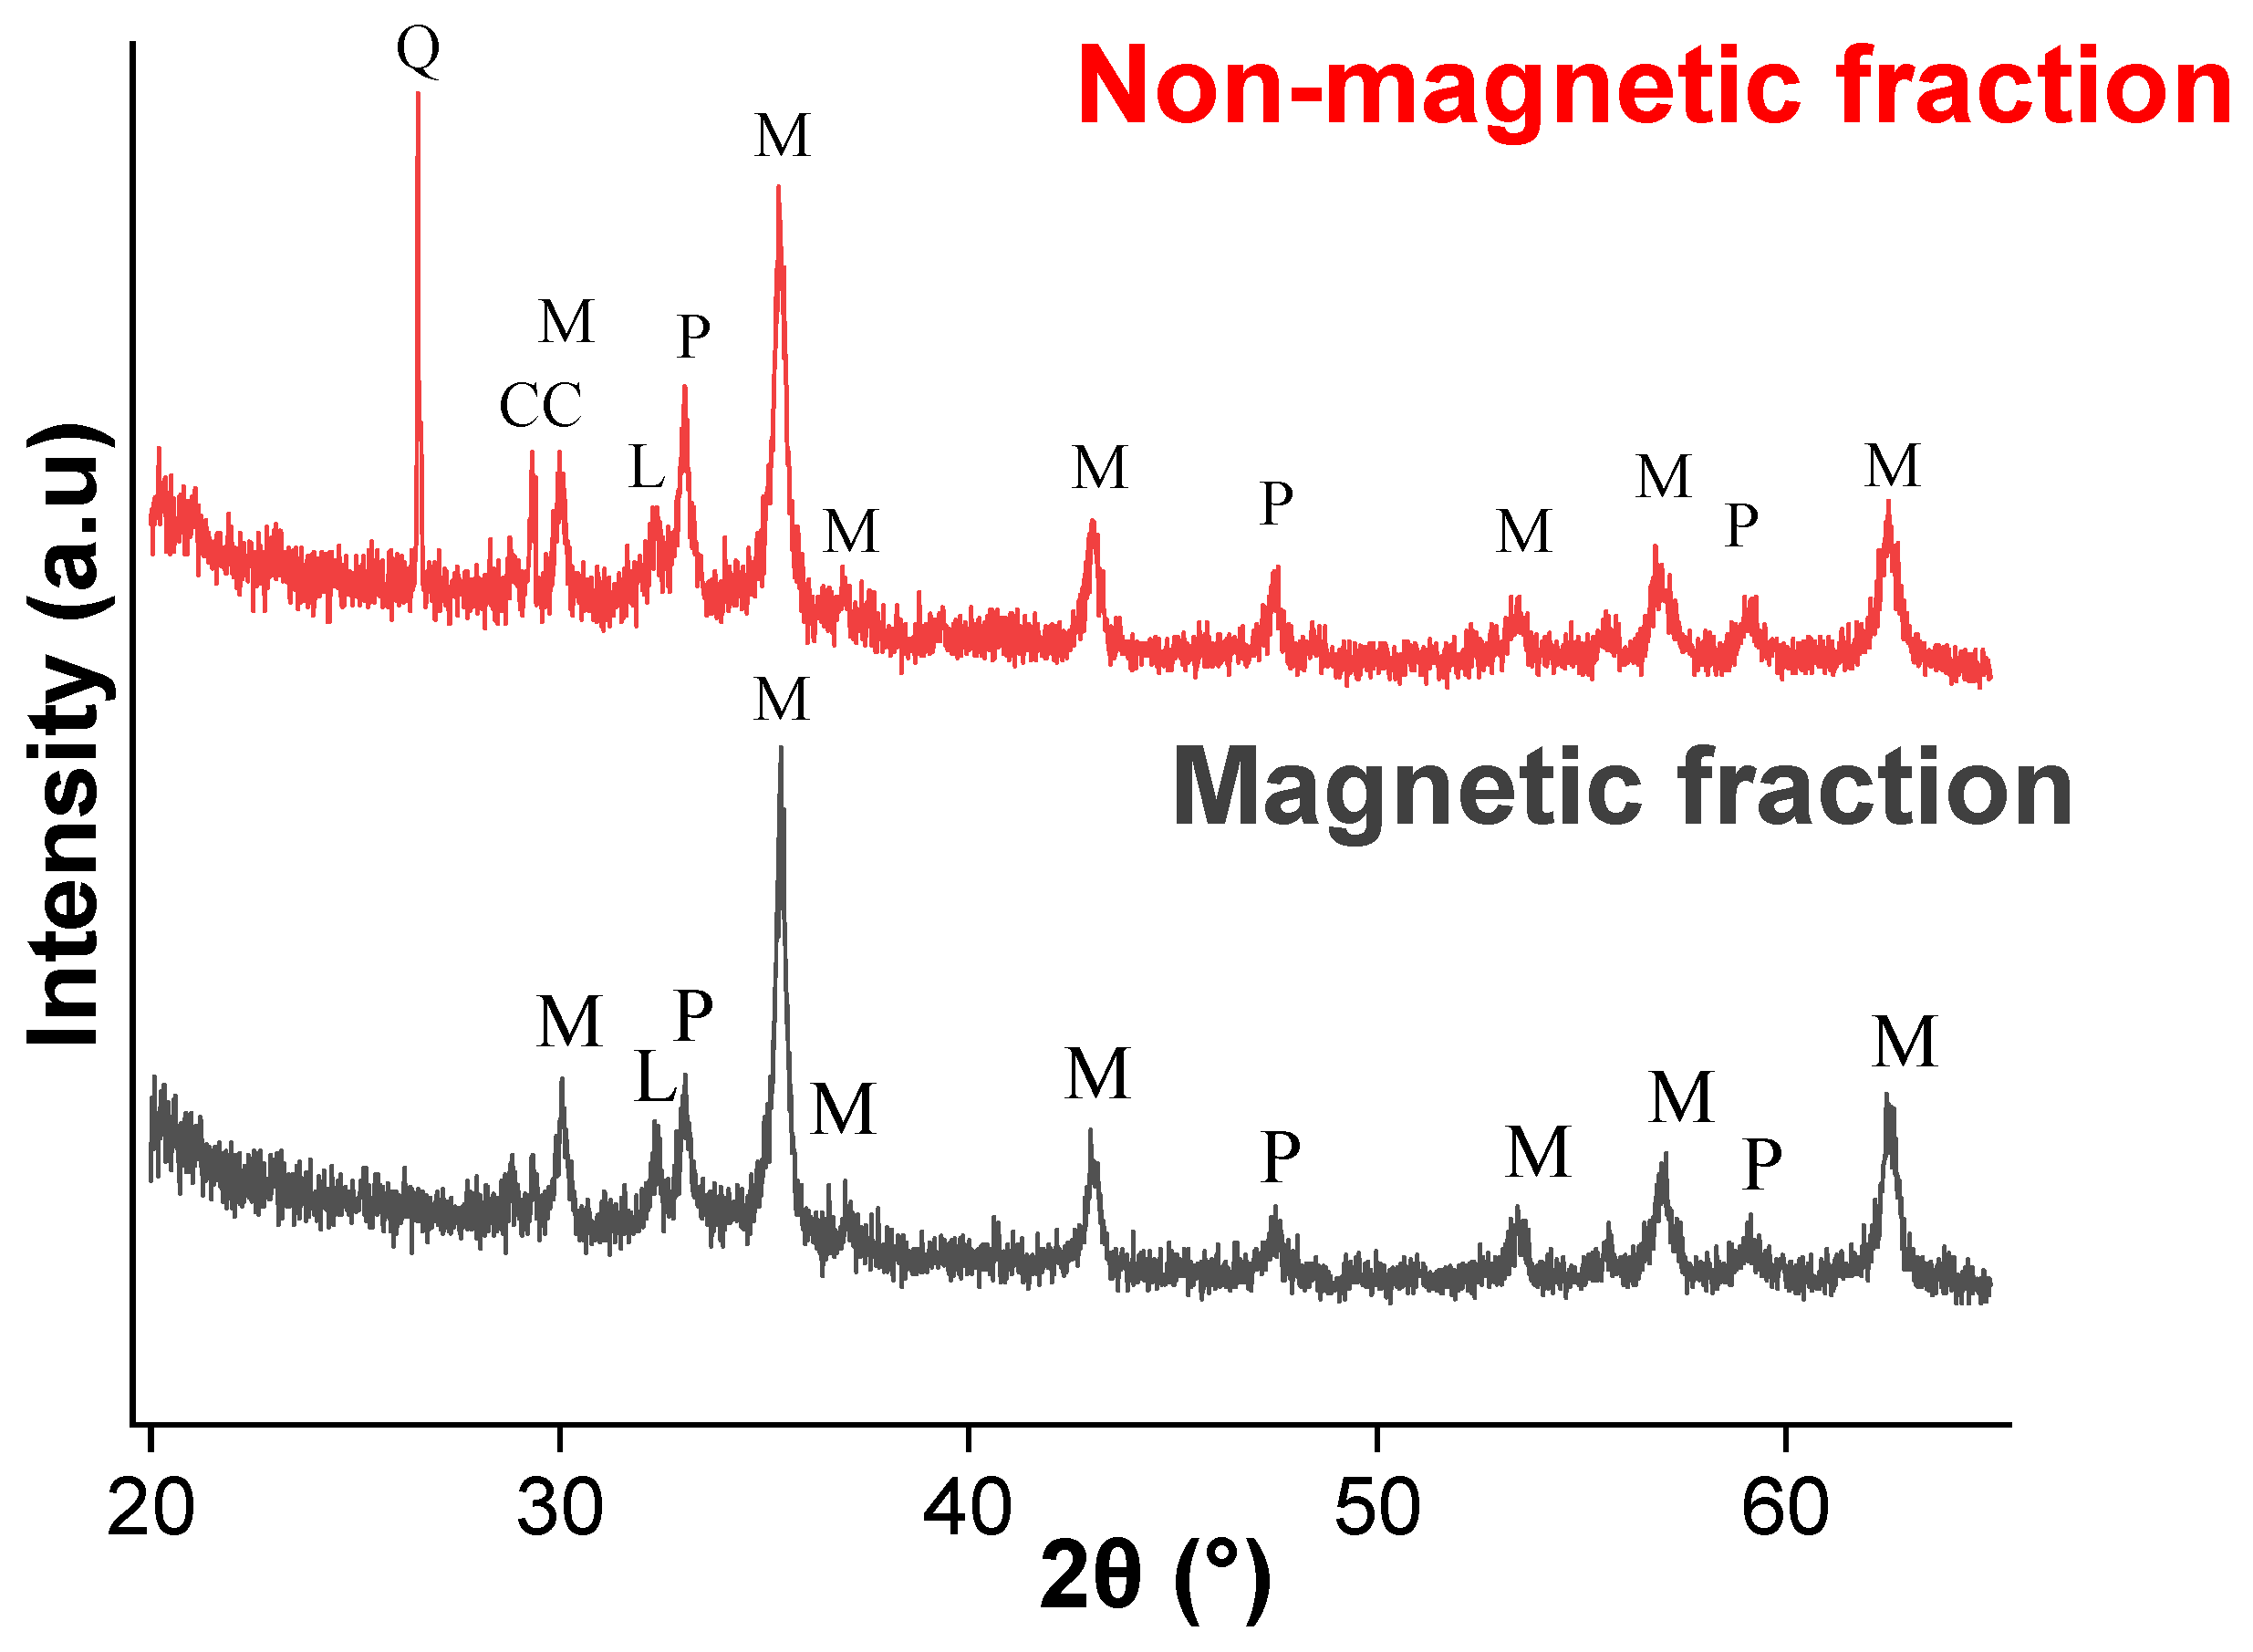
| Phase | Formula | Magnetic Product (wt%) | Non-Magnetic Product (wt%) |
|---|---|---|---|
| Magnetite | Fe3O4 | 61.6 | 37.8 |
| Perovskite | CaTiO3 | 12.4 | 18.9 |
| Ilmenite | FeTiO3 | 3.9 | 4.1 |
| Quartz | SiO2 | - | 7.5 |
| Calcite | CaCO3 | - | 5.9 |
| Amorphous/not detected | - | 22.1 | 25.8 |

References
- Dyussenova, S.; Abdulvaliyev, R.; Akcil, A.; Gladyshev, S.; Ruzakhunova, G. Processing of low-quality gibbsite-kaolinite bauxites. Metals 2022, 12, 1030. [Google Scholar] [CrossRef]
- Swain, B.; Akcil, A.; Lee, J. Red mud valorization an industrial waste circular economy challenge; review over processes and their chemistry. Crit. Rev. Environ. Sci. Technol. 2022, 52, 520–570. [Google Scholar] [CrossRef]
- Borra, C.R.; Blanpain, B.; Pontikes, Y.; Binnemans, K.; Van Gerven, T. Recovery of rare earths and other valuable metals from bauxite residue (red mud): A review. J. Sustain. Metall. 2016, 2, 365–386. [Google Scholar] [CrossRef]
- Evans, K. The History, Challenges, and New Developments in the Management and Use of Bauxite Residue. J. Sustain. Metall. 2016, 2, 316–331. [Google Scholar] [CrossRef]
- Xue, S.; Zhu, F.; Kong, X.; Wu, C.; Huang, L.; Huang, N.; Hartley, W. A review of the characterization and revegetation of bauxite residues (Red mud). Environ. Sci. Pollut. Res. Int. 2016, 23, 1120–1132. [Google Scholar] [CrossRef]
- Sutar, H.; Mishra, S.C.; Sahoo, S.K.; Chakraverty, A.P.; Maharana, H.S. Progress of red mud utilization: An overview. Am. Chem. Sci. J. 2014, 4, 255–279. [Google Scholar] [CrossRef]
- Zeng, H.; Lyu, F.; Sun, W.; Zhang, H.; Wang, L.; Wang, Y. Progress on the industrial applications of red mud with a focus on China. Minerals 2020, 10, 773. [Google Scholar] [CrossRef]
- Hertel, T.; Pontikes, Y. Geopolymers, inorganic polymers, alkali-activated materials and hybrid binders from bauxite residue (red mud)—Putting things in perspective. J. Clean. Prod. 2020, 258, 120610. [Google Scholar] [CrossRef]
- Pilla, G.; Kapelari, S.V.; Hertel, T.; Blanpain, B.; Pontikes, Y. Hydrogen reduction of bauxite residue and selective metal recovery. Mater. Today Proc. 2022, 57, 705–710. [Google Scholar] [CrossRef]
- Kapelari, S.; Gamaletsos, P.N.; Donck, T.V.D.; Pontikes, Y.; Blanpain, B. H2-based processes for Fe and Al recovery from bauxite residue (red mud): Comparing the options. Mater. Proc. 2021, 5, 45. [Google Scholar] [CrossRef]
- Li, Y.; Wang, J.; Wang, X.; Wang, B.; Luan, Z. Feasibility study of iron mineral separation from red mud by high gradient superconducting magnetic separation. Phys. C Supercond. 2011, 471, 91–96. [Google Scholar] [CrossRef]
- Rai, S.; Nimje, M.T.; Chaddha, M.J.; Modak, S.; Rao, K.R.; Agnihotri, A. Recovery of iron from bauxite residue using advanced separation techniques. Miner. Eng. 2019, 134, 222–231. [Google Scholar] [CrossRef]
- Cardenia, C.; Balomenos, F.; Panias, D. Iron recovery from bauxite residue through reductive roasting and Wet Magnetic Separation. J. Sustain. Metall. 2019, 5, 9–19. [Google Scholar] [CrossRef]
- Hassanzadeh, A.; Pilla, G.; Hertel, T.; Pontikes, Y.; Kowalczuk, P.B. H2-reduction of bauxite residue and iron recovery through magnetic separation. In Proceedings of the 17th International Mineral ProcessingSymposiume (IMPS), Istanbul, Turkey, 15–17 December 2022; pp. 223–243. [Google Scholar]
- McEnroe, S.A.; Church, N.; Fabian, K.; Stange, M.F.; Helvoort, A.T.J. An enigma in rock magnetism: Can microstructures in magnetite cause a threefold increase in the efficiency of NRM acquisition in the Stardalur Basalts? Geophys. J. Int. 2022, 231, 835–855. [Google Scholar] [CrossRef]
- Fabian, K.; Shcherbakov, V.P.; McEnroe, S.A. Measuring the Curie temperature. Geochem. Geophys. Geosyst. 2013, 14, 947–961. [Google Scholar] [CrossRef]
- Franco, V.; Dodrill, B. Magnetic Measurement Techniques for Materials Characterization; Springer: New York, NY, USA, 2021; ISBN 978-3-030-70443-8. [Google Scholar] [CrossRef]
- Hassanzadeh, A.; Lode, S.; Pilla, G.; Røstad, J.; Kowalczuk, P.B. Complementary approaches in characterization of secondary raw materials: A case study of H2-reduced bauxite residue. In Proceedings of the Process Mineralogy’22, MEi Conferences, Sitges, Spain, 2–4 November 2022. [Google Scholar]
- Pilla, G.; Hertel, T.; Kapelari, S.; Blanpain, B.; Pontikes, Y. Reactions and Phase Transformations During the Low-Temperature Reduction of Bauxite Residue by H2 in the Presence of NaOH, and Recovery Rates Downstream. In Proceedings of the 40th International ICSOBA Conference, Athens, Greece, 10–14 October 2022; TRAVAUX 51. pp. 801–810. [Google Scholar]
- Kapelari, S.; Gamaletsos, P.N.; Pilla, G.; Pontikes, Y.; Blanpain, B. Developing a Low-Temperature, Carbon-Lean Hybrid Valorisation Process for Bauxite Residue (Red Mud) Towards Metallic Fe and Al Recovery. J. Sustain. Metall. 2023, 1–10. [Google Scholar] [CrossRef]
- Coelho, A.A. TOPAS-Academic; A Computer Programme for Rietveld Analysis. Available online: http://www.topas-academic.net/ (accessed on 20 April 2023).
- Jansen, D.; Goetz-Neunhoeffer, F.; Stabler, C.; Neubauer, J. A remastered external standard method applied to the quantification of early OPC hydration. Cem. Concr. Res. 2011, 41, 602–608. [Google Scholar] [CrossRef]
- Fernandes, I.B.; Rudolph, M.; Hassanzadeh, A.; Bachmann, K.; Meskers, C.; Peuker, U.; Reuter, M.A. The quantification of entropy for multicomponent systems: Application to microwave-assisted comminution. Miner. Eng. 2021, 170, 107016. [Google Scholar] [CrossRef]
- Pilla, G.; Hertel, T.; Blanpain, B.; Pontikes, Y. Influence of H2 content on Fe, Al and Na recovery during low-temperature reduction of bauxite residue. In Proceedings of the 8th International Slag Valorisation Symposium, Mechelen, Belgium, 18–20 April 2023; pp. 146–149. [Google Scholar]
- Drzymala, J. Mineral Processing Foundations of Theory and Practice of Minerallurgy, 1st ed.; Wroclaw University of Technology: Wroclaw, Poland, 2007; pp. 1–497. ISBN 978-83-7493-362-9. [Google Scholar]
- Shao, Y.; Veasey, T.J.; Rowson, N.A. Wet high intensity magnetic separation of iron minerals. Magn. Electr. Sep. 1996, 8, 41–51. [Google Scholar] [CrossRef]
- Hassanzadeh, A.; Kar, M.K.; Safarian, J.; Kowalczuk, P.B. An Investigation on Reduction of Calcium Added Bauxite Residue Pellets by Hydrogen and Iron Recovery through Physical Separation Methods. Metals 2023, 13, 946. [Google Scholar] [CrossRef]
- Guao, X.; Zhang, M.; Ren, W.; Dai, S. Influence of particle size on the magnetism of magnetite and the development of an energy-efficient three-product magnetic separator. Sep. Sci. Technol. 2021, 56, 1397–1406. [Google Scholar] [CrossRef]
- Xiong, W.; Deng, J.; Chen, B.; Deng, S.; Wie, D. Flotation-magnetic separation for beneficiation of rare earth ores. Miner. Eng. 2018, 119, 49–56. [Google Scholar] [CrossRef]
- Rayner, J.G.; Napier-Munn, T.J. The mechanism of magnetics capture in the wet drum magnetic separator. Miner. Eng. 2000, 13, 277–285. [Google Scholar] [CrossRef]


| Method | XRF | pXRF | ICP-MS | QXRD |
|---|---|---|---|---|
| Fe (wt%) | 22 ± 2 | 23 ± 2 | 25 ± 1 | 25 ± 1 |
| −100 + 75 µm | −75 µm | |||
|---|---|---|---|---|
| Stream | Mass (g) | Fe (%) | Mass (g) | Fe (%) |
| MIMS Mag | 98.98 | 23 * | 117.25 | 24 * |
| MIMS Non-Mag | 8.88 | 13 | 51.17 | 19 |
| LIMS Mag | 70.11 | 32 | 68.83 | 36 |
| LIMS Non-Mag | 23.89 | 26 | 43.88 | 29 |
Disclaimer/Publisher’s Note: The statements, opinions and data contained in all publications are solely those of the individual author(s) and contributor(s) and not of MDPI and/or the editor(s). MDPI and/or the editor(s) disclaim responsibility for any injury to people or property resulting from any ideas, methods, instructions or products referred to in the content. |
© 2023 by the authors. Licensee MDPI, Basel, Switzerland. This article is an open access article distributed under the terms and conditions of the Creative Commons Attribution (CC BY) license (https://creativecommons.org/licenses/by/4.0/).
Share and Cite
Hassanzadeh, A.; Pilla, G.; Kar, M.K.; Kowalczuk, P.B. An Invitation on Characterization of H2-Reduced Bauxite Residue and Recovering Iron through Wet Magnetic Separation Processes. Minerals 2023, 13, 728. https://doi.org/10.3390/min13060728
Hassanzadeh A, Pilla G, Kar MK, Kowalczuk PB. An Invitation on Characterization of H2-Reduced Bauxite Residue and Recovering Iron through Wet Magnetic Separation Processes. Minerals. 2023; 13(6):728. https://doi.org/10.3390/min13060728
Chicago/Turabian StyleHassanzadeh, Ahmad, Ganesh Pilla, Manish K. Kar, and Przemyslaw B. Kowalczuk. 2023. "An Invitation on Characterization of H2-Reduced Bauxite Residue and Recovering Iron through Wet Magnetic Separation Processes" Minerals 13, no. 6: 728. https://doi.org/10.3390/min13060728