Article

Deportment of Metals from E-Waste PCBs towards Alloy and Slag Phases during Smelting Using CaO-Al2O3-SiO2-B2O3 Slags

1
Centre for Advanced Materials & Industrial Chemistry (CAMIC), School of Science, RMIT University, Melbourne, VIC 3001, Australia
2
CSIRO Mineral Resources, Clayton South, Melbourne, VIC 3169, Australia
3
Bangladesh Council of Scientific and Industrial Research (BCSIR), Institute of Mining, Mineralogy and Metallurgy, Joypurhat 5900, Bangladesh
4
CSIRO Energy, Clayton South, Melbourne, VIC 3169, Australia
*
Author to whom correspondence should be addressed.
Minerals 2023, 13(6), 727; https://doi.org/10.3390/min13060727
Submission received: 13 February 2023 / Revised: 16 May 2023 / Accepted: 24 May 2023 / Published: 26 May 2023
(This article belongs to the Special Issue Metal Recovery from Printed Circuit Boards)

Abstract

:
Printed circuit boards (PCBs) from antiquated electronic goods were processed by a pyrometallurgical route to produce and separate alloy and slag phases. The process involved initial size reduction of PCBs, followed by pyrolysis at 500 °C for 6 h and finally smelting of the solid materials in an electric furnace. A preliminary smelting test was performed at 1600 °C to estimate the composition of the slag generated. In later kilogram-scale smelting experiments, B2O3 flux was added along with CaO and SiO2 to decrease the liquidus temperature required to smelt the PCBs. The level of fluxing was adapted from earlier phase equilibria studies of the CaO-Al2O3-SiO2-B2O3 slag system. Results showed that the flux decreased the melting temperature and assisted the recovery of most valuable metals within the alloy phase at 1350 °C smelting temperature. The alloy phase recovered 99.8% of Cu, 99% of Sn, and 100% of precious metals (Au, Ag, Pt). A fluxing strategy for smelting high Al2O3 containing e-waste PCBs was proposed based on the experimental findings of this research.

1. Introduction

Printed circuit boards (PCBs), originating from waste electronics and electrical equipment, are complex heterogenous materials that can be processed to recover several components for re-use in further manufacturing. PCBs are essentially composite materials containing metals, ceramics, plastics, and fibres [1,2]. The glass fibres and resins can adversely impact on the recovery and decrease the process kinetics of hydrometallurgical operations as they can restrict contact between the metals and the chemicals/solvents [3,4,5]. To overcome this problem, extensive mechanical processing is required to reduce the size of feed PCB components to allow efficient leaching [6,7]. Other processing options, such as bio-hydrometallurgical processes, also suffer from issues, such as reduced microorganism life span due to the toxicity of metals and overall sluggish processing kinetics [8]. Pyrometallurgical processing has been shown to have certain advantages over hydrometallurgical based processing [9]. In pyrometallurgical processing, PCBs can be melted completely and eventually collection of most of the metals is possible within a copper-rich alloy phase. This process is faster, scalable to industrial operations, and can handle a large volume of feed materials compared to the other process options. Preliminary pyrolysis before smelting can reduce the burden of flue gas emission during the smelting [10,11]. In addition, the risk of dioxin release from the processing of e-waste can be eliminated with a preliminary pyrolysis process step. The composition of flue gas produced during the pyrolysis of PCBs at 400–600 °C was reported to contain very low dioxin levels within the limit set by the regulatory body (0.1 ng-TEQ/Sm3) [11]. Moreover, the carbonaceous char generated during the pyrolysis of organic components can act as a reducing agent, as well as providing heat due to exothermic combustion reactions [12].
Some PCBs contain boron-based flame retardants materials. Being a low-melting oxide (450 °C) and acidic in nature, B2O3 could be a good fluxing agent to reduce the melting temperature and viscosity of the aluminosilicate slags generated during smelting PCBs. Control of the slag liquidus and viscosity is important to maximise metal recovery by minimizing loss of metals with the slag phase. Entrapment of metals within the slag can be reduced by decreasing the liquidus temperature, as well as increasing the fluidity of slags to assist material transport through slags [11]. While phase equilibria of FeO-Al2O3-SiO2-MO (i.e., MgO, CaO, Cu2O) systems have been extensively explored by researchers in relation to e-waste processing, iron making, and other metallurgical processes, very few studies have been performed on the effect of B2O3 flux on the slags generated during e-waste PCB recycling [13,14,15]. This article describes designing a suitable slag based on the liquidus temperature of the CaO-Al2O3-SiO2-B2O3 slag [16]. The composition of PCB slag was estimated by a preliminary smelting test of pyrolyzed e-waste PCBs. The designed slag was used to smelt PCBs using an induction furnace. The mass balance of materials and recovery of metals in the alloy phase were calculated and discussed.

2. Materials and Methods

2.1. Materials and Equipment

The PCB materials used in this research were sourced from a diversified municipal collection, including computers, laptops, mobile phones, and tablets. The PCB feed material also contained all other electronic components, such as integrated circuits (ICs), transistors, resistors, and capacitors, which were mounted on the PCBs.
Bulk compositional analysis of the PCB feed material indicated that the Al2O3 content was high (>60 wt.%), so, to generate the required slag composition, additional CaO, SiO2, and B were added. The amount of CaO required for slag generation was obtained from the decomposition of CaCO3 (99.5 wt.%; Sigma-Aldrich) powder. The source of B flux was B2O3 powder (99.95 wt.%) from VWR Chemicals, as well as SiO2 (99.9 wt.%) from Sigma-Aldrich. Before weighing, the B2O3 and CaCO3 and SiO2 powders were dried overnight at 105 °C to remove any moisture. Magnesia crucibles were used to contain the material at high temperatures. A muffle furnace (Tetlow, Australia) was used for the preliminary smelting test, and an induction furnace (Furnace Engineering, Melbourne) was used for the kilogram-scale smelting experiments.

2.2. Methods

2.2.1. Size Reduction, Pyrolysis and Smelting

The discarded PCBs were manually cut to 3–4 cm in size before being further processed in a rotary cutter mill (FRITSCH, Germany) to reduce the size using a 4 mm mesh screen. The −4 mm PCB materials were pyrolyzed using a top-loaded kiln type furnace. The PCBs were placed in 6 steel retorts inside the kiln. A thermocouple was placed inside the chamber to monitor the temperature of the kiln. Another thermocouple was placed inside one of the retorts to measure the temperature of the PCBs under pyrolysis. The pyrolysis fumes were passed through an air filtration system supplied by Airpure Australia before being allowed to pass to the atmosphere. The kiln was programmed to heat at a rate of 250 °C/h to reach 500 °C and then kept as this temperature for 6 h to allow the pyrolysis reactions to occur. The furnace was then turned off, and the retorts slowly cooled in situ. The weight of the pyrolyzed PCBs, along with the remaining char, was recorded, and the total weight loss during the process was determined. An integrated data logger recorded the temperature for both the furnace and retort. The temperature profile during pyrolysis is plotted in Figure 1.
Smelting of the PCBs was performed in two stages. First, a preliminary test was run to determine the composition of the slag that is generated from the pyrolyzed PCBs without using any flux. The melting was performed at 1600 °C using a MgO crucible inside a muffle furnace. In the second stage of test work, fluxes were introduced to the smelting mix based on the measured composition of the slag. This smelting was performed in an induction furnace.
In the preliminary smelting test, about 150 g of pyrolyzed PCBs was charged to a MgO crucible (internal diameter = 75 mm, height = 60 mm), which was placed inside the muffle furnace. The furnace was programmed to reach 1600 °C at a rate of 250 °C/h and then held at 1600 °C for 2 h to melt and separate the metal and slag phases. After 2 h the furnace was turned off and the crucible containing the samples was allowed to slowly cool inside the furnace. Once at room temperature, the crucible was removed, and the metal and slag components recovered. The metal phase was expected to deposit in the bottom of the crucible, under the slag layer. However, observation showed that complete melting had not occurred. The metal portion was, therefore, separated manually. Some metals droplets were retained within the slag, and these were separated by subsequent pulverizing and screening. Material passing a 250 µm screen was taken as the slag phase. Coarser material (+250 µm) was assumed to be metallic. The metallic phase was analysed with XRF, ICP-OES, and ICP-MS to determine composition. Slag samples were taken from different locations within the crucible, and these were pulverised and analysed using XRF and ICP to determine the slag composition.
In the kilogram-scale smelting experiments, the pyrolyzed PCBs were fluxed with B2O3, CaO, and SiO2 to lower the liquidus temperature. The basis for the fluxing was (a) the lack of melting in the preliminary experiment suggesting the composition of the PCBs was more refractory than expected and (b) that lower liquidus temperatures in the CaO-Al2O3-SiO2 system can be achieved by adding B2O3 based on the phase equilibria study described in reference [16].
An induction furnace with 15–45 kHz frequency and 50 kw power capacity (Furnace Engineering, Melbourne) was used to melt the fluxed PCBs. A magnesia crucible (internal diameter = 60 mm, height = 240 mm) was filled with the mixture of pyrolyzed PCBs (405 g) and the flux material (575 g) before charging inside the induction furnace. Smelting was performed under a nitrogen blanket. The exhaust gases were passed through a caustic soda scrubber where any acidic gases were neutralized. A schematic diagram of the induction furnace, crucible arrangement and the flue gas treatment system are shown in Figure 2.
For the smelting tests the furnace was programmed to reach 1200 °C. A check was then made to determine if a liquid slag phase had formed. The temperature was increased by 50 °C step increments up to 1350 °C where a complete liquid slag formed. After a liquid slag was observed, an additional 2 h was allowed for the reaction to be completed. Slag samples were collected after every 30-min to check the change in slag composition with time. Alloy sampling was performed with a silica siphon at similar interval. Molten metal was collected from the metal/matte layer (shown in Figure 2) using a quartz tube inserted through the chimney. A suction was created by using a pipette controller (pipette rubber bulb) fitted on the other end of the quartz tube. A solidified metal sample was separated by breaking the quartz tube with a gentle hammering. This arrangement could be imagined as a large pipette. For slag sample collection, a steel rod was inserted within the slag layer, and the adhered slag was quenched in water bath and then separated from the rod by hammering. Quartz tube was not used for slag sampling as it could change the slag composition. Once the reaction time was reached the furnace was turned off and the crucible allowed to cool to room temperature in situ. The slag and metal samples were then recovered, separated, and samples collected and analysed. A flowsheet showing the steps of processing PCBs, the input (PCBs, flux) and the output streams (alloy, slag, and flue dust) can be seen in Figure 3.
The fume extraction system of the induction furnace was connected to a small bag house, which collected fume and other air-borne particulate materials. A sample of the flue dust, captured by the bag house, was analysed and a mass balance of the process gave the total proportion of volatiles, metals, and inorganic materials within the PCB mass. Photographs of the size reduced raw PCBs, pyrolyzed PCBs, and alloy samples obtained after smelting and flue dust capture are shown in Figure 4a–d, respectively.

2.2.2. Chemical Analysis with XRF, ICP-OES, and ICP-MS

X-ray Fluorescence Spectroscopy (XRF), Inductively Coupled Plasma Optical Emission Spectroscopy (ICP-OES), and Inductively Coupled Plasma Mass Spectroscopy (ICP-MS) were used to determine the composition of the slags and the alloy phases. XRF was used for the major elements in the slag and alloy/metal components, while the ICP techniques were used to determine the minor and trace elements. For the XRF analyses, the slag samples were fused with lithium tetra-borate into glass discs using a suitable flux. For the alloy phase, samples of turnings or off-cuts were dissolved in acids, and they were evaporated to dryness. The solid residue was fluxed with tetra-borates and made into glass discs and analysed using XRF instrument (Bruker 4 kw S8 Tiger WDXRF). For ICP analysis, both powdered slags and alloy phases were dissolved in strong acids (HF and HNO3) and then diluted as required. The diluted samples were then analysed using Agilent 5900 ICP-OES and Agilent 8900 ICP-MS instruments. The instruments were standardized using calibration standards.

2.2.3. Morphological Study Using SEM-EDS

The obtained alloy, slag and flue dust from smelting experiment were mounted in polymer resin and progressively ground using coarser to finer SiC abrasive papers. Finally, the samples were fine polished using 6, 3, and 1 µm diamond pastes and oil-based lubricants from Struers. The fine polished sample blocks were coated with C to enhance the conductivity and avoid charge build up while using SEM. A FEI Quanta 400 F SEM equipped with a Bruker EDS was used to examine the morphology and chemistry of the phases present in the alloy, slag, and flue dust. Secondary and backscattered images were taken using an accelerating potential of 15 KV and 10.0 mm working distance.

3. Results and Discussion

3.1. Mass Loss during Pyrolysis and Smelting

Most of the volatile components of the PCBs and all the moisture content was lost during the pyrolysis process. The mass balance before and after pyrolysis indicated around 25.7% of the total PCB mass was lost through the pyrolysis step, as shown in Table 1. In the later smelting stage, the remaining char was combusted and accounted for around 6.7% of the mass loss. The mass balance conducted showed the PCBs used in this study contained around 30.3 wt.% metals, 32.4 wt.% volatile organic materials, and 37.3 wt.% inorganic substances including ceramic materials (Table 1). Similar results were reported in earlier research where the average proportion of PCB metals ranges from 30–35 wt.%, inorganic (ceramic) 35–42 wt.%, and organic matters 24–30 wt.% [9,17].

3.2. Slag Obtained from the Preliminary Smelting Test

The objective of the preliminary smelting test was to estimate the composition of slag generated after smelting e-waste PCBs so that appropriate flux requirements could be determined. Table 2 shows the approximate composition of slags generated during the preliminary smelting of PCBs conducted at 1600 °C. Since it was a partial melt generating a slag that was not homogenous, slag samples were collected from three different zones of the crucible (Slag-T from top, Slag-B from bottom, and Slag-W from near crucible wall). The higher amount of Fe2O3 in slag phase indicates much of the Fe oxidized since the smelting was performed under atmospheric conditions. Additionally, the presence of CuO and SnO2 in the bottom part of the slag reveals poor separation of slags and alloy due to the partial melting.
The preliminary smelting test showed the raw slag contained very high Al2O3 contents (above 60 wt.%) with relatively low levels of SiO2 and CaO (Table 2). One possible reason for the higher-than-expected Al2O3 in the slags of smelting PCBs could be the presence of electronic components (chips, ICs, transistors, and capacitors) along with the PCBs [9,18]. These components may contain higher Al2O3 used for electrical insulation. Additionally, the aluminium supports embedded with the PCBs could contribute to higher Al2O3 in slag by oxidizing during the pyrometallurgical process. The high Al2O
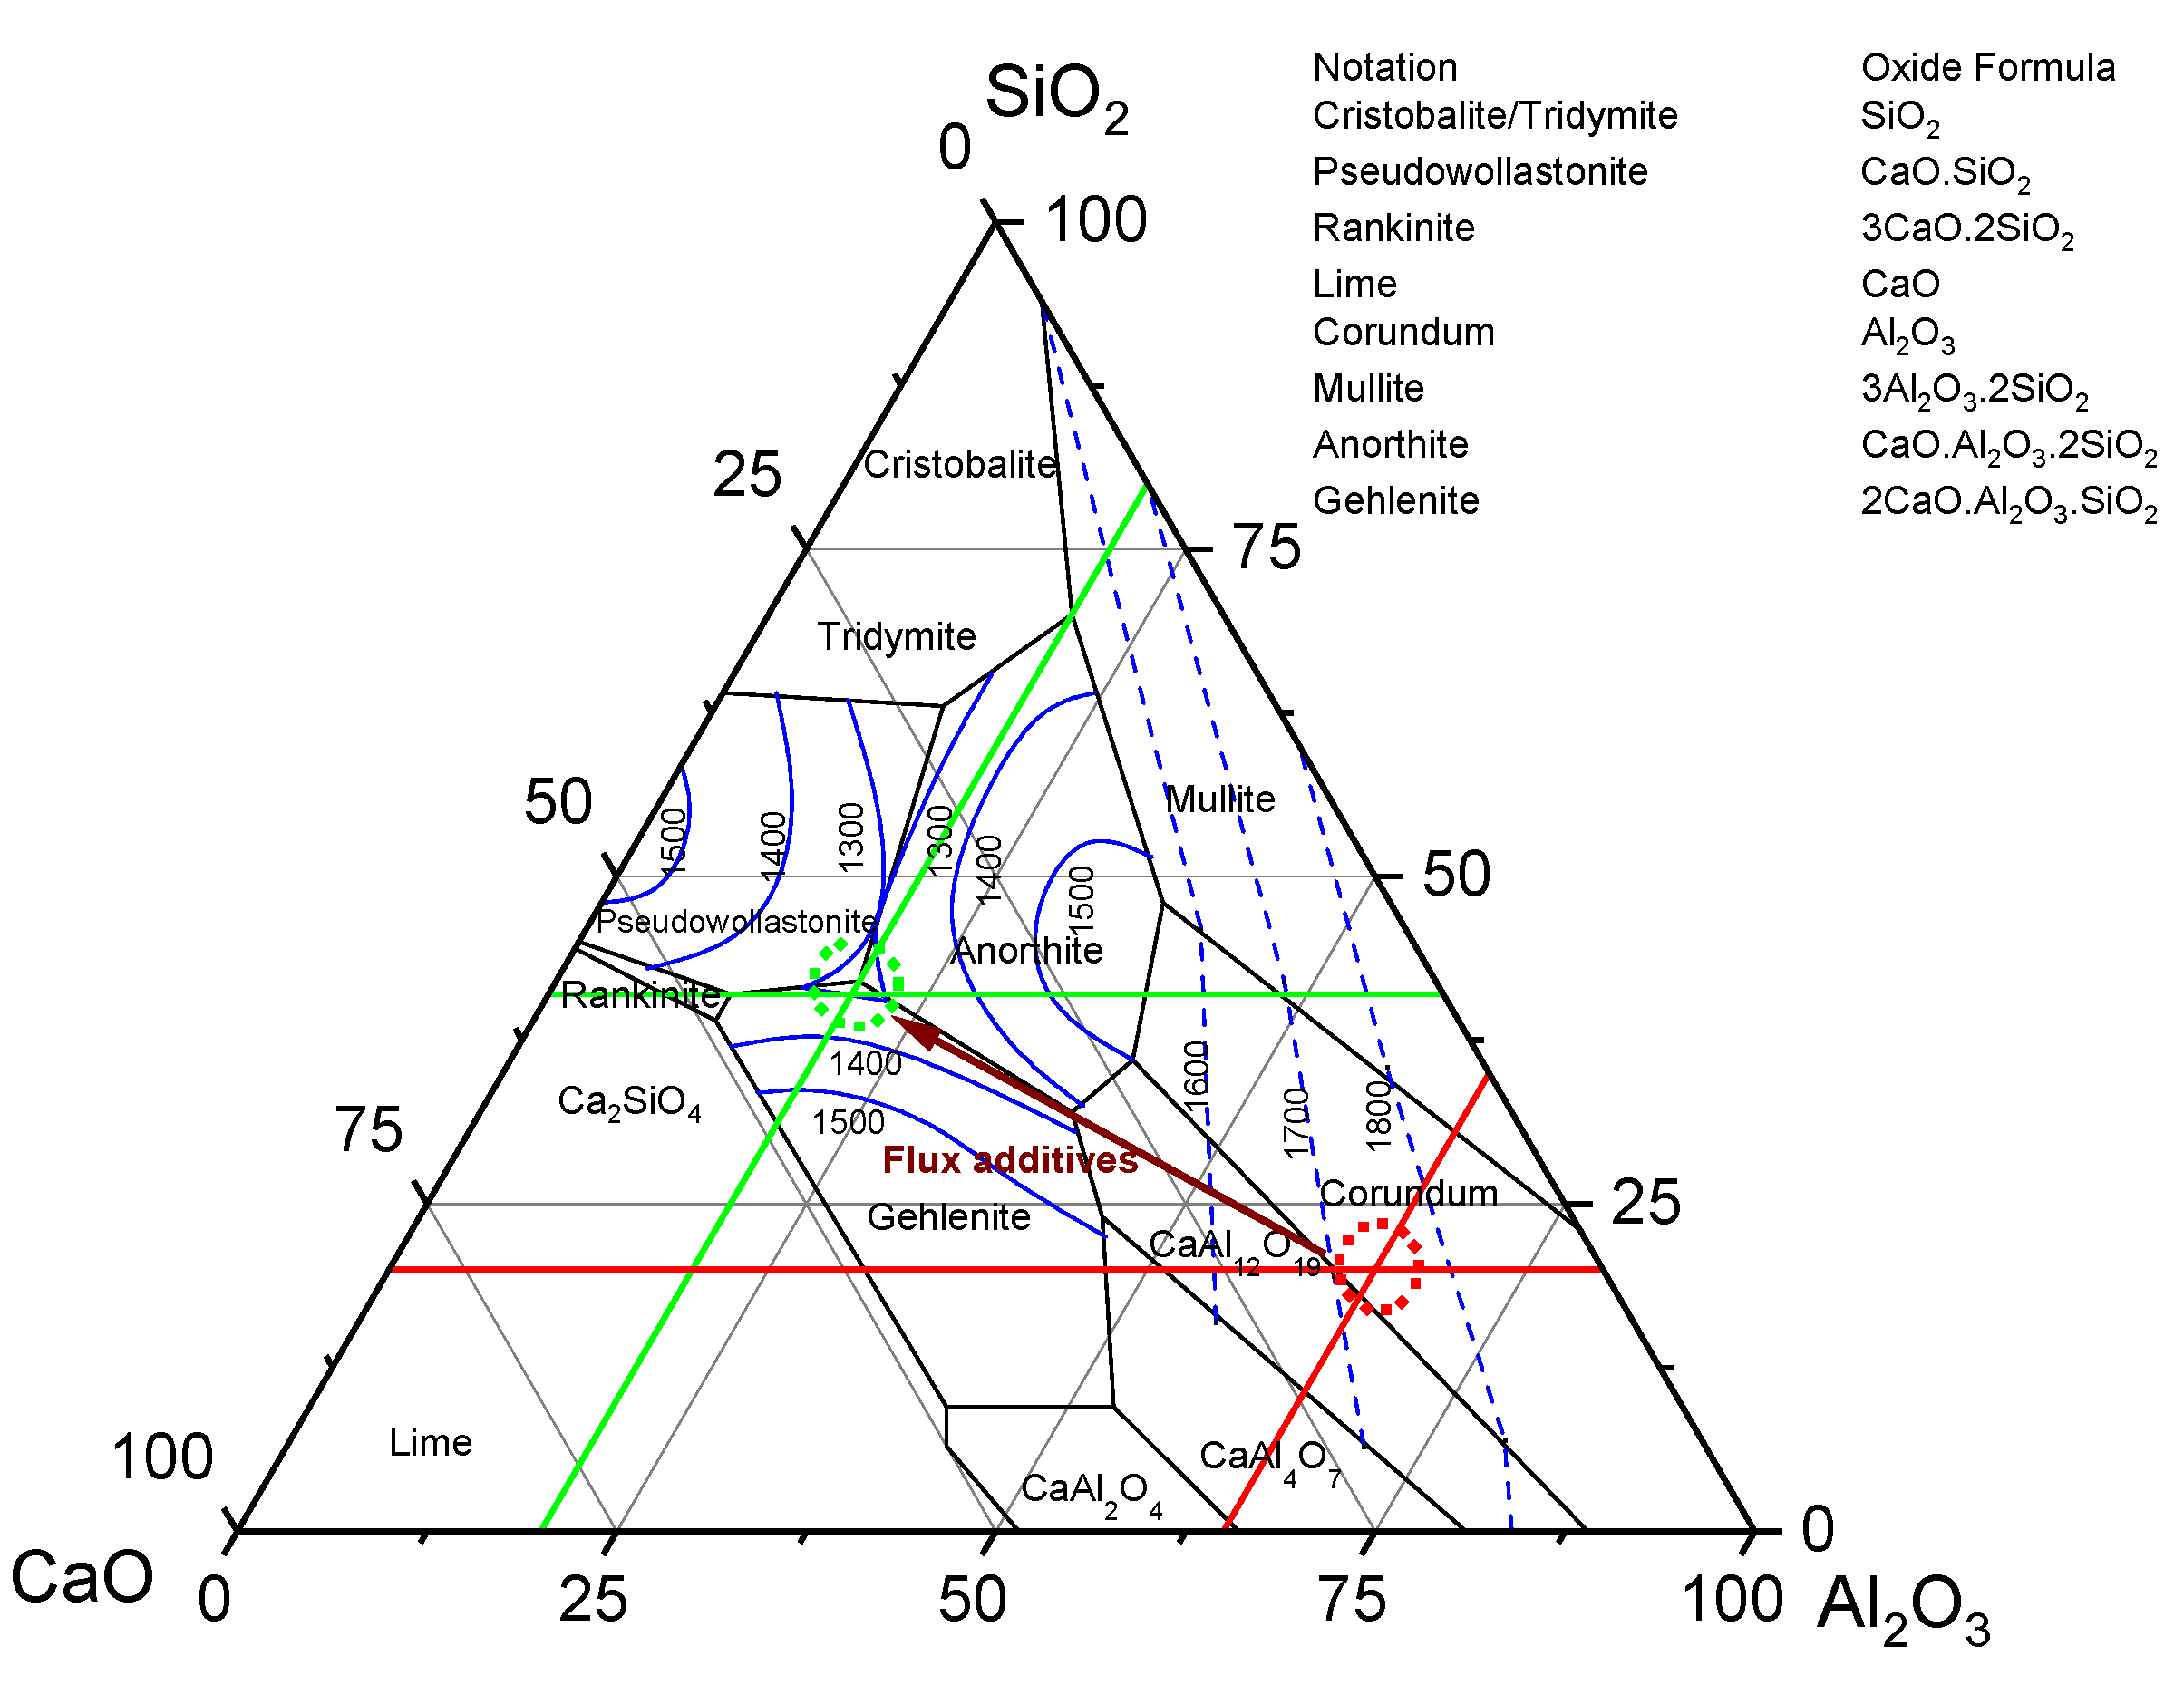
3 content meant the slag was extremely refractory and difficult to melt, as was evident from the partial melting/fused nature of the slag at 1600 °C. From the CaO-Al2O3-SiO2 phase diagram (Figure 5, marked in red), it can be seen that slag with this composition (65% Al2O3, 7–10% SiO2, and 2–4% CaO) could be challenging to melt as the primary phase field is corundum/mullite with a very high melting temperature. In practice, it is difficult to attain and maintain temperatures higher than 1600 °C. Hence, fluxes are required to reduce the liquidus temperature of the generated slags. In this work the targeted slag chemistry (of the three-component system) was 40% SiO2, 20% Al2O3, and the rest by CaO keeping a C/S ratio of 0.6 as shown by the green lines in Figure 5, with additional B2O3. The proposed fluxing would shift the slag chemistry from the intersection of the red lines (liquidus of about 1700 °C) to intersection of the green lines with a liquidus of about 1250 °C. The addition of B2O3 is known to decrease the liquidus of the CaO-Al2O3-SiO2 system significantly [16]. The circle around each intersection point indicates slight variation in the slag composition because of the presence of other minor oxides.

3.3. Slag Design for Induction Smelting

The target slag of the induction smelting test was based on the analysis of slags generated after preliminary smelting test of the pyrolyzed PCBs. From the previous article the lowest liquidus temperature of CaO-Al2O3-SiO2-B2O3 slag was found to be 900 ± 20 °C for a slag with 15.8 wt.% Al2O3, 18.8 wt.% B2O3, and a C/S ratio of 0.6 [16]. To calculate the fluxing requirements, the slag content contributed by the PCBs was considered, and the amount of flux (CaO, SiO2, and B2O3) required to reach the target slag composition was determined. The composition was then normalised based on the presence of three major oxides (SiO2, Al2O3 and CaO) of the slag generated from PCBs. Table 3 shows the calculation of the slag design required to reach the target slag composition for the induction smelting of PCBs.

3.4. Material and Elemental Mass Balance after Induction Smelting

The overall material balance was performed based on the mass difference of the total input and output materials. The mass balance with the output material breakdown is shown in Table 4. The material recovery was 93.3 wt.%, while the apparent mass loss may be attributed to the combustion of carbonaceous material (char), which remained with the shredded PCBs after pyrolysis.
The mass balance of the three different output material streams (alloy, slag, and flue dust) collected is shown in Table 5, Table 6 and Table 7, respectively. The total deportment of the metals in these streams was calculated in elemental form so the recovery of metals within the alloy phase could be determined.
Table 6 shows the composition of the final slag, and the elemental metallic components were calculated from the amount of their respective oxides present in the final slag. A total of 125.7 g Al2O3 was present in the final slag (17.3 wt.%) and contributed by only the PCBs, while MgO in the final slag originated from the crucible material. Note that precious metals in slag and flue dust were below the detection limit (Ag < 40 ppm, Au < 30 ppm, and Pt < 30 ppm).
The composition of captured flue dust during induction smelting is shown in Table 7. The flue dust contained a high amount of Zn (2.7 g) due to the high vapour pressure of Zn under the smelting conditions [20]. Almost all the Zn present reported to the flue dust with only 3.3 wt.% (0.08 g) recovered in the alloy phase, while around 5% (0.12 g) was in the slag phase. The other metal oxides found at a high level in the flue dust were Fe2O3 (2.2 g), which is likely to be carried over by the exhaust flow. Similarly, the SiO2, CaO, and Al2O3 portion are likely to be transported by the exhaust system during additional charging of powdered flux and PCBs mixture through the crucible chimney. The amount of B2O3 in the flue dust might be due to higher evaporation of B under the smelting conditions used. In addition, during smelting, the B content from the slag decreased with time, with the bulk of the B reporting to the flue dust as discussed in later sections.
The major base metals in the alloy phase were Cu, Sn, Pb, Si, and Fe, with a smaller proportion of Mn and Ni. While, among the precious metals, Au, Ag, and Pt were present in ppm levels. It was assumed that 100% of the metals in the input stream (PCBs) were recovered in the output streams (alloy, slag, and flue dust). The recovery of a metal (M) in the alloy phase can be calculated using the following equation:
Recovery   ( % ) = m a s s × w t % M a l l o y m a s s × w t % M a l l o y + m a s s × w t % M s l a g + m a s s × w t % M f l u e d u s t
where; w t % M a l l o y is the composition of metal (M) in the alloy phase,
w t % M s l a g is the composition of metal (M) in the slag phase,
w t % M f l u e d u s t is the composition of metal (M) in the flue dust,
and ‘mass’ is the total mass of alloy, slag, and flue dust, respectively.
Table 8 shows the summary of the calculation for the metal recovery in the alloy phase. The presence of metallic Si in the alloy might be entrapped SiO2 or could be reduced during smelting under the reducing conditions. The recovery of Si in the alloy phase was omitted and only accounted as SiO2 in the slag phase.
The deportment of other valuable metals in alloy phase is also shown in Table 8. Recovery of Cu and Sn was above 99 wt.%, while the precious metals (Ag, Au, and Pt) recovery was found to be close to 100%. The precious metals in the final slag and flue dust were below the detection limit. It is reasonable for the precious metals in the slag and flue dust to be present at such low levels, considering that the overall presence of precious metals in the system (derived from e-waste PCBs) was low, as indicated by the composition of the copper-rich alloy. When higher amounts of these precious metals are present in the system, both the rate of evaporation and their tendency to be carried into the slag phase are likely to be higher. For instance, Chen et al. conducted a study on the distribution of Cu, Ag, Co, and Sn between the slag, spinel, and matte phases. They found that the Ag content fluctuated around 1 wt.% in the matte phase and ranged from approximately 20-50 ppm in the slag phase, as measured using the LA-ICP-MS technique [21]. The study reported the evaporation of some Ag, which can be attributed to the higher standard deviation of Ag in the matte and slag compared to the other minor metals. An amount of 48.1% of the total Ni present reported to alloy phase, while 49.4% reports to the slag, and the rest is in the flue dust. Lower recovery of Fe (77%) and Mn (54%) was expected, as they form oxides and report to the slag. However, only 3.3 wt.% of Zn was recovered in the alloy phase with the major portion reporting to the flue dust due to the high vapour pressure of ZnO.
The composition of the final slag (Table 6) after induction smelting showed no CuO and SnO2. This also means that all precious metals (Au, Ag, and Pt), Cu, and Sn present in the PCBs were collected in the Cu-rich alloy, and no loss of these metals in the slag phase occurred under these smelting conditions. However, due to the higher slag viscosity, metal prills were entrapped within slag, which impacted the metal recovery in the alloy. These required further processing (pulverizing) to separate the alloy from the slag in later stages.
In the kg-scale induction smelting tests, a homogenous liquid slag was obtained in tests at 1350 °C. The composition of the slags sampled at 1- and 2-h intervals are shown in Table 9. With increasing reaction time, the CuO slightly decreased, while the SnO2 and Fe2O3 contents in the slag remained constant. At the end of smelting, the final slag composition contained no CuO, no SnO2, and only 0.1 wt.% Fe2O3. The composition of MgO also increased with an increase in the reaction time at the smelting temperature. Thinning of the crucible wall was observed because of MgO participating in the smelting reaction. Gradual B loss at this smelting condition was also evident, since only 8.4 wt.% B2O3 remained in the final slag. The relative Al2O3 content also increased in the final slag compared to the target slag because of the decreasing B2O3. The final slag was collected after cooling in situ to the room temperature.
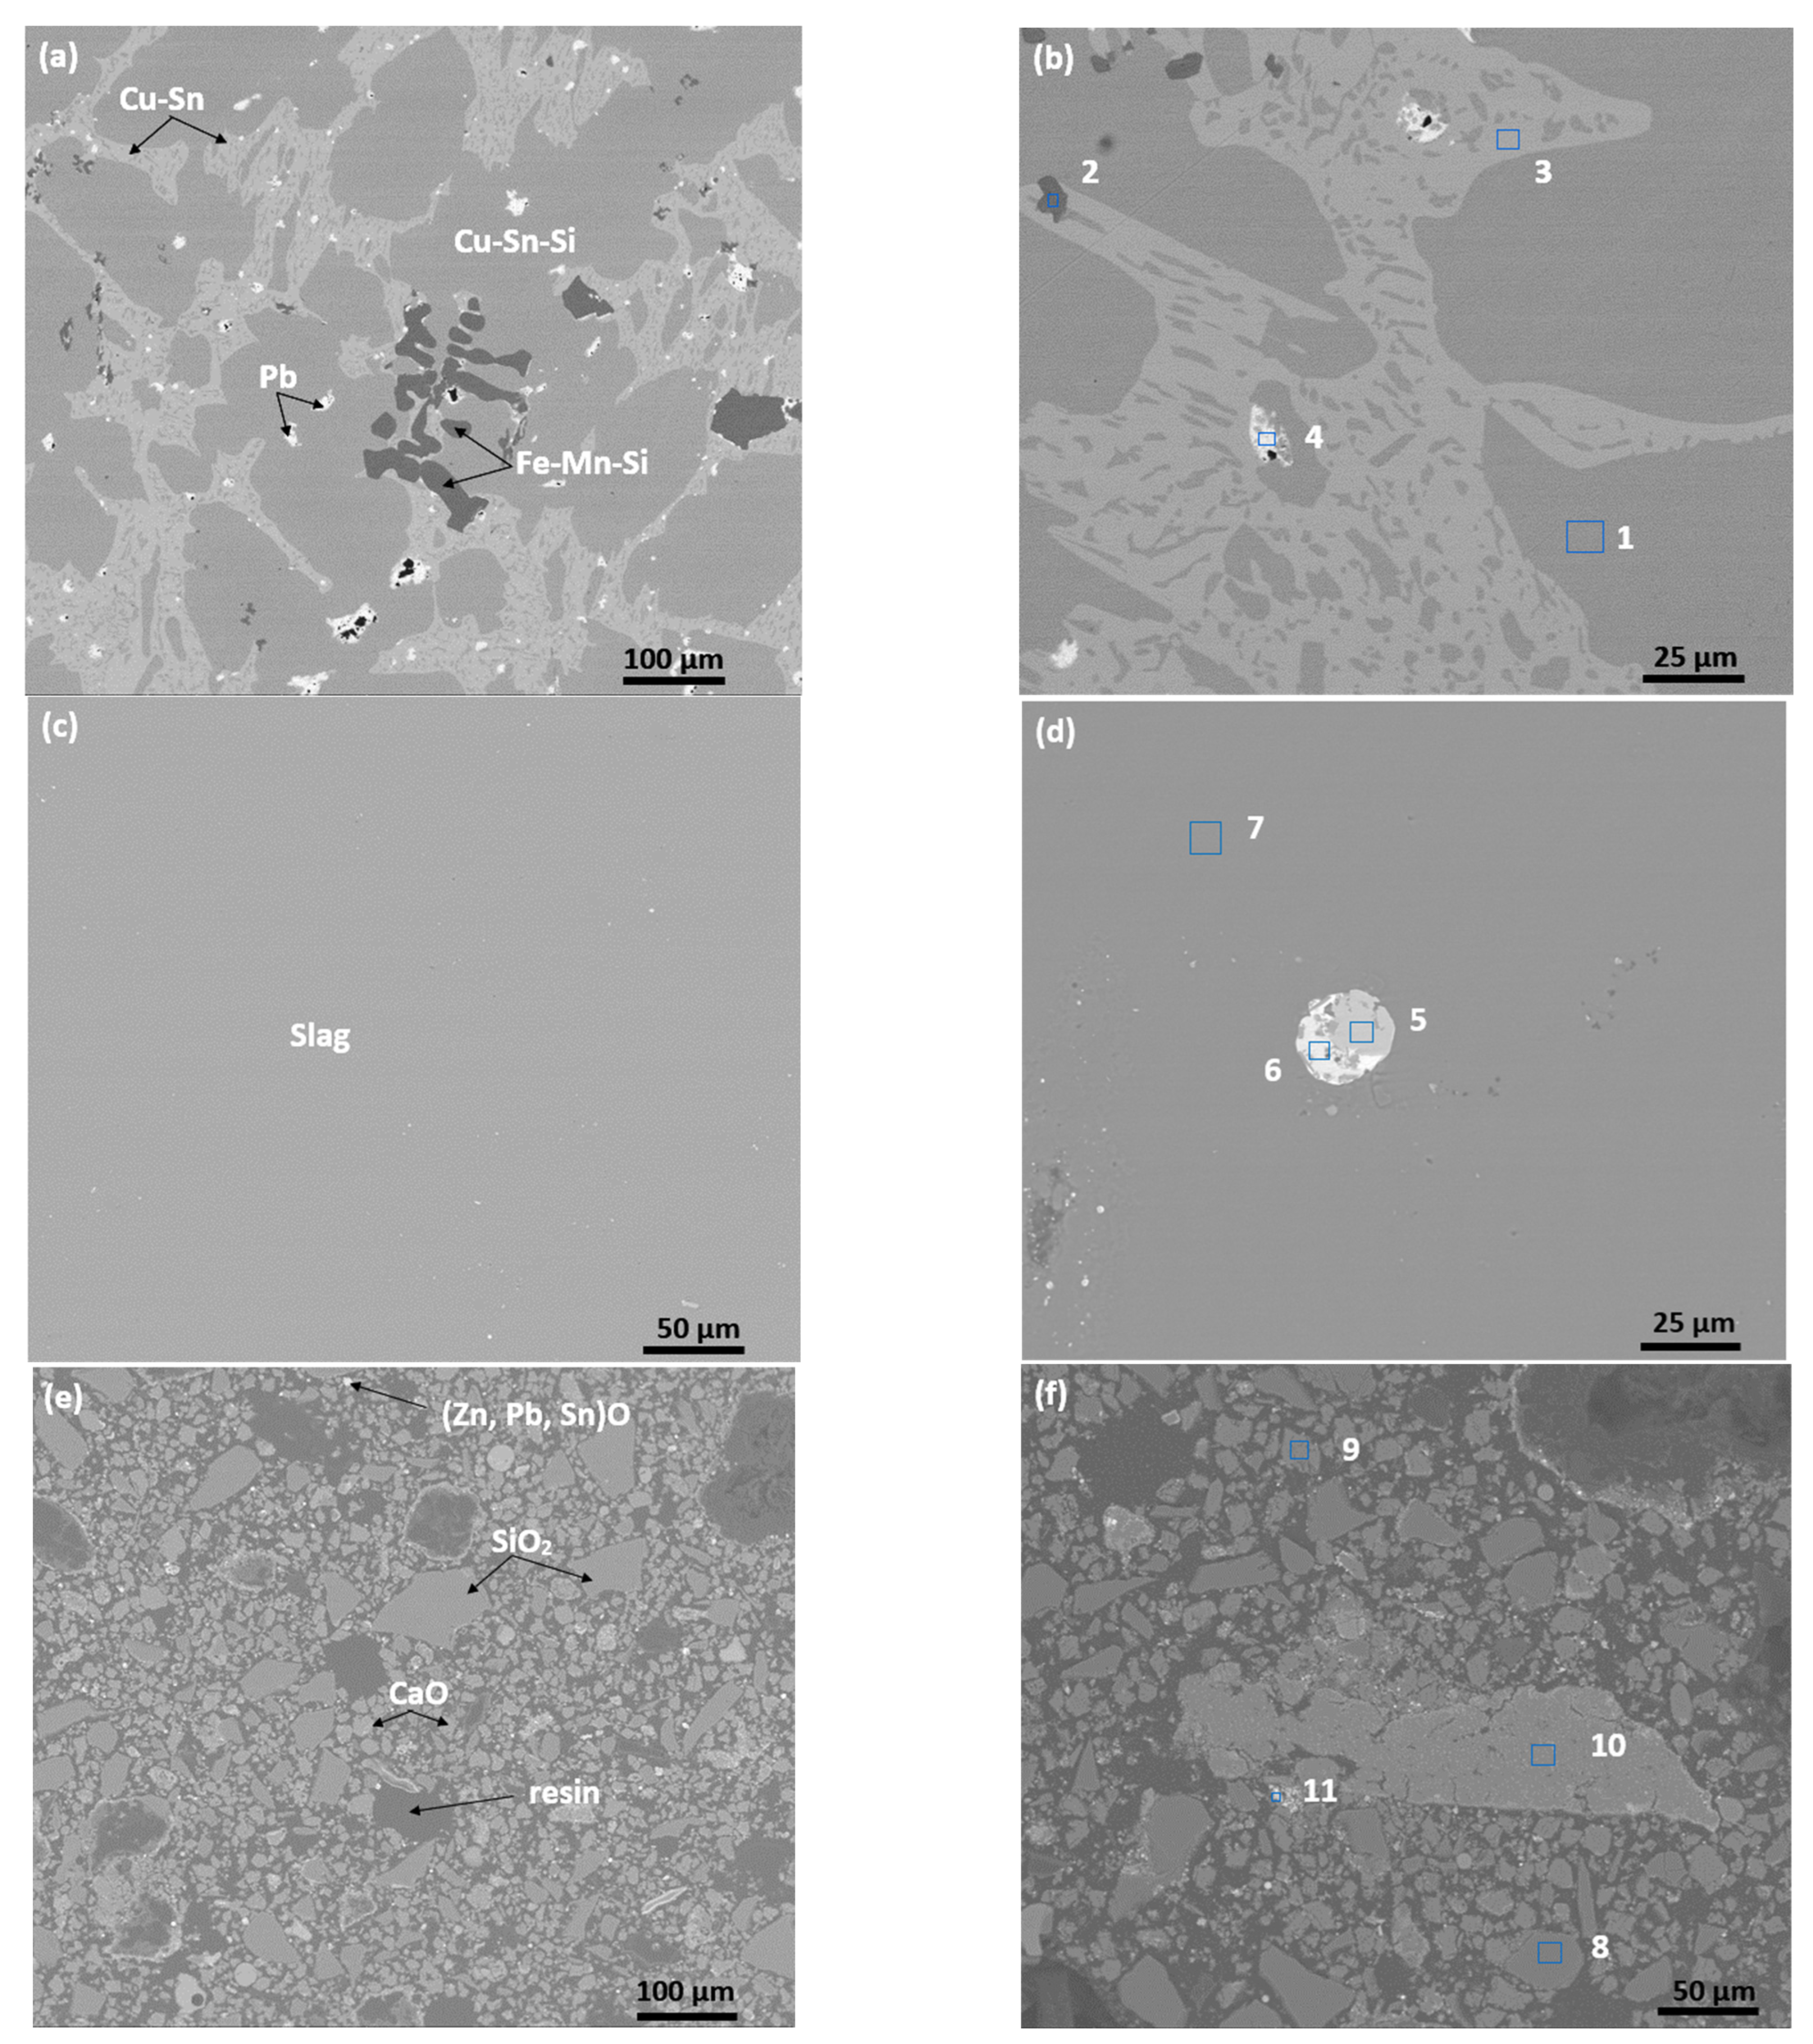
Figure 6a,c,e shows the backscattered electron (BSE) micrographs of the generated material streams (alloy, slag, and flue dust) in the smelting test. Figure 6b,d,f show EDS spectra taken in different locations of the alloy, slag, and flue dust, respectively. The semi-quantitative EDS analysis of the samples are presented in Table 10. Within the Cu-rich alloy, different phases formed, as can be seen in Figure 6a. The grey matrix (marked as position 1 in Figure 6b) is a Cu–Sn–Si alloy with minor Mg. The relatively brighter phase is the Cu–Sn alloy, while the brightest phase is characterized as Pb. The dark black phase contains Fe, Mn, and Si. Similar type of phases (i.e., Cu–Sn, and Pb) have previously been reported in the Cu-rich alloy phase obtained from smelting e-waste PCBs, and the precious metals (Au, Ag) were determined to have partitioned mostly into the Cu–Sn phases and Pb [22].
A homogenous slag was observed with that contained small amounts of tiny metallic prills physically entrapped within the slag, as shown in Figure 6c,d. EDS compositional analysis of the metal prills showed they contained Cu, Sn, Fe, Mn, and Si (Table 10). It was also noted that the CaO-Al2O3-SiO2-B2O3 based slag did not contain any metallic elements (i.e., Cu, Sn, Pb) in solid solution. The flue dust contained mostly SiO2 and CaO. The presence of bright ZnO and PbO in the flue dust indicated evaporation of these metal oxides during smelting due to their high vapour pressure.
The SEM-EDS elemental analysis results are consistent with the quantitative analysis results of the alloy, slag, and flue dust by XRF and ICP, as reported in the previous sections. However, precious metals in the alloy and B in the slag and flue dust were not detected using EDS, suggesting they were present in low abundances.

4. Conclusions

E-waste PCBs from various discarded electronic devices were smelted using electric furnaces to separate the generated alloy and slag streams. The main experimental findings can be concluded as following:
  • PCBs used in this study contained high levels of Al2O3, greater than 65%, and are thus very refractory and require very high temperature to melt. It was not possible to obtain homogenous alloy and slag phases through smelting at 1600 °C. Hence, some fluxing would be required for a successful smelting process.
  • Fluxing with B2O3 and CaO reduces the liquidus temperature of generated slags to reasonable temperatures. Smelting at 1350 °C produced a Cu-rich alloy and a homogenous liquid slag.
  • PCBs used in this study contained 30.3 wt.% metals, 32.4 wt.% organic matters, and 37.3 wt.% inorganic substances.
  • After smelting, the Cu-rich alloy phase contained 70 wt.% Cu, slightly above 14 wt.% Sn, around 100 ppm Au, and over 1400 ppm Ag.
  • Under the conditions of this work, all the contained precious metals reported to the alloy phase. The deportment of Cu and Sn in the slag phase was very low and indicates negligible loss of precious metals in slag phase.
Further experimental investigations are required to optimise the slag compositions, smelting temperature, and smelting time to obtain highest deportment of metals in the alloy stream and to lower the smelting temperature at the same time.

5. Recommendation

To keep the Al2O3 content lower and the slag composition within more reasonable temperatures, the electronic components may need to be disassembled, and some preliminary assortment could be useful [23]. Further smelting tests combined with few pre-processing steps (i.e., sorting, physical separations, and beneficiations) can optimise the process in terms of smelting temperature, proper slag design, and optimum smelting time to obtain highest metal recovery while minimizing the smelting temperature.

Author Contributions

Conceptualization, M.K.I. and M.S.; methodology, M.K.I., M.S. and M.I.P.; validation, M.S., J.T. and M.I.P.; formal analysis, M.K.I.; investigation, M.K.I.; resources, N.H. and S.B.; data curation, M.K.I.; writing—original draft preparation, M.K.I.; writing—review and editing, M.S. and M.I.P.; visualization, S.B. and J.T.; supervision, M.S., J.T. and M.I.P.; project administration, M.S. and J.T.; funding acquisition, N.H. and S.B. All authors have read and agreed to the published version of the manuscript.

Funding

This research was funded by CSIRO and RMIT University, Melbourne, Australia.

Data Availability Statement

The data presented in this study are available on request from the corresponding author. The data are not publicly available due to institutional restrictions.

Acknowledgments

The authors are grateful to Tom Austin and the Materials Characterization Team of CSIRO Mineral resources for their support to run the experiments and analyse the samples. The authors also acknowledge the financial support jointly provided by CSIRO and RMIT University.

Conflicts of Interest

All authors declare that they have no conflict of interest.

References

  1. Oguchi, M.; Murakami, S.; Sakanakura, H.; Kida, A.; Kameya, T. A preliminary categorization of end-of-life electrical and electronic equipment as secondary metal resources. Waste Manag. 2011, 31, 2150–2160. [Google Scholar] [CrossRef] [PubMed]
  2. Van Yken, J.; Boxall, N.J.; Cheng, K.Y.; Nikoloski, A.N.; Moheimani, N.R.; Kaksonen, A.H. E-waste recycling and resource recovery: A review on technologies, barriers and enablers with a focus on Oceania. Metals 2021, 11, 1313. [Google Scholar] [CrossRef]
  3. Yang, H.; Liu, J.; Yang, J. Leaching copper from shredded particles of waste printed circuit boards. J. Hazard. Mater. 2011, 187, 393–400. [Google Scholar] [CrossRef] [PubMed]
  4. Sethurajan, M.; van Hullebusch, E.D. Leaching and selective recovery of Cu from printed circuit boards. Metals 2019, 9, 1034. [Google Scholar] [CrossRef]
  5. Birloaga, I.; de Michelis, I.; Ferella, F.; Buzatu, M.; Vegliò, F. Study on the influence of various factors in the hydrometallurgical processing of waste printed circuit boards for copper and gold recovery. Waste Manag. 2013, 33, 935–941. [Google Scholar] [CrossRef]
  6. Khaliq, A.; Rhamdhani, M.A.; Brooks, G.; Masood, S. Metal extraction processes for electronic waste and existing industrial routes: A review and Australian perspective. Resources 2014, 3, 152–179. [Google Scholar] [CrossRef]
  7. Bachér, J.; Rintala, L.; Horttanainen, M. The effect of crusher type on printed circuit board assemblies’ liberation and dust generation from waste mobile phones. Miner. Eng. 2022, 185, 107674. [Google Scholar] [CrossRef]
  8. Benzal, E.; Cano, A.; Solé, M.; Lao-Luque, C.; Gamisans, X.; Dorado, A.D. Copper recovery from PCBs by Acidithiobacillus ferrooxidans: Toxicity of bioleached metals on biological activity. Waste Biomass Valorization 2020, 11, 5483–5492. [Google Scholar] [CrossRef]
  9. Mir, S.; Dhawan, N. A comprehensive review on the recycling of discarded printed circuit boards for resource recovery. Resour. Conserv. Recycl. 2022, 178, 106027. [Google Scholar] [CrossRef]
  10. Harvey, J.; Khalil, M.; Chaouki, J. Pyrometallurgical processes for recycling waste electrical and electronic equipment. In Electronic Waste: Recycling and Reprocessing for a Sustainable Future; Holuszko, M.E., Kumar, A., Espinosa, D.C.R., Eds.; Wiley-VCH GmbH: Weinheim, Germany, 2022; pp. 135–164. [Google Scholar] [CrossRef]
  11. Park, H.S.; Han, Y.S.; Park, J.H. Massive recycling of waste mobile phones: Pyrolysis, physical treatment, and pyrometallurgical processing of insoluble residue. ACS Sustain. Chem. Eng. 2019, 7, 14119–14125. [Google Scholar] [CrossRef]
  12. Ghodrat, M.; Rhamdhani, M.A.; Khaliq, A.; Brooks, G.; Samali, B. Thermodynamic analysis of metals recycling out of waste printed circuit board through secondary copper smelting. J. Mater. Cycles Waste Manag. 2017, 20, 386–401. [Google Scholar] [CrossRef]
  13. Anindya, A. Minor Elements Distribution during the Smelting of WEEE with Copper Scrap. Ph.D. Thesis, RMIT University, Melbourne, Australia, 2012. Available online: https://researchrepository.rmit.edu.au/esploro/outputs/9921861217401341 (accessed on 5 June 2019).
  14. Chen, M.; Avarmaa, K.; Klemettinen, L.; O’brien, H.; Sukhomlinov, D.; Shi, J.; Taskinen, P.; Jokilaakso, A. Recovery of precious metals (Au, Ag, Pt, and Pd) from urban mining through copper smelting. Met. Mater. Trans. B 2020, 51, 1495–1508. [Google Scholar] [CrossRef]
  15. Hidayat, T.; Hayes, P.C.; Jak, E. Characterisation of the effect of Al2O3 on the liquidus temperatures of copper cleaning furnace slags using experimental and modelling approach. Mater. Trans. 2019, 60, 1377–1383. [Google Scholar] [CrossRef]
  16. Islam, K.; Pownceby, M.I.; Somerville, M.; Tardio, J.; Haque, N.; Bhargava, S. Effect of B2O3 on the liquidus temperature and phase equilibria in the CaO–Al2O3–SiO2–B2O3 slag system, relevant to the smelting of e-waste. J. Sustain. Met. 2022, 8, 1590–1605. [Google Scholar] [CrossRef]
  17. Hino, T.; Agawa, R.; Moriya, Y.; Nishida, M.; Tsugita, Y.; Araki, T. Techniques to separate metal from waste printed circuit boards from discarded personal computers. J. Mater. Cycles Waste Manag. 2009, 11, 42–54. [Google Scholar] [CrossRef]
  18. Wang, J.; Xu, Z. Disposing and recycling waste printed circuit boards: Disconnecting, resource recovery, and pollution control. Environ. Sci. Technol. 2015, 49, 721–733. [Google Scholar] [CrossRef] [PubMed]
  19. Osborn, E.F.; Muan, A. Phase Equilibrium Diagrams of Oxide Systems; American Ceramic Society with the Edward Orton Jr. Ceramic Foundation: Columbus, OH, USA, 1960. [Google Scholar]
  20. Gao, J.; Huang, Z.; Wang, Z.; Guo, Z. Recovery of crown zinc and metallic copper from copper smelter dust by evaporation, condensation and super-gravity separation. Sep. Purif. Technol. 2020, 231, 115925. [Google Scholar] [CrossRef]
  21. Chen, M.; Avarmaa, K.; Taskinen, P.; Klemettinen, L.; Michallik, R.; O’Brien, H.; Jokilaakso, A. Novel fluxing strategy of copper matte smelting and trace metals in E-Waste recycling. Miner. Eng. 2023, 191, 107969. [Google Scholar] [CrossRef]
  22. Carelse, C.; Manuel, M.; Chetty, D.; Corfleld, A. Au and Ag distribution in alloys produced from the smelting of printed circuit boards-an assessment using SEM-EDS, EPMA, and LA-ICP-MS analysis. J. South. Afr. Inst. Min. Met. 2020, 120, 203–210. [Google Scholar] [CrossRef]
  23. Suponik, T.; Franke, D.M.; Nuckowski, P.M.; Matusiak, P.; Kowol, D.; Tora, B. Impact of grinding of printed circuit boards on the efficiency of metal recovery by means of electrostatic separation. Minerals 2021, 11, 281. [Google Scholar] [CrossRef]
Figure 1. Time vs temperature plot during the pyrolysis of PCBs.
Minerals 13 00727 g001
Figure 2. Schematic of induction furnace, crucible arrangement and fume treatment process.
Minerals 13 00727 g002
Figure 3. Flowsheet of the pyrometallurgical processing of PCBs smelting to recover materials.
Minerals 13 00727 g003
Figure 4. (a) Size reduced PCBs, (b) Pyrolyzed PCBs, (c) Cu-rich alloy phase after smelting, (d) Flue dust from smelting.
Minerals 13 00727 g004
Figure 5. Ternary CaO-Al2O3-SiO2 phase diagram showing the approximate composition of raw PCBs slag (red) and target slag composition of the induction smelting test (green) with flux additives. The ternary phase diagram was redrawn using data from reference [19].
Minerals 13 00727 g005
Figure 6. Representative SEM images (BSE) and boxed regions showing the positions of semi-quantitative EDS analysis of phases in the smelted PCBs. (ad) Images showing the typical microstructure and textural features present in the quenched material. In general, the brightest phase represents the alloy, while the darker phase(s) are the slag. (e,f) Images showing typical microstructural features of the flue dust together with positions of semi-quantitative EDS analysis datapoints. Numbers 1–11 indicate the EDS spectrum on individual phases present.
Minerals 13 00727 g006
Table 1. Mass balance of the PCBs’ contained materials.
Material Stream% WeightAttributed to
Pyrolysis loss (volatiles)25.7Organics (32.4%)
Smelting loss (residual carbon)6.7
Alloy30.3Metals (30.3%)
Slag31.3Inorganics (37.3%)
Flue dust6.0
Table 2. Composition of slags generated during preliminary smelting of PCBs in wt.%.
Slag IDMgO Al2O3 SiO2 CaO Mn3O4 Fe2O3 CuO ZnO PbO SnO2 Others
Slag-B 1.348.99.06.51.69.817.30.10.13.91.5
Slag-T1.463.79.64.21.910.06.00.60.11.51.0
Slag-W0.964.97.12.11.59.34.87.30.30.81.0
Table 3. Calculation of flux additives based on PCBs slag composition required to reach the target slag composition investigated in this study.
OxidesPCBs Slag Composition (%)Slag Contribution from PCBs (404.5 g)Amount of Flux Added (g)Target Slag Composition (wt.%)C/S Ratio
Al2O365.2118.70.015.80.6
SiO220.336.9269.840.9
CaO14.526.4160.624.5
B2O30.00.0143.918.8
Total182.0574.3
Sum of slag 756.3 g
Table 4. Overall material balance in terms of input and output mass of the smelting test.
Input MaterialMass (g)Output MaterialMass (g)
Pyrolyzed PCBs404.5total alloy155.7
SiO2269.8total slag726.6
B2O3143.9total flue dust30.8
CaO160.6total output913.1
total input978.8% material recovery93.3
Table 5. Total amount of alloy and the distribution of metallic elements in the alloy phase.
ElementsAlloy Composition (wt.%)Total Amount of Alloy (g)Total Metal in the Alloy (g)
Cu69.2155.7107.73
Sn14.322.26
Ni0.50.78
Fe6.49.96
Mn1.32.02
Pb2.64.05
Zn0.050.08
Si4.26.54
Au (ppm)1010.02
Ag (ppm)14590.23
Pt (ppm)560.01
others1.32.02
Table 6. Composition of the final slag and total amount of slag generated.
OxidesComposition (wt.%)Total Amount of Slag (g)Total Oxides in Slag (g)Metallic Element (g)
Al2O317.3726.6125.69--
SiO232.1233.22--
CaO20.6149.67--
B2O38.461.03--
MgO20.4148.22--
Mn3O40.32.181.69Mn
Fe2O30.151.090.76Fe
CuO0.020.150.12Cu
ZnO0.020.150.12Zn
PbO00.000.00Pb
SnO20.0170.120.10Sn
NiO0.141.020.80Ni
Others0.463.34
Table 7. Oxides present in the flue dust captured and the elemental recovery.
OxidesComposition (wt.%)Amount of Flue Dust (g)Total Oxides in The Flue Dust (g)Metallic Element (g)
Al2O36.130.81.88--
SiO237.211.47--
CaO23.67.28--
B2O311.73.61--
Fe2O310.33.182.22Fe
CuO0.20.060.05Cu
ZnO8.82.712.18Zn
PbO0.90.280.26Pb
SnO20.50.150.12Sn
NiO0.170.050.04Ni
Others0.60.19--
Table 8. Calculation of the overall metal recovery in the alloy phase.
ElementTotal in Alloy (g)Total in Slag (g)Total in Flue Dust (g)%Recovery in Alloy
Cu107.730.120.0599.8
Sn22.260.10.1299.0
Ni0.780.800.0448.1
Fe9.960.762.2277.0
Mn2.021.69054.5
Pb4.0500.2694.0
Zn0.080.122.183.3
Si6.54---
Au0.0200100
Ag0.2300100
Pt0.0100100
Others2.02---
Table 9. Composition of slag samples collected during the smelting test in wt.% (S-02 and S-04 are slag collected 1 h interval after reaching smelting temperature).
Slag IDMgOB2O3Al2O3SiO2CaOMn3O4Fe2O3CuOZnOPbOSnO2Others
S-02 (1 h)1614.615.231.319.60.50.80.60.40.10.10.8
S-04 (2 h)19.47.417.332.820.20.50.80.50.00.00.10.9
Final slag (2 h, cooled to room temperature)20.48.417.332.120.60.30.10.00.00.00.00.6
Table 10. Semi-quantitative composition (wt.%) from EDS compositional analysis of the various phases present in the quenched slag and alloy and phases in the flue dust. Positions of the analysis points are indicated in Figure 6.
SpectrumOMgAlSiCaMnFeCuZnSnPb
Alloy_EDS 1 0.4 1.2 89.3 9.1
Alloy_EDS 2 15.7 10.374.0
Alloy_EDS 3 72.4 27.6
Alloy_EDS 4 100.0
Slag_EDS 5 20.179.9
Slag_EDS 6 1.9 94.4 3.7
Slag_EDS 745.612.810.415.415.8
Flue dust_EDS 849.6 50.4
Flue dust_EDS 951.7 48.3
Flue dust_EDS 10 100.0
Flue dust_EDS 1118.2 69.0 12.8
Disclaimer/Publisher’s Note: The statements, opinions and data contained in all publications are solely those of the individual author(s) and contributor(s) and not of MDPI and/or the editor(s). MDPI and/or the editor(s) disclaim responsibility for any injury to people or property resulting from any ideas, methods, instructions or products referred to in the content.

