
Influence of Low-Temperature Hydrothermal Events and Basement Fault System on Low-Resistivity Shale Reservoirs: A Case Study from the Upper Ordovician to Lower Silurian in the Sichuan Basin, SW China
Abstract
:1. Introduction
2. Geological Setting
3. Samples and Methods
3.1. Mineral Composition and Morphological Analysis
3.1.1. Elementary Geochemistry Analysis
3.1.2. Inorganic Isotope Geochemistry
3.2. Organic Geochemistry Analysis
3.3. Electrical Resistivity
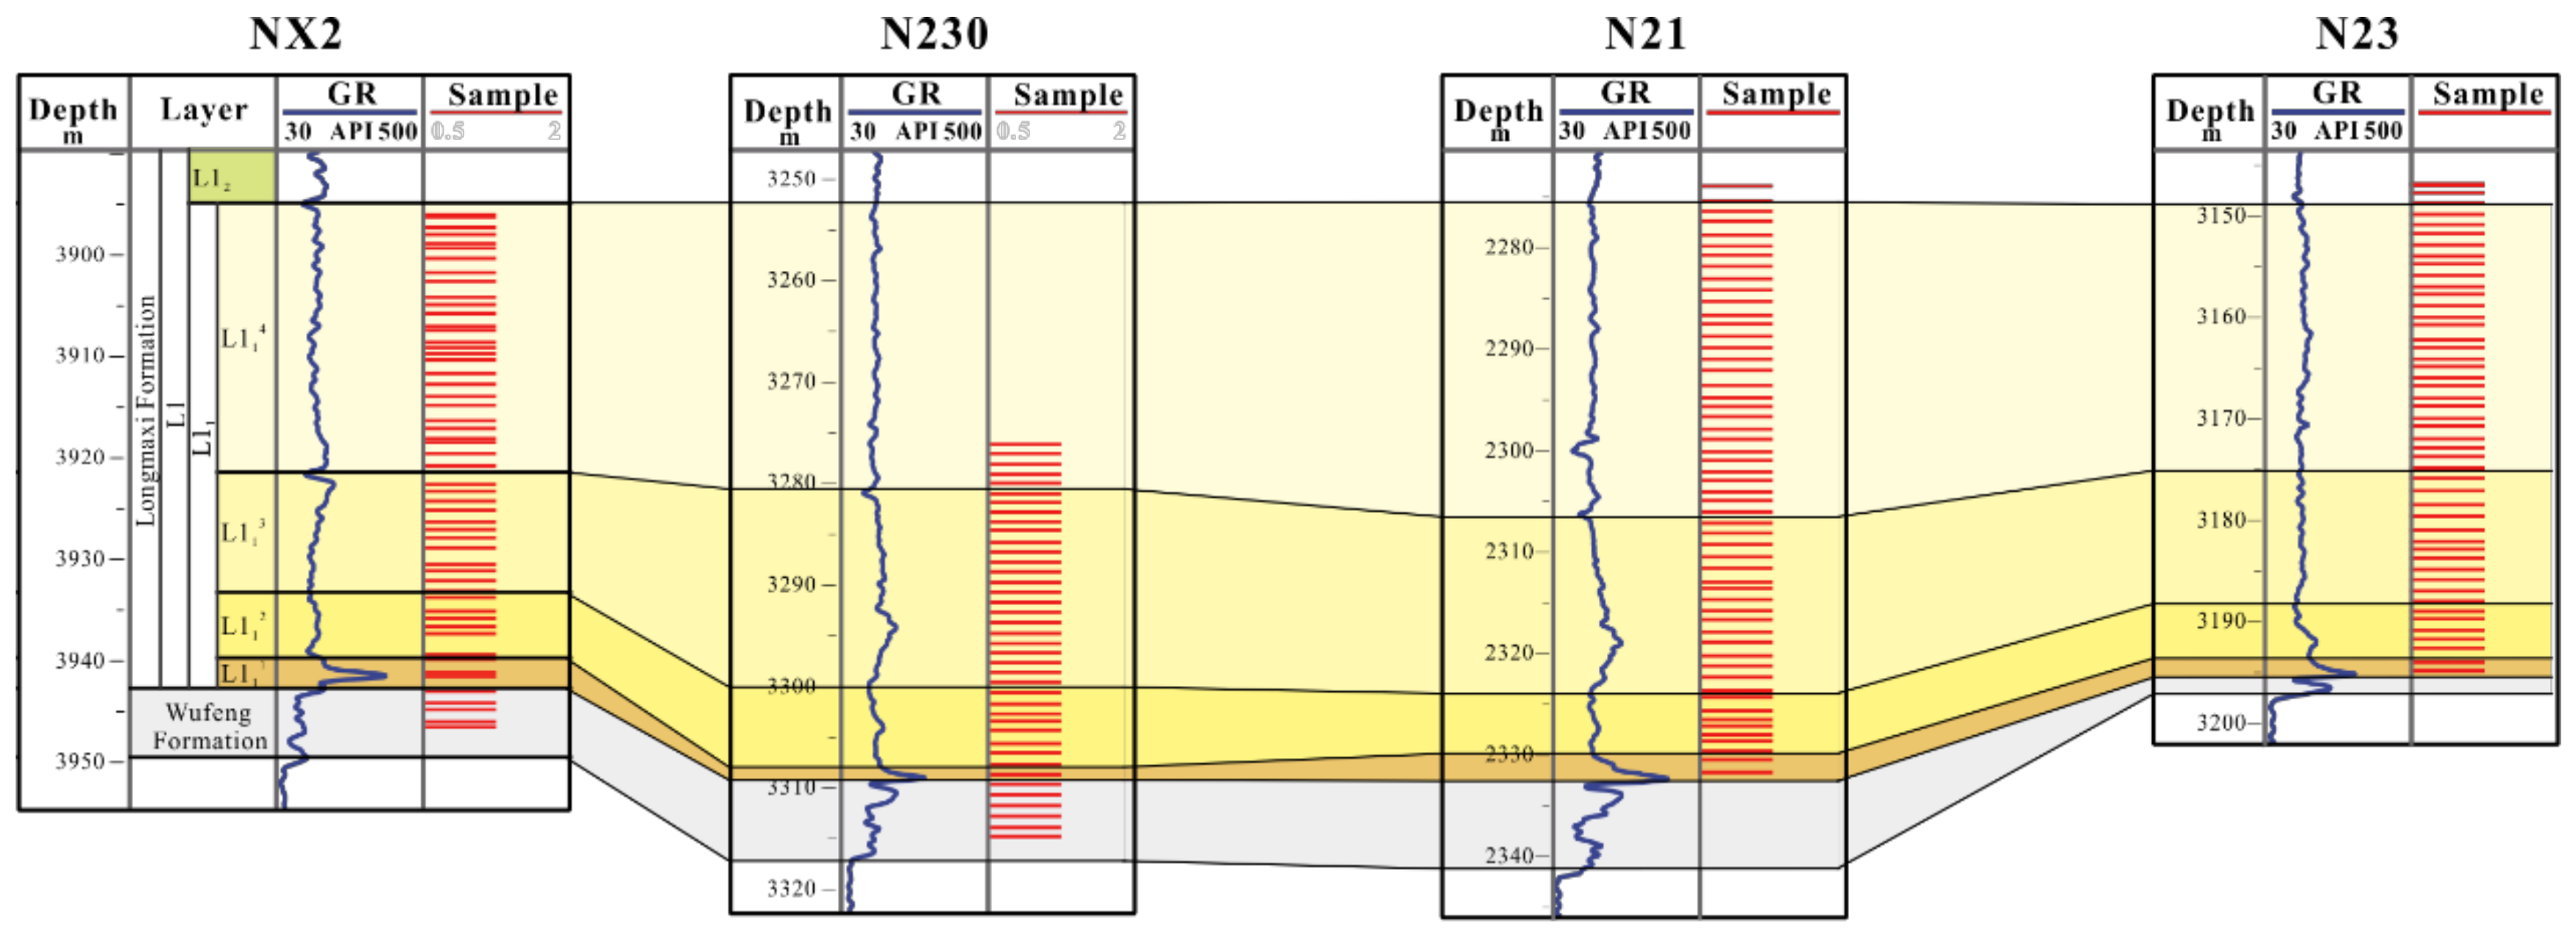
3.3.1. Well logs and Seismic Data
3.3.2. Fluid Inclusion Analysis
4. Results
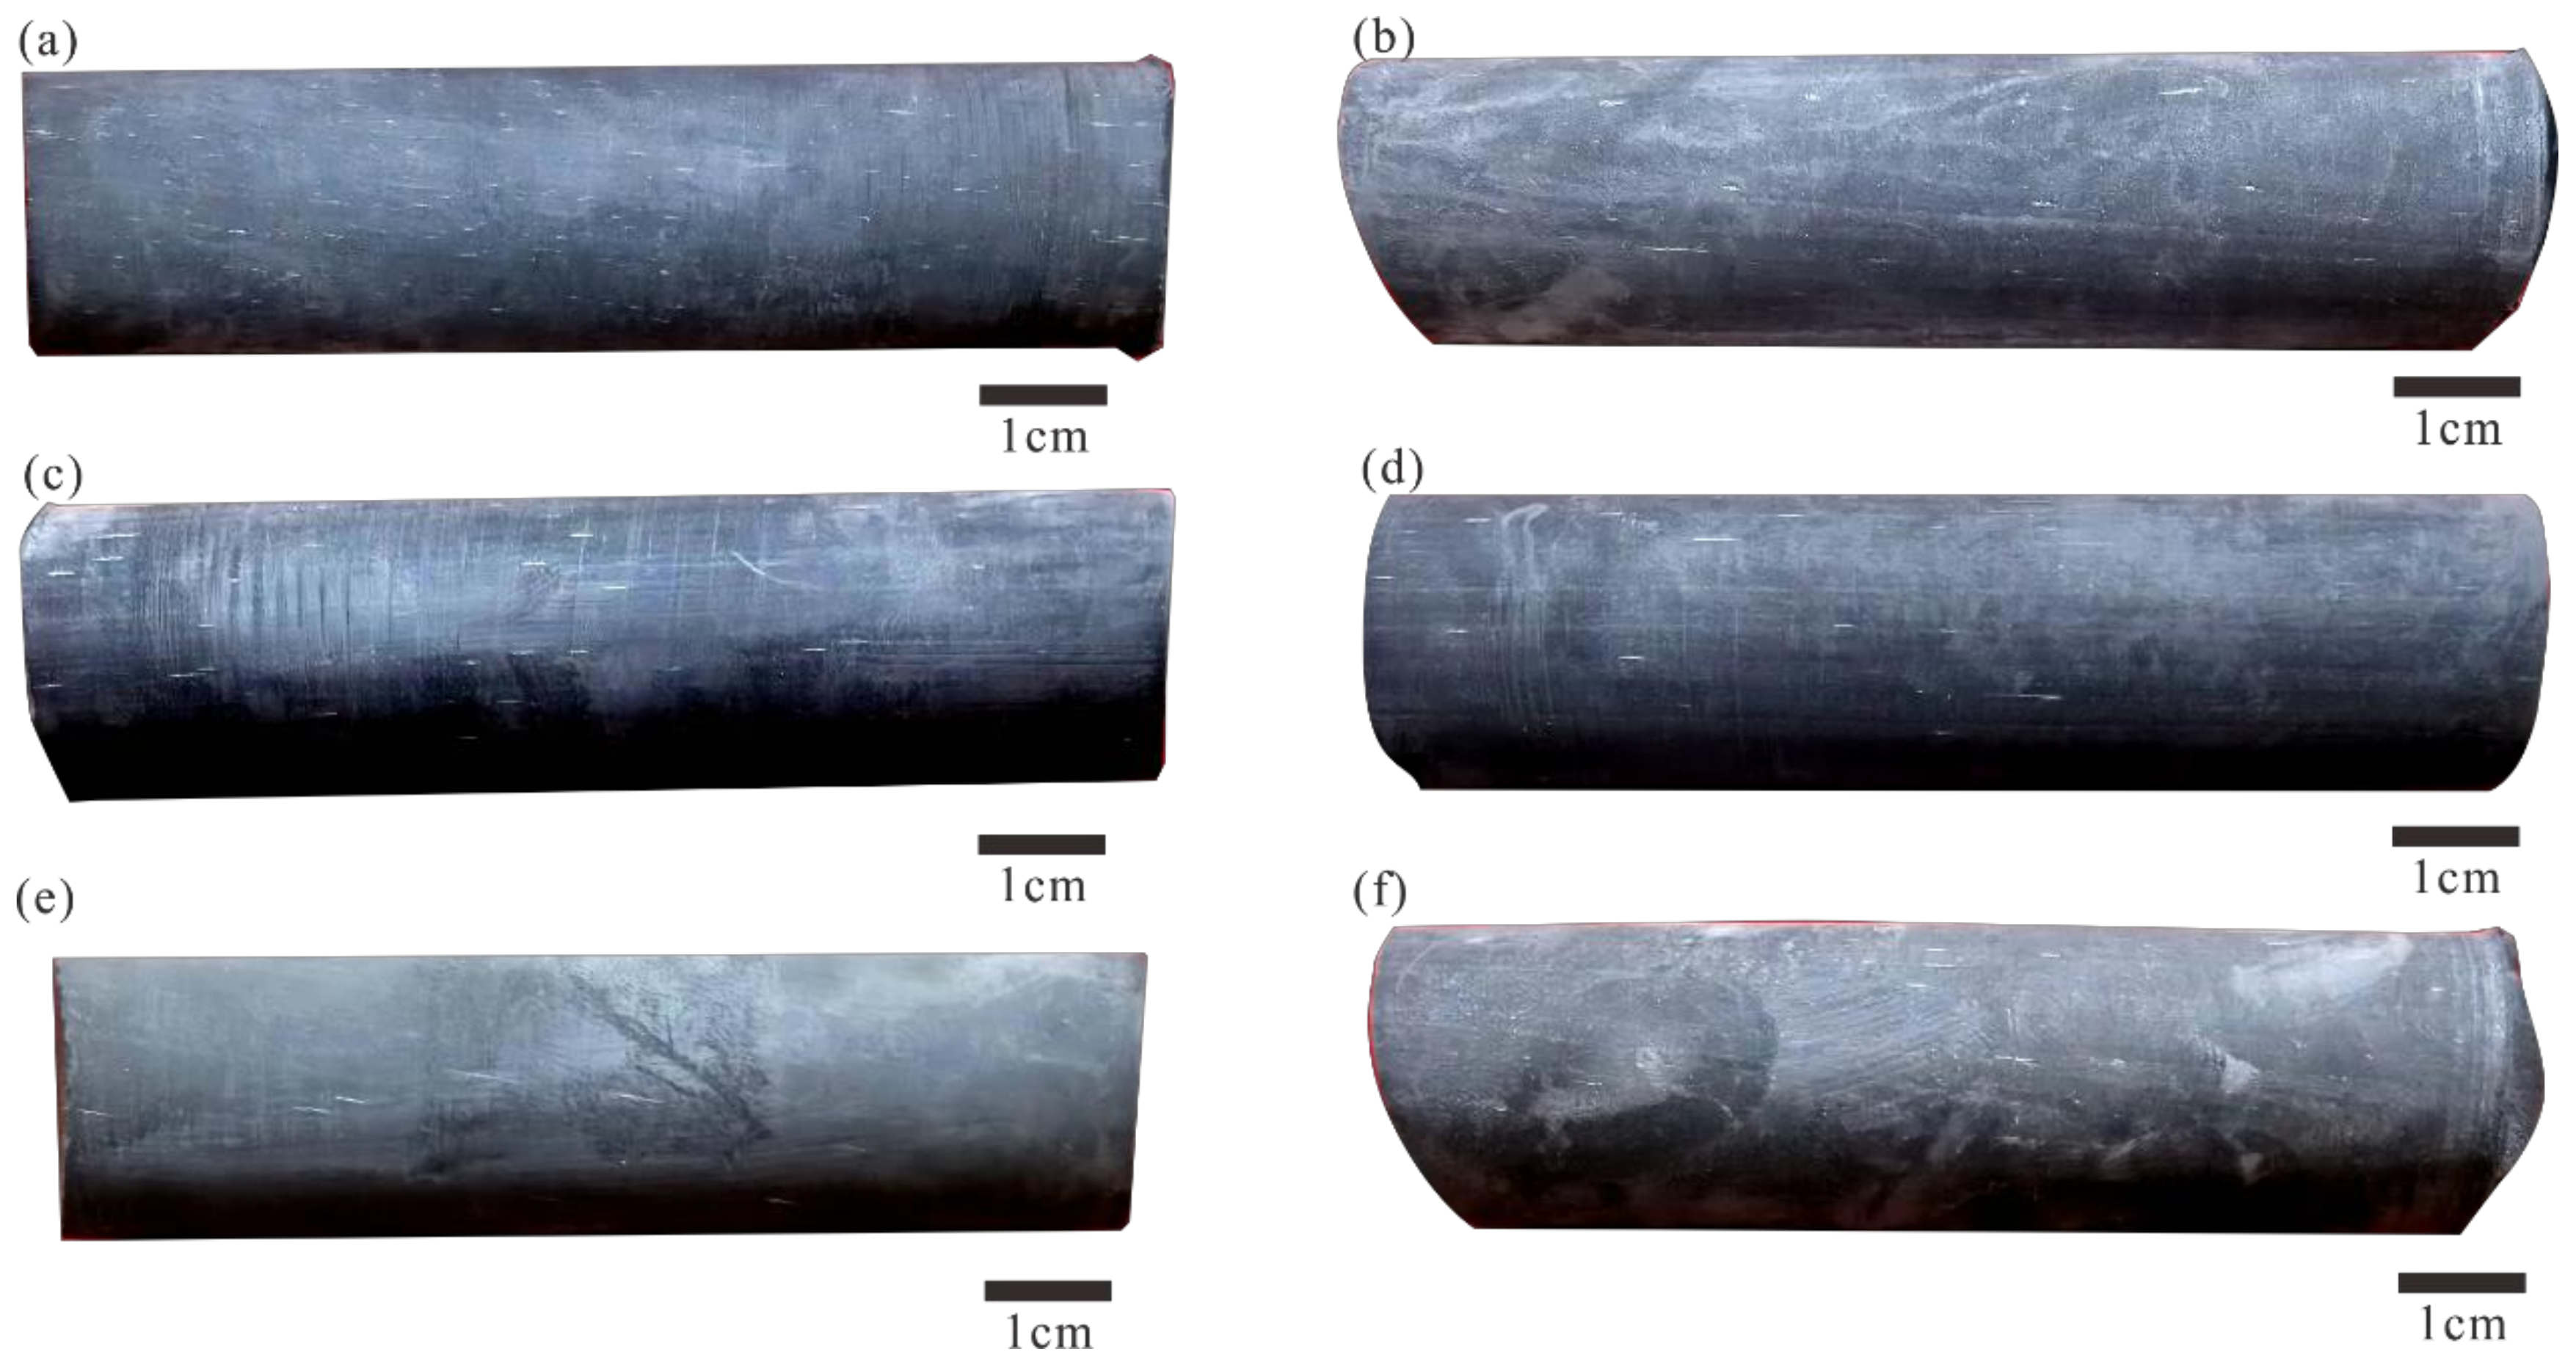
4.1. Lithology
4.1.1. Petrography and Mineralogy
4.1.2. Major Elements
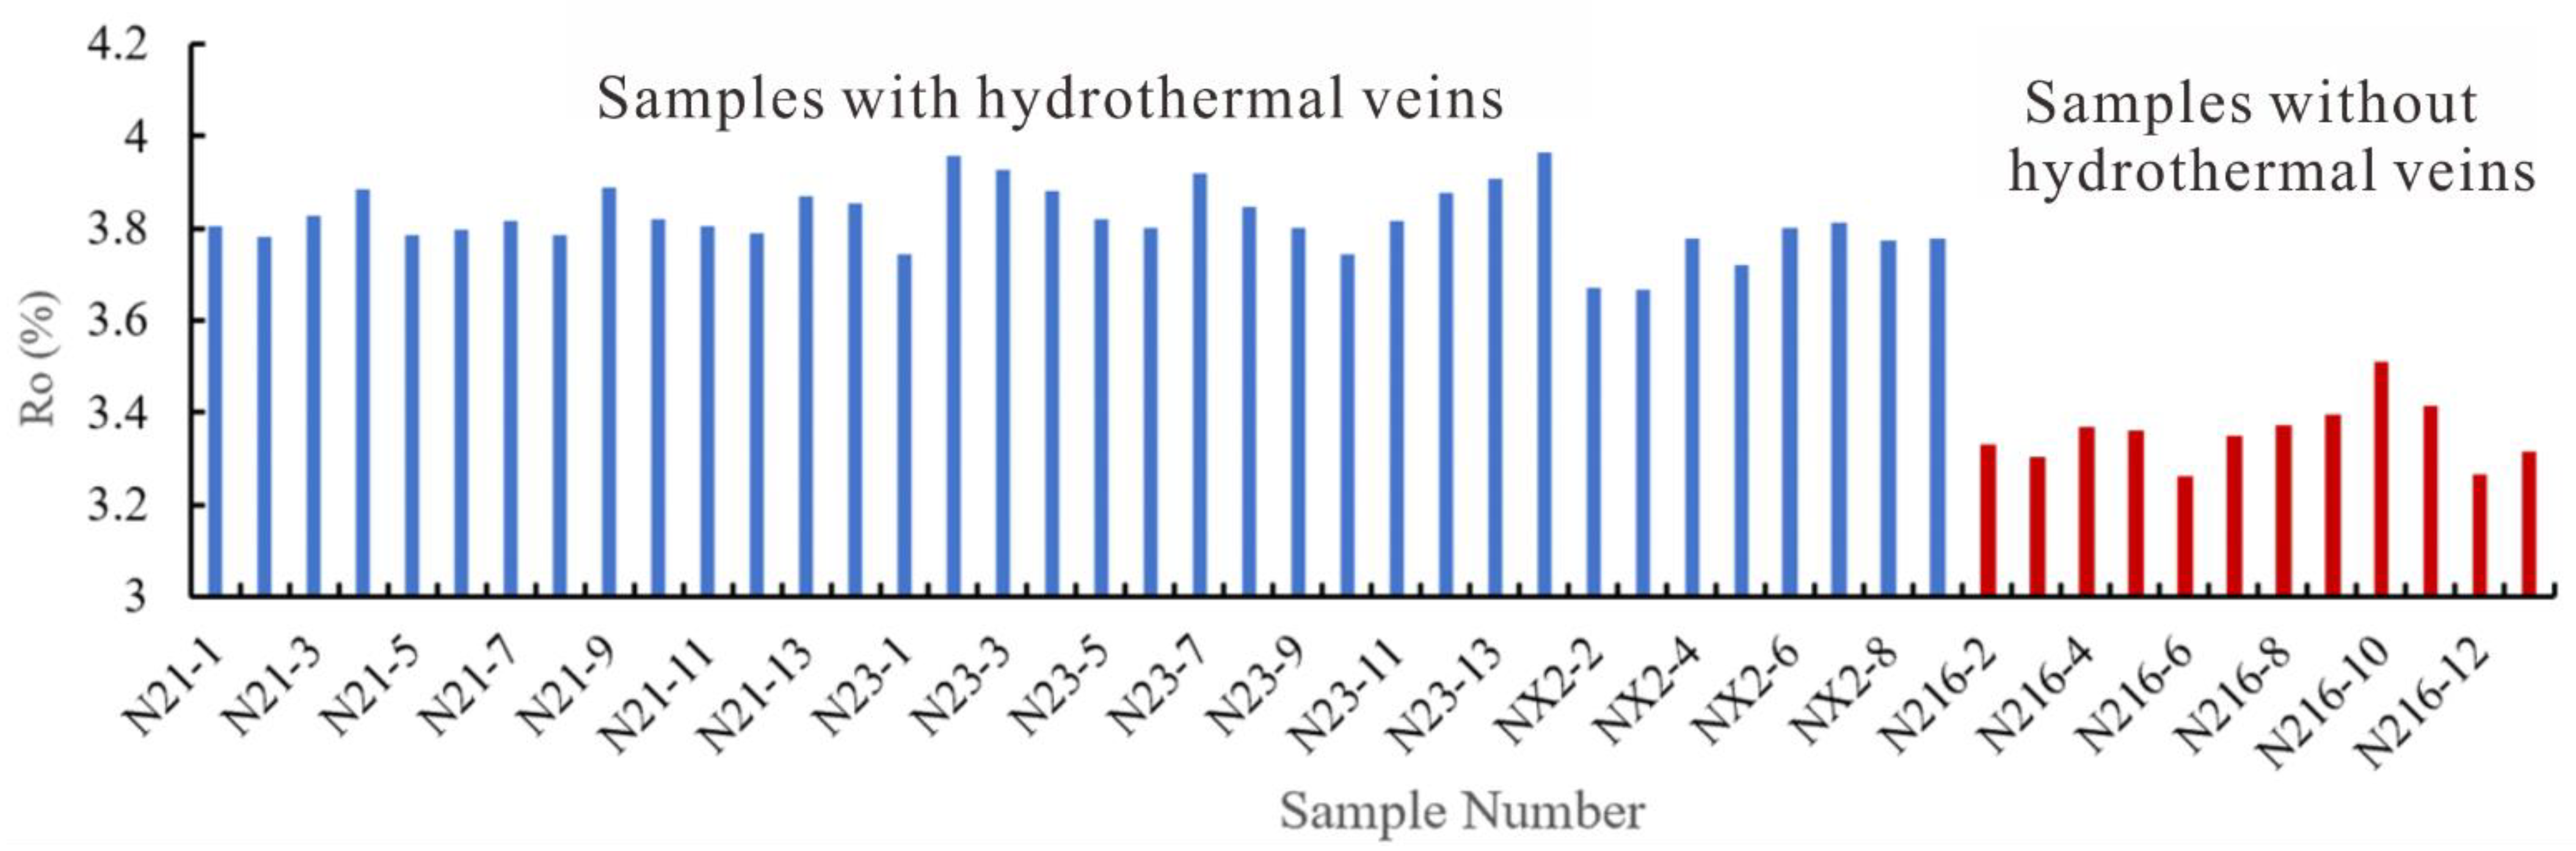
4.2. Organic Matter Graphitization
4.3. Hydrothermal Circulation Evidences
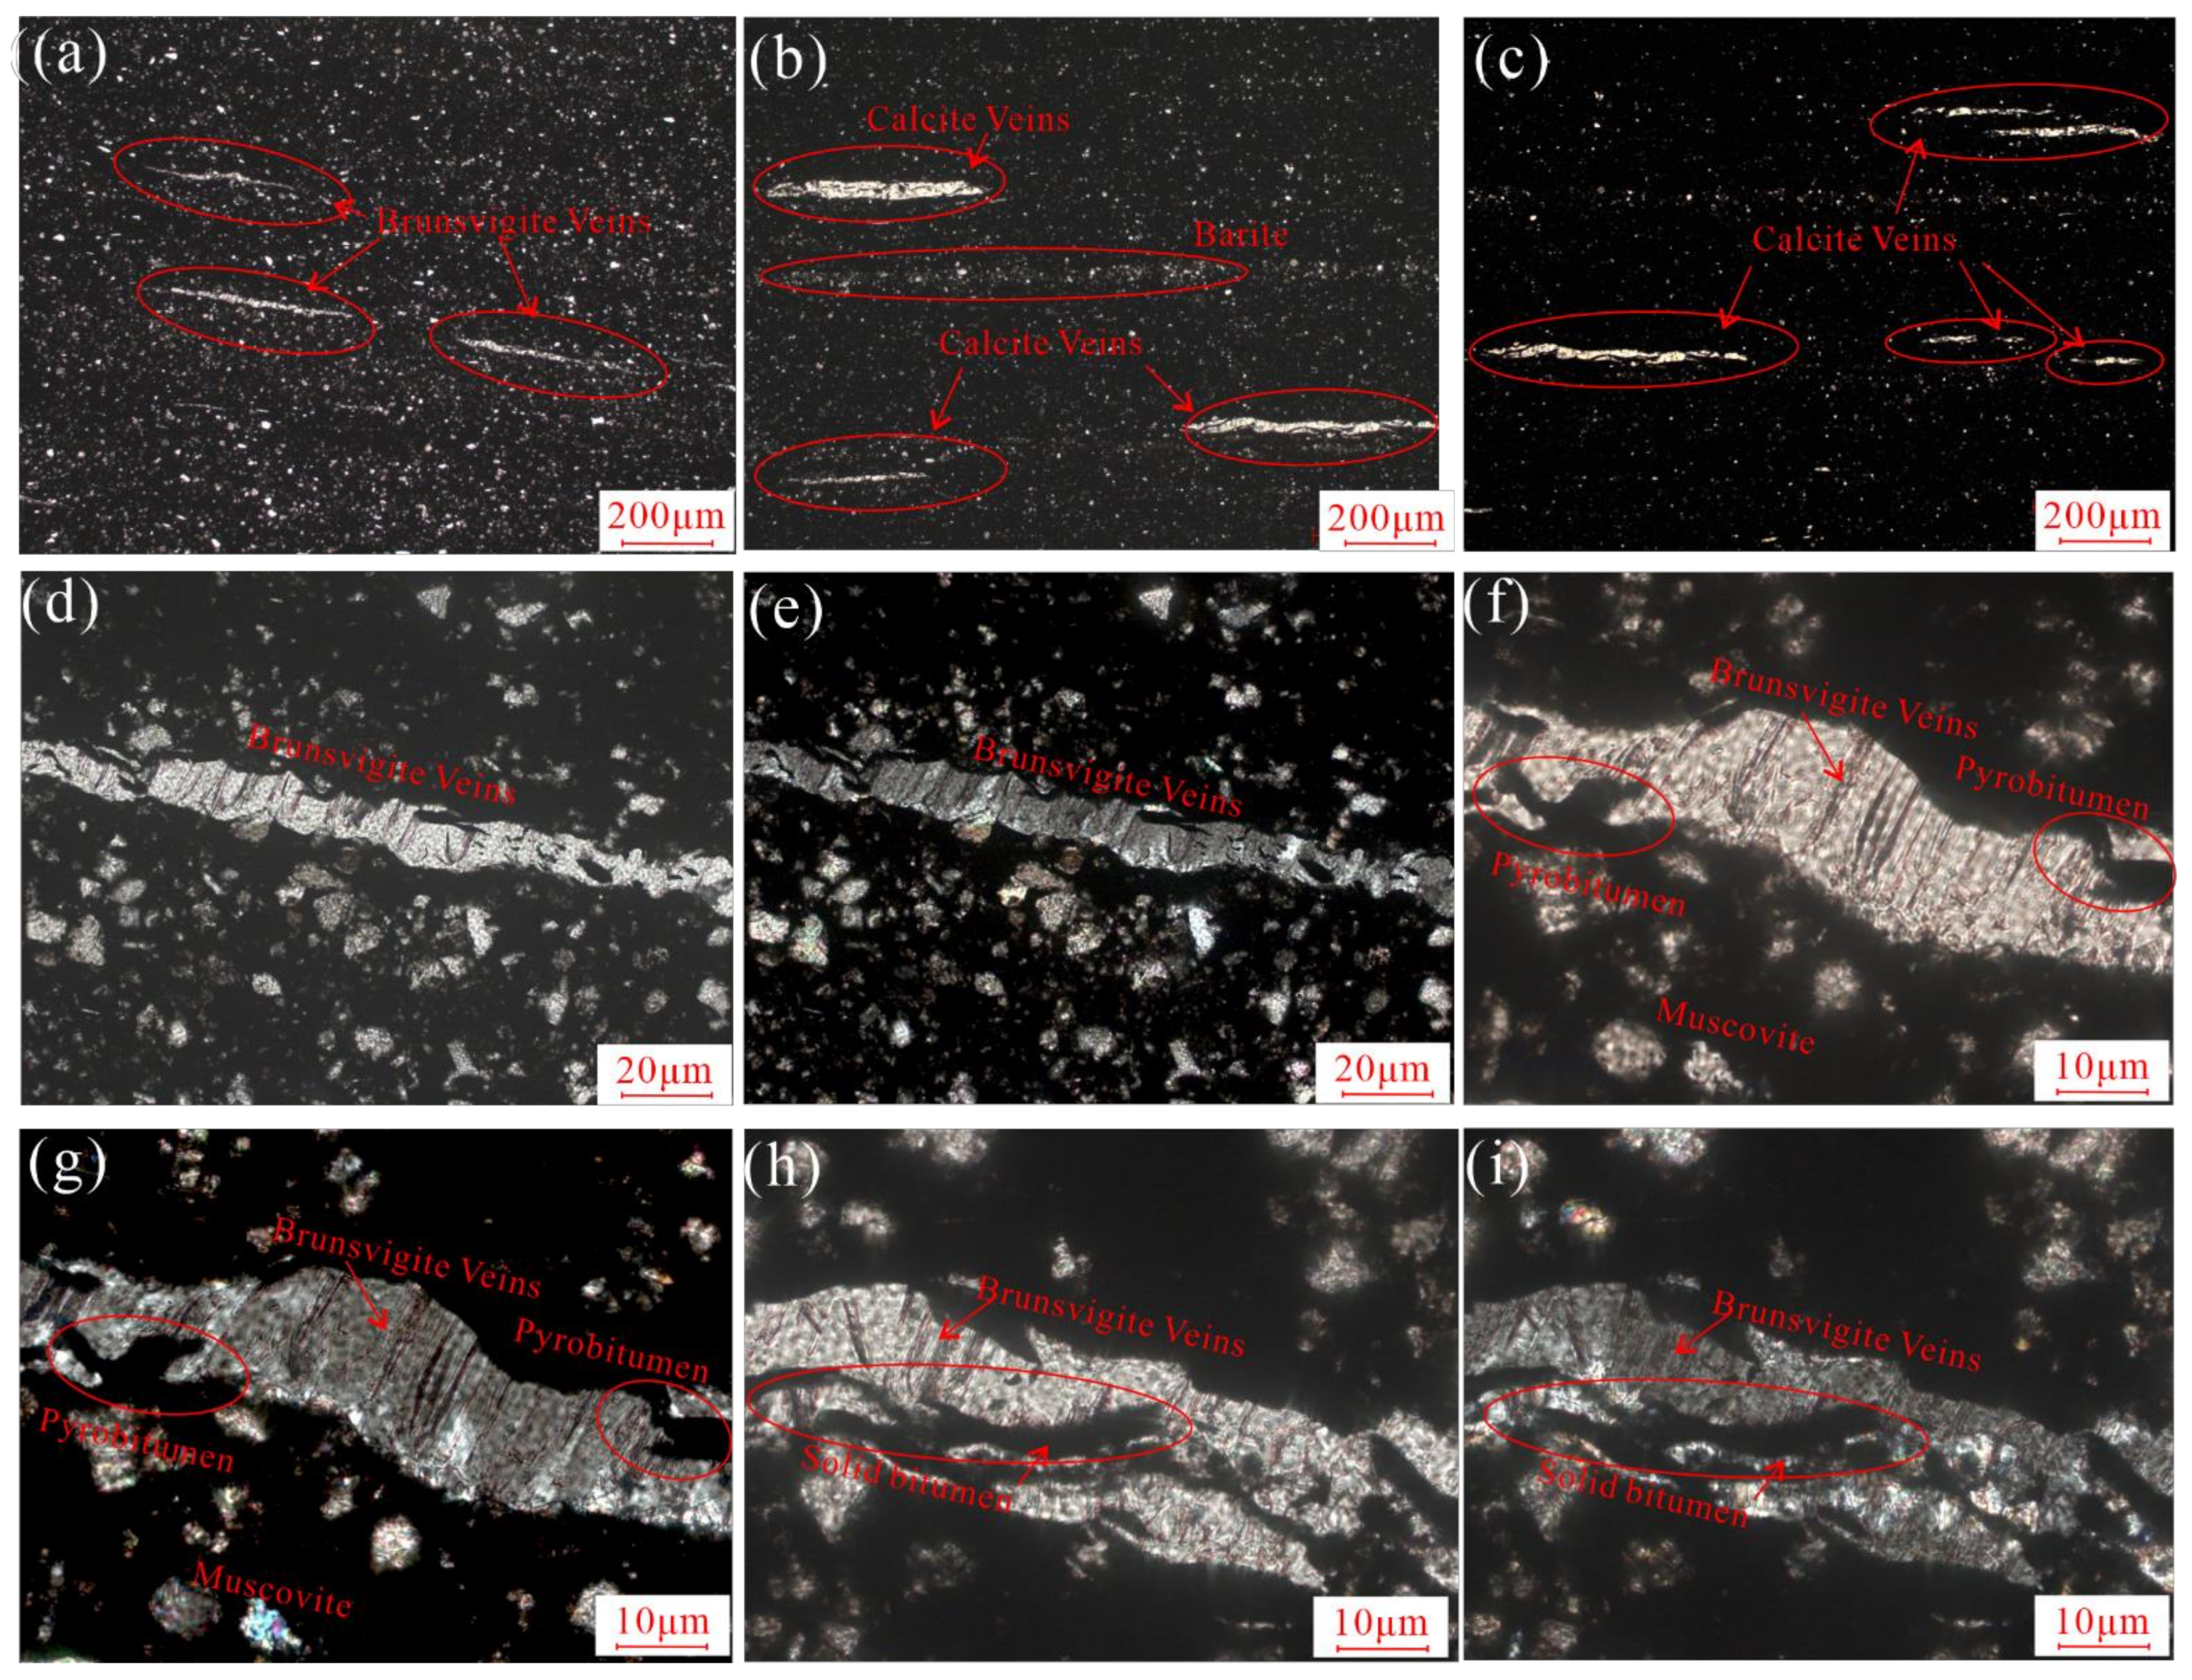
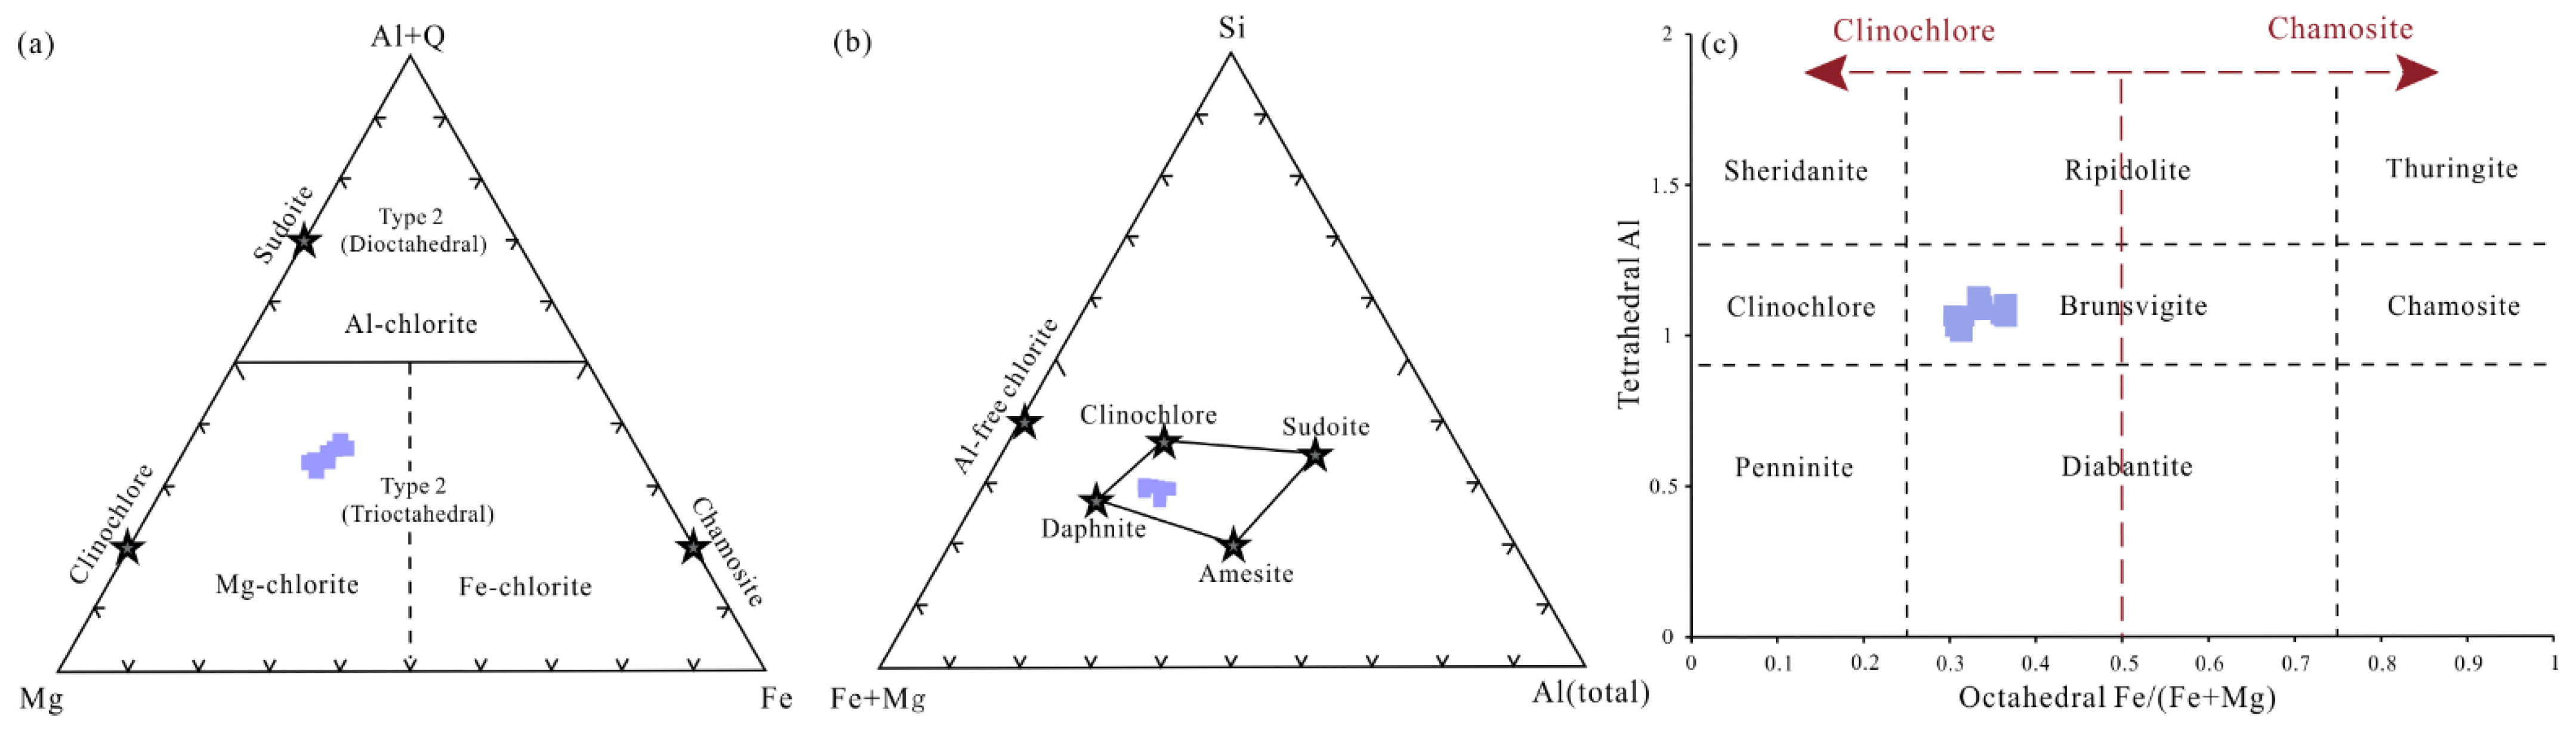
4.3.1. Mineralogy
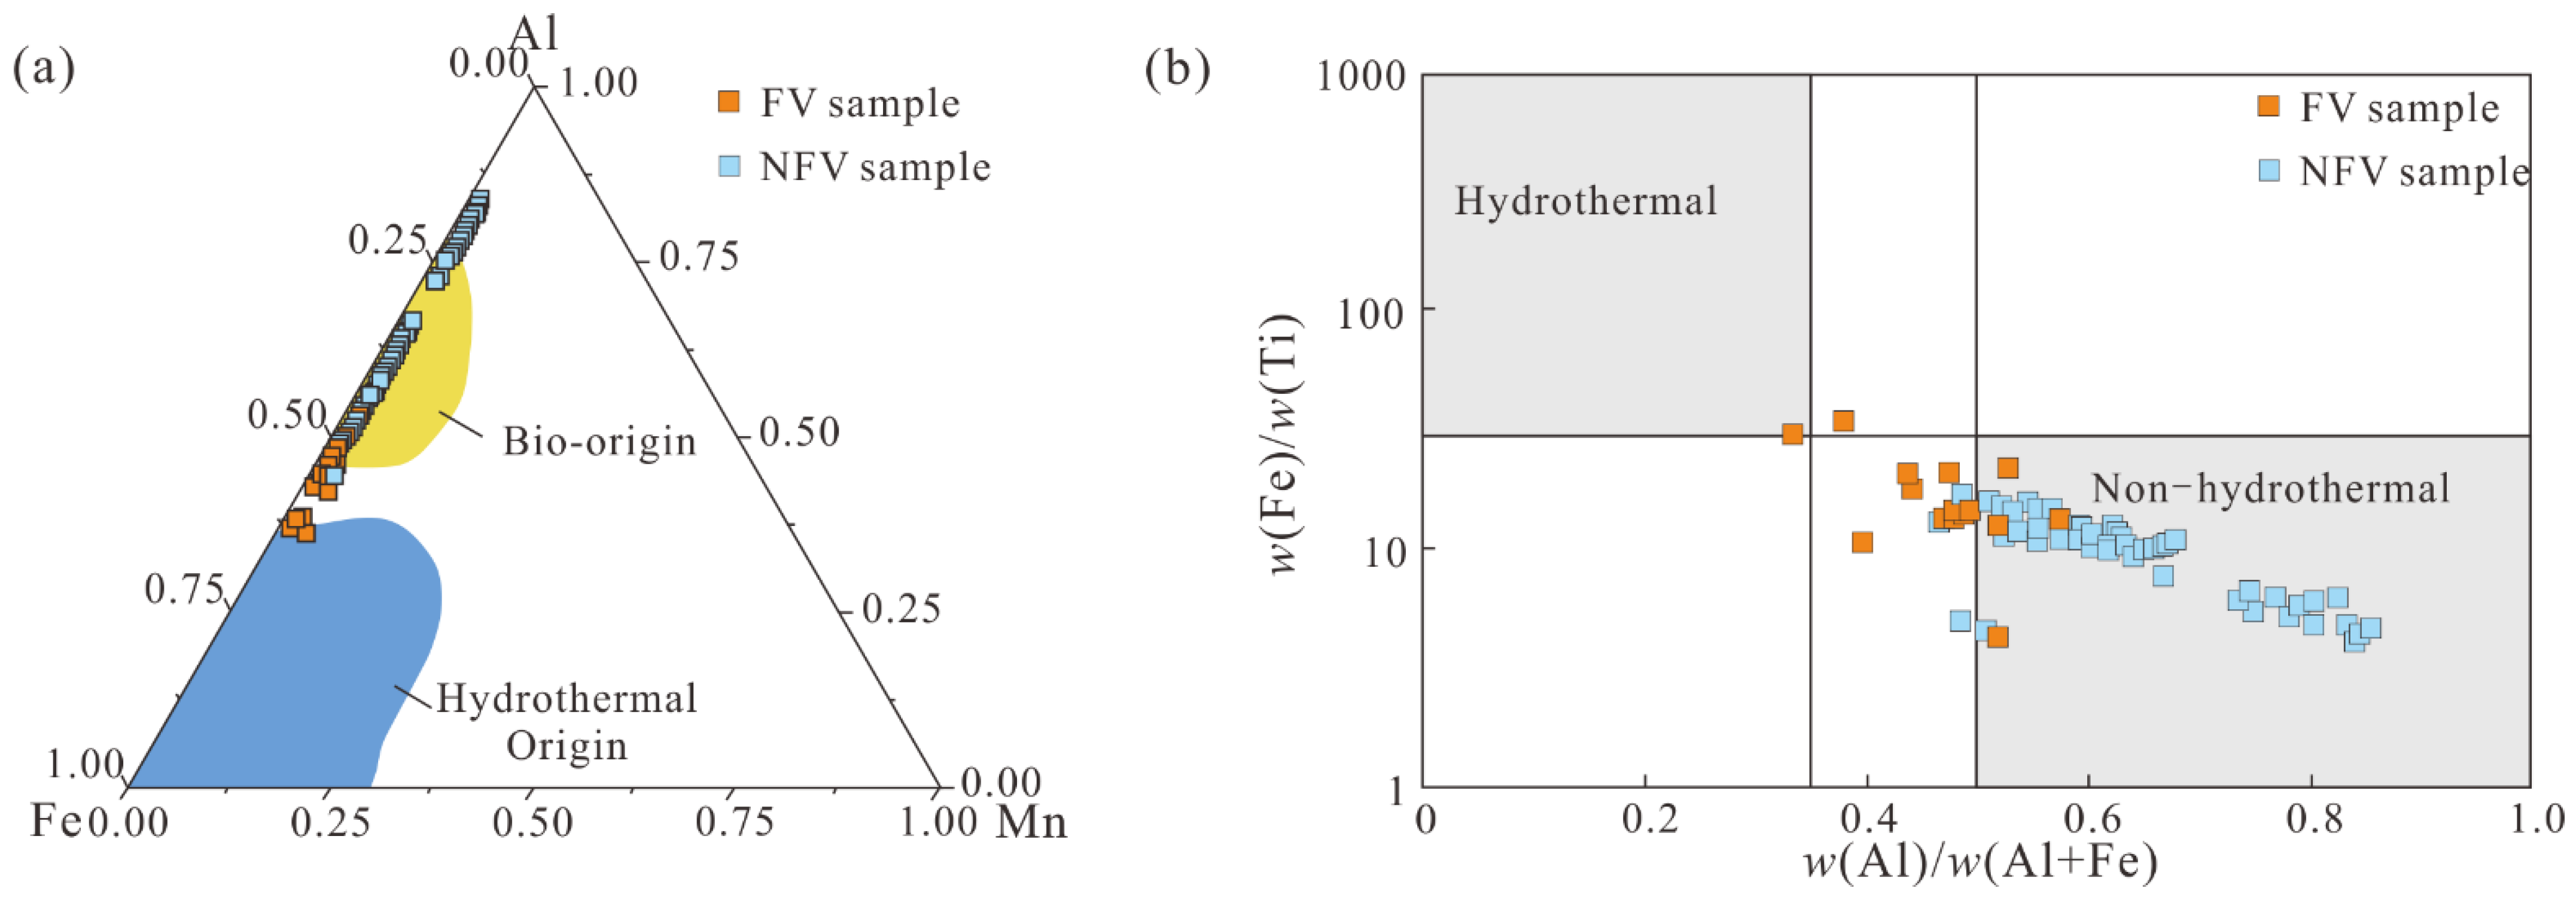
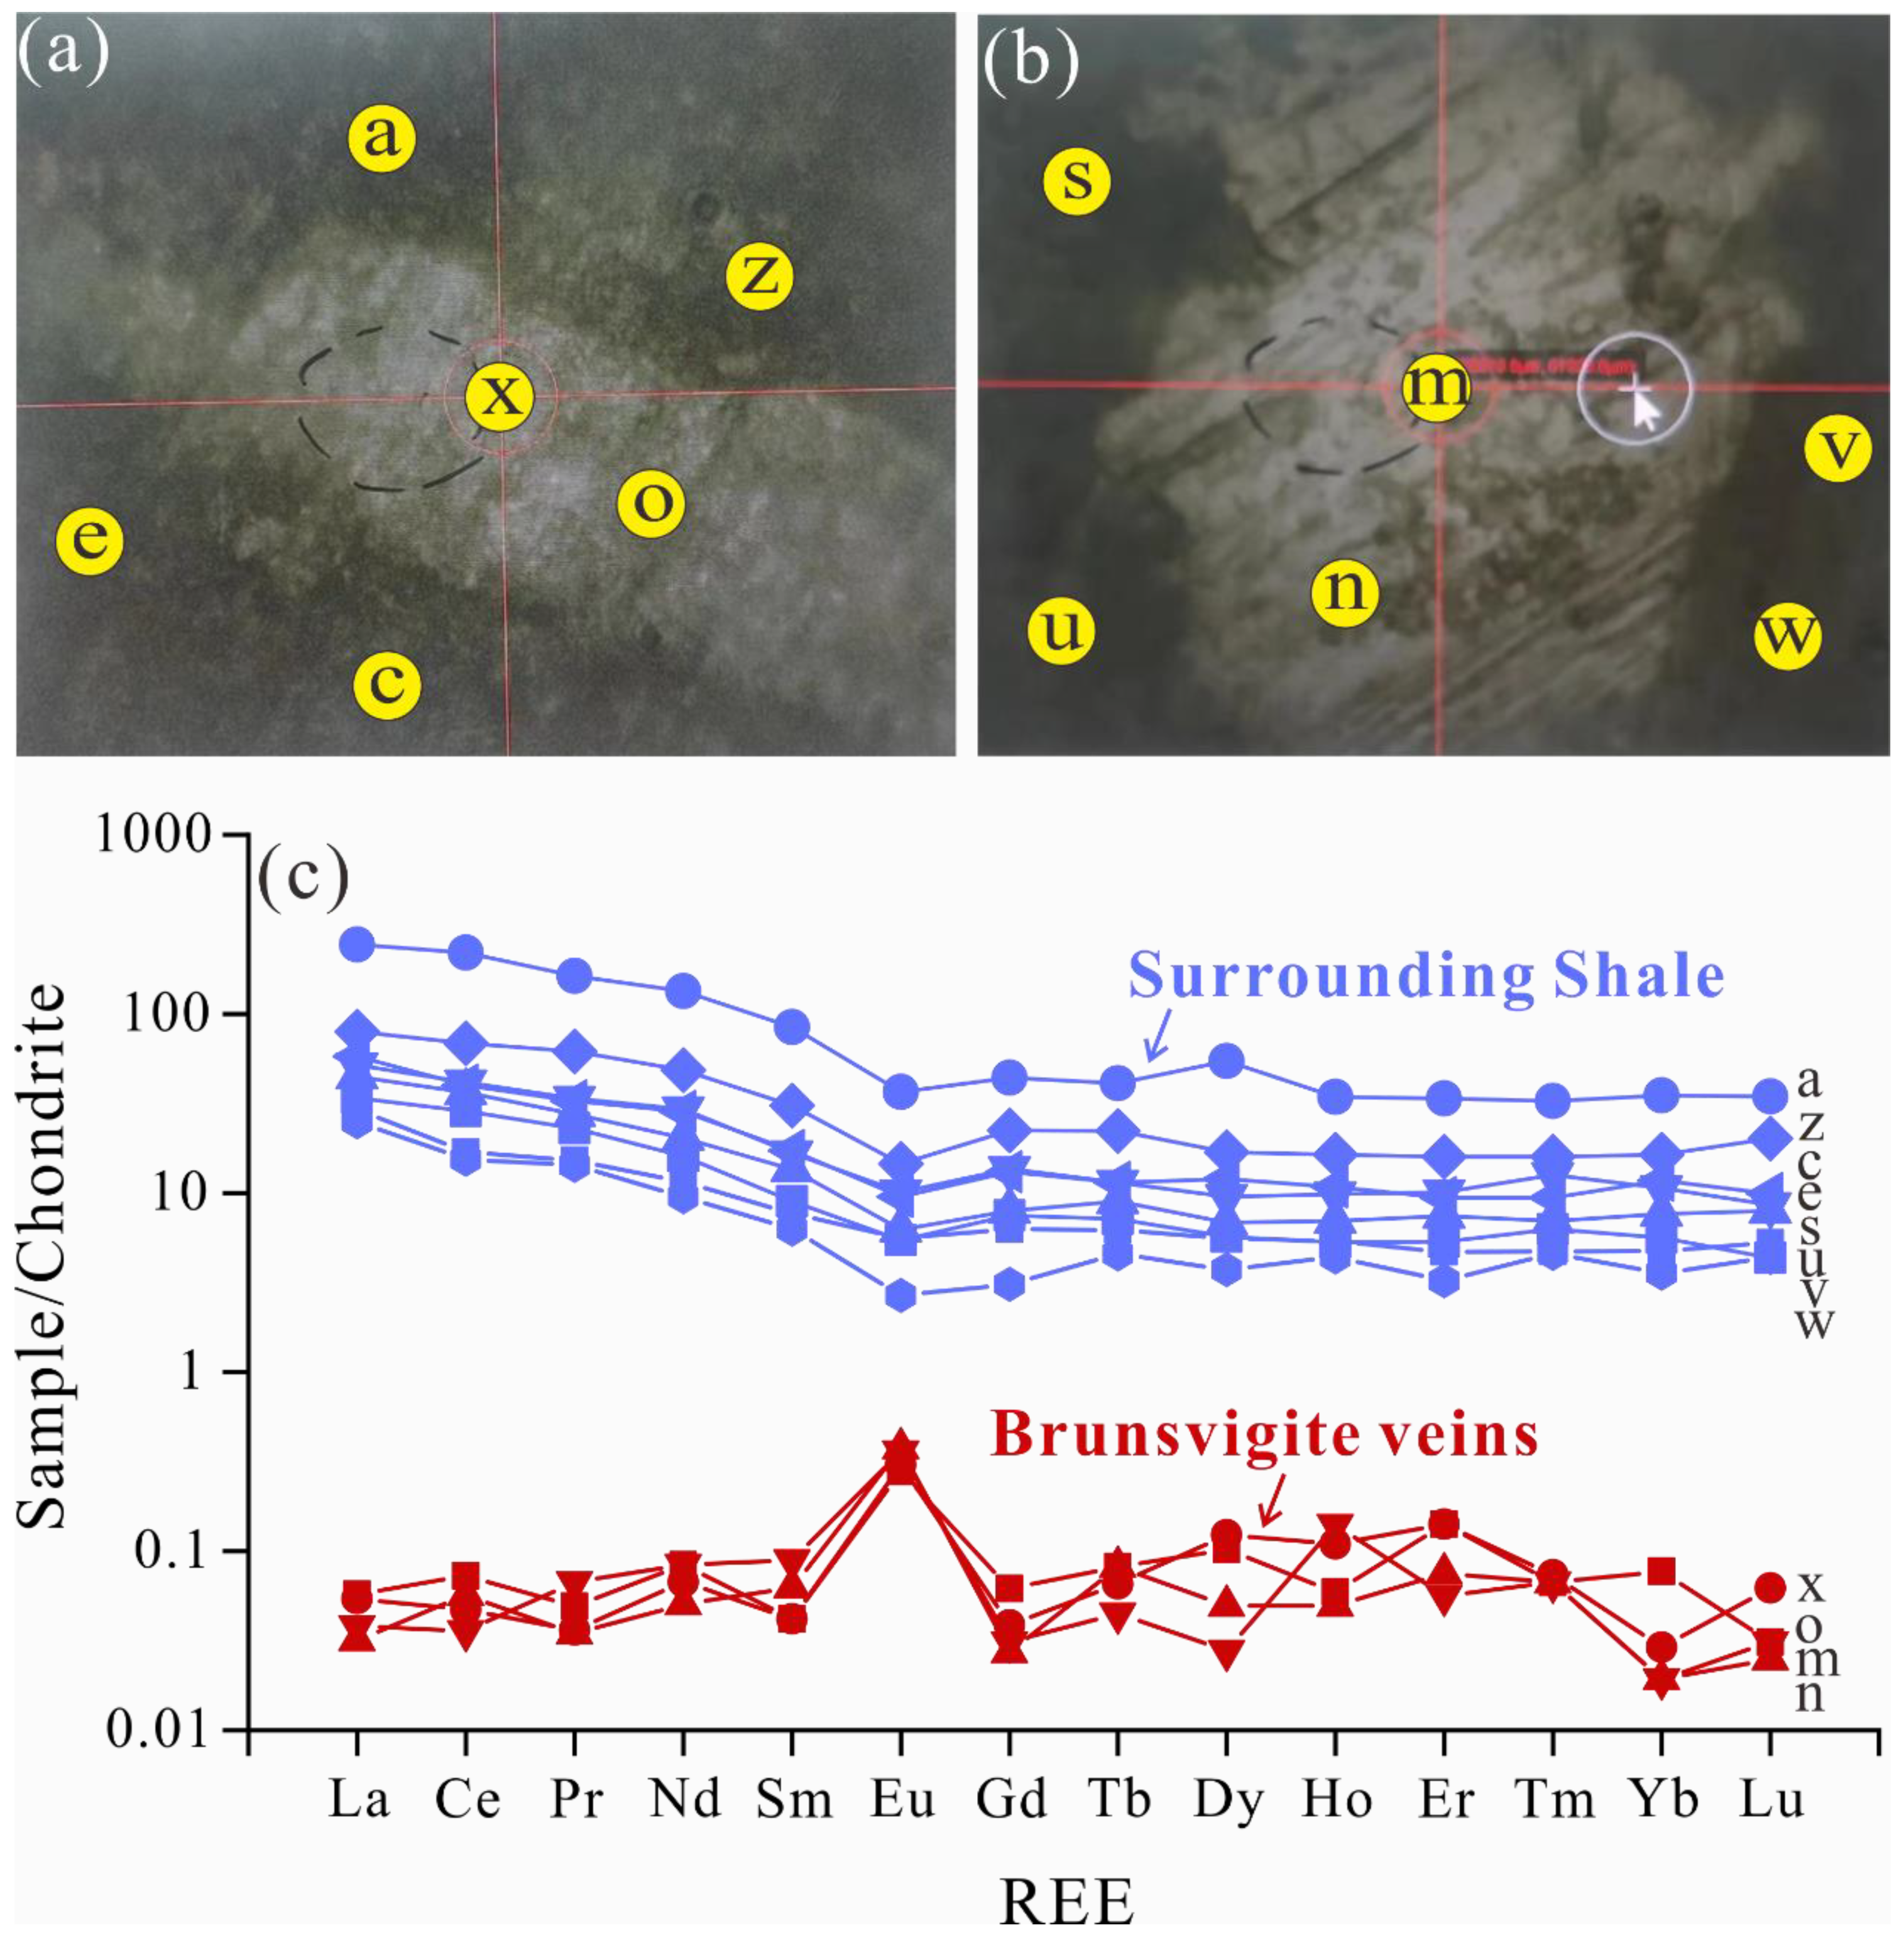
4.3.2. Geochemistry

4.3.3. Fluid Inclusion
4.4. Electric Resistivity of Low-Resistivity Shale Rocks
5. Discussion
5.1. Origin of Hydrothermal Mineral Assemblages
5.1.1. Chloritization Stage
5.1.2. Sulfatization Stage
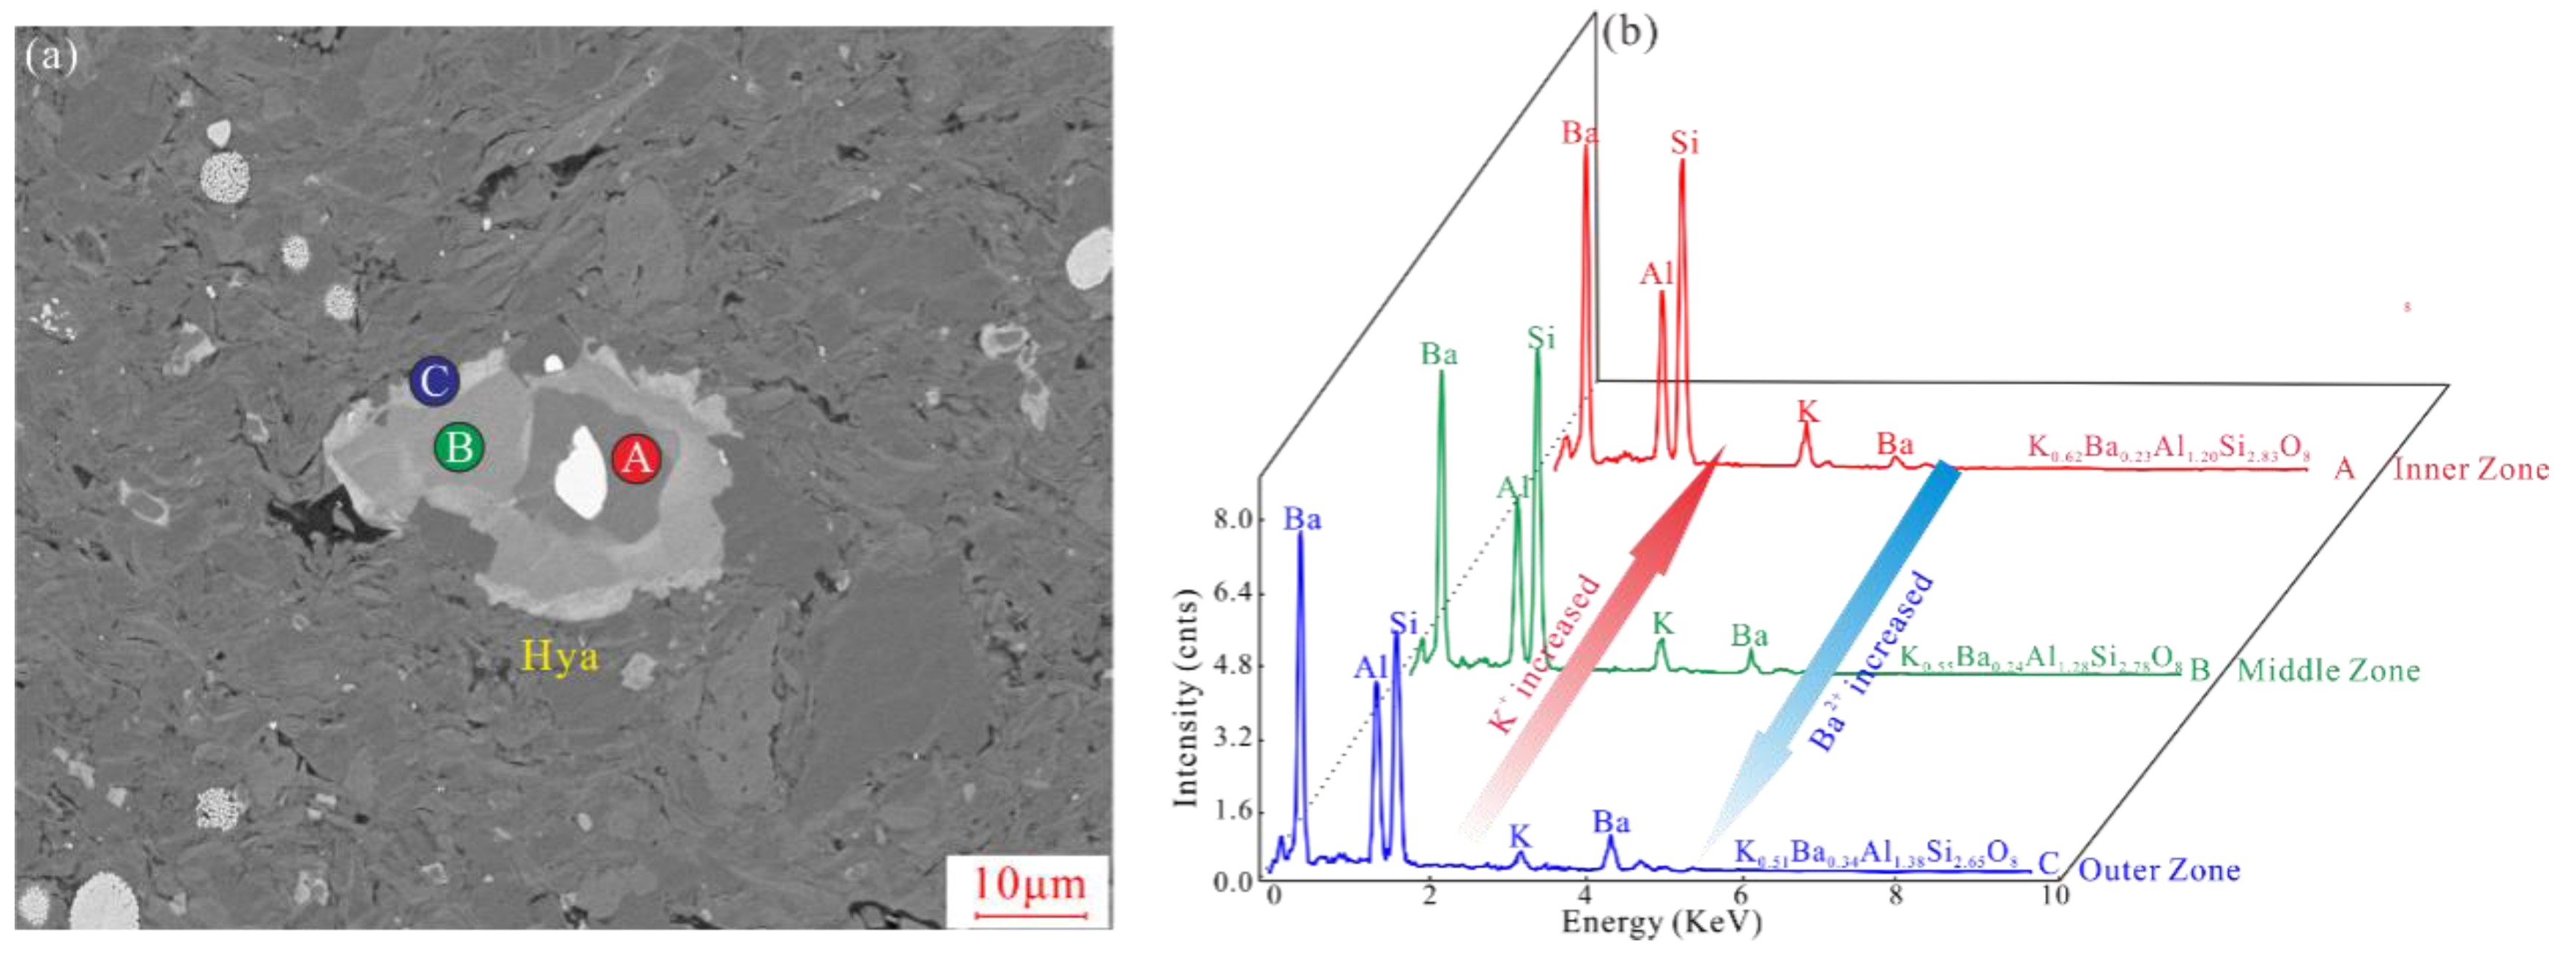
5.1.3. Feldspathisation Stage
5.1.4. Calcitization Stage
5.2. Graphitization of Organic Matter
5.3. Hydrothermal Circulation
5.4. Impact of Hydrothermal Activities and Fault Systems on Electric Resistivity of Shales
6. Conclusions
Author Contributions
Funding
Data Availability Statement
Conflicts of Interest
References
- Ashqar, A.; Uchida, M.; Salahuddin, A.A.; Olayiwola, S.O.; Awolayo, A.N. Evaluating a Complex Low-Resistivity Pay Carbonate Reservoir Onshore Abu Dhabi: From Model to Implementation. In Proceedings of the International Petroleum Exhibition & Conference, Abu Dhabi, United Arab Emirates, 14 November 2016; University of Calgary: Abu Dhabi, United Arab Emirates, 2016. [Google Scholar]
- Loukola-Ruskeeniemi, K.; Hyvönen, E.; Airo, M.; Lerssi, J.; Arkimaa, H. Country-wide exploration for graphite- and sulphide-rich black shales with airborne geophysics and petrophysical and geochemical studies. J. Geochem. Explor. 2023, 244, 107123. [Google Scholar] [CrossRef]
- Xue, Z.; Jiang, Z.; Wang, X.; Gao, Z.; Chang, J.; Nie, Z.; Li, H.; Wu, W.; Qiu, H.; Wang, Q.; et al. Genetic mechanism of low resistivity in high-mature marine shale: Insights from the study on pore structure and organic matter graphitization. Mar. Petrol. Geol. 2022, 144, 105825. [Google Scholar] [CrossRef]
- Spacapan, J.B.; D Odorico, A.; Palma, O.; Galland, O.; Senger, K.; Ruiz, R.; Manceda, R.; Leanza, H.A. Low resistivity zones at contacts of igneous intrusions emplaced in organic-rich formations and their implications on fluid flow and petroleum systems: A case study in the northern Neuquén Basin, Argentina. Basin Res. 2019, 32, 3–24. [Google Scholar] [CrossRef]
- Wang, Y.; Wei, G.; Shen, J.; Qiu, Z.; Li, X.; Zhang, Q.; Zhang, L.; Wang, C.; Liu, W. Analysis on distribution and main controlling factors of OM carbonization in marine shale in the Sichuan Basin of China and its periphery. J. Nat. Gas Geosci. 2022, 7, 181–197. [Google Scholar] [CrossRef]
- Cao, T.; Deng, M.; Cao, Q.; Huang, Y.; Yu, Y.; Cao, X. Pore formation and evolution of organic-rich shale during the entire hydrocarbon generation process: Examination of artificially and naturally matured samples. J. Nat. Gas Sci. Eng. 2021, 93, 104020. [Google Scholar] [CrossRef]
- Ma, X.; Wang, H.; Zhou, T.; Zhao, Q.; Shi, Z.; Sun, S.; Cheng, F. Geological Controlling Factors of Low Resistivity Shale and Their Implications on Reservoir Quality: A Case Study in the Southern Sichuan Basin, China. Energies 2022, 15, 5801. [Google Scholar] [CrossRef]
- Tang, X.; Jiang, S.; Jiang, Z.; Li, Z.; He, Z.; Long, S.; Zhu, D. Heterogeneity of Paleozoic Wufeng-Longmaxi formation shale and its effects on the shale gas accumulation in the Upper Yangtze Region, China. Fuel 2019, 239, 387–402. [Google Scholar] [CrossRef]
- Yan, W.; Sun, J.; Zhang, J.; Yuan, W.; Zhang, L.; Cui, L.; Dong, H. Studies of electrical properties of low-resistivity sandstones based on digital rock technology. J. Geophys. Eng. 2018, 15, 153–163. [Google Scholar] [CrossRef]
- Jianmeng, S.; Zhu, X.; Hong, L.; Hongpan, Z.; Jinjiang, Z.; Aarnes, I.; Aarnes, I. Mechanism analysis and logging evaluation of low resistivity in lower Paleozoic shale gas reservoirs of Yangtze region. J. China Univ. Pet. 2018, 42, 47–56. [Google Scholar]
- Xu, S.; Yassin, M.R.; Dehghanpour, H.; Kolbeck, C. The effects of kerogen maturity on pore structure and wettability of organic-rich calcareous shales. J. Mol. Liq. 2022, 362, 119577. [Google Scholar] [CrossRef]
- Senger, K.; Birchall, T.; Betlem, P.; Ogata, K.; Ohm, S.; Olaussen, S.; Paulsen, R.S. Resistivity of reservoir sandstones and organic rich shales on the Barents Shelf: Implications for interpreting CSEM data. Geosci. Front. 2021, 12, 101063. [Google Scholar] [CrossRef]
- Li, Y.; Li, M.; Zhang, J.; Pang, Q.; Zou, C.; Shu, H.; Wang, G. Influence of the Emeishan basalt eruption on shale gas enrichment: A case study of shale from Wufeng-Longmaxi formations in northern Yunnan and Guizhou provinces. Fuel 2020, 282, 118835. [Google Scholar] [CrossRef]
- Passos, A.S.D.; Dessuy, M.B.; Nakadi, F.V.; de Andrade, J.B.; Vale, M.G.R. Investigation of different chemical modifiers based on the Pd/Mg mixture for the determination of sulfur in shale oil by high-resolution continuum source graphite furnace molecular absorption spectrometry. Talanta 2019, 204, 206–212. [Google Scholar] [CrossRef]
- Hou, Y.; Zhang, K.; Wang, F.; He, S.; Dong, T.; Wang, C.; Qin, W.; Xiao, Y.; Tang, B.; Yu, R.; et al. Structural evolution of organic matter and implications for graphitization in over-mature marine shales, south China. Mar. Petrol. Geol. 2019, 109, 304–316. [Google Scholar] [CrossRef]
- Liu, X.; Zhuo, Y.; Feng, M.; Zhang, B.; Xia, M.; Wang, X. Constrains of eruption environment and hydrothermal fluid on the Permian pyroclastic reservoirs in the Sichuan Basin, SW China. Petroleum 2022, 8, 17–30. [Google Scholar] [CrossRef]
- Jerram, D.A.; Widdowson, M.; Wignall, P.B.; Sun, Y.; Lai, X.; Bond, D.P.G.; Torsvik, T.H. Submarine palaeoenvironments during Emeishan flood basalt volcanism, SW China: Implications for plume–lithosphere interaction during the Capitanian, Middle Permian (‘end Guadalupian’) extinction event. Palaeogeogr. Palaeoclimatol. Palaeoecol. 2016, 441, 65–73. [Google Scholar] [CrossRef]
- Yuguang, H.; Kunpeng, Z.; Sheng, H.; Weifeng, T.; Yan, X.; Cheng, W.; Rui, Y. Origin and geological siginificance of ultrs-low resistivity in Lower Paleozoic marine shale, Southern China. Geol. Scinece Technol. 2021, 40, 80–89. [Google Scholar]
- Yunfeng, Y.; Fang, B.; Geer, T.; Anyang, P.; Baojian, S. Characteristics of organic matter-hosted pores in Lower Silurian Longmaxi shale with different maturities, Sichuan Basin. Pet. Geol. Exp. 2020, 42, 387–397. [Google Scholar]
- Gao, Z.; Fan, Y.; Xuan, Q.; Zheng, G. A review of shale pore structure evolution characteristics with increasing thermal maturities. Adv. Geo-Energy Res. 2020, 4, 247–259. [Google Scholar] [CrossRef]
- Wang, R.; Hu, Z.; Long, S.; Liu, G.; Zhao, J.; Dong, L.; Du, W.; Wang, P.; Yin, S. Differential Characteristics of the Upper Ordovician-Lower Silurian Wufeng-Longmaxi Shale Reservoir and its Implications for Exploration and Development of Shale Gas in/around the Sichuan Basin. Acta. Geol. Sin. 2019, 93, 520–535. [Google Scholar] [CrossRef]
- Yunfeng, Y. Application of bitumen and graptolite reflectance in the Silurian Longmaxi shale, southeastern Sichuan Basin. Pet. Geol. Exp. 2016, 38, 466–472. [Google Scholar]
- Wang, R.; Gu, Y.; Ding, W.; Gong, D.; Yin, S.; Wang, X.; Zhou, X.; Li, A.; Xiao, Z.; Cui, Z. Characteristics and dominant controlling factors of organic-rich marine shales with high thermal maturity: A case study of the Lower Cambrian Niutitang Formation in the Cen’gong block, southern China. J. Nat. Gas Sci. Eng. 2016, 33, 81–96. [Google Scholar] [CrossRef]
- Zhang, B.; Wen, H.; Qing, H.; Yang, K.; Luo, Y.; Yang, H.; Wang, P.; He, L.; Xiao, W. The influence of depositional and diagenetic processes on rock electrical properties: A case study of the Longmaxi shale in the Sichuan Basin. J. Petrol. Sci. Eng. 2022, 211, 110119. [Google Scholar] [CrossRef]
- Wu, F.; Dai, J.; Wen, Z.; Yao, C.; Shi, X.; Liang, L.; Yun, L.; Shi, B. Resistivity anisotropy analysis of Longmaxi shale by resistivity measurements, scanning electron microscope, and resistivity simulation. J. Appl. Geophys. 2022, 203, 104700. [Google Scholar] [CrossRef]
- Wang, Y.; Li, X.; Chen, B.; Wu, W.; Dong, D.; Zhang, J.; Han, J.; Ma, J.; Dai, B.; Wang, H.; et al. Lower limit of thermal maturity for the carbonization of organic matter in marine shale and its exploration risk. Petrol. Explor. Dev. 2018, 45, 402–411. [Google Scholar] [CrossRef]
- Qiu, Z.; Liu, B.; Lu, B.; Shi, Z.; Li, Z. Mineralogical and petrographic characteristics of the Ordovician-Silurian Wufeng-Longmaxi Shale in the Sichuan Basin and implications for depositional conditions and diagenesis of black shales. Mar. Petrol. Geol. 2022, 135, 105428. [Google Scholar] [CrossRef]
- Shi, Z.; Qiu, Z. Main Bedding Types of Marine Fine-Grained Sediments and their Significance for Oil and Gas Exploration and Development. Acta. Sedimentol. Sin. 2021, 39, 181–196. [Google Scholar]
- Shi, Z.; Zhou, T.; Guo, W.; Liang, P.; Cheng, F. Quantitative Paleogeographic Mapping and Sedimentary Microfacies Division in a Deep-water Marine Shale Shelf: Case study of Wufeng-Longmaxi shale, southern Sichuan Basin, China. Acta. Sedimentol. Sin. 2022, 40, 17. [Google Scholar]
- Hongyan, W.; Zhensheng, S.; Shasha, S.; Leifu, Z.; Aarnes, I. Characterization and genesis of deep shale reservoirs in the first Member of the Silurian Longmaxi Formation in southern Sichuan Basin and its periphery. Oil Gas Geol. 2021, 42, 66–75. [Google Scholar]
- Shi, Z.; Zhou, T.; Wang, H.; Sun, S. Depositional Structures and Their Reservoir Characteristics in the Wufeng–Longmaxi Shale in Southern Sichuan Basin, China. Energies 2022, 15, 1618. [Google Scholar] [CrossRef]
- Wang, Y.; Jia, H.; Kou, Y.; Hao, Z. Causes of low resistivity of Longmaxi Formation shale reservoirs in Changning area. Pet. Geol. Recovery Effic. 2021, 19, 53–61. [Google Scholar]
- He, X.; Wu, J.; Yong, R.; Zhao, S. Hydrocarbon accumulation and key exploration & development technologies of Changning-Weiyuan marine shale gas field, southern Sichuan. Pet. Res. 2021, 6, 1–15. [Google Scholar]
- Wang, X.; Zhang, B.; He, Z.; He, L.; Yang, K.; Huang, T.; Luo, F.; Tang, J.; Gan, L. Electrical properties of Longmaxi organic-rich shale and its potential applications to shale gas exploration and exploitation. J. Nat. Gas Sci. Eng. 2016, 36, 573–585. [Google Scholar] [CrossRef]
- Zan, B.; Mou, C.; Lash, G.G.; Yan, J.; Hou, Q. Diagenetic barite-calcite-pyrite nodules in the Silurian Longmaxi Formation of the Yangtze Block, South China: A plausible record of sulfate-methane transition zone movements in ancient marine sediments. Chem. Geol. 2022, 595, 120789. [Google Scholar] [CrossRef]
- Craddock, P.R.; Bach, W. Insights to magmatic–hydrothermal processes in the Manus back-arc basin as recorded by anhydrite. Geochim. Cosmochim. Ac. 2010, 74, 5514–5536. [Google Scholar] [CrossRef]
- Žigaitė, Ž.; Qvarnström, M.; Bancroft, A.; Pérez-Huerta, A.; Blom, H.; Ahlberg, P.E. Trace and rare earth element compositions of Silurian conodonts from the Vesiku Bone Bed: Histological and palaeoenvironmental implications. Palaeogeogr. Palaeoclimatol. Palaeoecol. 2020, 549, 109449. [Google Scholar] [CrossRef]
- Sun, S.S.; McDonough, W.F. Chemical and isotopic systematics of oceanic basalts: Implications for mantle composition and processes. Geol. Soc. Lond. Spec. Publ. 1989, 42, 313–345. [Google Scholar] [CrossRef]
- Wille, G.; Schmidt, U.; Hollricher, O. RISE: Correlative Confocal Raman and Scanning Electron Microscopy. In Confocal Raman Microscopy; Springer International Publishing: Cham, Switzerland, 2018; pp. 559–580. [Google Scholar]
- Tian, H.; Li, T.; Zhang, T.; Xiao, X. Characterization of methane adsorption on overmature Lower Silurian–Upper Ordovician shales in Sichuan Basin, southwest China: Experimental results and geological implications. Int. J. Coal Geol. 2016, 156, 36–49. [Google Scholar] [CrossRef]
- Schoenherr, J.; Littke, R.; Urai, J.L.; Kukla, P.A.; Rawahi, Z. Polyphase thermal evolution in the Infra-Cambrian Ara Group (South Oman Salt Basin) as deduced by maturity of solid reservoir bitumen. Org. Geochem. 2007, 38, 1293–1318. [Google Scholar] [CrossRef]
- Ducut, J.D.; Alipio, M.; Go, P.J.; Concepcion, R., II; Vicerra, R.R.; Bandala, A.; Dadios, E. A Review of Electrical Resistivity Tomography Applications in Underground Imaging and Object Detection. Displays 2022, 73, 102208. [Google Scholar] [CrossRef]
- Zhang, S.; Yan, J.; Cai, J.; Zhu, X.; Hu, Q.; Wang, M.; Geng, B.; Zhong, G. Fracture characteristics and logging identification of lacustrine shale in the Jiyang Depression, Bohai Bay Basin, Eastern China. Mar. Petrol. Geol. 2021, 132, 105192. [Google Scholar] [CrossRef]
- Wang, S.; Wang, G.; Huang, L.; Song, L.; Zhang, Y.; Li, D.; Huang, Y. Logging evaluation of lamina structure and reservoir quality in shale oil reservoir of Fengcheng Formation in Mahu Sag, China. Mar. Petrol. Geol. 2021, 133, 105299. [Google Scholar] [CrossRef]
- Khoshbakht, F.; Azizzadeh, M.; Memarian, H.; Nourozi, G.H.; Moallemi, S.A. Comparison of electrical image log with core in a fractured carbonate reservoir. J. Petrol. Sci. Eng. 2012, 86,87, 289–296. [Google Scholar] [CrossRef]
- Okubo, J.; Klyukin, Y.I.; Warren, L.V.; Sublett, D.M.; Bodnar, R.J.; Gill, B.C.; Xiao, S. Hydrothermal influence on barite precipitates in the basal Ediacaran Sete Lagoas cap dolostone, São Francisco Craton, central Brazil. Precambrian Res. 2020, 340, 105628. [Google Scholar] [CrossRef]
- Kuhn, T.; Herzig, P.M.; Hannington, M.D.; Garbe-Schönberg, D.; Stoffers, P. Origin of fluids and anhydrite precipitation in the sediment-hosted Grimsey hydrothermal field north of Iceland. Chem. Geol. 2003, 202, 5–21. [Google Scholar] [CrossRef]
- Zane, A.; Weiss, Z. A procedure for classifying rock-forming chlorites based on microprobe data. Rend. Lincei. 1998, 9, 51–56. [Google Scholar] [CrossRef]
- Kranidiotis, P.; Maclean, W.H. Systematics of chlorite alteration at the Phelps Dodge massive sulfide deposit, Matagami, Quebec. Econ. Geol. 1987, 82, 1898–1911. [Google Scholar] [CrossRef]
- Inoue, A.; Inoué, S.; Utada, M. Application of chlorite thermometry to estimation of formation temperature and redox conditions. Clay Miner. 2018, 53, 143–158. [Google Scholar] [CrossRef]
- Taylor, S.R.; McLennan, S.M. The Continental Crust: Its Composition and Evolution; U.S. Department of Energy, Office of Scientific and Technical Information: Washington, DC, USA, 1985.
- Adachi, M.; Yamamoto, K.; Sugisaki, R. Hydrothermal chert and associated siliceous rocks from the northern Pacific their geological significance as indication od ocean ridge activity. Sediment Geol. 1986, 47, 125–148. [Google Scholar] [CrossRef]
- Yamamoto, K. Geochemical characteristics and depositional environments of cherts and associated rocks in the Franciscan and Shimanto Terranes. Sediment Geol. 1987, 52, 65–108. [Google Scholar] [CrossRef]
- Arbiol, C.; Layne, G.D.; Zanoni, G.; Šegvić, B. Characteristics and genesis of phyllosilicate hydrothermal assemblages from Neoproterozoic epithermal Au-Ag mineralization of the Avalon Zone of Newfoundland, Canada. Appl. Clay Sci. 2021, 202, 105960. [Google Scholar] [CrossRef]
- Worden, R.H.; Griffiths, J.; Wooldridge, L.J.; Utley, J.E.P.; Lawan, A.Y.; Muhammed, D.D.; Simon, N.; Armitage, P.J. Chlorite in sandstones. Earth-Sci. Rev. 2020, 204, 103105. [Google Scholar] [CrossRef]
- Wu, A.; Cao, J.; Zhang, J. Bedding-parallel calcite veins indicate hydrocarbon–water–rock interactions in the over-mature Longmaxi shales, Sichuan Basin. Mar. Petrol. Geol. 2021, 133, 105303. [Google Scholar] [CrossRef]
- Sun, B. Characteristics of Structural Deformation and Fluid Activity in Changning Area and Its’ Perphery, Southern Sichuan. Master’s Thesis, Chengdu University of Technology, Chengdu, China, 2018. [Google Scholar]
- Delle Piane, C.; Ansari, H.; Li, Z.; Mata, J.; Rickard, W.; Pini, R.; Dewhurst, D.N.; Sherwood, N. Influence of organic matter type on porosity development in the Wufeng-Longmaxi Shale: A combined microscopy, neutron scattering and physisorption approach. Int. J. Coal Geol. 2022, 249, 103880. [Google Scholar] [CrossRef]
- Chu, G.; Zhang, S.; Zhang, X.; Xiao, B.; Han, J.; Zhang, Y.; Cheng, J.; Feng, Y. Chlorite chemistry of Tongshankou porphyry-related Cu–Mo–W skarn deposit, Eastern China: Implications for hydrothermal fluid evolution and exploration vectoring to concealed orebodies. Ore Geol. Rev. 2020, 122, 103531. [Google Scholar] [CrossRef]
- Wei, W.; Chen, X.; Yu, Z.; Chen, W.; Fang, Q.; Tang, X.; Ling, H. Different hydrothermal fluids inducing alteration and uranium mineralisation in the Baquan deposit of the Xiangshan uranium ore field: Constraints from geochemistry of altered rocks and ores. Ore Geol. Rev. 2021, 139, 104475. [Google Scholar] [CrossRef]
- Han, G.; Wang, L.; Xiao, D.; Lou, D.; Xu, M.; Zhao, Y.; Pei, Y.; Guo, X.; Teng, J.; Han, Y. Magmatic hydrothermal fluid genesis of zeolite in the Paleogene Kongdian Formation of Zaoyuan oilfield, Bohai Bay Basin, China. Petrol. Explor. Dev. 2021, 48, 1101–1112. [Google Scholar] [CrossRef]
- Dora, M.L.; Roy, S.K.; Khan, M.; Randive, K.; Kanungo, D.R.; Barik, R.; Kaushik, C.S.; Bari, S.H.; Pattanayak, R.S.; Krishna, K.V.S.; et al. Rift-induced structurally controlled hydrothermal barite veins in 1.6 Ga granite, Western Bastar Craton, Central India: Constraints from fluid inclusions, REE geochemistry, sulfur and strontium isotopes studies. Ore Geol. Rev. 2022, 148, 105050. [Google Scholar] [CrossRef]
- Dekov, V.M.; Kyono, K.; Yasukawa, K.; Guéguen, B.; Ivarsson, M.; Kamenov, G.D.; Yamanaka, T.; Asael, D.; Ishida, M.; Cavalcante, L.L.; et al. Mineralogy, geochemistry and microbiology insights into precipitation of stibnite and orpiment at the Daiyon-Yonaguni Knoll (Okinawa Trough) hydrothermal barite deposits. Chem. Geol. 2022, 610, 121092. [Google Scholar] [CrossRef]
- Schoepfer, S.D.; Shen, J.; Wei, H.; Tyson, R.V.; Ingall, E.; Algeo, T.J. Total organic carbon, organic phosphorus, and biogenic barium fluxes as proxies for paleomarine productivity. Earth-Sci. Rev. 2015, 149, 23–52. [Google Scholar] [CrossRef]
- Wu, Y.; Tian, H.; Dong, D.; Li, T.; Zhou, Q. Paleo-environmental variation and its control on organic matter enrichment of black shales from shallow shelf to slope regions on the Upper Yangtze Platform during Cambrian Stage 3. Palaeogeogr. Palaeoclimatol. Palaeoecol. 2020, 545, 109653. [Google Scholar] [CrossRef]
- Dulski, P. Interferences of oxide, hydroxide and chloride analyte species in the determination of rare earth elements in geological samples by inductively coupled plasma-mass spectrometry. Fresenius J. Anal. Chem. 1994, 350, 194–203. [Google Scholar] [CrossRef]
- Barrett, T.J.; Jarvis, I.; Jarvis, K.E. Rare earth element geochemistry of massive sulfides-sulfates and gossans on the Southern Explorer Ridge. Geology 1990, 18, 583–586. [Google Scholar] [CrossRef]
- Zhou, Z.; Wen, H.; Qin, C.; de Fourestier, J.; Liu, L.; Shi, Q. The genesis of the Dahebian Zn-Pb deposit and associated barite mineralization: Implications for hydrothermal fluid venting events along the Nanhua Basin, South China. Ore Geol. Rev. 2018, 101, 785–802. [Google Scholar] [CrossRef]
- Melekestseva, I.Y.; Tret’Yakov, G.A.; Nimis, P.; Yuminov, A.M.; Maslennikov, V.V.; Maslennikova, S.P.; Kotlyarov, V.A.; Beltenev, V.E.; Danyushevsky, L.V.; Large, R. Barite-rich massive sulfides from the Semenov-1 hydrothermal field (Mid-Atlantic Ridge, 13°30.87′ N): Evidence for phase separation and magmatic input. Mar. Geol. 2014, 349, 37–54. [Google Scholar] [CrossRef]
- Jamieson, J.W.; Hannington, M.D.; Tivey, M.K.; Hansteen, T.; Williamson, N.M.B.; Stewart, M.; Fietzke, J.; Butterfield, D.; Frische, M.; Allen, L.; et al. Precipitation and growth of barite within hydrothermal vent deposits from the Endeavour Segment, Juan de Fuca Ridge. Geochim. Cosmochim. Ac. 2016, 173, 64–85. [Google Scholar] [CrossRef]
- Li, C.; Shen, P.; Li, P.; Sun, J.; Feng, H.; Pan, H. Changes in the factors controlling the chlorite composition and their influence on hydrothermal deposit studies: A case study from Hongguleleng Manto-type Cu deposit. J. Geochem. Explor. 2022, 243, 107096. [Google Scholar] [CrossRef]
- Qaim Raza, M.; Absar, N.; Pandalai, H.S.; Patel, S.C. Chlorite thermometry and fluid inclusion studies on vein-type Tintini copper deposit, Eastern Dharwar Craton, India: Ore genetic implications. Ore Geol. Rev. 2021, 131, 104058. [Google Scholar] [CrossRef]
- Rasmussen, B.; Fletcher, I.R. Indirect dating of mafic intrusions by SHRIMP U-Pb analysis of monazite in contact metamorphosed shale: An example from the Palaeoproterozoic Capricorn Orogen, Western Australia. Earth Planet. Sci. Lett. 2002, 197, 287–299. [Google Scholar] [CrossRef]
- Meng, F.; Tian, Y.; Kerr, A.C.; Wang, W.; Wu, Z.; Xu, Q.; Du, Q.; Zhou, Y.; Liu, J. Geochemistry and petrogenesis of Late Permian basalts from the Sichuan Basin, SW China: Implications for the geodynamics of the Emeishan mantle plume. J. Asian Earth Sci. 2023, 241, 105477. [Google Scholar] [CrossRef]


Disclaimer/Publisher’s Note: The statements, opinions and data contained in all publications are solely those of the individual author(s) and contributor(s) and not of MDPI and/or the editor(s). MDPI and/or the editor(s) disclaim responsibility for any injury to people or property resulting from any ideas, methods, instructions or products referred to in the content. |
© 2023 by the authors. Licensee MDPI, Basel, Switzerland. This article is an open access article distributed under the terms and conditions of the Creative Commons Attribution (CC BY) license (https://creativecommons.org/licenses/by/4.0/).
Share and Cite
Zhou, T.; Cai, J.; Mou, S.; Zhao, Q.; Shi, Z.; Sun, S.; Guo, W.; Gao, J.; Cheng, F.; Wang, H.; et al. Influence of Low-Temperature Hydrothermal Events and Basement Fault System on Low-Resistivity Shale Reservoirs: A Case Study from the Upper Ordovician to Lower Silurian in the Sichuan Basin, SW China. Minerals 2023, 13, 720. https://doi.org/10.3390/min13060720
Zhou T, Cai J, Mou S, Zhao Q, Shi Z, Sun S, Guo W, Gao J, Cheng F, Wang H, et al. Influence of Low-Temperature Hydrothermal Events and Basement Fault System on Low-Resistivity Shale Reservoirs: A Case Study from the Upper Ordovician to Lower Silurian in the Sichuan Basin, SW China. Minerals. 2023; 13(6):720. https://doi.org/10.3390/min13060720
Chicago/Turabian StyleZhou, Tianqi, Jingshun Cai, Shaomin Mou, Qun Zhao, Zhensheng Shi, Shasha Sun, Wei Guo, Jinliang Gao, Feng Cheng, Hongyan Wang, and et al. 2023. "Influence of Low-Temperature Hydrothermal Events and Basement Fault System on Low-Resistivity Shale Reservoirs: A Case Study from the Upper Ordovician to Lower Silurian in the Sichuan Basin, SW China" Minerals 13, no. 6: 720. https://doi.org/10.3390/min13060720