
Application of Logistic Regression and Weights of Evidence Methods for Mapping Volcanic-Type Uranium Prospectivity

1
School of Earth Resources, China University of Geosciences, Wuhan 430074, China
2
Key Laboratory of Strategic Mineral Resources of the Upper Yellow River, Ministry of Natural Resources, Lanzhou 730046, China
3
School of Resources and Environmental Science and Engineering, Hubei University of Science and Technology, Xianning 437100, China
4
294th Geological Party of Fujian Nuclear Industry, Nanping 353000, China
*
Author to whom correspondence should be addressed.
Minerals 2023, 13(5), 608; https://doi.org/10.3390/min13050608
Submission received: 26 February 2023
/
Revised: 26 April 2023
/
Accepted: 26 April 2023
/
Published: 27 April 2023
(This article belongs to the Special Issue Digital Exploration and Assessment of Mineral Resources: Theories, Methods and Achievements)
Abstract
:Pucheng district is a part of the Wuyi Mountain polymetallic metallogenic belt, which is constituted by Archean-Proterozoic metamorphic basements and Mesozoic volcanic-sedimentary covers. Uranium deposits are formed as volcanic-hosted and structural controls. In this study, the hybrid data-driven methods of logistic regression (LR) and weights of evidence (WofE) were applied for the mineral potential mapping of uranium in the Pucheng district. Evidential layers such as volcanic stratum, structure, igneous rock, alteration and radioactive anomaly were used in the mineral prospectivity analyses. The results show that the data-driven methods can not only measure the relative importance of each type of geological feature in uranium controls but also delineate prospective grounds for uranium exploration. The receiver operating characteristics (ROC) curve and under the ROC curve (AUC) were applied to measure the performance of the prospectivity models. The data-driven models are highly capable of mapping uranium prospectivity because AUC is close to 1. The results show that more than 90% of the known uranium deposits occur in regions with high probability. LR performs a little better than WofE in this area. The prospectivity mapping confirmed that there is significant potential for uranium mineralization for further exploration.
1. Introduction
Uranium is a strategic mineral resource in China that is often used in nuclear power generation [1]. Because of its low resource consumption and environmental impact, uranium has become one of the main sources of electricity [2]. Uranium is an element that can be active in various geological environments; thus, it can be accumulated to form uranium mineral deposits in various geological systems [3]. The South China Uranium Province is known for hosting large uranium resources in China and the four main types of uranium deposits are granite-related, volcanic-related, sandstone-related and carbonaceous-siliceous pelitic rock-related [4]. Uranium mineralization in South China is structure-controlled and hydrothermal in nature and mainly took place in the Cretaceous and Tertiary periods [5].
Volcanic-type uranium deposits are often hosted within and near volcanic calderas filled with various lavas or pyroclastic rocks [5,6]. The source rocks are generally acid and intermediate acid and are enriched in U, F, Nb, Ta, Zr, Th and Rb and depleted in Mg, Fe, Ti, P, Ba, Sr, La and Eu [7]. Volcanic-type uranium deposits are characterized by structural controls that focus fluid flow, including caldera margin faults, linear fault zones, breccia pipes and fracture zones in brittle welded tuff [2]. Many researchers demonstrated that alteration changes uranium content significantly [3]. Hydrothermal alterations related to volcanic rock-type uranium deposits are often characterized by strong hematization, fluoritization, silicification, pyritization and sericitization [7].
Mineral prospectivity mapping (MPM), as a key component of mineral exploration, aims to explore new mineral occurrences by delineating the target grounds of the mineralization [8,9,10]. To model the prospectivity, various methods have been employed for weighting and integrating spatial evidence layers to delineate target areas. The methods are mainly divided into data–and knowledge-driven methods [11,12]. The data-driven methods, involving quantitative analysis of spatial associations between known mineral occurrences as training sites, contain logistic regression, weights of evidence model, evidential belief modeling, Bayesian network classifiers, artificial neural networks, support vector machines and random forests [12,13,14,15]. The knowledge-driven methods, based on the judgment of a geological expert, contain Boolean logic, index overlay, fuzzy analytical hierarchy process, fuzzy logic and restricted Boltzmann machine [8,16,17]. Hybrid methods with a combination of data- and knowledge-driven components can be used to construct prospectivity mapping models as hybrid prospectivity maps [18].
The Pucheng district in Fujian Province, characterized by widespread volcanic rocks, is a significant area of volcanic-type uranium resources in the South China uranium province. In this study, the hybrid data-driven methods of logistic regression and weights of evidence models are applied for mapping uranium potential in the Pucheng district, NW Fujian, China. The objectives of this study are to (1) explore the spatial associations of uranium occurrences with certain geological features and (2) generate uranium potential maps and estimate the predictive accuracy.
2. Geology Setting and Uranium Mineralization
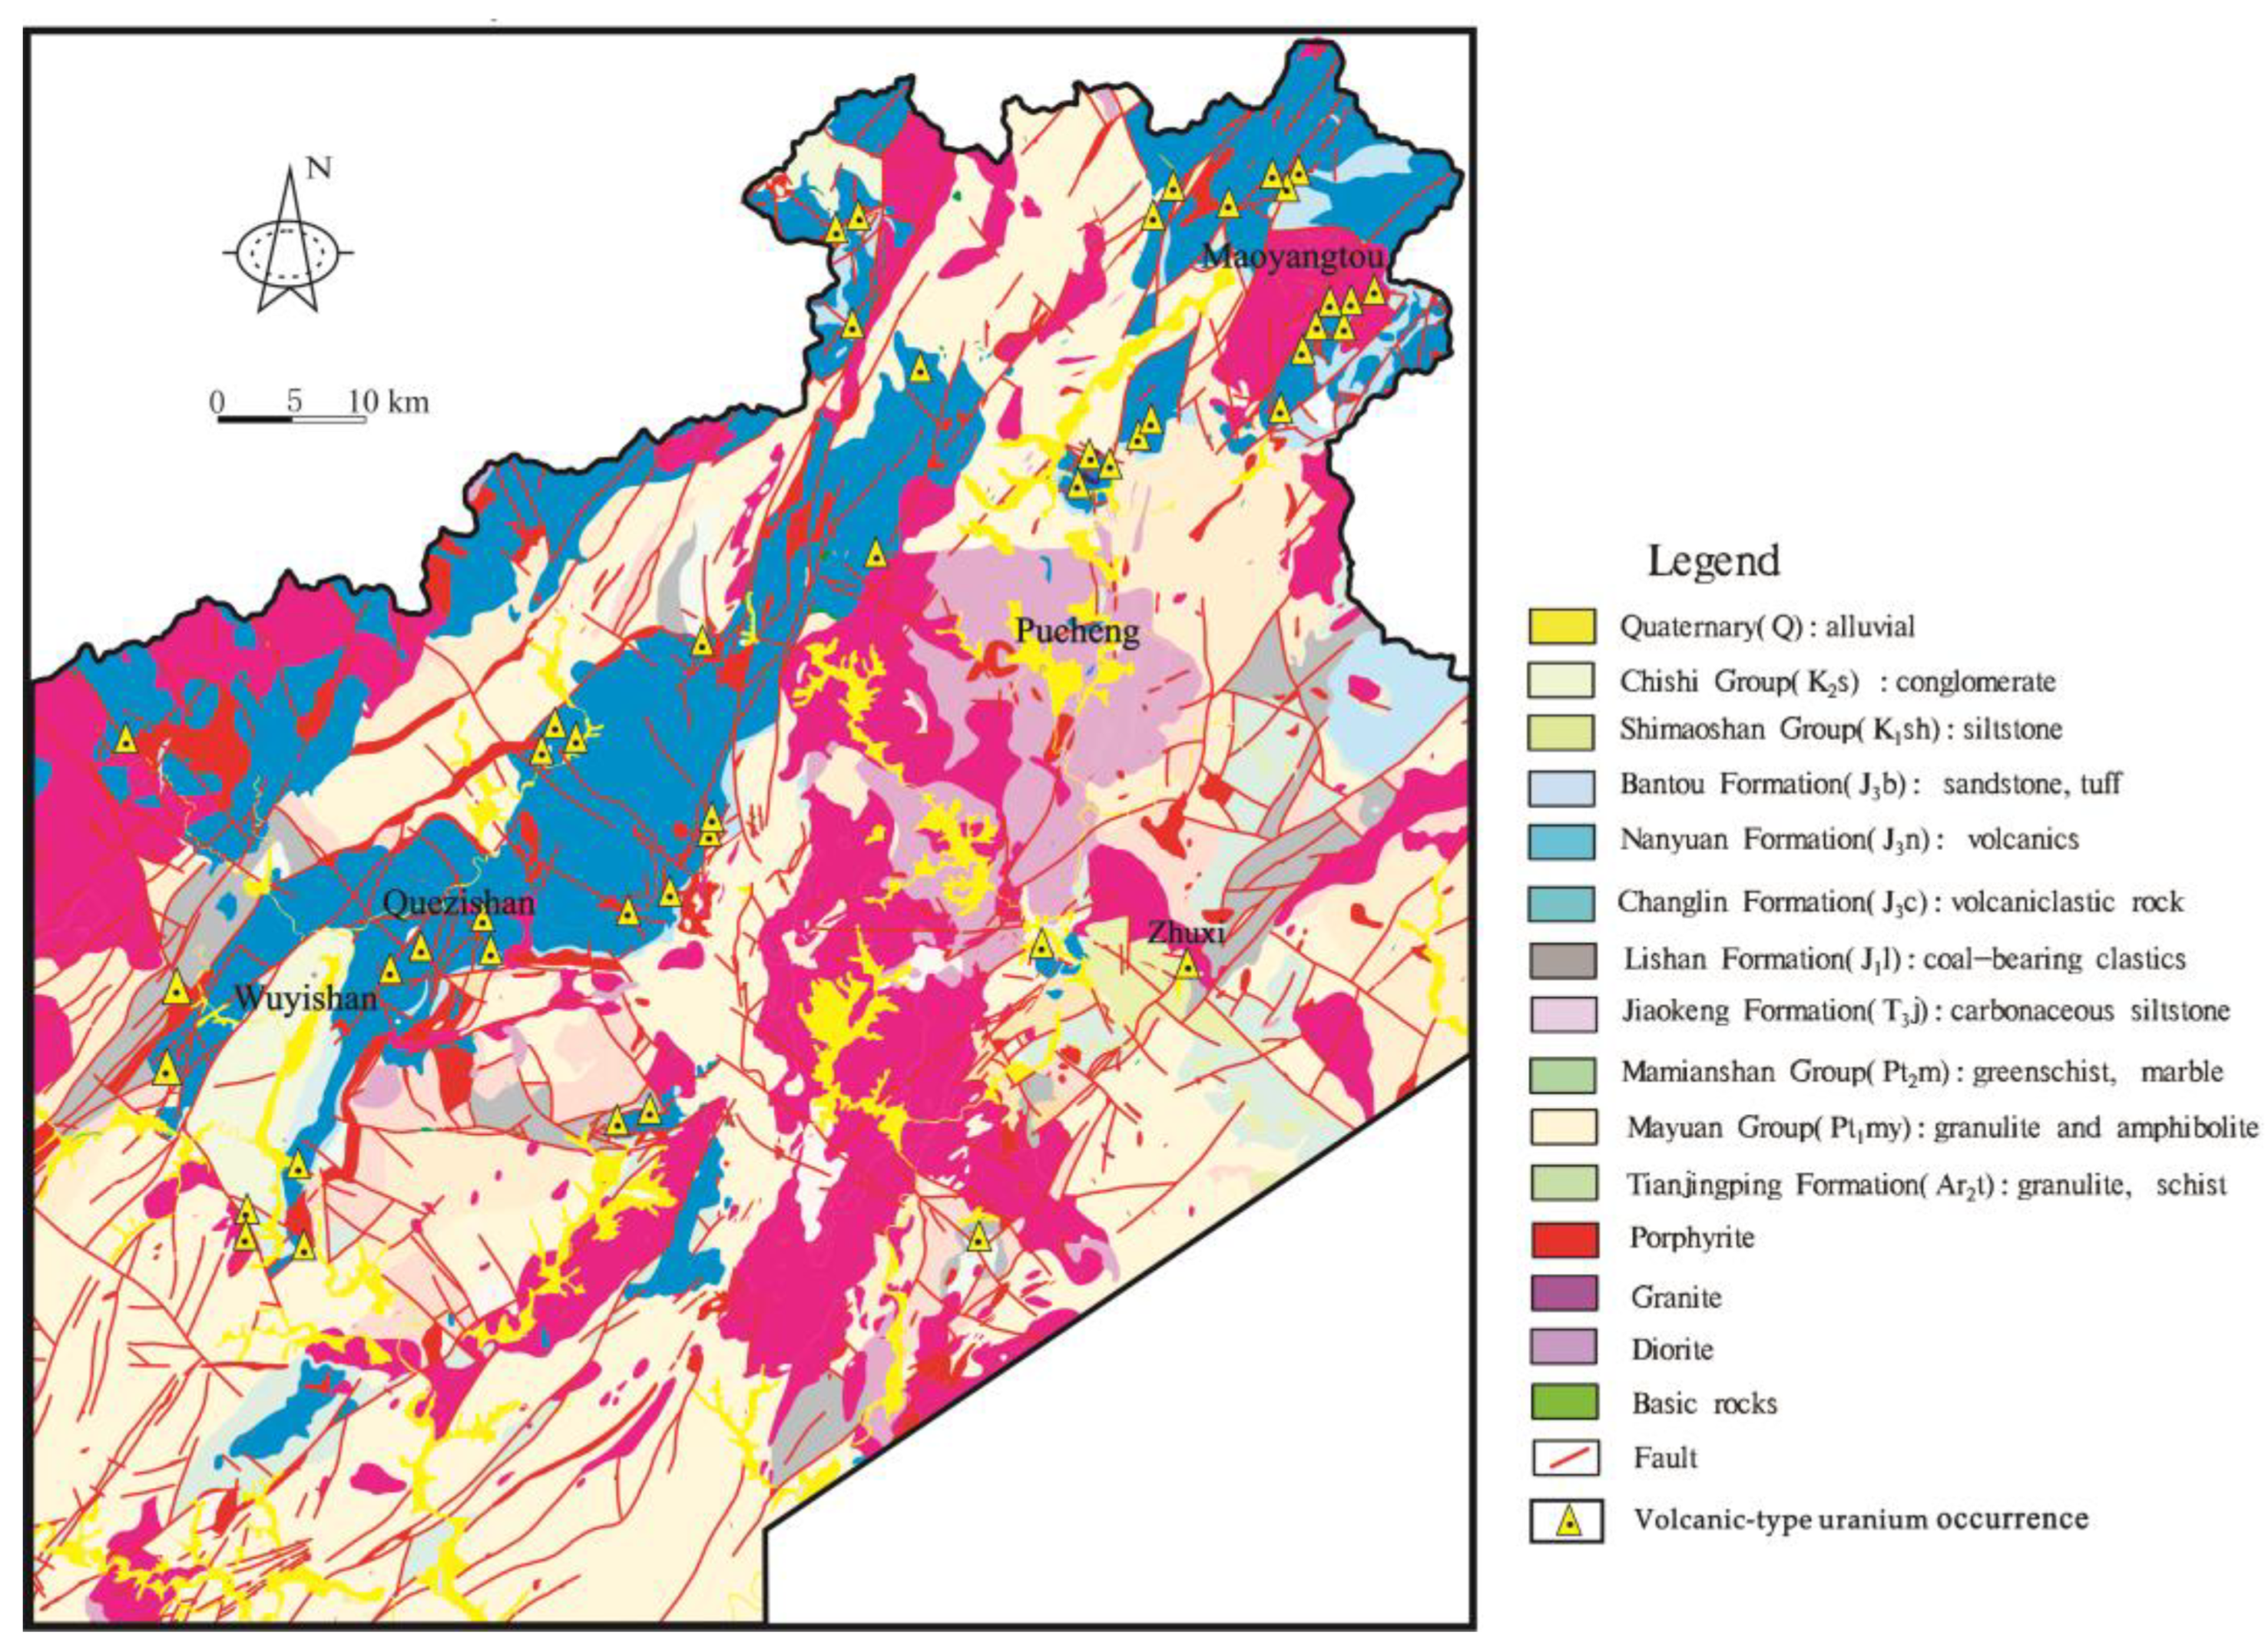
The study area is situated in the northwest of Fujian Province, China. Metamorphic rocks in the Precambrian and volcanic rocks in the Mesozoic strata are exposed widely in the study areas (Figure 1). The oldest units in this area are Neoarchean metaigneous basement rocks (ca. 1790 Ma), mostly biotite plagioclase granulite, amphibolite schist and gneiss rocks of the Tianjingping Formation. The latter is unconformably overlain by Proterozoic metamorphic basement rocks, exposed low- to high-grade metamorphic rocks of Mayuan Group (ca. 807 Ma) and Mamianshan Group (ca. 751 Ma), mostly sericite schist, metamorphic sandstone, metamorphosed siltstone, metamorphic conglomerate and plagioclase granulite [19,20]. The Mesozoic stratigraphy is volcanic and volcanic-sedimentary rocks, such as rhyolite, tuff, lava, tuffaceous sandstone and siltstone (Table 1).
The study area contains intrusive rocks of mafic to felsic composition, including olivine gabbro, syenite, diorite, granite and porphyry. The district is mainly dominated by NE-SW and NW-SE oriented faults, which cut the different lithologic units. The NE-SW faults are concentrated in the large area of volcanic rocks in the western part of the area and belong to the structural traces in the late Yanshan to the Himalayan period. The NW-SE faults exhibit mainly normal dip-slip displacements. In the study area, NE-trending faults mainly controlled the distribution of uranium polymetallic deposits.
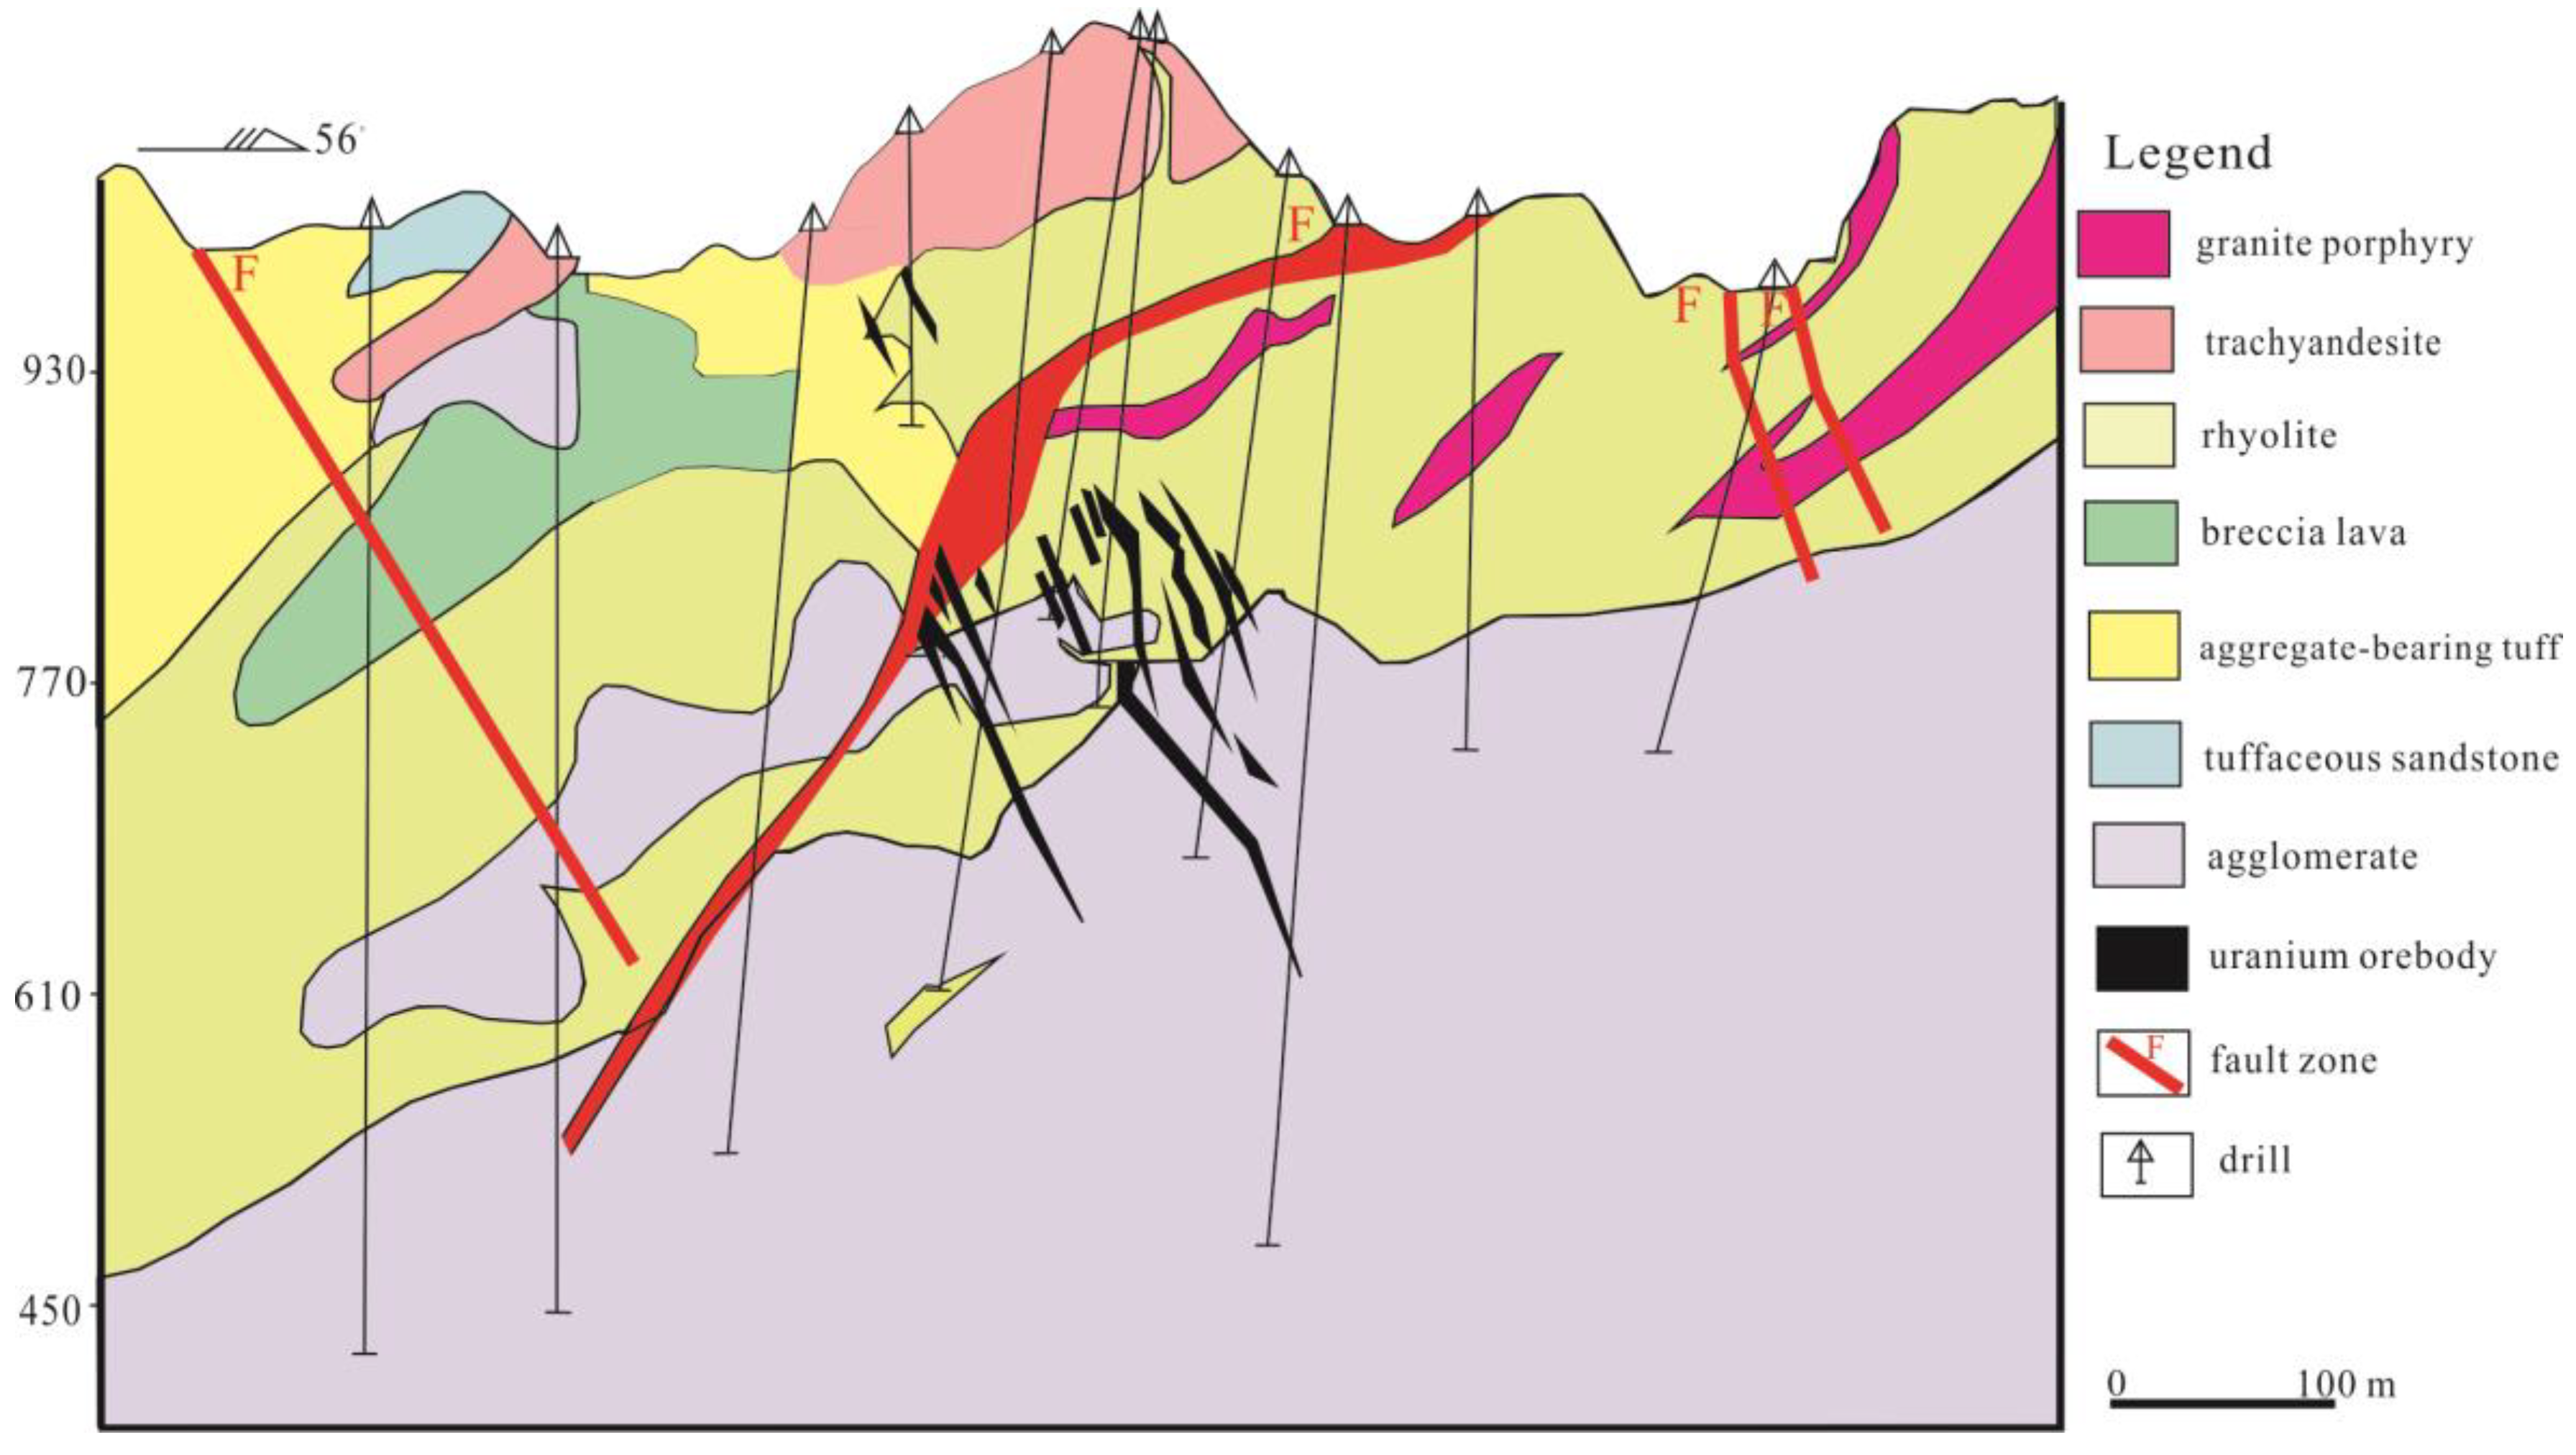
A number of uranium deposits occur in this area, such as the Maoyangtou deposit, with proved reserves of approximately 2000t U at an average grade of 0.185% and Quezishan deposits with approximately 600t U at an average grade of 0.103% [20]. The major host rocks are volcanic rocks of the Jurassic-Cretaceous Nanyuan Formation, which is a series of continental intermediate and intermediate acid lavas and pyroclastic rocks. A few deposits are granite-type uranium, such as the Qinshan deposit. The uranium deposits in the granite and the uranium deposits in the volcanic rocks can be seen as the same mineralization in different layers [21]. A sectional view of the Maoyangtou deposit shows that the mineralized bodies, appearing in veined, lenticular and stratoid shapes, often forms discontinuous and parallel to the ore-controlling faults (Figure 2). The host rock is composed of rhyolitic tuff, breccia lava, tuffaceous sandstone, agglomerate, etc. Hydrothermal alteration of hematization, albitization, silicification and pyritization are closely related to uranium mineralization and well developed in proximity to the mineralized zones [20,21]. The main ore-forming age given by the U-Pb data is 89.3–107.7 Ma [22,23]. Summarizing the previous work in this area, we discuss the critical parts of a volcanic-type uranium mineral system.
Uranium sources: Acidic granite and uranium-rich volcanic rocks provide the main source of uranium in the region. This is supported by geochemical studies based on the Pb isotopic ratios in the ore and volcanic rocks [22]. Uranium is found in concentrations of between 10 ppm to 24 ppm in granite [23]. Yanshanian coarse-grained biotite granite is an important uranium source in this area. The Mesozoic volcanic acid constitutes a primary uranium source for forming an economic deposit. Among the volcanics, rhyolites provide an ideal source, followed by rhyolitic tuffs, ignimbrites, etc.
Uranium transport: hydrolysis affects the U activation and transportation in this area. Various uranyl complexes, including carbonate, fluoride and chloride, have been proposed for the transportation of uranium in the ore-forming fluids [6,7]. Under oxidation conditions, uranium in +VI state (UO22+) can form fluoride, carbonate, hydroxyl, sulfate, chloride, silicate and other complexes. The NE- and NW-striking faults have caused a zone of weakness to control the transportation of uranium [22].
Precipitation of uranium: the main process responsible for uranium precipitation appears to redox reaction with reductants [5]. UO22+ was mainly reduced into UO2 so as to precipitate. Brittle structures developed in an extensional tectonic setting which provided pathways for fluid flow and spaces for uranium precipitation, commonly in linear fault zones, breccia pipes, fracture zones and fault intersections. At the deposit scale, the local secondary faults actually control the precipitation of individual ore zones. For example, the Maoyangtou deposit is jointly controlled by secondary NW- and NNW-striking fault zones adjacent to the south of the volcanic conduit. In addition, geologic contact surfaces and volcanic structures are also believed to be favorable structures controlling the precipitation of uranium mineralization [21,22,23,24].
3. Mineral Prospectivity Mapping Methods
3.1. Weights of Evidence (WofE)
This method, based on a Bayesian conditional probability, utilizes multi-source signatures with target areas of high mineral prospectivity [8]. The WofE technique comprises four processes as follows:
Estimation of prior probability (Pprior): let an area be divided into a number of N(T) cells, of which there are N(D) pixels containing prospect D. The Pprior that a cell selected randomly contains a prospect can be estimated as Pprior defined by N(D)/N(T).
Determination of weighting coefficients (W+ & W−): Suppose that in the area, there are N(B) and N() cells where spatial evidence B is present and absent, respectively. The weighting coefficients W+ and W− spatial association of the predictor pattern B with a target mineral deposit D. W+ and W− can be expressed as:
A positive W+ reflects that more training points occur, and a positive W− reflects that fewer training points occur. A weight of zero for either the W+ or W− coefficient indicates spatially uncorrelated training points. The contrast, C = W+ − W− represents a measure of spatial association between a set of spatial evidence and a set of prospects. If the spatial association is positive, C > 0, if the spatial association is negative, C < 0, and if the spatial association is lacking, C = 0.
Calculation of posterior probability (Ppost): weights of evidence in predictor maps are combined with loge prior odds O(D) defined by P(D)/P(), which are related to the prior probability. The posterior probability is then found by combining weighting coefficients using the odds formulation of Bayes’ rule. For Kth (k = 1, 2, ……, n) layers, estimates of posterior odds are converted to posterior probabilities reflecting degrees of mineral potential, which can be expressed as:
Testing for conditional independence (Cl): WofE modeling requires the assumption of conditional independence among evidential layers with respect to prospects.
3.2. Logistic Regression (LR)
Logistic regression is a classification rather than a regression model. Logistic regression is a simple and more efficient method for binary and linear classification problems [25]. The logistic regression model is a statistical method for binary classification that can be generalized to multi-class classification. It can be expressed as a linear equation:
where Y is the dependent variable representing the presence (1) or absence (0), b0 is the intercept of the model, b1~bn are the partial regression coefficients, and x1~xn are the independent variables. Logistic regression makes no assumption about the probability distribution of the independent predictor variables and, being a nonlinear model does not require conditional independence of input predictor maps [26]. The possibility can be calculated as an equation:
Y = b0 + b1x1 + b2x2 + b3x3 + … + bnxn
p = 1/(1 + e−Y)
4. Evidential Maps
4.1. Geological Controls
To generate evidential maps, the datasets consisting of geological and airborne radioactive survey data were collected. The geological dataset contains a 1:100,000 geological map, including strata, intrusive rocks, faults and mineral occurrences (Figure 1). The airborne radioactive survey data contain anomaly maps of K, Th, γ, and U. We also collected ASTER data to extract alteration maps related to uranium mineralization.
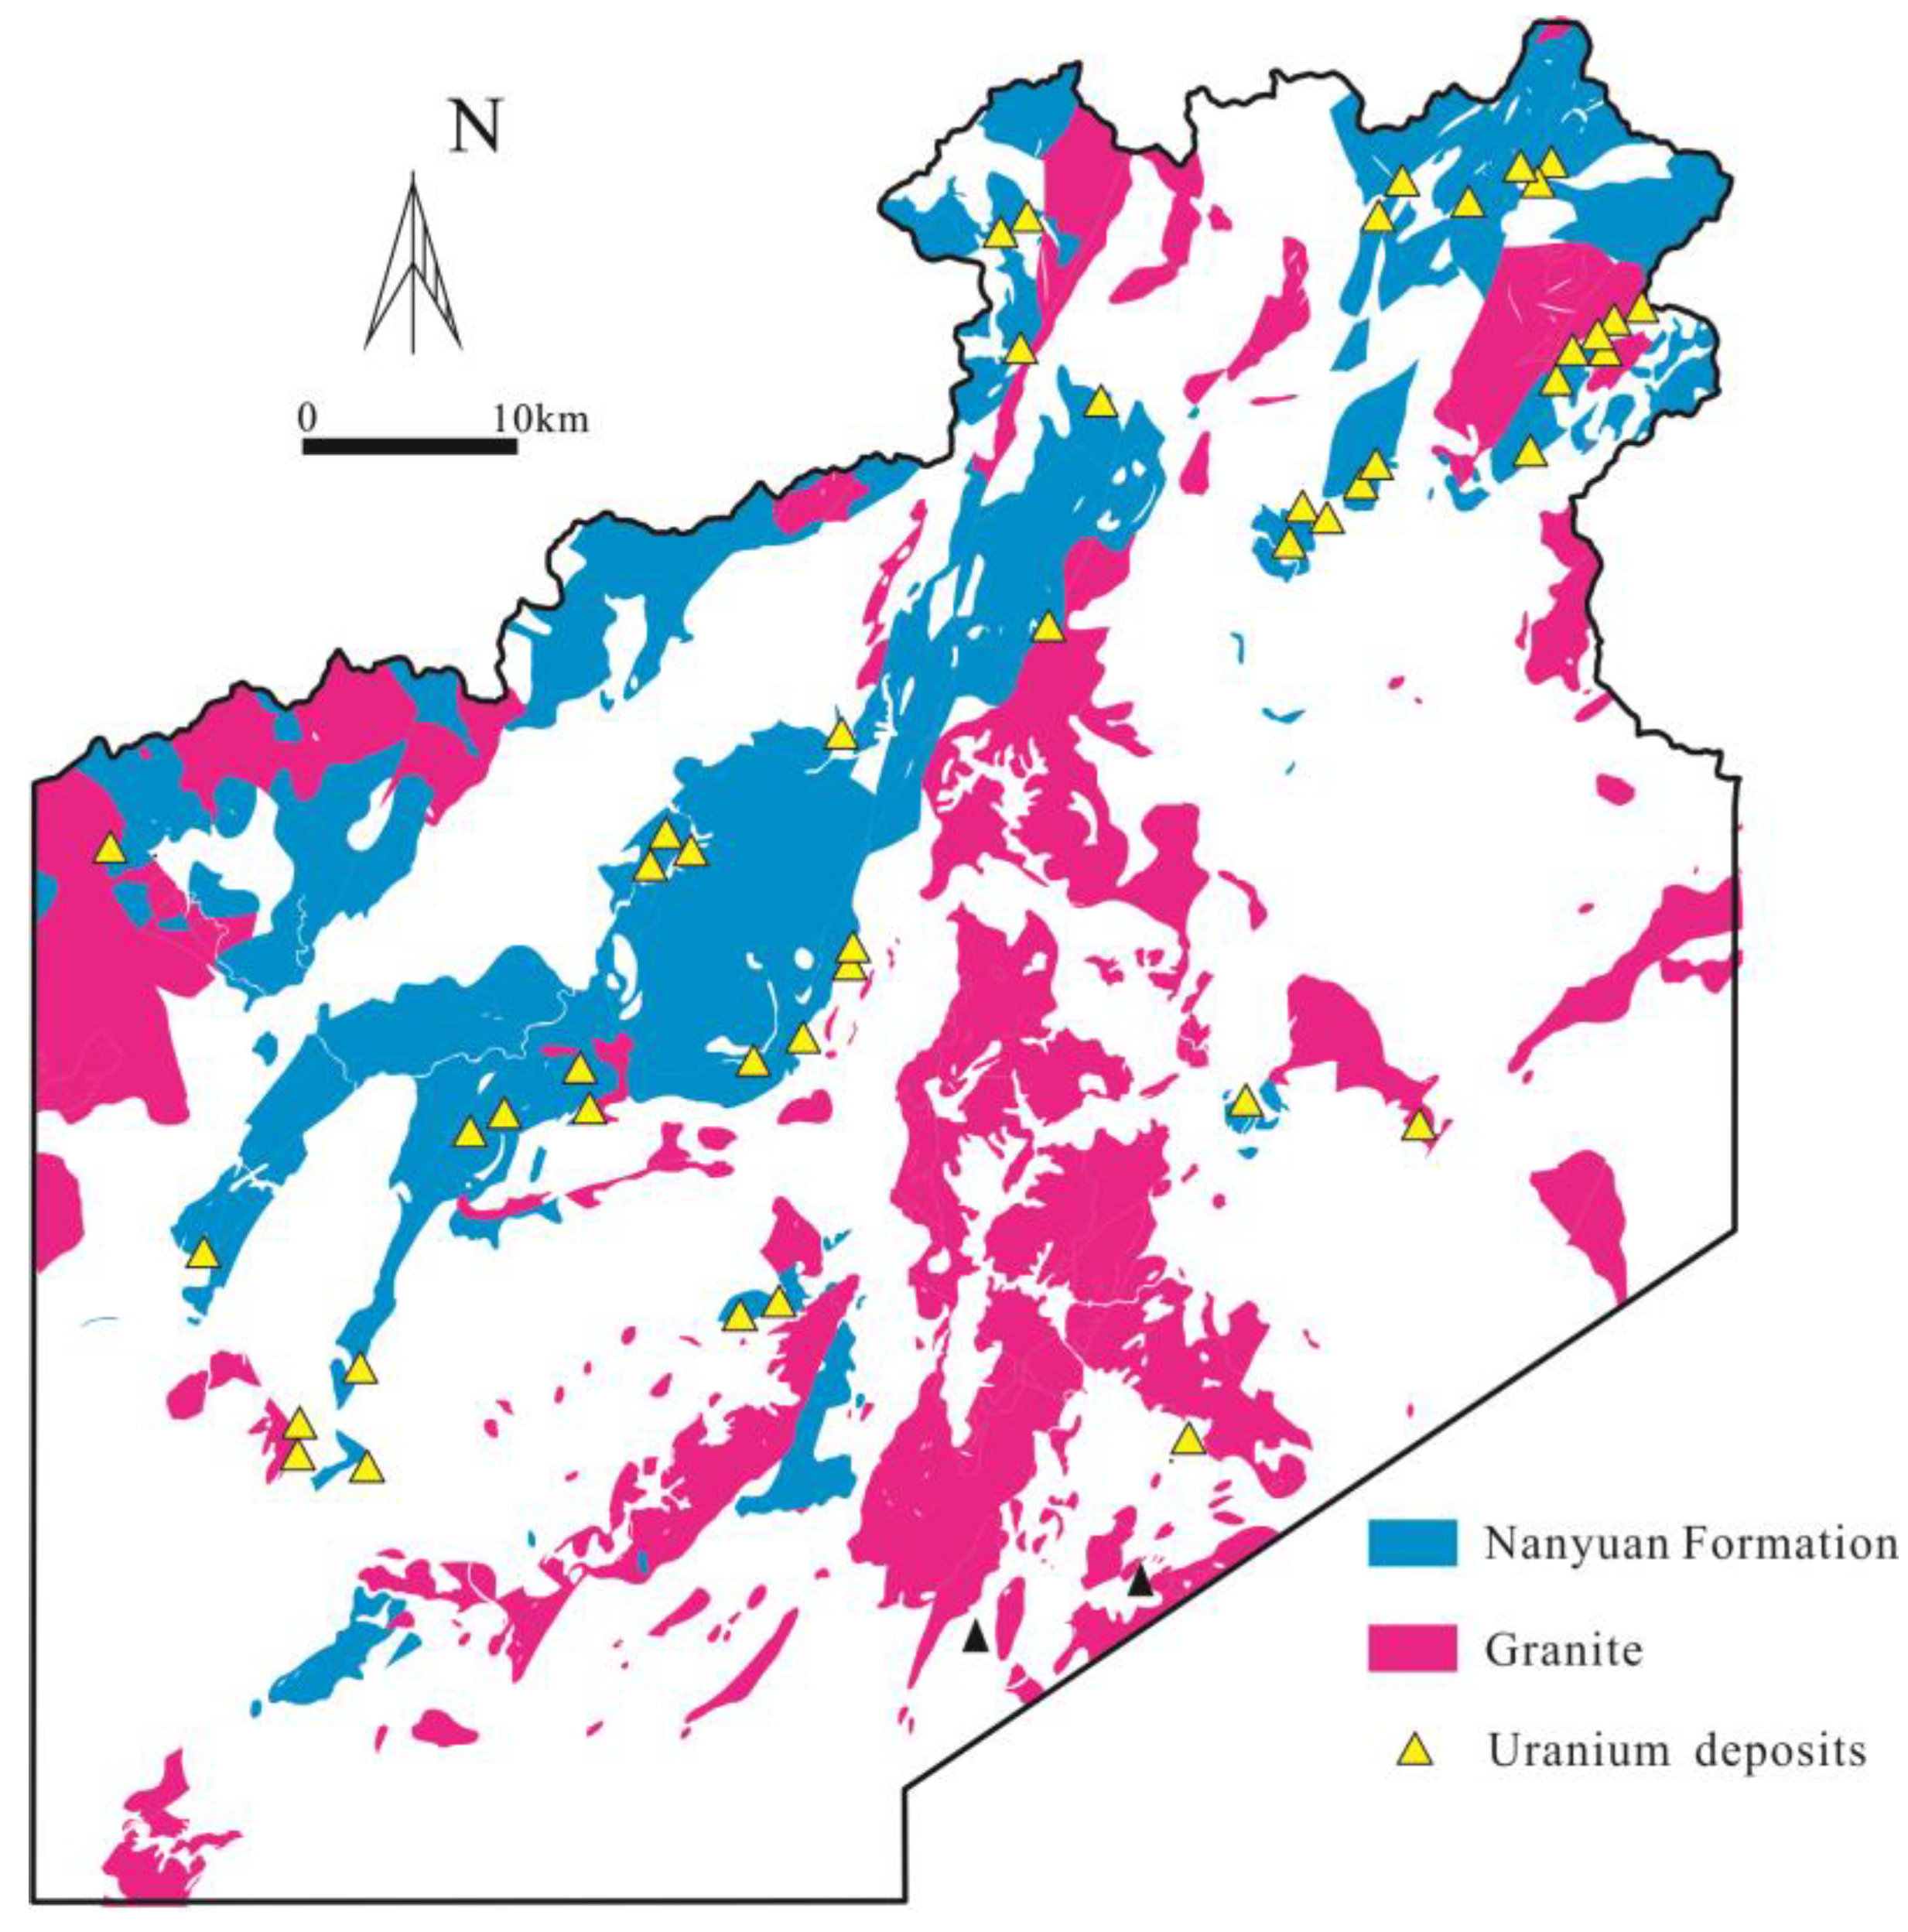
As demonstrated by the volcanic-type uranium mineral system, the volcanic and intrusive rocks constitute significant metal sources for forming an economic uranium deposit. Most of the uranium is derived from volcanic rocks of the later Jurassic Nanyuan Formation, while some originated from both volcanic and intrusive rocks [20]. The uranium source map (Figure 3) shows that there are strong positive spatial associations between the Nanyuan formation and granite with uranium occurrences. Therefore, these rock units might be the plausible lithological control concerning uranium mineralization.
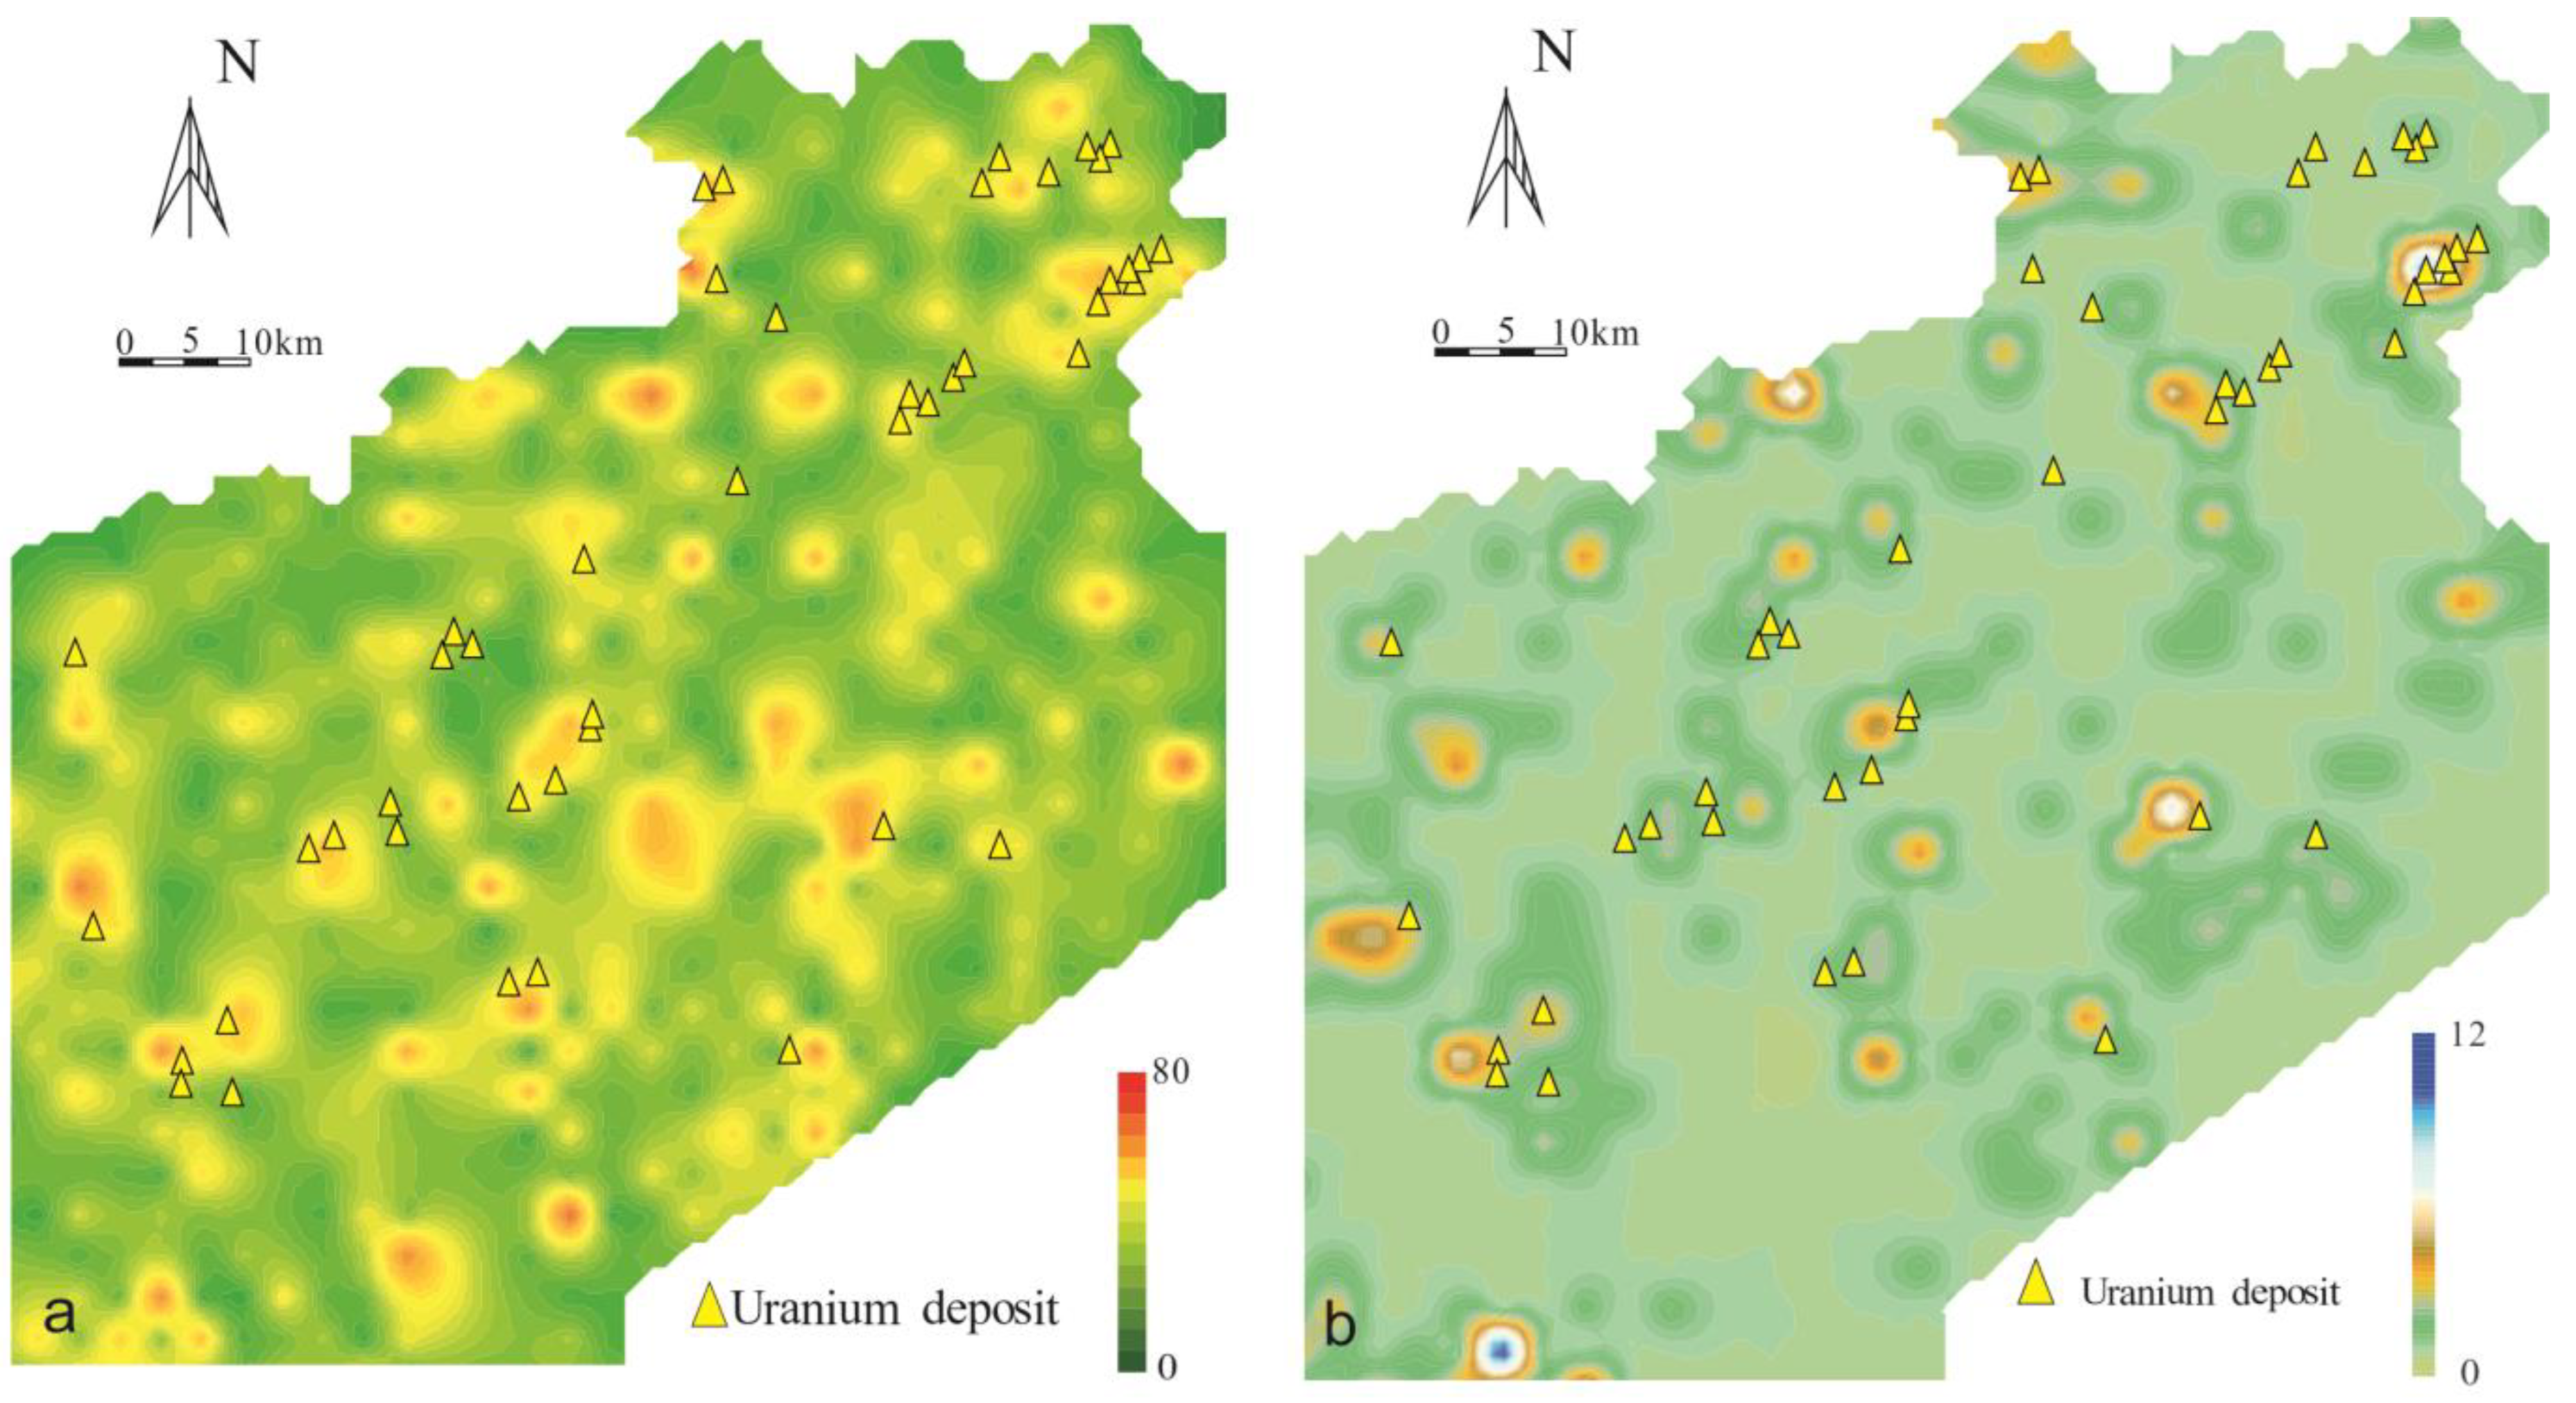
In this district, fault and volcanic lithologies are fundamental factors that control the size and location of ore deposits [21]. The lineament structures containing faults and lithological contacts are important factors in the genesis of hydrothermal ore deposits. For mapping of structure density, we divided the study area into small grids and counted the number, and summed the lengths of faults fallen within each grid. Then, the structure density map for total lengths per grid was created (Figure 4a). The intersection of lineament structure is also an important index to analyze the structure controls; areas surrounding the fault intersections with higher permeability could be appropriate for the penetration of ore-forming fluids. Hence, the density map of intersections of lineament structures for total lengths per grid was also created (Figure 4b). Both length and intersection present strong positive correlations with the uranium occurrences (Figure 4). In addition, The NE- and NW-striking faults have resulted in the formation of uranium resources. The buffer map of NE and NW-striking faults is shown in Figure 5; the buffer radii of 1.0 and 1.2 km were considered according to the areas containing approximately 75% of known deposits [24].
4.2. Hydrothermal Alteration
Uranium mineralization is often found by the recognition of hydro-thermally altered host rocks and is produced by fluid flow processes that alter the mineralogy and chemistry of the country rock. Using a multi-spectral and hyperspectral sensor is due to detecting the optical characteristics of the Earth’s surface by several spectral bands [27]. The ASTER (Advanced Spaceborne Thermal Emission and Reflection Radiometer) sensor is an imaging instrument flown on the Terra satellite, which was launched in December 1999. The instrument consists of three separate subsystems with a total of 14 bands: (1) optical images of three bands (0.52 to 0.86 μm) with a spatial resolution of 15 m obtained by the visible near-infrared (VNIR) subsystem; (2) optical images of six bands (1.60 to 2.43 μm) with a spatial resolution of 30 m obtained by the shortwave infrared (SWIR) subsystem; (3) optical images of five bands (8.12 to 11.65 μm) with a spatial resolution of 90 m obtained by the thermal infrared (TIR) subsystem. Image preprocessing includes data resampling, radiation calibration, geometric correction, etc.
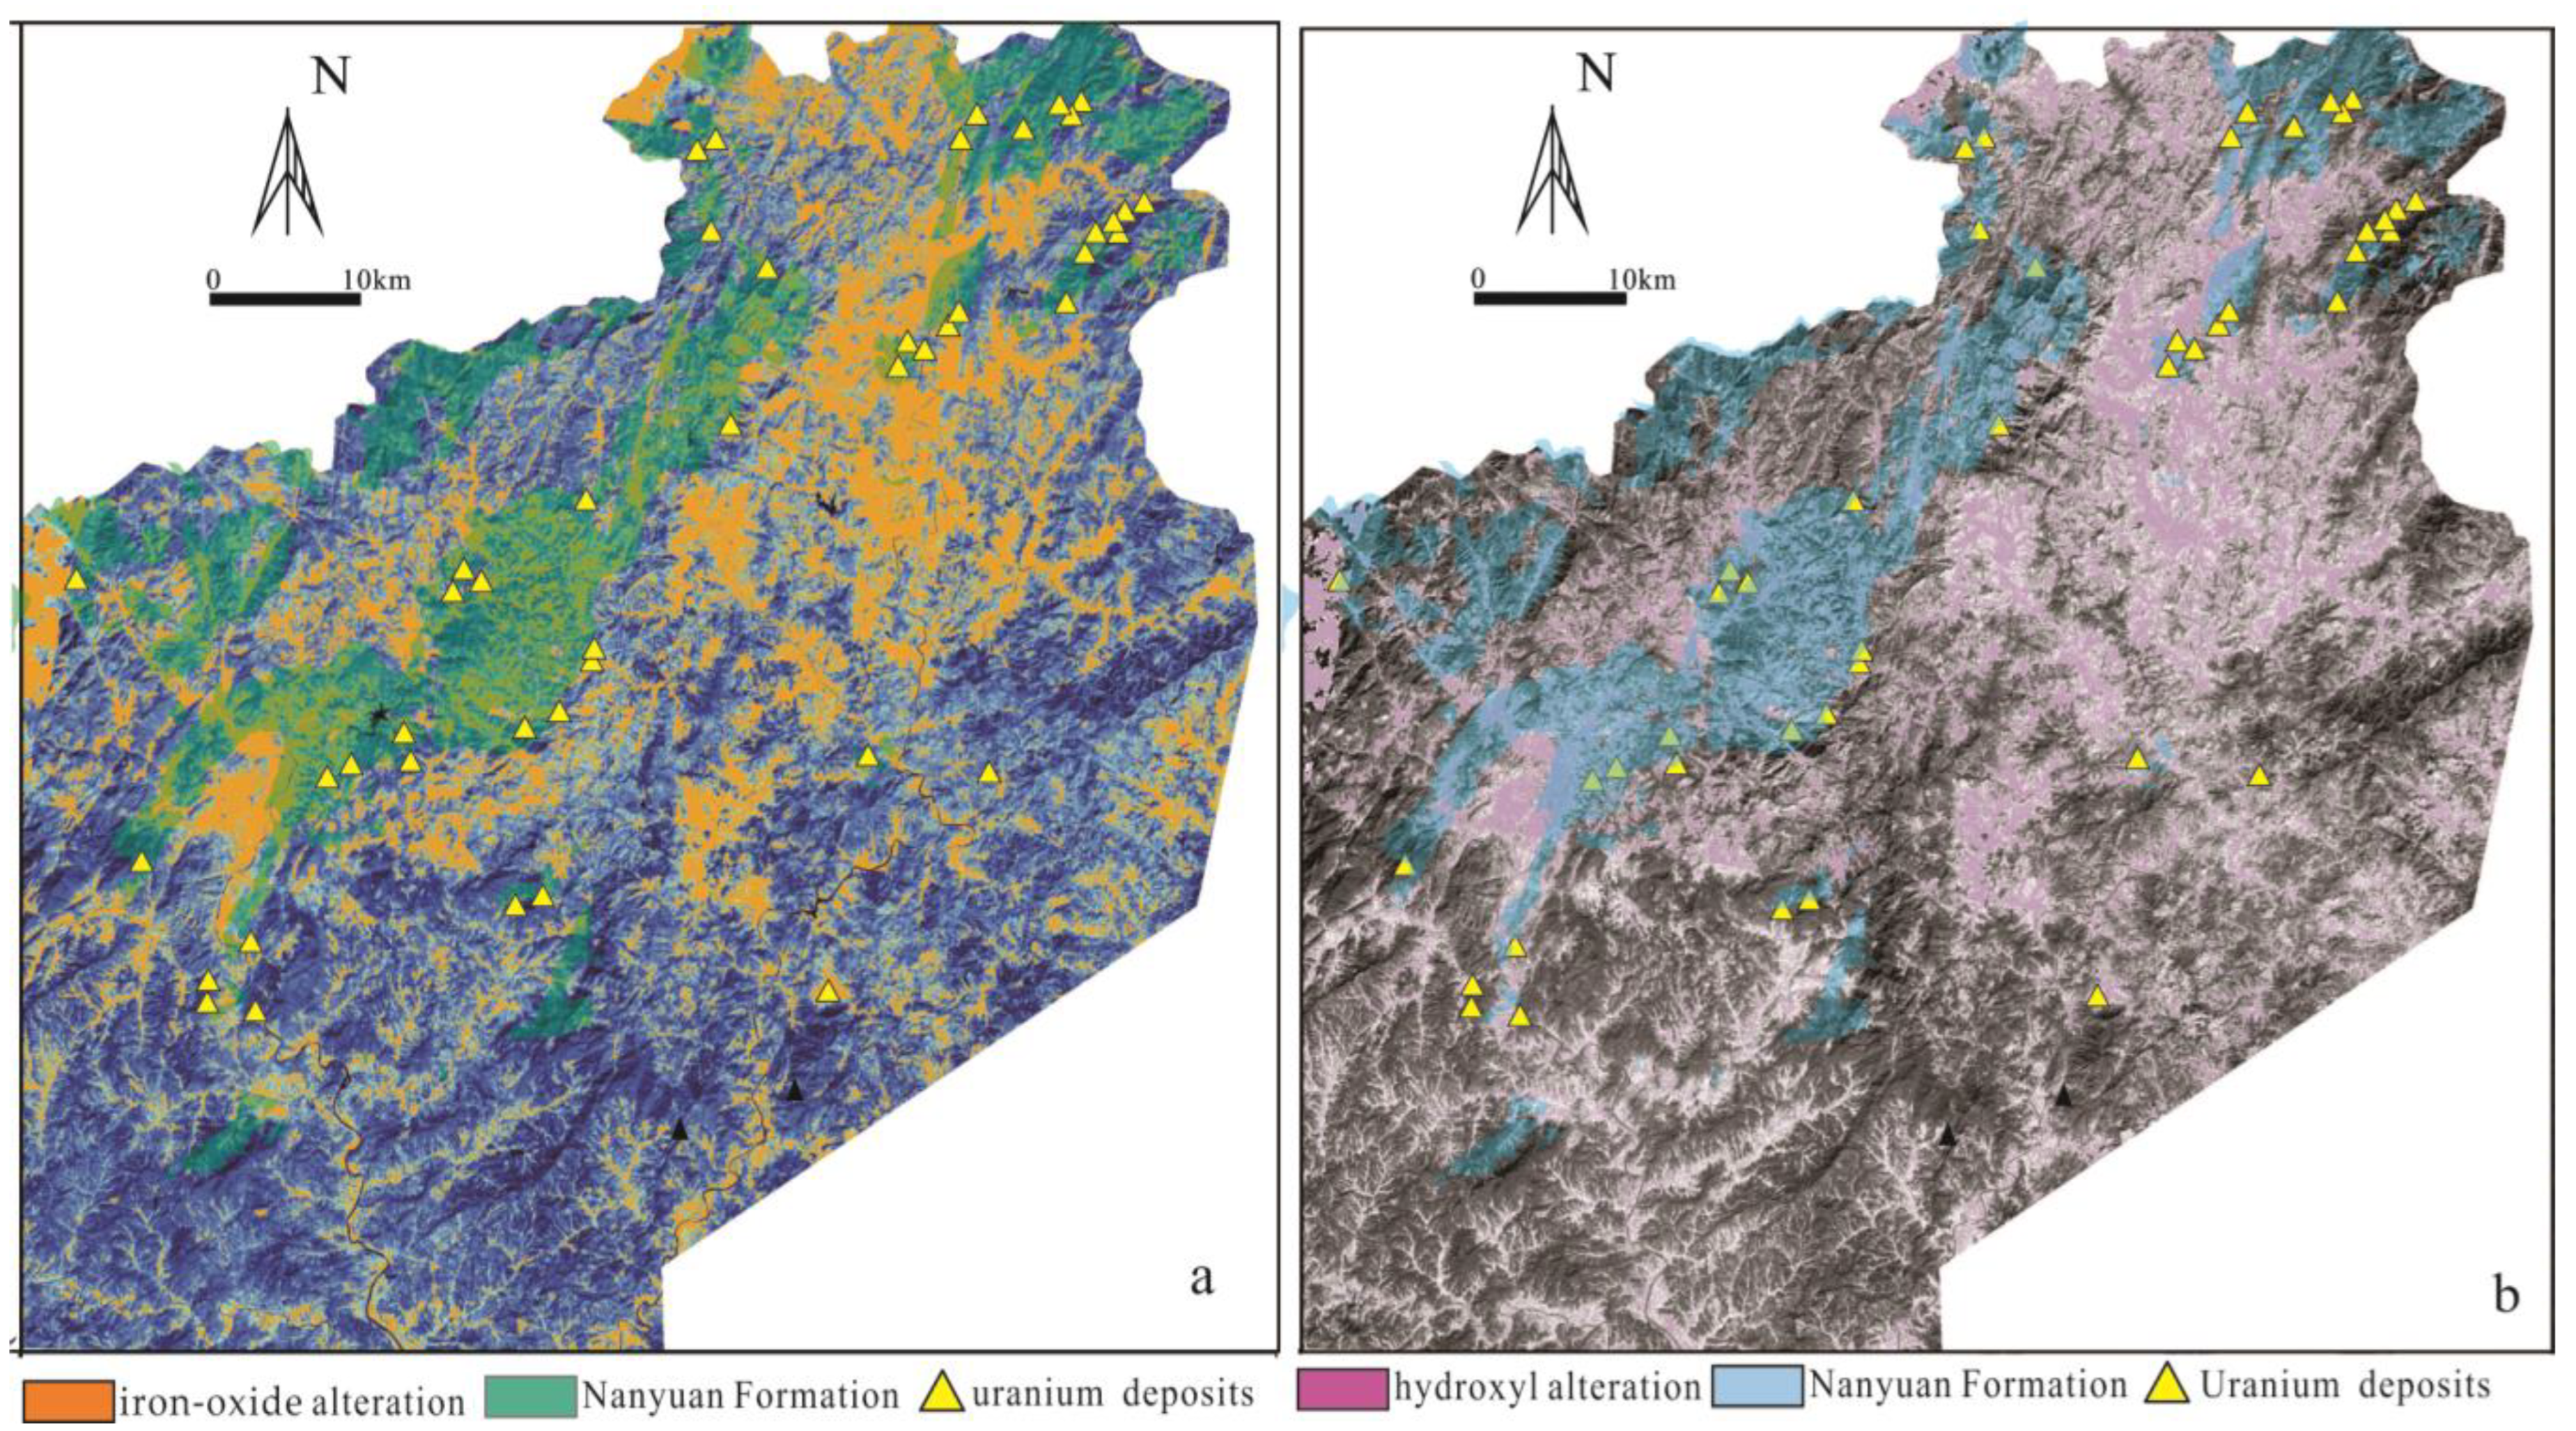
Hydroxyl-bearing mineral reflectivity peaks in band 3 and decreases in band 4, and absorption grains appear in band 6. For iron-oxide-bearing minerals, the vast majority of Fe2+ and Fe3+-bearing minerals reflect more strongly and peak in bands 2 and 4. Therefore, it is believed that the selected band set of bands 1, 3, 4 and 6 can extract most hydroxyl-bearing mineral information, while the band set of bands 1, 2, 3 and 4 can extract most iron-oxide-bearing mineral information. Principal component analysis (PCA) is used for mapping of alteration. Table 2 shows the results of PCA for recording iron-oxide-bearing minerals with the mentioned bands. According to the results, PC2′s image shows the presence of iron-oxide-bearing minerals in the area (Figure 6a). In addition, for recording hydroxyl-bearing minerals, PCA comprising bands 1, 3, 4 and 6 have been used. Table 3 shows the results of recording hydroxyl-bearing minerals. According to the results, an image related to PC4 shows the presence of hydroxyl-bearing minerals in the study area (Figure 6b). The results show that the spatial distribution of the altered area is consistent with that of the volcanic rocks and known uranium deposits.
4.3. Airborne Radioactive Anomaly
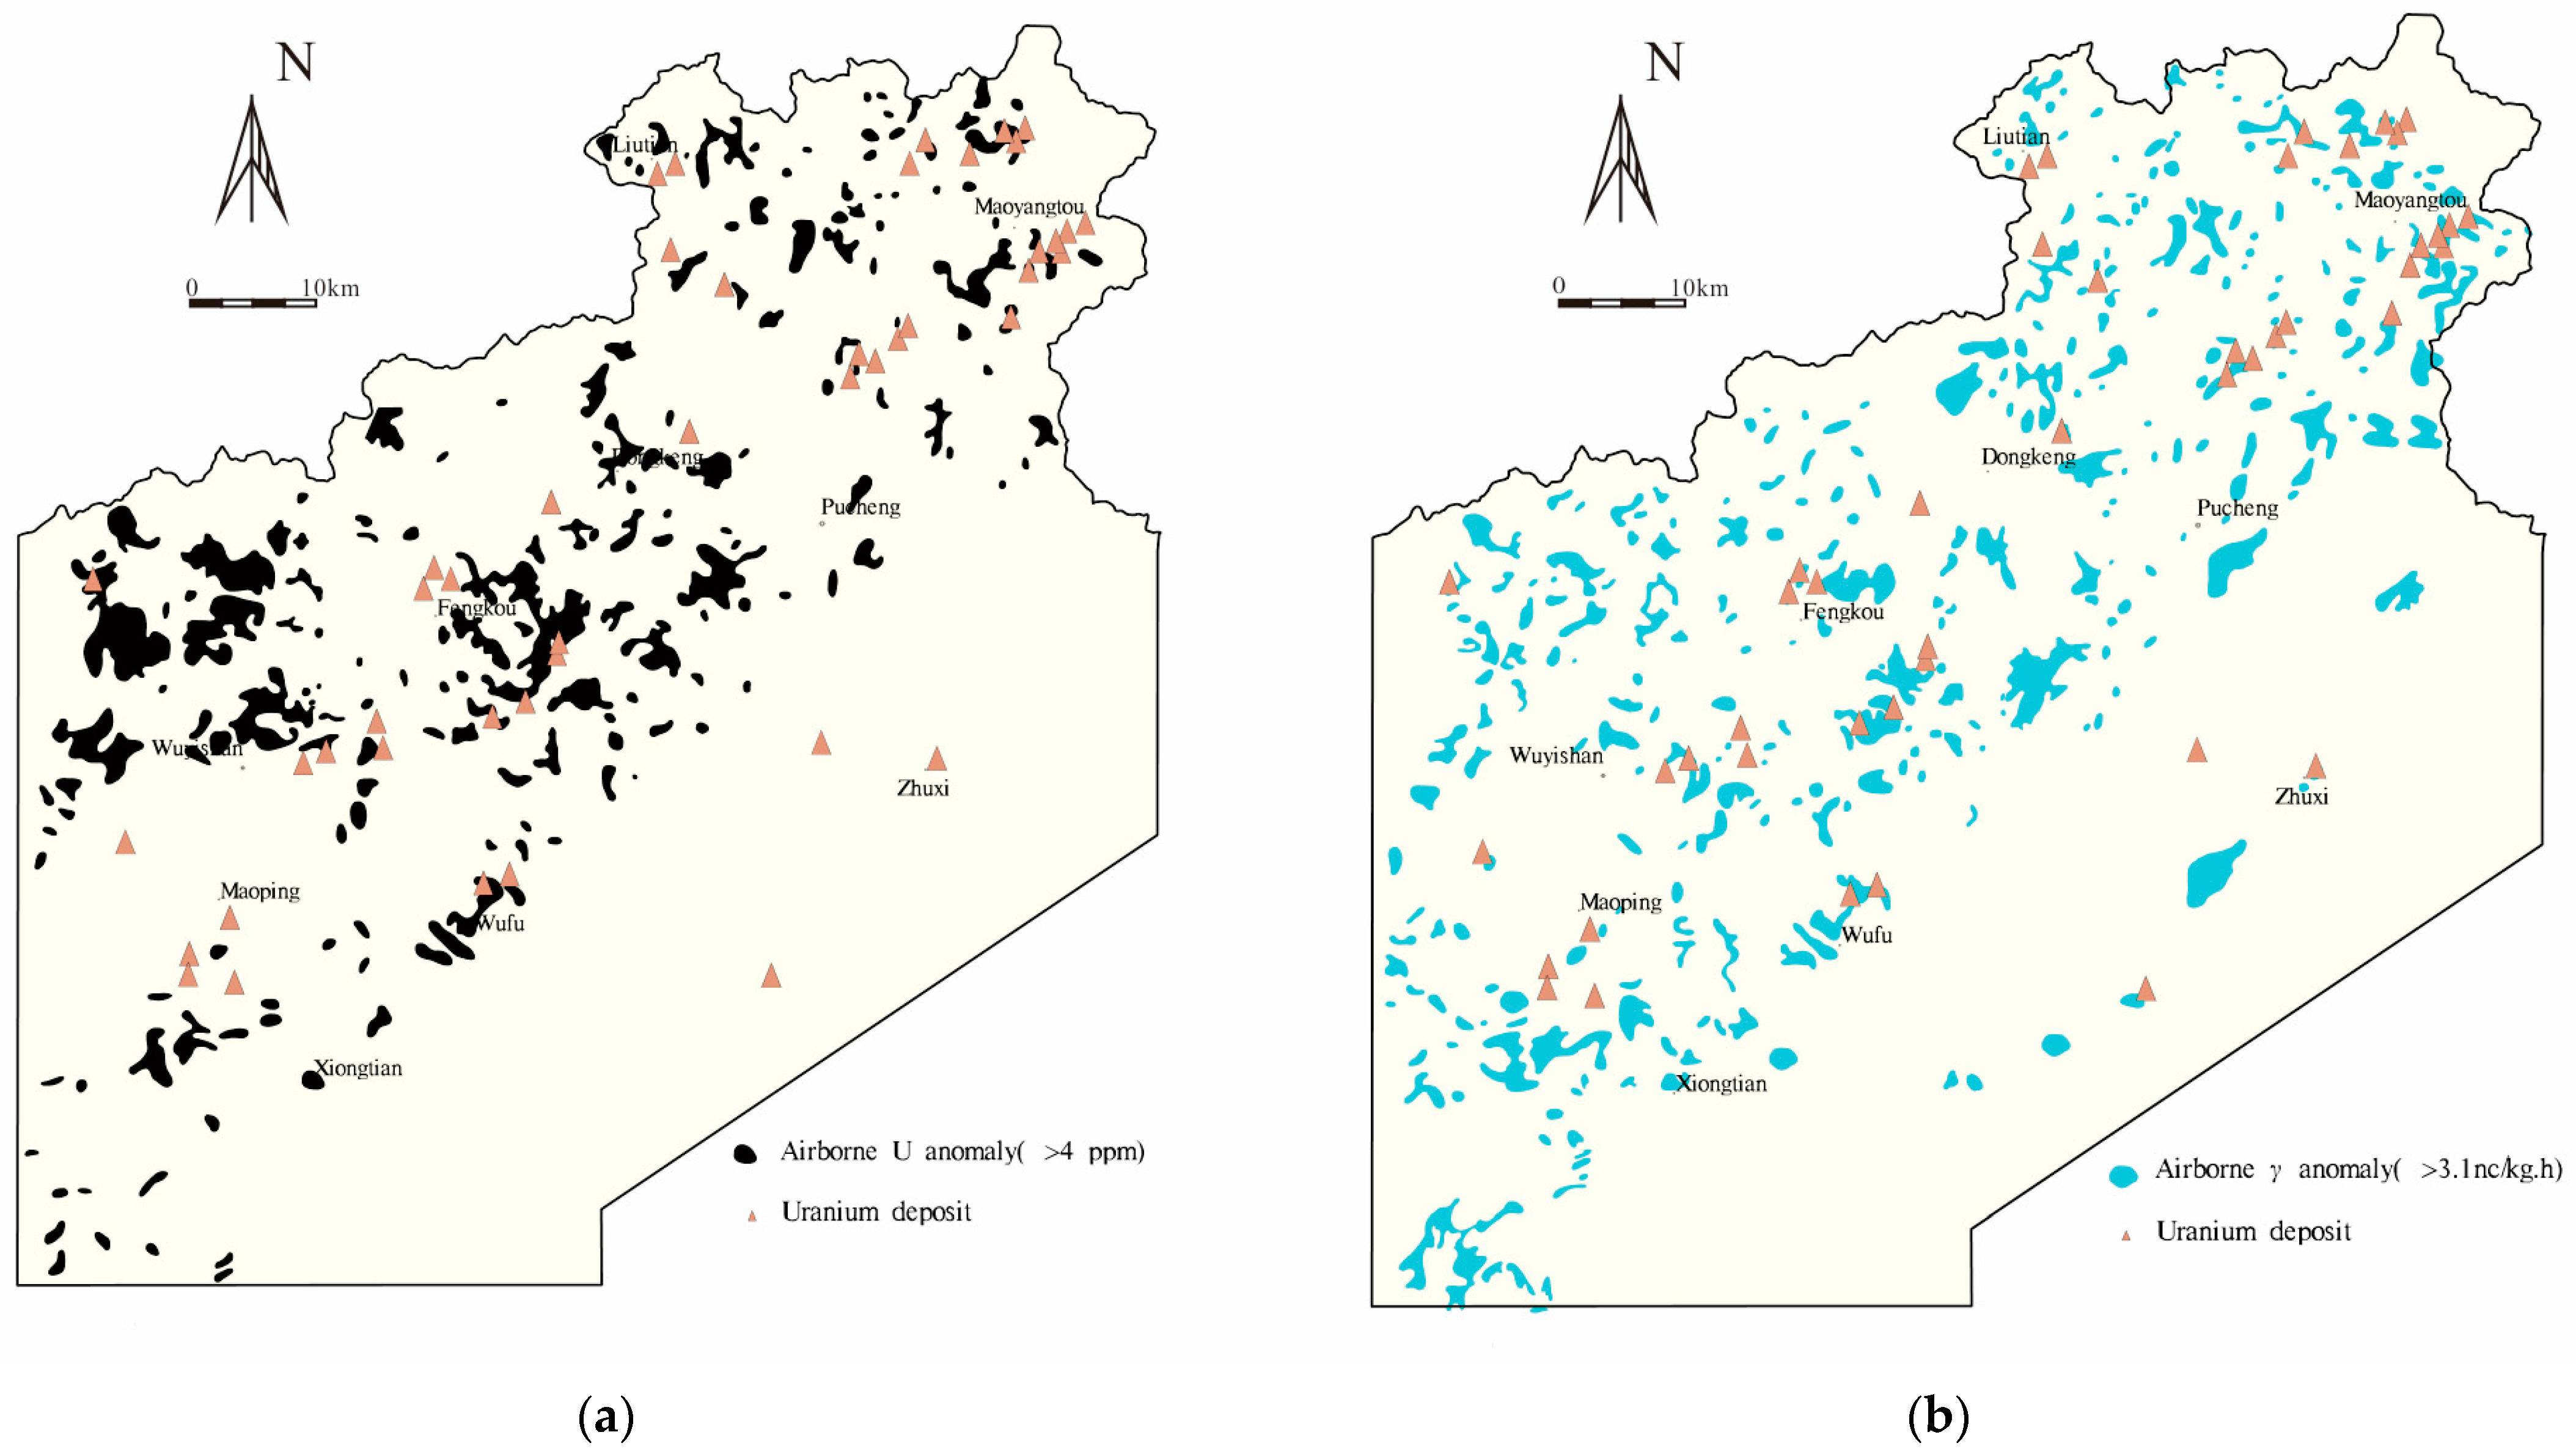
In uranium exploration, airborne radioactive anomalies are important criteria, providing results about uranium deposition and preservation in mineral systems. The anomaly maps clearly show that the anomalies are mainly concentrated in the north and the west part (Figure 7), which coincide with the distribution of uranium-rich volcanic rocks; the thresholds were chosen according to the background values in this area [24].
5. GIS-Based Prospectivity Modeling
Ascertaining appropriate prospecting criteria about the mineral deposit-type sought features is a fundamental issue encountered during MPM. In the uranium mineral system, the source, pathway of fluids, and conditions for uranium deposition and preservation are considered to be essential [6,28,29,30]. In this research, ten binary variables are derived from multi-class evidential maps. Nanyuan Formation(F1) and granite(F2) are the main host rocks and provide material sources. NE- and NW-striking faults (F3 and F4) provide pathways in the formation of uranium resources. Linear structures (F3 and F4) can provide fluid pathways and physico-chemical traps to form mineralization. Airborne radioactive U and gamma anomalies, iron-stained alteration and hydroxyl alteration (F7~F10) are important geophysical and remote sensing exploration criteria in uranium mineral exploration, indicating the deposition and preservation.
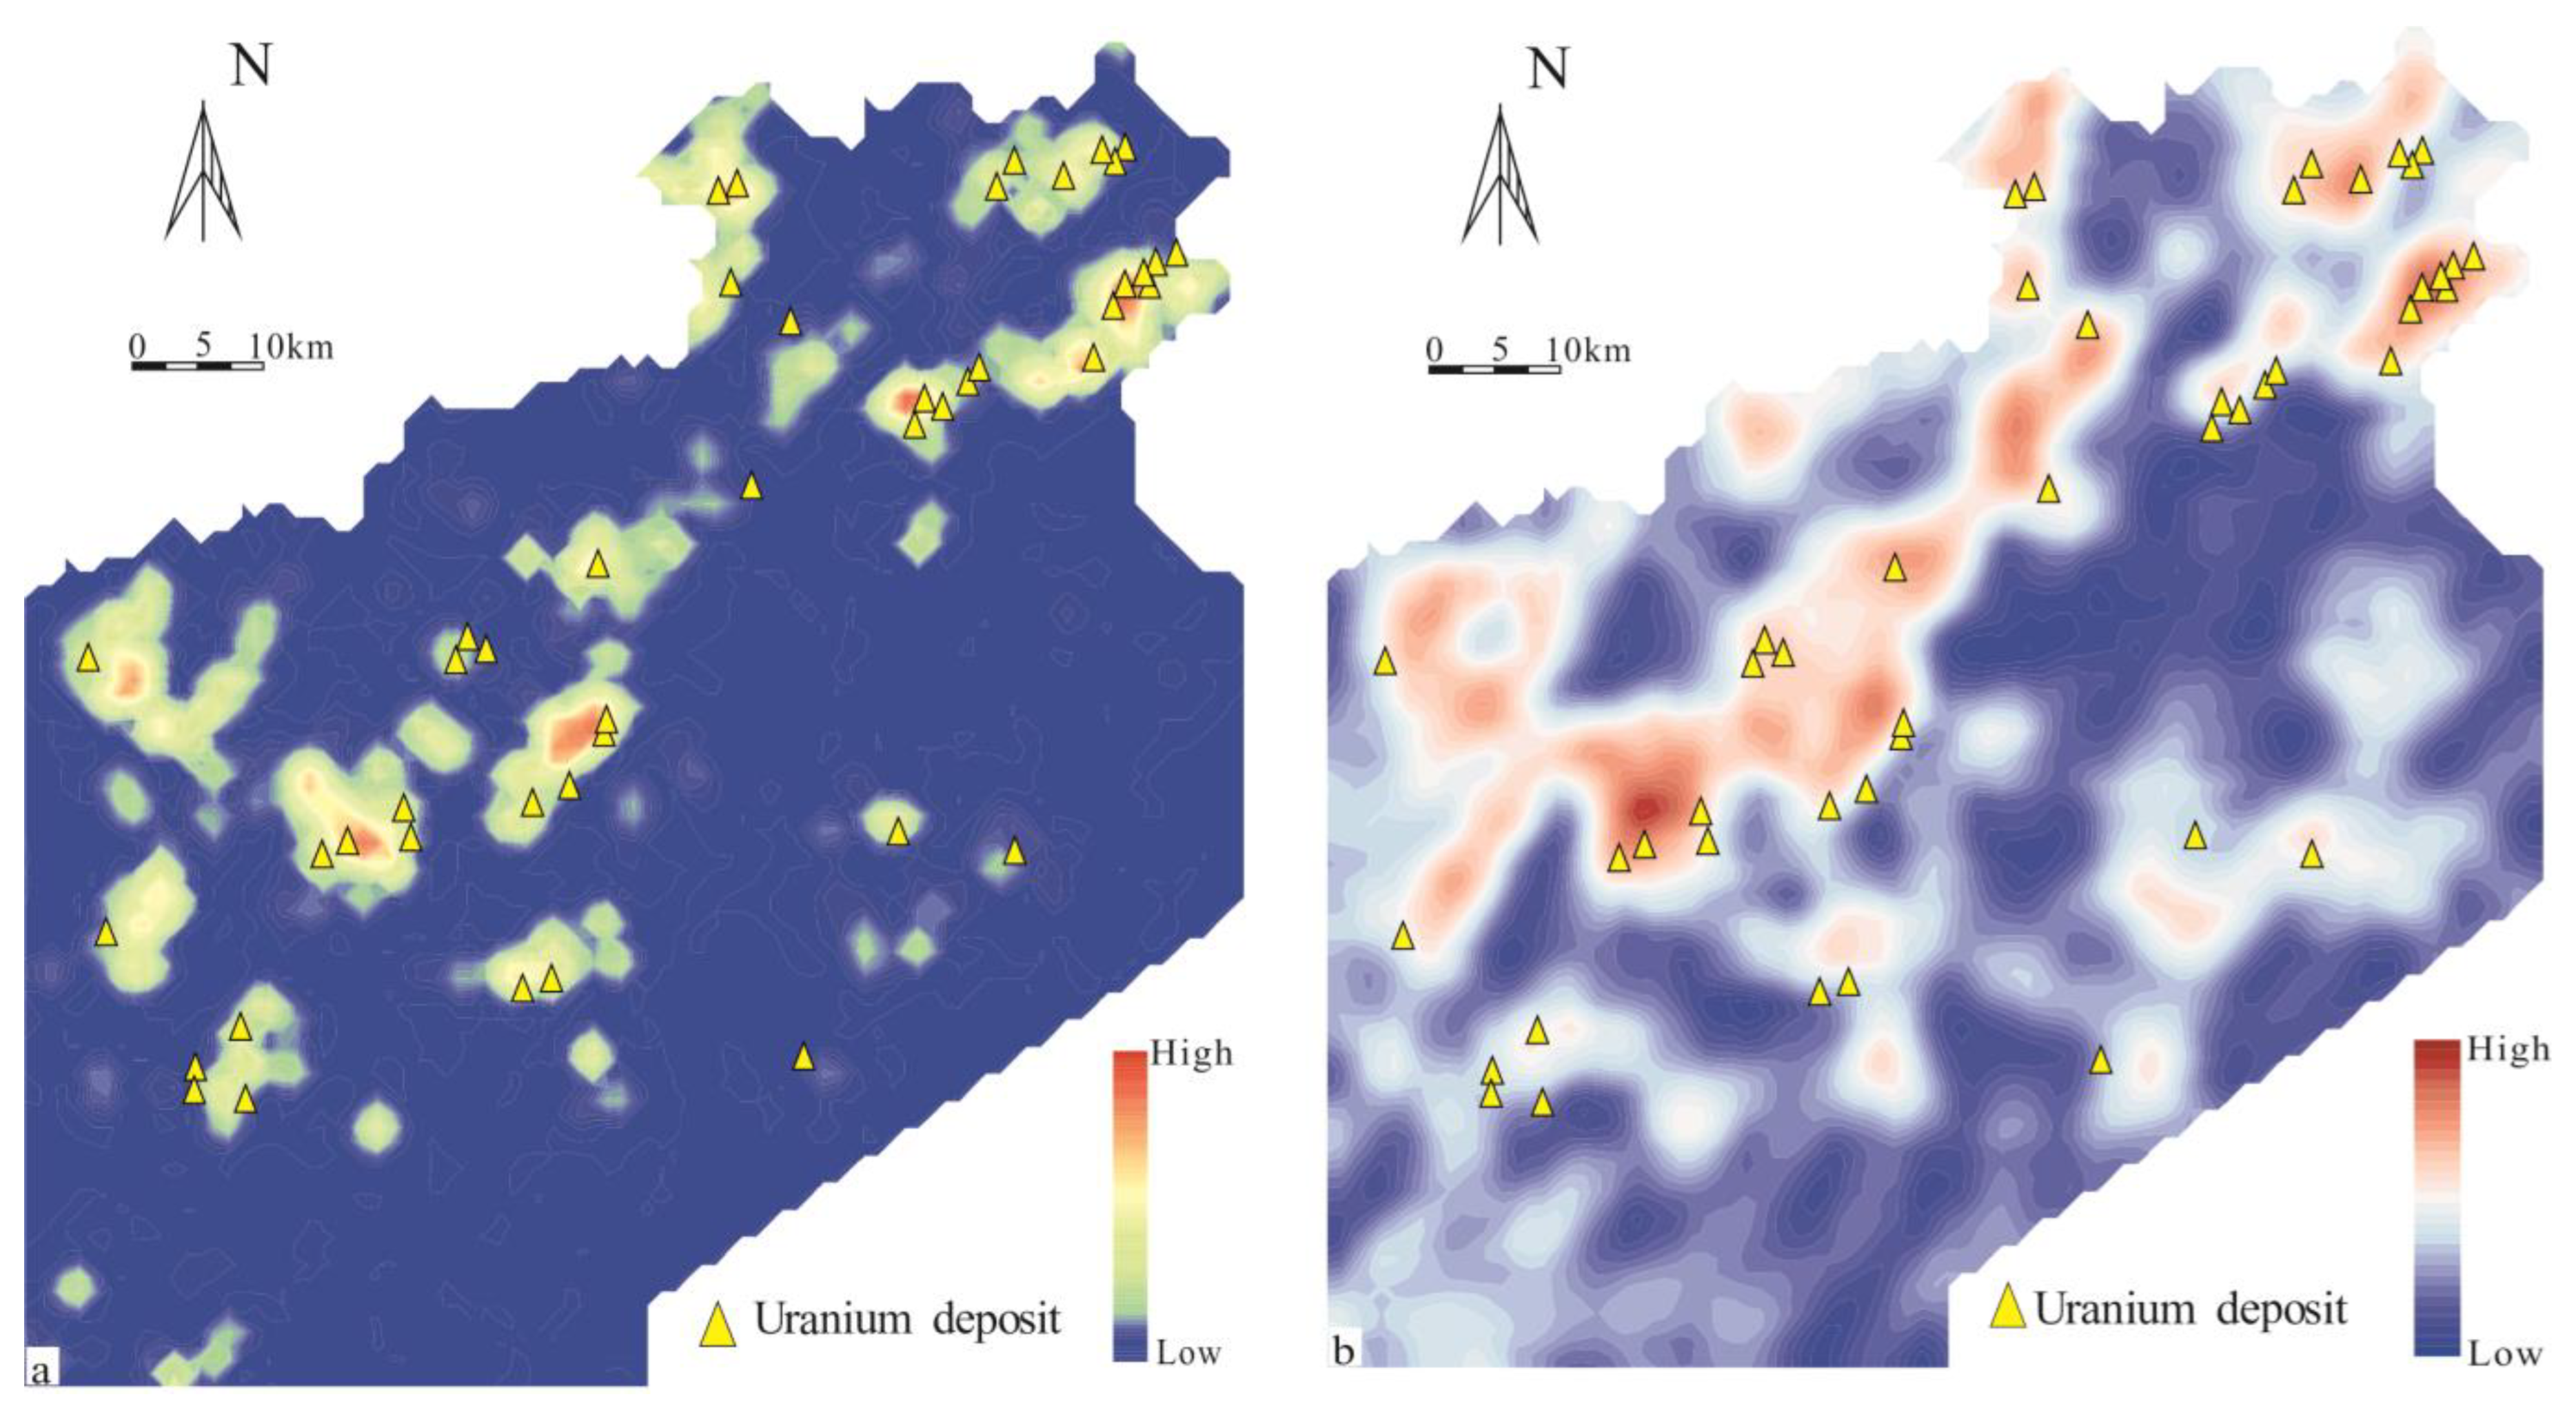
The unit cell size for GIS-based prospectivity analysis depends on the size of the deposits and the input geological data; 95% of closest point pairs do not fall into the same pixel [31]. We used 1 km × 1 km unit cells in predictive modeling. The WofE and LR models were implemented in a GIS environment. In this work, conditional independence was not tested in the WofE model. Although various conditional independence tests containing the pairwise χ2 test and the “omnibus” test have been suggested [32], it is unrealistic to assume independence of evidence layers because of the internal spatial and genetic relationships among different geological features. The posterior probabilities can be interpreted as relative estimations for mineralization [25,33]. Table 4 shows the weighting coefficients and contrast of the WofE model, while Table 5 shows the regression coefficients and the significance level of the independent variables. The outputs of the WofE and LR models were mapped to generate continuous-scale prospectivity maps (Figure 8).
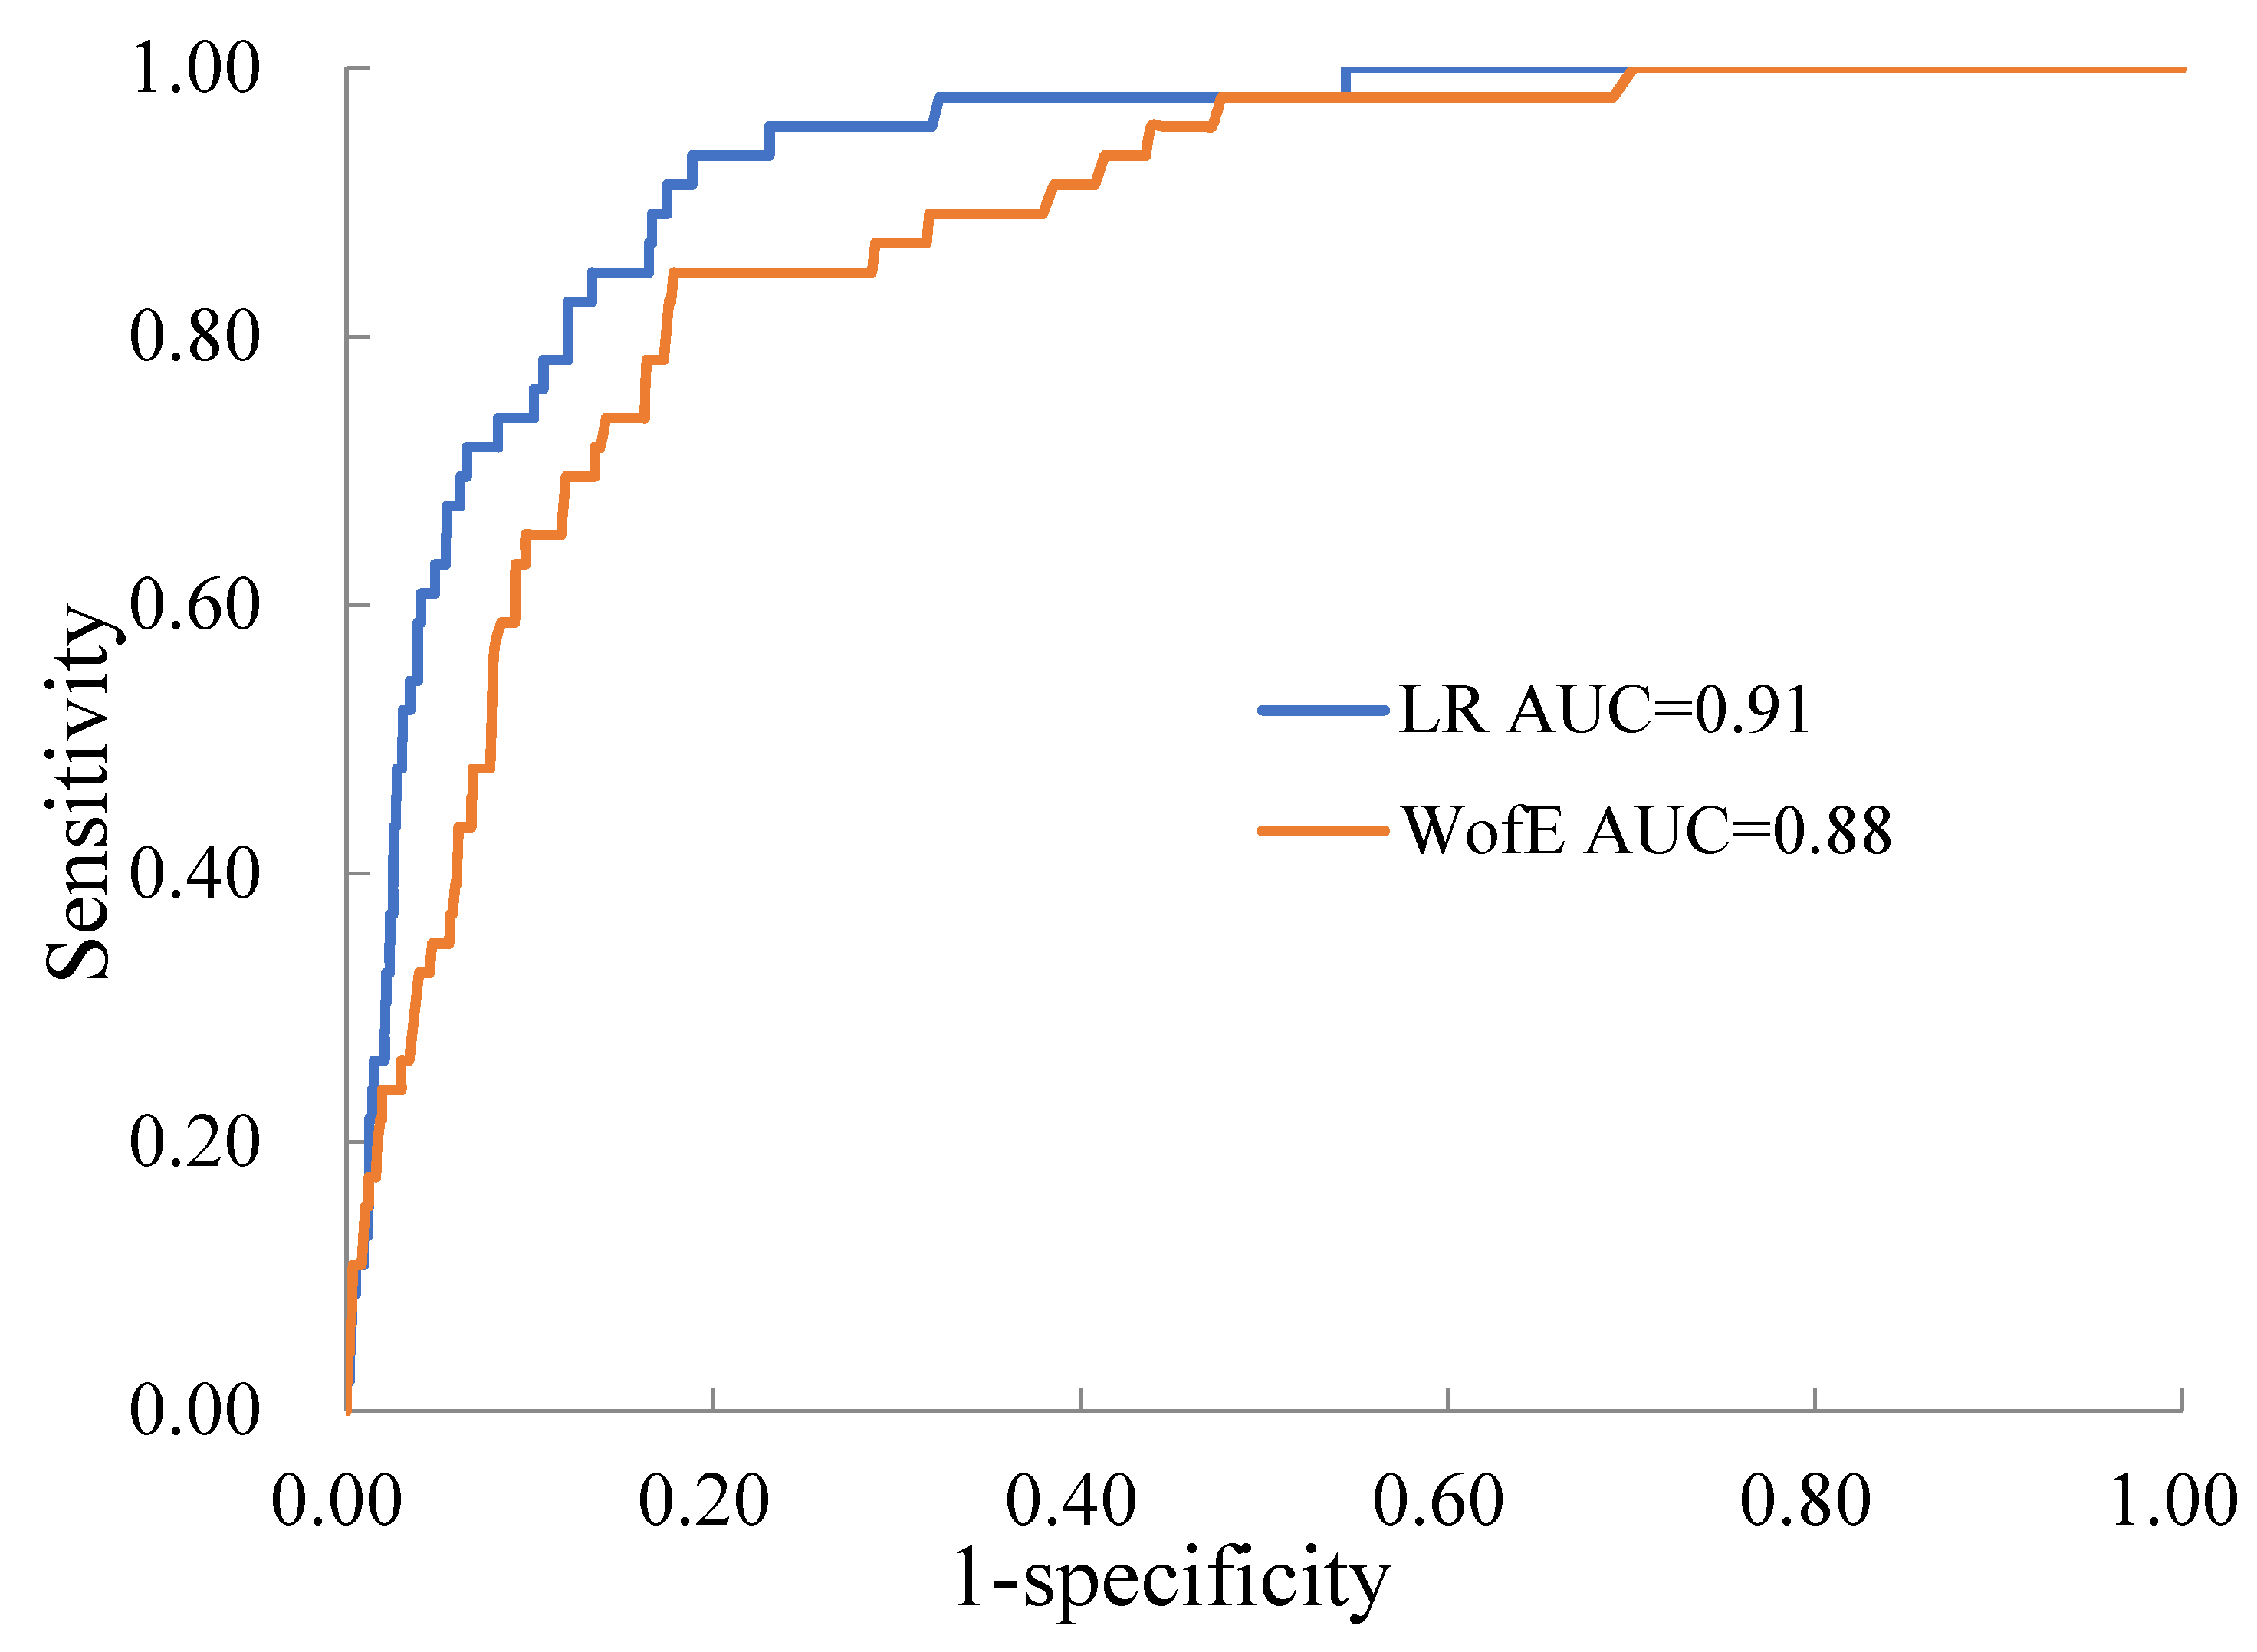
To test the performances of the WofE model and LR, ROC curves were addressed in this study. Applying the ROC curve to the prospectivity modeling test contains four parameters: (1) true positive (Tp) presenting the known uranium occurrences occupied prospective zones, (2) false negative (Fn) presenting the known uranium occurrences occupied non-prospect zones, (3) false positive (Fp) presenting the no known uranium occurrences occupied prospective zones, and (4) true negative (Tn) presenting the no known uranium occurrences occupied non-prospect zones. Then, the true positive rate (TPR) and false positive rate (FPR) can be calculated by TPR = Tp/(Tp + Fn) and FPR = Fp/(Fp + Tn). ROC graphs can then be constructed by the paired data of TPR, FPR obtained using a series of thresholds to classify the prospectivity pattern. These are also known as sensitivity (TPR) and specificity (1-FPR). The AUC, the area under the ROC curve, is a quantitative index to measure the performance of classifiers. The value of the AUC ranges from 0 to 1.0, and the larger the AUC, the better the performance. Figure 9 shows the results of ROC according to different probability threshold values of mineral prospectivity. The AUC values of WofE and LR are 0.88 and 0.91, respectively, showing that both of the models are capable of prospectivity mapping for U mineralization. The prediction accuracy of the LR model is greater than that of WofE. LR provides unbiased estimates of the posterior probability of mineral deposits because of its ability to accommodate conditional dependencies in the input datasets [23]. The most important variables are Nanyuan Formation, followed by linear structure density and NE-striking faults. It should be noted that although the contrast of WofE and regression coefficient of LR for the granite is far smaller than others, we have not abandoned it because the granite provides a uranium source proven by geologists despite the somewhat inconsistent spatial distribution to known uranium deposits [24].
6. Conclusions
In this study, the weight of evidence and logistic regression models are implemented for regional-scale prospectivity modeling of volcanic-type uranium mineralization. Mineral prospectivity maps showed that they could highly predict accuracy, indicating capability for mapping uranium mineral prospectivity. The logistic regression model performs better than the weight of evidence model in predicting the known mineral deposits in this area. GIS-based modeling techniques provide effective approaches to delineate prospective target areas on a regional scale based on multi-sources exploration datasets. These predictive maps can provide useful information for further exploration.
Author Contributions
Conceptualization, J.Z. and Y.S.; methodology, J.Z.; validation, J.Z., Y.S., Z.Z. and M.Z.; data curation, J.Z. and Y.S.; writing—original draft preparation, J.Z.; writing—review and editing, J.Z. and Y.S. All authors have read and agreed to the published version of the manuscript.
Funding
This research was supported by the Key Laboratory of Strategic Mineral Resources of the Upper Yellow River, Ministry of Natural Resources (YSMRKF202205).
Data Availability Statement
Not applicable.
Conflicts of Interest
The authors declare no conflict of interest.
References
- Wang, D. Research significance of key minerals, determination of mineral types, resource attributes, ore prospecting progress, existing problems and main research directions. J. Geol. 2019, 93, 1189–1209. (In Chinese) [Google Scholar]
- Castor, S.B.; Henry, C.D. Geology, geochemistry, and origin of volcanic rock-hosted uranium deposits in northwestern Nevada and southeastern Oregon, USA. Ore Geol. Rev. 2000, 16, 1–40. [Google Scholar] [CrossRef]
- Cuney, M.; Kyser, K. Recent and not-so-recent developments in uranium deposits and implications for exploration. Mineral. Assoc. Can. Short Course Ser. 2008, 39, 1–257. [Google Scholar]
- Cai, Y.; Zhang, J.; Li, Z.; Guo, Q.; Song, J.; Fan, H.; Liu, W.; Qi, F.; Zhang, M. Summary of characteristics of uranium resources and metallogenic regularities in China. Acta Geol. Sin. 2015, 89, 1051–1069, (In Chinese with English Abstract). [Google Scholar]
- Guo, F.; Li, Z.; Deng, T.; Qu, M.; Zhou, W. Key factors controlling volcanic-related uranium mineralization in the Xiangshan Basin, Jiangxi Province, South China: A review. Ore Geol. Rev. 2020, 122, 103517. [Google Scholar] [CrossRef]
- Nash, J. Volcanogenic Uranium Deposits—Geology, Geochemical Processes, and Criteria for Resource Assessment: U.S. Geological Survey Open-File Report 2010–1001; US Geological Survey: Denver, CO, USA, 2010; 99p. [Google Scholar]
- Zhang, L.; Li, X.; Wang, G. Basic characteristics, research progress, and prospects of volcanic rock type uranium deposits. Acta Petrol. Sin. 2020, 36, 575–588. (In Chinese) [Google Scholar]
- Bonham-Carter, G.F. Geographic Information Systems for Geoscientists: Modeling with GIS, Computer Methods in the Geosciences 13; Pergamon Press: Oxford, UK, 1994; p. 398. [Google Scholar]
- Roshanravan, B. Translating a mineral systems model into continuous and datadriven targeting models: An example from the Dolatabad Chromite District, Southeastern Iran. J. Geochem. Explor. 2020, 215, 106556. [Google Scholar] [CrossRef]
- Carranza, E.J.M.; Laborte, A.G. Data-driven predictive mapping of gold prospectivity, Baguio district, Philippines: Application of Random Forests algorithm. Ore Geol. Rev. 2015, 71, 777–787. [Google Scholar] [CrossRef]
- Zuo, R.; Carranza, E.M.J. Support vector machine: A tool for mapping mineral prospectivity. Comput. Geosci. 2011, 37, 1967–1975. [Google Scholar] [CrossRef]
- Roshanravan, B.; Aghajani, H.; Youseff, M.; Kreuzer, O. An improved prediction area plot for prospectivity analysis of mineral deposits. Nat. Resour. Res. 2019, 28, 1089–1105. [Google Scholar] [CrossRef]
- Roshanravan, B.; Kreuzer, O.P.; Bruce, M.; Davis, J.; Briggs, M. Modelling gold potential in the Granites-Tanami Orogen, NT, Australia: A comparative study using continuous and data-driven techniques. Ore Geol. Rev. 2020, 125, 103661. [Google Scholar] [CrossRef]
- Roshanravan, B.; Kreuzer, O.P.; Buckingham, A.; Keykhay-Hosseinpoor, M.; Keys, E. Mineral potential modelling of orogenic gold systems in the granites-tanami Orogen, Northern Territory, Australia: A multi-technique approach. Ore Geol. Rev. 2023, 152, 105224. [Google Scholar] [CrossRef]
- Harris, J.R.; Grunsky, E.; Behnia, P.; Corrigan, D. Data-and knowledge-driven mineral prospectivity maps for Canada’s North. Ore Geol. Rev. 2015, 71, 788–803. [Google Scholar] [CrossRef]
- Ford, A.; Miller, J.M.; Mol, A.G. A comparative analysis of weights of evidence, evidential belief functions, and fuzzy logic for mineral potential mapping using incomplete data at the scale of investigation. Nat. Resour. Res. 2016, 25, 19–33. [Google Scholar] [CrossRef]
- Lisitsin, V.A.; Porwal, A.; Mccuaig, T.C. Probabilistic Fuzzy Logic Modeling: Quantifying Uncertainty of Mineral Prospectivity Models Using Monte Carlo Simulations. Math. Geosci. 2014, 46, 747–769. [Google Scholar] [CrossRef]
- Carranza, E.J.M. Weights of Evidence Modeling of Mineral Potential: A Case Study Using Small Number of Prospects, Abra, Philippines. Nat. Resour. Res. 2004, 13, 173–187. [Google Scholar] [CrossRef]
- Wan, Y.; Liu, D.; Wilde, S. Evolution of the Yunkai Terrane, South China: Evidence from SHRIMP zircon U–Pb dating, geochemistry and Nd isotope. J. Asian Earth Sci. 2010, 37, 140–153. [Google Scholar] [CrossRef]
- Zhou, M. Geological characteristics and prospecting prospects of the Maoyangtou uranium deposit in Pucheng, Fujian. Fujian Geol. 2010, 29, 8–16. (In Chinese) [Google Scholar]
- Nie, G.; Yin, L.; Wang, X.; Liu, L. Formation Conditions and Tectonic Environment of Mesozoic Uranium and Polymetallic Deposits in Pucheng, Fujian Province. J. East China Univ. Technol. 1994, 2, 106–116. (In Chinese) [Google Scholar]
- Lu, W.; Wang, Y. Isotope geochemistry of 570 uranium deposit, Fujian. J. Chengdu Univ. Technol. 1990, 17, 85–93. (In Chinese) [Google Scholar]
- Chen, D. Ore-controlling factors and genesis of Maoyangtou volcanic U. (Ag, Mo) deposit. Miner. Depos. 1997, 16, 44–55. (In Chinese) [Google Scholar]
- Zhao, J.; Chen, S.; Zuo, R.; Zhou, M. Controls on and prospectivity mapping of volcanic-type uranium mineralization in the Pucheng district, NW Fujian, China. Ore Geol. Rev. 2019, 112, 103028. [Google Scholar] [CrossRef]
- Porwal, A.; IGonzález-Álvarez Markwitz, V.; Mccuaig, T.C.; Mamuse, A. Weights-of-evidence and logistic regression modeling of magmatic nickel sulfide prospectivity in the Yilgarn craton, western Australia. Ore Geol. Rev. 2010, 38, 184–196. [Google Scholar] [CrossRef]
- Yilmaz, I. Landslide susceptibility mapping using frequency ratio, logistic regression, artificial neural networks and their comparison: A case study from Kat landslides (Tokat—Turkey). Comput. Geosci. 2009, 35, 1125–1138. [Google Scholar] [CrossRef]
- Rowan, S.; Hook, M.; Abrams Mars, J. Mapping hydrothermally altered rocks at Cuprite, Nevada using the Advanced Spaceborne Thermal Emissivity and Reflection Radiometer ASTER. A New Satell. Imaging Syst. Econ. Geol. 2003, 98, 1019–1027. [Google Scholar]
- Porwal, A.; Das, R.D.; Chaudhary, B.; Gonzalez-Alvarez, I.; Kreuzer, O. Fuzzy inference systems for prospectivity modeling of mineral systems and a case-study for prospectivity mapping of surficial Uranium in Yeelirrie Area, Western Australia. Ore Geol. Rev. 2015, 71, 839–852. [Google Scholar] [CrossRef]
- IAEA. Descriptive Uranium Deposit and Mineral System Models; Non-Serial Publications: Vienna, Austria, 2020; p. 313. [Google Scholar]
- McCuaig, T.C.; Beresford, S.; Hronsky, J. Translating the mineral systems approach into an effective exploration targeting system. Ore Geol. Rev. 2010, 38, 128–138. [Google Scholar] [CrossRef]
- Hengl, T. Finding the right pixel size. Comput. Geosci. 2006, 32, 1283–1298. [Google Scholar] [CrossRef]
- Agterberg, F.P. Combining indicator patterns in weights of evidence modeling for resource evaluation. Nonrenew. Resour. 1992, 1, 39–50. [Google Scholar] [CrossRef]
- Wang, C.; Rao, J.; Chen, J.; Ouyang, Y.; Qi, S.; Li, Q. Prospectivity mapping for “Zhuxi-type” copper-tungsten polymetallic deposits in the Jingdezhen region of Jiangxi province, South China. Ore Geol. Rev. 2017, 89, 1–14. [Google Scholar] [CrossRef]
Figure 1.
Simplified geological map of the Pucheng district.

Figure 2.
Sectional view of the Maoyangtou deposit [20].
Figure 2.
Sectional view of the Maoyangtou deposit [20].

Figure 3.
Uranium source map comprising the Nanyuan formation and granite.

Figure 4.
Anomaly maps of (a) lengths and (b) intersections.

Figure 5.
Buffer maps of (a) NE-striking faults and (b) NW-striking faults.

Figure 6.
Alteration anomaly map of (a) iron-oxide-bearing minerals and (b) hydroxyl-bearing minerals.
Figure 6.
Alteration anomaly map of (a) iron-oxide-bearing minerals and (b) hydroxyl-bearing minerals.

Figure 7.
Anomaly maps of (a) airborne radioactive U and (b) airborne radioactive gamma.

Figure 8.
Probability map obtained by (a) WofE and (b) LR.

Figure 9.
The ROC curves of WofE and LR.


Table 1.
Stratigraphic column of the strata in the Pucheng area.
| Lithostratigraphic Unit (Code) | Lithological Description | Thickness (m) | |
|---|---|---|---|
| Quaternary (Q) | Eluvium, Deluvium, Alluvium. | 0~20 | |
| Akaishi Group (K2ch) | Gray-purple thick-layer conglomerate. | 313~2015 | |
| Shaxian Formation (K2s) | Purple-red thick-layer siltstone interbedded with tuffaceous sandstone. | 144~1160 | |
| Shimaoshan Group (K1sh) | The second member: tuff, tuffaceous sandstone interbedded with basalt. The first member: red thick-layer conglomerate. | 182~1265 | |
| Bantou Formation (J3b) | The second member: tuff, tuff lava, rhyolite interbedded with tuffaceous and siltstone; the first member: gray feldspar quartz sandstone, shale, conglomerate, tuffaceous sandstone. | 336~1774 | |
| Nanyuan Formation (J3n) | The third member: porphyroclastic lava, rhyolite; the second member: tuff, tuff lava, rhyolite interbedded with tuff and tuffaceous sandstone; The first member: siltstone, tuffaceous sandstone. | >5576 | |
| Changlin Formation (J3c) | Tuff and tuffaceous sandstone. | 644~1774 | |
| Lishan Formation (J1l) | Grey medium coarse grain siltstones, interbedded with sandstone. | 33~1524 | |
| Jiaokeng Formation (T3j) | Carbonaceous siltstone, coal seam; feldspar quartz sandstone. | 58~508 | |
| Mamianshan Group | Longbeixi Formation (Pt2l) | Marble, schist and granulite. | >2117 |
| Dongyan Formation (Pt2dn) | Green schist, plagioclasite amphibolite interbedded with marble lens. | >2760 | |
| Mayuan Group | Nanshan Formation (Pt1n) | Granulite interbedded with schist, plagioclase amphibolite. | 1681~3498 |
| Dajinshan Formation (Pt1d) | Crystalline graphite-bearing granulite and schist interbedded with amphibolite, occasionally marble lens. | >3300 | |
| Tianjingping Formation (Ar2t) | Biotite plagioclase granulite interbedded with amphibolite schist. | >732 | |
Table 2.
Results of PCA of bands sets, comprising 1, 2, 3 and 4.
| Band 1 | Band 2 | Band 3 | Band 4 | |
|---|---|---|---|---|
| PC1 | 0.34 | 0.38 | 0.68 | 0.52 |
| PC2 | 0.41 | 0.62 | −0.65 | 0.14 |
| PC3 | −0.33 | −0.30 | −0.31 | 0.84 |
| PC4 | 0.78 | −0.62 | −0.08 | 0.06 |
Table 3.
Results of PCA of bands sets, comprising 1, 3, 4 and 6.
| Band 1 | Band 3 | Band 4 | Band 6 | |
|---|---|---|---|---|
| PC1 | −0.32 | −0.71 | −0.53 | −0.34 |
| PC2 | −0.46 | 0.68 | −0.34 | −0.46 |
| PC3 | 0.81 | 0.13 | −0.51 | −0.24 |
| PC4 | 0.16 | 0.13 | 0.58 | −0.79 |
Table 4.
Predictive model for WofE prospectivity modeling.
| Targeting Criteria | Evidence Layer | W+ | W− | C |
|---|---|---|---|---|
| Sources | F1: uranium-rich Nanyuan Formation | 1.24 | −1.92 | 3.16 |
| F2: uranium-rich granite | 0.11 | −0.13 | 0.24 | |
| Pathways | F3: NE-striking faults | 0.42 | −1.53 | 1.95 |
| F4: NW-striking faults | 0.72 | −0.91 | 1.63 | |
| Traps | F5: Linear structures intersection | 2.13 | −0.08 | 2.23 |
| F6: Linear structures density | 0.66 | −0.56 | 1.22 | |
| Deposition and preservation | F7: Airborne radioactive gamma | 0.92 | −0.66 | 1.58 |
| F8: Airborne radioactive U | 0.62 | −0.22 | 0.84 | |
| F9: Iron-stained alteration | 1.35 | −0.21 | 1.56 | |
| F10: Hydroxyl alteration | 0.93 | −0.12 | 1.05 |
Table 5.
Predictive model for LR prospectivity modeling.
| Variable | b | Standard Deviation | Wald’s Statistics | Significance Level |
|---|---|---|---|---|
| Nanyuan Formation | 2.401 | 0.428 | 31.414 | 0.000 |
| Granite | 0.502 | 0.734 | 0.467 | 0.495 |
| Radioactive U | 1.287 | 0.666 | 3.731 | 0.053 |
| Radioactive gamma | 1.914 | 0.552 | 12.049 | 0.001 |
| Iron alteration | 0.861 | 0.59 | 2.131 | 0.144 |
| Hydroxyl alteration | −1.251 | 0.671 | 3.477 | 0.062 |
| Structures density | 0.865 | 0.332 | 6.807 | 0.009 |
| Structures intersection | 0.564 | 0.377 | 2.238 | 0.135 |
| NE-striking fault | 2.004 | 0.45 | 19.795 | 0.002 |
| NW-striking fault | 1.746 | 0.363 | 23.169 | 0.010 |
| Constant | −8.49 | 0.548 | 239.803 | 0.350 |
Disclaimer/Publisher’s Note: The statements, opinions and data contained in all publications are solely those of the individual author(s) and contributor(s) and not of MDPI and/or the editor(s). MDPI and/or the editor(s) disclaim responsibility for any injury to people or property resulting from any ideas, methods, instructions or products referred to in the content. |
© 2023 by the authors. Licensee MDPI, Basel, Switzerland. This article is an open access article distributed under the terms and conditions of the Creative Commons Attribution (CC BY) license (https://creativecommons.org/licenses/by/4.0/).
Share and Cite
MDPI and ACS Style
Zhao, J.; Sui, Y.; Zhang, Z.; Zhou, M. Application of Logistic Regression and Weights of Evidence Methods for Mapping Volcanic-Type Uranium Prospectivity. Minerals 2023, 13, 608. https://doi.org/10.3390/min13050608
AMA Style
Zhao J, Sui Y, Zhang Z, Zhou M. Application of Logistic Regression and Weights of Evidence Methods for Mapping Volcanic-Type Uranium Prospectivity. Minerals. 2023; 13(5):608. https://doi.org/10.3390/min13050608
Chicago/Turabian StyleZhao, Jiangnan, Yu Sui, Zongyao Zhang, and Mi Zhou. 2023. "Application of Logistic Regression and Weights of Evidence Methods for Mapping Volcanic-Type Uranium Prospectivity" Minerals 13, no. 5: 608. https://doi.org/10.3390/min13050608
Note that from the first issue of 2016, this journal uses article numbers instead of page numbers. See further details here.