Article

Controls on the Generation and Geochemistry of Neutral Mine Drainage: Evidence from Force Crag Mine, Cumbria, UK

1
School of Engineering, Newcastle University, Newcastle upon Tyne NE1 7RU, UK
2
Discipline of Ecology and Environment, La Trobe University, Melbourne 3086, Australia
*
Author to whom correspondence should be addressed.
Minerals 2023, 13(5), 592; https://doi.org/10.3390/min13050592
Submission received: 27 March 2023 / Revised: 14 April 2023 / Accepted: 22 April 2023 / Published: 25 April 2023
(This article belongs to the Special Issue Environmental Pollution and Assessment in Mining Areas)

Abstract

:
Neutral mine drainage (NMD) at Force Crag mine in north-west England has a circumneutral pH and high levels of Zn contamination. A long-term geochemical and hydrological dataset from this site was analysed using a novel molar mass balance approach, which demonstrated that the water chemistry is dominated by species released by the oxidation of sulphides: sphalerite (Zn, Cd, Ni), galena (Pb, mostly removed by adsorption to ferrihydrite) and pyrite (Fe, mostly precipitates as ferrihydrite). The calculations show that the sphalerite:galena:pyrite oxidation ratio is ~1:2:1, but the mine water chemistry is dominated by Zn due to the removal of Pb and Fe by adsorption/precipitation. The acidity released by pyrite oxidation is neutralised by the dissolution of calcite and, to a lesser extent, chlorite. The presence of pyrite is responsible both for the release of acidity and the removal of some contaminant metals by adsorption on ferrihydrite. The concentrations of sulphate, Zn, Cd and Ni in the mine water decrease with increasing flow due to dilution; modest increases in metal flux with flow probably reflect increased oxidation due to greater amounts of oxygenated water flowing through the mine. In contrast, Al, Pb and Cu concentrations are positively correlated with flow due to the flushing of these metals adsorbed to ferrihydrite particles. The influence of temperature is relatively subtle; metal fluxes are a balance between abiotic oxidation (which increases at higher temperatures and flows) and bacterially mediated oxidation (which is depressed at high flow rates when temperatures decrease below 10 °C). These conclusions apply to NMD mine water throughout the UK and elsewhere in the world, including mines hosted in both limestone and silicate rocks. The molar mass balance approach, together with synchronous flow and geochemistry data, provides crucial information for effective mine-water-treatment system design by elucidating the critical roles of flow rate and temperature in determining contaminant concentrations and loads.

1. Introduction

Contaminated drainage from metalliferous mines is commonly acidic (acid mine drainage, AMD), but at some mines it has a circumneutral pH (neutral mine drainage, NMD). This is generally due to neutralisation by carbonate (mostly limestone) dissolution [1]. NMD is less common than AMD globally, and because the environmental impacts are not as severe, it has received relatively little attention. Nevertheless, NMD often contains high levels of dissolved metals, frequently Zn. NMD is a widespread problem in many regions around the world [2,3,4,5,6,7], and consequently, it has received international attention with respect to both its evolution and treatment (e.g., [8,9,10]).
NMD is a particular problem in the UK. A total of 260 abandoned mine sites across England and Wales have been confirmed as causing contamination of freshwaters, and a large majority of these have near-neutral pH drainage, with elevated Zn concentrations in particular [11,12,13]. The combined flux of Zn from abandoned base-metal mines across England and Wales is more than 250 t/annum [14], and although the levels of Zn are typically low compared to many examples of AMD, they still have serious environmental impacts [15,16]. Consequently, there is an ongoing programme of UK government investment in designing and building treatment systems to remediate these sites wherever possible. Estimates of the cost for remediation of all abandoned metal mine discharges in England and Wales are substantial: over £372 million for system construction and operation for a period of 10 years [11].
One of the first metal-mine water discharges to be remediated in the UK was the main NMD drainage at the Force Crag mine in the Lake District National Park, in north-west England, which was the last working metal mine in the region (finally closed in 1991). The UK Coal Authority built a passive treatment system at Force Crag that was commissioned in March 2014 [13,17]. As part of the remedial programme, detailed monitoring of water quality and hydrology across the site has been carried out, and these data have provided an ideal opportunity to understand in detail the controls on the composition of the NMD issuing from the mine.
The aim of the current work was to elucidate key processes controlling the water quality of the main contaminated discharge emerging from the mine using the 57 months of detailed water quality and hydrology data available. To do so, a novel geochemical mass balance approach was developed, both to quantify subsurface processes at the mine and to assess any evolution of the mine water quality over time. The results of the study can then be applied to understanding the variability in discharge flow and water quality at the Force Crag mine site, as this is crucial for long-term prognoses of the performance of the operational treatment system. This approach can also be used to understand the variability in NMD composition at mines across the UK and elsewhere in the world and to plan remediation at these sites.

2. Materials and Methods
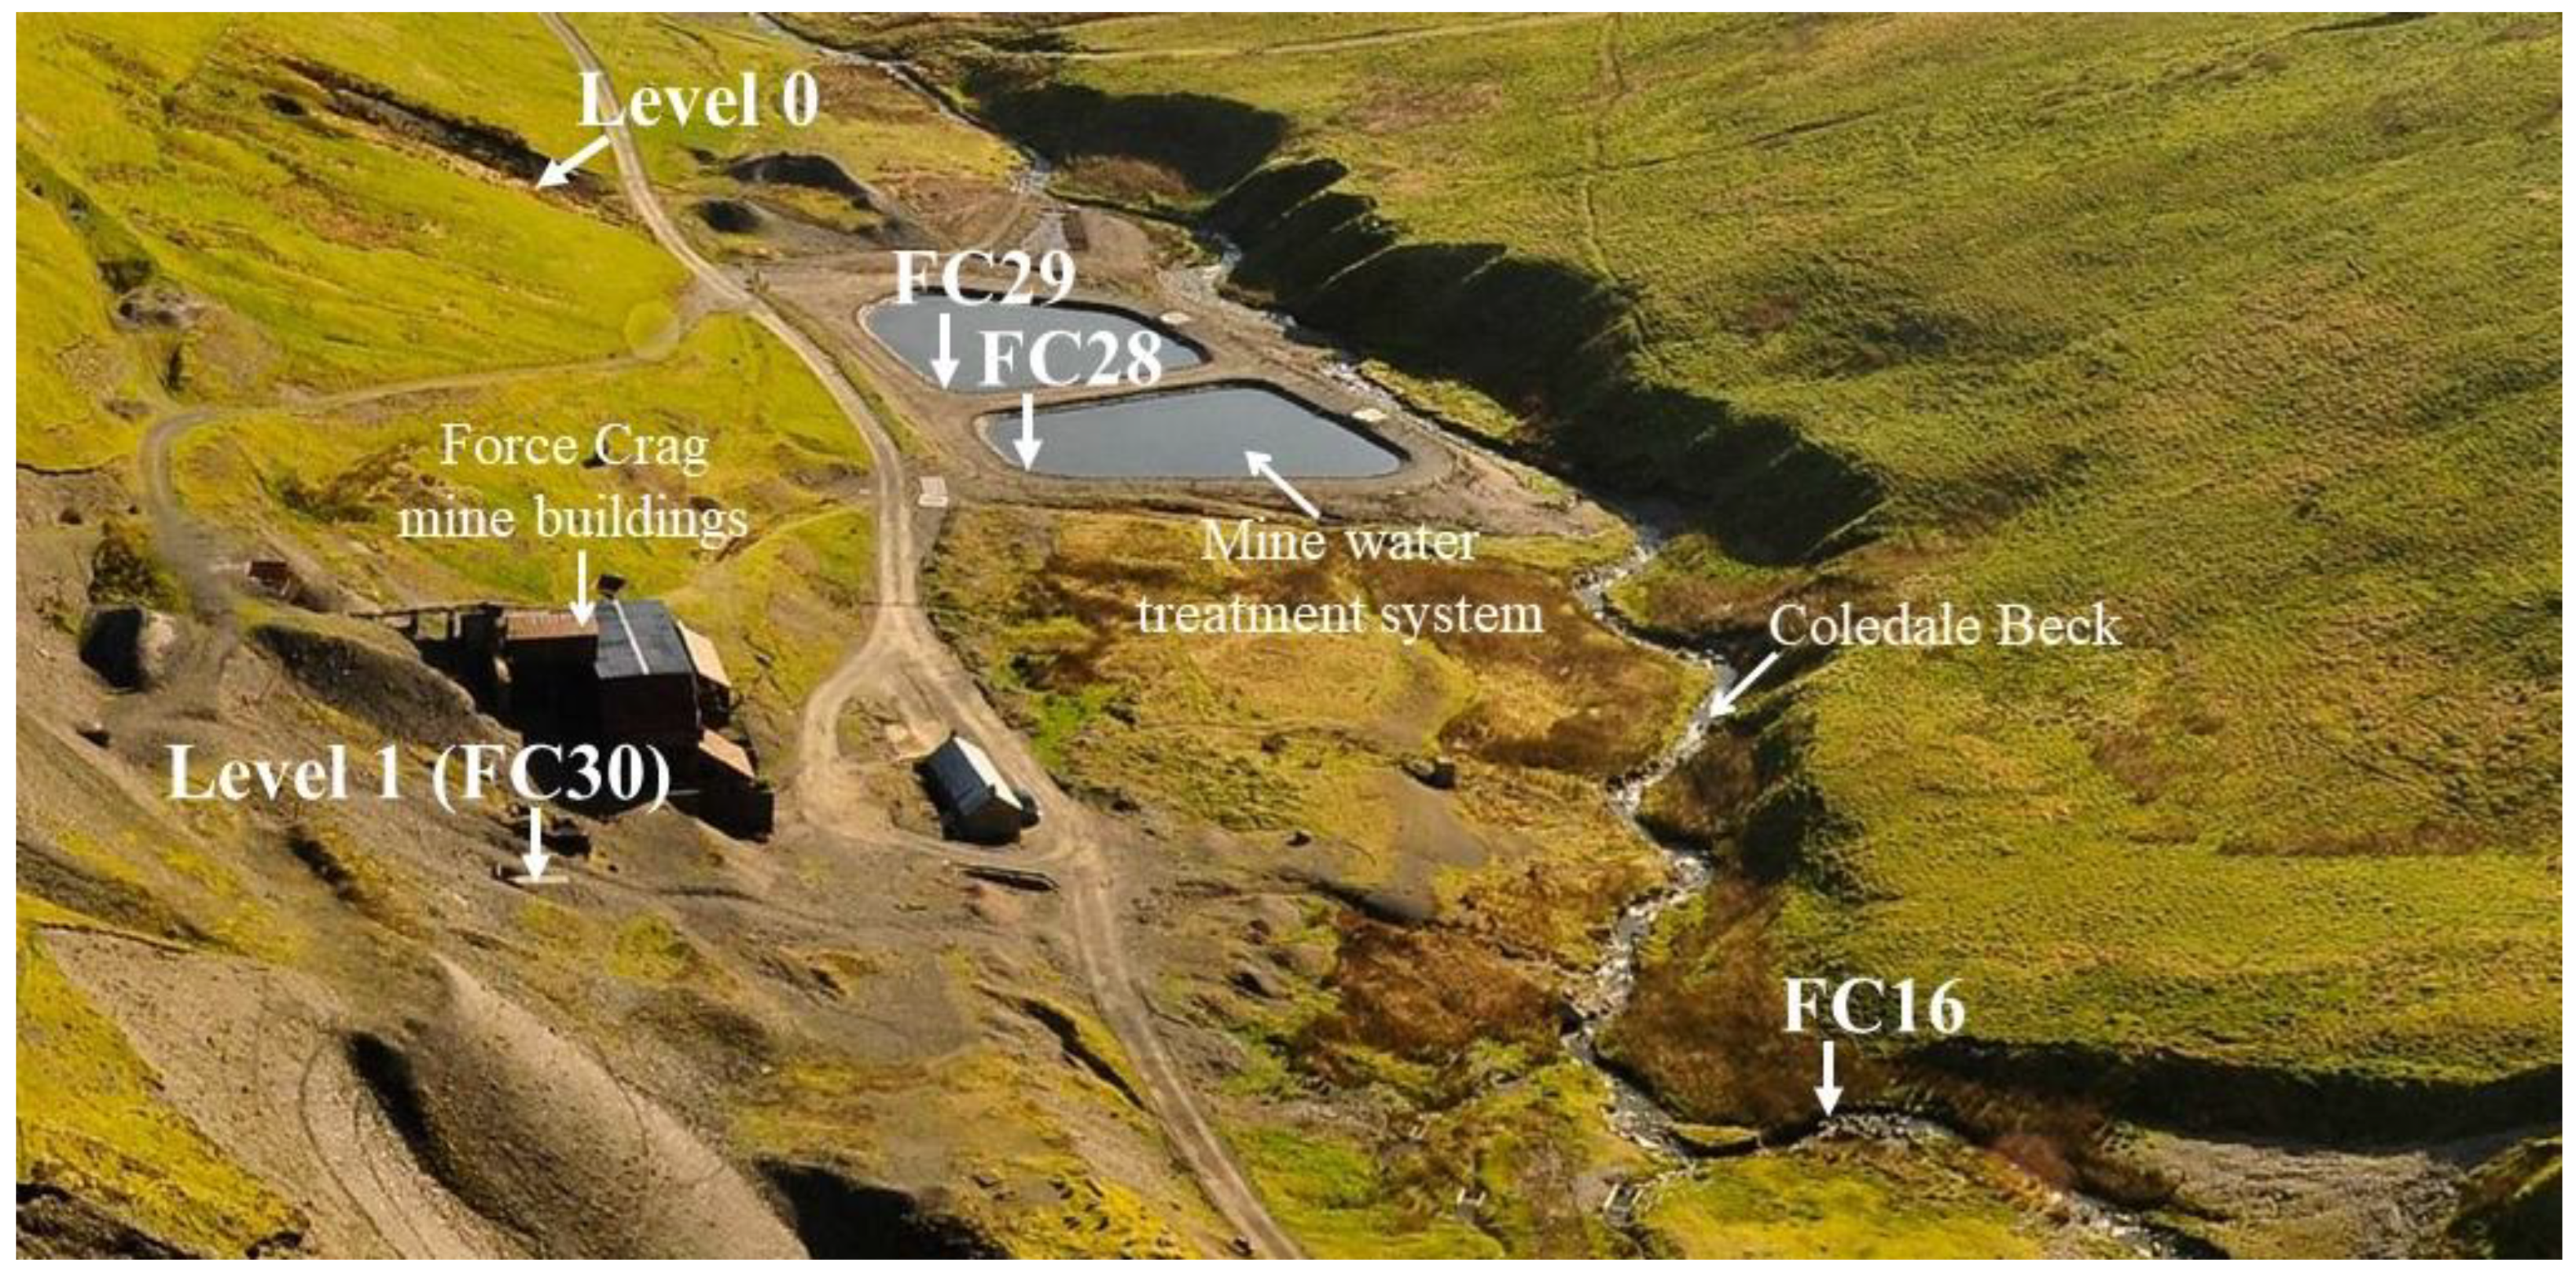
2.1. Study Site

Force Crag mine (Figure 1) is in the Lake District of Cumbria, north-west England, at 54.5835° N 3.2397° W, towards the head of the Coledale Beck valley. Force Crag is the cliff from which the mine takes its name and lies 300 m to the west-south-west of the mine. The Coledale Beck valley is narrow and steep-sided, and the beck (stream) is therefore fast-flowing. A tributary, Pudding Beck, descends the cliffs adjacent to the workings. The valley floor consists of a glacial deposit of yellow boulder clay overlain by peat.
The mineralised vein mined at Force Crag occupies a roughly E-W-trending, steeply dipping fault cutting through slates of the Ordovician Skiddaw Group [18]. The slates are regionally metamorphosed siltstones of turbidite origin and comprise predominantly quartz, K- and Na-rich white micas and chlorite, with relatively little compositional variation [19,20,21].
In the upper part of the Force Crag vein, barite is the main constituent, accompanied by abundant manganese and iron oxides, cerussite and rare malachite [18]. Below this, the vein is composed of massive white quartz, underlain in turn by a zone with abundant sulphides, predominantly sphalerite; galena is less common, and minor barite is present. Pyrite and chalcopyrite occur locally as small crystals in the lower parts of the vein, and siderite is common; dolomite, calcite, ankerite and rare fluorite are also present [18,22,23]. Near the top of the sphalerite and galena-rich part of the vein, supergene Pb, Cu, Ag, Co and Zn minerals have been recorded: erythrite, acanthite, anglesite, brochantite, cerussite (most common), cuprite, langite, lautenthalite, linarite, pyromorphite, serpierite and native silver [24]. Gypsum, melanterite and jarosite occur as post-mining encrustations on the mine walls [24]. Ferric hydroxide (ochre) coatings up to 1.5 m thick line the walls, roof and floor in places [25]. Although this material has not been identified mineralogically, it was probably deposited as ferrihydrite, which is the amorphous ferric hydroxide mineral stable at the pH of the mine water (pH > 5 [26]).
At Force Crag mine, the mineralisation was accessed from a series of levels (adits) numbered from 0 to 7 (from lowest to highest) [27]. Mining extended over a horizontal distance of ≈1.2 km and a vertical extent of ≈350 m. Various operators mined for lead at the site between 1839 and 1865, and then for barite and zinc periodically between 1867 and 1991, when the mine was finally abandoned [27]. More than 60,000 tons of barite, 1248 tons of sphalerite, 624 tons of galena and 20,000 ounces of silver were extracted [28].
Level 1 (FC30) forms the main drain of the mine; some drainage also occurs from Level 0, which is 200 m to the east of Level 1, at an elevation of 20 m below it (Figure 1). Discharge water from the mine contains high levels of zinc, cadmium and lead; consequently, concentrations of all three metals in the Coledale Beck exceed relevant regulatory standards most of the time [13]. Before the passive treatment system commenced operation in 2014, the mine discharge polluted the Coledale Beck for at least 10 km downstream of the mine.

2.2. Water Quality and Hydrology Monitoring

Water samples for the Level 1 mine water discharge were collected at location FC29 (Figure 1), one of the two inlet points to the treatment system (FC28 is the other; Figure 1), rather than at the discharge point (FC30; Figure 1), because evaluation of the treatment system was a key part of the wider programme of work (not reported here). However, the flow rate of the discharge from Level 1 was measured directly at FC30 because some of the water from Level 1 bypasses the treatment system before FC28/29. Flow at FC30 was measured immediately after the collection of water samples at FC29 using a sharp-crested V-notch weir just below the level entrance. There is no difference in water quality between FC30 and FC29 because water is rapidly transported from one location to the other via a 0.315 m diameter buried plastic pipe.
To understand the role of the dissolution of different minerals in the underground workings in governing the quality of water emerging from the mine, it was necessary to know the chemistry of the input water to the mine. This input water could not be directly sampled at Force Crag due to a lack of access; the mine is unstable and unsafe. Coledale Beck runs adjacent to the mine, and Coledale Beck water immediately upstream of the mine (FC16, Figure 1) was regarded as an approximation of input water to the mine (it represents the least polluted water sampled). Therefore, samples were always collected from FC16 and FC29 on the same day.
After the treatment system was commissioned in March 2014, water-quality and flow monitoring was carried out on average every 2 weeks from April 2014 to September 2019, and up to 130 measurements are available from each sample site. A pre-calibrated Myron L 6P Ultrameter recorded measurements of water temperature, pH, oxidation−reduction potential (ORP) and electrical conductivity during site visits. Total alkalinity was measured with a Hach digital titrator using 0.16 N sulfuric acid and bromcresol-green methyl-red indicator. The collection of water samples was performed in sterile 30 mL polypropylene bottles. Three aliquots were collected for total cations and filtered cations and anions; filtration was carried out using 0.45 μm cellulose nitrate filter paper. Cation samples were acidified with 2% v/v concentrated nitric acid and 1% v/v concentrated hydrochloric acid.
Filtered ion concentrations are often referred to as “dissolved” concentrations, but we use the term “filtered” or “aqueous-phase” rather than “dissolved” because the filtered aliquot may contain colloids <0.45 µm in diameter (colloids are from 1 nm to 1 µm across [29]). Only larger colloids (>0.45 µm) were retained by the filter. “Particulate” concentrations were calculated by subtracting the filtered concentration from the total concentration, albeit this does not include any particulates <0.45 µm in diameter. The great majority of unfiltered samples did not contain particles visible to the naked eye, so the particulates present were very small. Nevertheless, the quantitative distinction between particulate and filterable cation concentrations provides useful insights into the hydrogeochemical behaviour of metals.
All samples were stored at 4 °C prior to laboratory analysis. Cation concentrations were determined using a Varian Vista-MPX Inductively Coupled Plasma-Optical Emission Spectrometer (ICP-OES) or an Agilent Technologies 7700 Series Inductively Coupled Plasma-Mass Spectrometer (ICP-MS). Anion concentrations were measured with a Dionex DX320 Ion Chromatograph (IC). Additional details of sampling and analytical methods are provided elsewhere [13,30], but, in brief, calibration standards were made using certified standards (1000 ppm; accuracy of ≤±1.0%; VWR Chemicals) and deionised water (Elga Purelab Ultra 18.2 MΩ at 25.8 °C). Analytical accuracy and precision were checked for every 10 samples using blanks (deionised water) and standards. Triplicate samples were collected periodically as part of a wider QA/QC programme. Mann–Whitney U tests indicated no significant differences (p > 0.1) between metals and SO4 concentrations in replicates. The reliability of sample analysis (for FC16 and FC29) was also tested using charge balance calculations. In the majority of cases (>65% for FC16 (n = 34) and >70% for FC29 (n = 132)), electro-neutrality was within ±5%, and in more than 90% of cases within ±10% for FC16 and within ±10% in all cases for FC29. For FC16, the very low ion content of the water (electrical conductivity of <40 μS/cm) means that the charge balance is very sensitive to even minor analytical errors [30].
Geochemical modelling using the PhreeqC software was used to calculate saturation indices (SI = log (activity product/Keq)) for minerals that could be precipitating from the mine water. Minitab v21.2 was used for statistical analysis. For the calculation of correlation coefficients, the non-parametric Spearman’s Rho coefficient was used in all cases since data for many variables are non-normally distributed. Because of the covariance of the key variables (flow rate, temperature and water quality), partial correlation coefficients were calculated in Minitab for selected data.

3. Results and Discussion

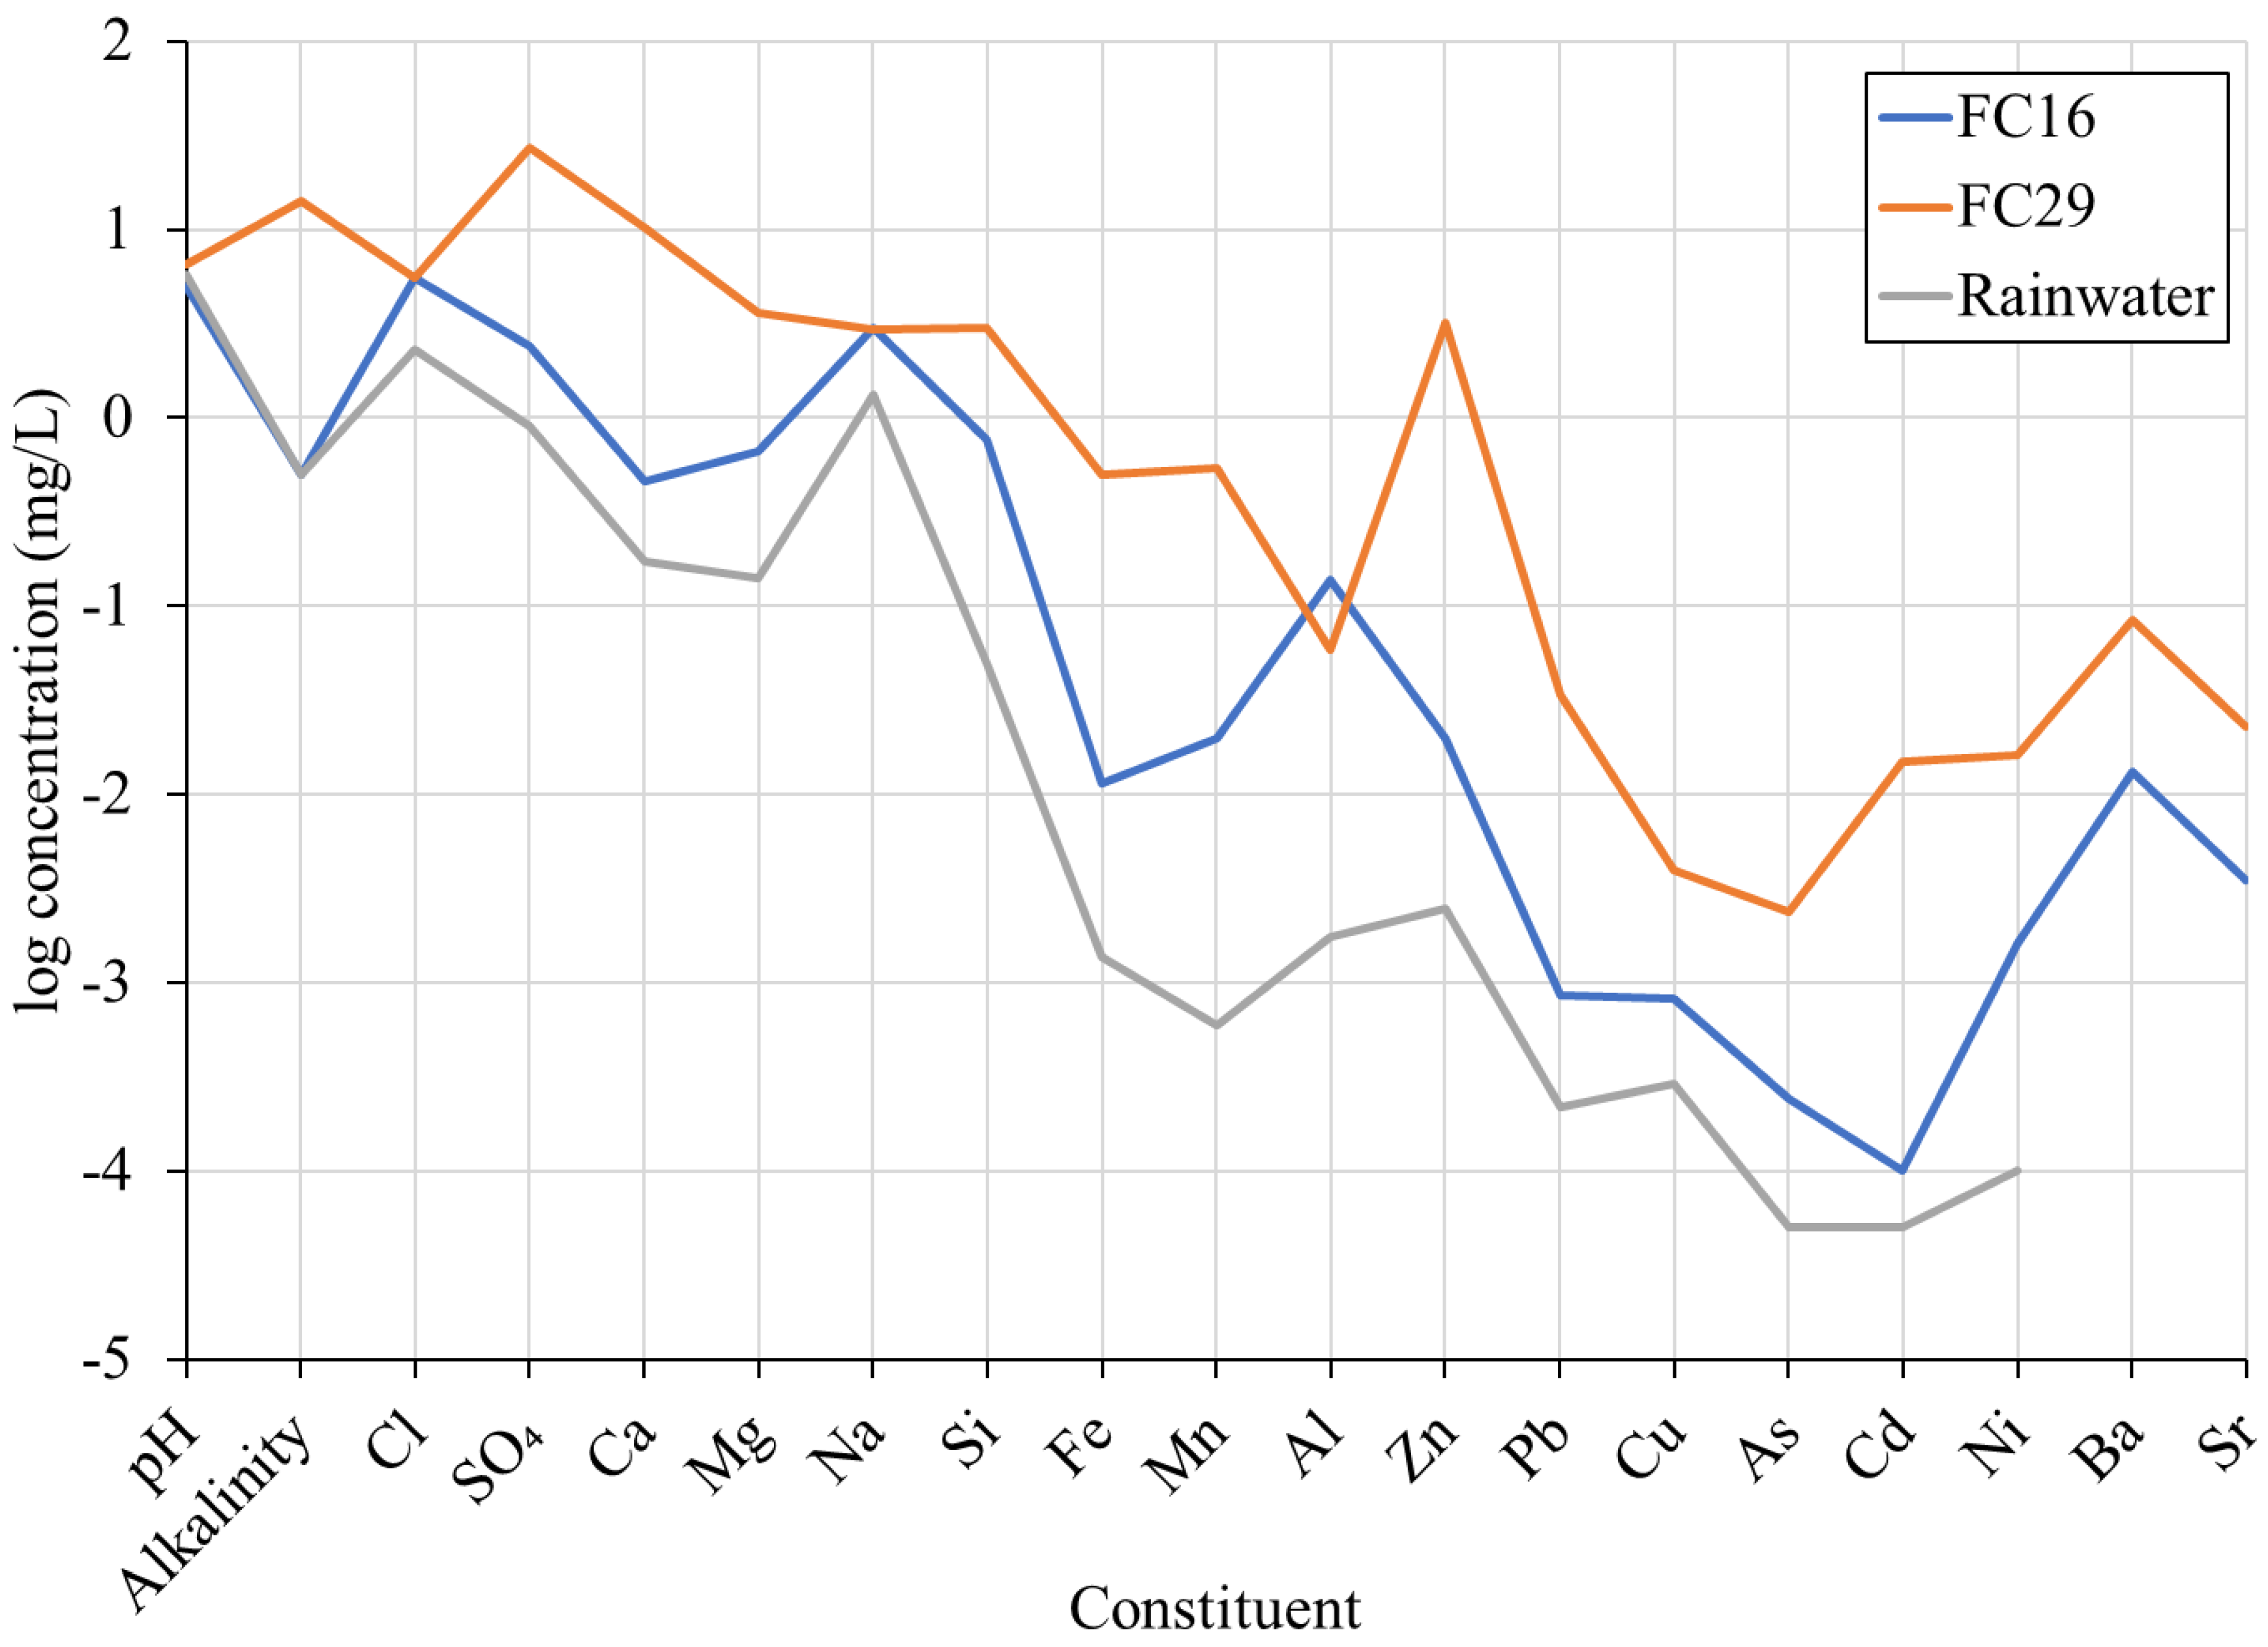
3.1. Selection of Input Water for Calculation of Water Chemistry Changes within the Mine

Because input water to the Force Crag mine could not be directly sampled, FC16 water (Coledale Beck upstream of the mine; Figure 1) was collected as a reasonable proxy. To assess the suitability of this, FC16 water quality was compared with that of nearby rainfall (Bannisdale, 35 km SE of Force Crag [31]; Table 1, Figure 2), because direct ingress of rainfall to the mine is possible through open voids into the workings. The rainfall data used [31] do not include trace metals, so a one-off sample of rainwater was collected at Force Crag and analysed for trace metals (Table 1).
The Na and Cl levels in Coledale Beck water at FC16 are 2.3–2.4 times those in rainfall, due to evapotranspiration within the soil as the rainfall infiltrates. However, the concentrations of SO4, Ca and Mg at FC16 are more elevated than would be expected from evapotranspiration alone, with concentration factors relative to rainfall of 2.7–4.8, and the levels of some metals are also slightly raised (20 µg/L Zn; Table 1). This indicates a minor input to Coledale Beck water from oxidation/dissolution of mineralisation adjacent to the main vein at Force Crag. The low pH of Coledale Beck water (pH 4.97) is probably due to input from organic acids that are common in peaty soils such as those in this area [32]. Thus, upstream Coledale Beck water has been affected by evapotranspiration and the addition of some species, but these processes are equally likely to have affected infiltration into the mine from the hillside above, indicating that FC16 water is a valid proxy for input water to the Force Crag mine. Independent confirmation of this comes from the comparison of Na and Cl concentrations at FC16 with those at FC29 (mine outlet water); they are almost identical (Table 1, Figure 2), indicating that there is no direct rainfall input within the mine, as this would have diluted the Na and Cl levels. The correspondence between these concentrations also shows that there is no significant evaporation within the mine.

3.2. Mineralogical Controls on Mine Water Chemistry

To delineate the changes in water chemistry occurring within the mine, median analyses of input water (FC16) and output water (FC29) were compared (Table 1, Figure 2) as both total and filtered (0.45 μm) concentrations. For Zn, Cd, Ni and Ba, there was no significant difference between total and filtered (aqueous-phase) concentrations (Mann–Whitney U test; p > 0.1 in all cases; Table S1). However, for Pb, Fe, Al and Cu, the filtered concentrations in the mine water (FC29) were significantly lower (<50%) than the total concentrations (p < 0.001). This does not affect the following discussion about the mineralogical controls on mine water chemistry but has important implications for the influence of flow and temperature on the composition of mine water, discussed in Section 3.3 and Section 3.4.
Using concentrations rather than loadings for comparison assumes that the input and output flows are equal, i.e., there are no gains or losses of water within the system. Na and Cl concentrations at FC16 and FC29 are almost identical (Table 1, Figure 2), indicating that there is no evaporation within the mine and no input of water with a different composition.

3.2.1. Sulphide Oxidation

The concentrations of metals and sulphate in the mine outlet water are much greater than in the input water (Table 1, Figure 2) due to the oxidation of sulphides exposed in the Force Crag vein within the mine. The high concentrations of Zn are due to the oxidation of sphalerite, and hence there is a strong correlation between Zn and SO4 concentrations in the mine water (Figure 3; r2 = 0.95; p < 0.001). Sphalerite oxidation also releases Cd, as shown by the very strong correlation between Zn and Cd (Figure 3; r2 = 0.98; p < 0.001). The Zn:Cd weight ratio of 0.0047 indicates ≈0.5 wt% Cd in solid solution within the sphalerite, well within the recorded range of Cd levels in sphalerite [28].
The Ni in the mine water was probably also largely released by sphalerite oxidation because there is a good correlation between Zn and Ni (Figure 3; r2 = 0.90; p < 0.001) with a Zn:Ni weight ratio of 0.0042, indicating ≈0.4 wt% Ni in solid solution within the sphalerite. Sphalerite can contain low levels of Ni in solid solution [33,34]. Some Ni may also have been released from chlorite dissolution (discussed below). Ni substitutes for Fe in the octahedral sheet of the chlorite structure, and the clay-rich fraction of Skiddaw Group slates contains on average ≈100 ppm Ni [21].
The Pb, Cu, As and Fe in the mine water were released by the oxidation of galena, chalcopyrite and pyrite, which contain these elements and are common in the lower levels of the mine. Pyrite can incorporate large amounts of arsenic (up to 10 wt%) within its structure [35]. The dissolution of supergene Pb/Cu sulphates and oxides may make a minor contribution to the Pb and Cu concentrations. The upper levels of the mine lack sulphides, but pyrite and chalcopyrite may have been previously common because this part of the vein contains reniform masses of goethite [21], which typically forms by oxidation of iron-containing sulphides.
There is approximately 100 times more Zn than Pb in solution in the mine water (as ug/L). This is despite the fact that (1) galena oxidises much more rapidly than sphalerite [36] and (2) there is only twice as much sphalerite as galena in the Force Crag veins, based on production figures and visual estimates of abundance [18,22,28]. This is because two processes attenuate the Pb released by galena oxidation:
(1)
Adsorption onto ferrihydrite, which strongly adsorbs Pb at the circumneutral pH typical of the mine water [37,38,39].
(2)
Precipitation of Pb carbonate (cerussite), which is present at Force Crag [24]. This is relatively minor, as the mine waters are consistently undersaturated with respect to cerussite (SI from −2.39 to −0.76, n = 96; Figure S1a).
The adsorption of Zn to ferrihydrite will also occur at the pH of the mine water [13,40], but at a lower rate than that for Pb; the order of adsorption affinity of metal ions to ferrihydrite is Pb > Cu > Zn [41]. Zinc is not removed by ZnCO3 (smithsonite) precipitation; this mineral is unknown within the Force Crag mine. Saturation indices for smithsonite in the mine outlet water (FC29) are always negative (range from −1.13 to −3.52; n = 132; Figure S1b), reflecting the fact that ZnCO3 is ~1000 times more soluble than PbCO3 (pKsp cerussite = 13.13, pKsp smithsonite = 10.00 [42]). Thus, relatively little Zn is removed from the mine water compared to Pb, and as a result, there is much more Zn than Pb in solution at the mine outlet (FC29; Table 1, Figure 2).
Cd has similar chemical and crystallographic properties to Zn [43], so relatively little Cd is probably removed by adsorption and precipitation. This is verified by the very strong Cd/Zn correlation in the mine water.
The concentrations of Cu and As in the mine water (Table 1) are lower than would be expected from the occurrence of chalcopyrite and pyrite, respectively, in the Force Crag vein. Nevertheless, there is a strong positive correlation between the total Fe concentration and the total (r2 = 0.91; p < 0.001) and filtered (r2 = 0.72; p < 0.001) As concentrations, suggesting pyrite as the As source. Both Cu and As are removed by adsorption on ferrihydrite [37,38,39,44], and a small amount of Cu is probably also removed by minor precipitation as supergene Cu minerals such as brochantite and malachite.

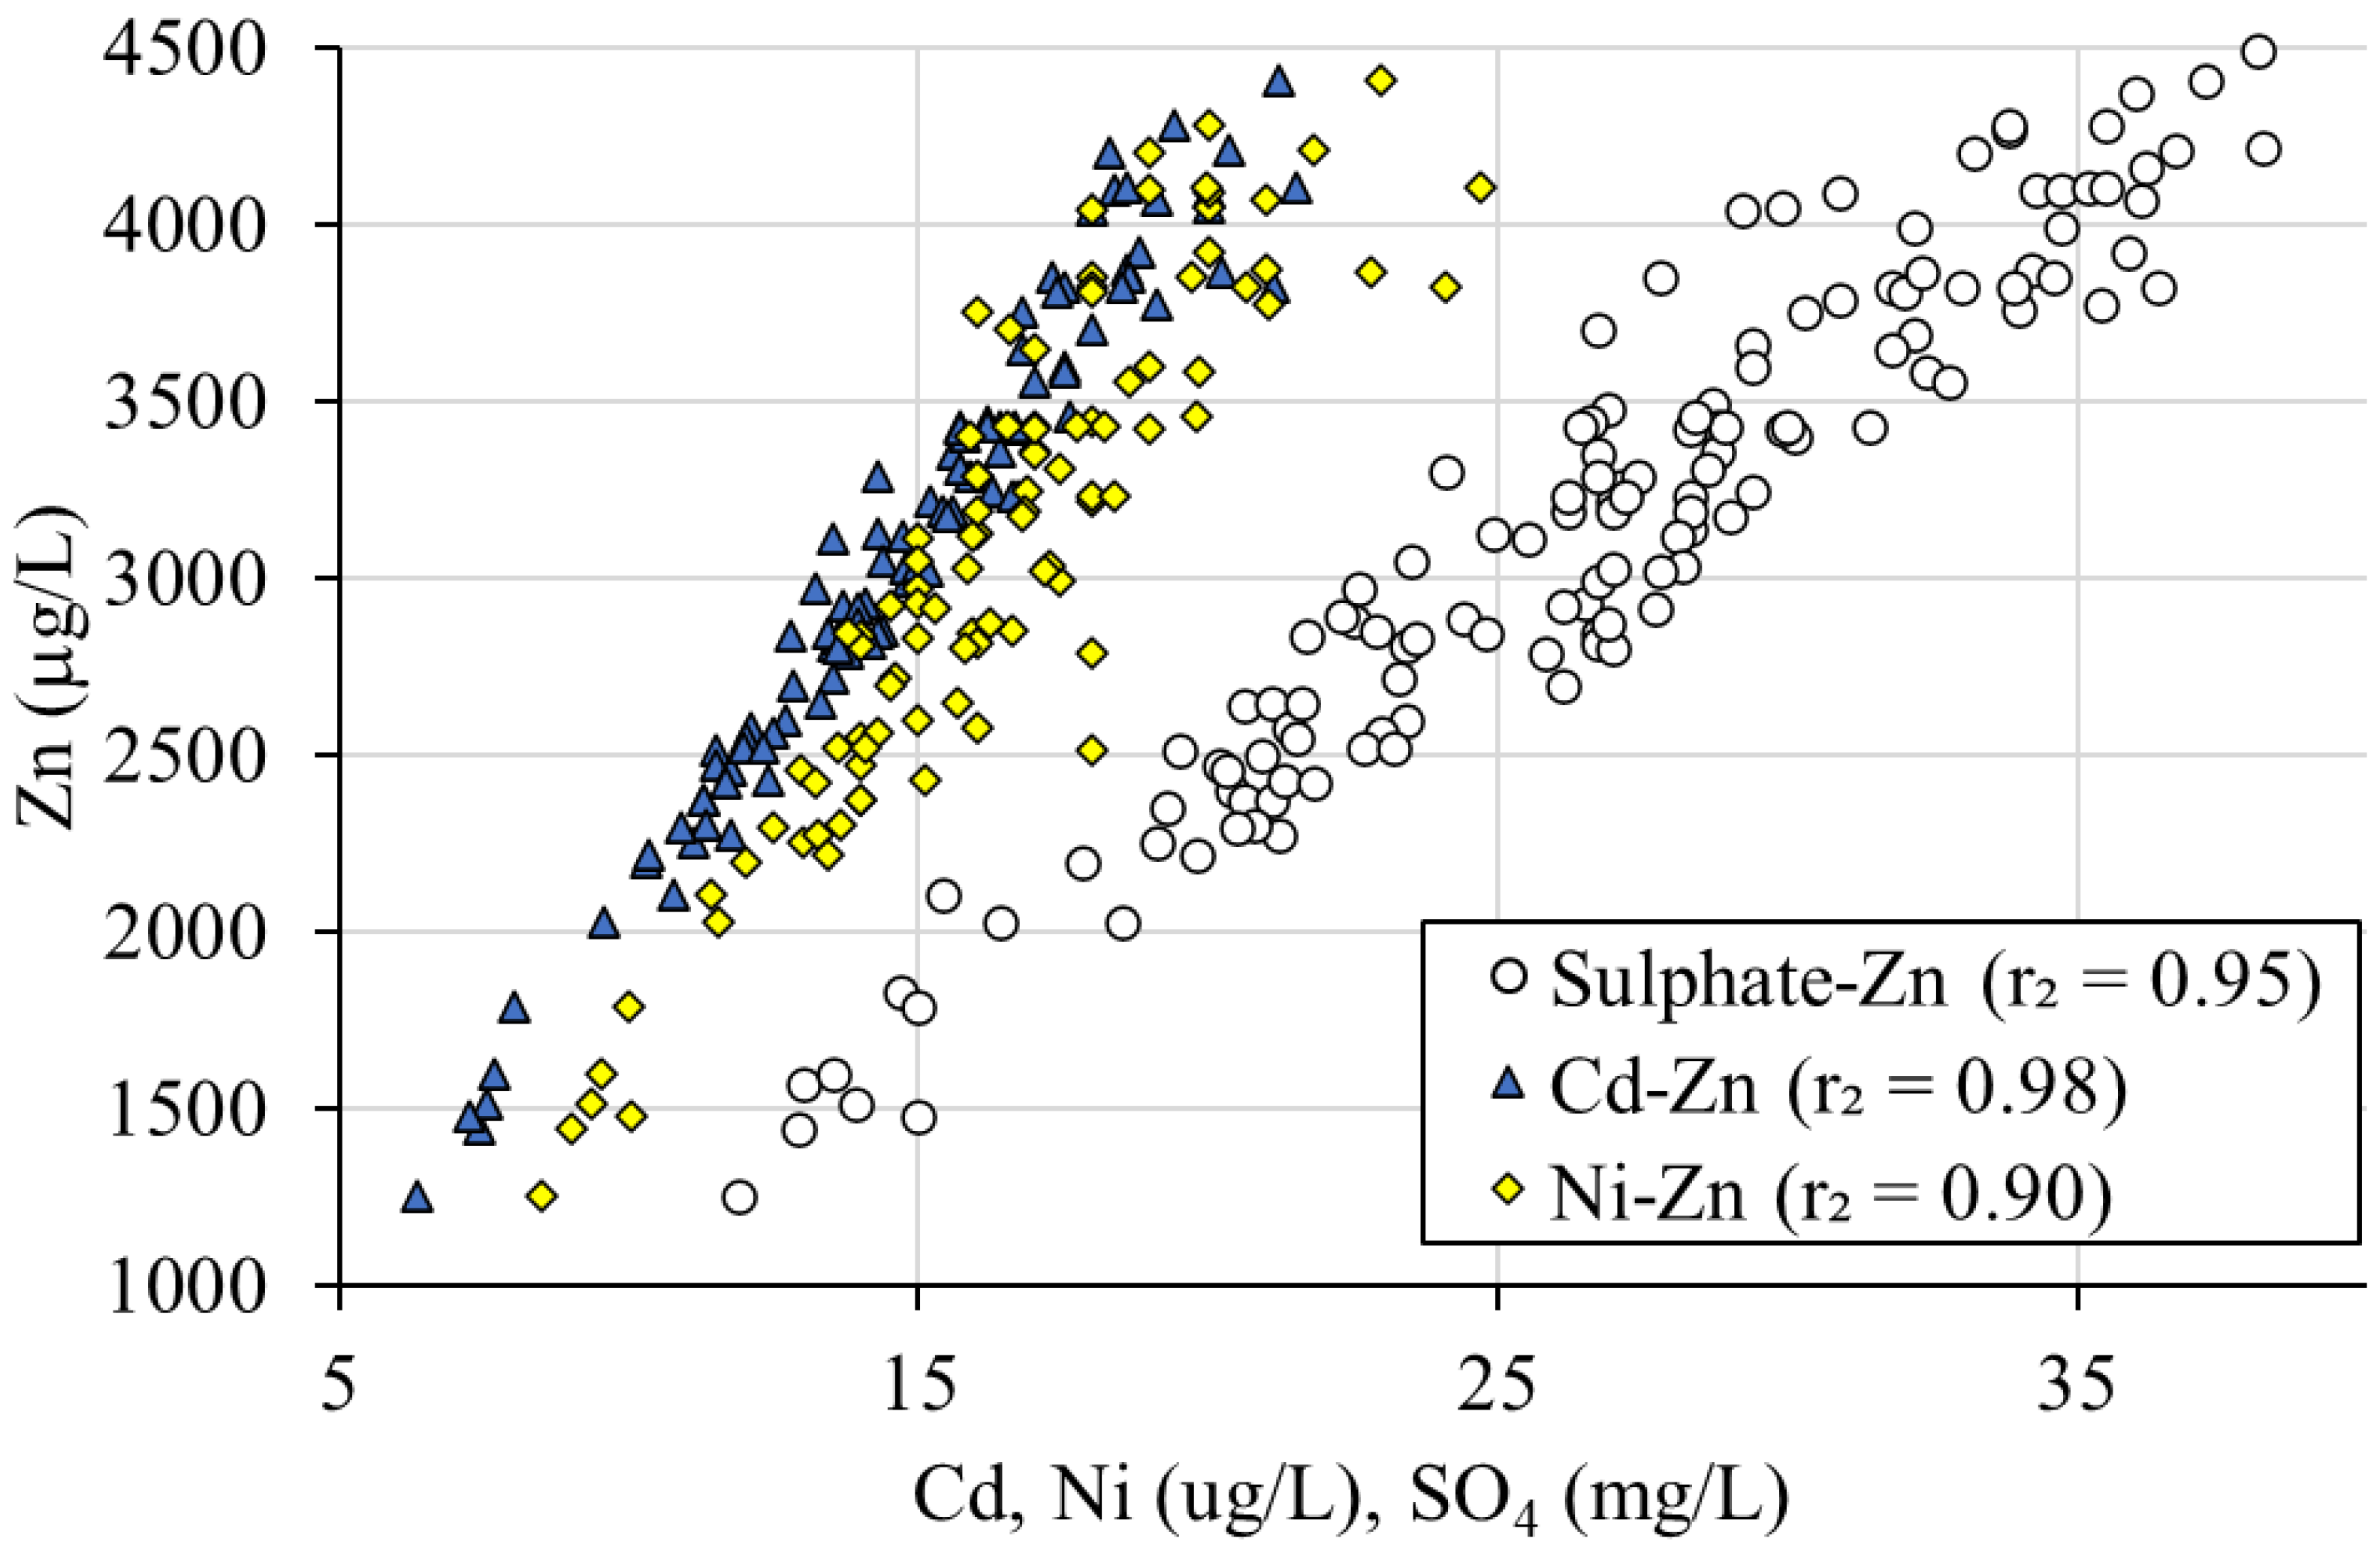
3.2.2. Sphalerite/Galena Oxidation Ratio

To determine the ratio in which sphalerite and galena are oxidising, a molar balance calculation was carried out (Table 2, Table S2). Molar balance calculations can reveal the proportions of the various minerals dissolving/oxidising/precipitating within the mine. The format used here was initially developed by Garrels and MacKenzie [45] and was successfully applied to mine drainage [46]. We extend that approach to incorporate bicarbonate concentration to resolve the mass balance for this NMD. This molar mass balance calculation is based on four reactions:
  • Sphalerite oxidation:
    ZnS + 2O2 = Zn2+ + SO42−
  • Galena oxidation:
    PbS + 2O2 = Pb2+ + SO42−
  • Pyrite oxidation and ferrihydrite precipitation:
    FeS2 + 3.75O2 + 3.5H2O = Fe(OH)3 + 2SO42− + 4H+
  • Calcite dissolution and acid neutralisation:
    CaCO3 + H2CO3 = Ca2+ + 2HCO3
The relative amounts of sphalerite and galena oxidation cannot be determined from the Zn/Pb ratio in the mine water due to the preferential removal of Pb by adsorption on ferrihydrite and secondary mineral precipitation, as previously discussed. Instead, the molar balance calculations used mine input and output pH and bicarbonate concentration data. An initial assumed sphalerite:galena oxidation ratio of 1:2 (based on estimates of sphalerite and galena oxidation rates; see above) was adjusted until the calculated and measured HCO3 concentrations in the mine water outlet were equal.
Firstly, the number of moles of Zn (per litre) released by sphalerite oxidation (Equation (1)) was computed from the difference between Zn concentrations in the mine outlet (FC29) and the input (FC16) water. From this, the number of moles of sulphate released by sphalerite oxidation was calculated based on the 1:1 molar Zn:S ratio in sphalerite. The assumed sphalerite-to-galena oxidation ratio (1:2) was then used to calculate the number of moles of Pb and sulphate released by galena oxidation (Equation (2)). The moles of sulphate released by pyrite oxidation (Equation (3)) were calculated as the difference between the sulphate concentration in FC29 and the sum of that in FC16 and the amount released by sphalerite and galena oxidation (chalcopyrite oxidation was ignored because the amount of Cu in solution was too small).
Knowing the moles of sulphate released by pyrite oxidation, it was then possible to calculate the acidity release from this reaction (1 mole of pyrite oxidation generates 4 moles of H+ if the iron released precipitates as ferric hydroxide; Equation (3)). This would be expected to decrease the pH of the mine outlet water, but instead, there was an increase in pH between FC16 and FC29 (Table 1), indicating that the acidity was consumed within the mine workings. Calcite dissolution was responsible for this, as shown by the increase in Ca concentration at FC29 relative to FC16 (Figure 2). Calcite dissolution also releases bicarbonate: 2 moles for every mole of Ca released at the pH of mine water (pH 5 to 6.5; Equation (4) [47]). This bicarbonate was partly consumed by neutralising the H+ generated by pyrite oxidation as well as reacting with some of the H+ already present in the mine input water, which had a pH of 5.
Using the assumed sphalerite-to-galena oxidation ratio of 1:2, the bicarbonate consumed by both these reactions was subtracted from the bicarbonate generated via calcite dissolution to calculate the bicarbonate concentration that should be present in FC29; this was less than the actual bicarbonate concentration in FC29. The sphalerite-to-galena oxidation ratio was then changed iteratively until the calculated FC29 bicarbonate concentration equalled the actual bicarbonate concentration, giving a sphalerite-to-galena oxidation ratio of 1:2.22 (Table 2).
The calculations show that over 99% of the Pb released by galena oxidation is removed within the mine (Table 2). In the molar balance calculations, this loss was assigned to adsorption by ferrihydrite; precipitation as cerussite is probably minor, given the consistent undersaturation of mine waters with respect to this mineral (Figure S1a).

3.2.3. Pyrite/Chalcopyrite Oxidation and Ferrihydrite Precipitation

In the molar balance calculations, the amount of sulphate in excess of that produced by sphalerite and galena oxidation was attributed to the oxidation of pyrite (Table 2). However, sulphate was also released by chalcopyrite oxidation. The relative proportions of pyrite and chalcopyrite oxidation cannot be estimated because of Cu adsorption on ferrihydrite. The adsorption of Zn to ferrihydrite within the mine workings would result in an underestimation of the amount of sphalerite oxidation and an overestimation of the contribution of pyrite/chalcopyrite oxidation, but the effect is minor.
The calculations show that, to explain the composition of the mine outlet water, significant quantities of pyrite and chalcopyrite need to have oxidised (1 mole compared to 3.2 moles of sphalerite and galena). Pyrite and chalcopyrite have been recorded locally in the lower parts of the Force Crag vein; the molar balance calculation suggests that these minerals are more widespread than has been realised, probably because they occur as small, disseminated crystals that are easily overlooked.
The molar balance calculations also show that 82% of the Fe released by pyrite oxidation is removed by ferrihydrite precipitation (Table 2), and this is verified by fine particulate ferrihydrite in the mine outlet water (discussed further in Section 3.3, below), the coating of ferrihydrite (‘ochre’) up to 1.5 m thick on parts of the mine walls, roof and floor and the orange precipitate on the base of the channel discharging water from Level 1 of the mine (FC30) before it was confined to a pipe [25]. Saturation indices for amorphous iron hydroxide in the mine outlet water are generally negative, indicating that the water should be undersaturated (Figure S1c), but this is clearly incorrect and presumably reflects the difficulty of calculating saturation indices for amorphous minerals such as ferrihydrite, which has a very variable composition [37], so it is difficult to assign an accurate Keq value. Some iron is removed by the precipitation of the minor amounts of iron carbonates (siderite, ankerite) present in the mine, though on all occasions, FC29 water is undersaturated with respect to siderite (SI values of −3.09 to −0.87; n = 131; Figure S1d).

3.2.4. Dissolution of Carbonates

The molar balance calculation showed that the acidity released by pyrite/chalcopyrite oxidation is neutralised by the dissolution of calcite, releasing Ca and alkalinity. Ca and bicarbonate concentrations are strongly correlated in the mine outlet water (r2 = 0.86; p < 0.001). Dissolution of dolomite is probably also occurring (this carbonate has been recorded at Force Crag), but the rate of dolomite dissolution is much lower than that of calcite [48], and the increase in the molar Ca:Mg ratio from ≈1:2.5 at FC16 to 2:1 at FC29 suggests that calcite dissolution is dominant in the subsurface.
The dissolution of calcite also releases Sr, as shown by the correlation between concentrations of Ca and Sr in the mine outlet water (r2 = 0.77; p < 0.001). The Ca/Sr weight ratio in the mine water (0.00115) corresponds to 0.12 wt% Sr in the calcite, well within the range of Sr concentrations in calcite (up to 4% [49]).
For every 1 mole of sphalerite oxidised, 5 moles of calcite/dolomite are dissolved (Table 2). This is substantial and indicates that these carbonates are more abundant in the Force Crag vein than suggested from descriptions of the vein mineralogy, probably because they are typically fine-grained and inconspicuous. There is only one mention of calcite at Force Crag [23].

3.2.5. Dissolution of Silicates

Silicate weathering, probably largely due to the reaction with the acidity released by pyrite oxidation, is responsible for the low levels of Si in the mine water (median of 3.0 mg/L; Table 1). This is not due to the dissolution of quartz because, although it is abundant in the Force Crag vein, quartz has very low solubility at an acid-circumneutral pH [32]. Likewise, dissolution of the K- and Na-rich white micas in the Skiddaw Group slates is not occurring because the levels of K in the mine water are below the detection limit (<1 mg/L) and there is no Na input within the mine workings. However, chlorite, which is common in the Skiddaw slates, is most likely dissolving, releasing Si, Mg and Al (the most common elements in this mineral [50]).
The Al concentration of mine water is lower than in the upstream water (Figure 2; Table 1), despite the release of Al by chlorite dissolution, because the upstream water has a lower pH. Al solubility increases rapidly as pH decreases [38]. The Al in the upstream water is most likely derived from clay dissolution within the peaty soils. The lack of filtered (aqueous-phase) Al within the mine water may also reflect the strong adsorption of Al on ferrihydrite at circumneutral pH [39]; Al can be readily incorporated into the ferrihydrite structure [51].
The weathering of chlorite was not incorporated into the molar balance calculations because the amount is relatively small and Mg is also released by dolomite dissolution. The relative molar amounts of Ca and Si in the mine water (0.255 mmol/L and 0.106 mmol/L, respectively) verify that carbonates are contributing more to the mine water than chlorite, so that although chlorite is more abundant, carbonates are more reactive.
It is notable that because the dissolution of calcite, dolomite and chlorite is largely due to the acid released by the oxidation of pyrite/chalcopyrite, the amounts of Ca, alkalinity, Sr, Mg and Si in the mine water are all strongly correlated (e.g., Ca-Si r2 = 0.99 (p < 0.001)), even though the release of these two species is by different reactions involving different minerals.

3.2.6. Dissolution of Mn Oxides and Barite

The low concentrations of Mn and Ba in the mine water (Table 1) were likely released from the dissolution of Mn oxides and barite in the mine workings, respectively (both are most common in the upper part of the Force Crag vein). These minerals are only sparingly soluble under the temperature, pH and redox conditions of the mine water.

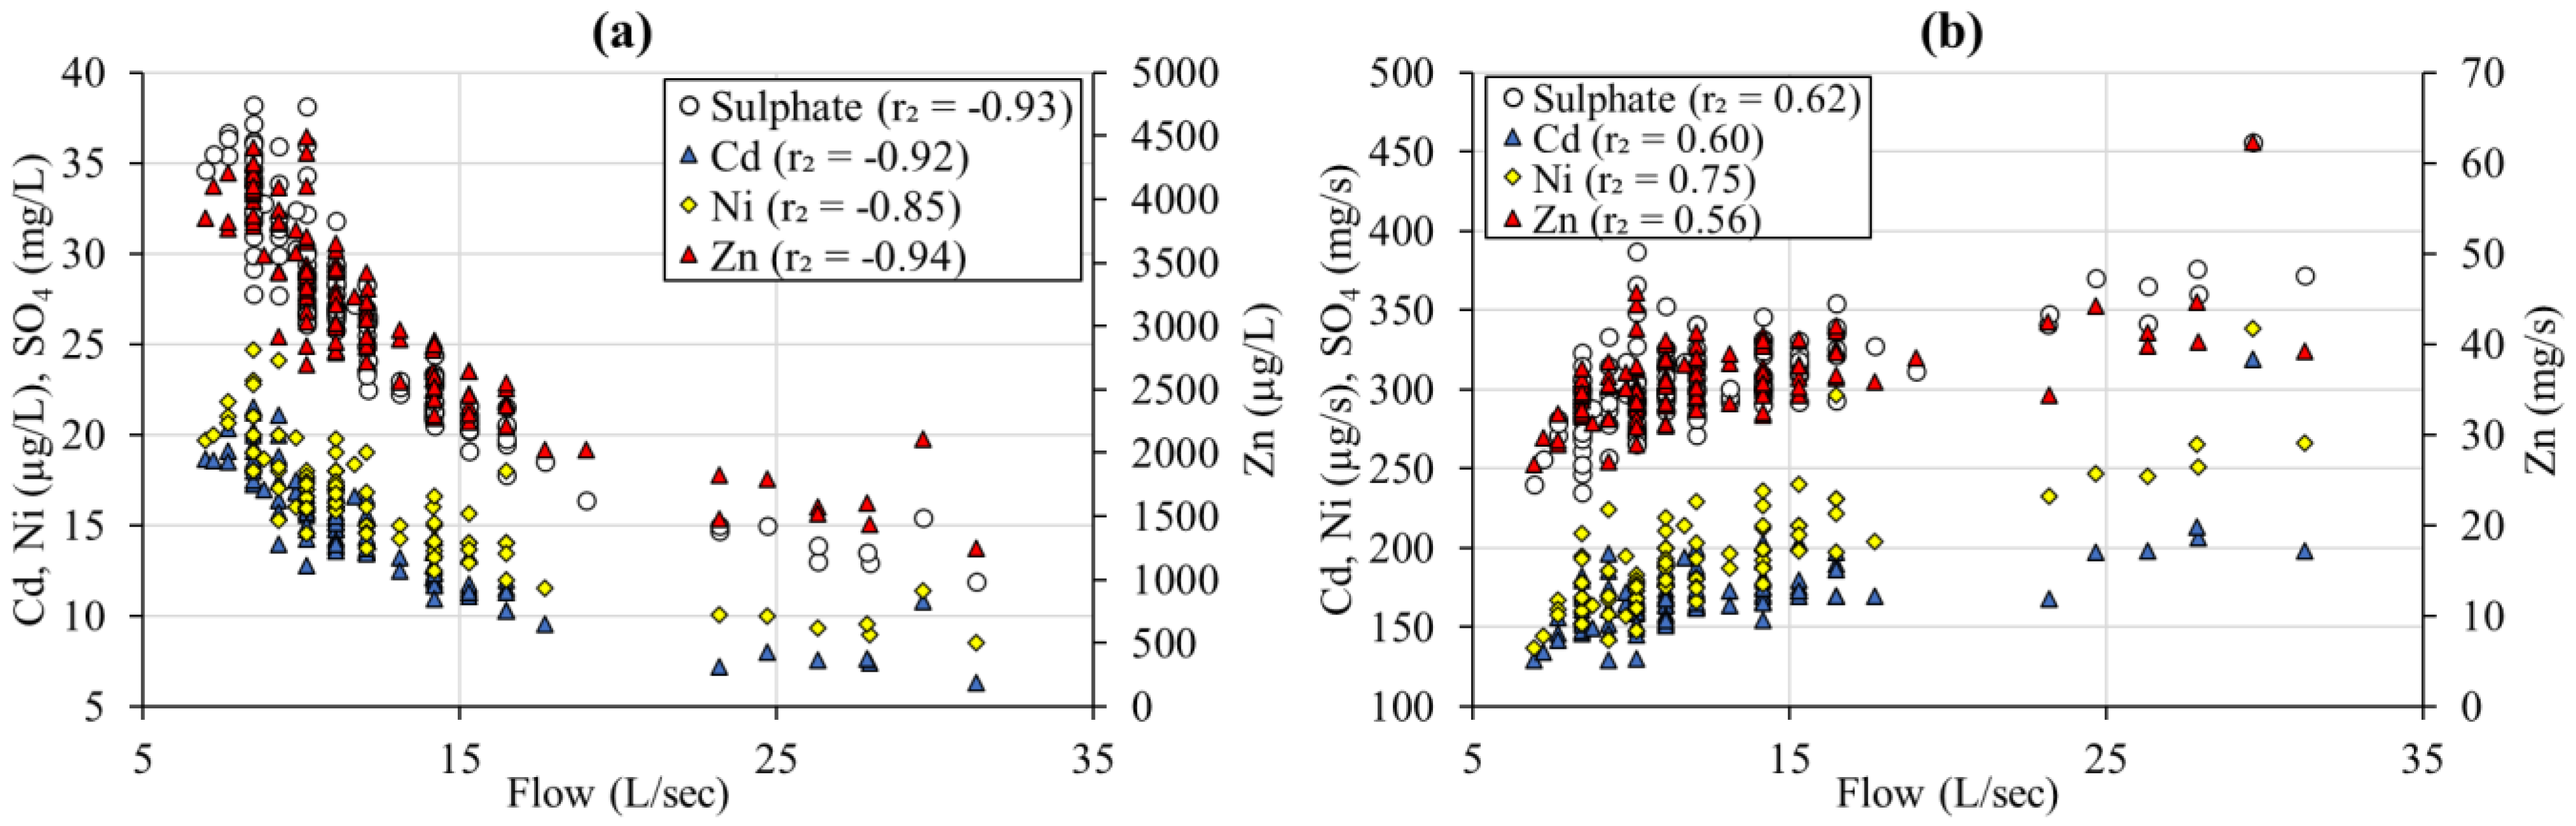
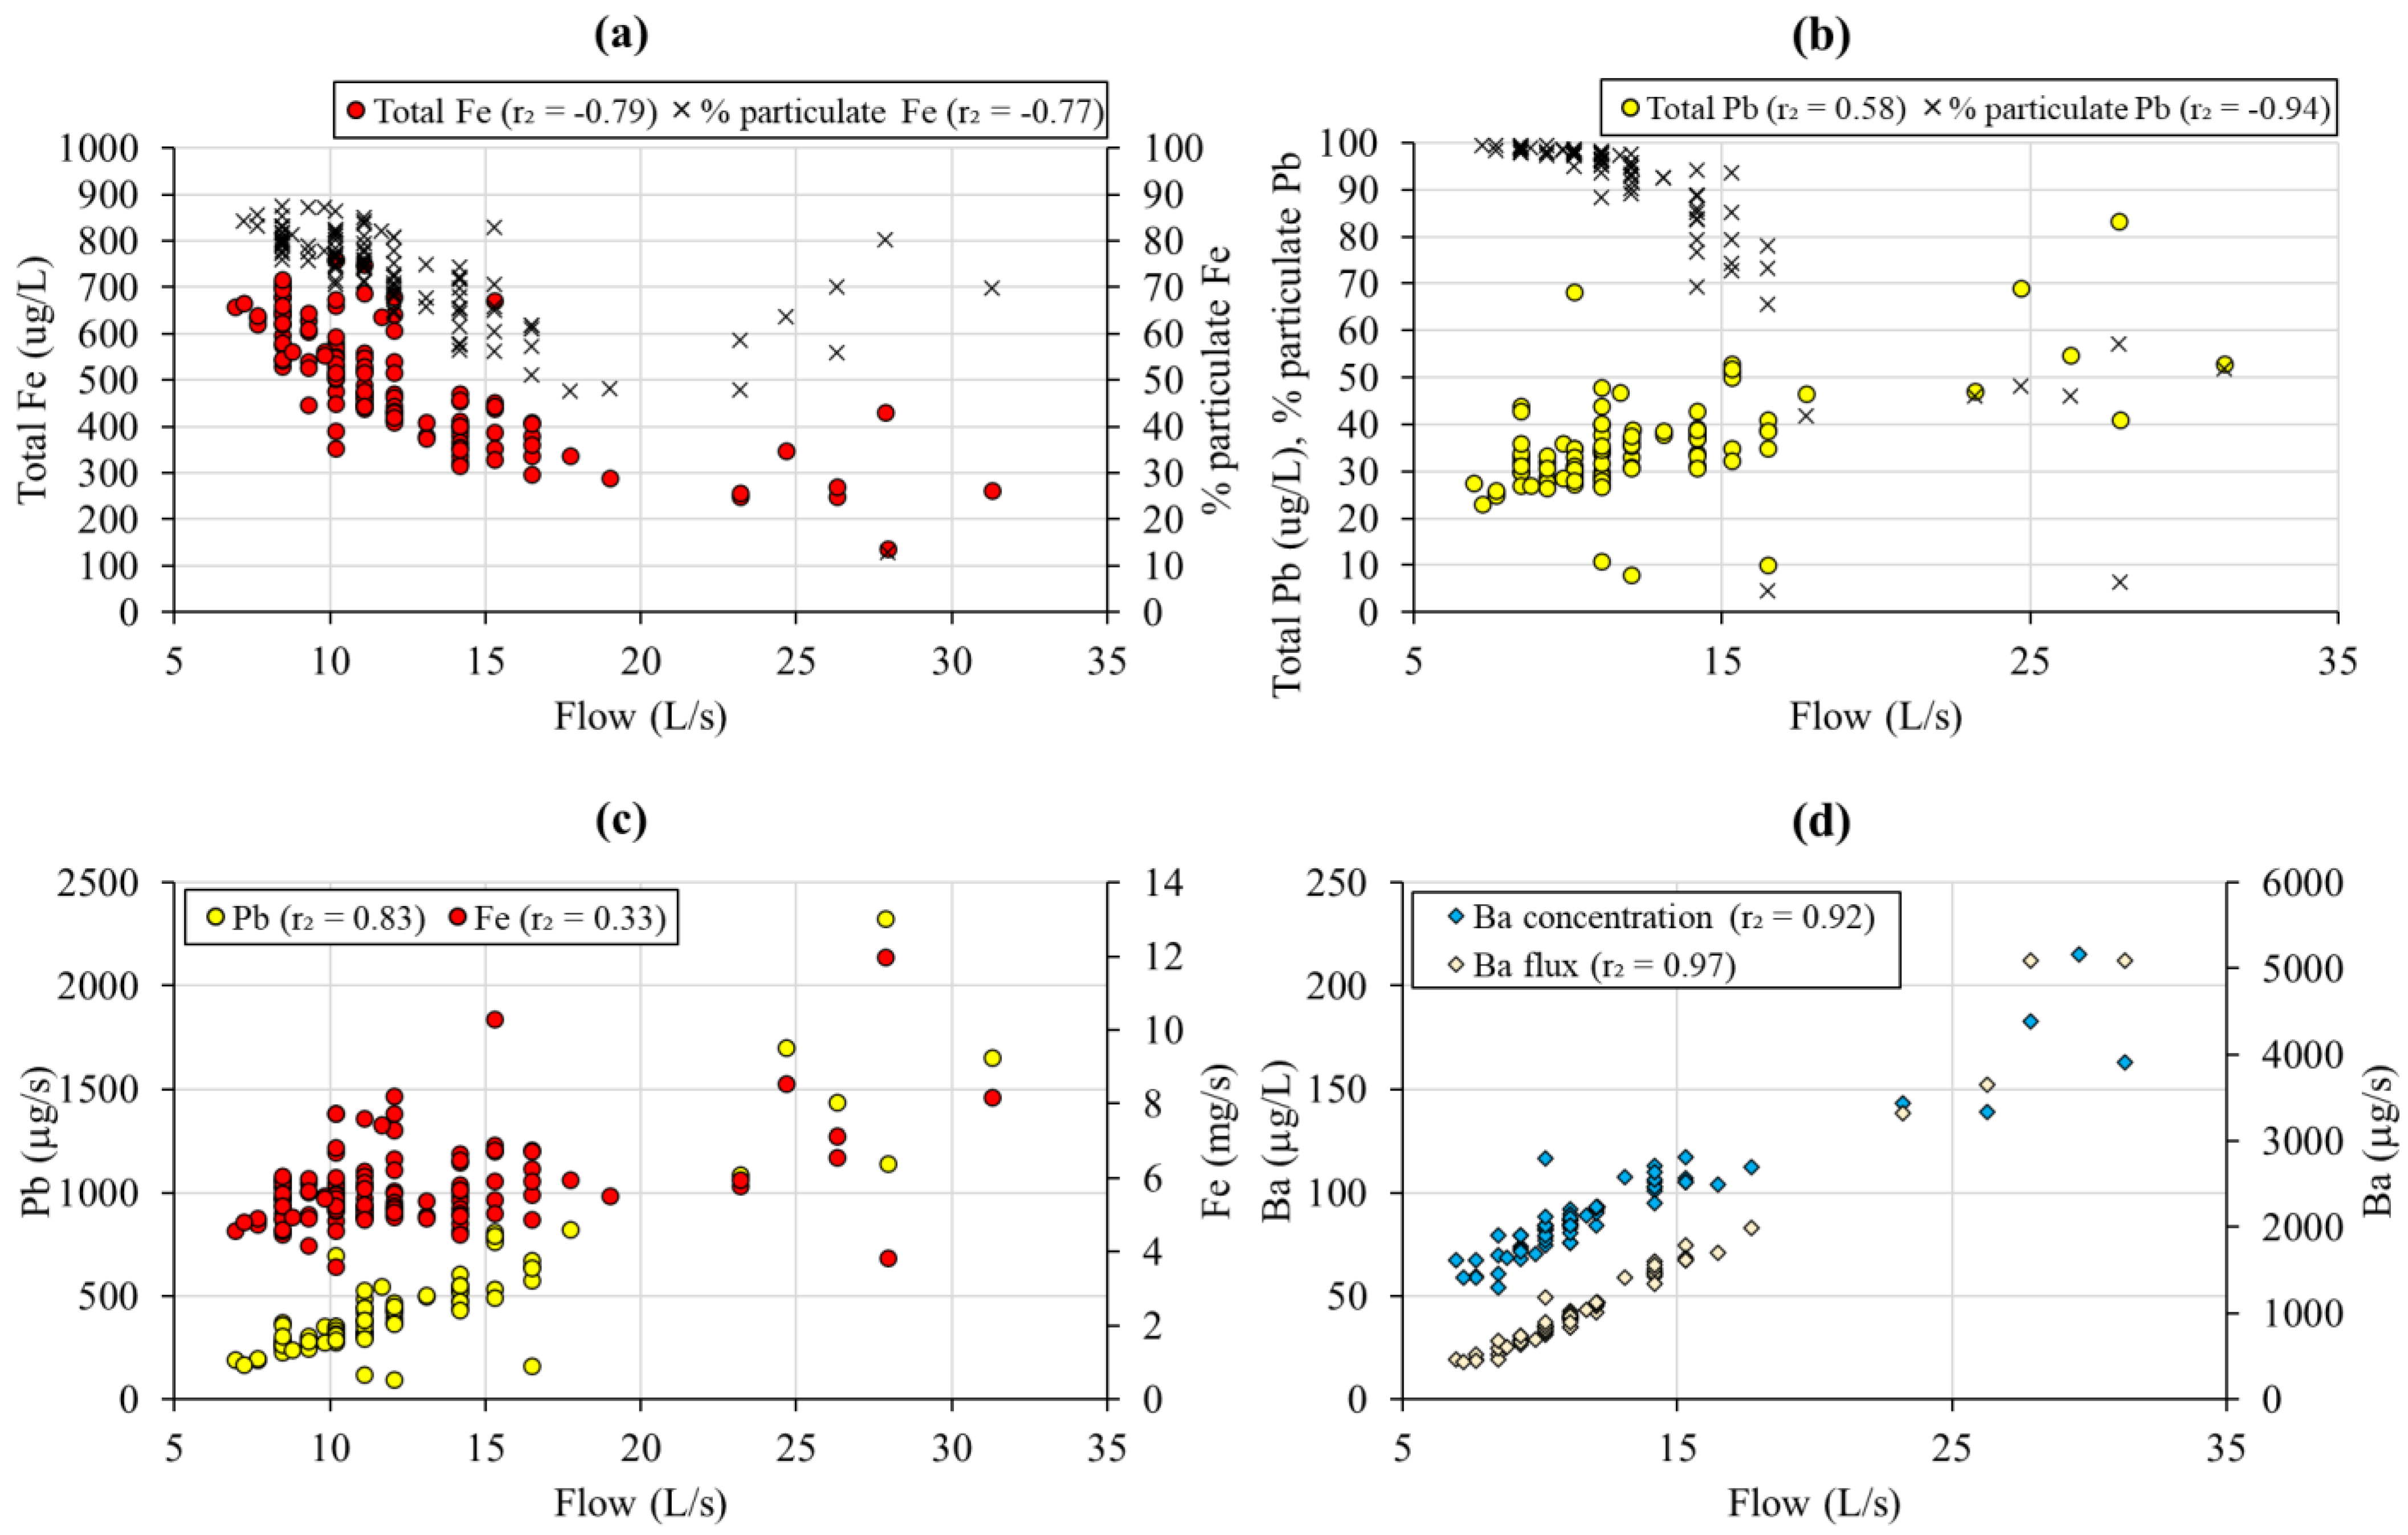
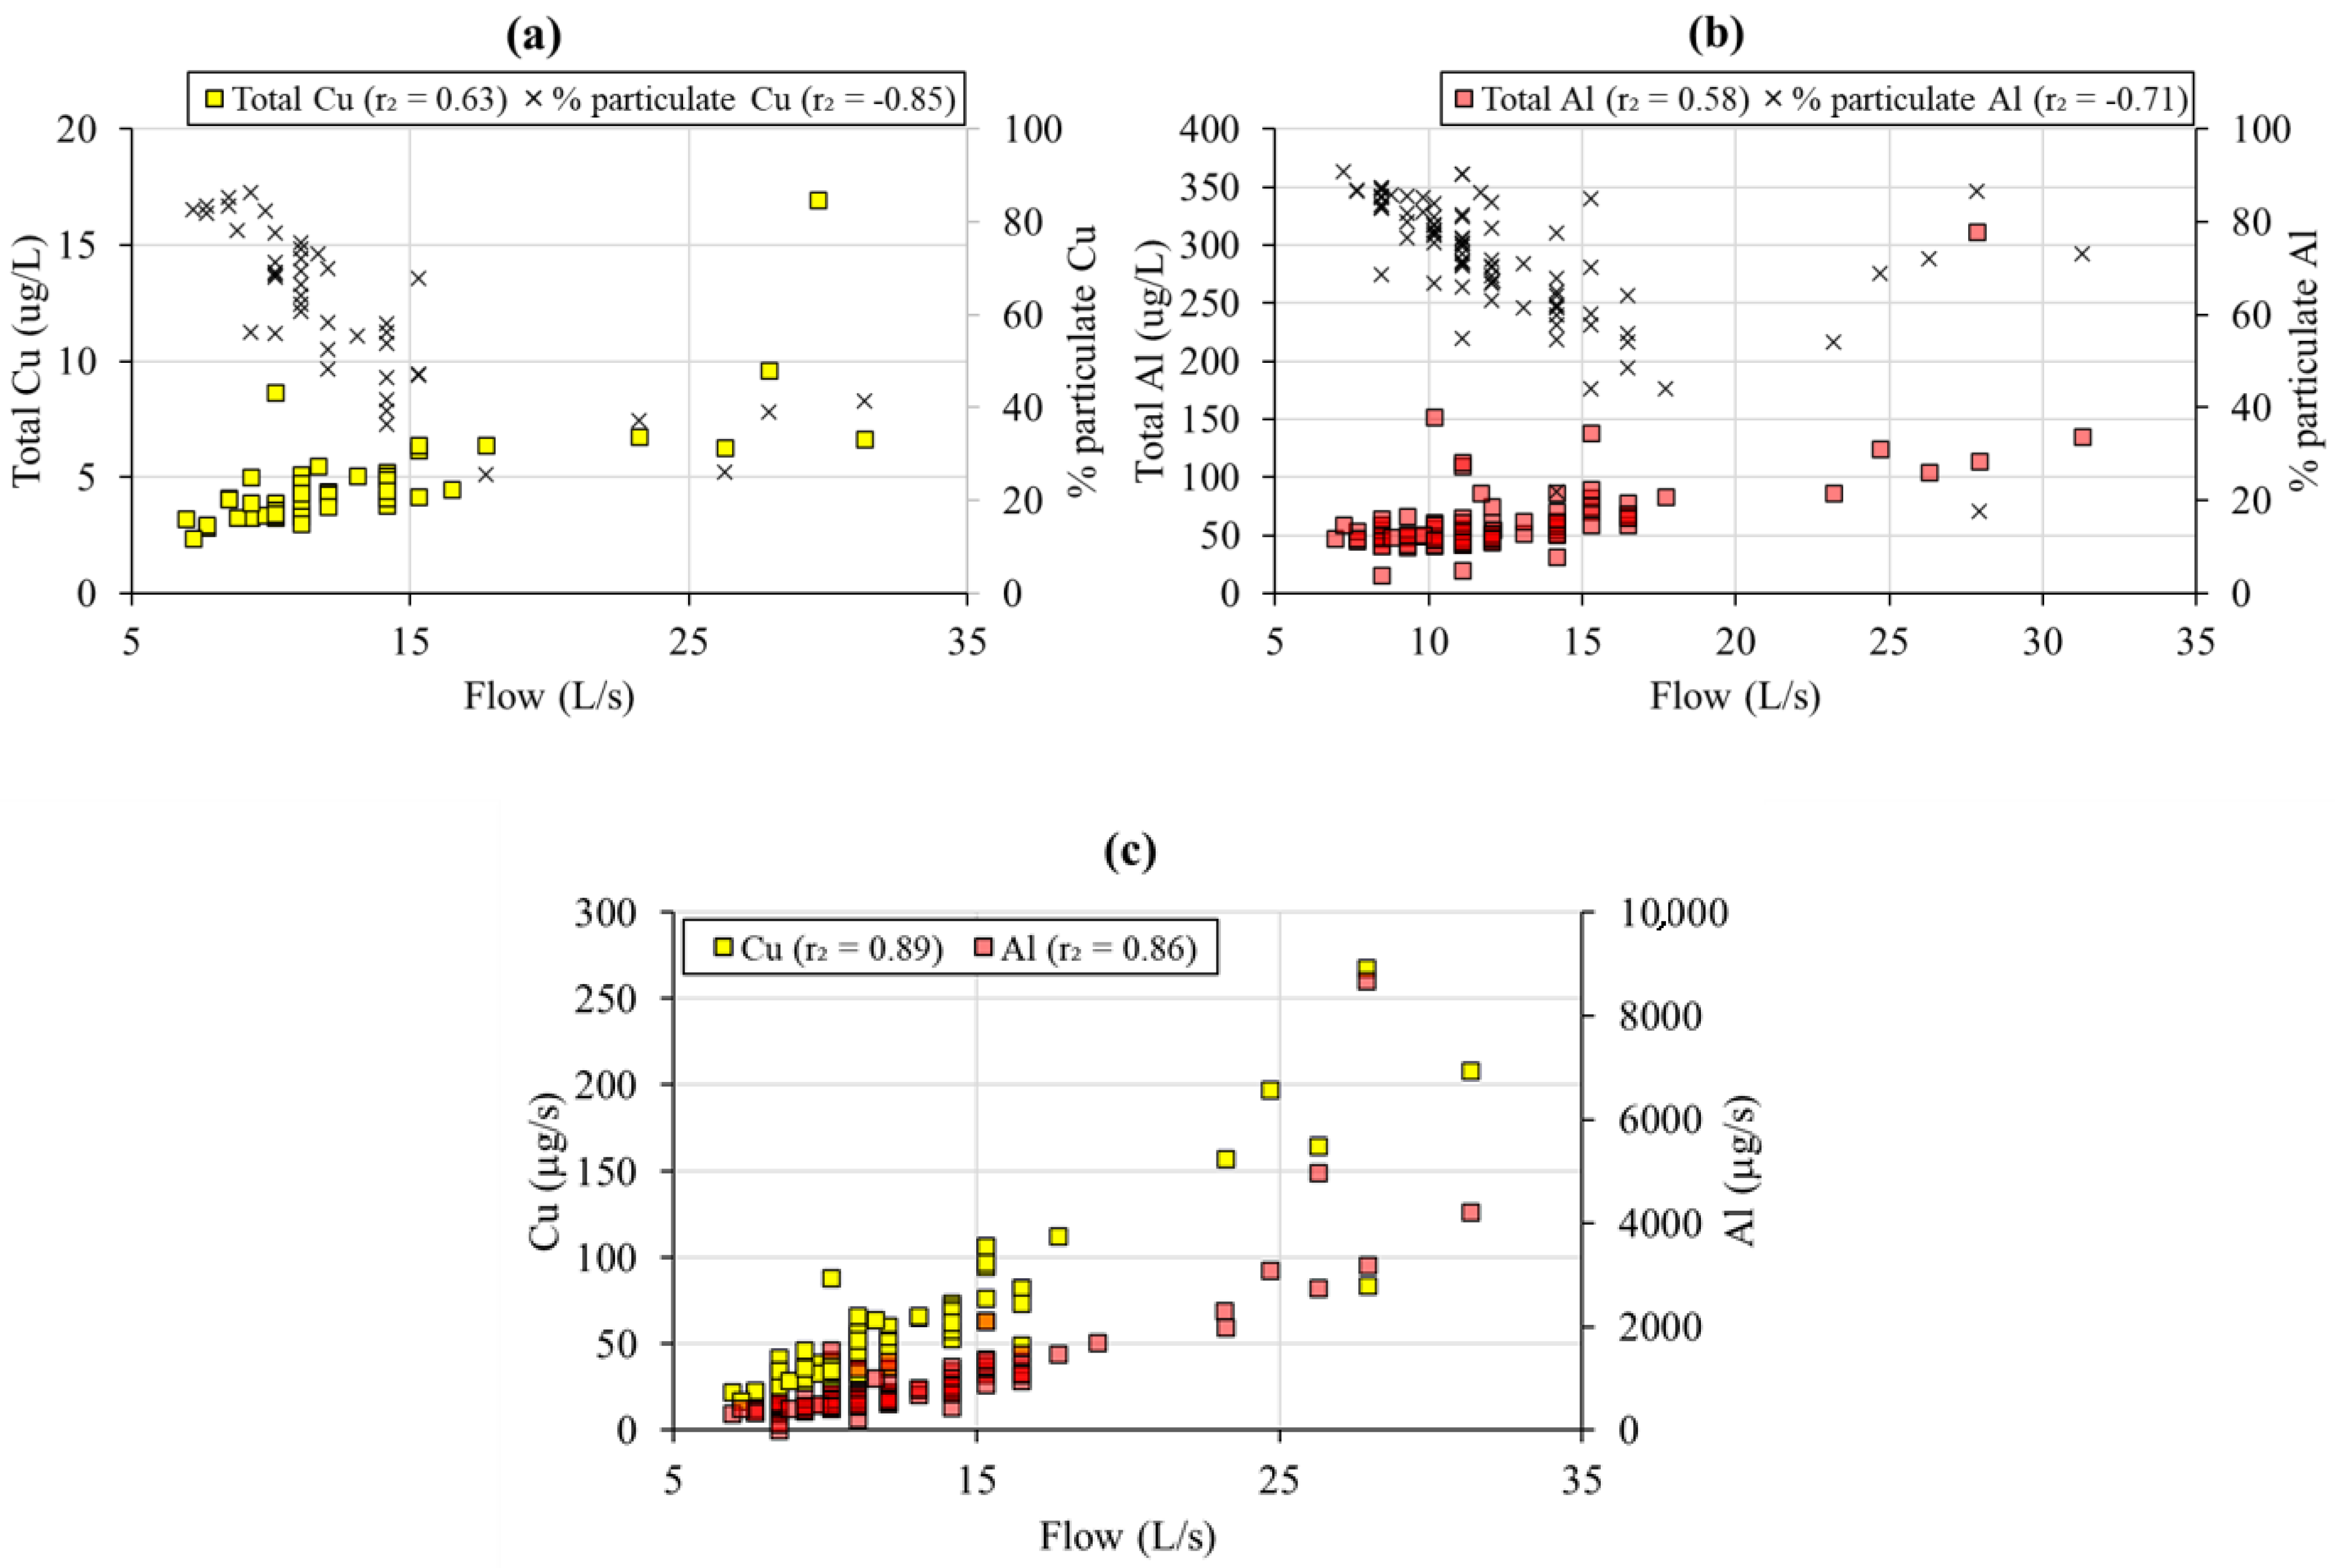
3.3. Flow Control on Mine Water Chemistry

Flow is negatively correlated with the concentrations of many constituents of the mine water, both major species (Ca, alkalinity, Mg, Si and SO4) and some metals (Zn, Cd, Ni and Mn) (Figure 4a and Figure S2; p < 0.001 in all cases). For Zn, Cd, Ni and Mn, total concentration equals filtered concentration (Table S1), so these species are present in dissolved form and perhaps also as very fine (<0.45 μm) colloids. The negative correlation with flow for all these species is due to dilution. Concentrations are ≈1.2 times lower in winter than in summer due to dilution by higher winter flows (though rainfall events throughout the year result in short-term dilution effects). The winter flow at the mine outlet (FC30) is on average 12.1 L/s, 1.2 times higher than the mean summer flow (10.2 L/s), reflecting the higher rainfall in winter (average 100 mm/month compared to 70 mm/month in summer; data from Thornthwaite, 5 km NE of Force Crag mine [52]).
Despite the strong negative correlation between flow and the main contaminant metal concentrations (Zn and Cd), simultaneous measurements of both the concentration and flow show that metal fluxes increase modestly with flow (Figure 4b), so the absolute mass of these metals discharged from the Level 1 mine portal (FC30) increases with flow rate. This is probably due to an increase in the oxidation rate of the sulphide minerals resulting from the greater amounts of oxygenated water flowing through the mine. The oxidation rate of sulphides is directly related to the oxygen concentration of the water [53]. This is corroborated by the increase in sulphate flux with flow (Figure 4b).
For Fe, Pb, Al and Cu, the relationship between flow and concentration in the mine water is not straightforward. For all these metals, the filtered (aqueous-phase) concentrations are generally ≤50% of the total concentrations (Table S1), indicating the presence of substantial amounts of fine particulate matter.
Fe in the mine water is present predominantly as finely particulate ferrihydrite (up to ≈80% of total Fe levels). Ferrihydrite has a low density and a large surface area [54], so the freshly precipitated particles are readily entrained by the flowing water within the mine. As flow increases, the concentration of particulate ferrihydrite decreases to approximately one third of the low flow values (Figure 5a); this is too great a reduction to be solely due to dilution. Additional factors probably include the slowing of precipitation rates during cooler temperatures at times of higher winter flows and the reduced time for particles to form when flows are faster. However, during the occasional very high flow events (>20 L/s), the concentrations of particulate ferrihydrite increase (Figure 5a), suggesting the physical flushing of ferrihydrite particles recently deposited on the mine walls.
Pb is predominantly present as fine particles at low flow (96% of the median total Pb concentration; Figure 5b). These particles are unlikely to be a Pb precipitate, as the mine waters are consistently undersaturated with respect to the most likely mineral (cerussite; Figure S1a). Instead, Pb is probably adsorbed onto the ferrihydrite particles described above. As previously discussed, ferrihydrite strongly adsorbs Pb at a circumneutral pH. Particulate Pb concentration is ≥80% of the total concentration on most occasions at flows of <15 L/s (Figure 5b). At low flows, it appears that there are enough ferrihydrite particles to adsorb the majority of the Pb in solution, as shown by the much higher concentrations of particulate Fe (median 376 μg/L) than particulate Pb (median 33 μg/L). However, at flows >15 L/s, the level of particulate ferrihydrite drops sufficiently for a proportion of Pb to remain in solution, so filtered (aqueous-phase) and total Pb concentrations increase at higher flows. As a result, total Pb concentrations are positively correlated with flow, and fluxes of this metal increase with increases in flow (Figure 5c). The lower temperatures at higher flows probably contribute to the higher levels of dissolved Pb because cation adsorption decreases with a drop in temperature in neutral water. This is believed to be at least partly responsible for the widespread diurnal cycles of dissolved concentrations of many trace metals [55]. In addition, the higher flows allow less opportunity for adsorption because of the shorter contact time in the rapidly flowing water. This means that the elevated filtered Pb concentrations at these higher flows are a reflection of the Pb levels released into the mine water by sulphide oxidation before Pb removal onto ferrihydrite.
During the occasional very high flow events (>20 L/s; Figure 5c), Pb fluxes in the mine water show sharp increases, probably due mainly to the physical flushing of Pb-containing ferrihydrite particles recently deposited on the mine walls, as the spikes in Pb flux generally match those in Fe flux. The concentrations of other species in the mine water (e.g., Zn, Cd, Ni), which are relatively unaffected by adsorption, decrease during these very high flow events due to dilution (Figure 4a).
For Ba in the mine water, total concentration equals filtered concentration, but, unlike other species for which this is true (e.g., Zn, Cd, Ni and Mn), Ba concentrations increase rather than decrease with flow (Figure 5d). This takes place because the mine waters are at or close to equilibrium with barite. Saturation indices have a mean of 0.02 and a range of 0.25 to −0.1 (Figure S1e). As flow increases, SO4 concentrations decrease due to dilution (as previously discussed; Figure 4a), and this causes more barite to dissolve, so Ba concentrations rise. At lower flows, the higher SO4 concentrations depress barite dissolution. Solution saturation may have some influence on the dissolution/precipitation of other metal phases, but, unlike for Ba, it is not the main cause of fluctuations in concentrations of other metals.
Patterns of change in Cu concentration and flux with flow (Figure 6a) are very similar to those of Pb: increasing concentration with flow (r2 = 0.63, p < 0.001) and a sharp decrease in the proportion of particulate Cu with flow (r2 = −0.85, p < 0.001), from ≈85% as particulate Cu on most occasions when flow is <10 L/s to approximately 40% or less as particulate Cu at flows above 15.5 L/s. Cu flux increases with flow (Figure 6c) due to the increase in Cu concentration, likely for the same reasons as for Pb, discussed previously. The somewhat lower proportion of particulate Cu compared to particulate Pb likely reflects the somewhat lower ferrihydrite adsorption affinity of Cu compared to Pb [37,38].
Al concentration is also positively correlated with flow (Figure 6b; r2 = 0.58, p < 0.001) and Al flux increases with flow (Figure 6c). This is probably for the same reason as for Pb: adsorption to particulate ferrihydrite. Similar to Cu, Al is less strongly adsorbed to ferrihydrite than Pb [37,38], accounting for the smaller percentage of Al present as fine particles (~77% of the median total concentrations; Table S1). However, Figure 6b indicates that the proportion of Al in particulate form decreases up to approximately 20 L/s but then increases again at higher flows. This is likely a consequence of the physical flushing of Al particulates at higher flows and is an almost identical pattern to that seen for Fe (Figure 5a).

3.4. Temperature Control on Mine Water Chemistry

Temperatures in the mine water (FC29) fluctuate seasonally but over a restricted range (8–13.5 °C) compared to air temperatures (−0.2 to 18.8 °C), data from Thornthwaite [52]). The median water temperature (11.2 °C) is ≈3 °C higher than the mean annual surface temperature (8.2 °C). This is because at depths of >10–15 m, temperatures increase with depth in line with the geothermal gradient (≈3.3 °C/100 m in the Lake District [56]). The mine water travels underground for some distance because the mine extends ≈1.2 km horizontally and 350 m vertically, and the water is, overall, warmed by ≈3 °C during its passage through the subsurface due to the warmer temperature at depth. The mine water does not emerge at a constant temperature because it travels through the mine too rapidly to equilibrate with its surroundings. This suggests that residence time within the mine is on the order of hours.
Temperature is negatively correlated with the flow of the mine water (r2 = −0.83; p < 0.001; Figure S3, Table S3) because winter flows are higher and cooler than summer flows. This relationship is less clear for the occasional very high flows (>20 L/s), which all have cool temperatures (8–10 °C) irrespective of the season due to the rapid influx and throughflow of relatively cool rainwater.
To investigate the association between temperature and species concentrations in the mine water, the strong inverse relationship between flow rate and temperature must be taken into account. Correlation coefficients between temperature and metal concentrations suggest a negative correlation in the majority of cases, i.e., higher temperatures drive lower metal concentrations (Table S3). However, partial correlation coefficients computed between temperature and the various constituents of the mine water with flow rate held constant show that this is not the case (Table S3). Therefore, the apparent inverse relationship between temperature and the concentrations of these metals is in fact an artefact of the negative correlation between flow rate and temperature.
The partial correlation coefficients calculated with flow rate held constant show a positive correlation between temperature and the concentrations of the main contaminant metals (Zn, Cd, Pb). The strongest partial correlation coefficient is between zinc and temperature (rZn,T·Q = 0.55; p < 0.001). This implies that higher water temperatures may be driving more vigorous metal sulphide oxidation within the mine workings, which is consistent with the positive partial correlation coefficient between sulphate and temperature (rSO4.T.Q = 0.61; p < 0.001). This reflects the fact that reaction kinetics in general are directly impacted by temperature [57]. Although the temperature range is just 8.0–13.5 °C in the FC28/29 water, Thiobacillus ferrooxidans, the main organism responsible for microbially mediated sulphide oxidation, becomes inactive at temperatures of <10 °C [58], so perhaps bacterial oxidation is ‘switched off’ when temperatures drop during times of high flow.
Therefore, the released metal fluxes are a balance between abiotic oxidation reactions (which increase at higher temperatures and, as previously discussed, at higher flows with more highly oxygenated water) and bacterially mediated oxidation (which is depressed at high flow rates when temperatures decrease below 10 °C).

3.5. Mineralogical Control on NMD Composition

The hydrochemical data at Force Crag demonstrate that the major control on the composition of NMD issuing from the mine is mineralogical. The main sulphides present are sphalerite and galena, which do not release acidity when they oxidise, but sufficient amounts of pyrite and chalcopyrite occur in the Force Crag vein that their oxidation generates significant acidity. However, this is neutralised by carbonates present in the mineralised vein and, to a lesser extent, silicates in the host rock, so drainage from the mine is neutral rather than acidic. The iron released by the oxidation of pyrite and chalcopyrite largely precipitates as ferrihydrite, which adsorbs some species, particularly Pb, Cu, As and Al. Therefore, the presence of pyrite and chalcopyrite both causes problems through the release of acidity and provides solutions through the precipitation of ferrihydrite and the adsorption of some contaminant metals.
Force Crag is typical of many mines in the Lake District that have similar ore mineralogy and are emplaced in silicate host rocks [59]. Therefore, the composition of the neutral mine drainage from these mines is determined by the same factors that are applicable at Force Crag, i.e., the mineralogy of the ore deposit and the host rock. The variability in the composition of the mine drainage in the Lake District is likely to be explicable in terms of the relative proportions of key minerals at the sites: iron-containing sulphides (particularly pyrite) and carbonates (particularly calcite and dolomite). These minerals are often overlooked at mine sites in this region because other minerals present are more valuable, more spectacular and/or more sought-after. In contrast, pyrite, calcite and dolomite are typically fine-grained and inconspicuous.
The same conclusions apply to mines discharging water with a near-neutral pH and elevated Zn concentrations throughout the UK. Most of these are Pb/Zn mines hosted in limestone, located in the Pennines from Northumberland to Derbyshire, where iron-containing sulphides (marcasite, pyrite, chalcopyrite and pyrrhotite) widely occur in small proportions associated with lead and zinc sulphides [60,61]. The most important factor is that iron-containing sulphides are not dominant at these sites, so the acidity released when these sulphides oxidise is rapidly neutralised by the limestone, which hosts almost all of these deposits. The dominant control on the composition of the drainage from these mines is, effectively, the same mineralogy as that present at Force Crag.
Zn is the most common contaminant metal in the neutral drainage from mines in the UK because, even if sphalerite is not abundant at a site, Zn is soluble under the hydrochemical conditions present, as it is not removed by precipitation as a supergene mineral and is less susceptible to adsorption to ferrihydrite than other contaminant metals (e.g., Pb). Cd is also soluble under these conditions and is often associated with Zn in ore deposits, usually in solid solution within sphalerite, so it too is a characteristic contaminant of NMD.
The reasons why NMD is so much more common than AMD in the UK are twofold: the dominant sulphides at most mines (sphalerite and galena) do not release acidity when they oxidise, and because most mines are hosted in limestone, there are sufficient carbonates to neutralise the acidity generated by the oxidation of any iron-containing sulphides present. This is true even when the deposits are not hosted by limestone, as the Force Crag vein attests. In contrast, AMD sites in the UK are characterised by abundant iron-containing sulphides and low, or absent, carbonate content. For example, at the Wheal Jane mine in Cornwall, a well-known AMD site, cassiterite mineralisation with abundant pyrite and arsenopyrite is associated with quartz porphyry dykes intruded into lightly metamorphosed mudstones and sandstones [62]. The dominant sulphide minerals present are iron-containing, and carbonates are virtually absent.

3.6. Hydrological Control on NMD Composition

The present study has shown that hydrological factors have a strong influence on the concentrations and fluxes of the constituents of the NMD, due in particular to:
(i)
Physical dilution of aqueous-phase metals released by mineral weathering in the subsurface;
(ii)
Variation in the degree and duration of rock–water interaction;
(iii)
Changes to the rates of reactions, including both sulphide oxidation reactions and aqueous metal attenuation processes.
In particular, it is clear from this study that flow rate plays a critical role in controlling the rates/extent of subsurface (bio)geochemical processes. An understanding of this role is crucial for remedial planning, i.e., fluctuations in flow have a key influence on metal concentration and flux, which in turn have major implications for the design of treatment systems for mine waters. Contaminant concentration and load are crucial criteria for mine-water-treatment system design [47]. The central role of flow rate in determining NMD composition suggests that engineering interventions to limit the ingress of water into mine workings, where feasible, may pay substantial dividends with respect to the size (and therefore cost) of a treatment system by limiting peak metal loadings in mine drainage. In addition, the molar mass balance approach used here revealed that there is substantial ferrihydrite precipitation within the mine workings at the Force Crag mine (which probably removes Pb, Al, As and Cu). Knowing this is important because, in situations where ferrihydrite accumulates within mine workings, there are two potentially important risks: (1) the accumulation of ferrihydrite to the extent that water is re-routed within the workings, potentially emerging to surface at a different location; and (2) the possibility of flushing large volumes of ferrihydrite during extreme flows.
The conclusions of this study also have implications for the impact of climate change on mine water remediation. Warmer temperatures are likely to result in faster sulphide oxidation and, therefore, a deterioration in mine water quality. Furthermore, an increase in the number of extreme flow events will flush more contaminant-laden ferrihydrite particles downstream, increasing pollution in streams below mine sites.

4. Conclusions

The composition of the NMD at Force Crag mine is controlled by a combination of mineralogical and hydrological factors. Mineralogy is the key control on the constituents of the drainage and exerts control on the acidity of the water (the net product of acid-generating and acid-neutralising reactions).
There are strong correlations between the flow rate of the main NMD outflow at Force Crag and the concentrations of contaminant metals and sulphate. There is also a strong inverse correlation between flow and water temperature, due primarily to seasonal fluctuations (lower flows but higher temperatures in the summer months).
The correlation coefficients reveal that Zn, Cd, Fe and SO4 are strongly inversely correlated with flow, which is indicative of dilution. In contrast, Al, Pb and Cu concentrations are positively correlated with flow due to the flushing of these metals adsorbed on ferrihydrite particles. Although Fe concentrations in the NMD are quite low, a molar mass balance approach demonstrates that (a) pyrite and chalcopyrite oxidations are prevalent in the mine workings, but that (b) there is then substantial precipitation of the iron released as ferrihydrite. The presence of ferrihydrite results in the attenuation, via adsorption, of metals such as Pb, Al, As and Cu within the workings. Thus, concentrations of these metals in the NMD are relatively minor at low flows but then increase at higher flows due to the flushing of the metals in association with ferrihydrite precipitates.
To elucidate the influence of mine water temperature on metal mobilisation within the mine workings, it is necessary to compute partial correlation coefficients. This is because there is a strong inverse relationship between temperature and mine water flow rate, and therefore the role of temperature can only be determined by holding flow rate constant. There are positive correlations between temperature and the main contaminant metals emerging from the Force Crag mine (Zn, Cd, Pb). Since there is also a correlation between temperature and sulphate concentration, this suggests more vigorous sulphide oxidation occurs at higher temperatures, resulting in higher metal concentrations in the mine water discharge.
The important roles of both flow rate and temperature in governing mine water quality have implications for the future management of such mine waters since extreme rainfall events and potentially higher temperatures may exacerbate mine water contamination problems in the UK and elsewhere.
An equivalent approach to that taken here could be used to evaluate mineralogical and hydrological controls on NMD composition at other locations across the UK and around the world. The insights gained from this research have important implications for NMD mine water remediation initiatives wherever they are needed, in particular because they illustrate the critical role of flow rate in controlling the rates and extent of subsurface (bio)geochemical processes and, therefore, in determining the concentrations and loadings of metal contaminants in mine water discharges.

Supplementary Materials

The following supporting information can be downloaded at https://www.mdpi.com/article/10.3390/min13050592/s1, Table S1: Total and filtered (0.45 μm) cation concentrations for FC29 (Level 1 discharge water at inlet to treatment system) and FC16 (Coledale Beck upstream of mine site), showing median (standard deviation), minimum and maximum (n) values; Figure S1: Saturation Indices (calculated in PhreeqC) for minerals in the Force Crag mine Level 1 discharge (at location FC29), showing (a) cerussite, (b) smithsonite, (c) ferrihydrite (amorphous), (d) siderite and (e) barite; Table S2: Molar balance calculations for one litre of water, showing the molar proportions of the different mineral dissolution/precipitation reactions (in bold, relative to sphalerite) within the mine that explain the difference in composition between input water (FC16) and outlet water (FC29); Figure S2: Relationship between flow of the Level 1 mine water discharge at Force Crag with (a) Ca and alkalinity concentrations and (b) Mg, Si and Mn concentrations; Figure S3: Relationship between temperature and flow of water leaving the Force Crag mine (FC28/29); Table S3: Full and partial Spearman’s Rho correlation coefficients (r2) and significance level (p) between mine water temperature and selected variables.

Author Contributions

Conceptualization, A.P.J. and J.A.W.; Data curation, C.J.G.; Formal analysis, A.P.J. and J.A.W.; Funding acquisition, A.P.J.; Investigation, A.P.J., C.J.G. and J.A.W.; Methodology, A.P.J., C.J.G. and J.A.W.; Project administration, A.P.J. and C.J.G.; Resources, A.P.J., C.J.G. and J.A.W.; Software, C.J.G.; Supervision, A.P.J. and J.A.W.; Validation, A.P.J. and J.A.W.; Visualization, A.P.J. and J.A.W.; Writing—original draft, A.P.J. and J.A.W.; Writing—review and editing, A.P.J., C.J.G. and J.A.W. All authors have read and agreed to the published version of the manuscript.

Funding

The research was funded by the UK Coal Authority, primarily via contract No. CA18/2377, under the umbrella of the Water and Abandoned Metal Mines Programme (WAMM). The WAMM programme is a partnership between the Environment Agency, the Coal Authority and the UK Department for Environment, Food and Rural Affairs (Defra).

Data Availability Statement

The data presented in this study are available on request from the corresponding author, subject to the prior permission of the research funder being granted.

Acknowledgments

We express our gratitude to Jane Davis, Patrick Orme (both formerly at Newcastle University) and Clair Roper (Newcastle University) for their invaluable assistance with field work and lab analysis. We are grateful to Hugh Potter (Environment Agency) for many insightful discussions about UK mine water pollution, including Force Crag. We are also indebted to the National Trust, in particular John Malley, for site access and background information. We are grateful for the comments of three anonymous reviewers that helped to improve the manuscript.

Conflicts of Interest

The authors declare no conflict of interest. The funders had no role in the design of the study; in the collection, analyses or interpretation of data; in the writing of the manuscript; or in the decision to publish the results.

References

  1. Webb, J.A.; Sasowsky, I.D. The interaction of acid mine drainage with a carbonate terrane: Evidence from the Obey River, north-central Tennessee. J. Hydrol. 1994, 161, 327–346. [Google Scholar] [CrossRef]
  2. Cravotta, C.A.; Brady, K.B.C.; Rose, A.W.; Douds, J.B. Frequency distribution of the pH of coal-mine drainage in Pennsylvania. In U.S. Geological Survey Toxic Substances Hydrology Program, Proceedings of the Technical Meeting in Charleston, SC, USA, 8–12 March 1999; Morganwalp, D.W., Buxton, H., Eds.; U.S. Geological Survey Water Resource Investigations Report 99-4018A; United States Geological Survey: Reston, VA, USA, 1999; pp. 313–324. [Google Scholar]
  3. Younger, P.L. Nature and practical implications of heterogeneities in the geochemistry of zinc-rich, alkaline mine waters in an underground F-Pb mine in the UK. Appl. Geochem. 2000, 15, 1383–1397. [Google Scholar] [CrossRef]
  4. Iribar, V. Origin of neutral mine water in flooded underground mines: An appraisal using geochemical and hydrogeological methodologies. In Proceedings of the International Mine Water Association Conference 2004, Newcastle upon Tyne, UK, 19–23 September 2004; pp. 169–178. [Google Scholar]
  5. Doulati Ardejani, F.; Rooki, R.; Jodieri Shokri, B.; Eslam Kish, T.; Aryafar, A.; Tourani, P. Prediction of rare earth elements in neutral alkaline mine drainage from Razi coal mine, Golestan province, northeast Iran, using general regression neural network. J. Environ. Eng. 2013, 139, 896–907. [Google Scholar] [CrossRef]
  6. Pope, J.; Trumm, D. Controls on Zn concentrations in acidic and neutral mine drainage from New Zealand’s bituminous coal and epithermal mineral deposits. Mine Water Environ. 2015, 34, 455–463. [Google Scholar] [CrossRef]
  7. Shahhosseini, M.; Doulati Ardejani, F.; Baafi, E. Geochemistry of rare earth elements in a neutral mine drainage environment, Anjir Tangeh, northern Iran. Int. J. Coal Geol. 2017, 183, 120–135. [Google Scholar] [CrossRef]
  8. Barago, N.; Pavoni, E.; Floreani, F.; Crosera, M.; Adami, G.; Lenaz, D.; Covelli, S. Hydrogeochemistry of thallium and other potentially toxic elements in neutral mine drainage at the decommissioned Pb-Zn Raibl mine (Eastern Alps, Italy). J. Geochem. Explor. 2023, 245, 107129. [Google Scholar] [CrossRef]
  9. Heikkinen, P.M.; Räisänen, M.L.; Johnson, R.H. Geochemical Characterisation of Seepage and Drainage Water Quality from Two Sulphide Mine Tailings Impoundments: Acid Mine Drainage versus Neutral Mine Drainage. Mine Water Environ. 2009, 28, 30–49. [Google Scholar] [CrossRef]
  10. Sracek, O.; Filip, J.; Mihaljevič, M.; Kříbek, B.; Majer, V.; Veselovský, F. Attenuation of dissolved metals in neutral mine drainage in the Zambian Copperbelt. Environ. Monit. Assess. 2011, 172, 287–299. [Google Scholar] [CrossRef]
  11. EA (Environment Agency). Prioritisation of Abandoned Non-Coal Mine Impacts on the Environment: The National Picture; Report of Project SC030136/R14; Environment Agency: Bristol, UK, 2012. [Google Scholar]
  12. Jones, A.; Rogerson, M.; Greenway, G.; Potter, H.A.B.; Mayes, W.M. Mine water geochemistry and metal flux in a major historic Pb- Zn-F orefield, the Yorkshire Pennines, UK. Environ. Sci. Pollut. Res. 2013, 20, 7570–7581. [Google Scholar] [CrossRef]
  13. Jarvis, A.P.; Davis, J.E.; Orme, P.H.A.; Potter, H.A.B.; Gandy, C.J. Predicting the benefits of mine water treatment under varying hydrological conditions using a synoptic mass balance approach. Environ. Sci. Technol. 2019, 53, 702–709. [Google Scholar] [CrossRef]
  14. Mayes, W.M.; Potter, H.A.B.; Jarvis, A.P. Riverine flux of metals from historically mined orefields in England and Wales. Water Air Soil Pollut. 2013, 224, 1425. [Google Scholar] [CrossRef]
  15. de Jonge, M.; Tipping, E.; Lofts, S.; Bervoets, L.; Blust, R. The use of invertebrate body burdens to predict ecological effects of metal mixtures in mining-impacted waters. Aquat. Toxicol. 2013, 142, 294–302. [Google Scholar] [CrossRef] [PubMed]
  16. Schmidt, T.S.; Clements, W.H.; Zuellig, R.E.; Mitchell, K.A.; Church, S.E.; Wanty, R.B.; San Juan, C.A.; Adams, M.; Lamothe, P. Critical tissue residue approach linking accumulated metals in aquatic insects to population and community-level effects. Environ. Sci. Technol. 2011, 45, 7004–7010. [Google Scholar] [CrossRef] [PubMed]
  17. Gandy, C.J.; Davis, J.E.; Orme, P.H.A.; Potter, H.A.B.; Jarvis, A.P. Metal removal mechanisms in a short hydraulic residence time subsurface flow compost wetland for mine drainage treatment. Ecol. Eng. 2016, 97, 179–185. [Google Scholar] [CrossRef]
  18. Young, B.; Cooper, A.H. The geology and mineralisation of Force Crag Mine, Cumbria. Proc. Cumberl. Geol. Soc. 1988, 5, 5–11. [Google Scholar]
  19. Fortey, N.J. Low grade metamorphism in the Lower Ordovician Skiddaw Group of the Lake District, England. Proc. Yorks. Geol. Soc. 1989, 47, 325–337. [Google Scholar] [CrossRef]
  20. Bebout, G.E.; Cooper, D.C.; Bradley, A.D.; Sadofsky, S.J. Nitrogen-isotope record of fluid-rock interactions in the Skiddaw Aureole and granite, English Lake District. Am. Mineral. 1999, 84, 1495–1505. [Google Scholar] [CrossRef]
  21. Merriman, R.J.; Breward, N.; Stone, P.; Green, K.; Kemp, S. Element Mobility and Low-Grade Metamorphism of Mudrocks in British Caledonian Basins; British Geological Survey Geology and Landscape Programme Internal Report OR/09/017; British Geological Survey: Keyworth, UK, 2009; p. 27. [Google Scholar]
  22. Eastwood, T. The Lead and Zinc Ores of the Lake District; Memoirs of the Geological Survey, Special report on the mineral resources of Great Britain 22; Her Majesty’s Stationery Office (HMSO): London, UK, 1921; p. 42. [Google Scholar]
  23. Mindat, nd. Force Crag Mine. Available online: https://www.mindat.org/loc-1468.html (accessed on 3 December 2019).
  24. Green, D.I.; McCallum, D.; Wood, M. Supergene Cu, Pb, Zn and Ag minerals from Force Crag Mine, Coledale, Cumbria. UK J. Mines Miner. 1997, 18, 10–14. [Google Scholar]
  25. Bell, F.G.; Donnelly, L.J. Mining and Its Impact on the Environment; Taylor and Francis: London, UK, 2006; p. 543. [Google Scholar]
  26. Bigham, J.; Schwertmann, U.; Traina, S.; Winland, R.; Wolf, M. Schwertmannite and the chemical modeling of iron in acid sulfate waters. Geochim. Cosmochim. Acta 1996, 60, 2111–2121. [Google Scholar] [CrossRef]
  27. Oswald, A.; Pearson, T. Force Crag Mine, Cumbria; English Heritage Archaeological Investigation Report Series AI/1/1999; Historic England: Portsmouth, UK, 1999; p. 109. [Google Scholar]
  28. Dewey, M. Mines in Cumbria. Available online: http://www.cbdc.org.uk/CumbriaLGS/Leaflets/3_046.pdf (accessed on 3 December 2019).
  29. Stumm, W.; Morgan, J.J. Aquatic Chemistry: Chemical Equilibria and Rates in Natural Waters, 3rd ed.; John Wiley & Sons Inc.: New York, NY, USA, 1996; p. 1022. [Google Scholar]
  30. Mayes, W.M.; Perks, M.T.; Large, A.R.G.; Davis, J.E.; Gandy, C.J.; Orme, P.A.H.; Jarvis, A.P. Effect of an extreme flood event on solute transport and resilience of a mine water treatment system in a mineralised catchment. Sci. Total Environ. 2021, 750, 141693. [Google Scholar] [CrossRef]
  31. UKEAP (UK Eutrophying & Acidifying Network). Bannisdale; UK-AIR 00114. © Crown 2019 copyright Defra via uk-air.defra.gov.uk, licenced under the Open Government Licence (OGL). 2019. Available online: https://uk-air.defra.gov.uk/networks/site-info?uka_id=UKA00114 (accessed on 3 December 2019).
  32. Drever, J.I. The Geochemistry of Natural Waters: Surface and Groundwater Environments, 3rd ed.; Prentice Hall: Upper Saddle River, NJ, USA, 1997. [Google Scholar]
  33. Cook, N.J.; Ciobanu, C.L.; Pring, A.; Skinner, W.; Shimizu, M.; Danyushevsky, L.; Saini-Eidukat, B.; Melcher, F. Trace and minor elements in sphalerite: A LA-ICPMS study. Geochim. Cosmochim. Acta 2009, 73, 4761–4791. [Google Scholar] [CrossRef]
  34. Wu, P.; Kershaw, R.; Dwight, K.; Wold, A. Growth and characterization of nickel-doped ZnS single crystals. Mater. Res. Bull. 1989, 24, 49–53. [Google Scholar] [CrossRef]
  35. Blanchard, M.; Alfredsson, M.; Brodholt, J.; Wright, K.; Catlow, C.R.A. Arsenic incorporation into FeS2 pyrite and its influence on dissolution: A DFT study. Geochim. Cosmochim. Acta 2007, 71, 624–630. [Google Scholar] [CrossRef]
  36. Rimstidt, J.D.; Chermak, J.A.; Gag, P.M. Rates of reaction of galena, sphalerite, chalcopyrite, and arsenopyrite with Fe(III) in acidic solutions. In Environmental Geochemistry of Sulfide Oxidation; Alpers, C.N., Blowes, D.W., Eds.; ACS Symposium Series; American Chemical Society: Washington, DC, USA, 1993; pp. 1–13. [Google Scholar]
  37. Dzombak, D.A.; Morel, F.M.M. Surface Complexation Modelling: Hydrous Ferric Oxide; Wiley-Interscience: New York, NY, USA, 1990; p. 430. [Google Scholar]
  38. Schultz, M.F.; Benjamin, M.M.; Ferguson, J.F. Adsorption and desorption of metals on ferrihydrite: Reversibility of the reaction and sorption properties of the regenerated solid. Environ. Sci. Technol. 1987, 21, 863–869. [Google Scholar] [CrossRef]
  39. McDonald, D.M.; Webb, J.A.; Taylor, J. Chemical stability of acid rock drainage treatment sludge and implications for sludge management. Environ. Sci. Technol. 2006, 40, 1984–1990. [Google Scholar] [CrossRef]
  40. Trivedi, P.; Axe, L. Modeling Cd and Zn sorption to hydrous metal oxides. Environ. Sci. Technol. 2000, 34, 2215–2223. [Google Scholar] [CrossRef]
  41. Martinez, C.E.; McBride, M.B. Dissolved and labile concentrations of Cd, Cu, Pb, and Zn in aged ferrihydrite-organic matter systems. Environ. Sci. Technol. 1999, 33, 745–750. [Google Scholar] [CrossRef]
  42. Aqion. Solubility Product Constants Ksp at 25 °C. Available online: https://www.aqion.de/site/16 (accessed on 15 April 2020).
  43. Schwartz, M.O. Cadmium in zinc deposits: Economic geology of a polluting element. Int. Geol. Rev. 2000, 42, 445–469. [Google Scholar] [CrossRef]
  44. Hering, J.; Chen, P.; Wilkie, J.; Elimelech, M.; Liang, S. Arsenic removal by ferric chloride. J. Am. Water Work. Assoc. 1996, 88, 155–167. [Google Scholar] [CrossRef]
  45. Garrels, R.M.; MacKenzie, F.T. Origin of the chemical compositions of some springs and lakes. In Equilibrium Concepts in Natural Water Systems; Stumm, W., Ed.; ACS Publications, Advances in Chemistry: Washington, DC, USA, 1967; Volume 67, pp. 222–241. [Google Scholar]
  46. Nordstrom, D.K. Hydrogeochemical processes governing the origin, transport and fate of major and trace elements from mine wastes and mineralized rock to surface waters. Appl. Geochem. 2011, 26, 1777–1791. [Google Scholar] [CrossRef]
  47. Younger, P.L.; Banwart, S.A.; Hedin, R.S. Mine Water: Hydrology, Pollution, Remediation; Environmental Pollution Series (Vol. 5); Kluwer Academic Publishers: Dordrecht, The Netherlands, 2002; p. 442. [Google Scholar]
  48. Pokrovsky, O.S.; Schott, J. Surface chemistry and dissolution kinetics of divalent metal carbonates. Environ. Sci. Technol. 2002, 36, 426–432. [Google Scholar] [CrossRef]
  49. Tucker, M.E.; Wright, V.P. Carbonate Sedimentology; Blackwell Science Ltd.: Hoboken, NJ, USA, 1990. [Google Scholar] [CrossRef]
  50. Deer, W.A.; Howie, R.A.; Zussman, J. An Introduction to the Rock-Forming Minerals. Mineralogical Society of Great Britain and Ireland; GeoScienceWorld: Tysons Corner, VA, USA, 2013. [Google Scholar] [CrossRef]
  51. Hansel, C.M.; Learman, D.R.; Lentini, C.J.; Ekstrom, E.B. Effect of adsorbed and substituted Al on Fe(II)-induced mineralization pathways of ferrihydrite. Geochim. Cosmochim. Acta 2011, 75, 4653–4666. [Google Scholar] [CrossRef]
  52. Climate-data.org. Thornthwaite Climate. Available online: https://en.climate-data.org/europe/united-kingdom/england/thornthwaite-70265/ (accessed on 3 December 2019).
  53. Bilenker, L.D.; Romano, G.Y.; McKibben, M.A. Kinetics of sulfide mineral oxidation in seawater: Implications for acid generation during in situ mining of seafloor hydrothermal vent deposits. Appl. Geochem. 2016, 75, 20–31. [Google Scholar] [CrossRef]
  54. Mendez, J.C.; Hiemstra, T. Surface area of ferrihydrite consistently related to primary surface charge, ion pair formation and specific ion adsorption. Chem. Geol. 2020, 532, 119304. [Google Scholar] [CrossRef]
  55. Nimick, D.A.; Gammons, C.H.; Parker, S.R. Diel biogeochemical processes and their effect on the aqueous chemistry of streams: A review. Chem. Geol. 2011, 283, 3–17. [Google Scholar] [CrossRef]
  56. Busby, J. Geothermal prospects in the United Kingdom. In Proceedings of the World Geothermal Congress, Bali, Indonesia, 25–30 April 2010; pp. 1–7. [Google Scholar]
  57. Schott, J.; Pokrovsky, O.S.; Oelkers, E.H. The Link Between Mineral Dissolution/Precipitation Kinetics and Solution Chemistry. Rev. Mineral. Geochem. 2009, 70, 207–258. [Google Scholar] [CrossRef]
  58. Dixon, D.G. Analysis of heat conservation during copper sulphide heap leaching. Hydrometallurgy 2000, 58, 27–41. [Google Scholar] [CrossRef]
  59. Stanley, C.J.; Vaughan, D.J. Copper, lead, zinc and cobalt mineralization in the English Lake District: Classification, conditions of formation and genesis. J. Geol. Soc. 1982, 139, 569–579. [Google Scholar] [CrossRef]
  60. Dunham, K.C. Geology of the Northern Pennine Orefield; Memoirs of the Geological Survey (Economic) HMSO: London, UK, 1990. [Google Scholar]
  61. Ford, T.D.; Worley, N.E. Mineralization of the South Pennine Orefield, UK—A review. Proc. Yorks. Geol. Soc. 2016, 61, 55–86. [Google Scholar] [CrossRef]
  62. Jackson, N.J.; Willis-Richards, J.; Manning, D.A.C.; Sams, M.S. Evolution of the Cornubian ore field, Southwest England; Part II, Mineral deposits and ore-forming processes. Econ. Geol. 1989, 84, 1101–1133. [Google Scholar] [CrossRef]
Figure 1. Force Crag mine buildings and treatment ponds, showing sampling sites: main mine water discharge (Level 1, FC30), inlets to mine water treatment ponds (FC28/29) and Coledale Beck immediately upstream of the mine (FC16). Photo by John Malley, National Trust (taken in April 2015).
Minerals 13 00592 g001
Figure 2. Scholler plot of the median total composition of rainwater, upstream Coledale Beck water (FC16) and output water from the mine (FC29) (for rainwater, Si, As and Cd are reported as half of the detection limit as all were below detection limits of 0.1 mg/L (Si) and 0.1 μg/L (As and Cd); alkalinity in mg/L as CaCO3).
Minerals 13 00592 g002
Figure 3. Relationships between sulphate, Zn, Cd and Ni in the Level 1 mine water discharge at Force Crag mine (from analyses of water at location FC29; p < 0.001 for all correlation coefficients).
Minerals 13 00592 g003
Figure 4. Relationships between flow of the Level 1 mine water discharge at Force Crag and (a) contaminant metal and sulphate concentrations and (b) contaminant metal and sulphate fluxes (p < 0.001 for all correlation coefficients).
Minerals 13 00592 g004
Figure 5. Relationship between Level 1 mine water flow and (a) total Fe concentration and percentage particulate Fe, (b) total Pb concentration and percentage particulate Pb, (c) Fe and Pb flux and (d) Ba concentration and flux (p < 0.001 for all correlation coefficients).
Minerals 13 00592 g005
Figure 6. Relationship between Level 1 mine water flow and (a) total Al concentration and percentage particulate Al, (b) total Cu concentration and percentage particulate Cu and (c) Al and Cu flux (p < 0.001 for all correlation coefficients).
Minerals 13 00592 g006
Table 1. Medians of total (0.45 μm filtered) compositions ± standard deviation of Coledale Beck water upstream of the mine (FC16), output water from the mine (FC28/29) and nearby rainfall (Bannisdale; UK-AIR 00114 [31]; n = a 124, b 137; c concentrations in rainfall sample from 2 February 2022); for FC16 and FC28/29 n, number of measurements of total concentration, or filtered if no total measurements = d 34, e 18, f 16, g 12, h 11, I 132, j 131, k 97, l 100, m 72, n 42. Filtered anion concentrations only. All analyses of K at FC16 and FC28/29 were below detection limit (1 mg/L). See Table S1 for additional details.
UnitsRainfallFC16FC28/29
pH 5.83 ± 0.58 a4.97 ± 0.39 d6.56 ± 0.38 i
Alkalinitymg/L as CaCO3 (<1.0) d(14.3 ± 3.86) i
Clmg/L2.32 ± 2.86 a(5.60 ± 1.67) d(5.50 ± 0.46) i
SO4mg/L0.89 ± 0.53 b(2.40 ± 0.39) d(27.0 ± 6.09) i
Camg/L0.17 ± 0.96 b0.46 (0.45) ± 0.08 d10.2 (10.1) ± 2.51 i
Mgmg/L0.14 ± 0.17 b0.67 (0.67) ± 0.13 d3.61 (3.60) ± 0.78 i
Namg/L1.33 ± 1.60 b3.00 (3.00) ± 0.59 d2.95 (2.94) ± 0.28 i
Simg/Lbdl c0.77 (0.77) ± 0.09 d3.00 (2.93) ± 0.53 i
Feµg/L1.36 c11.3 (8.76) ± 7.24 e503 (127) ± 127 j
Mnµg/L0.60 c20.0 (20.0) ± 4.57 d536 (521) ± 131 i
Alµg/L1.75 c139 (133) ± 46.5 d58.0 (13.3) ± 55.1 i
Znµg/L2.49 c20.0 (20.0) ± 4.17 d3190 (3030) ± 723 i
Pbµg/L0.22 c0.86 (0.64) ± 0.77 f34.0 (1.35) ± 10.7 k
Cuµg/L0.29 c0.83 (0.77) ± 0.19 f4.00 (2.00) ± 1.83 k
Cdµg/Lbdl c0.05 (0.05) ± 0.04 f14.8 (14.1) ± 3.33 l
Niµg/L0.10 c1.61 (1.59) ± 0.22 f16.1 (16.0) ± 3.19 l
Baµg/L 13.1 (nd) ± 3.79 g84.8 (85.3) ± 26.6 m
Srµg/L 3.50 (nd) ± 0.34 h23.0 (22.5) ± 3.18 m
Asµg/L 0.24 (0.22) ± 0.05 f2.39 (1.45) ± 0.49 n
Note: bdl = below detection limits; nd = no data; standard deviation for filtered composition if total composition not available.
Table 2. Molar balance calculations for one litre of water, showing the molar proportions of the different mineral dissolution (diss.)/precipitation (precip.) reactions (in bold, relative to sphalerite) within the mine that explain the difference in composition (comp.) between input water (FC16) and outlet water (FC29); see text for explanation. For ferrihydrite, the general formula Fe(OH)3 was used. Cd, Ni and Cu were not taken into consideration as the amounts were too small to make a difference. Mg was not included because the relative proportions contributed by dolomite and chlorite dissolution could not be constrained. Full details of all calculations given in Table S2, which shows calculated FC29 composition to match actual composition for all constituents shown.
FC16 Comp.Sphalerite Diss.Galena Diss.Pyrite Diss.Calcite Diss.Ferrihydrite Precip.FC29 Comp.
Molar ratio 1.02.221.05.00.8
S2.50 × 10−54.87 × 10−51.08 × 10−49.94 × 10⁻⁵ 2.81 × 10⁻⁴
Ca1.15 × 10−5 2.44 × 10⁻⁴ 2.55 × 10⁻⁴
Fe2.03 × 10−7 4.97 × 10⁻⁵ −4.09 × 10−59.04 × 10−6
Zn3.06 × 10−74.87 × 10⁻⁵ 4.90 × 10⁻⁵
Pb4.15 × 10−9 1.08 × 10⁻⁴ −1.08 × 10−41.64 × 10−7
HCO38.20 × 10−6 4.87 × 10⁻⁴ 2.86 × 10⁻⁴
H+1.07 × 10⁻⁵ 1.99 × 10⁻⁴ 2.82 × 10⁻⁷
Disclaimer/Publisher’s Note: The statements, opinions and data contained in all publications are solely those of the individual author(s) and contributor(s) and not of MDPI and/or the editor(s). MDPI and/or the editor(s) disclaim responsibility for any injury to people or property resulting from any ideas, methods, instructions or products referred to in the content.

