
Study on Continuously Weakening Mechanism of Heap Leaching Velocity of Weathered Rare Earth Ores with the Increase of Ore Burial Depth

Abstract
:1. Introduction
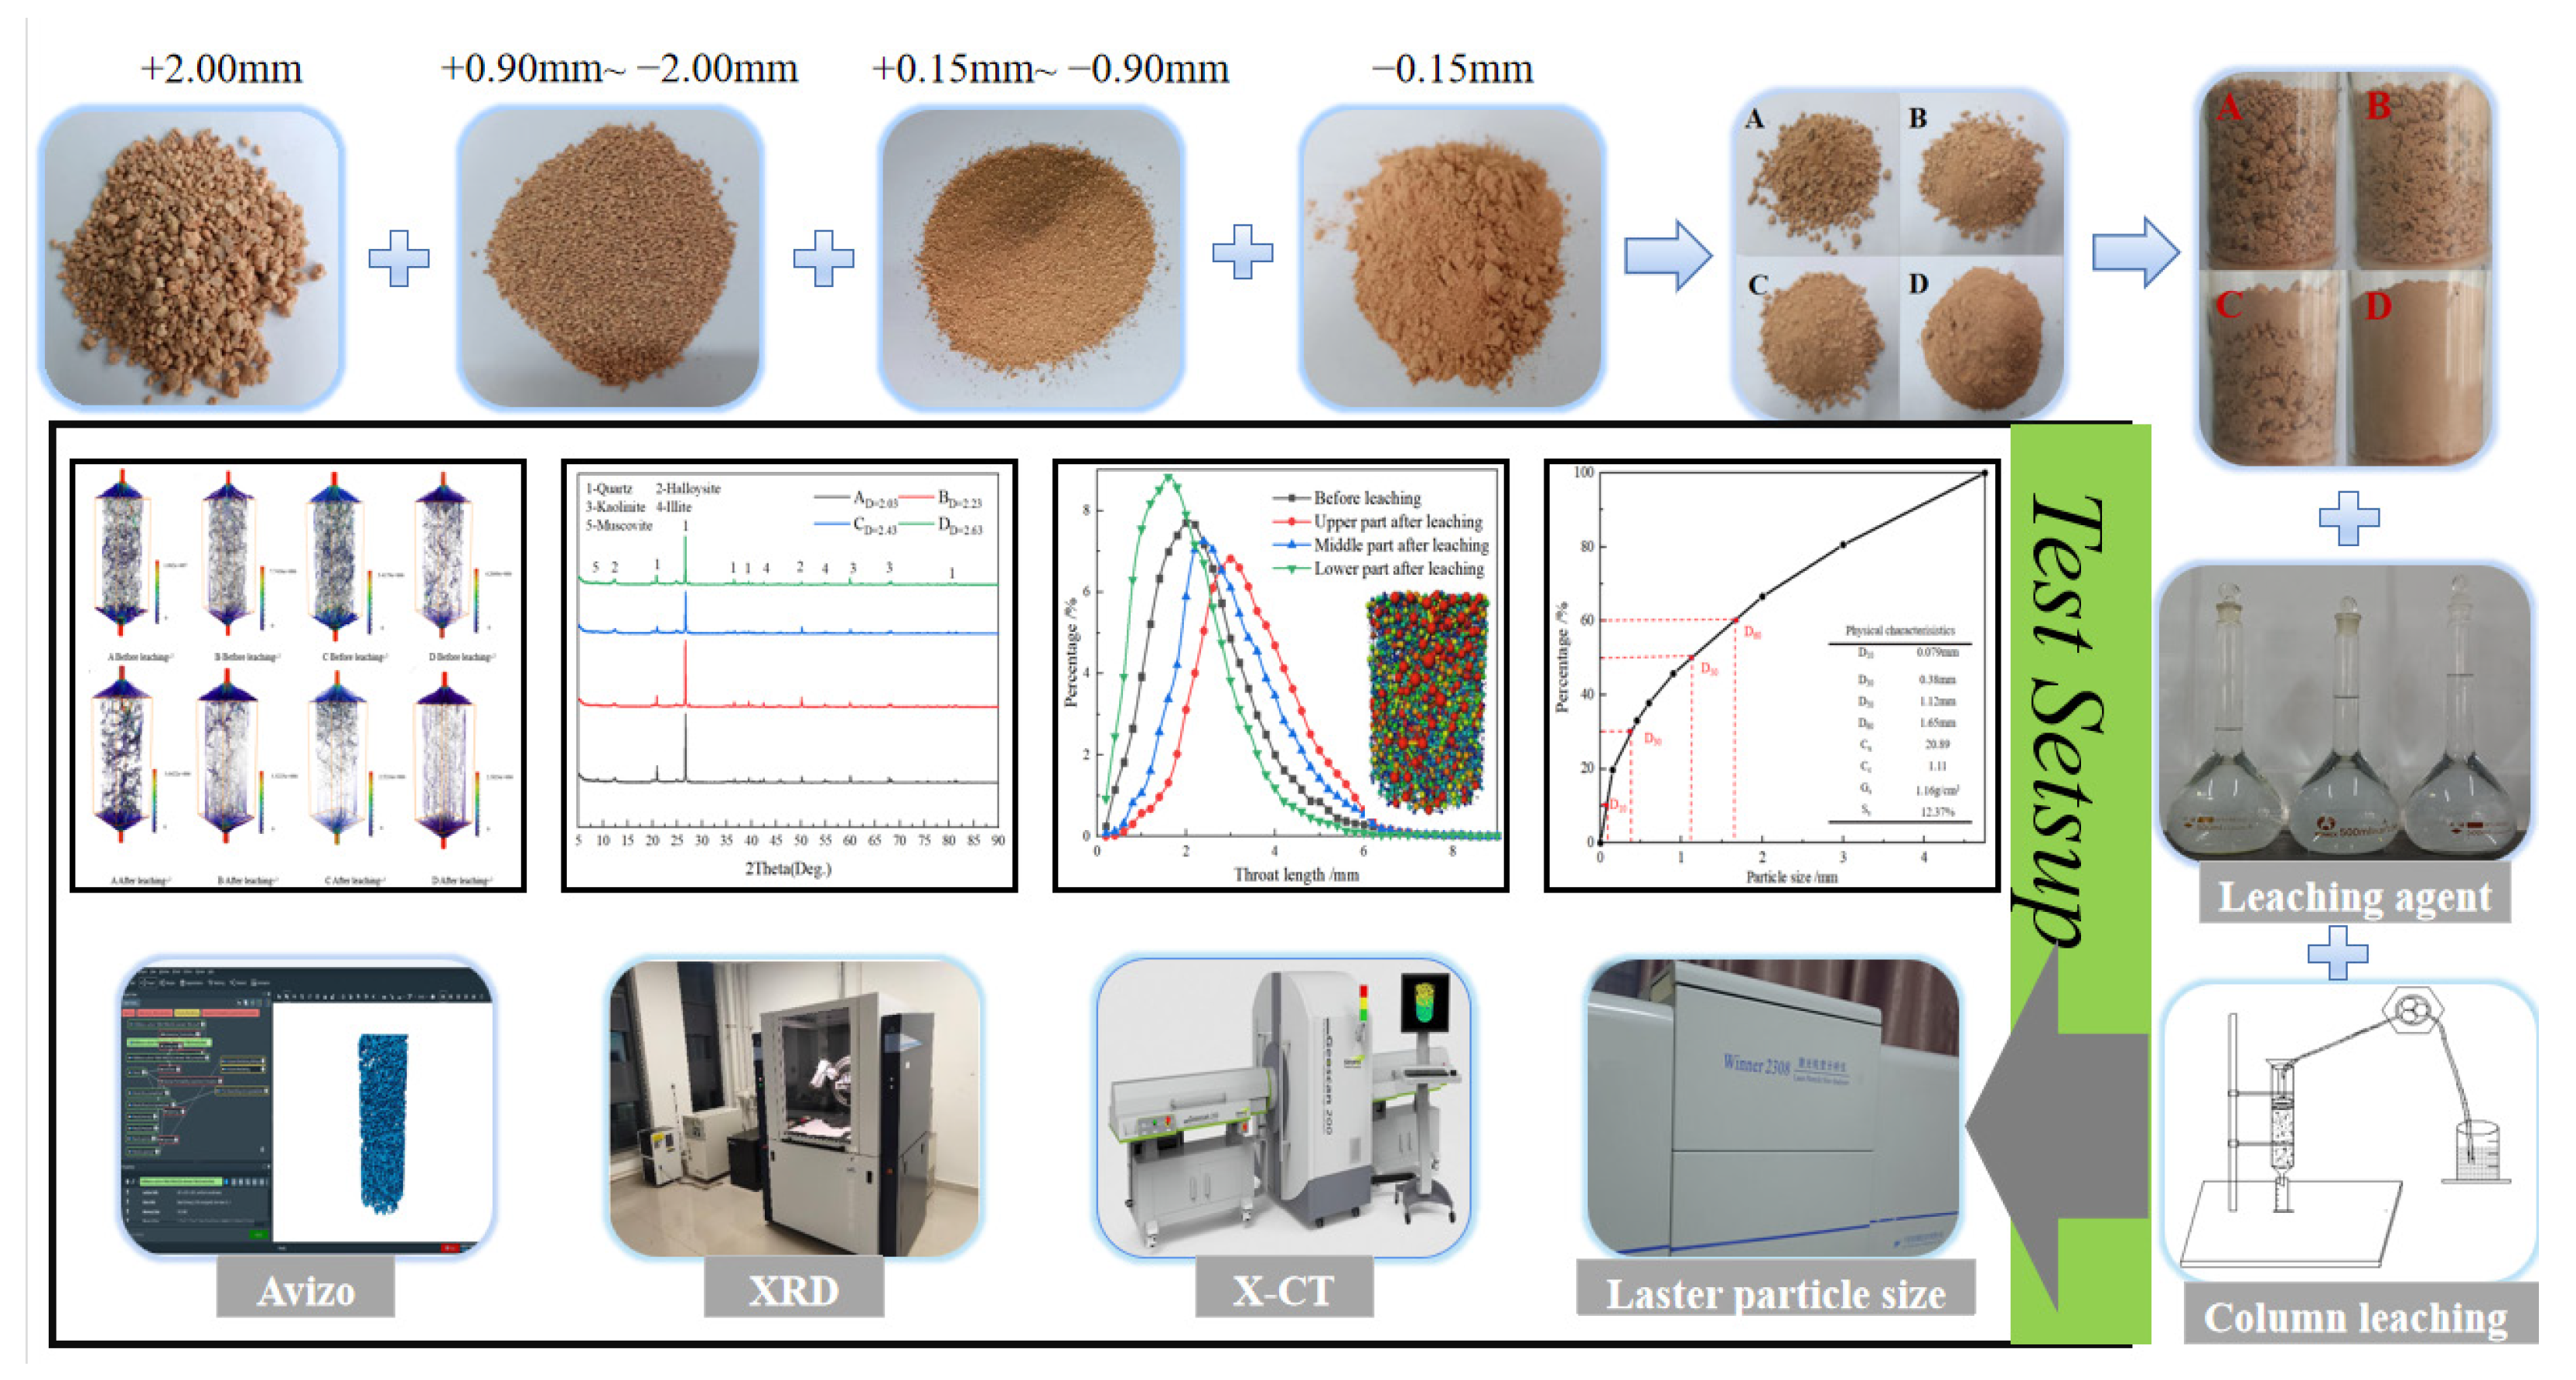
2. Experimental
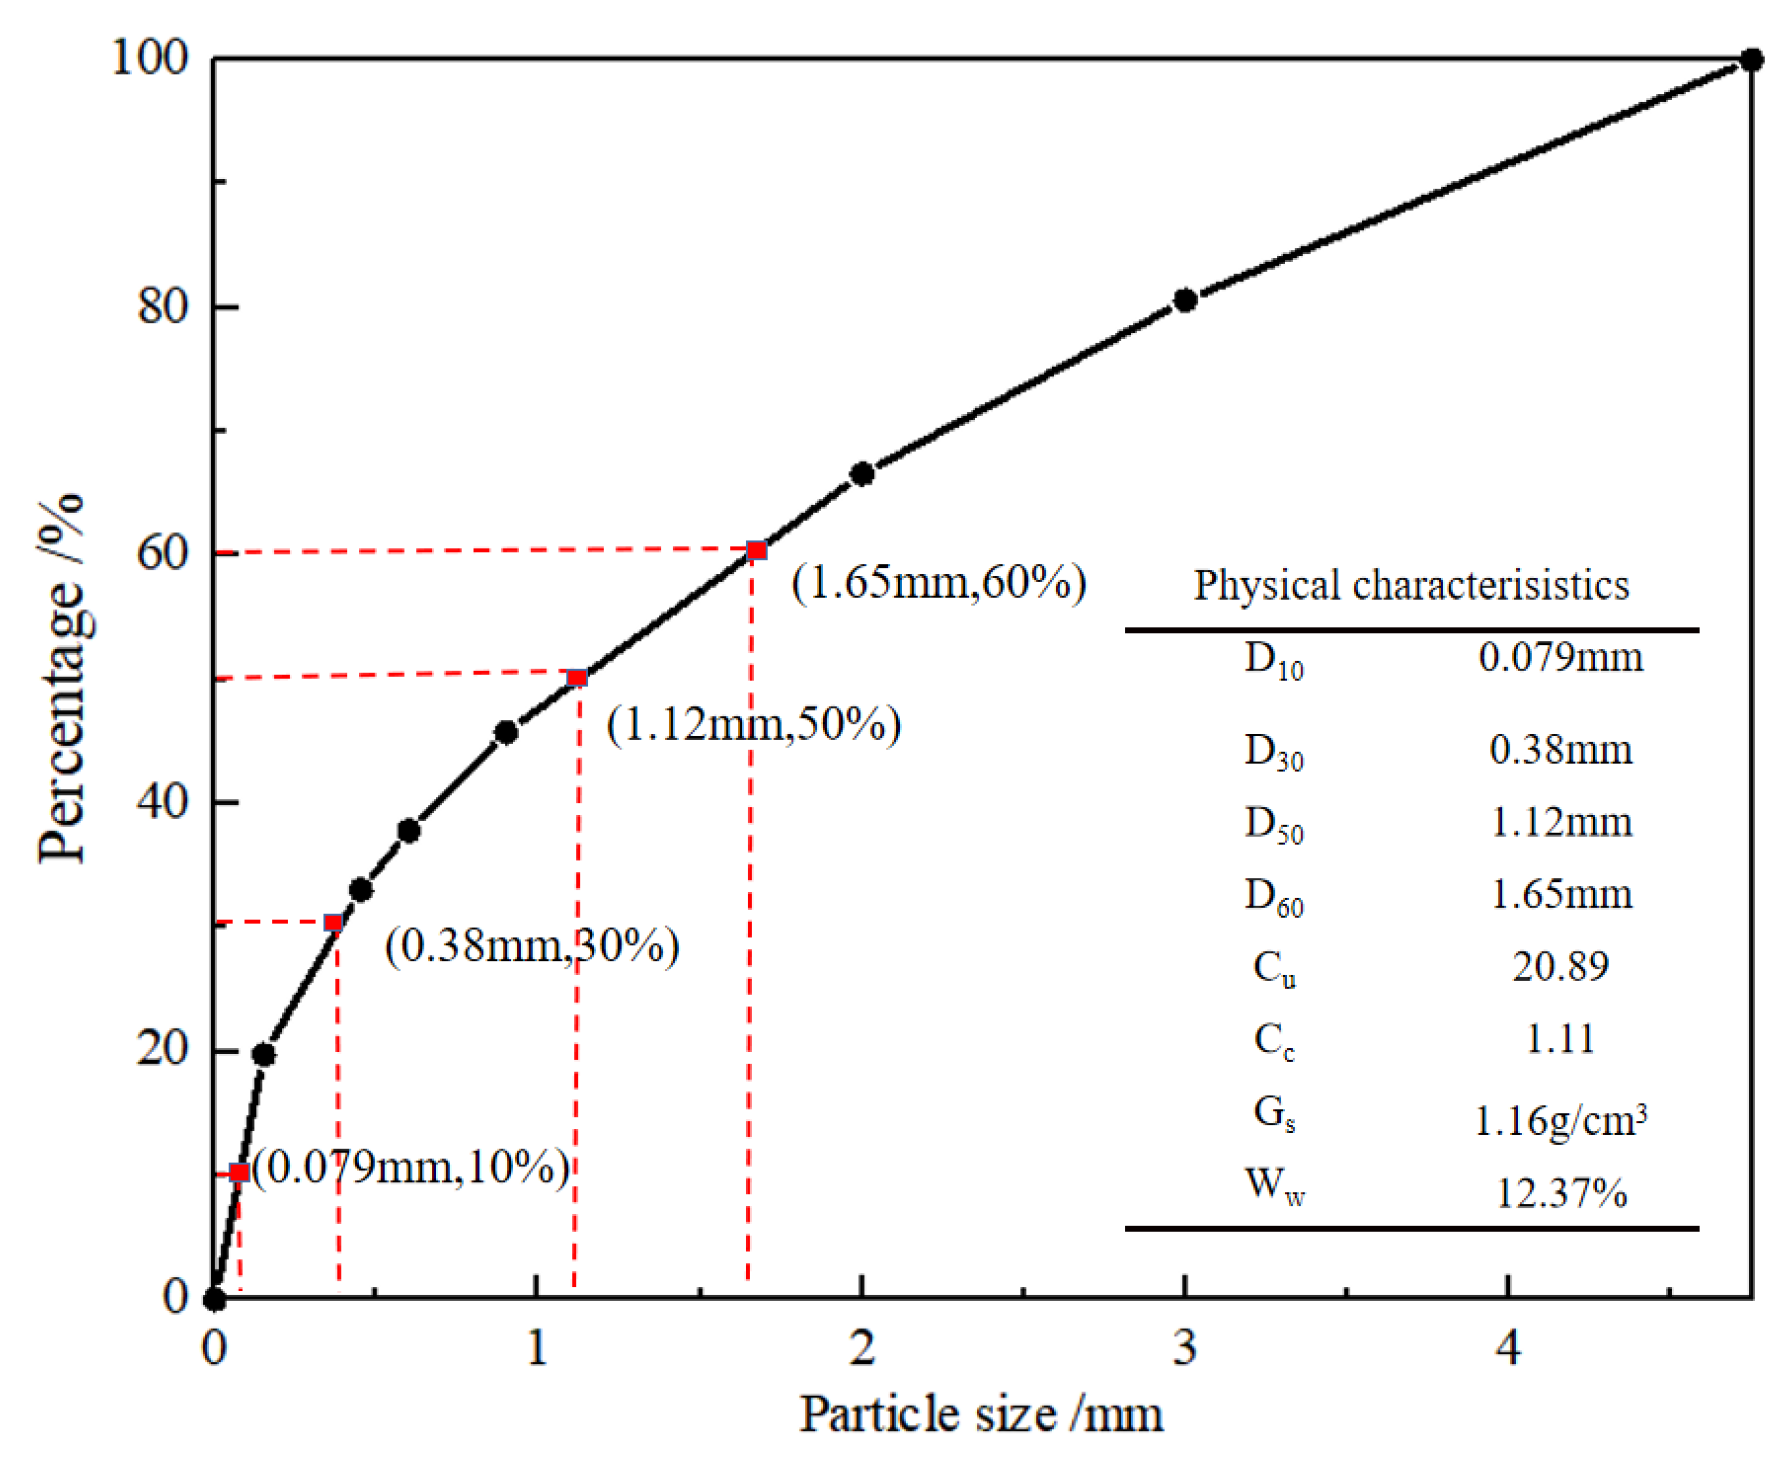
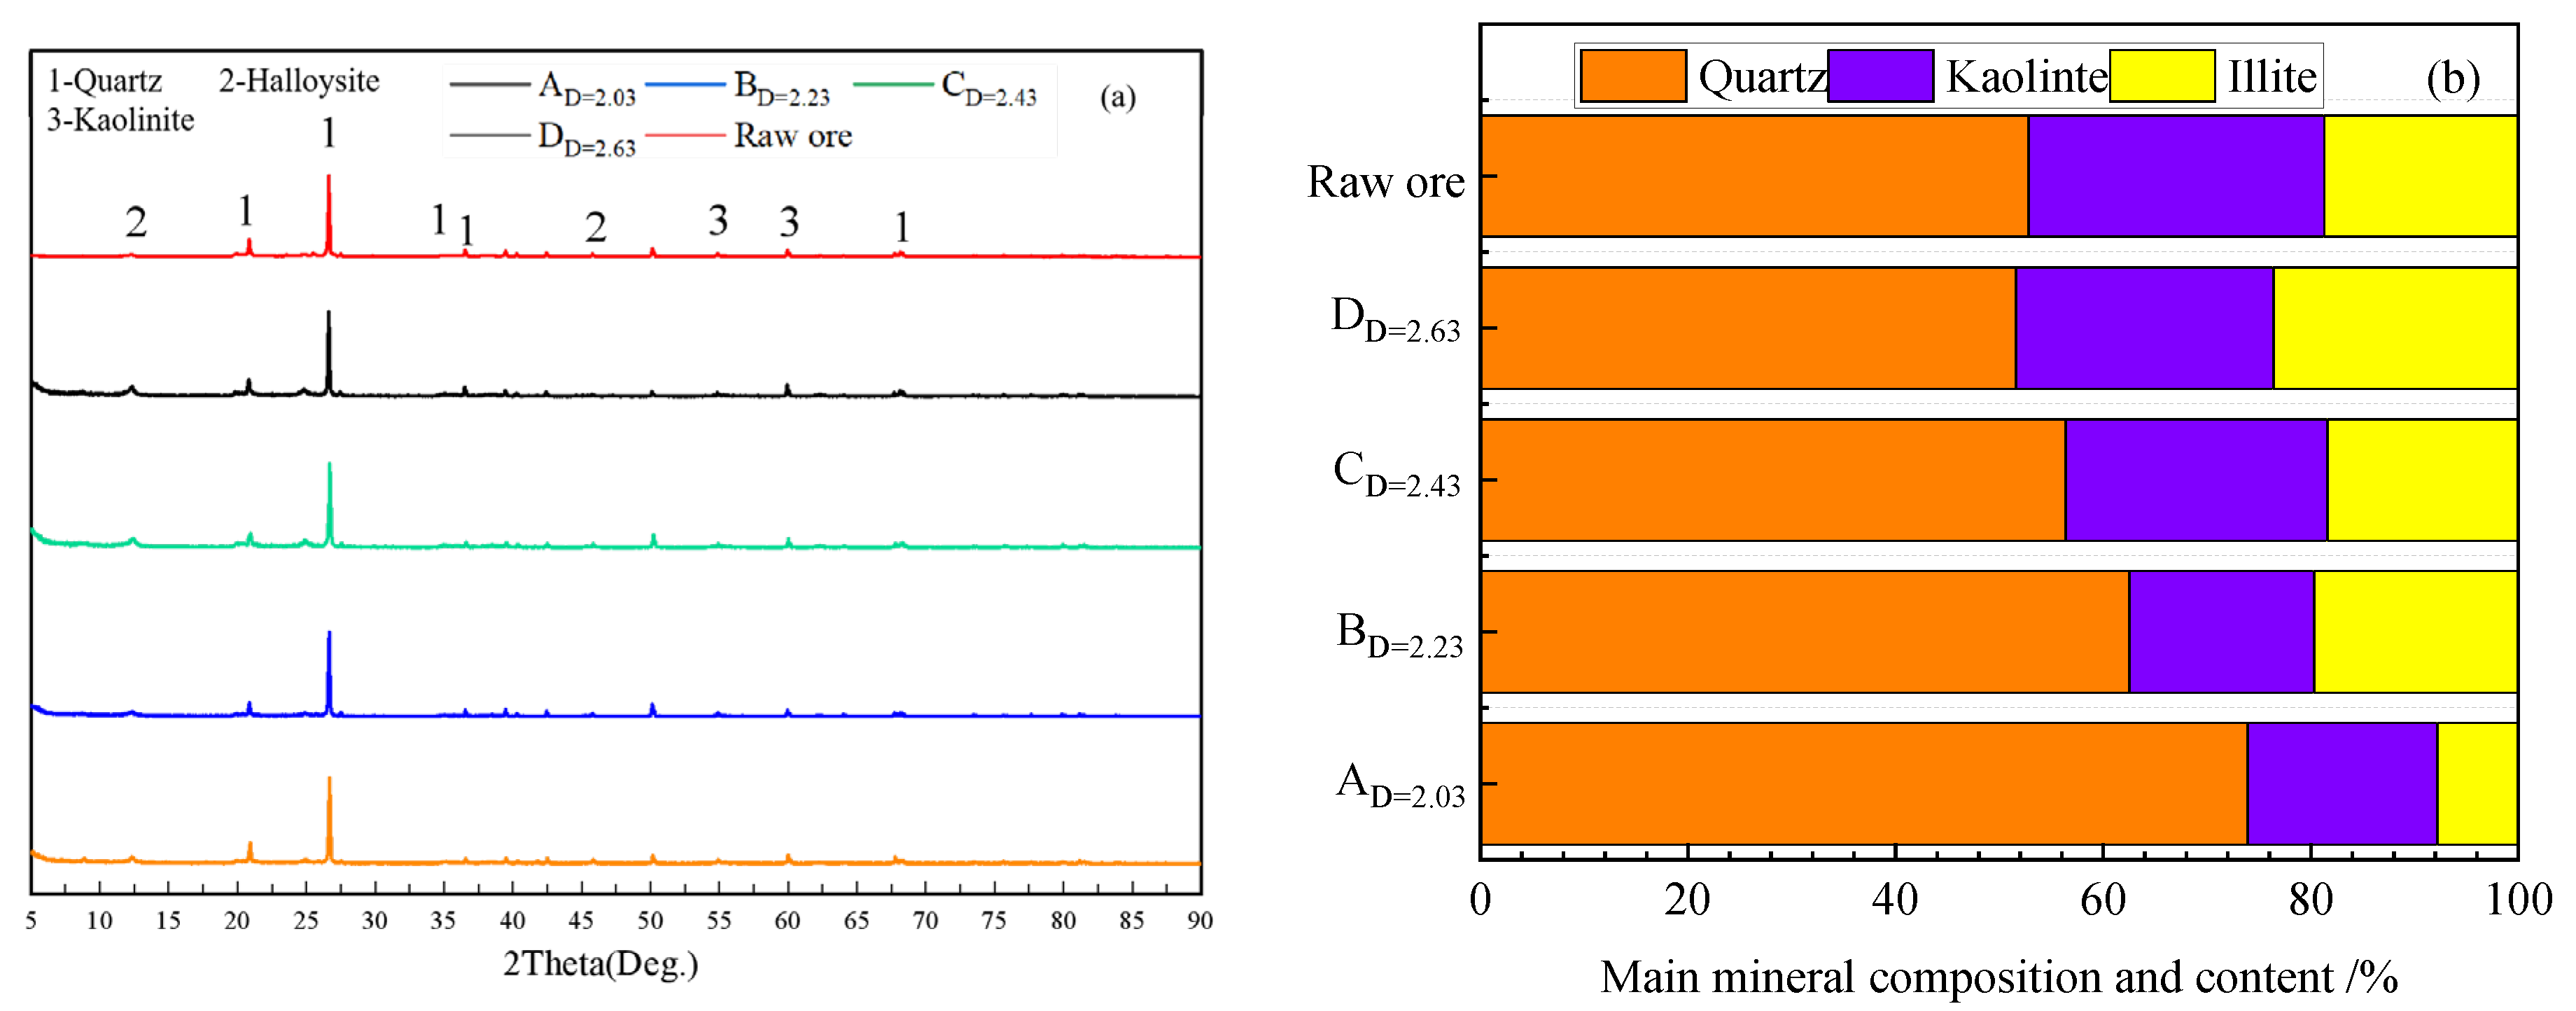
2.1. Raw Ore Characteristics
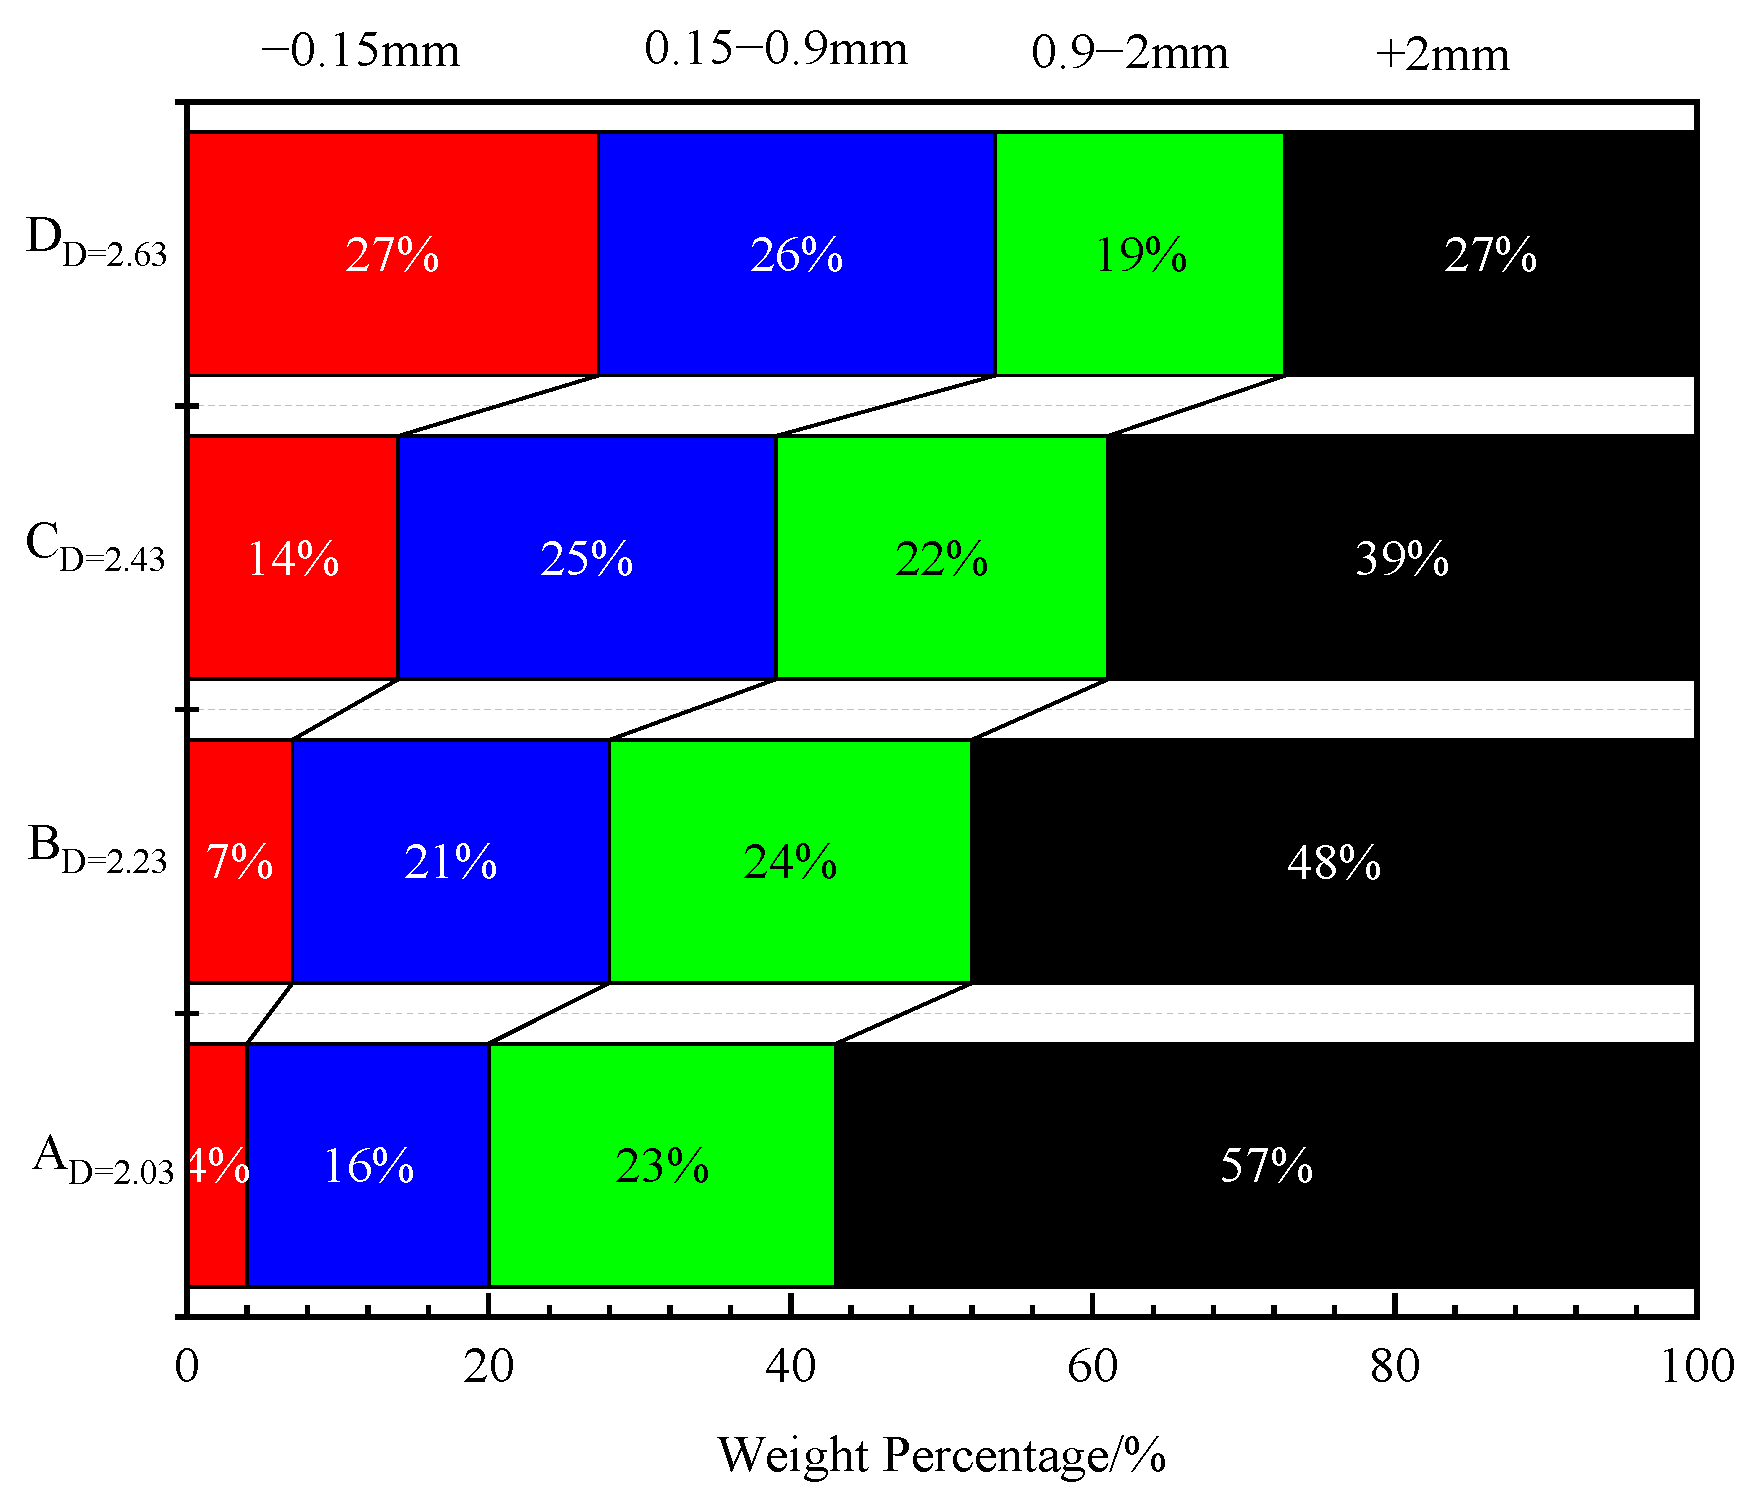
2.2. Experimental Samples
2.3. Experimental Methods
2.3.1. Column Leaching Experiments
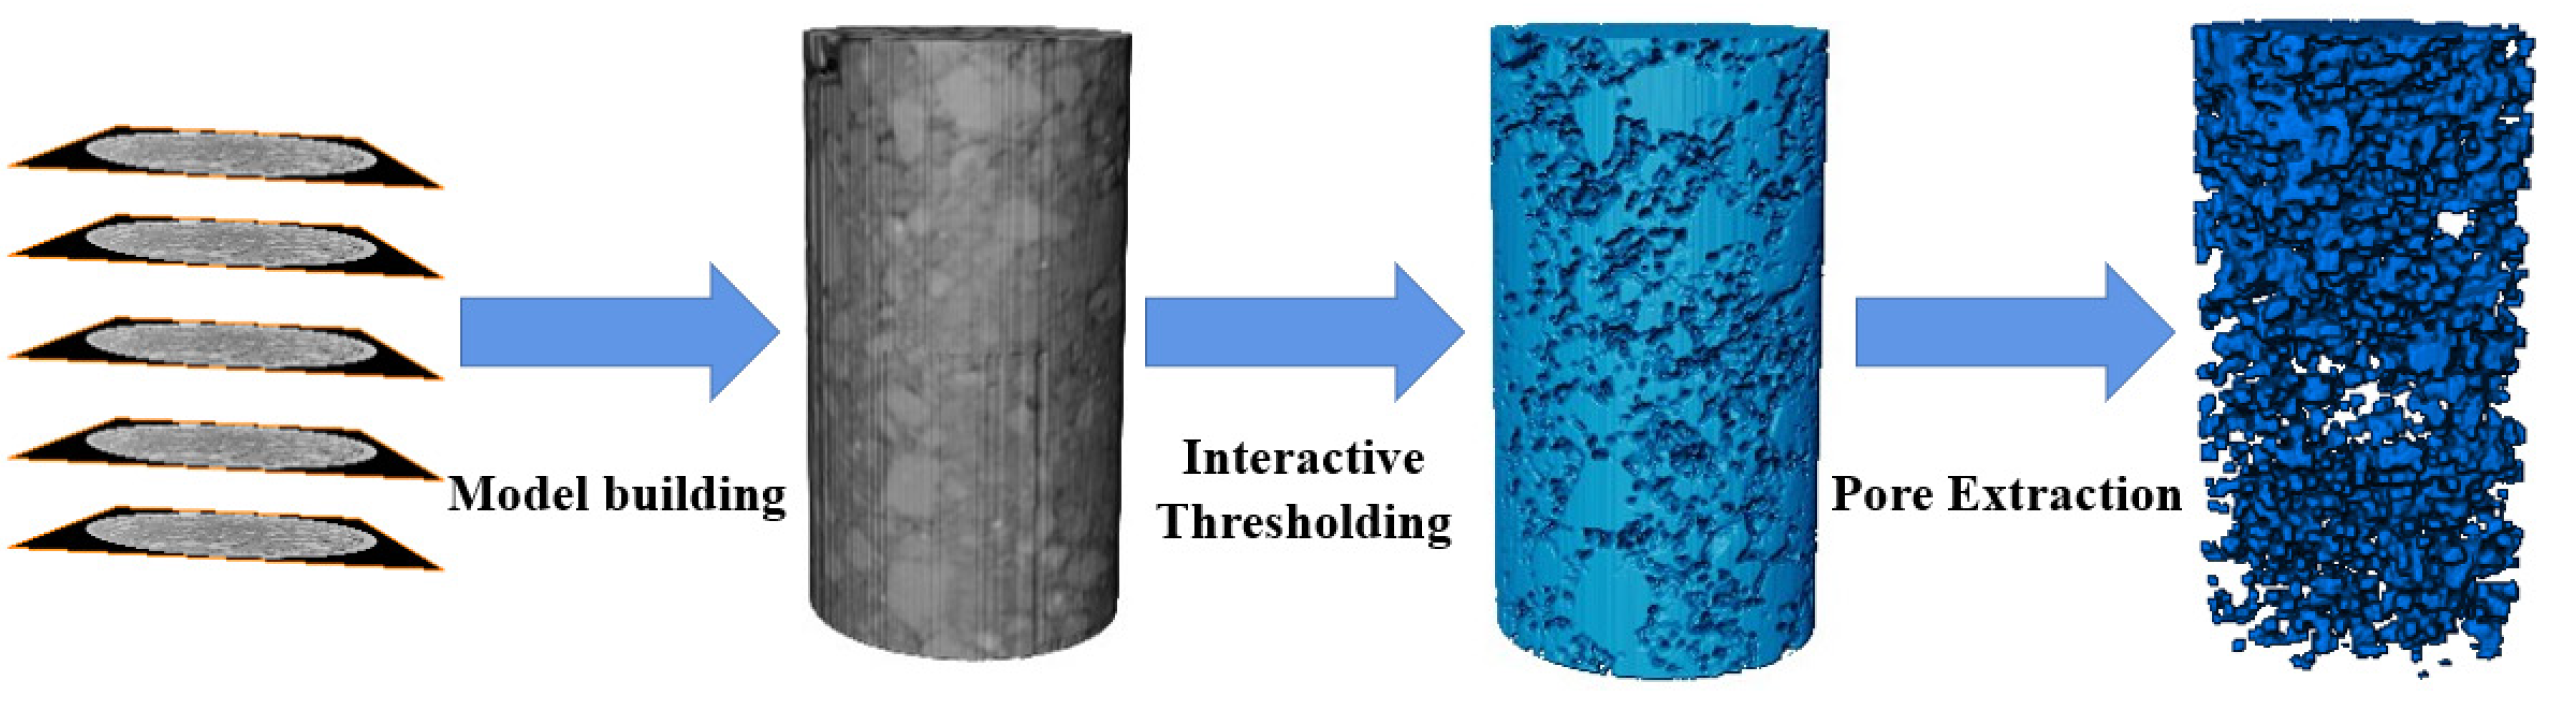
2.3.2. Construction of Three-Dimensional Pore Structure
2.3.3. Numerical Simulation Analysis
3. Results
3.1. Evolution Characteristics of the Pore Structure of Rare Earth Ores during Leaching
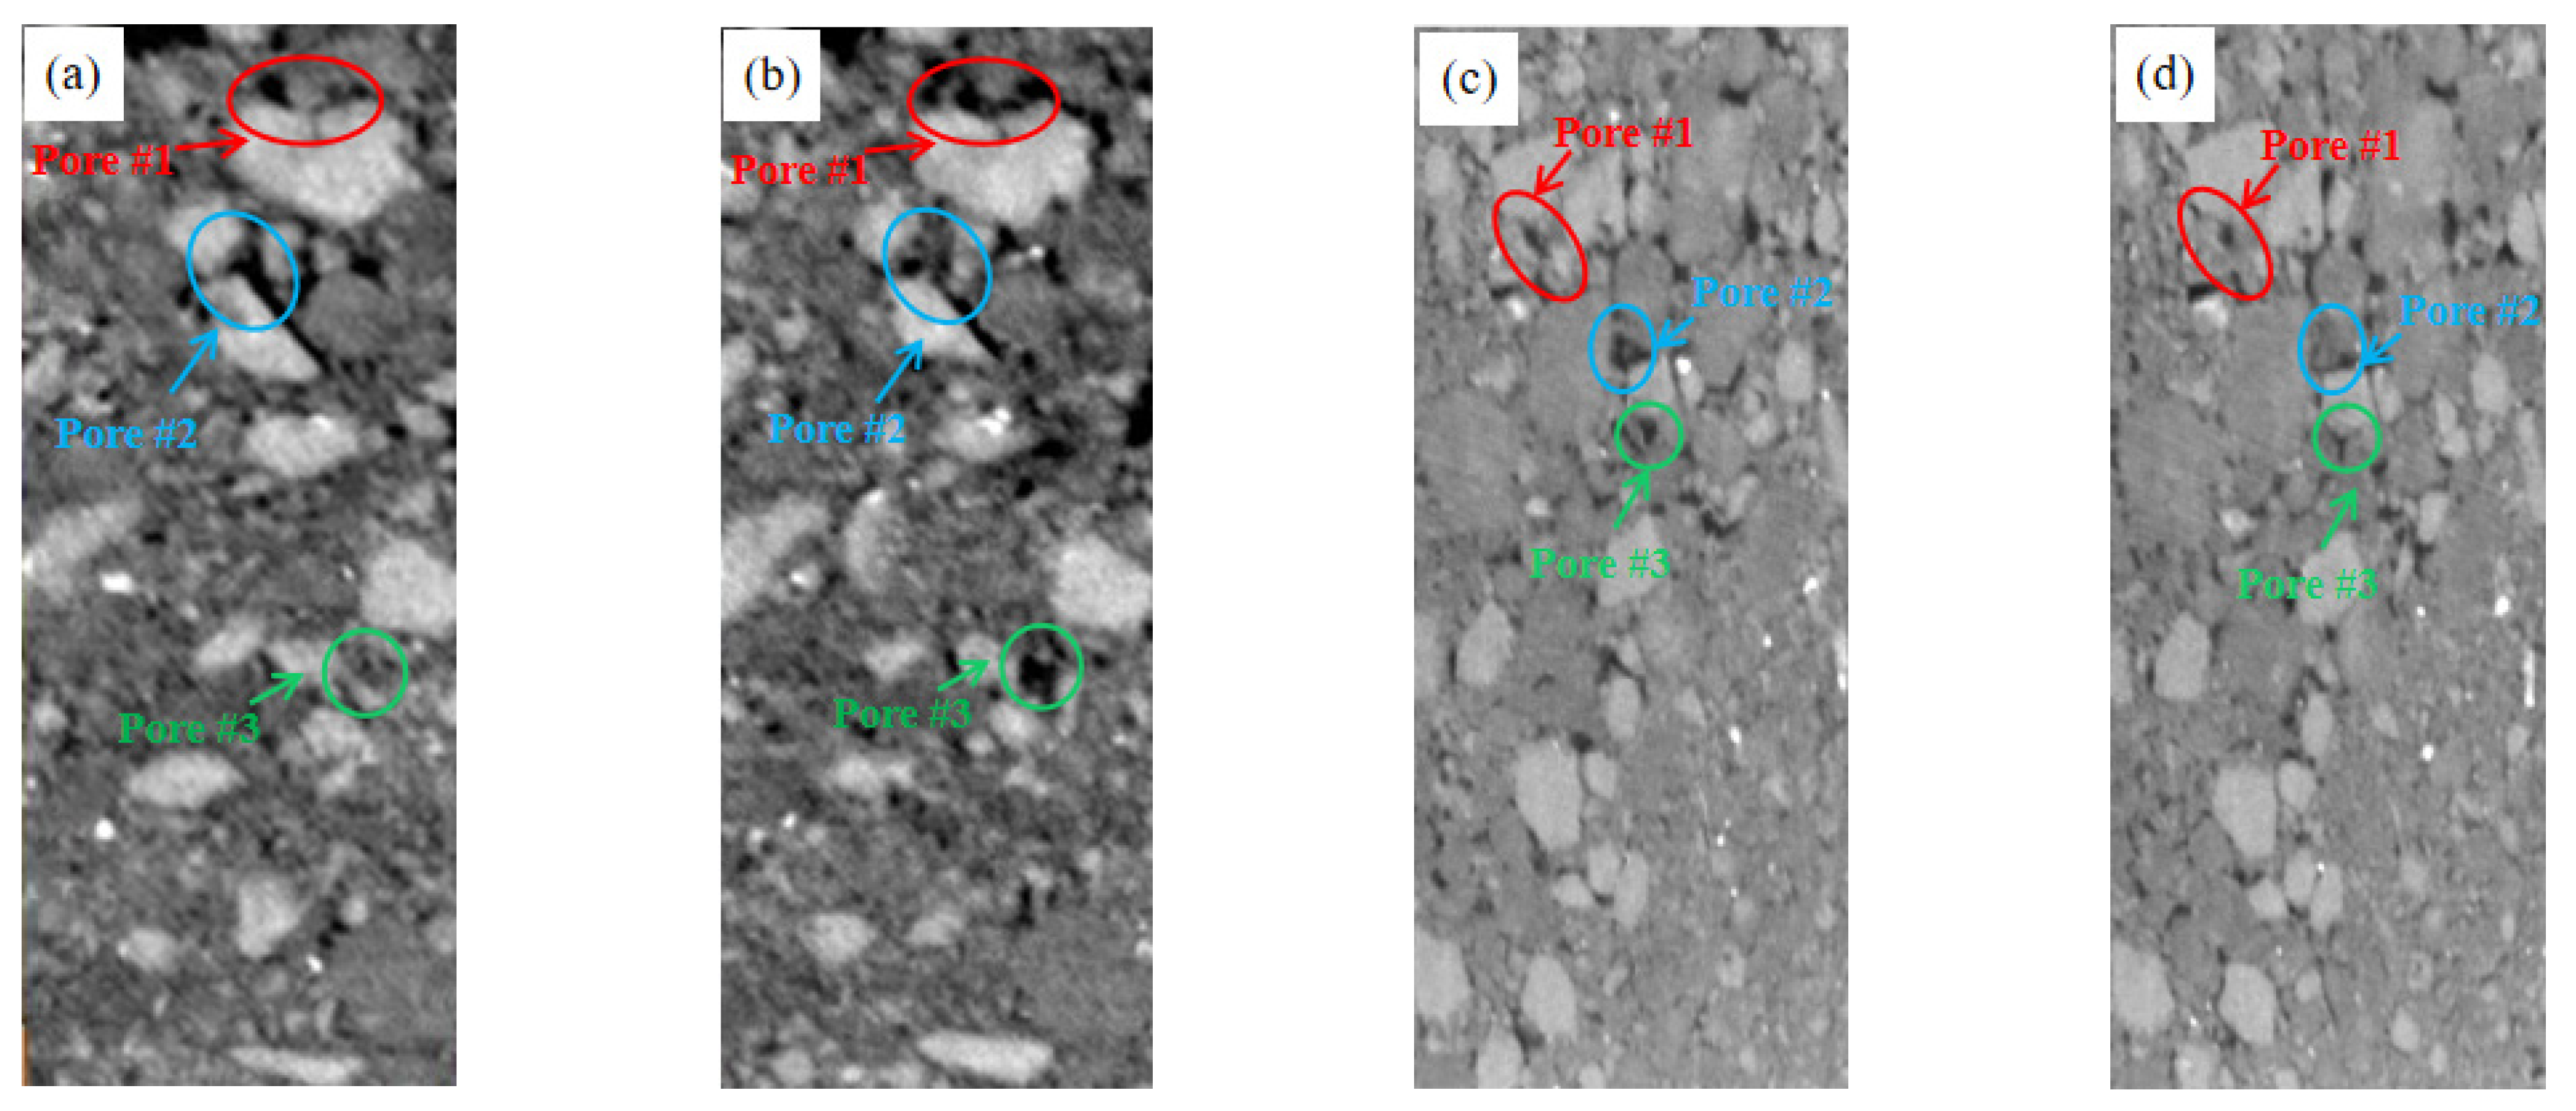
3.1.1. Evolution Law of Pore Characteristic Parameters
- (1)
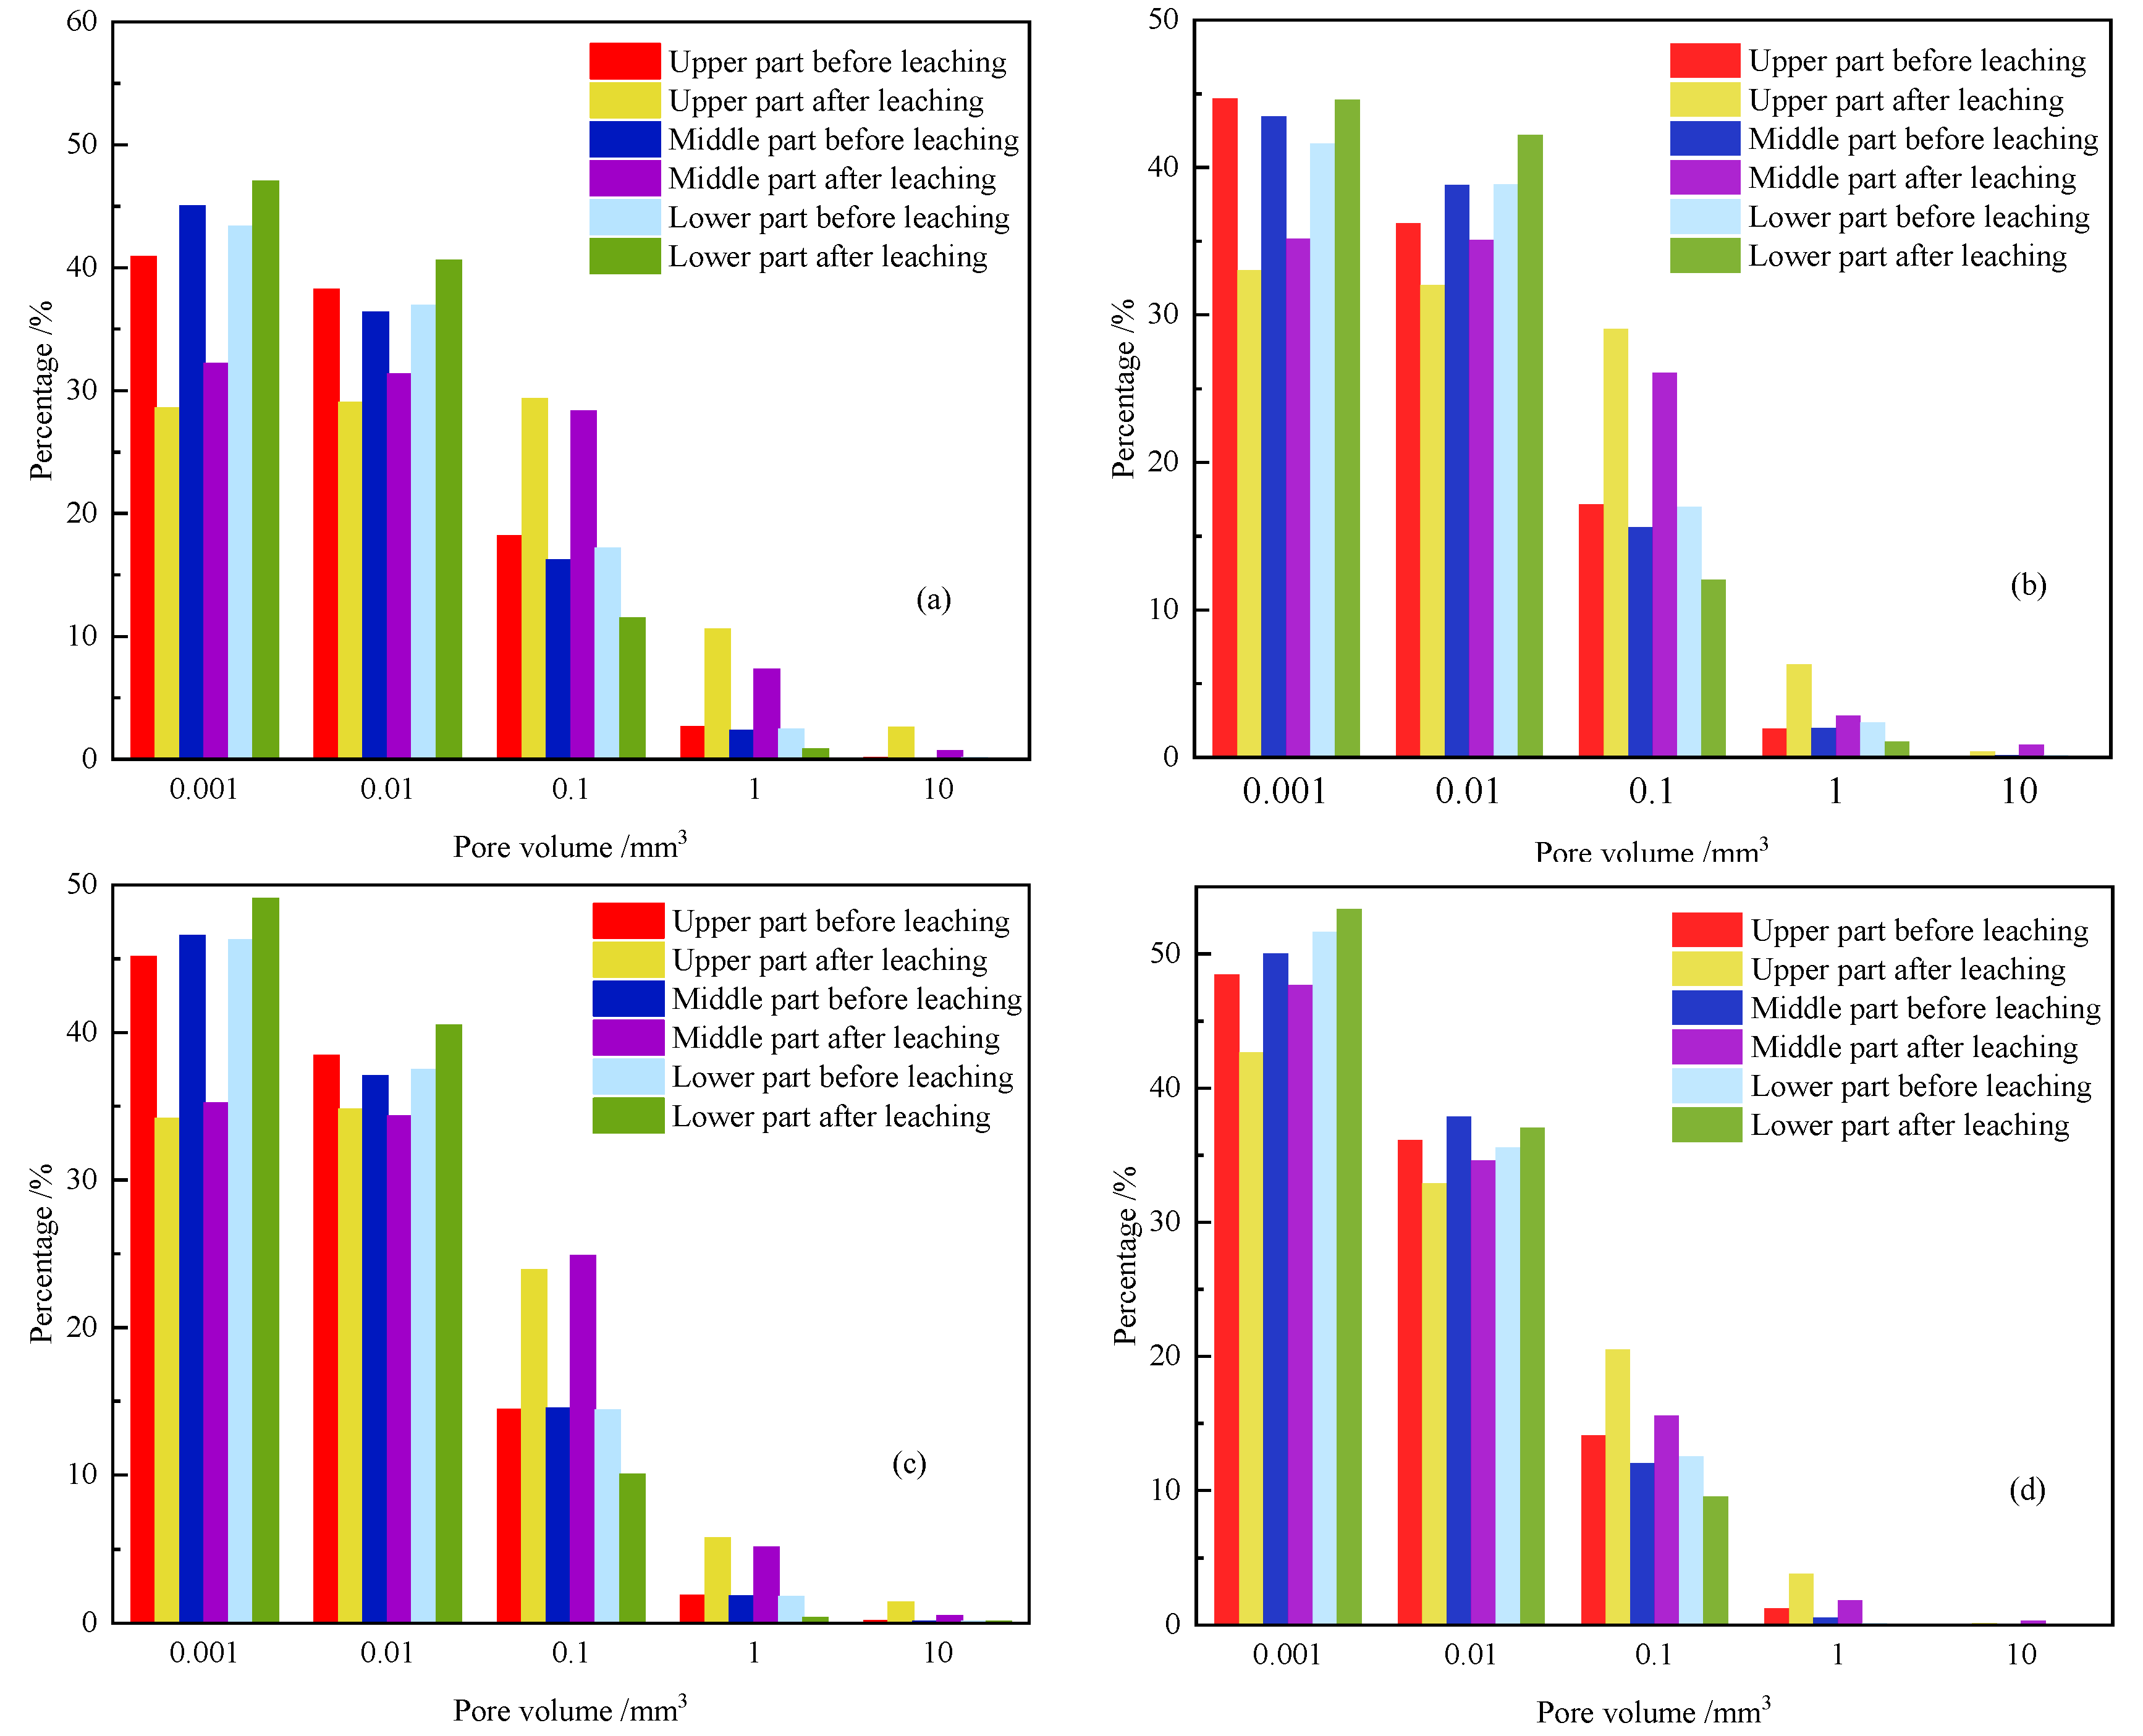
- Pore volume
- (2)
- Pore connectivity
- (3)
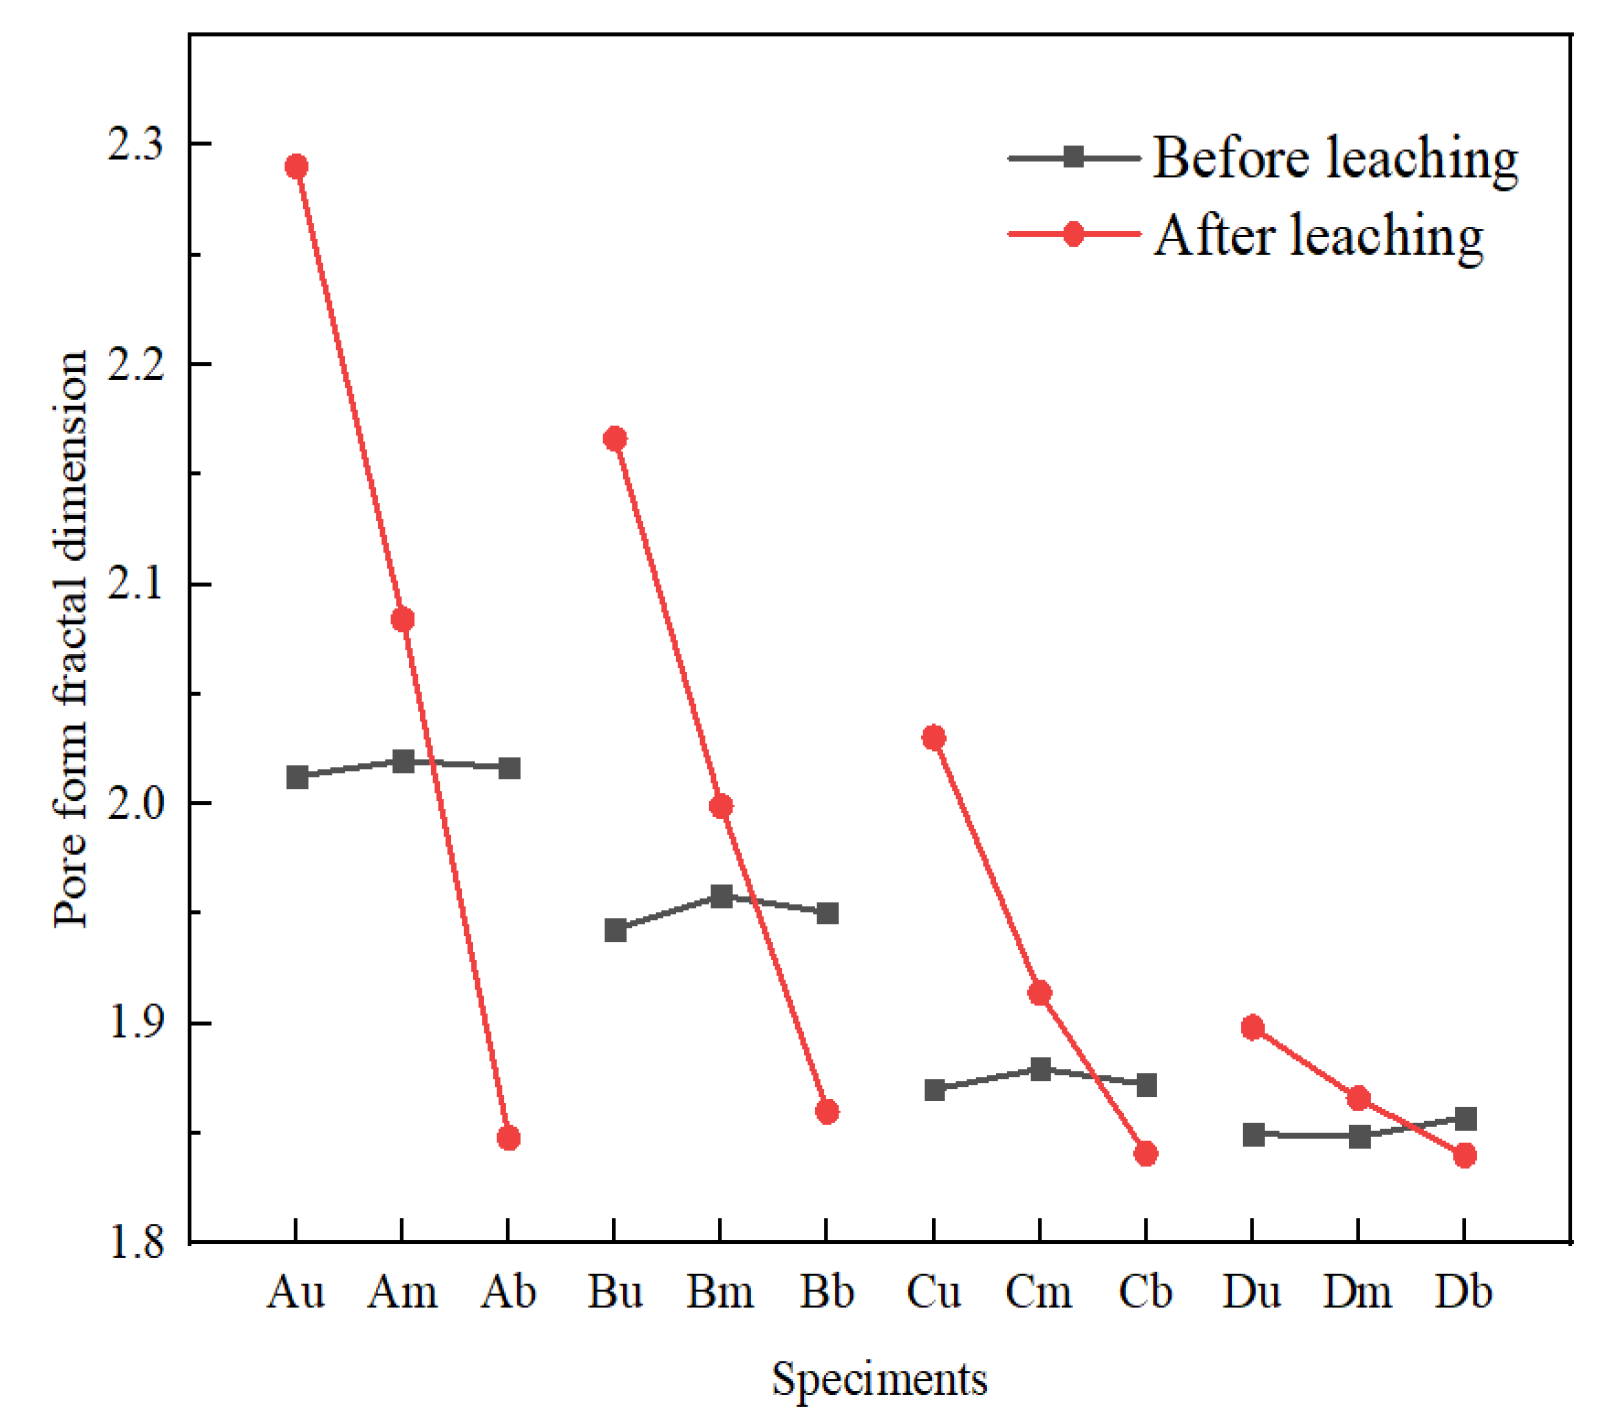
- Fractal dimension of the pore shape
- (4)
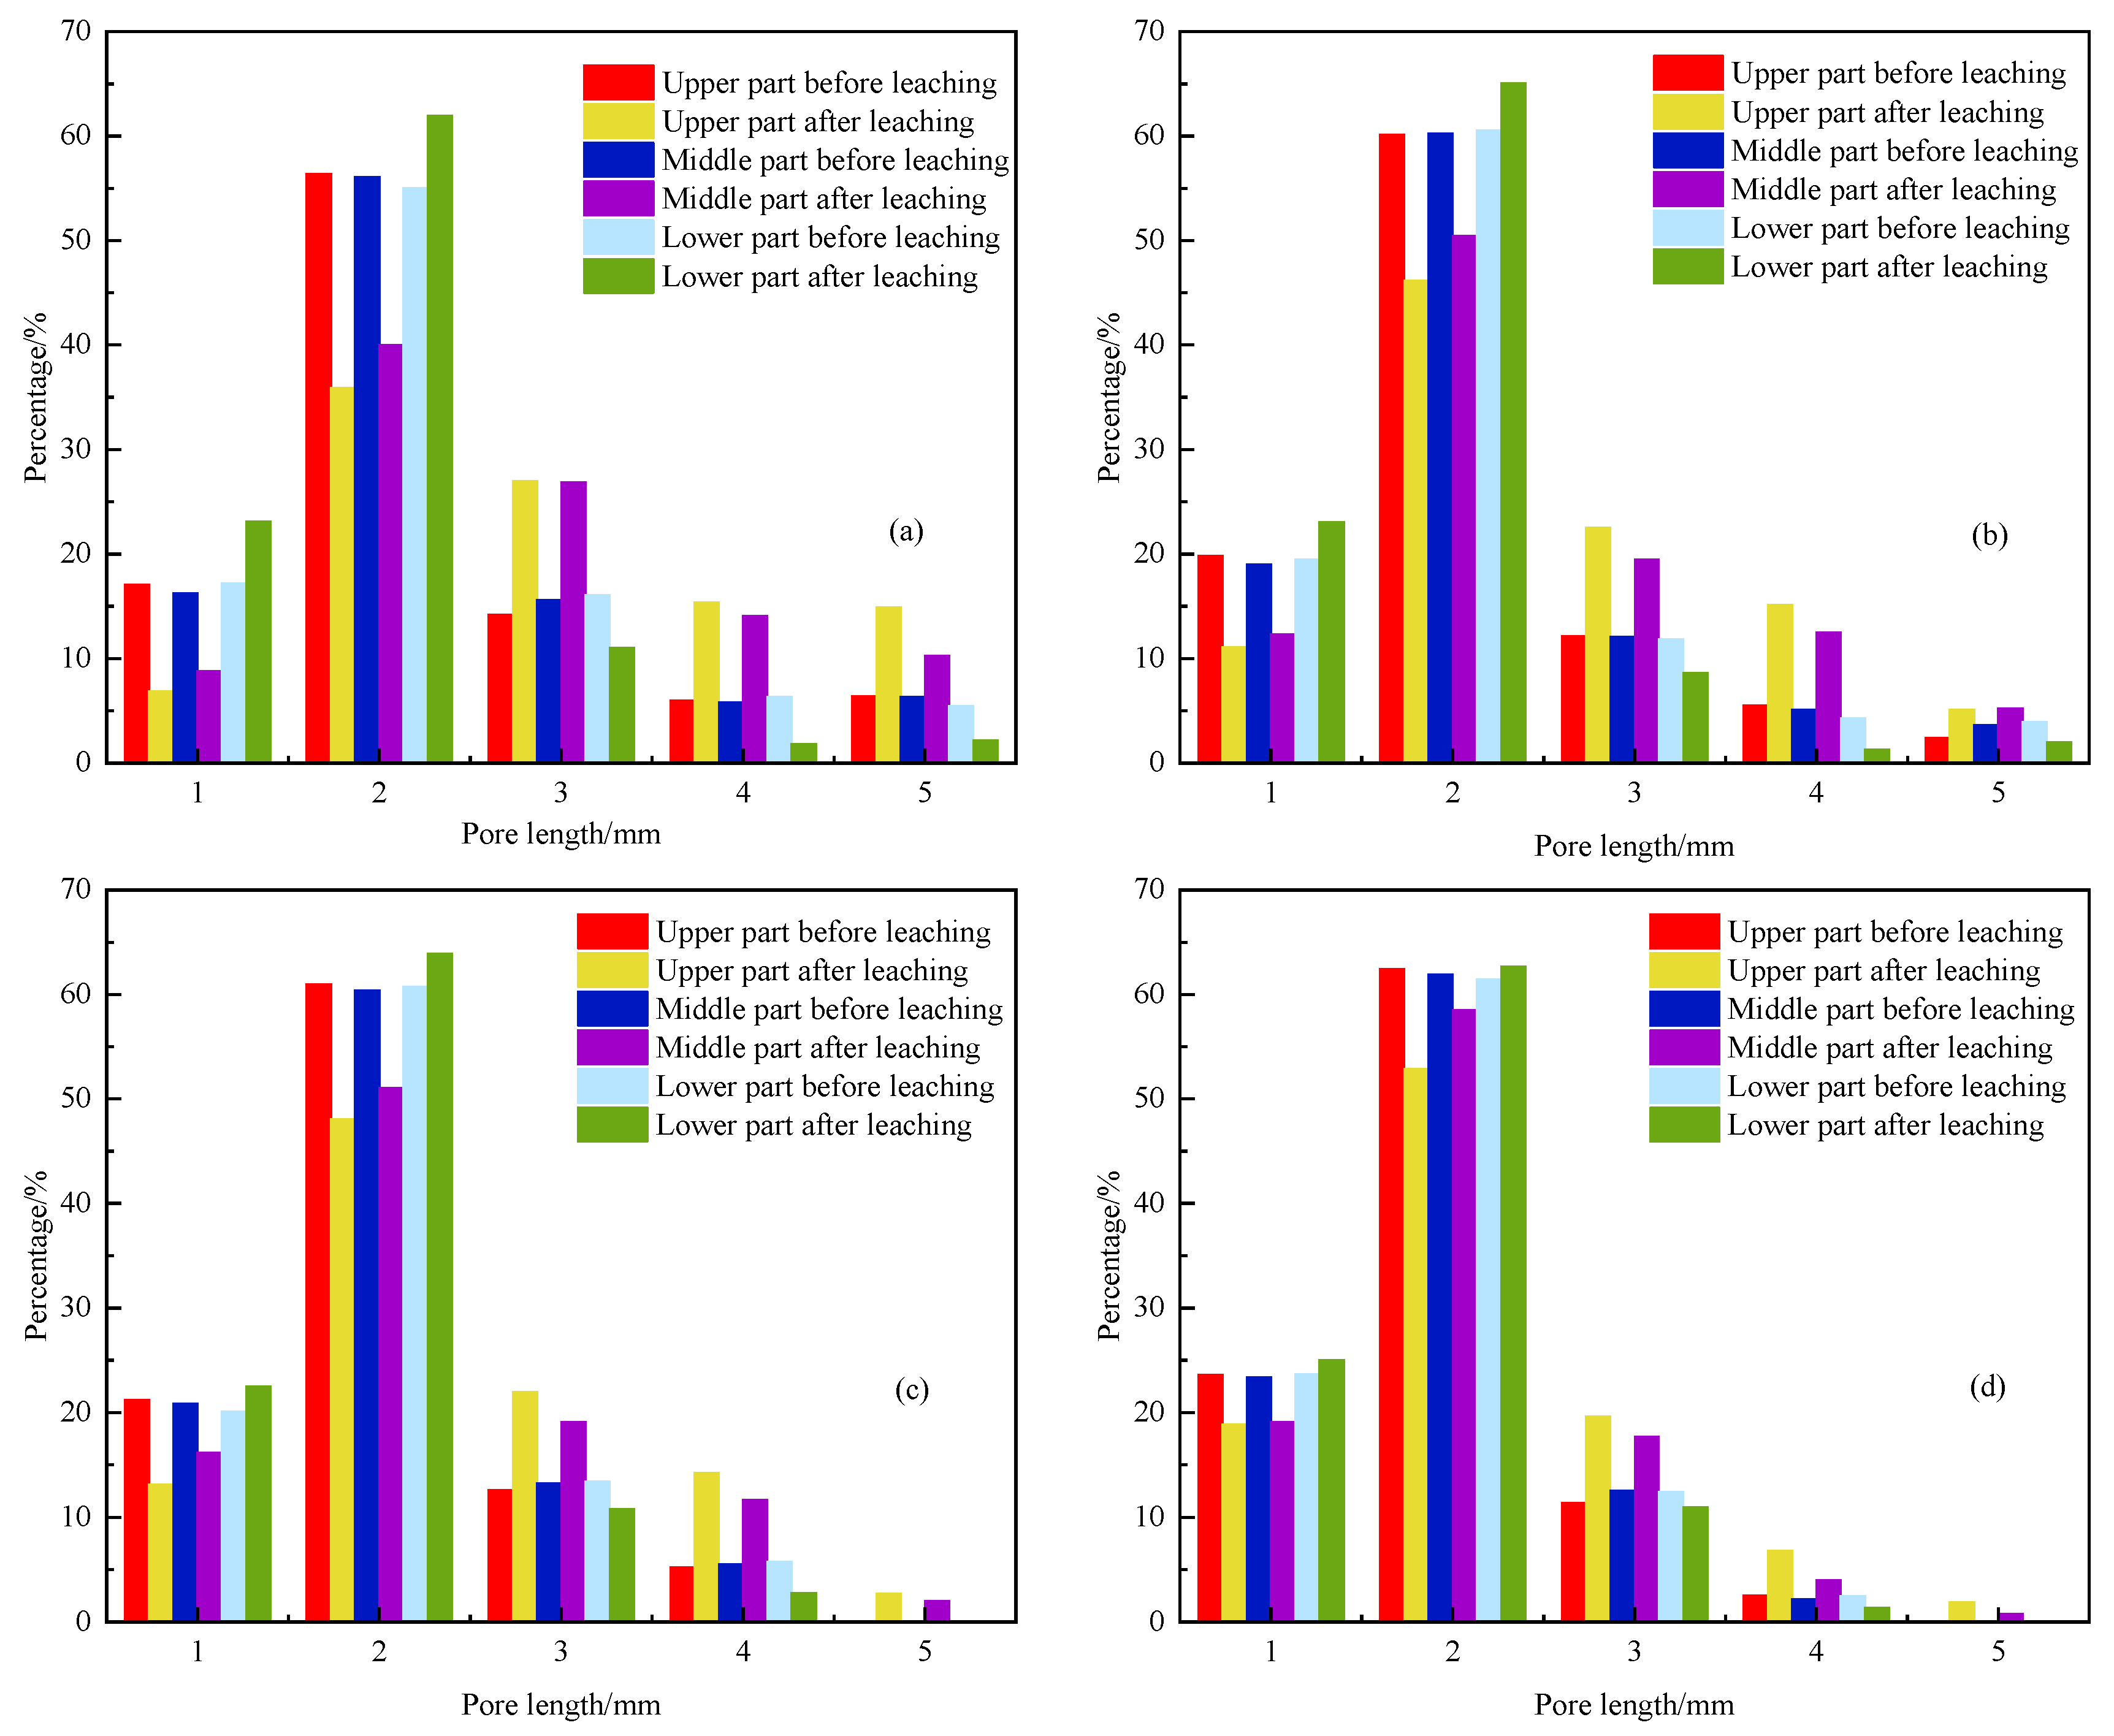
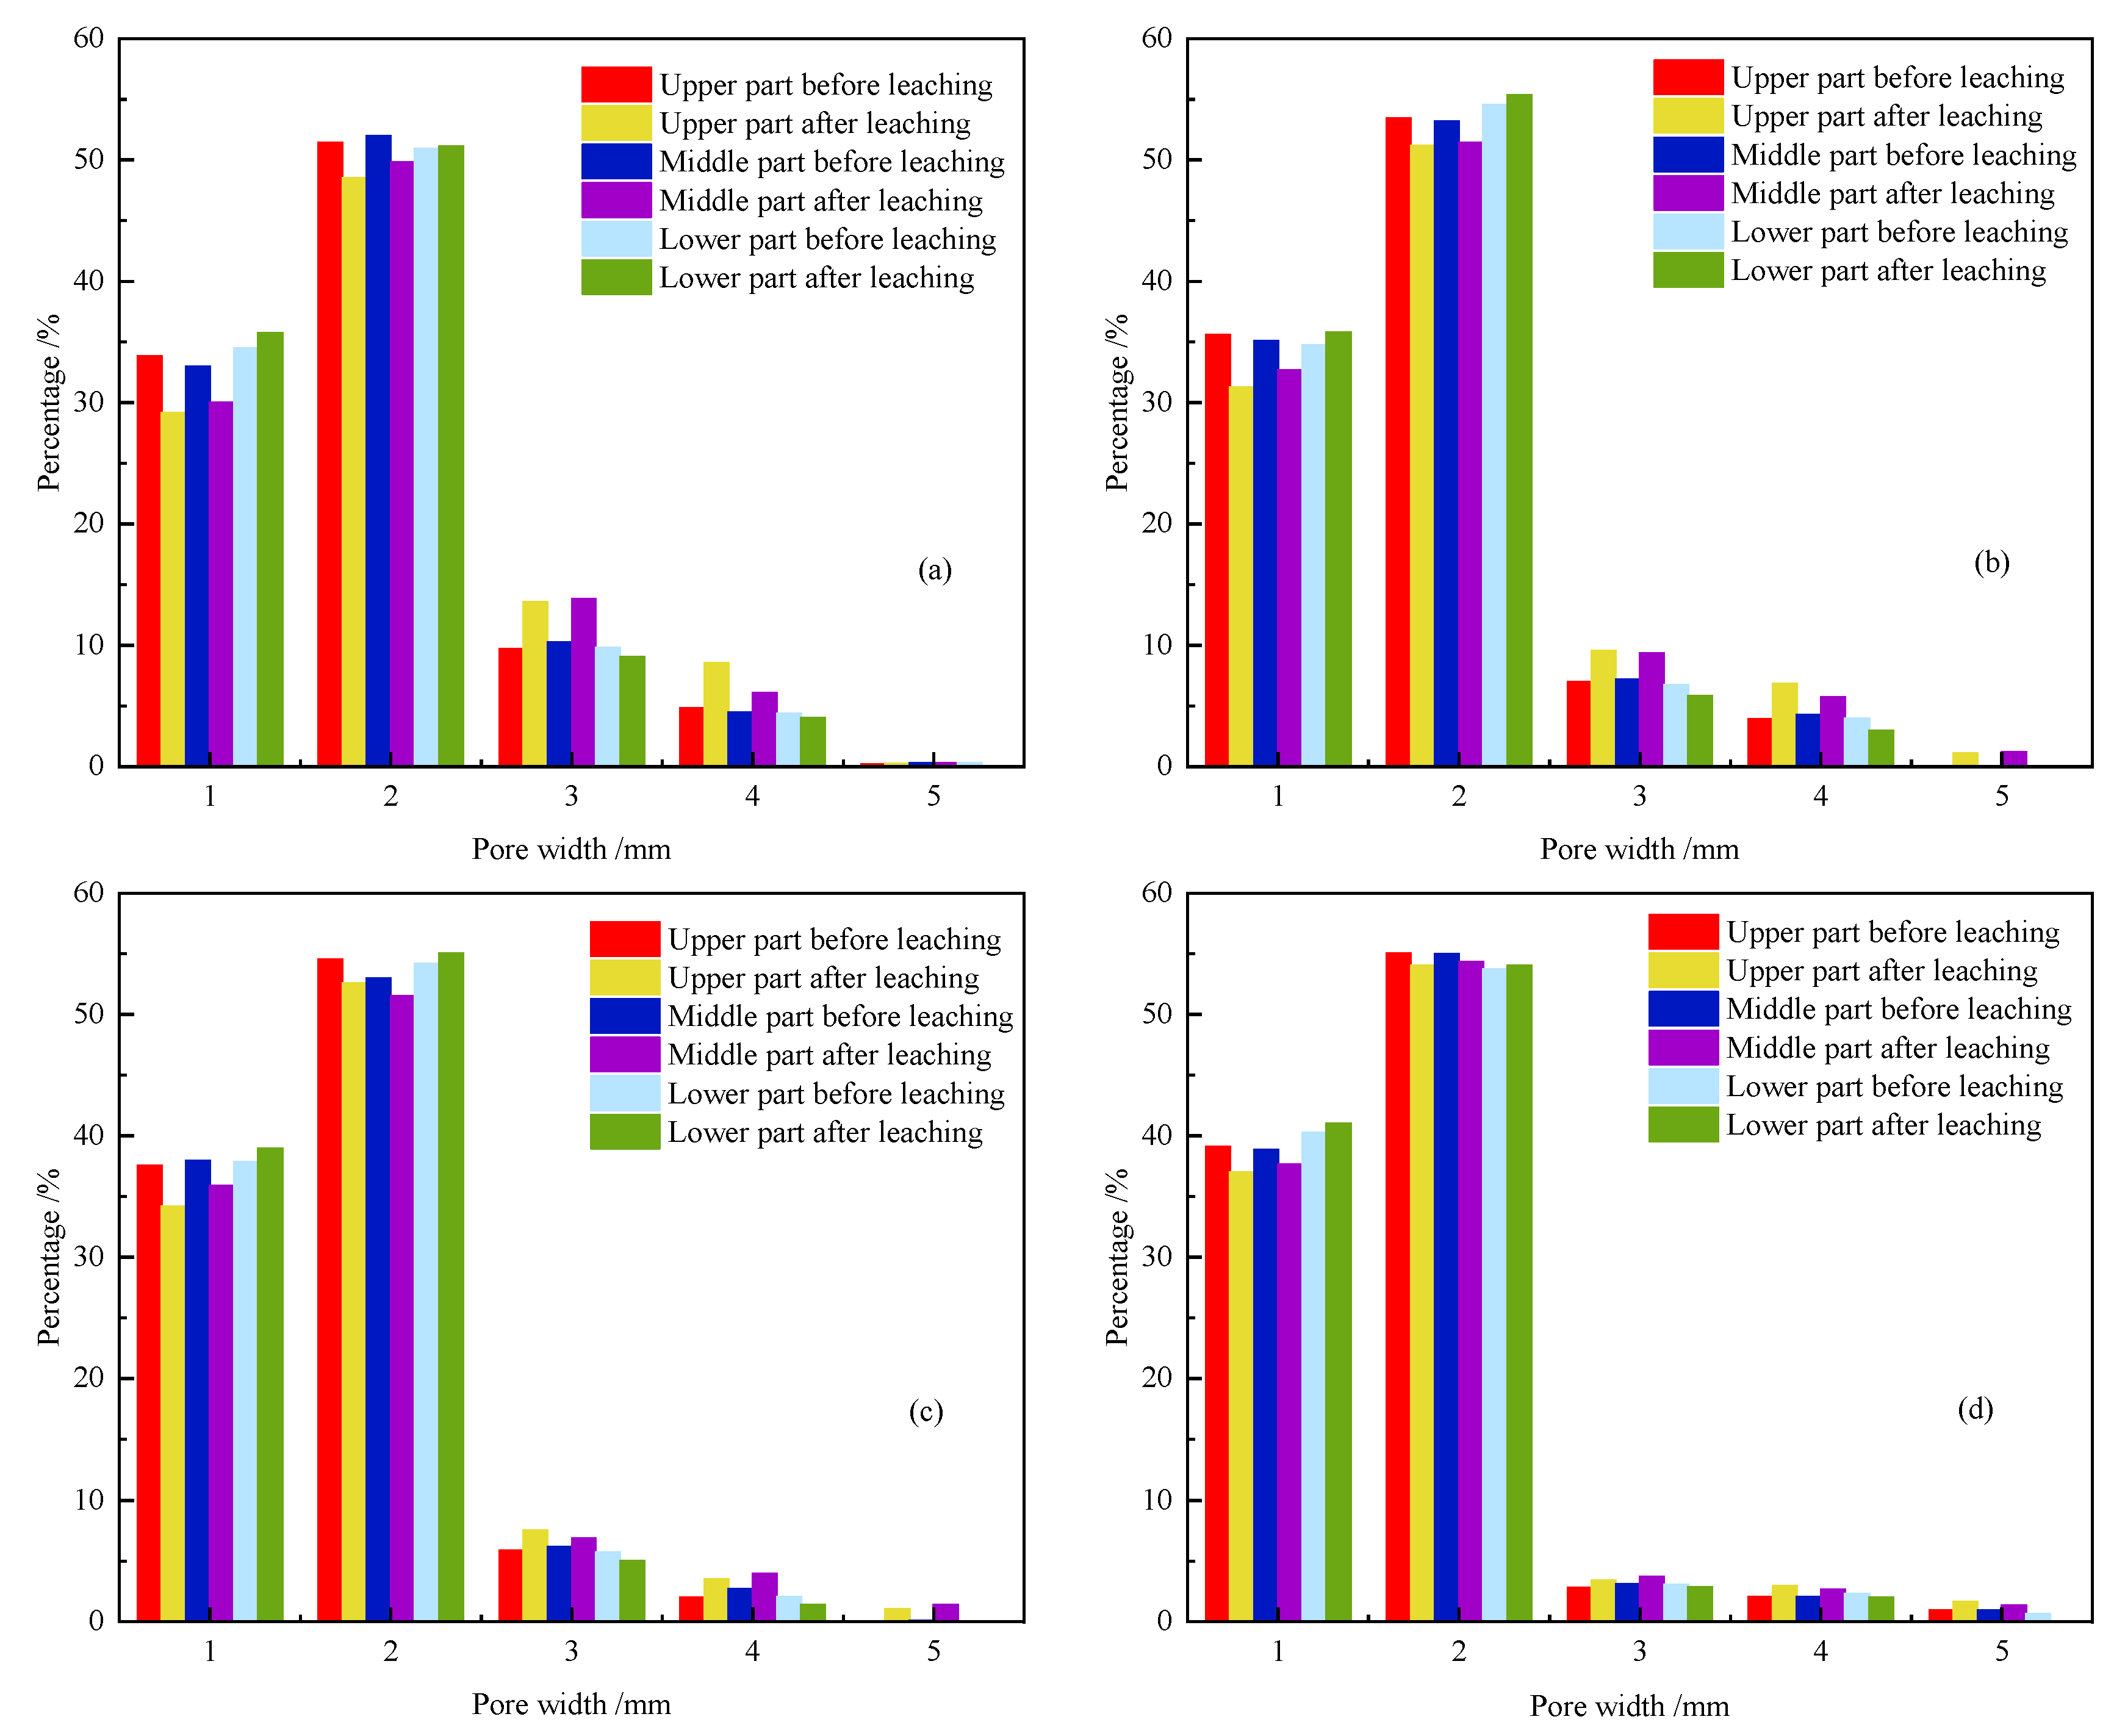
- Pore length and width
- (5)
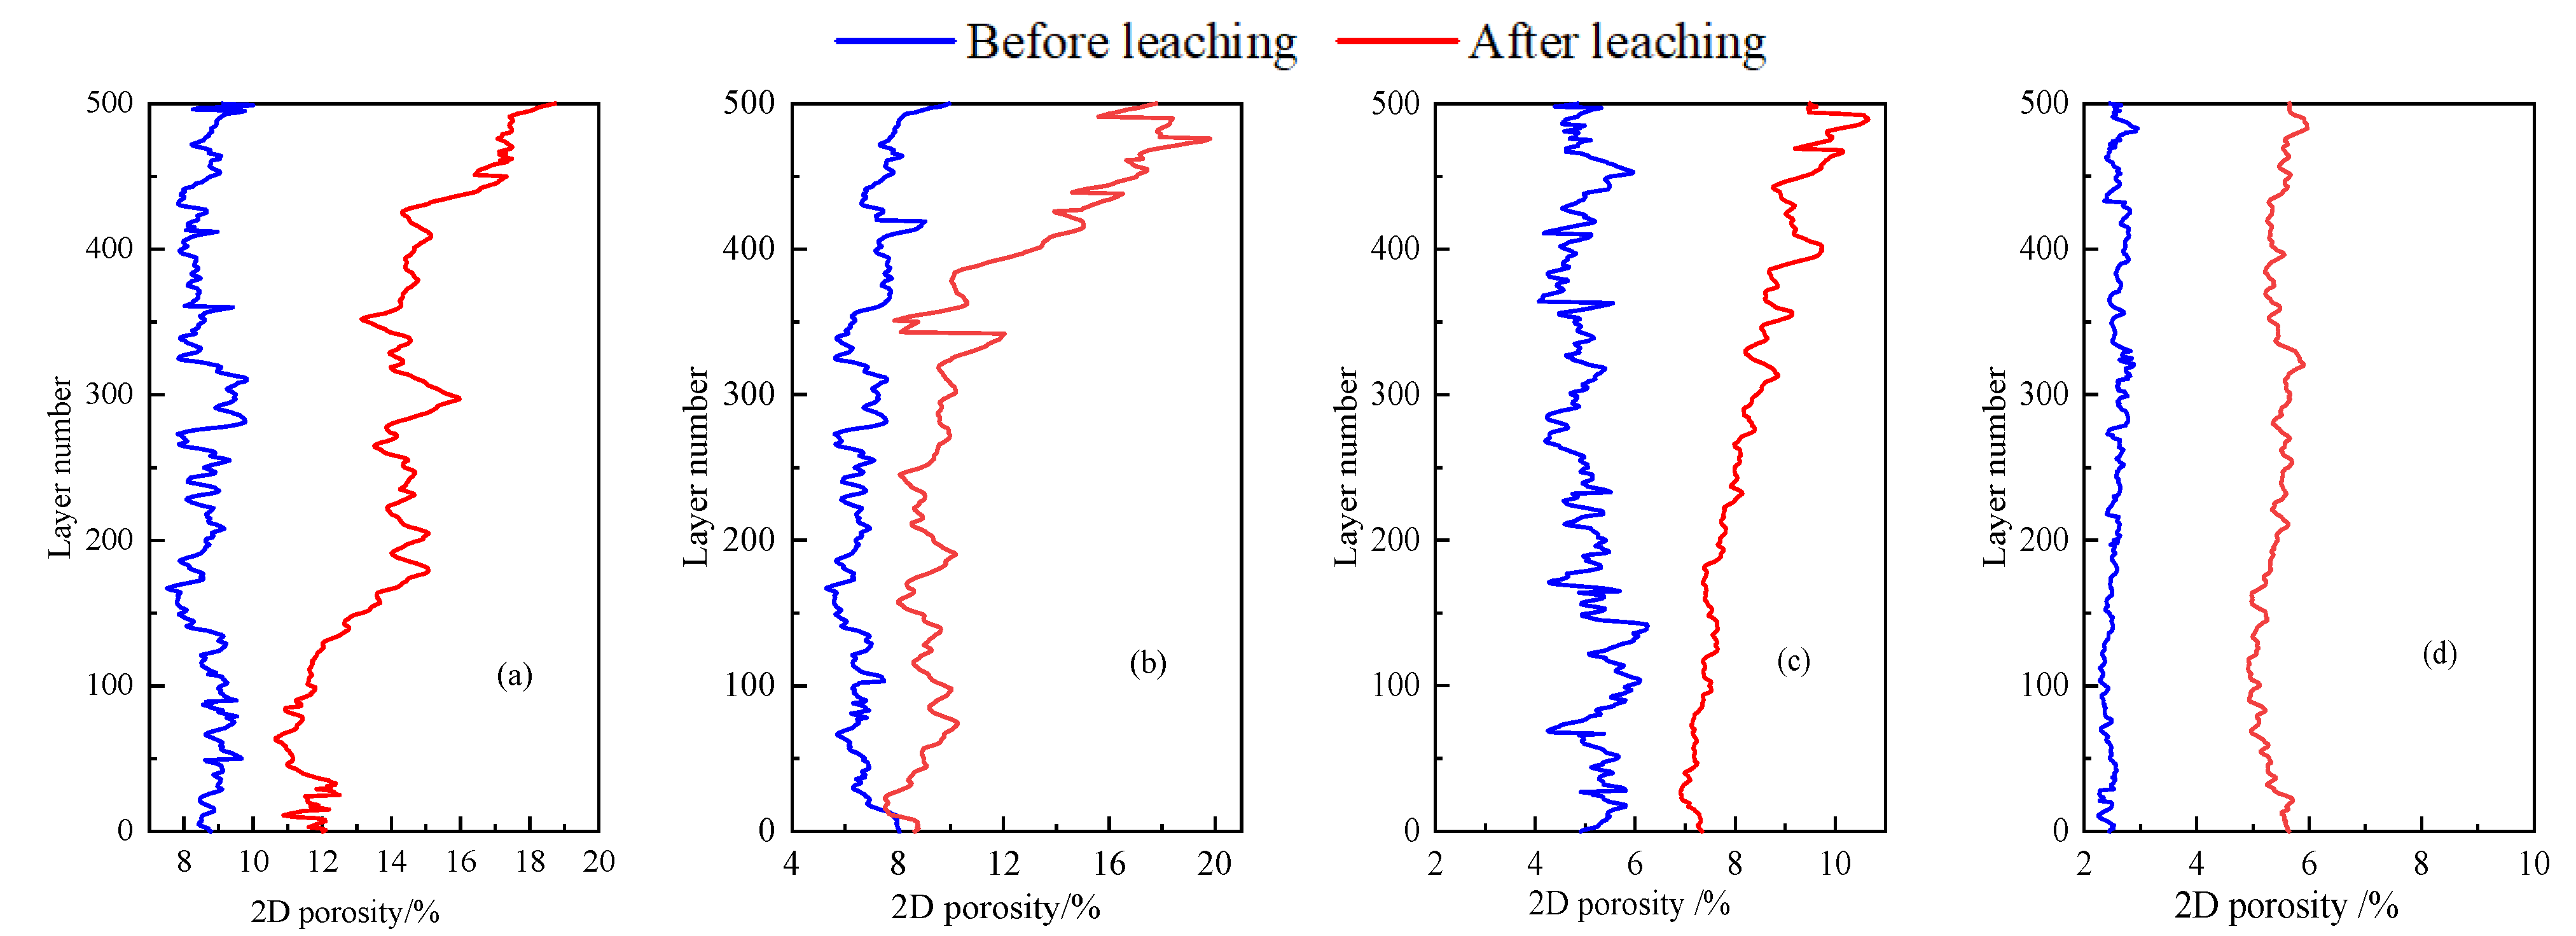
- Two-dimensional porosity
3.1.2. Evolution Law of Pore Throat Characteristic Parameters
- (1)
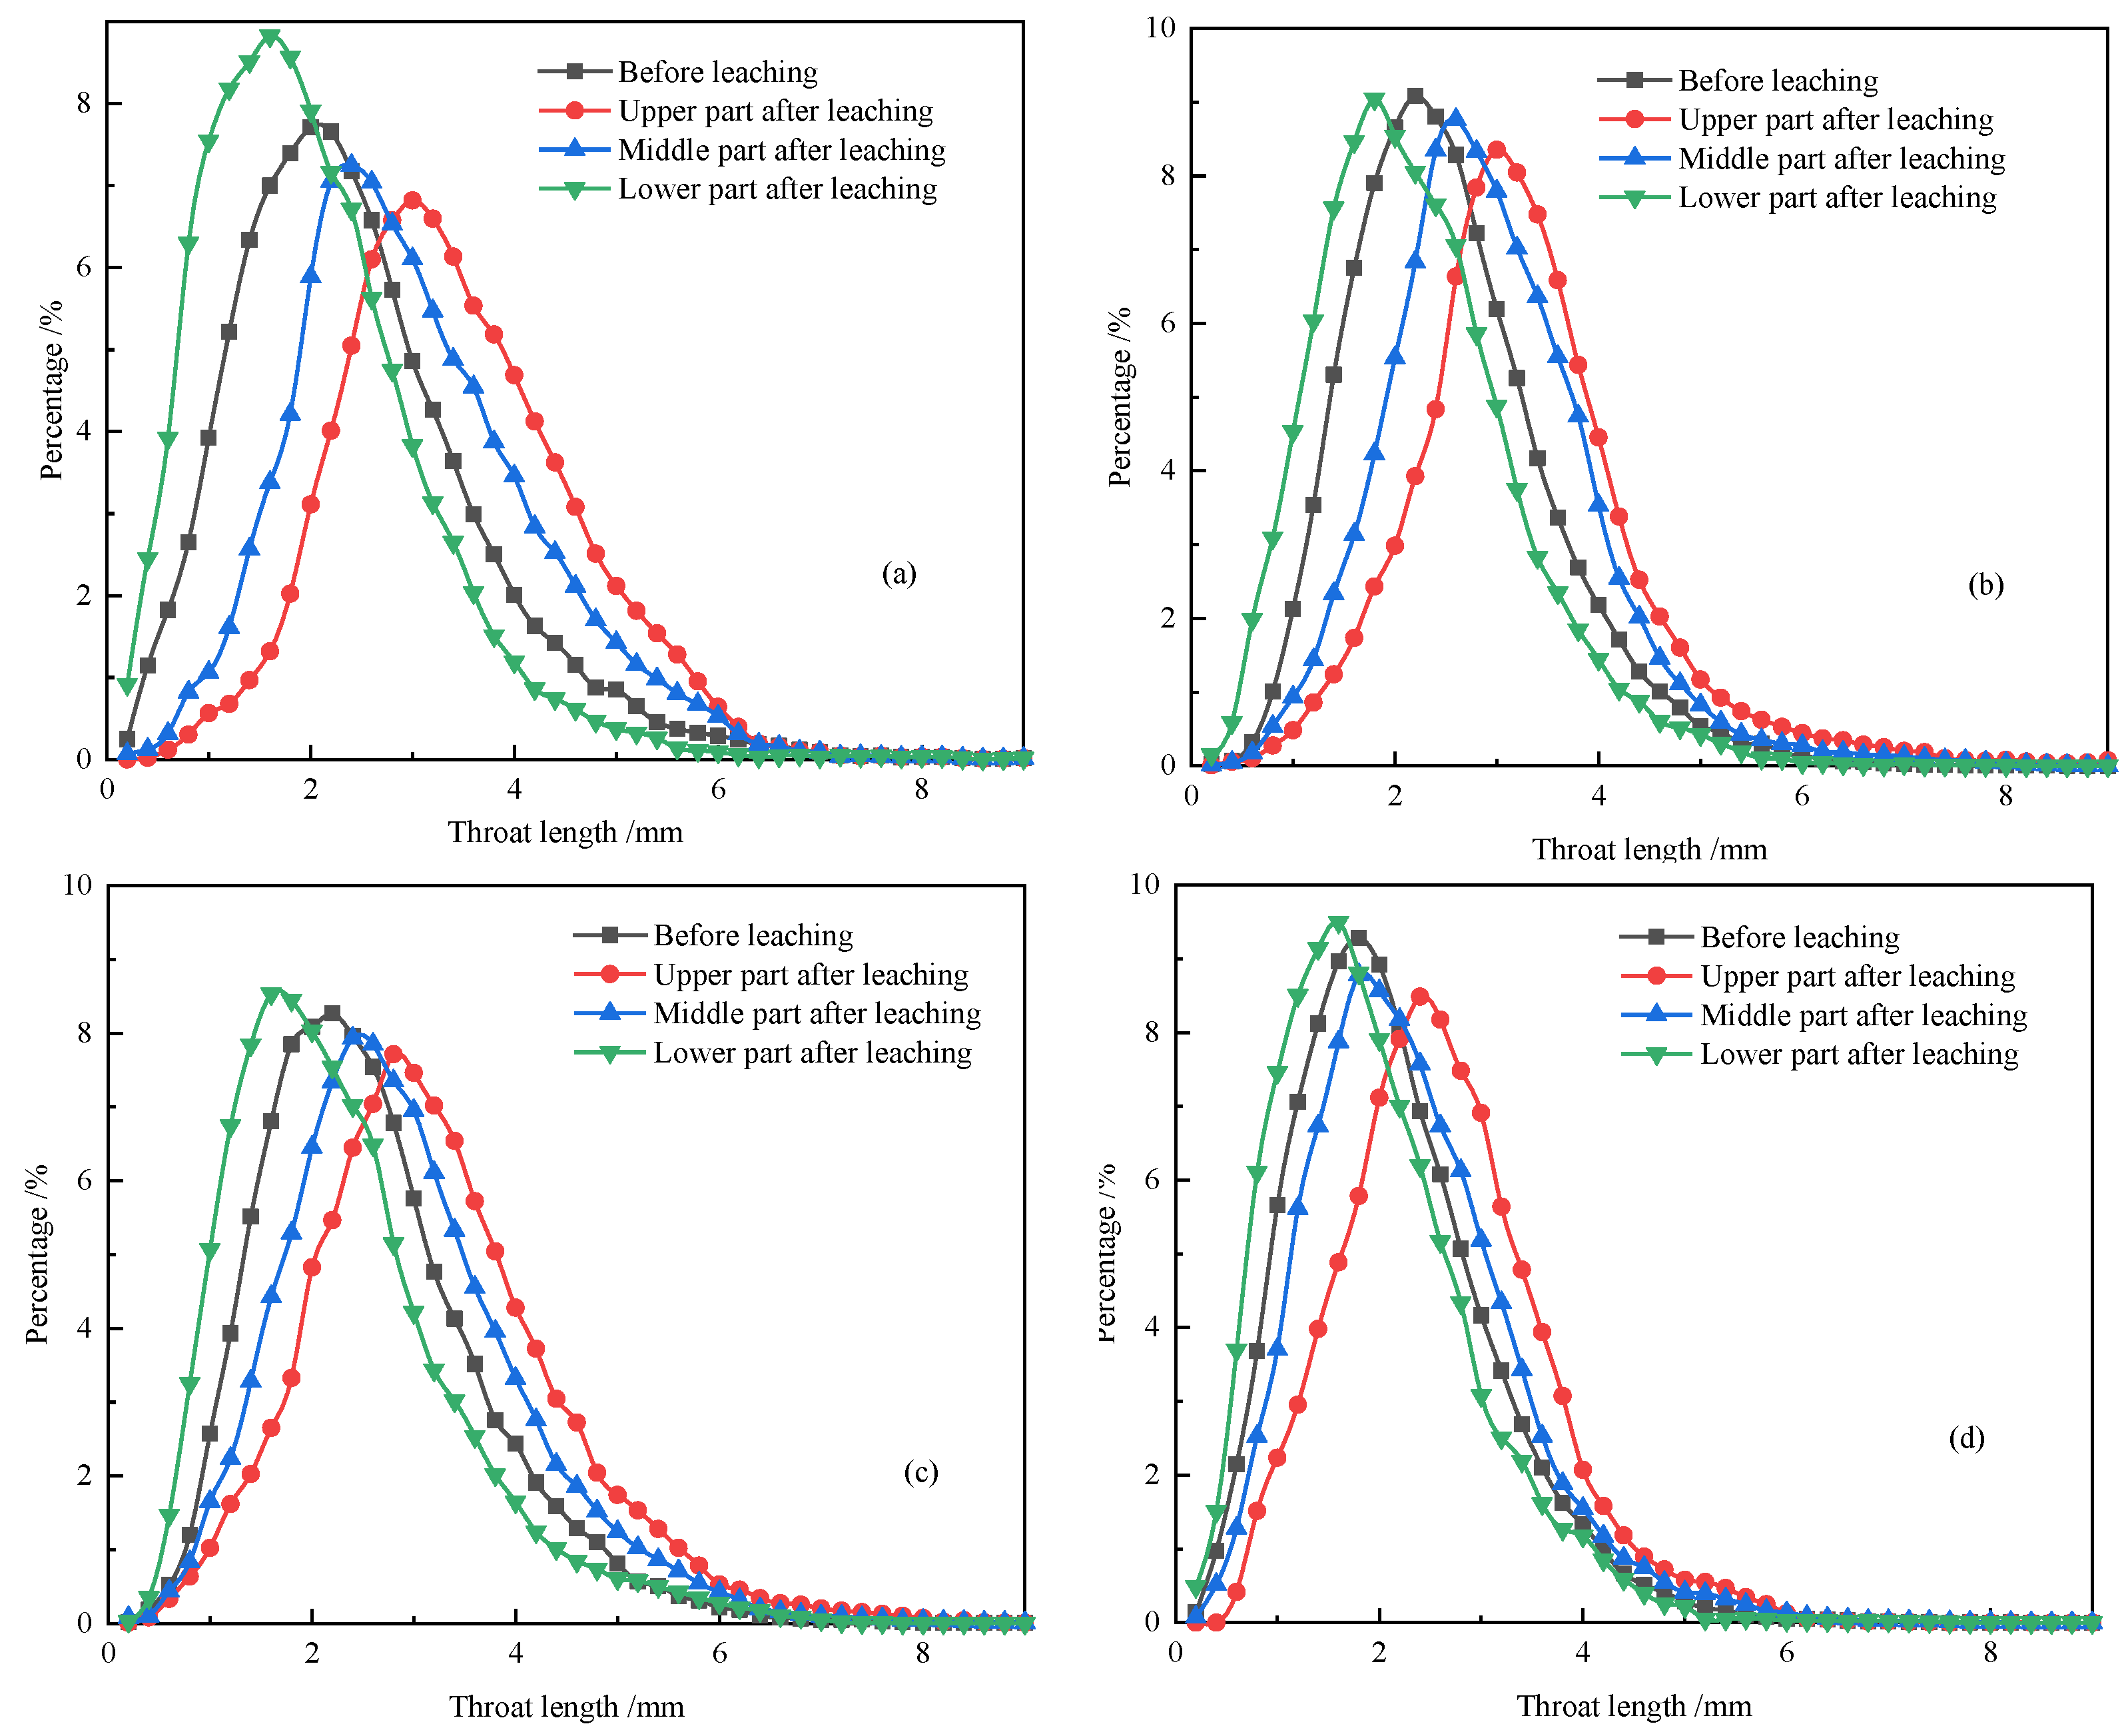
- Pore throat length
- (2)
- Pore throat radius
3.2. Evolution Characteristics of the Leaching Solution
3.2.1. Variation Law of Seepage Path of the Solution
3.2.2. Variation Characteristics of the Pore Pressure
4. Conclusions
- (1)
- Compared with those before leaching, the pore characteristic parameters of ore samples at different depths after leaching had changed significantly. Both the pore quantities with pore volume less than 0.01 mm3 and a pore radius of less than 0.8 mm increased for the lower ore samples while that of the upper and middle ore samples reduced. At the same time, the pore connectivity, the fractal dimension of the pore shape and the ratio of pore length to width and pore length in the lower ore samples decreased.
- (2)
- The solution seepage path and the pore pressure of ore samples during leaching were weakened. After leaching, the solution paths of the upper and middle ore samples were concentrated, while those of the lower samples were few, even interrupted. In addition, the average pore pressure reduced to 4106.18 Pa, 4043.37 Pa, 3636.29 Pa and 3507.63 Pa, respectively. However, the pore pressure of the lower ore samples showed the highest reduction compared with the upper and middle ore samples. The research results not only reveal the continuously weakening mechanism of the leaching velocity of weathered rare earth ores with the increase of ore burial depth, but also help to enrich the basic theory on the heap leaching of weathered rare earth ores.
Author Contributions
Funding
Data Availability Statement
Acknowledgments
Conflicts of Interest
References
- Chi, R.A.; Tian, J.; Li, Z.J.; Peng, C.; Wu, Y.X.; Li, S.R.; Wang, C.W.; Zhou, Z.A. Existing State and Partitioning of Rare Earth on Weathered Ores. J. Rare Rarths 2005, 23, 756–759. [Google Scholar] [CrossRef]
- Zhang, Z.Y.; He, Z.Y.; Xu, Z.G.; Yu, J.X.; Zhang, Y.F.; Chi, R.A. Rare earth partitioning characteristics of China rare earth ore. Chin. Rare Earths 2016, 37, 127–133. [Google Scholar] [CrossRef]
- Liu, D.F.; Zhang, Z.Y.; Chi, R.A. Seepage mechanism during in-situ leaching process of weathered crust elution-deposited rare earth ores with magnesium salt. Physicochem. Probl. Miner. Process. 2020, 56, 350–362. [Google Scholar] [CrossRef]
- Zhang, Z.Y.; He, Z.Y.; Yu, J.X.; Xu, Z.G.; Chi, R.A. Novel solution injection technology for in-situ leaching of weathered crust elution-deposited rare earth ores. Hydrometallurgy 2016, 164, 248–256. [Google Scholar] [CrossRef]
- Moldoveanu, G.; Papangelakis, V. Chelation-Assisted Ion-Exchange Leaching of Rare Earths from Clay Minerals. Metals 2021, 11, 1265. [Google Scholar] [CrossRef]
- Agatzini-Leonardou, S.; Oustadakis, P.; Dimaki, D.; Zafiratos, J.; Tsakiridis, P.; Karidakis, T.; Frogoudakis, E.; Drougas, J. Heap Leaching of Greek Low-Grade Nickel Oxide Ores by Dilute Sulphuric Acid at a Pilot-Plant Scale. Mater. Proc. 2021, 5, 65. [Google Scholar] [CrossRef]
- He, Z.Y.; Zhang, Z.Y.; Yu, J.X.; Xu, Z.G.; Chi, R.A. Process optimization of rare earth and aluminum leaching from weathered crust elution-deposited rare earth ore with compound ammonium salts. J. Rare Rarths 2016, 34, 413–419. [Google Scholar] [CrossRef]
- Xiao, Y.F.; Feng, Z.Y.; Hu, G.H.; Huang, L.; Huang, X.W.; Chen, Y.Y.; Long, Z.Q. Reduction leaching of rare earth from ion-adsorption type rare earths ore with ferrous sulfate. J. Rare Earths 2016, 34, 917–923. [Google Scholar] [CrossRef]
- Chen, Z.; Zhang, Z.Z.; He, Z.Y.; Chi, R.A. Mass transfer process of leaching weathered crust elution-deposited rare earth ore with magnesium salts. Physicochem. Probl. Miner. Process. 2018, 54, 1004–1013. [Google Scholar] [CrossRef]
- Zou, H.L.; Zhang, Z.Y.; Chen, Z.; Liu, D.F.; Zhang, H.; Chi, R.A. Seepage process on weathered crust elution-deposited rare earth ores with ammonium carboxylate solution. Physicochem. Probl. Miner. Process. 2020, 56, 89–101. [Google Scholar] [CrossRef]
- Luo, X.P.; Zhang, Y.B.; Zhou, H.P.; He, K.Z.; Zhang, B.Y.; Zhang, D.M.; Xiao, W.J. Pore structure characterization and seepage analysis of ionic rare earth orebodies based on computed tomography images. Int. J. Min. Sci. Technol. 2022, 32, 411–421. [Google Scholar] [CrossRef]
- Wang, X.J.; Wang, H.; Sui, C.; Zhou, L.B.; Feng, X.; Huang, C.G.; Zhao, L.; Zhong, W.; Hu, K.J. Permeability and Adsorption–Desorption Behavior of Rare Earth in Laboratory Leaching Tests. Minerals 2020, 10, 889. [Google Scholar] [CrossRef]
- Deng, Y.C.; Wan, Y.H.; Yu, H.D.; Kang, S.J.; Deng, Y.; Yang, J. Changes in Microfine Particle Migration of Ionic Rare Earth Ores during Leaching. Sustainability 2023, 15, 3867. [Google Scholar] [CrossRef]
- Liu, D.F.; Zhang, Z.Y.; Chi, R.A. Microscopic Seepage Mechanism during In-situ Leaching of Weathered Crust Elution-deposited Rare Earth Ores. Chin. Rare Earths 2020, 41, 1–11. [Google Scholar] [CrossRef]
- Wang, G.L.; Zhang, J.L.; Liu, Z.J.; Tan, Y.B.; Wang, Y.Z. Cracking and Microstructure Transition of Iron Ore Containing Goethite in Fe-C Melt Based on the HIsmelt Process. Minerals 2023, 13, 448. [Google Scholar] [CrossRef]
- Wang, Y.; Li, C.H.; Hou, Z.Q.; Yi, X.F.; Wei, X.M. In Vivo X-ray Computed Tomography Investigations of Crack Damage Evolution of Cemented Waste Rock Backfills (CWRB) under Uniaxial Deformation. Minerals 2018, 8, 539. [Google Scholar] [CrossRef]
- Yin, S.H.; Chen, X.; Yan, R.F.; Wang, L.M. Pore Structure Characterization of Undisturbed Weathered Crust Elution-Deposited Rare Earth Ore Based on X-ray Micro-CT Scanning. Minerals 2021, 11, 236. [Google Scholar] [CrossRef]
- Fan, N.; Wang, J.R.; Deng, C.B.; Fan, Y.P.; Wang, T.T.; Guo, X.Y. Quantitative characterization of coal microstructure and visualization seepage of macropores using CT-based 3D reconstruction. J. Nat. Gas Sci. Eng. 2020, 81, 103384. [Google Scholar] [CrossRef]
- Li, Y.; Chi, Y.M.; Han, S.L.; Zhao, C.J.; Miao, Y.N. Pore-throat structure characterization of carbon fiber reinforced resin matrix composites: Employing Micro-CT and Avizo technique. PLoS ONE 2021, 16, e0257640. [Google Scholar] [CrossRef]
- Keles, C.; Sarver, E. A Study of Respirable Silica in Underground Coal Mines: Particle Characteristics. Minerals 2022, 12, 1555. [Google Scholar] [CrossRef]
- Liu, D.F.; Yan, W.X.; Zhang, Z.Y.; Chi, X.W.; Chi, R.A. Study on Fractal Leaching Kinetics of Weathered Crust Elution-deposited. Rare Earth Chin. Rare Earths 2021, 42, 1–9. [Google Scholar] [CrossRef]
- Long, P.; Wang, G.S.; Tian, J.; Hu, S.L.; Luo, S.H. Simulation of one-dimensional column leaching of weathered crust elution-deposited rare earth ore. Trans. Nonferrous Met. Soc. China 2019, 29, 625–633. [Google Scholar] [CrossRef]
- An, R.; Kong, L.W.; Zhang, X.W.; Li, C.S. Effects of dry-wet cycles on three-dimensional pore structure and permeability characteristics of granite residual soil using X-ray micro computed tomography. J. Rock Mech. Geotech. Eng. 2022, 14, 851–860. [Google Scholar] [CrossRef]
- Zhang, X.; Gao, Z.; Rao, Y.; Shi, L.; Xu, W. Evolutionary Law of Pore Structure of Ion-Adsorbed Rare Earth Ore Leaching Process. Minerals 2023, 13, 322. [Google Scholar] [CrossRef]
- Yan, B.H.; Wu, A.X.; Miao, X.X.; Liu, H.B. Microstructure evolution of ore particles during bioleaching based on X-ray Micro-Computed tomography images. Adv. Mater. Res. 2015, 1130, 325–328. [Google Scholar] [CrossRef]
- Yan, B.H.; Wu, A.X.; Yin, S.H. Simulation of pore scale fluid flow of granular ore media in heap leaching based on realistic model. J. Cent. South Univ. 2011, 18, 848–853. [Google Scholar] [CrossRef]
- Wu, A.X.; Yang, B.H.; Zhou, X. Fractal analysis of granular ore media based on computed tomography image processing. Trans. Nonferrous Met. Soc. China 2008, 18, 1523–2528. [Google Scholar] [CrossRef]
- Chen, J.; Feng, Y.G.; Gu, R.G.; Shu, H.K.; Ba, L.Z.; Wei, L. Study on pore size effect of low permeability clay seepage. Arab. J. Geosci. 2019, 12, 238. [Google Scholar] [CrossRef]
- Miao, X.X.; Li, S.C.; Chen, Z.Q.; Liu, W.Q. Experimental Study of Seepage Properties of Broken Sandstone Under Different Porosities. Transp. Porous Media 2011, 86, 805–814. [Google Scholar] [CrossRef]
- Yan, B.H.; Wu, A.X.; Jiang, H.C.; Chen, X.S. Evolvement of permeability of ore granular media during heap leaching based on image analysis. Trans. Nonferrous Met. Soc. China 2008, 18, 426–431. [Google Scholar] [CrossRef]
- Zhao, Y.X.; Zhu, G.P.; Liu, S.M.; Wang, L.; Zhang, C. Effects of Pore Structure on Stress-Dependent Fluid Flow in Synthetic Porous Rocks Using Microfocus X-ray Computed Tomography. Transp. Porous Media 2019, 128, 653–675. [Google Scholar] [CrossRef]
- Li, G.Y.; Dai, S.; Zhang, L.T.; Chen, Y.M. A pore-scale numerical investigation of the effect of pore characteristics on flow properties in soils. J. Zhejiang Univ. Sci. A 2019, 20, 961–978. [Google Scholar] [CrossRef]
- Chang, B.M.; Du, C.F.; Su, M.K.; Lin, Y.F.; Wang, Y.; Chu, X.F.; Zhang, L.; He, J.Q. Mesoscopic Seepage Simulation and Analysis of Unclassified Tailings Pores Based on 3D Reconstruction Technology. ACS Omega 2021, 6, 14309–14316. [Google Scholar] [CrossRef] [PubMed]
- Zhou, G.; Zhang, Q.; Bai, R.N.; Ni, G.H. Characterization of Coal Micro-Pore Structure and Simulation on the Seepage Rules of Low-Pressure Water Based on CT Scanning Data. Minerals 2016, 6, 78. [Google Scholar] [CrossRef]


| A | B | C | D | |||||
|---|---|---|---|---|---|---|---|---|
| Before Leaching | After Leaching | Before Leaching | After Leaching | Before Leaching | After Leaching | Before Leaching | After Leaching | |
| Upper part | 0.0658 | 0.0958 | 0.0587 | 0.0792 | 0.0375 | 0.0457 | 0.0164 | 0.0186 |
| Middle part | 0.0683 | 0.0522 | 0.0605 | 0.0476 | 0.0347 | 0.0282 | 0.0145 | 0.0125 |
| Lower part | 0.0713 | 0.0443 | 0.0578 | 0.0373 | 0.0357 | 0.0242 | 0.0157 | 0.0118 |
| A (10−6 m/s) | B (10−6 m/s) | C (10−6 m/s) | D (10−6 m/s) | |
|---|---|---|---|---|
| Upper part | 2.43 | 2.24 | 1.78 | 1.57 |
| Middle part | 2.12 | 1.69 | 1.27 | 1.11 |
| Lower part | 1.62 | 1.47 | 1.03 | 0.88 |
| Average seepage velocity | 1.82 | 1.61 | 1.26 | 1.19 |
| A/Pa | B/Pa | C/Pa | D/Pa | |
|---|---|---|---|---|
| Upper part | 4253.82 | 4172.34 | 3724.92 | 3621.05 |
| Middle part | 4176.37 | 4083.25 | 3682.84 | 3587.15 |
| Lower part | 4013.29 | 3972.71 | 3624.28 | 3559.93 |
| Average pore pressure | 4106.18 | 4043.37 | 3636.29 | 3507.63 |
Disclaimer/Publisher’s Note: The statements, opinions and data contained in all publications are solely those of the individual author(s) and contributor(s) and not of MDPI and/or the editor(s). MDPI and/or the editor(s) disclaim responsibility for any injury to people or property resulting from any ideas, methods, instructions or products referred to in the content. |
© 2023 by the authors. Licensee MDPI, Basel, Switzerland. This article is an open access article distributed under the terms and conditions of the Creative Commons Attribution (CC BY) license (https://creativecommons.org/licenses/by/4.0/).
Share and Cite
Liu, D.; Yan, W.; Zhang, Z.; Guo, W.; Chi, R. Study on Continuously Weakening Mechanism of Heap Leaching Velocity of Weathered Rare Earth Ores with the Increase of Ore Burial Depth. Minerals 2023, 13, 581. https://doi.org/10.3390/min13040581
Liu D, Yan W, Zhang Z, Guo W, Chi R. Study on Continuously Weakening Mechanism of Heap Leaching Velocity of Weathered Rare Earth Ores with the Increase of Ore Burial Depth. Minerals. 2023; 13(4):581. https://doi.org/10.3390/min13040581
Chicago/Turabian StyleLiu, Defeng, Wenxin Yan, Zhenyue Zhang, Wenda Guo, and Ruan Chi. 2023. "Study on Continuously Weakening Mechanism of Heap Leaching Velocity of Weathered Rare Earth Ores with the Increase of Ore Burial Depth" Minerals 13, no. 4: 581. https://doi.org/10.3390/min13040581