Article

Estonian Phosphate Rock Dissolution in Hydrochloric Acid: Optimization of Acid Dosage and Concentration

1
Department of Materials and Environmental Technology, Tallinn University of Technology, 19086 Tallinn, Estonia
2
Department of Geology, Tallinn University of Technology, 19086 Tallinn, Estonia
*
Authors to whom correspondence should be addressed.
Minerals 2023, 13(4), 578; https://doi.org/10.3390/min13040578
Submission received: 10 March 2023 / Revised: 13 April 2023 / Accepted: 19 April 2023 / Published: 20 April 2023
(This article belongs to the Section Mineral Processing and Extractive Metallurgy)

Abstract

:
The increasing need for phosphorus and rare earth elements (REEs) has initiated the studies of new mineral deposits and new complex processing technologies. Estonian phosphate rock (EPR) resources, which are not in use, are estimated to be more than 3 billion metric tons or 800 million tons of P2O5. The experiments of dissolution of three different EPR samples in hydrochloric acid were carried out with the aim of studying the impact of the chemical and mineralogical composition of EPR on the leaching process. The leaching of P, Ca, Mg, and consumption of H+ ions depend on HCl concentration and dosage. The solubility of fluorine and REEs are also influenced by CaF2 and REEs-phosphates precipitation. Fe solubility depends on the mineralogical composition of EPR but also on particle size, acid dosage, pH, and phosphorus content in the solution. The dissolution of pyrite is much lower than the solubility of carbonate apatite. Dolomite dissolution depends on the acid dosage and the fractional composition of EPR. Dolomite dissolution also rests lower than that of apatite. For all the samples studied, the best regression models that describe P, Mg, and Ca solubility and the optimum concentration of HCl for phosphorus dissolution were found using mathematical modeling.

1. Introduction

Phosphate minerals are the main source of phosphorus in fertilizer production but can also be considered a source of rare earth elements (REEs). In Europe, both phosphorus and REEs are proclaimed as critical raw materials [1].
Estonian phosphate rock (EPR) resources are estimated to be more than 3 billion metric tons or 800 million tons of P2O5. The content of P2O5 in the Estonian phosphate ore varies between 6% and 20% [2]. Phosphorus in EPR is contained in the brachiopod shells in the form of carbonate fluorapatite but can also be found on the surface of quartz particles [3]. The total content of REEs expressed as the ratio of REEs in ppm and P2O5 %, varies from 20 to 70 [2]. The other main minerals in EPR are quartz, calcite, dolomite, pyrite, feldspar, and ferrous hydroxide, which content varies depending on the deposit.
The basic process used for the production of phosphoric acid and fertilizers is sulfuric acid decomposition of phosphate concentrate. In this process, REEs are distributed between the phosphoric acid produced (5%–30%) and phosphogypsum (up to 95%) [4]. Separation of REEs from phosphogypsum is complicated and expensive [4,5]. According to stronger environmental requirements and the need for more efficient, economical use of raw materials, new complex processing methods of phosphate ore are needed [6].
To improve the treatment technology, the dissolution of PR in other mineral acids is studied [7,8]. Thereby, in the last years, more attention has been paid to hydrochloric acid treatment, and different flowsheets have been proposed for phosphoric acid or calcium phosphate production, combined or not with REEs separation [4]. The PR dissolution studies have been carried out in a wide parameter range and with samples of different type and chemical composition that complicates the analysis of the results obtained. If the target is the production of phosphoric acid, at least 10% HCl is suggested for the decomposition of high-quality PR, followed by the separation of H3PO4 by applying solvent extraction technology [9,10,11,12]. The studies of the dissolution of different phosphate concentrates with HCl [11,12,13,14,15,16,17] have revealed that the leaching rate of phosphorus increases with the increase in acid concentration and liquid/solid ratio and decreases with the increase in particle size of PR. Agitation intensity and duration over 30 min have less impact [15]. The increase in the solubility of REEs in 10% HCl was achieved by increasing temperature up to 60 °C [16] or 90 °C [14].
Calcium phosphates manufacturing technology for P-fertilizers or food supplements from PR hydrochloric acid leachate provides an opportunity to process low-grade PR using lower concentrations of HCl [18,19]. In the studies of impurity-rich ores, it has been found that higher concentrations of the acid (above 4%) favor the dissolution of apatite rather than that of carbonates in PR. Part of the acid is consumed in the decomposition of the impurities, mainly carbonates, present in the rock [20,21].
REEs, which are found in the structure of apatite [21,22], dissolve simultaneously with apatite. Their dissolution and separation from the solution before H3PO4 or CaHPO4 are studied intensively [7,8,14,15,16,17,21,23]. Regardless of the fast and complete dissolution of apatite in HCl solutions, the solubility of REEs does not follow the same rules. Their solubility is additionally strongly affected by the pH of the solution formed and the phosphate ions content in it [7,24]. The precipitation of REEs has been analyzed by kinetic studies with 1 M HCl [21].
The impact of HCl concentration, solid/liquid ratio, temperature, particle size, mixing time, and intensity on the solubility of phosphorus and/or REEs is studied widely, but little attention has been paid to the solubility of other minerals found in PR and their impact on the dissolution process. Yet the solubility of impurity minerals has significant importance in the case of complex treatment of low-quality rocks.
The aim of the study was to investigate the conditions of the first step of the complex treatment of Estonian phosphorite with hydrochloric acid, more in detail, the impact of impurity minerals on the solubility of phosphorus, REEs, and other elements in HCl solutions. In addition to the analysis of solubility data, regression models were provided on the basis of the data attempting to optimize the dissolution conditions.

2. Materials and Methods

2.1. Materials

Three different Estonian PR samples without preceding beneficiation were used in the experiments. The samples were used as received after crushing. The chemical, mineralogical, and fractional composition is given in Table 1 and Table 2. It is important to mention that the samples were obtained from three different locations and represent somewhat different stratigraphic intervals and lithologies. Ülgase (Y) sample, obtained near drift surfaces, belongs to the chemically weathered ore where pyrite is partially decomposed and oxidized. As a result of these geochemical processes, part of iron is apparently present in amorphous or poorly crystalline forms, such as goethite [25]. The content of gypsum and/or basanite that is formed in the reaction of calcite with the acidic environment supports the pyrite oxidation idea.
Ülgase sample is characterized by the highest content of apatite, therefore, also by the highest content of P2O5 and REEs. Toolse samples 1 and 2 (T1 and T2) are characterized by a higher content of dolomite and, accordingly, higher content of Mg. Toolse sample 2 also differs by a higher content of pyrite and the share of smaller particles (Table 2). Quartz is contained mainly in the 100–400 µm fraction and apatite in the fraction bigger than 400 µm and smaller than 100 µm.
Concentrated HCl (Sigma-Aldrich, ACS reagent) was used for the preparation of the 0.5, 1.0, and 1.5 M solutions. The concentrations of the acid solutions were checked by potentiometric titration with KOH solution. The acid dosage (HCl/Ca) was calculated as moles of HCl per moles of Ca in the sample.

2.2. Experimental

2.2.1. Experiment Planning

Laboratory tests were carried out using experiment planning as shown in Table 3, according to which HCl concentration, sample mass, and mixer rotation speed were the parameters to be varied. The HCl concentration range (×1) was chosen by the previous results of carbonate apatite dissolution that is fast even in diluted acid [20,21] and with the aim to avoid fluorine evolvement into the atmosphere.
The central point of the experimental plan (sample mass) was chosen according to the simplified reaction of apatite and calcite with hydrochloric acid, where for the dissolution of 1 mole of apatite, 10 moles of HCl is needed (Equations (1) and (2)) or 2 moles of HCl per 1 mole of CaCO3.
Ca5(PO4)3F + 10H+ + 10Cl → 5Ca2+ + 3H3PO4 + 10Cl + HF
CaCO3 + 2H+ + 2Cl → Ca2+ + 2Cl + CO2 + H2O
The first results of modeling demonstrated that including the rotation speed (in the 350–650 rpm range) into the experimental plan did not improve the model quality, and experiments with Ülgase and Toolse 2 samples were carried out at a fixed mixing rate of 550 rpm. The insignificant impact of mixing speed was also followed by Amine et al. [15], despite of high solid/liquid ratio of 0.2–0.5, explained by a high HCl concentration of 13.23%.

2.2.2. Experiment

Dissolution of PR samples was performed in LARA CLR reactor (Radleys, Essex, UK) of volume 1 L using 500 mL of acid and mixing for 60 min at room temperature 25 ± 1 °C. The reaction time was chosen according to the preliminary experiments. The pH change was recorded with a combination VP pH probe electrode, calibrated with pH buffer solutions 4.01; 7.00; 9.0 (Hamilton Bonaduz AG, Switzerland).
Immediately after 60 min, the suspension obtained was centrifuged, the clear solution was diluted 1/25 with distilled water to avoid further precipitation, and the content of P, Ca, F, Fe, Mg, and REEs was determined.

2.2.3. Analyses

The element’s content in solutions was determined as follows: the concentration of phosphorus spectrophotometrically (Biochrom Libra S70PC) as the phosphomolybdate yellow complex (λ = 430 nm); Ca, Fe, and Mg by atomic absorption spectrometry (Spectr AA 55B, Varian BV, Varian Australia Pty Ltd., Belrose, Australia); fluorine by F sensitive electrode (Mettler Toledo GmbH, Schwerzenbach, Switzerland); REEs by quadrupole mass spectrometer (ICPC-MS, Thermo X- series II quadrupole mass spectrometer by Thermo Electron Corporation, Cheshire, UK). The instrument was calibrated using multielement standard solutions from Inorganic Ventures. Standards and diluted samples were spiked with 50 ppb of In and Bi for instrumental drift correction.
X-ray diffraction (XRD) analysis was used for the characterization of the mineralogical composition of the PR samples and the solid residue (X-Ray diffractometer Bruker AXS GmbH, model D8 Advance, Fe-filtered Co radiation, Lynxeye detector). Quantitative analysis was carried out by TOPAS software (Rietveld refinement method).
The fractional composition of the samples was determined by sieve analysis: the sieves of 2, 1, 0.64, 0.40, 0.20, 0.1, and 0.071 mm were used (Sieves from Retsch, Leuven, Germany).

2.2.4. Mathematical Modeling

The effect of experimental parameters on the solubility of different elements was determined using the regression analysis by MatLab R2020b software (update 4, The MathWorks, Inc., Natick, MA, US). Five different models were tested for the dissolution extent (%) of all analyzed elements y = P, F, Fe, REEs, Ca, Mg, and consumption of H+ ions per moles of P dissolved (ΔH+/ΔP).
  • Model 1 y = a + bx1 + cx2 + dx3
  • Model 2 y = a + bx1 + cx2 + d(x1/x2)
  • Model 3 y = a + b(x1/x2)
  • Model 4 y = a + b(x1/x2)2
  • Model 5 y = a + b(x1/x2) + c(x1/x2)2, where
  • x1-HCl concentration in M (mol∙L−1);
  • x2-sample mass in one L, kg∙L−1;
  • x3-mixing rate, rpm.
R-squared correlation coefficient (R) and root mean squared error (s) were evaluated in the analysis process to choose the best model for every element.
Optimum conditions of P dissolution were found using Wolfram|Alpha Widgets: “Constrained Optimization” program [26].

3. Results and Discussion

The results of leachate chemical analyses are shown in Supplementary Materials Tables S1–S3.

3.1. Solubility of P, F, Mg, Fe, and REEs

As a result of the HCl reaction with PR, the pH of the forming solution increases depending on the HCl concentration and dosage (Figure 1). The pH change is more visible in 0.5 M solution. The pH value also depends on the sample composition being higher for carbonate-rich sample T2. The final value of pH at acid dosage above 2 varies from 0.88 to 1.4 or from 1.4 to 1.7 for the samples T1 and T2, respectively.
Both phosphorus and fluorine are released into the solution from fluorcarbonate apatite (Ap) in the dissolution process of PR. In Figure 2a, it is clearly seen the importance of acid dosage on the solubility of phosphorus, in other words, of Ap. Phosphorus dissolution increases linearly up to acid dosage ~2–2.2 (HCl/Ca mole ratio). P solubility is higher in more concentrated solutions at acid dosage below 2–2.2, but above this level, ~100% solubility is reached, independently of the acid concentration.
At the same time, fluorine dissolution (Figure 2b) is scattered, however, being lower at lower acid dosages. The F solubility over 80% is achieved at an acid dosage above 2.3. In our previous study [27], it was ascertained that precipitation of CaF2 takes place in the Ap-HCl system. Therefore, the content of fluorine in the solution depends on the solubility of Ap and CaF2, as CaF2 precipitation depends strongly on the solution’s pH and Ca concentration [28].
During PR dissolution, Mg2+ ions are released into the solution mainly as a result of dolomite reaction with HCl (3) that also causes the increase in solution pH.
CaMg(CO3)2 + 4HCl Ca2+ + Mg2+ + 4Cl + 2CO2 + 2H2O
Mg solubility increases with the increase in acid dosage (Figure 3), and it almost does not depend on acid concentration under the conditions used (Supplementary Materials). The higher solubility level of the Toolse 2 sample can be explained by the smaller particle size (Table 2). Dolomite dissolution reaches 60%–80% at acid dosage 2 when Ap (P) dissolution is 90%–100%. The incomplete dissolution of dolomite was also proved by XRD analysis of the insoluble residue. The lower solubility of dolomite in comparison with Ap is explained by its relative stability in mineral acids [29].
Fe ions can be released into the solution as a result of numerous reactions (4)–(7) of pyrite and other iron compounds, which can take place simultaneously:
FeO(OH) + 3HCl Fe3+ + 2H2O + 3Cl
FeS2 + 2HCl Fe2+ + H2S + S + 2Cl
FeS2 + 8H2O + 14Fe3+15Fe2+ + 2SO42− + 16H+
2FeS2 + 2H2O + 7O22Fe2+ + 4SO42− + 4H+
The dissolution extent of iron increases linearly with the increase in acid dosage (Figure 4a) and almost does not depend on acid concentration, similarly, with Mg release. Fe solubility reaches from 12% for Toolse 1 to 55% for Ülgase at acid dosage 2. This is explained by the different mineralogical compositions of the samples. The Ülgase sample represents a weathered sample that probably contains part of iron in the form of hydroxide (goethite), which is easily soluble in acids, compared to the Toolse samples where pyrite dominates (Table 1), which is hardly soluble in HCl [30].
Fe dissolution is also influenced by the content of phosphorus in the solution (Figure 4b). The increase in P content causes a decrease in Fe solubility, most likely, due to the increase in pH value that favors the precipitation of FePO4 [31]. Unfortunately, the detection of FePO4 in the solid residue is complicated because of its amorphous structure. The main insoluble iron-bearing phase detected by XRD was pyrite.
REEs in PR are mainly bound into the Ap structure, and therefore their dissolution is expected to follow the Ap dissolution behavior. In reality, the solubility of REEs from Ülgase reached 100% only just when the acid dosage was 2.6 and HCl concentration 1.5 M (Supplementary Materials). In the experiments with Toolse (acid dosage 1–2.4) and with Ülgase in 1 M HCl, the REEs solubility is below 10% (Figure 5). The low solubility of REEs in some cases is explained by the change of REEs-phosphates solubility depending on solution pH and phosphate ions concentration [24]. The increase in pH and phosphate content leads to REEs-phosphates formation. Therefore, the REEs solubility is more dependent on solution phosphate concentration and pH than on the acid dosage that determines Ap solubility. The formation of REEs-phosphates at certain conditions is a group of other secondary reactions, similar to the CaF2 precipitation, which takes place simultaneously with PR dissolution in an HCl solution. This result indicates the possibility of REEs separation with solid precipitate at slightly higher pH values (~2.5–3) as needed for Ap dissolution.

3.2. Regression Analysis

The regression analysis with Matlab 2020b and the following optimization was performed with the aim of establishing optimum values for acid concentration and sample mass to achieve at least 98% apatite dissolution extent. The squared correlation coefficient (R) and the root mean squared error (s) values were evaluated for all five proposed models (see Experimental) using Toolse 1 sample data. The results are presented in Table 4.
The best fit for P, Fe, Ca, and Mg solubility for Toolse 1 sample was obtained with model 5 that is based on acid molar concentration (mol∙L1) and sample mass in kg per liter (kg∙L1) ratio (x1/x2). The fluorine and REEs solubility do not follow any studied model as the best R values are below 0.75 for REEs and 0.89 for F. This can be explained by the secondary precipitation reactions of these elements in the system. At the same time, Fe solubility fits well with all tested models. The equations describing the solubility of these elements according to model 5 as dissolution extent in % are given in Table 5.
To clarify more in detail the reaction mechanism, a variable y = ΔH+/ΔP was calculated, where ΔH+ is the amount of H+ in moles used and ΔP amount of P in moles dissolved. The concentration of H+ ions in the solutions of the experiment was found by the cH+ = f(pH) calibration curve. The change in ΔH+/ΔP also correlates well with the regression model 5 (Figure 6).
The regression analysis of Ülgase and Toolse 2 solubility data was performed with models 1, 2, 3, and 5, and the most suitable equations for dissolution extent are presented in Table 5. The results are similar to Toolse 1 results for all the samples considering P and Mg, whereas model 5 gives the best fit. Model 5 was also the best for Ca and Fe dissolution in the experiments with Ülgase and for ΔH+/ΔP with Toolse 2. In the case of Toolse 2, Ca(%) solubility was better described by model 2. The best model for the description of REEs solubility was also model 2; however, the R value is below 0.9. The dissolution data of Fe did not fit into any regression model satisfactorily. Therefore, regression modeling of solubility of the elements whose content in solutions is impacted by simultaneous precipitation does not give satisfactory results.
The fitted values of ΔH+/ΔP according to model 2 for the Ülgase sample are presented in Figure 7. It can be seen that the correlation is remarkably weaker than it was for Toolse 1 (Figure 6).
The calculated and experimental values of ΔH+/ΔP for Toolse 2 are presented in Figure 8. The difference between the experimental and the calculated values were found to be minimal, which indicates good accuracy of the tested model 5 to describe the consumption of H+ ions in the dissolution process per dissolved P and its strong dependence on the x1/x2 ratio.
At the same time, ΔH+/ΔP values are remarkably higher than expected by the reaction (1) (10/3) as part of H+ ions are used in the reactions of dissolution of other minerals (dolomite, pyrite, goethite) that increases the acid consumption. In addition, the reactions of solid phosphates formation must be considered as well.

3.3. Optimization of the Conditions of Phosphorus Dissolution

According to the experiment matrix (Table 3), all series of experiments with different samples (Toolse 1, Ülgase, and Toolse 2) have their definite limits of parameters (Table 6) defined by the experimental conditions used and apatite content in it. For example, for all the experiments, the molar concentration of HCl is limited by 0.5 < x < 1.5.
To optimize the dissolution conditions, calculation of the maximum and minimum values for P dissolution according to the equations of model 5 (Table 5) for each sample as well as the optimum values for x1 and x2 within the given limits for x2 and x1/x2, was performed. The 3D plots of the calculation results are presented in Figure 9. The marked points are as close to real optimums as possible. The restriction for x1/x2 influences the optimum values but is hidden in 3D graphs. The minimum values help to understand the validity region of the model. Within the defined limits, the following optimum values for x1 and x2 were obtained (Table 7). In the case of Toolse 2, the maximum and minimum point coordinates are quite close as during the experiments, all values of P dissolution (%) received were higher than 90%.

4. Conclusions

The dissolution of three different Estonian phosphorite ore samples in HCl acid was studied, and the impact of the chemical and mineralogical composition of PR on the release of P, F, Fe, Mg, and REEs was shown.
Analysis of the data obtained, modeling calculations, and optimization of the dissolution conditions permit us to conclude the complexity of the reactions and equilibrium in the system.
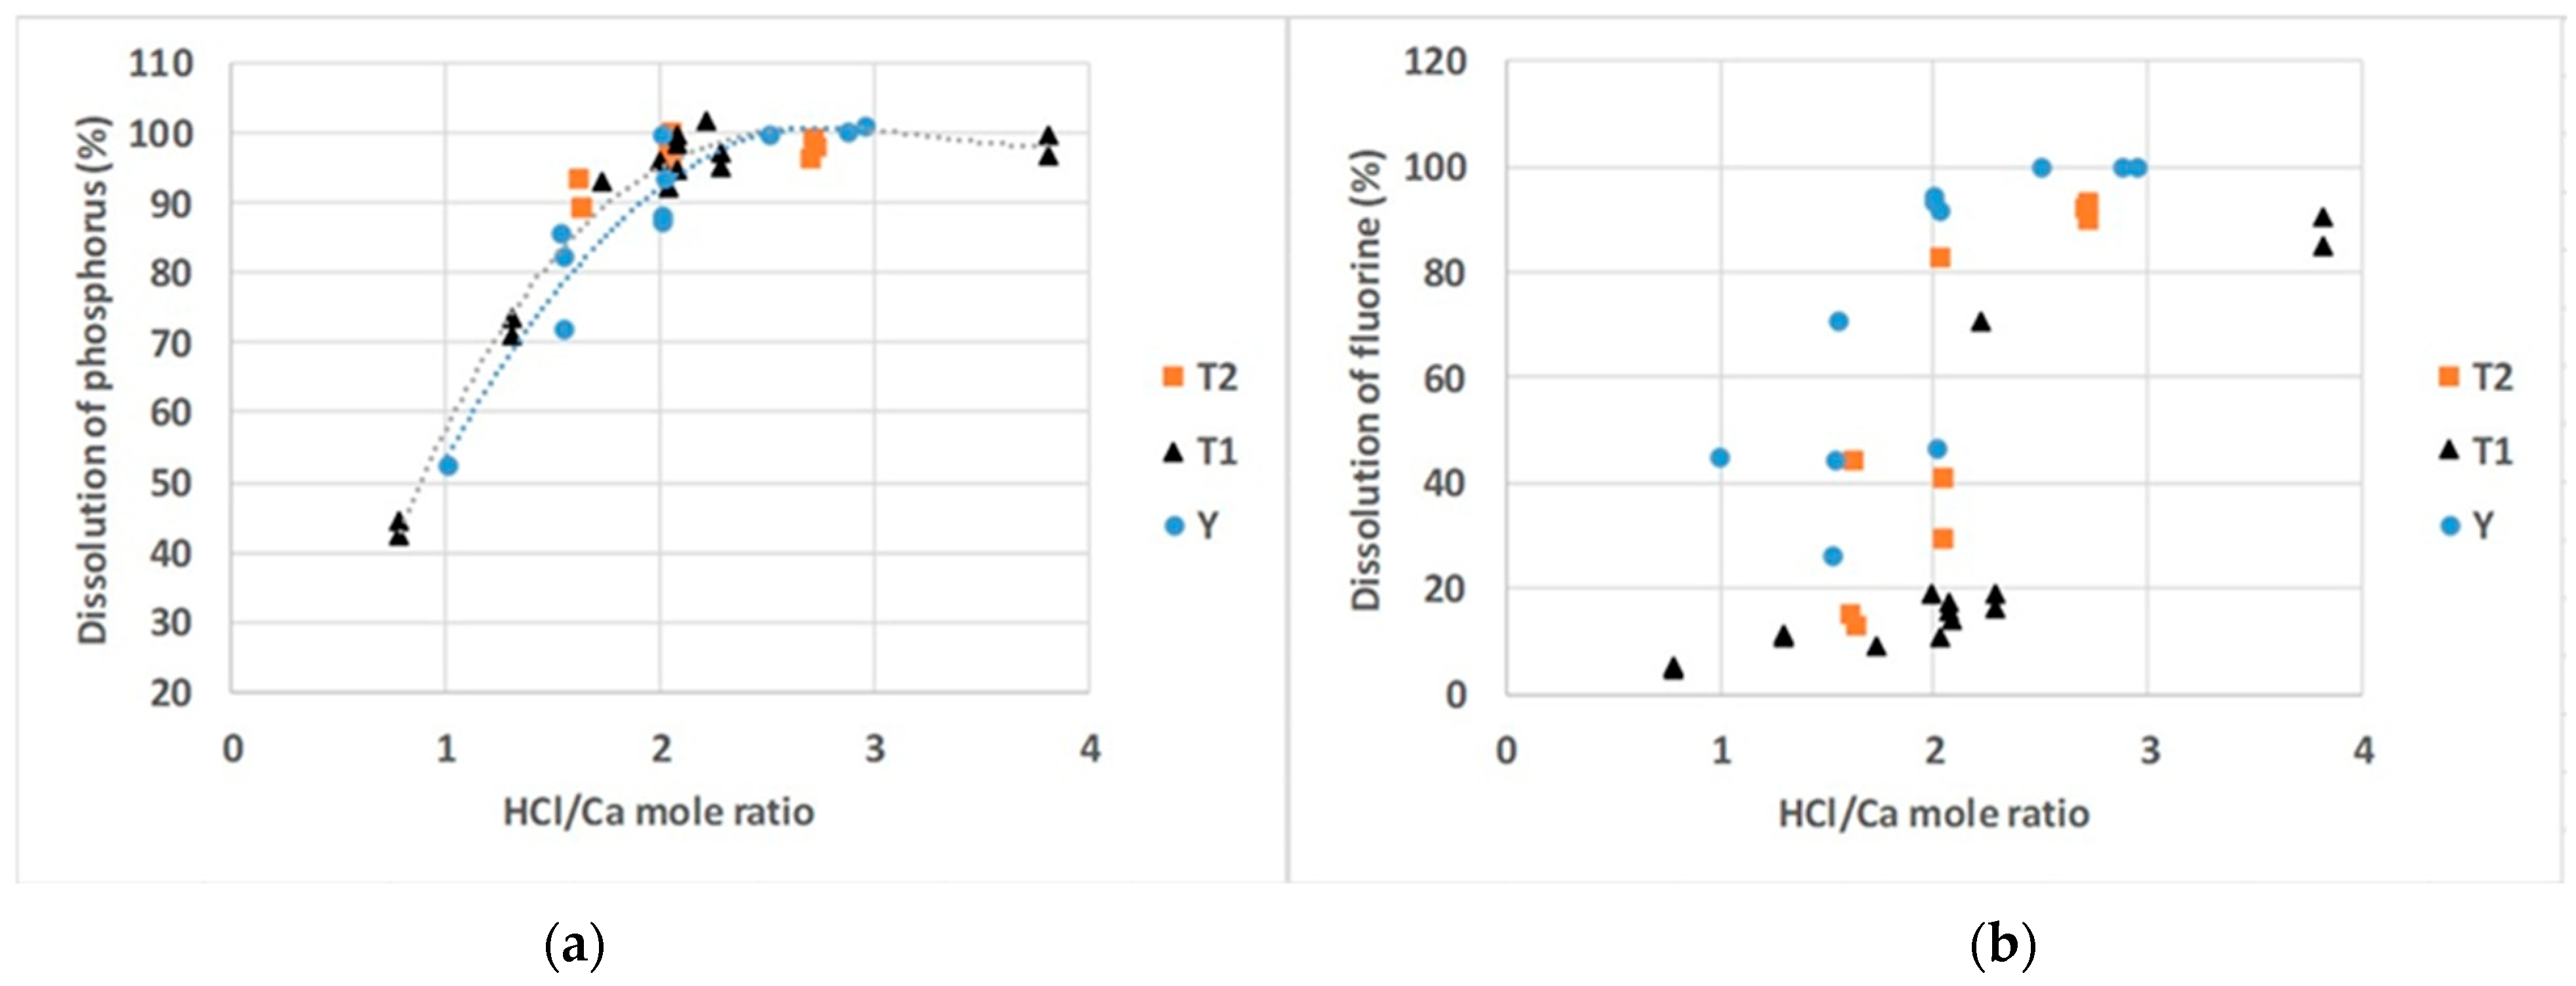
The experiments carried out revealed that complete phosphorus solubility from Estonian phosphate rock could be achieved in quite dilute 0.5 M (3%) HCl in 60 min at acid dosage 2.2 (HCl/Ca mole ratio).
Phosphorus (carbonate apatite) dissolution in 1 h depends mainly on acid dosage up to 2.1. The increase in HCl concentration (0.5–1.5 M) has less impact. Mixing intensity had a minor impact on PR solubility under the conditions used in the experiments.
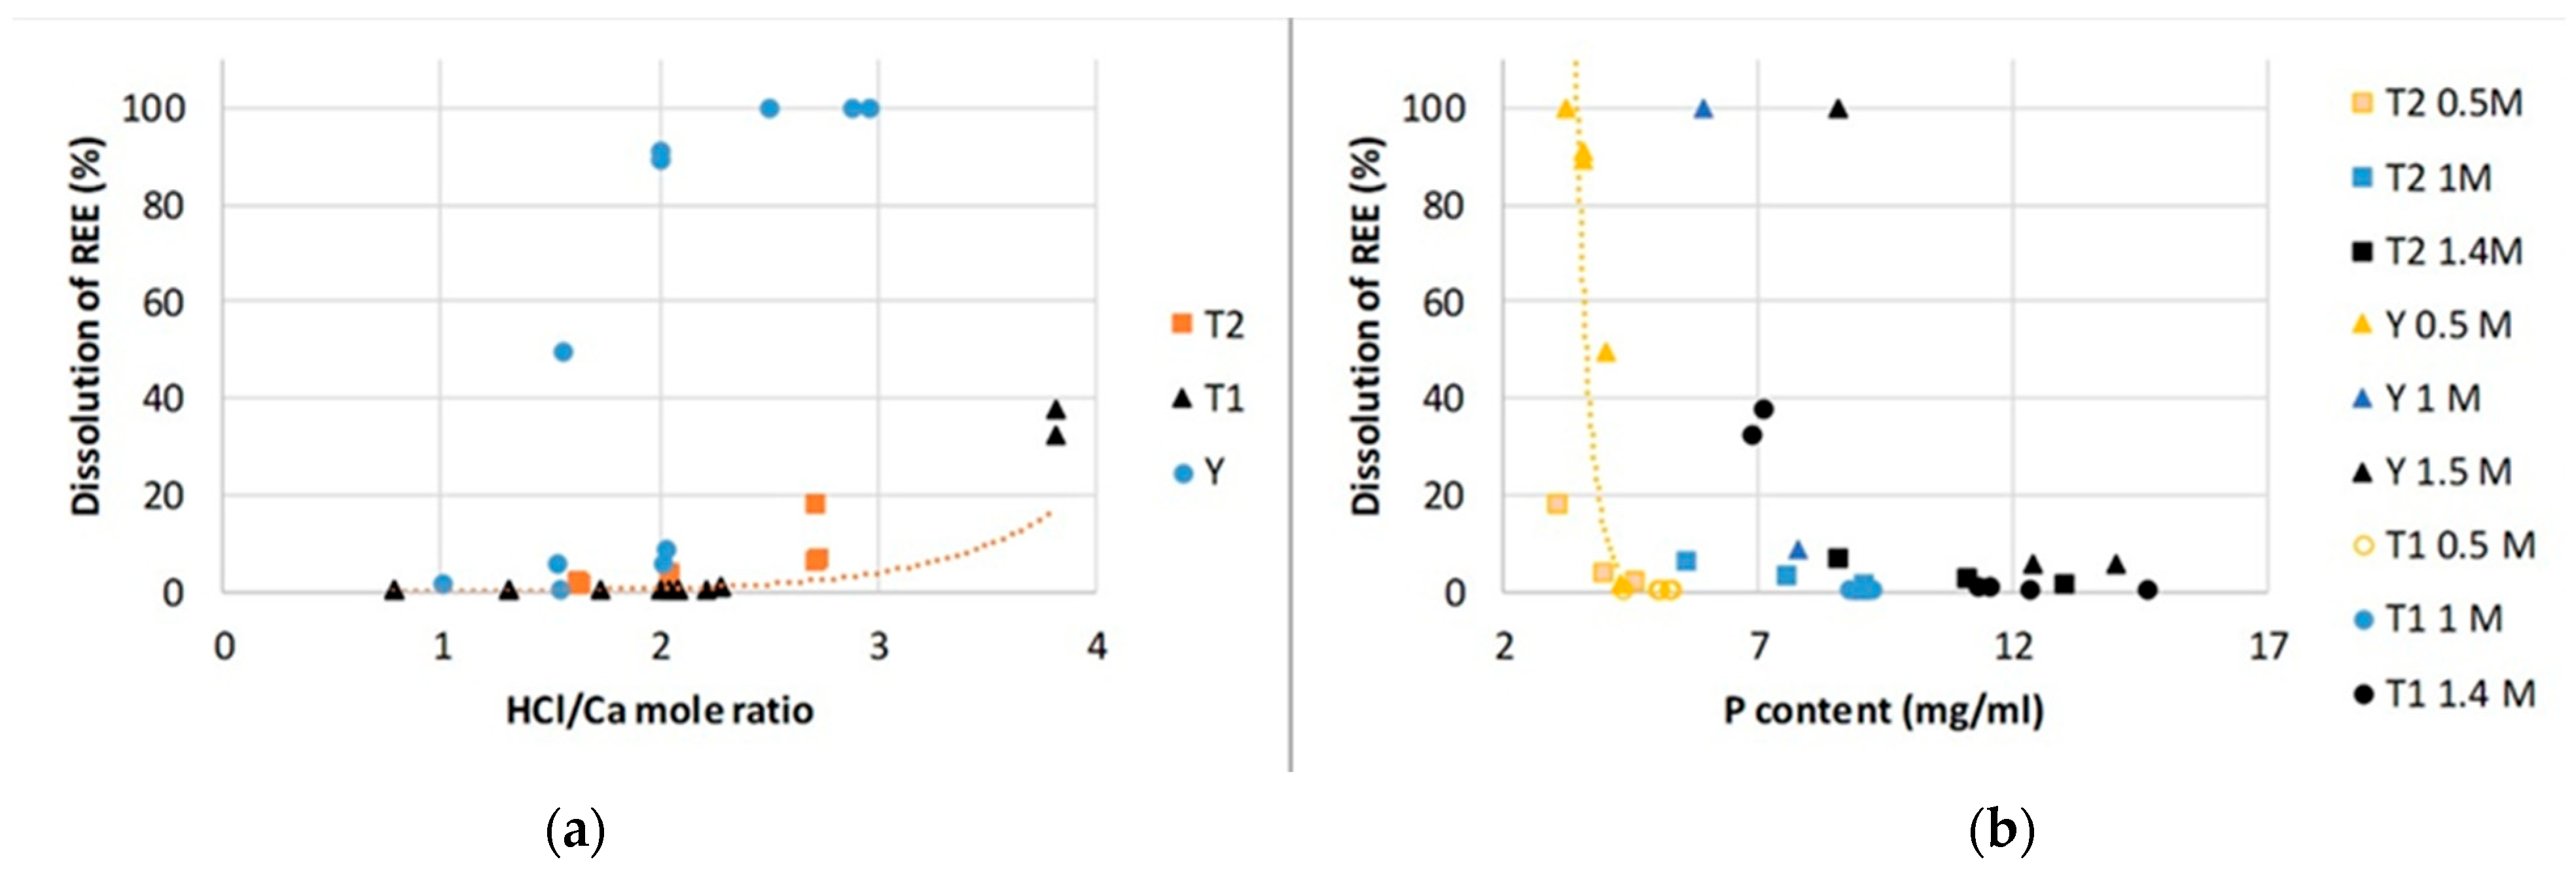
The solubility of fluorine and REEs is also influenced by CaF2 and REEs-phosphates precipitation, accordingly.
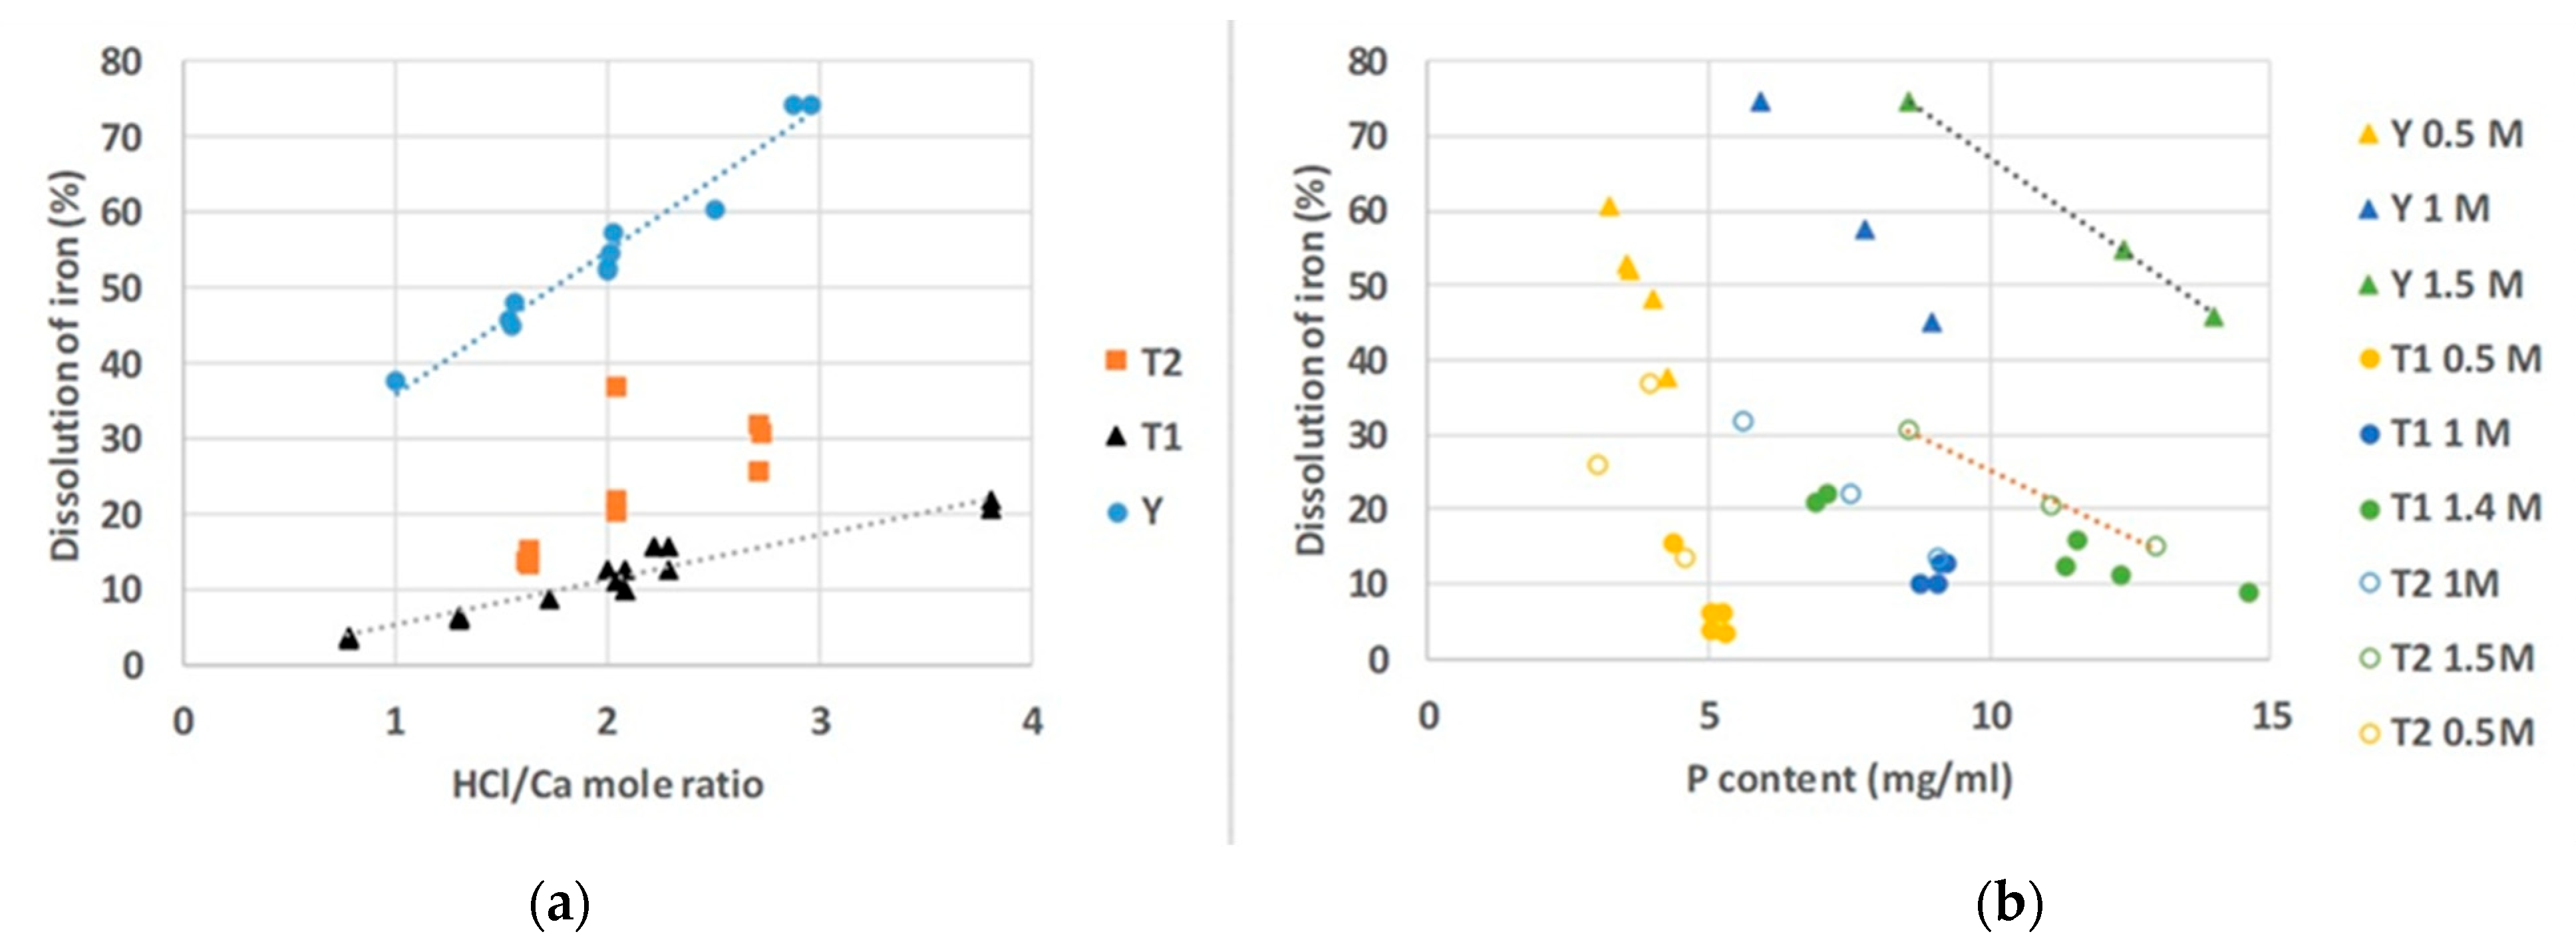
Fe solubility depends first of all on the mineralogical composition of PR (pyrite content) but also on particle size, acid dosage, pH as well as phosphorus content in the solution—higher P content with a simultaneous increase in pH causes precipitation of FePO4. The dissolution of pyrite is much lower than the solubility of carbonate apatite.
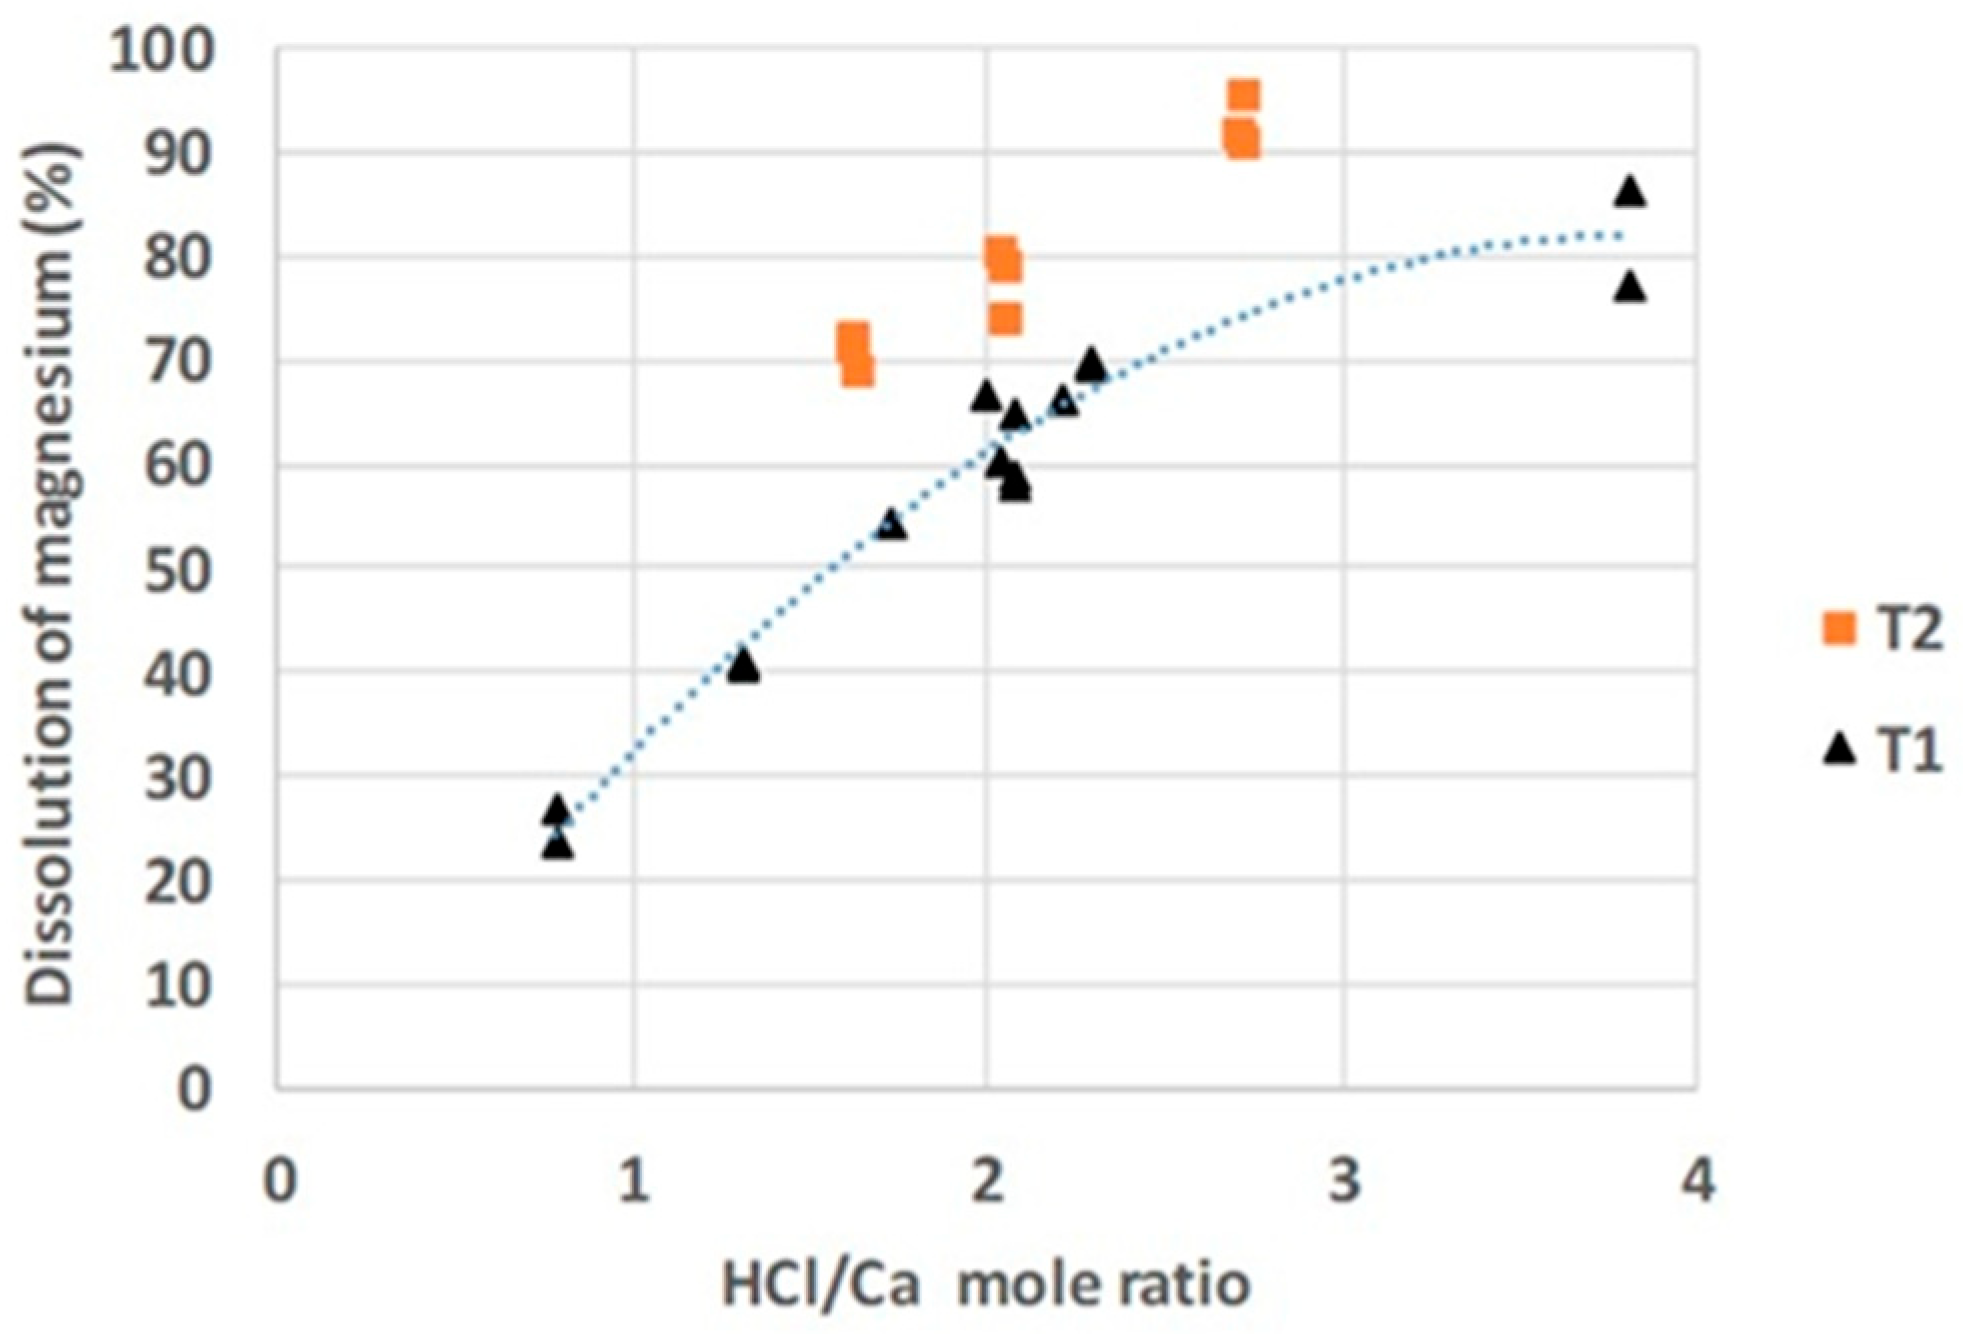
Dolomite dissolution is expressed by Mg release into the solution that depends on the acid dosage and on the fractional composition of PR. Dolomite dissolution also rests lower as compared to apatite dissolution.
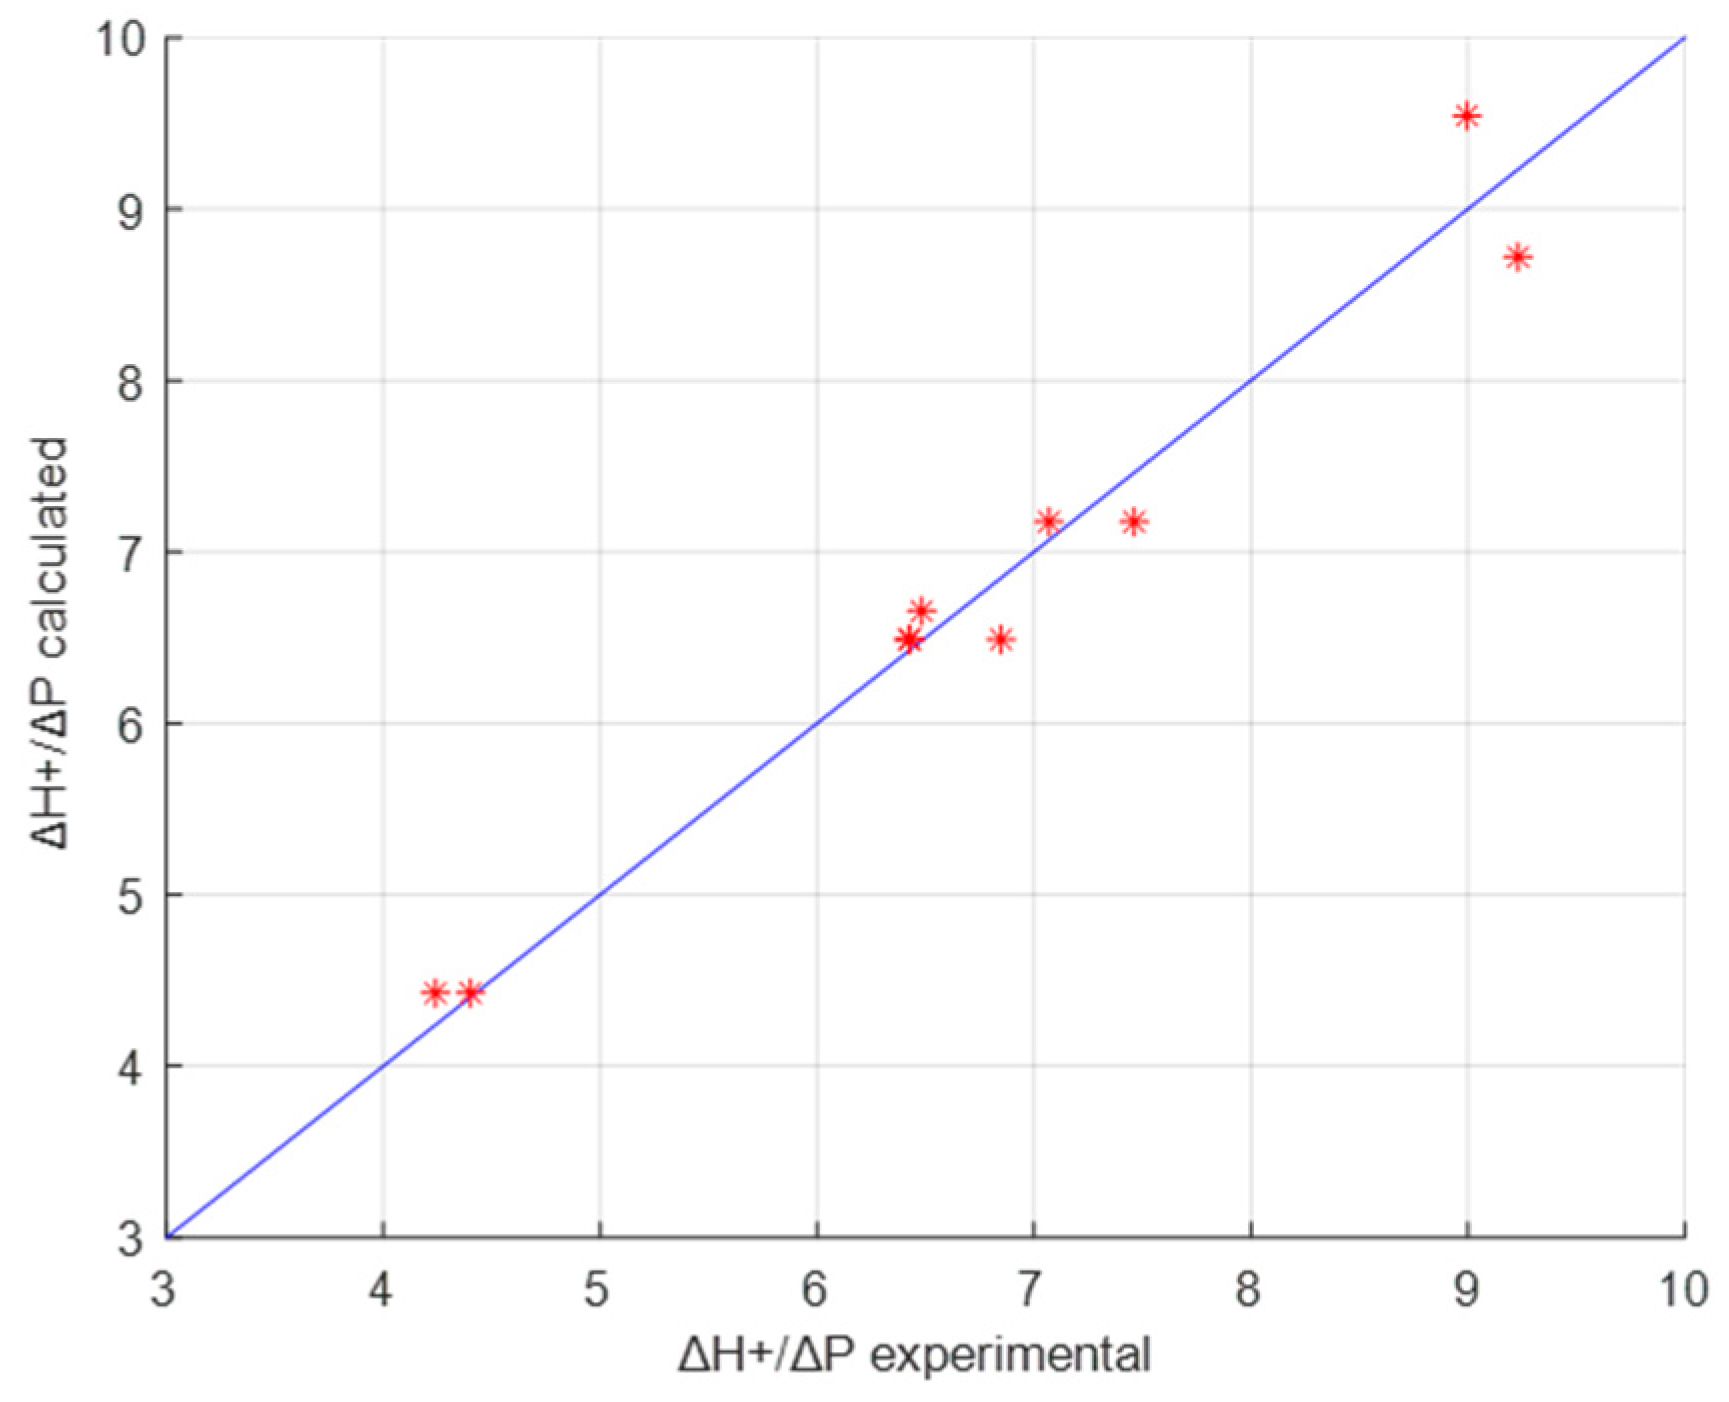
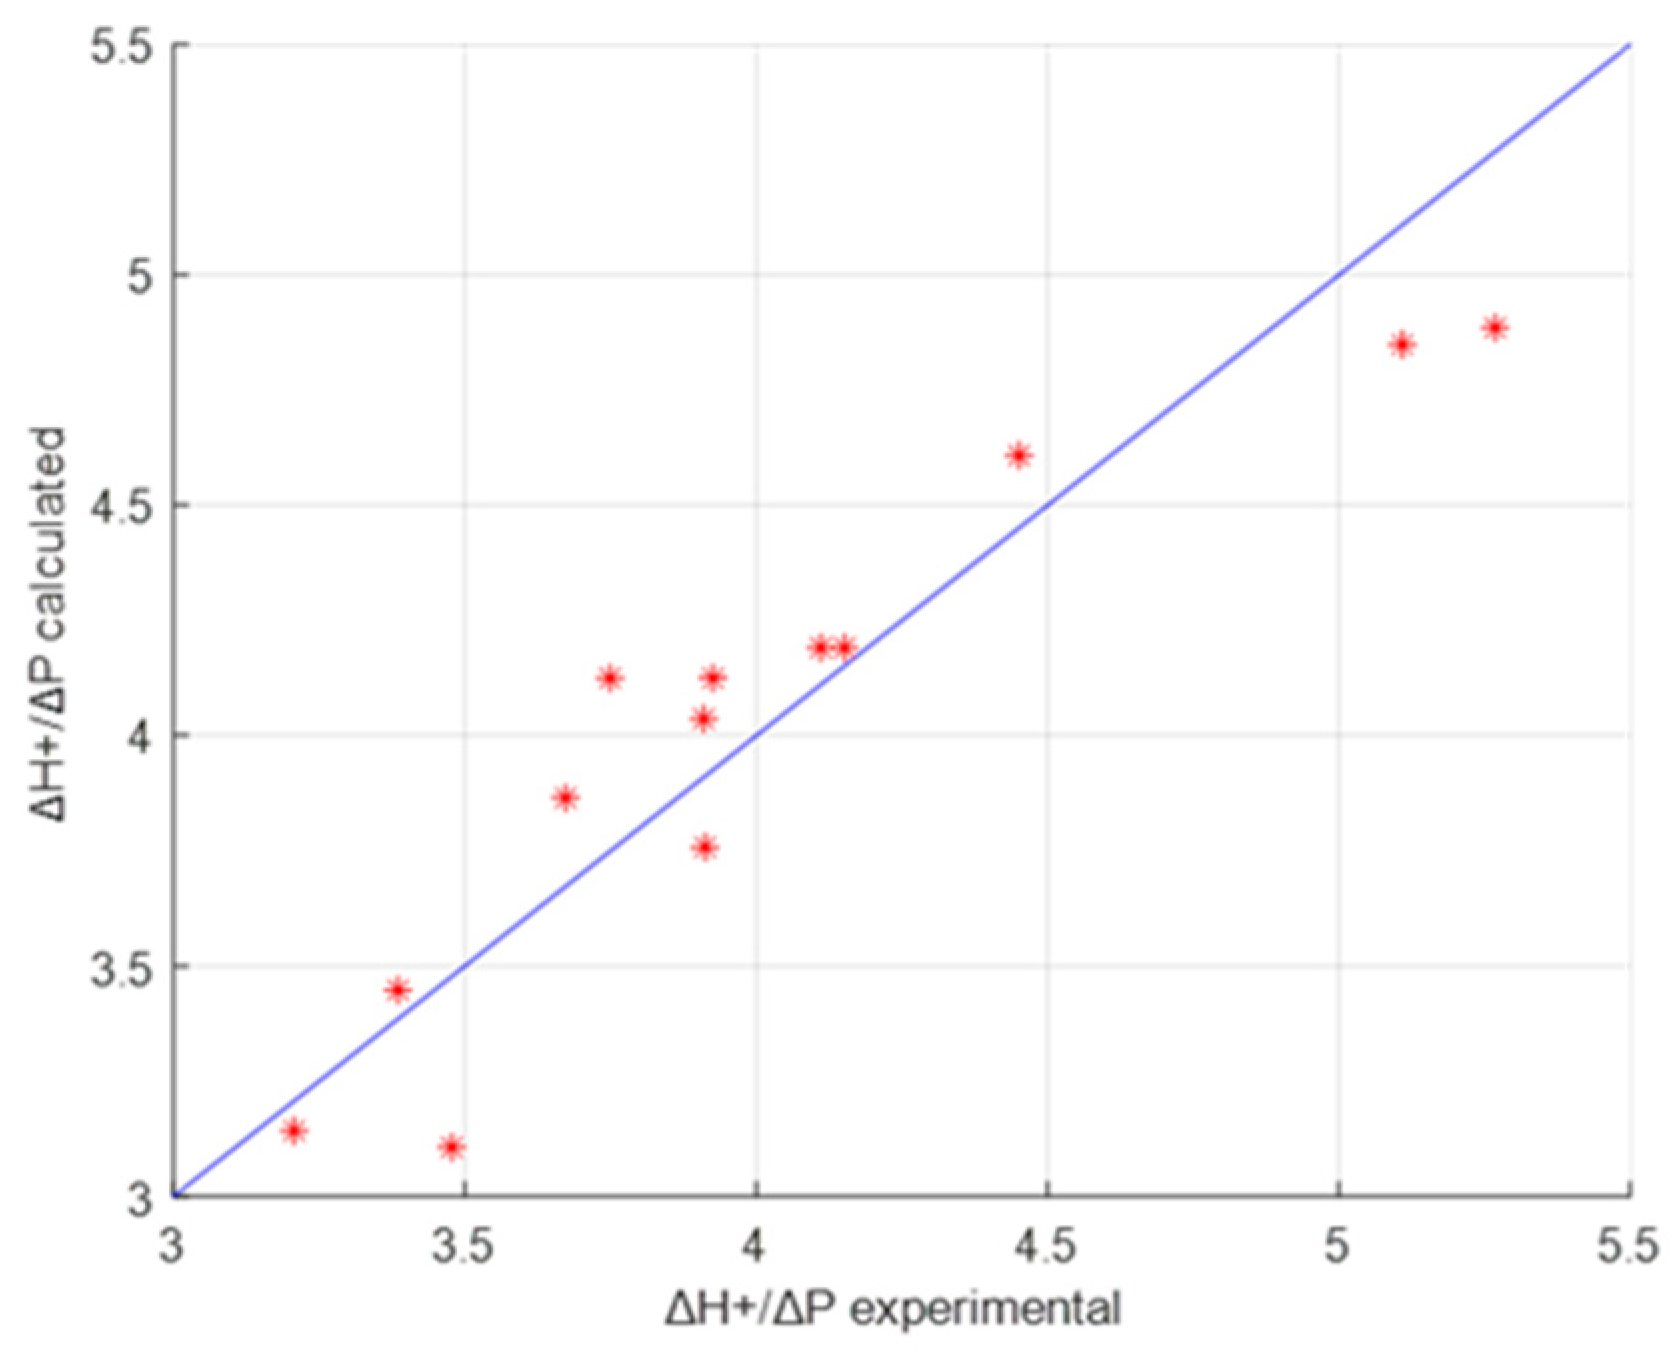
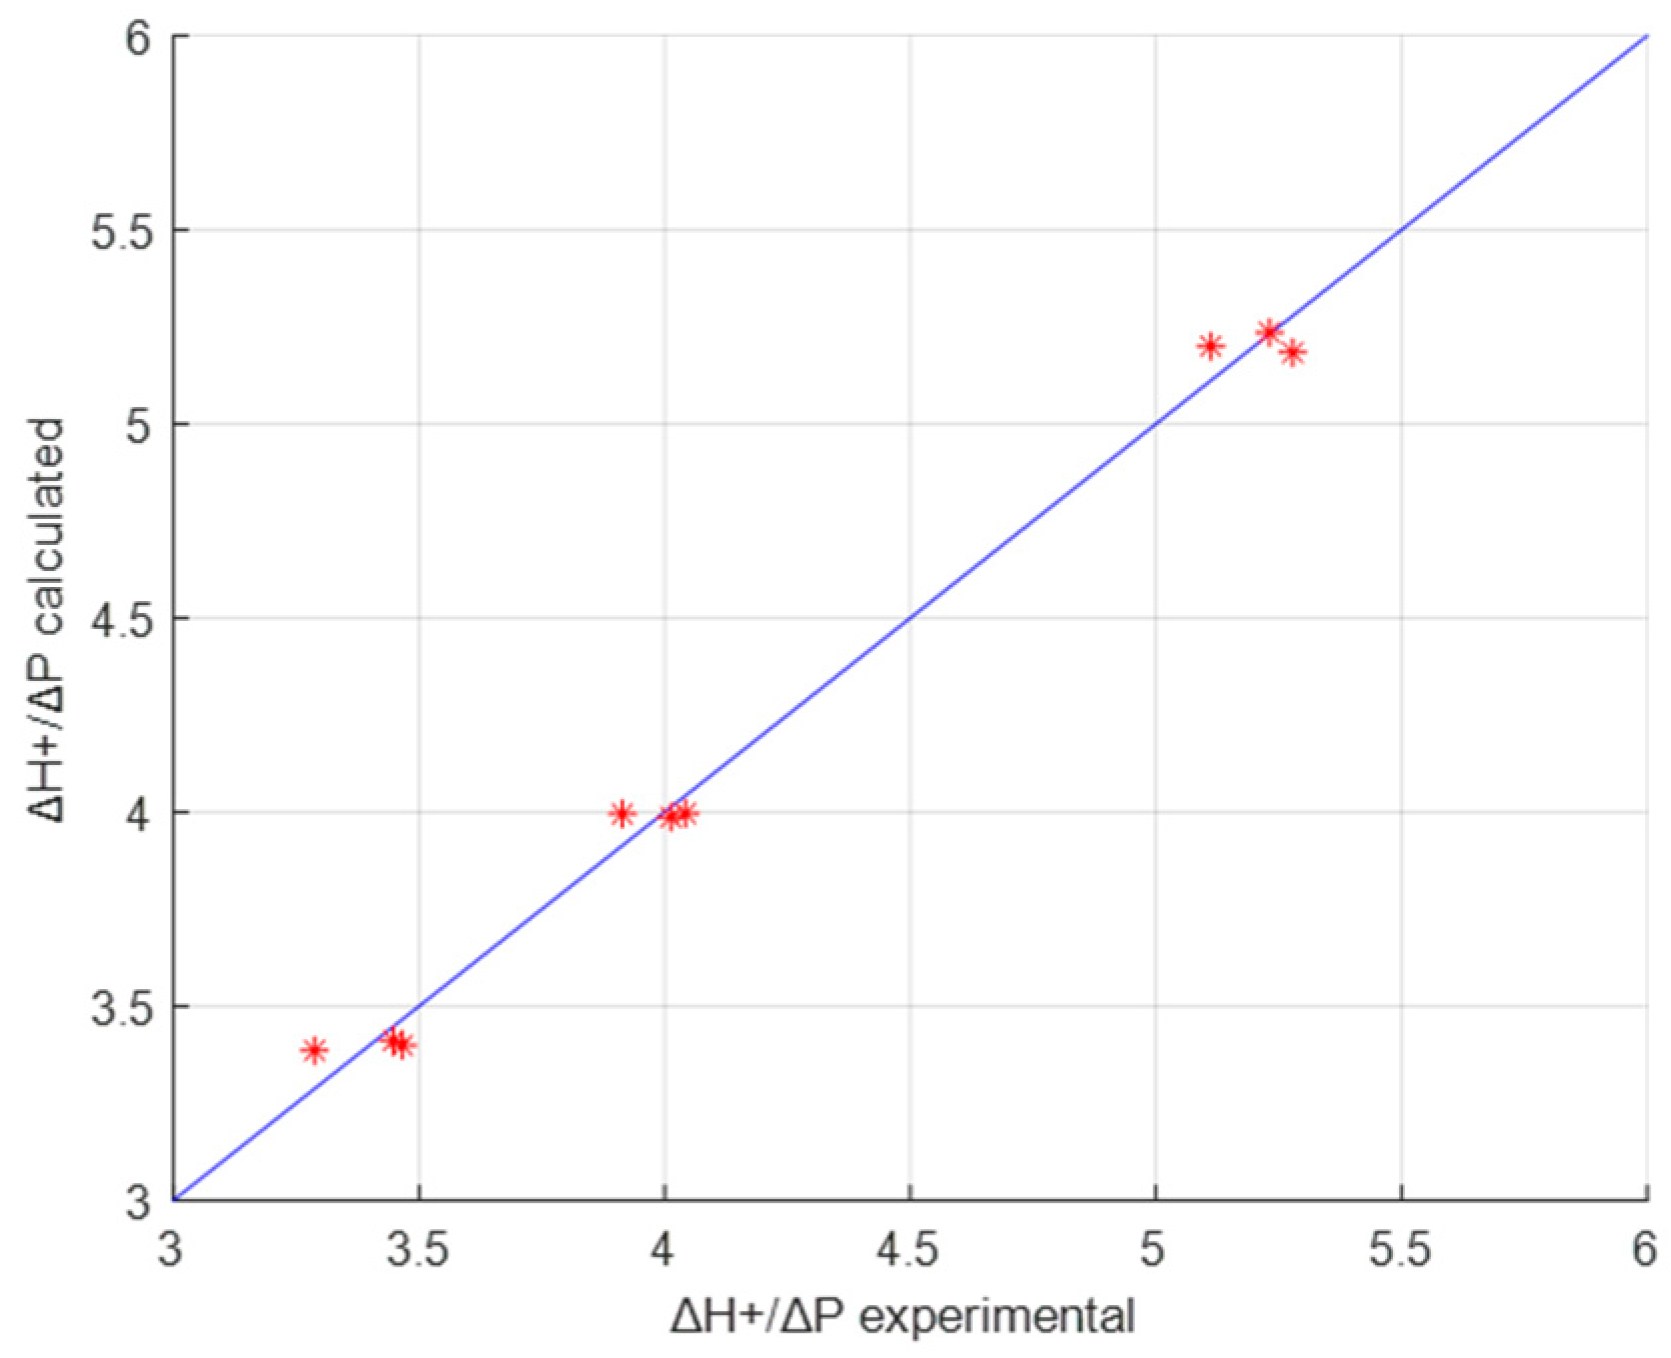
This was the first attempt to model the carbonate fluorapatite dissolution in a weak HCl solution. It was shown by regression analysis of the experiment data that dissolution of P, Ca, Mg, and consumption of H+ ions per P dissolved could be described by the ratio of HCl moles and sample mass per one liter (x1/x2). For all the samples, the best model to describe P and Mg solubility can be given as y = a + b(x1/x2) + c(x1/x2)2.
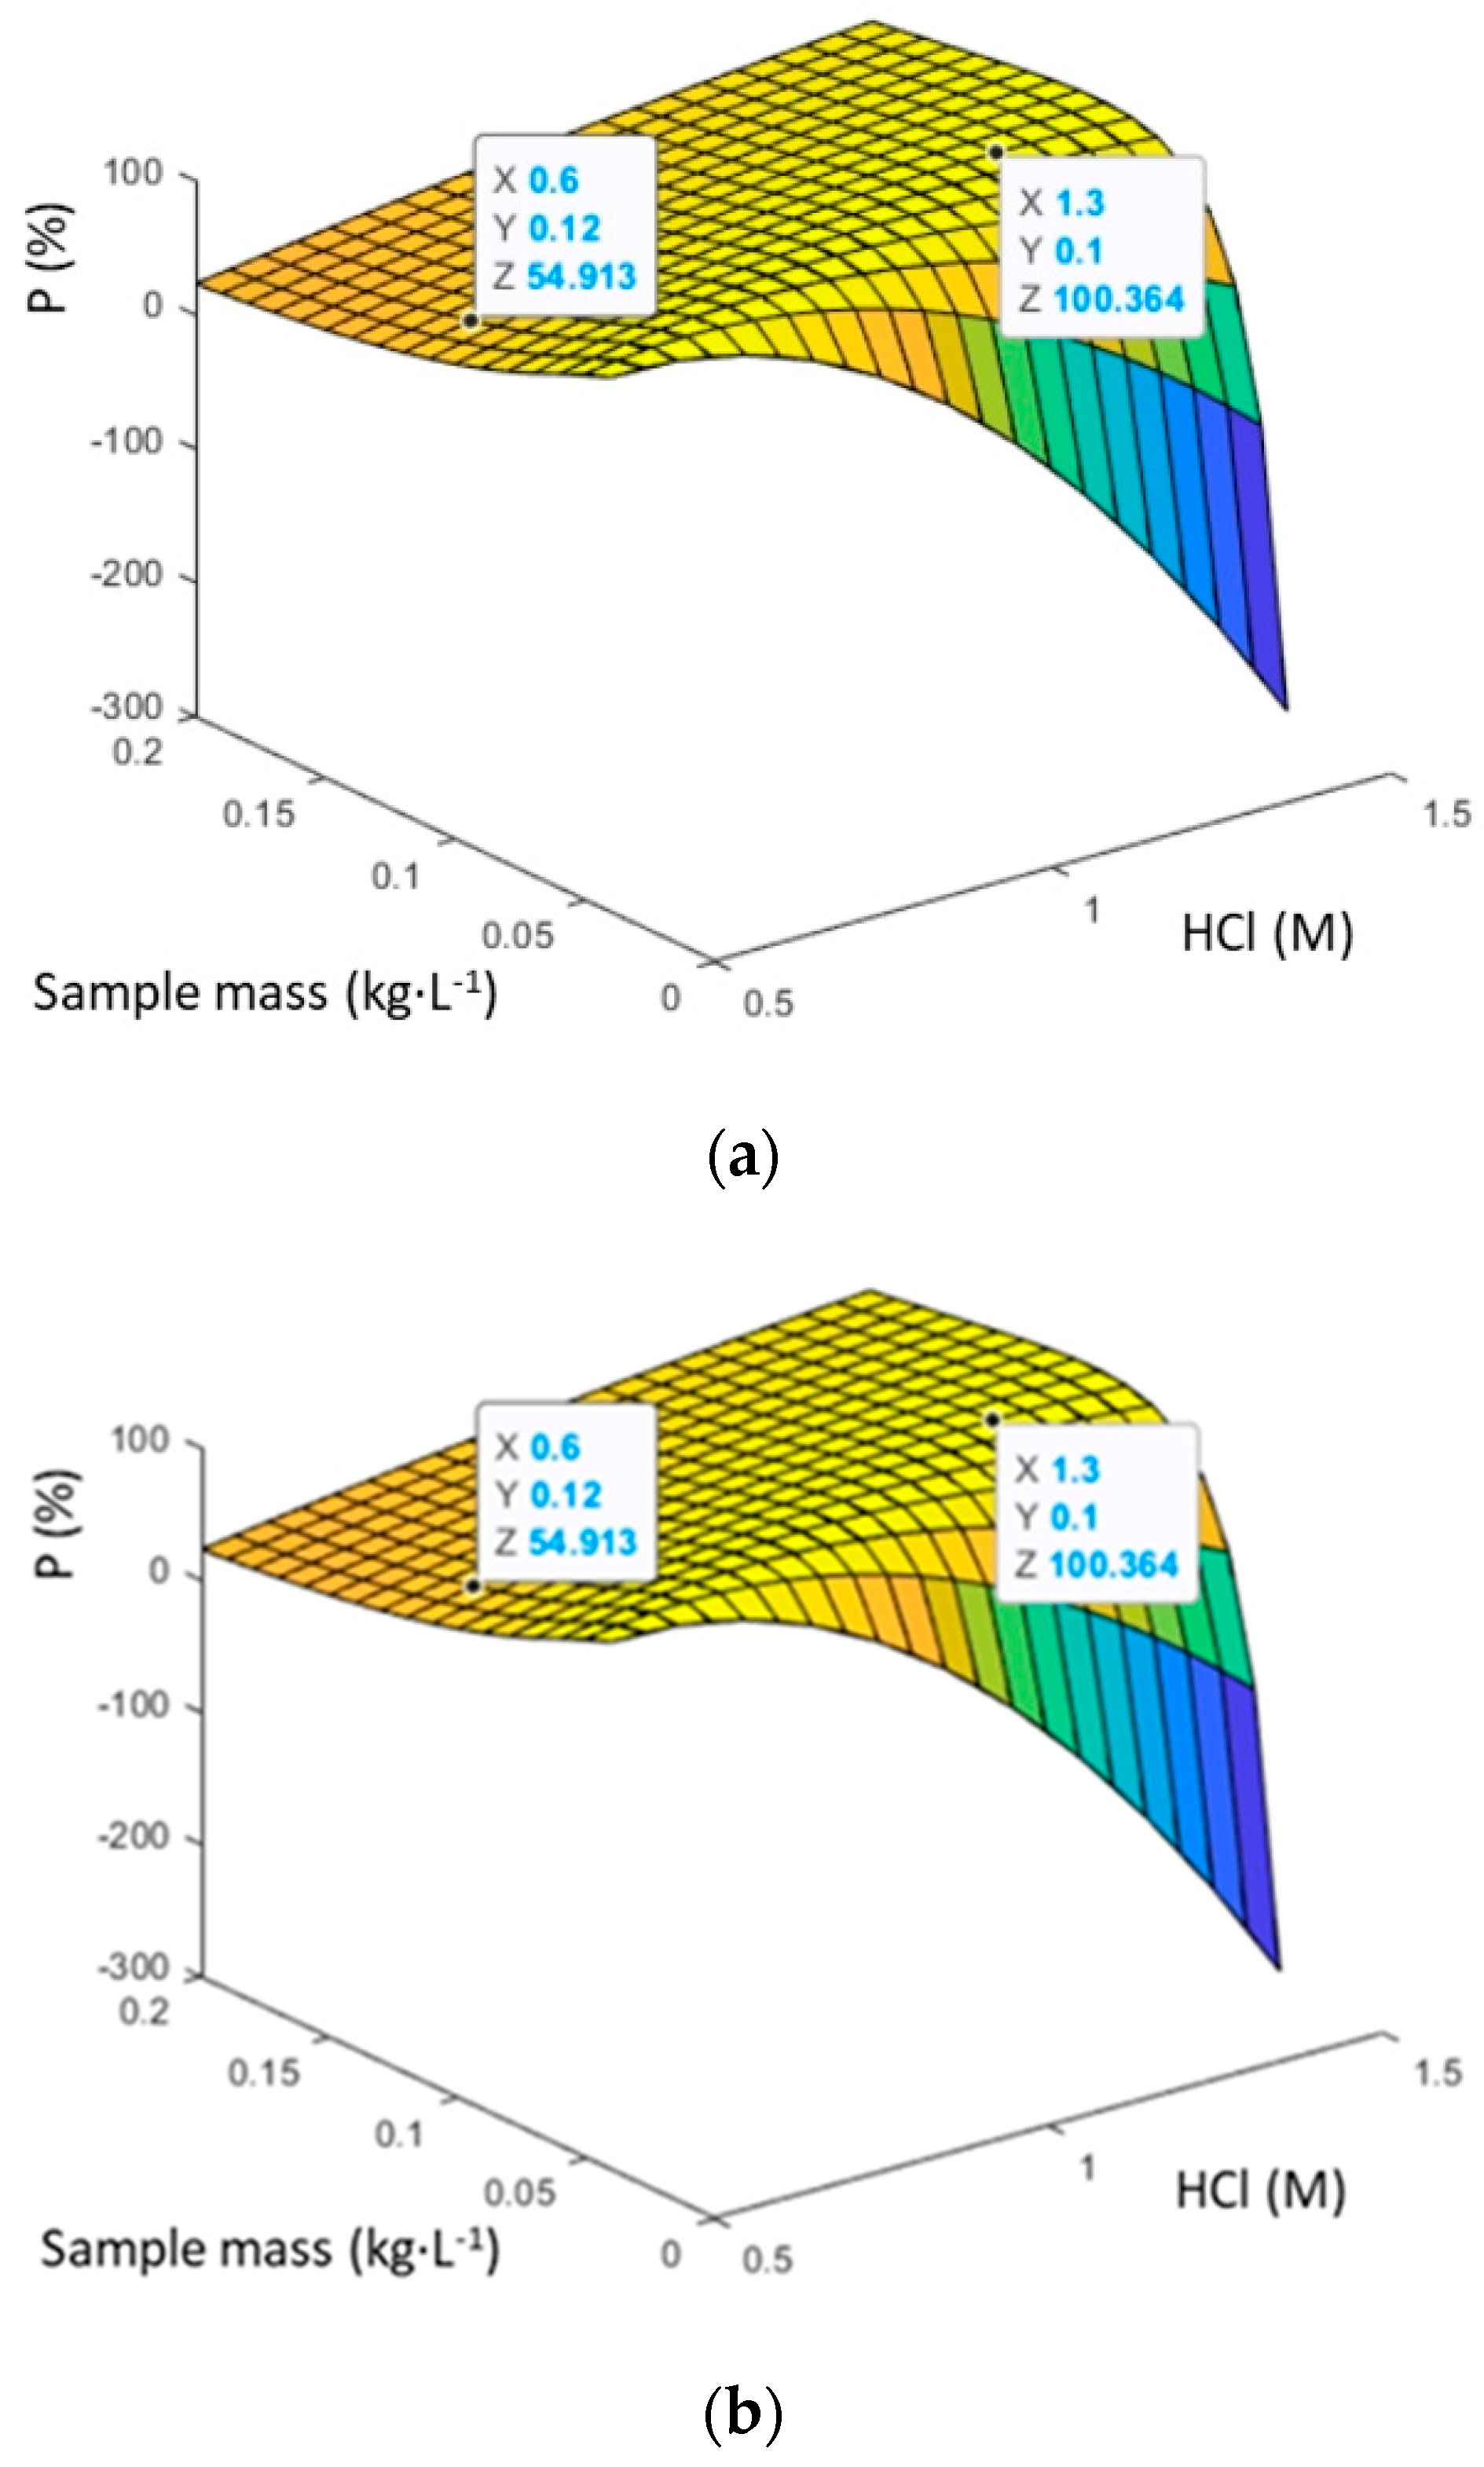
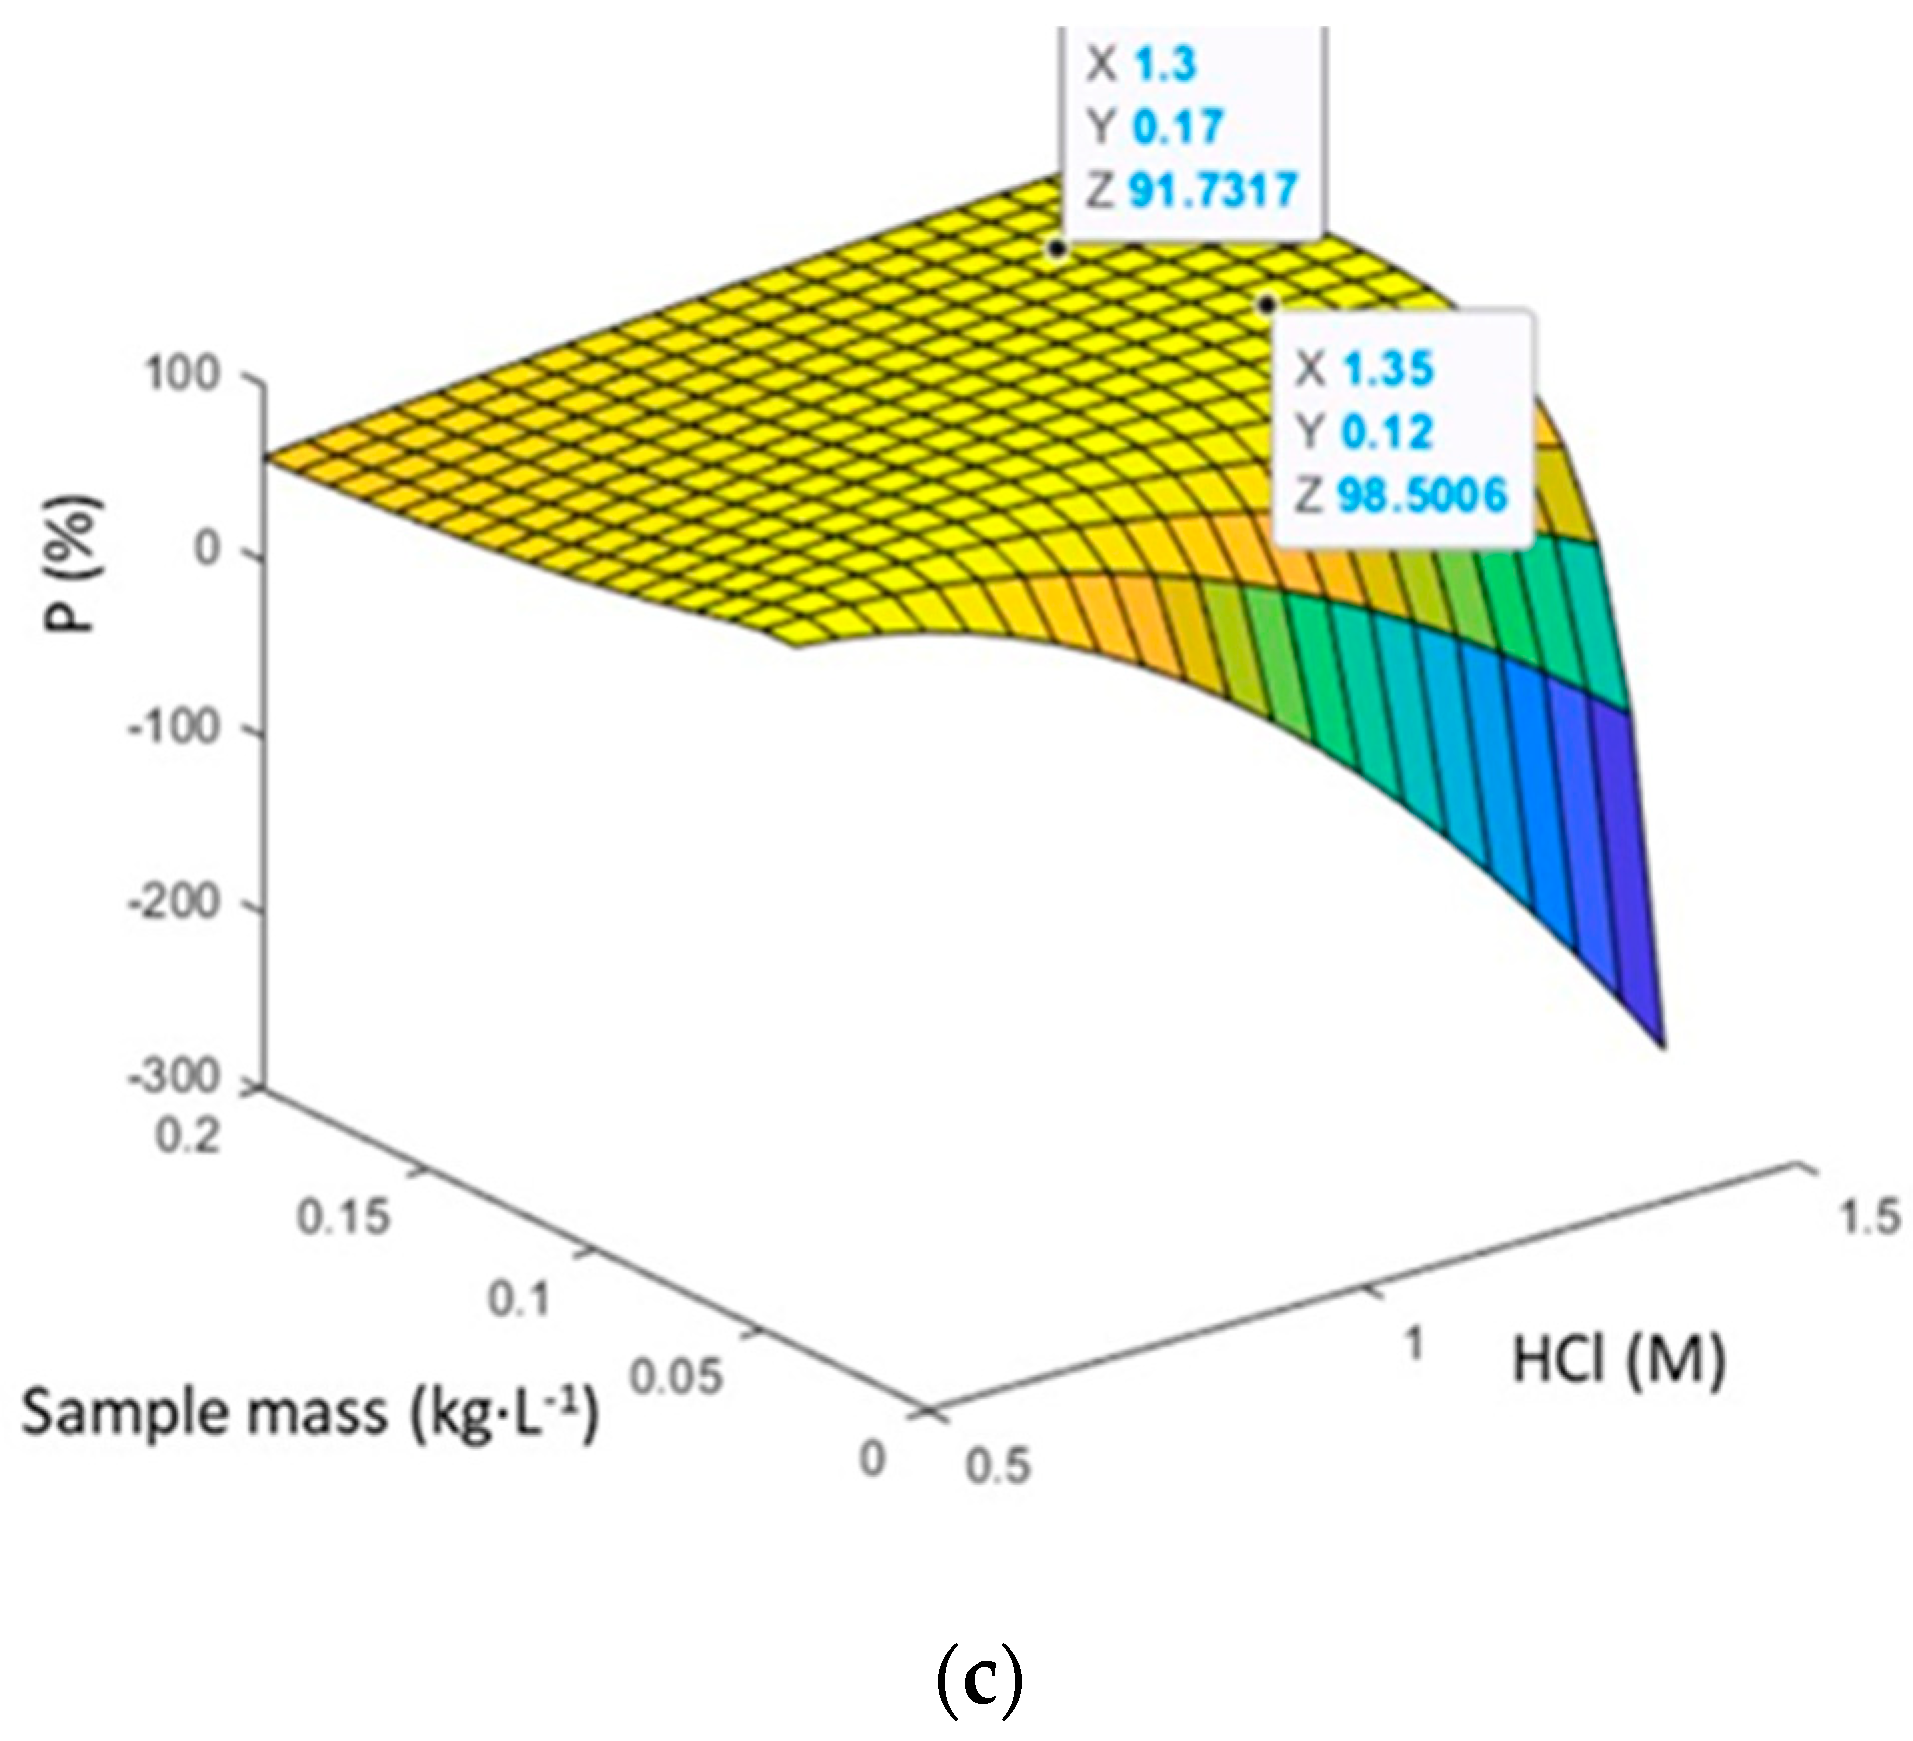
A comparison of the results of optimization calculations for different samples established that for total dissolution of apatite, the optimum HCl concentration is 1.28–1.35 M. Sample mass dissolved in 1 L HCl (0.1–0.21 kg) depends on the apatite content in it.

Supplementary Materials

The following supporting information can be downloaded at: https://www.mdpi.com/article/10.3390/min13040578/s1, Table S1: Final pH and solubility data of Toolse 1. Table S2: Solubility data of Ülgase. Table S3: Final pH and solubility data of Toolse 2.

Author Contributions

Conceptualization, K.T., A.T. and J.K.; Methodology, K.T. and J.K.; Validation, K.T., J.K. and T.K.; Formal Analysis, M.E., R.M., T.K. and K.U.; Investigation, K.T. and R.M.; Resources, M.E.; Writing—Original Draft Preparation, K.T.; Writing—Review & Editing, K.T., R.K. and A.T.; Visualization, K.T. and J.K.; Supervision, R.K.; Project Administration, A.T.; Funding Acquisition, A.T. All authors have read and agreed to the published version of the manuscript.

Funding

This study was supported by ERDF and Estonian Research Council via project RESTA23 and grant PRG1779.

Data Availability Statement

Not applicable.

Conflicts of Interest

The authors declare no conflict of interest.

References

  1. Bobba, S.; Carrara, S.; Huisman, J.; Mathieux, F.; Pavel, C. Critical Raw Materials for Strategic Technologies and Sectors in the EU: A Foresight Study; Publication Office of the European Commission: Luxenbourg, 2020. [Google Scholar] [CrossRef]
  2. Raudsep, R. Phosphorite. In Geology and Mineral Resources of Estonia; Raukas, A., Teedumäe, A., Eds.; Estonian Academy Publishers: Tallinn, Estonia, 1997; pp. 331–336. [Google Scholar]
  3. Yang, X.; Tamm, K.; Piir, I.; Kuusik, R.; Trikkel, A.; Tõnsuaadu, K. Evaluation of Estonian Phosphate Rock by Flotation. Miner. Eng. 2021, 171, 107–127. [Google Scholar] [CrossRef]
  4. Wu, S.; Wang, L.; Zhao, L.; Zhang, P.; El-Shall, H.; Moudgil, B.; Huang, X.; Zhang, L. Recovery of Rare Earth Elements from Phosphate Rock by Hydrometallurgical Processes—A Critical Review. Chem. Eng. J. 2018, 335, 774–800. [Google Scholar] [CrossRef]
  5. Koopman, C.; Witkamp, G.J. Extraction of Lanthanides from the Phosphoric Acid Production Process to Gain a Purified Gypsum and a Valuable Lanthanide By-Product. Hydrometallurgy 2000, 58, 51–60. [Google Scholar] [CrossRef]
  6. Hermann, L.; Kraus, F.; Hermann, R. Phosphorus Processing-Potentials for Higher Efficiency. Sustainability 2018, 10, 1482. [Google Scholar] [CrossRef]
  7. Stone, K.; Bandara, A.M.T.S.; Senanayake, G.; Jayasekera, S. Processing of Rare Earth Phosphate Concentrates: A Comparative Study of Pre-Leaching with Perchloric, Hydrochloric, Nitric and Phosphoric Acids and Deportment of Minor/Major Elements. Hydrometallurgy 2016, 163, 137–147. [Google Scholar] [CrossRef]
  8. Bandara, A.M.T.S.; Senanayake, G. Dissolution of Calcium, Phosphate, Fluoride and Rare Earth Elements (REEs) from a Disc of Natural Fluorapatite Mineral (FAP) in Perchloric, Hydrochloric, Nitric, Sulphuric and Phosphoric Acid Solutions: A Kinetic Model and Comparative Batch Leaching of Ma. Hydrometallurgy 2019, 184, 218–236. [Google Scholar] [CrossRef]
  9. Baniel, A.M.; Ruth, B.; Alexander, A. Process for Preparation of Substantially Pure Phosphoric Acid. US Patent 3,338,674, 29 August 1967. [Google Scholar]
  10. Schorr, M.; Valdez, B.; Zlatev, R.; Stoytcheva, M. Phosphate Ore Processing for Phosphoric Acid Production: Classical and Novel Technology. Trans. Inst. Min. Metall. Sect. C Min. Proc. Extr. Metal. 2010, 119, 125–129. [Google Scholar] [CrossRef]
  11. Shlewit, H. Treatment of Phosphate Rocks with Hydrochloric Acid. J. Radioanal Nucl. Chem. 2011, 287, 49–54. [Google Scholar] [CrossRef]
  12. Kandil, A.H.T.; Mira, H.I.; Taha, M.H.; Kamel, M.F. Production of Pure Phosphoric Acid from El-Sebaeya Low-Grade Phosphate Ore. Sep. Sci. Technol. 2017, 52, 679–690. [Google Scholar] [CrossRef]
  13. Aly, H.F.; Ali, M.M.; Taha, M.H. Dissolution Kinetics of Western Desert Phosphate Rocks, Abu Tartur with Hydrochloric Acid. Arab J. Nuc. Sci. Appl. 2013, 46, 1–16. [Google Scholar]
  14. Abd El-Mottaleb, M.; Cheira, M.F.; Gouda, G.A.H.; Ahmed, A.S.A. Leaching of Rare Earth Elements from Egyptian Western Desert Phosphate Rocks Using HCl. Chem. Adv. Mat. 2016, 1, 33–40. [Google Scholar]
  15. Amine, M.; Asafar, F.; Bilali, L.; Nadifiyine, M. Hydrochloric Acid Leaching Study of Rare Earth Elements from Moroccan Phosphate. J. Chem. 2019, 2019, 4675276. [Google Scholar] [CrossRef]
  16. Nie, D.; Xue, A.; Zhu, M.; Zhang, Y.; Cao, J. Separation and Recovery of Associated Rare Earths from the Zhijin Phosphorite Using Hydrochloric Acid. J. Rare Earths 2019, 37, 443–450. [Google Scholar] [CrossRef]
  17. Nayl, A.A.; Arafa, W.A.A.; Abd-Elhamid, A.I.; Elkhashab, R.A. Studying and Spectral Characterization for the Separation of Lanthanides from Phosphate Ore by Organic and Inorganic Acids. J. Mat. Res. Technol. 2020, 9, 10276–10290. [Google Scholar] [CrossRef]
  18. Palierne, L. Details a Number of New and Sustainable Processes That Make Use of Low-Grade Phosphate Rock. World Fertil. 2017, 2, 33–38. [Google Scholar]
  19. Takhim, M. Method for the Production of Phosphoric Acid and/or a Salt Thereof and Products Thus Obtained. U.S. Patent 2005/0238558 A1, 4 October 2005. [Google Scholar]
  20. Zafar, I.; Mahmood, T.; Amin, M. Effect of Hydrochloric Acid on Leaching Behavior of Calcareous Phosphorites. Iran. J. Chem. Chem. Eng.-Int. Engl. Ed. 2006, 25, 47–57. [Google Scholar]
  21. Kim, R.; Cho, H.; Han, K.N.; Kim, K.; Mun, M. Optimization of Acid Leaching of Rare-Earth Elements from Mongolian Apatite-Based Ore. Minerals 2016, 6, 63. [Google Scholar] [CrossRef]
  22. Hughes, J.M. The Many Facets of Apatite. Am. Mineral. 1991, 76, 1165–1173. [Google Scholar] [CrossRef]
  23. Pereira, F.; Bilal, E.; Bilal, E. Phosphoric Acid Extraction and Rare Earth Recovery from Apatites of the Brazilian Phosphatic Ores. Rom. J. Min. Depos. 2012, 85, 49–52. [Google Scholar]
  24. Han, K.N. Characteristics of Precipitation of Rare Earth Elements with Various Precipitants. Minerals 2020, 10, 178. [Google Scholar] [CrossRef]
  25. Tõnsuaadu, K.; Hints, R.; Kuusik, R.; Kirsimäe, K. Eesti Fosforiidi Säästlik Väärindamine; Tallinn: Sihtasutus Eesti Teadusagentuur: Tartu, Estonia, 2020; 20p, Available online: https://fond.egt.ee/fond/egf/9405 (accessed on 15 January 2023).
  26. Constrained Optimization Program. Available online: https://www.wolframalpha.com (accessed on 20 November 2022).
  27. Tõnsuaadu, K.; Kallas, J.; Kuusik, R.; Hacialioglu-Erlenheim, G.; Trikkel, A. A New Perspective on Fluorapatite Dissolution in Hydrochloric Acid: Thermodynamic Calculations and Experimental Study. Inorganics 2021, 9, 65. [Google Scholar] [CrossRef]
  28. Markovic, M.; Takagi, S.; Chow, L.; Frukhtbeyn, S. Calcium Fluoride Precipitation and Deposition from 12 Mmol/L Fluoride Solutions with Different Calcium Addition Rates. J. Res. Natl. Inst. Stan. Technol. 2009, 114, 293–301. [Google Scholar] [CrossRef]
  29. Gautelier, M.; Oelkers, E.H.; Schott, J. An Experimental Study of Dolomite Dissolution Rates as a Function of PH from −0.5 to 5 and Temperature from 25 to 808 °C. Chem. Geol. 1999, 157, 13–26. [Google Scholar] [CrossRef]
  30. Crundwell, F.K. The Dissolution and Leaching of Minerals: Mechanisms, Myths and Misunderstandings. Hydrometallurgy 2013, 139, 132–148. [Google Scholar] [CrossRef]
  31. Yang, L.; Feng, Y.; Wang, C.; Fang, D.; Yi, G.; Gao, Z.; Shao, P.; Liu, C.; Luo, X.; Luo, S. Closed-loop regeneration of battery-grade FePO4 from lithium extraction slag of spent Li-ion batteries via phosphoric acid mixture selective leaching. Chem. Eng. J. 2022, 431, 133232. [Google Scholar] [CrossRef]
Figure 1. pH value depending on HCl dosage and concentration in the reaction with Toolse 2 sample: ○ before reaction; • after reaction.
Minerals 13 00578 g001
Figure 2. Dissolution of phosphorus (a) and fluorine (b) depending on HCl dosage where T1—Toolse 1, T2—Toolse 2, and Y—Ülgase.
Minerals 13 00578 g002
Figure 3. Dissolution of Mg depending on HCl dosage where T1—Toolse 1, T2—Toolse 2.
Minerals 13 00578 g003
Figure 4. Dissolution of Fe depending on HCl dosage (a) and on P content in the solution at different acid concentrations (b) where T1—Toolse 1, T2—Toolse 2, and Y- Ülgase with the numbers indicating acid molarity.
Minerals 13 00578 g004
Figure 5. Dissolution of REEs depending on HCl dosage (a) and P content in the solution at different HCl concentrations (b) where T1—Toolse 1, T2—Toolse 2, and Y—Ülgase with the numbers indicating acid molarity.
Minerals 13 00578 g005
Figure 6. Comparison of the experimental (*) and calculated values of y = ΔH+/ΔP for Toolse 1 sample according to model 5.
Minerals 13 00578 g006
Figure 7. Comparison of the experimental (*) and calculated values of y = ΔH+/ΔP for Ülgase sample by model 2.
Minerals 13 00578 g007
Figure 8. Comparison of the experimental (*) and calculated values of y = ΔH+/ΔP for Toolse 2 sample according to model 5.
Minerals 13 00578 g008
Figure 9. 3D plots of P dissolution depending on HCl concentration and sample mass per 1 L: (a) Toolse 1, (b) Ülgase and (c) Toolse 2.
Minerals 13 00578 g009aMinerals 13 00578 g009b
Table 1. Chemical and mineralogical composition of Estonian PR samples.
Chemical Composition (%)ÜlgaseToolse 1Toolse 2
P2O518.810.915.5
CaO27.314.523.6
F1.61.01.5
Fe2O31.21.11.5
MgO0.20.31.3
CO21.71.84.1
Total REEs (ppm)982658756
REEs/P2O5526048
Minerals (%)
Apatite50.42537.0
Quartz46.17355.7
Pyrite0.40.61.6
Orthoclase0.3-0.1
Gypsum2.8--
Dolomite-1.55.6
Table 2. Fractional composition of Estonian PR samples (as received), %.
Fraction Size (µm)ÜlgaseToolse 1Toolse 2
+2000049
−2000 + 100002.13
−1000 + 630326.66
−630 + 4001716.311
−400 + 2002353.632
−200 + 1002511.918
−100 + 712.72.410
−7113.111
Table 3. Experiments plan.
Test nr.HCl Conc. (x1)Sample Amount (x2)HCl Dosage (x1/x2)Mixing Rate (x3)
Toolse 1ÜlgaseToolse 2Toolse 1ÜlgaseToolse 2Toolse 1
Mkg·L−1Mol HCl·kg−1rpm
10.50.0900.0400.0425.4612.2512.30550
20.50.1500.0500.0563.279.809.25550
30.50.1500.0680.0703.277.627.38650
40.50.2500.100 1.964.90 450
50.50.248 1.96 350
610.1940.0720.0805.2114.0312.26550
710.1940.1020.1065.219.909.27650
810.1940.1340.1345.217.547.33450
61.50.1500.1040.1209.5314.4212.37550
71.50.2500.1520.1605.729.879.28550
81.50.250 5.72 650
91.50.2800.2000.2005.117.507.42650
Table 4. The comparison of regression models in the case of the Toolse 1 sample.
ModelElementPFFeREEsCaMg
1R0.9690.8660.9170.6810.9510.978
s4.792.181.440.2326.213.07
2R0.9850.8890.9170.6450.9670.985
s3.311.981.440.2455.142.56
3R0.9510.8390.9010.5320.9620.982
s5.22.071.370.2444.722.42
4R0.8970.8210.9180.6020.9220.974
s7.532.181.240.2256.82.89
5R0.990.8410.9190.7430.980.982
s2.52.21.320.1933.672.56
Table 5. The equations with the best squared correlation coefficient (R) and the root mean squared error (s) values for the dissolution of different elements of the studied samples and of ΔH+/ΔP.
Model nr. Toolse 1RsÜlgaseRsToolse 2Rs
5Py = −23.79 + 40.74(x1/x2) − 3.42(x1/x2)^20.992.5y = −22.12 + 18.899(x1/x2) − 0.72523(x1/x2)^20.905.2y = 31.27 + 12.00(x1/x2) − 0.54(x1/x2)^20.811.8
Cay = −12.61 + 33.37(x1/x2) − 2.38(x1/x2)^20.983.7y = −2.01 + 13.15(x1/x2) − 0.44(x1/x2)^20.953.1Not acceptable
Fey = 3.56 − 0.73(x1/x2) + 0.43(x1/x2)^20.921.3y = 29.02 + 1.23 × (x1/x2) + 0.13(x1/x2)^20.972.2Not acceptable
Mgy = 6.51 + 9.26(x1/x2) + 0.26(x1/x2)^20.982.6Mg was not detected y = 59.64 − 0.29(x1/x2) + 0.24(x1/x2)^20.952.5
ΔH+/ΔPy = −0.51 + 1.64(x1/x2) + 27.49(x2/x2)^20.960.4Not acceptable y = 2.25 + 0.03(x1/x2) + 0.018(x1/x2)^20.990.08
2REEsNot acceptable y = −55.23 − 76.53x1 + 175.38x2 + 16.15(x1/x2)0.8521y = −30.80 − 28.30x1 + 220.12x2 + 4.20(x1/x2)0.862.54
ΔH+/ΔPy = −7.34 − 7.11x1 + 56.54x2 + 2.05(x1/x2)0.721.1y = 3.02 + 0.51x1 − 0.32x2 + 0.14(x1/x2)0.860.3Not acceptable
CaNot acceptable Not acceptable y = 66.26 − 8.45x1 − 3.65x2 + 3.09(x1/x2)0.891.8
Table 6. Parameter limits used in the optimization calculations.
SampleToolse 1ÜlgaseToolse 2
x1HCl (M)0.5 < x < 1.5
x2sample mass (kg∙L−1)0.09 < x2< 0.2480.04 < x2 < 0.20.042 < x2 < 0.2
x1/x21.96 < x1/x2 < 9.534.90 < x1/x2 < 14.427.33 < x1/x2 < 12.37
Table 7. Calculated values of parameters for P solubility optimization.
Toolse 1ÜlgaseToolse 2
Max P dissolution (%) at:97.4810098.50
x1 (HCl, M)1.281.311.35
x2 (mass, kg∙L−1)0.210.100.12
Min P dissolution (%) at:42.9153.8990.67
x1 (HCl, M) 0.500.621.32
x2 (mass, kg∙L−1) 0.250.120.18
Disclaimer/Publisher’s Note: The statements, opinions and data contained in all publications are solely those of the individual author(s) and contributor(s) and not of MDPI and/or the editor(s). MDPI and/or the editor(s) disclaim responsibility for any injury to people or property resulting from any ideas, methods, instructions or products referred to in the content.

