Article

Reconstructing the Tectonic History of the Arabian–Nubian Shield in Sinai: Low-Temperature Thermochronology Implications on Wadi Agar Area

1
Geology Department, Faculty of Science, Port Said University, Port Said 42522, Egypt
2
Institute of Nature and Environmental Technology, Kanazawa University, Kanazawa 920-1192, Japan
3
Department of Geology & Geophysics, College of Science, King Saud University, P.O. Box 2455, Riyadh 11451, Saudi Arabia
4
Department of Earth Sciences, Kanazawa University, Kanazawa 920-1192, Japan
*
Author to whom correspondence should be addressed.
Minerals 2023, 13(4), 574; https://doi.org/10.3390/min13040574
Submission received: 3 March 2023 / Revised: 13 April 2023 / Accepted: 17 April 2023 / Published: 20 April 2023

Abstract

:
The Arabian–Nubian Shield envelops the entire regional tectonic history from its formation during the Ediacaran to the Red Sea/Gulf of Suez rifting in the Oligocene–Miocene. The occurrence and extent of the expected successive tectonic events on Sinai basement rocks remain uncertain. Integration of thermochronological techniques with time–temperature modelling has proven to be a powerful tool for thermal-tectonic history reconstruction. Therefore, we collected representative samples from the Arabian–Nubian Shield basement rocks of the Wadi Agar area at the eastern flank of the Suez rift. Zircon fission-track data show two cooling age possibilities of Ediacaran and Devonian ages. Meanwhile, apatite fission-track data represent three cooling age spans of Carboniferous, Triassic, and Cretaceous. The integration of these data with the modelled time–temperature histories reveals four different cooling events synchronous with the regional events; (1) the Neoproterozoic post-accretion erosional event that causes near-surface rock uplift, (2) the Devonian–Carboniferous Hercynian tectonic event which affected the region with rocks exhumation of ca. 4.2 ± 1.4 km, (3) the Triassic Gondwana breakup initiation, and (4) the Oligocene–Miocene Gulf of Suez rifting which caused flanks uplift in the studied region of ca. 1.2 ± 0.4 km. The Gulf of Suez is a passive rift with a dominant mechanical component that is divided into two differently exhumed northern and southern segments, where an additional far-field thermal overprint was restricted to the southern segment.

1. Introduction

The Arabian–Nubian Shield (ANS) that represents the basement rocks beneath northeastern Africa and Arabia was primarily developed by the accretion of micro-continents and island arcs in the Archean crust during the East African Orogeny (EAO; ca. 900–650 Ma) (e.g., [1]). The ANS is composed mainly of granitoids and lesser occurrences of metavolcanics and metasediments. It is exposed around the Red Sea/Gulf of Suez/Gulf of Aqaba rift system. Shortly after its development, the Egyptian portion of the ANS (Figure 1) was entirely eroded by the Cambrian to form a peneplain surface (e.g., [2]). Then, it was buried beneath a Lower Paleozoic sedimentary succession of ca. 2.5 km thickness [3]. During the Devonian–Carboniferous, the Hercynian tectonic event affected northern Egypt through uplifts and erosions [4]. Then, a period of tectonic stability and localized uplifts and unconformities was dominated until the Cretaceous [5,6], when the Gondwana started to break up, affecting the region with significant exhumations [7,8,9]. Finally, During the Oligocene–Miocene, the Red Sea/Gulf of Suez rift was developed to form grabens along their axis and elevated rift flanks [10,11]. The Suez rift flanks consist of the ANS basement rocks [12] that comprise the whole prolonged regional geological history (Figure 1). Many thermochronological studies have been conducted on the ANS [3,13,14,15,16,17,18,19,20,21], and few of them were applied to the Suez rift’s eastern flank [22,23,24]. This caused a shortage of detailed information on the ANS construction in the region; consequently, the following important questions remain unanswered: (1) What is the effect and extent of each of the successive regional tectonic events on the northern ANS in Sinai? (2) Why are the highly elevated flanks restricted farther to the south (Figure 1)? (3) Is there any role for a mantle plume in the rifting processes? Reconstructing the thermal-tectonic history of the ANS basement rocks in the Gulf of Suez’s eastern flank using an integration of different low-temperature thermochronology could answer these questions [17,23,25,26].
For this study, we collected 10 samples from the Wadi Agar area (Figure 2), which represents the ANS northern exposure in Sinai, and the low-elevated northeastern flank of the Gulf of Suez (Figure 1).

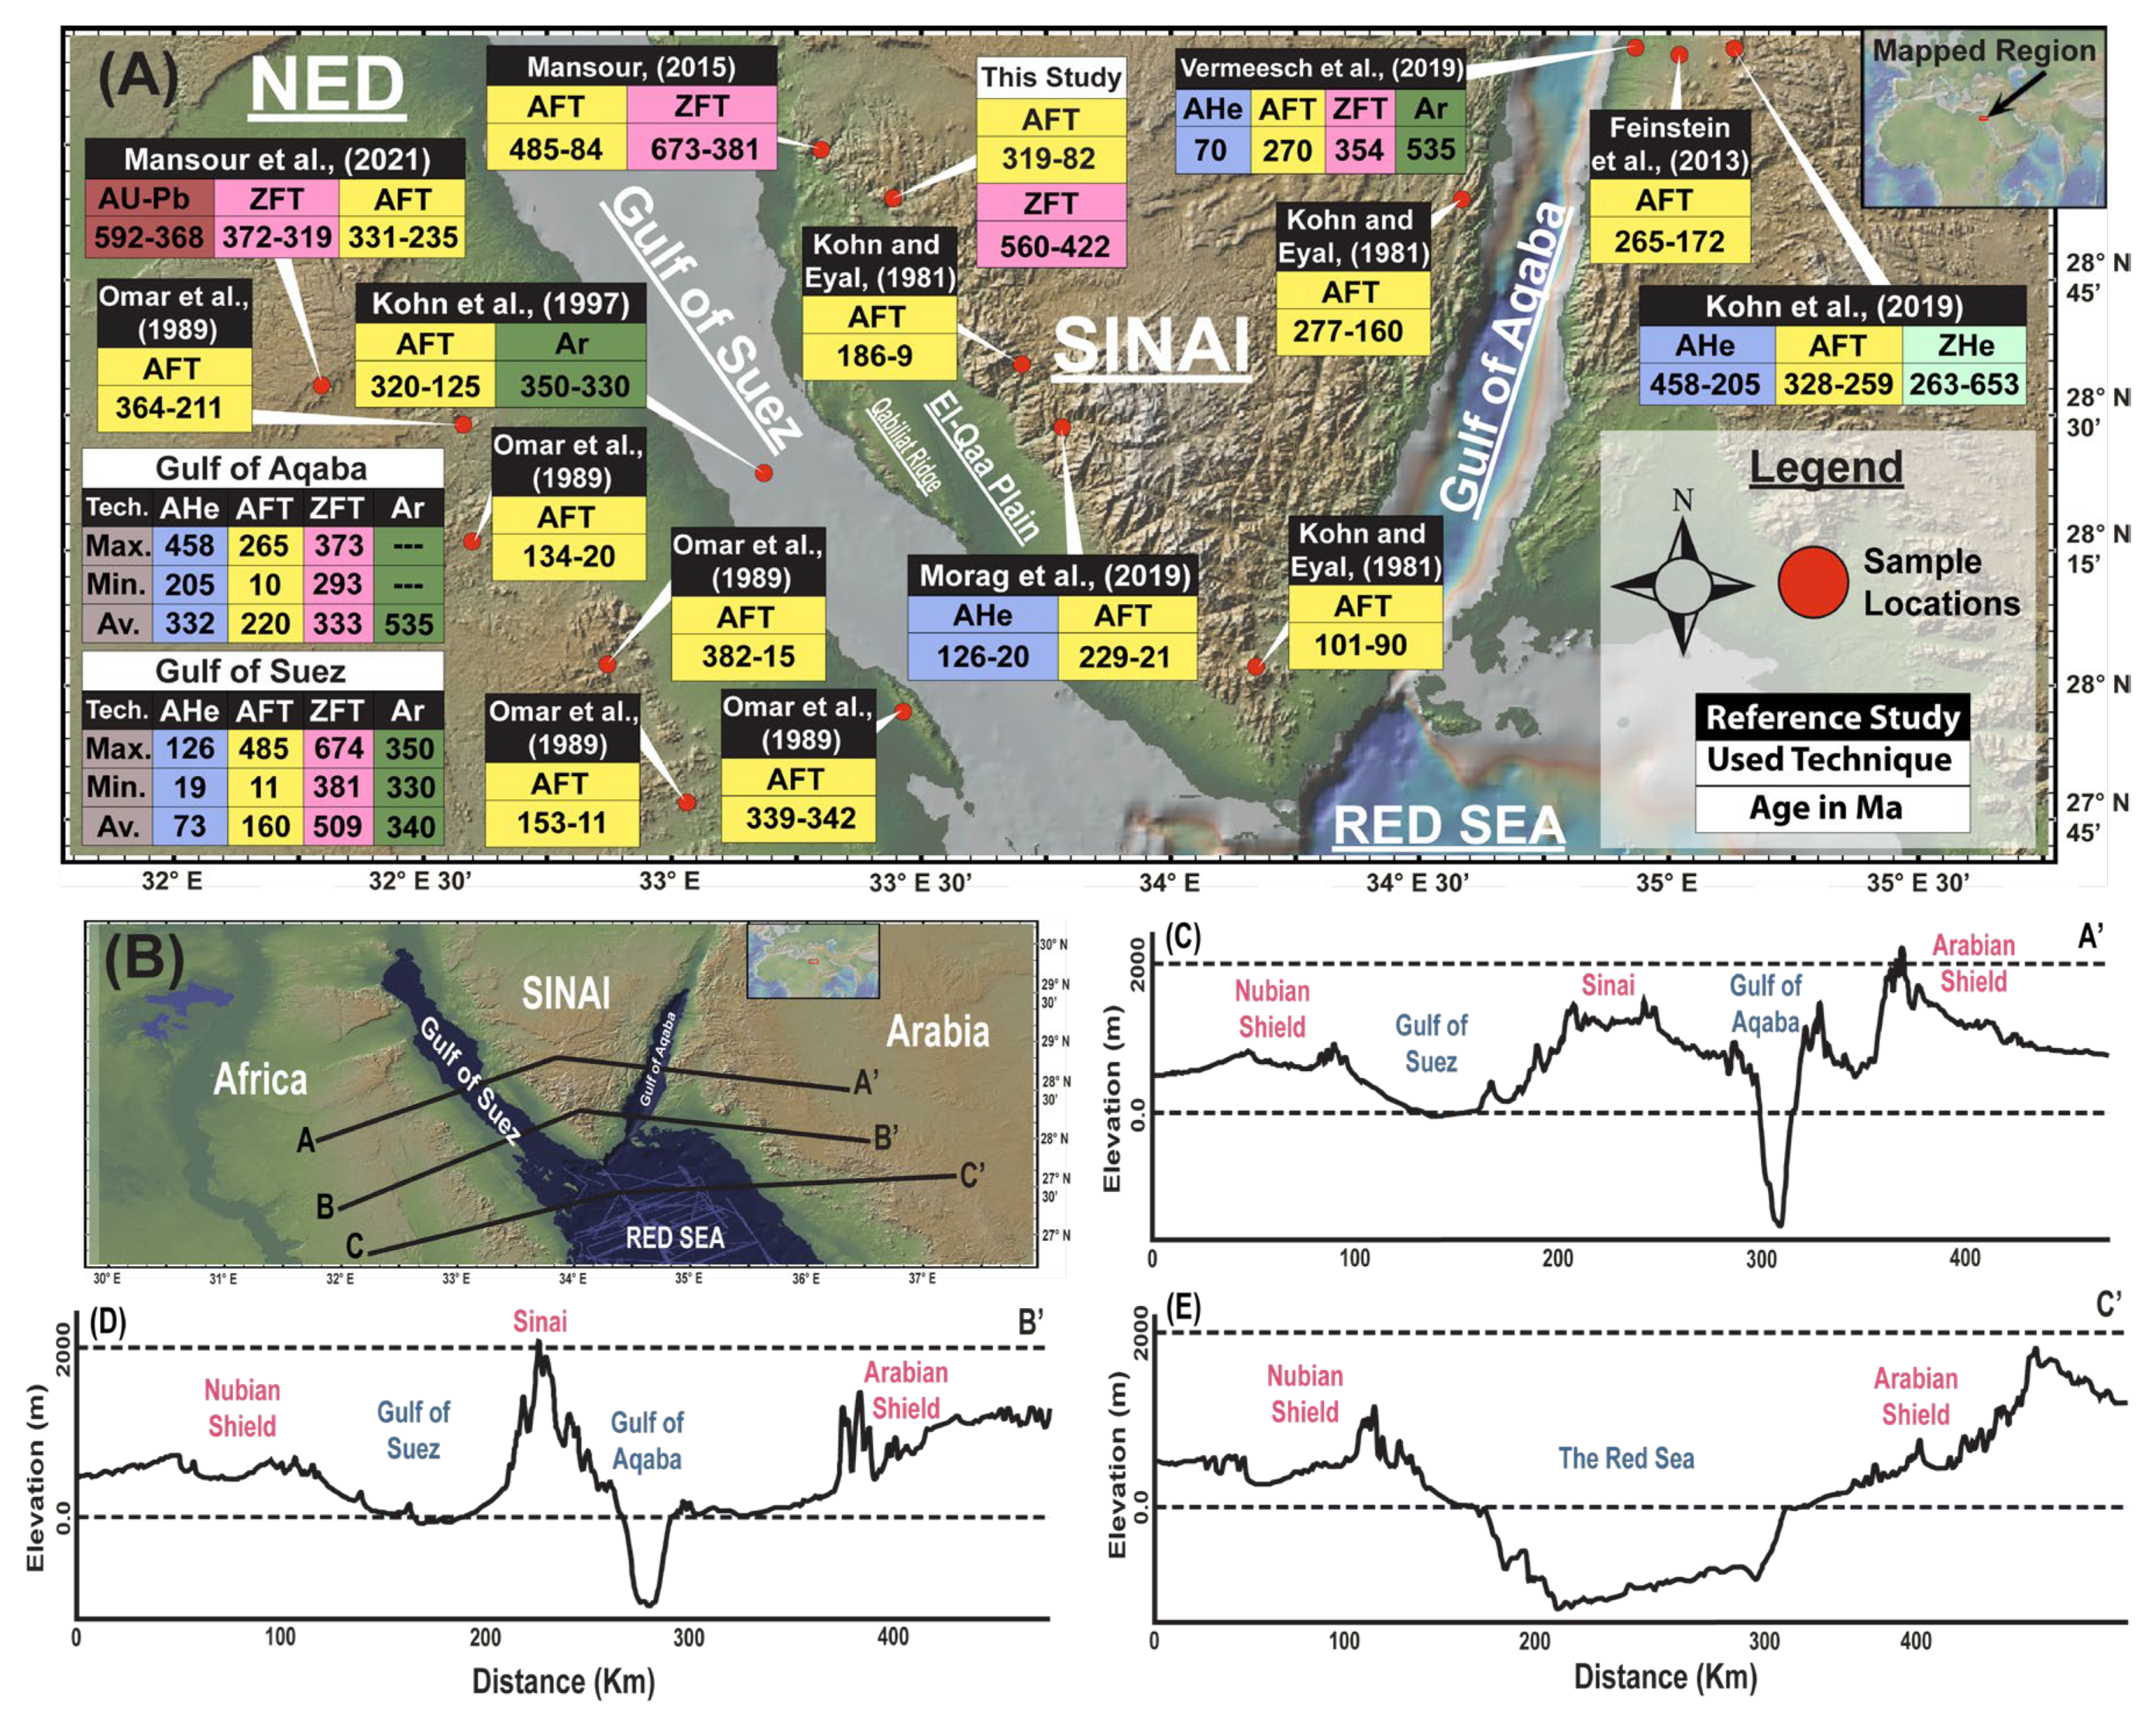
The Problem and Reported Thermochronological Data

There is debate about what tectonic events affected the ANS in Southern Sinai and to what extent. The additional debate concerning the Suez rift type is raised by the topographic growth variation between the Gulf of Suez rift flanks, and between rift flanks on the African and the Arabian plates (Figure 1B). One model suggests only the isostatic rebound effect following the early development of the rift axis [18,20]. A second model considers the presence of an additional thermal component based on an apparent southward increase in both heat flow and elevation [21,27]. A third model proposes a role of the so-called Cairo mini mantle plume [24,28], or the Arabian marginal plume [23]. Thermochronology techniques are effective tools to address this issue as they introduce cooling ages which are sensitive to temperature changes, that may or may not accompany any of the aforementioned models. Therefore, thermochronology techniques are the best methods to be used to solve this conflict.
Previous thermochronological studies on the northern ANS represent an extended cooling history characterized by non-uniform uplift between fault-bound blocks [6,15,19,20,22,23,27]. Flanks of the Suez rift yielded AFT ages between 485 ± 18 Ma and 11 ± 2 Ma [12,15,17,20,22,24], ZFT ages between 674 ± 77 Ma and 381 ± 26 Ma [23], and AHe ages between 126 ± 4 Ma and 19 ± 1 Ma [24]. Flanks of the Aqaba rift reveal AFT ages ranging from 265 ± 13 Ma to 10 ± 0.3 Ma [14,22]. In the Eilat area, 40Ar/39Ar ages group around 535 Ma [6], ZFT ages range from 373 ± 26 Ma to 293 ± 21 Ma [3,6], and AHe ages between 458 Ma and 205 Ma [29]. From detrital rocks, AFT ages range from 328 ± 36 Ma to 259 ± 17 Ma, and AHe ages from 207 Ma to 11 Ma [3,6]. The northern Red Sea western flank reveals that sphene FT ages range from 410 to 339 Ma [13], ZFT ages from 366 to 315 Ma [13], and AFT ages from 191 ± 7 Ma to 29 ± 2 Ma [19]. Noticeably, these cooling ages range over a wide time span; the majority of them predate the rifting process. This would raise questions about the nature of rock exhumation as a response to the different tectonic events and the cause behind the limited rock uplift that accompanied the Oligocene–Miocene rifting event.

2. Geologic Setting and Regional Tectonics

The ANS formed through multi-stage orogeny development by accretion of island arcs, continental fragments, and oceanic plateaus in Archean nuclei between ca. 900 Ma and 650 Ma [1,12,30]. The basement rocks in the southern Sinai Peninsula exposed over ca. 14,000 km2 in area represent a small portion of the ANS composed mainly of granites along with lesser outcrops of metamorphic and volcanic lithologies. The Sinai Peninsula itself is squeezed between the African, Eurasian, and Arabian plates in a tectonically active region; hence, these plates’ intra-activities are expected to be recorded in the Neoproterozoic basement of Sinai. The rifting between Africa and Arabia is the most recent tectonic event, initiated in the eastern proto-Gulf of Aden by ca. 34 Ma. This rifting marked the Red Sea initiation [18] within the tectonic framework of the Afar triple-junction [31,32,33,34] and the slab-pull of the Bitlis–Zagros convergence zone in modern Anatolia [35].

2.1. The Basement Rocks

The basement rocks of Sinai are composed mainly of the following: (1) Island arc metamorphic rocks, representing the earliest stage of the EAO that extended from ca. 820 to 750 Ma [12,36]. This phase of metamorphism is generally confined to the lower greenschist facies [37]. (2) Syn-orogenic suite, representing a compressional regime that dominated between ca. 750 and 610 Ma [12,38]. (3) Post-orogenic younger suites and dyke swarms, characterizing the EAO extensional collapse stage that developed with the final orogenic phase between ca. 610 Ma and 550 Ma [12,17,38,39,40].

2.2. Tectonic History

The basement complex of the ANS was entirely eroded through the post-accretion erosional event (PAEE) by the Cambrian, as indicated by the Lower Cambrian fossils dated in fluvial to near-shore marine sediments [41]. This sedimentation regime developed ca. 2.5 km of Lower Paleozoic succession (Figure 3) until the Devonian–Carboniferous, when Gondwana and Laurasia collided to develop the Hercynian (Variscan) tectonic event [4]. This collision resulted in the reversal of tectonic activity to a southward vergence, substantial uplift, and erosion of the Lower Paleozoic succession in Sinai by the Late Carboniferous [13,23,42,43,44]. Meanwhile, the whole Lower-Paleozoic sequence (ca. 2.5 km thickness) is preserved in northern Saudi Arabia and southern Jordan [3]. During the Jurassic–Cretaceous Gondwana started to break up, causing restoration of the northward tectonic vergence, sinistral shearing, local volcanism, normal NW-SE and N-S trending faults, and the Syrian Arc domal system in the Egyptian ANS [7,8,9,45,46,47]. Finally, the Red Sea/Gulf of Suez rift system developed during the Oligocene–Miocene causing rift flanks uplift, erosion, the production of limited basaltic dykes, and the development of normal faults [10,11].
This rifting process was developed as a response to the Afar superplume [48]. Meanwhile, the major extension phase in the Red Sea/Gulf of Suez axis was activated during the Oligocene–Miocene [18,20]. A second major flank uplift (ca. 15 Ma) was reported in the central Arabia Red Sea flank [49].
Structurally, the studied area is dominated by three sets of faults (Figure 2): (1) the NNW-NW trending faults with (the Oligocene–Miocene) Suez rift age, (2) the NE trending faults with pre-rift age, and (3) the ENE trending faults, which might have a Precambrian age [44].
Figure 3. General lithostratigraphy of the Gulf of Suez region (modified after [50,51]).
Minerals 13 00574 g003

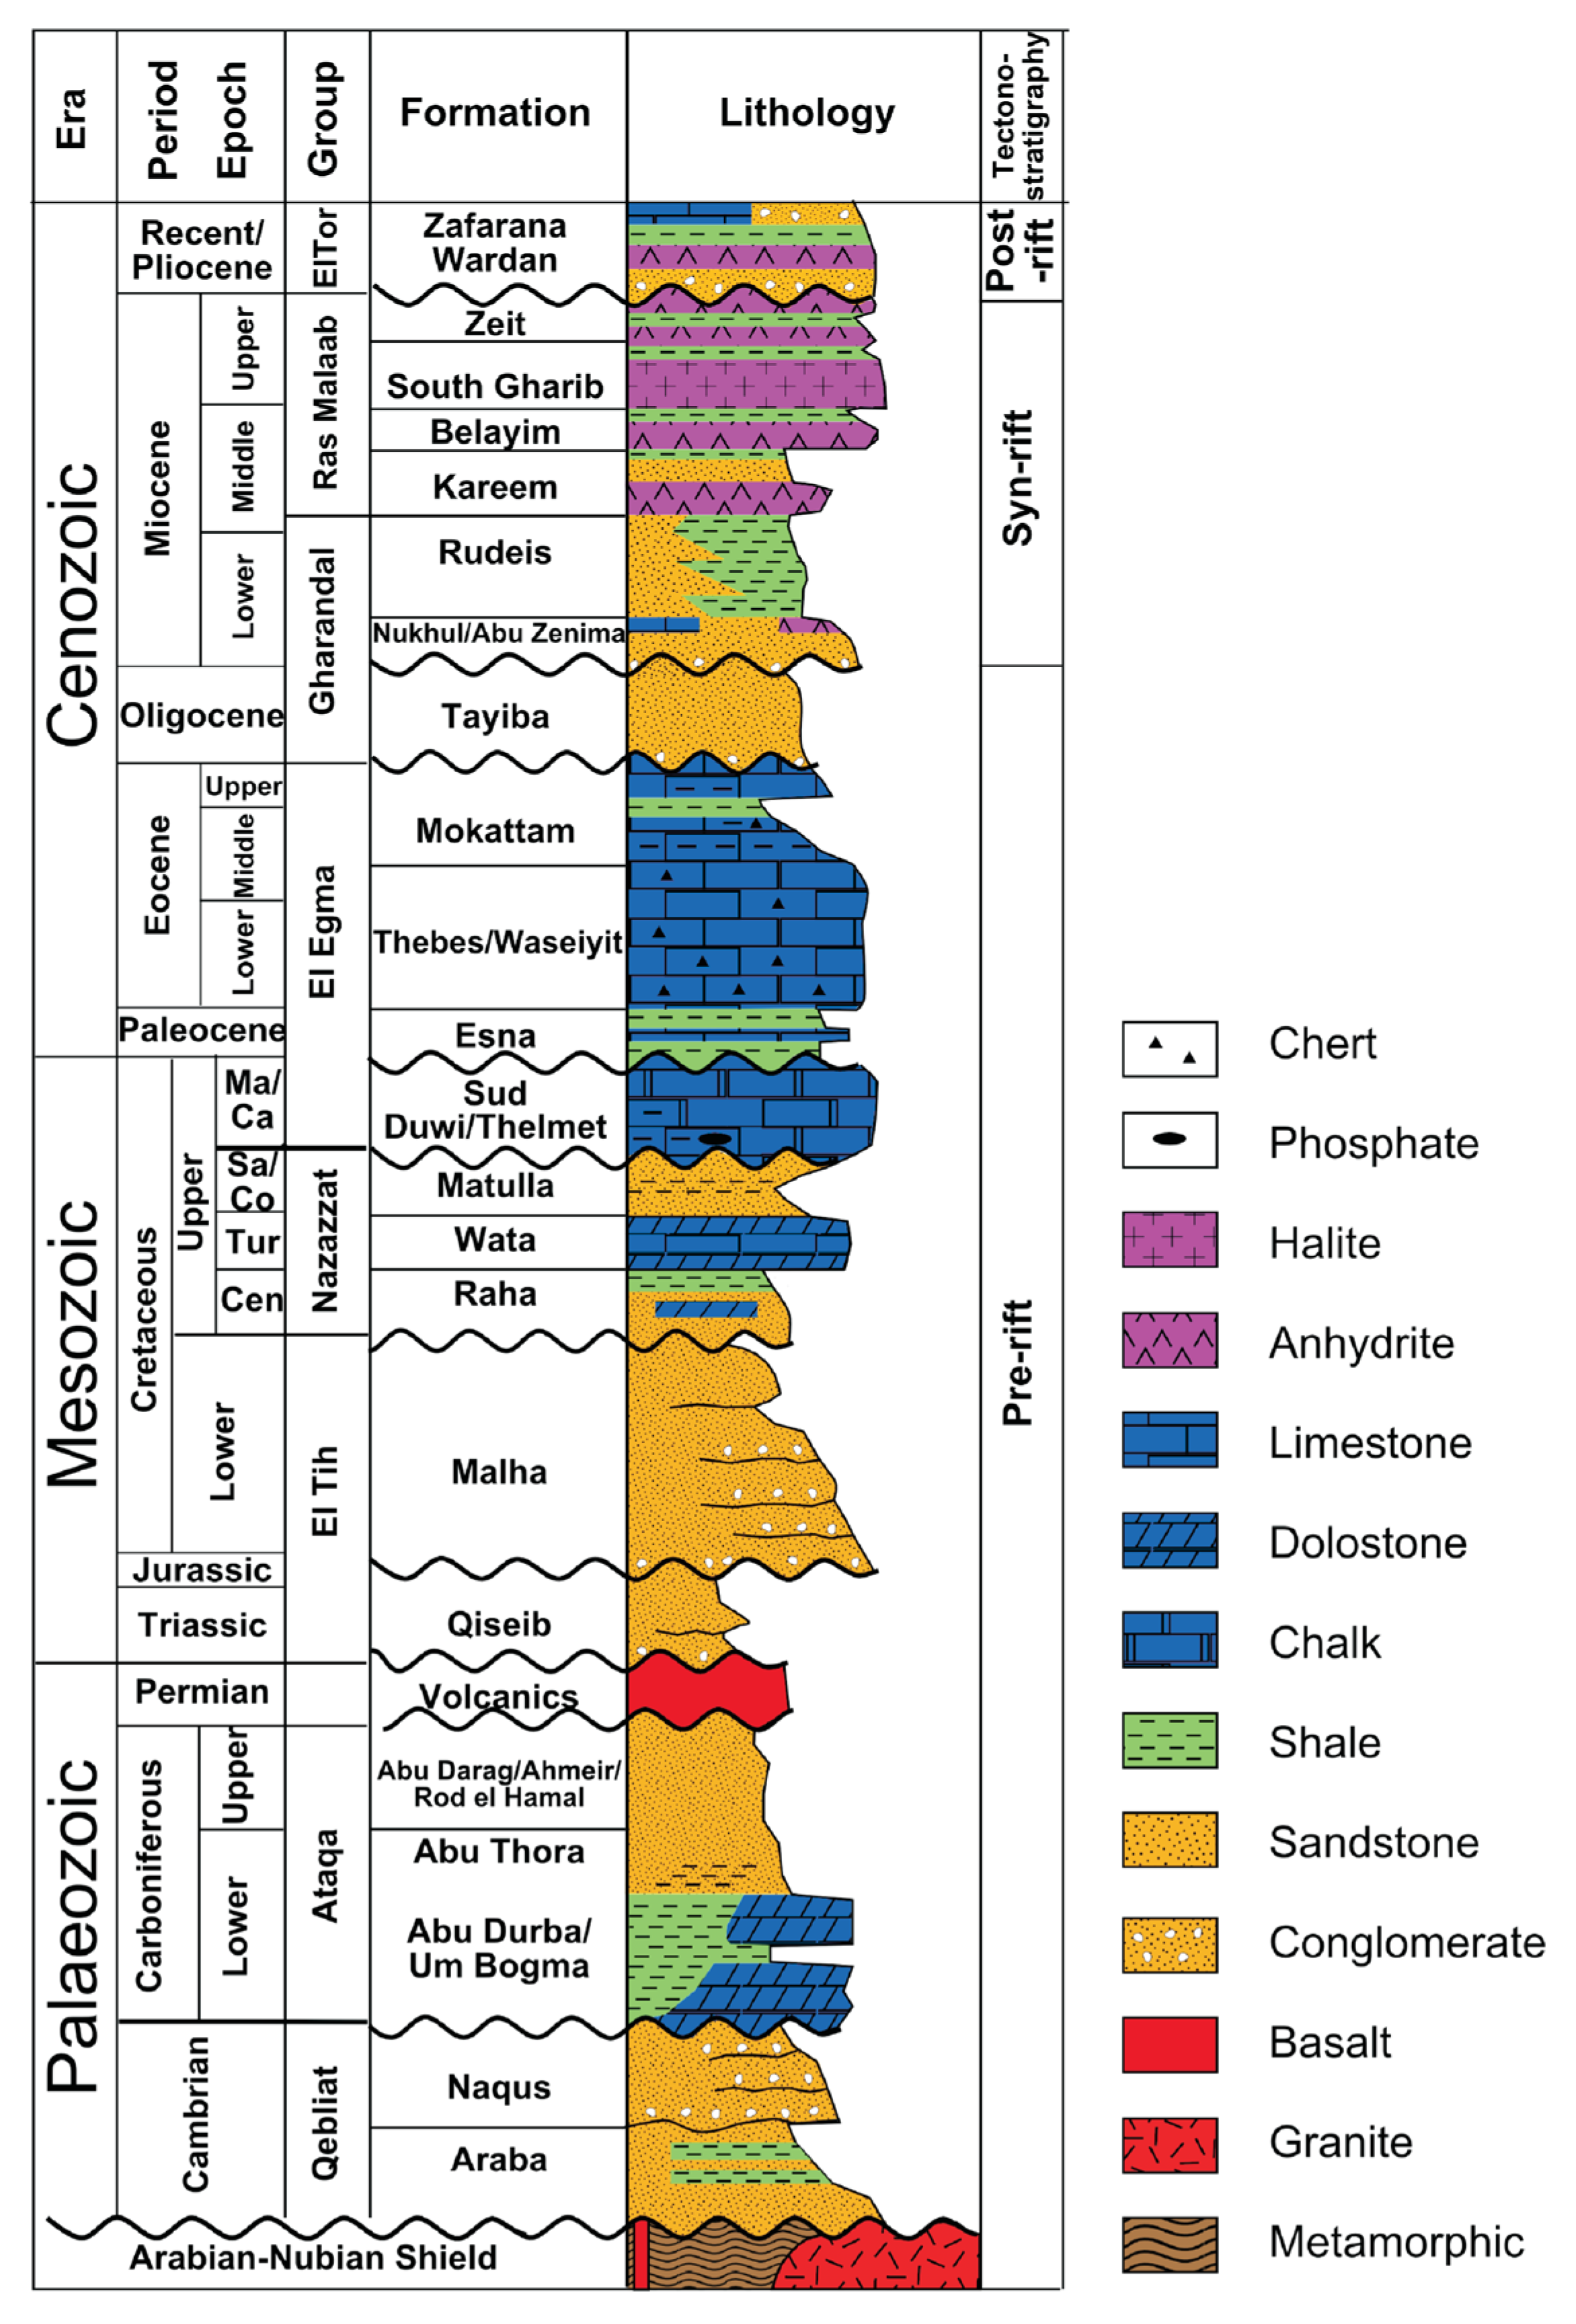
2.3. Sedimentation Cover

The lithostratigraphic succession of the Gulf of Suez vicinity documents the major changes in the depositional environments and the uplifting events through frequent unconformities (Figure 3). Further details of the sedimentary sequence and the depositional environments and relations are described in the Supplementary File Section Text S2.

3. Materials and Methods

Fission-track (FT) thermochronology is based on the accumulation and retention of radiation damage in the crystal lattice. The heavy fragments of spontaneous 238U fission produce chemically etchable latent tracks [52]. These fission tracks are annealed at specific temperatures that differ from mineral to mineral [53,54]. This thermal sensitivity can be modelled to reconstruct the time–temperature (t-T) history of the upper crust.
For this study, 10 samples were collected from the Wadi Agar area at the eastern flank of the Suez rift (Figure 2). Samples were collected from the Neoproterozoic basement rock units avoiding any thermal overprinting by any possible Phanerozoic magmatic intrusions. From these 10 samples, 7 yielded enough zircons and/or apatites for FT analyses (Figure 2). Apatite and zircon grains were separated from the collected samples using conventional techniques as described by Donelick et al. [55]. The etching conditions were chosen for compatibility with the inverse modelling software [56]. Zircon (ZFT) and apatite fission-track (AFT) analyses were performed at the Kanazawa University thermochronology lab, where the Laser Ablation Inductively Coupled Plasma Mass Spectrometry (LA-ICP-MS) technique was used for direct measurement of the U concentrations [57]. Ages and error ranges are calculated using IsoplotR [58]. The thermal history was modelled using the well-established computer code HeFTy v1.8.3 [56].
The partial annealing zone (PAZ) of ZFT ranges between ca. 330–190 °C/10 Ma based on the metamictization degree [59,60]. Consequently, for an average degree of metamictization, a closure temperature of ca. 240 °C/10 Ma is considered [54,61]. Meanwhile, the PAZ in apatites is controlled by the crystallographic orientation of tracks, where tracks parallel to the c-axis anneal slower [55,62,63]. The chemical composition of each apatite grain may have additional effect. The PAZ for the dominant fluorapatite is typically in the range of ca. 110–60 °C/10 Ma [53], with a general closure temperature of ca. 110 °C for a 1 °C/Ma cooling rate and ca. 10 Ma holding time [64,65].
Further details of the analytical methods and conditions are described in the Supplementary File Section Text S3.

4. Results

From the 10 collected samples, 3 yielded reliable zircons for ZFT dating (Table 1), and 5 yielded suitable apatites for AFT dating (Table 2). Out of the five AFT-dated samples, three samples yielded a sufficient number of horizontal confined tracks (HCTLs) for t-T modelling. All ZFT and AFT data are presented in Table 1 and Table 2 according to Hurford’s [66] recommendations.

4.1. Zircon Fission-Track Data

All the treated samples pass the Chi-square (χ2) statistical test for age homogeneity (Table 1). Uranium concentrations vary between ca. 403 and 208 μg/g (Table 1). There is no relationship between ZFT age and uranium concentration (Figure S1). The yielded ZFT weighted mean ages and standard errors range between 560 ± 17 Ma and 421 ± 13 Ma (Figure 2), which can be separated into two ZFT age spans. The first group comprises samples SA-13 and SA-16 that are close to the sedimentary cover on the eastern border of the studied region (Figure 2), and comprises the older ZFT ages ranging from ca. 560 ± 17 Ma to ca. 556 ± 14 Ma (Table 1), indicating an average cooling within/through the ZFT PAZ (240–200 °C; [57] ca. 558 ± 16 Myrs ago. The second consists of samples SA-03 with a ZFT age of ca. 422 ± 13 Ma (Table 1).

4.2. Apatite Fission-Track Data

The dated AFT ages range between 319 ± 13 Ma and 82 ± 5 Ma. These ages are separated into two distinct spatial/temporal groups (Table 2). The older AFT age group consists of two land-ward samples with Carboniferous ages between 319 ± 13 Ma and 303 ± 10 Ma, suggesting an average cooling within/through the AFT PAZ (110–60 °C; [55,67] at ca. 311 ± 11 Ma. The younger AFT age group consists of two samples closer to the Suez Gulf. This group consists of two samples with Triassic ages of 229 ± 10 Ma and 227 ± 10 Ma (Figure 2). These ages indicate an average cooling within/through the AFT PAZ at ca. 228 ± 10 Ma (Figure 2; Table 2).
The c-axis-corrected HCTLs (Lc) range from 13.0 ± 0.6 µm to 11.4 ± 1.0 μm (Table 3). A total of 235 Dpars were measured yielding values between 1.5 ± 0.2 µm and 1.4 ± 0.2 μm. There is no systematic relationship between the Dpar values and apatite FT ages (Figure S2).

5. Discussion

Wadi Agar area responded to the Devonian–Carboniferous and the Cretaceous tectonic events by a non-uniform uplift between fault-bounded blocks. Unfortunately, the fault systems responsible for such differential responses are difficult to be assigned. Noticeably, sample SA-13 which did not respond to either the Devonian–Carboniferous or the Cretaceous tectonic events are collected from blocks that are bounded by NE-SW, and NW-SE faults. These different faults’ orientations might have prevented the tectonic uplift of localized blocks. However, further detailed research considering known differential movement may reveal the kinematic characters of these fault systems.

5.1. Zircon Fission-Track Thermochronometry

There is no evidence of multiple age populations as indicated by all samples passed the Chi-square (χ2) homogeneity test (Table 1). The lack of any discernible correlation between ZFT age and uranium concentration (Figure S1) indicates that the metamictization effect on ZFT ages is negligible (Table 1).
The Precambrian ZFT cooling ages (average ca. 558 ± 16 Ma; Table 1, Figure 2) are consistent with the early erosion of the ANS to near sea level before the Cambrian [41,68,69,70], which caused the fluvial to near-shore marine nature of the Qebliat Group sediments, unconformably overlying the ANS (Figure 3). This intense erosional event must have been accompanied by rock exhumation as an isostatic rebound. Moreover, such old ages were reported from other parts of the ANS [3,13,14,23,29]. The younger age sample SA-03 (422 ± 12 Ma; Figure 2) is concordant with previously reported ZFT and ZHe ages from other parts of the ANS [3,6,13,23]. Such ages were previously interpreted as a tectonically driven uplift during the Devonian–Carboniferous [3,6,13,23]. This exhumation is also consistent with the change in depositional environment from the marine Lower Carboniferous Um Bogma Formation to the erosional nonmarine Upper Carboniferous Abu Thora Formation (Figure 3).

5.2. Apatite Fission-Track Thermochronometry

All the AFT ages are substantially younger than their Precambrian host rocks formation ages, consistent with previously reported ages from Sinai and the NED [15,19,22,23,24]. These AFT ages range between ca. 319 ± 13 Ma and ca. 82 ± 5 Ma, and are differentiated into three geographically separated age groups, indicating a differential thermo-tectonic history (Figure 2). This spatial separation is consistent with the non-uniform uplift between fault-bound blocks that were previously reported in the ANS [6,15,19,20,22,23]. Furthermore, the AFT ages of the older age group samples (Carboniferous; SA-13, SA-16) are consistent with the stratigraphic sequence showing multiple unconformities between similarly aged formations (Figure 3). Additionally, a concurrent tectonically driven uplift during the Carboniferous was reported [3,6,13,23]. The second age group (Triassic; SA-03, SA-06) is concordant with the synchronous unconformities and the Permian basaltic flows that indicate a probable uplift and thermal event (Figure 3). In contrast, the younger AFT sample (Late Cretaceous; SA-01) represented by AFT age is concurrent with the depositional regime change from the marine Wata Formation to the nonmarine Matulla Formation (Figure 3), which recommends a synchronous rock uplift.
Our thermochronologic ages are slightly younger than the corresponding exhumation events that caused them, which indicates long residence within the upper part of the AFT PAZ (Figure 4). This is supported by being the youngest dated AFT cooling age during this study (ca. 82 ± 5 Ma), much older than the Oligocene–Miocene Gulf of Suez rifting, the last exhumation event, indicating that the rock did not experience any temperature higher than 110 °C since the Cretaceous. Additionally, this exhumation from AFT PAZ is confirmed by the t-T models and the track lengths distribution histograms as most c-axis-corrected HCTLs’ (Lc) distributions show positive skewness with a tail of longer tracks (Figure 4).

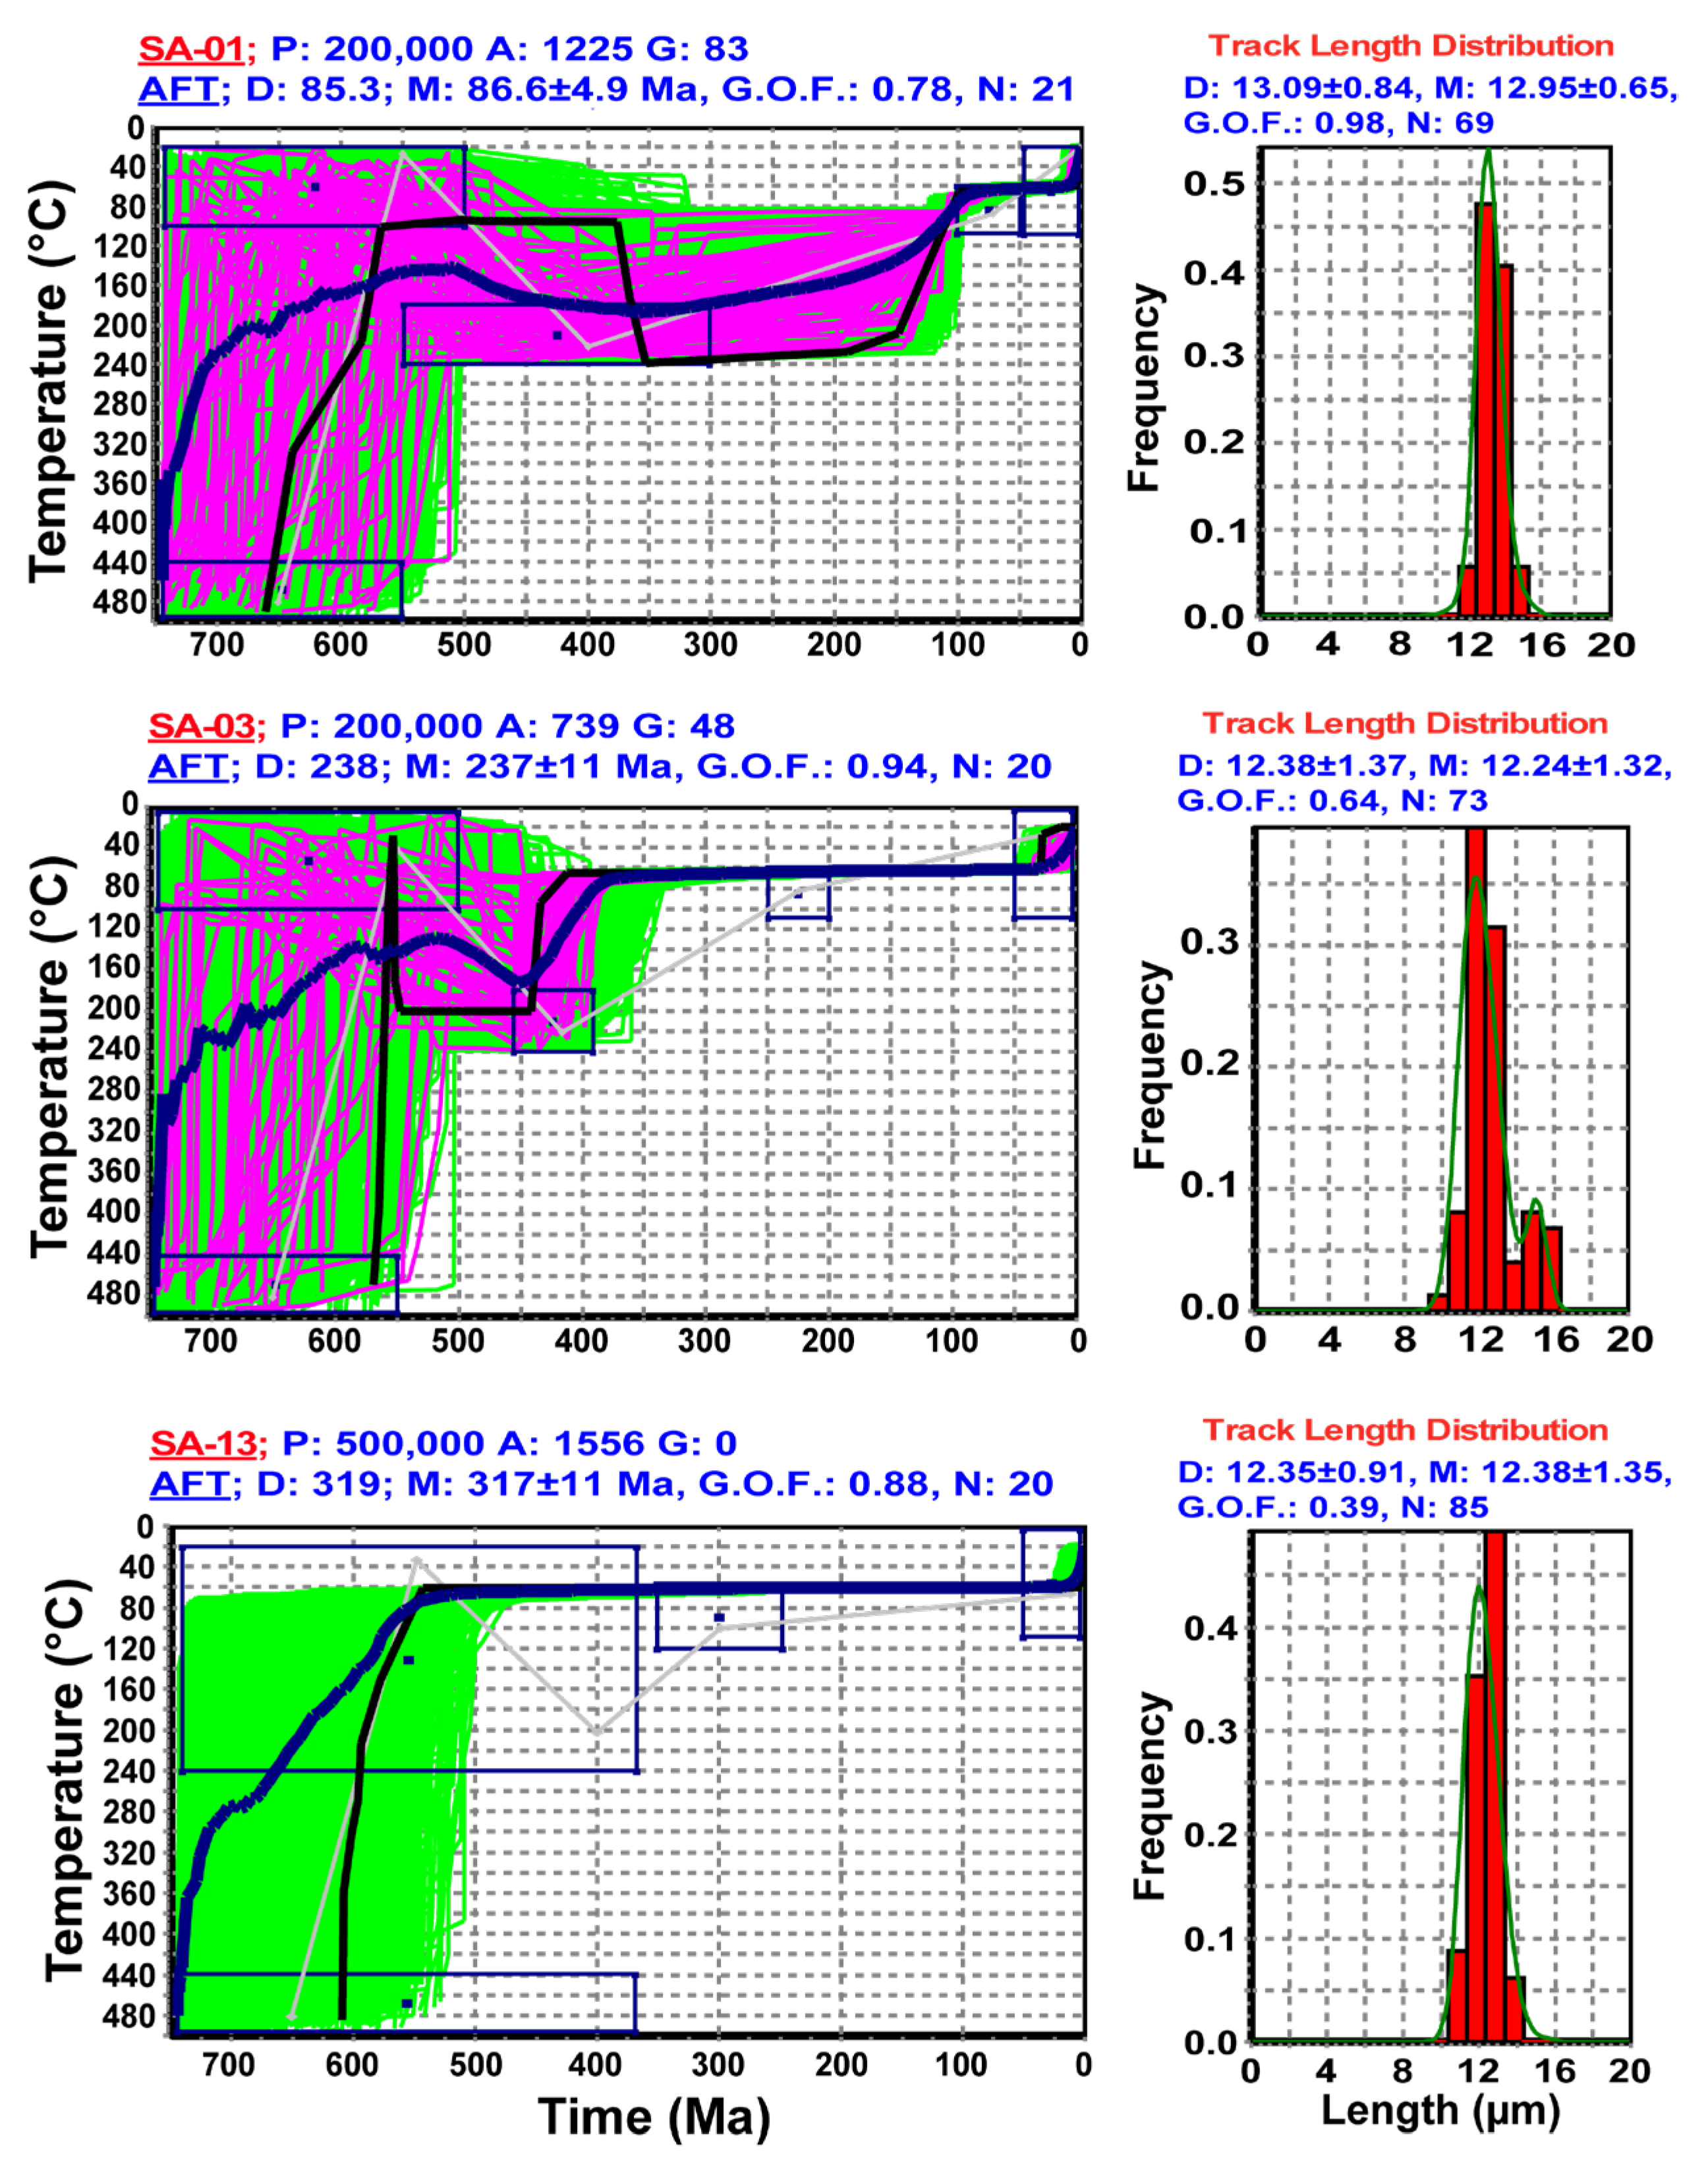
5.3. Thermal History Reconstruction

The time–temperature (t–T) history of the studied region was reconstructed using HeFTy v1.8.3 [56]. HeFTy requires user-defined t-T constraints to guide its Monte Carlo algorithm. During this study, these constraints were defined based on the obtained thermochronologic ages (ZFT and AFT) and the well-documented geological events: the post-accretion erosional event (PAEE), during which the entire ANS was eroded by the Cambrian, and the Oligocene–Miocene rifting of the Gulf of Suez (Figure 3). The width of these constraints was changed based on the age and degree of uncertainty of each event. The age-based constraints were drawn as the measured ages show, otherwise, it was drawn as a wide constraint to provide a high degree of freedom. Detailed information about the used constraints is provided in the Supplementary File (Table S1). The precision of the resulting t–T models strongly depends on the number of HCTLs. Therefore, during this study, the t–T modelling was performed on samples with sufficient HCTLs, and those with an insufficient number were not modelled (Table 3).
The t–T models categorize the cooling scenarios for the studied region into three different possibilities: (1) Sample SA-13 (Figure 4), which experienced the first rapid cooling event during the Neoproterozoic, then a period of slow reheating to stable temperature, which extended until the Late Oligocene when the sample was exhumed to its current elevation (Figure 4). (2) Sample SA-03 (Figure 4), which experienced the first rapid cooling event during the Neoproterozoic to exhume the sample closer to the surface. Then, the sample experienced a reheating event extended till the Devonian–Carboniferous, when a second rapid cooling event affected the sample uplifting it to the upper part of the AFT PAZ. Then, the sample experienced a period of thermal stability until the Oligocene–Miocene, when it was exhumed to its current elevation (Figure 4). (3) Sample SA-01 (Figure 4), which experienced the first rapid cooling event during the Neoproterozoic to exhume a sample closer to the surface. Then, the sample experienced a reheating event which might have extended until the Cretaceous, when a second rapid cooling event affected the sample during the Jurassic–Cretaceous, raising it to the AFT PAZ. Then, the sample experienced a relatively short period of thermal stability until the Oligocene–Miocene, when it was exhumed to its current elevation (Figure 4).
The possibility of having sample SA-13 to a similar t-T history to the other samples (SA-03 and SA-01) was tested and failed (Figure S3).
From all modelled samples, as from the AFT ages, there is no record of thermal anomaly accompanying the Gulf of Suez rifting on the t-T paths, instead, all rocks were uplifted from depths equivalent to ca. 60 °C temperatures (Figure 4).
The t-T modelling shows differential cooling events which can be interpreted as exhumation events when compared to our thermochronologic ages, the well-documented geological events, and the lithostratigraphic sequence. These exhumation events are the following: (1) The Neoproterozoic–Cambrian cooling/exhumation event (Figure 4), which is emphasized by our ZFT ages, the well-documented PAEE, and the deposition of Cambrian fluvial to near-shore marine sediments. (2) The Devonian–Carboniferous cooling/exhumation event (Figure 4) when rock uplifted in response to the Hercynian tectonic events which affected the study area causing the depositional regime to change from the Lower Carboniferous marine sediments of Um Bogma Formation to the Upper Carboniferous erosional sediments of Abu Thora Formation (Figure 3). This exhumation caused the removal of ca. 2.5 km succession of the Lower Paleozoic sediments [44]. (3) The Cretaceous cooling/exhumation event (Figure 4) when rock uplifted in response to the Gondwana breakup event which uplifted localities in northern Africa and the Gulf of Suez region, and caused multiple hiatus and dominance of conglomeratic sandstone erosional deposits through most of the Cretaceous (Figure 3). Synchronous major cooling events and strike-slip tectonically driven structures were previously reported [13,14]. This differential nature of uplift as a response to the aforementioned Hercynian and the Gondwana breakup events is consistent with the previous thermochronological findings which show tectonic movement along fault-bound blocks in the ANS [3,6,14,19,20,22,23]. These exhumations were probably controlled by faults activation through the corresponding stress field direction of each event. (4) The Oligocene–Miocene cooling/exhumation event (Figure 4) when rock exhumed in response to the Red Sea/Gulf of Suez rifting. Our t-T modelling (Figure 4) as well as un-reset AFT ages (Table 2) show that no thermal print accompanied the Gulf of Suez initiation and flanks exhumation from depths equivalent to ca. 60 °C (Figure 4). The possibility of higher thermal overprint was tested using wider AFT and Gulf of Suez constraints on the temperature axis, and we achieved similar results suggesting a temperature of ca. 60 °C to accompany the rifting event (Figure S4).

5.4. Cooling, and Rocks Exhumation

The cooling events measured by thermochronologic data cannot be countered for exhumation events; however, coupling them with the regional geological history and sedimentological record could. The rock uplift accompanying each of these tectonic events could be inferred based on cooling ages and the corresponding PAZ of each thermochronometer. Here, a range of geothermal gradient possibilities (between 25 °C/km; the current, and 50 °C/km; expected in active tectonics) were used due to a lack of precise paleo-geothermal gradient data. Afterwards, the calculated data were compared to the sedimentologic succession and correlated to the synchronous regional tectonic events. Integration of these data provided supporting evidence for being our measured cooling events expressions for major exhumation events: (1) The PAEE event removed the ANS high topography and transformed it into a peneplain surface [2], causing the currently exposed rocks to exhume by an isostatic rebound from the emplacement depths to the surface or close to it. (2) The Hercynian tectonic event affected parts of the Egyptian ANS by uplifts, and caused erosion of ca. 2.5 km of the Lower Paleozoic sediments [4]. This event caused rock exhumation in the studied region from temperatures of the ZFT PAZ (240–200 °C) to ca. 60 °C, which is equivalent to ca. 4.2 ± 1.4 km of rock uplift. (3) The Gondwana breakup event caused the Africa–Eurasia convergence. This event resulted in a reported total uplift of ca. 2.4 km, domal uplifts of ca. 0.9 km in northern Sinai (Gabals Maghara, Yelleg, and Halal), and the additional removal of ca. 1.5 km of the Cretaceous sedimentary succession [70] in the studied region. There are indicators of a localized effect of this event on the area of study represented by the younger AFT age sample (Table 2), and its t-T modelling (Figure 4), where its effect is integrated with the Devonian–Carboniferous event to exhume the region from the ZFT PAZ (240–200 °C) to ca. 60 °C. (4) The Gulf of Suez rifting caused rift flanks uplift of more than 2.4 km at Wadi Miar, south of the area of study [24]. In the current study area, the Suez rift caused rock exhumation from depths equivalent to ca. 60 °C, which is equal to 1.2 ± 0.4 km of rock uplift.

6. Geological History Implications

The ZFT data are separated into two age groups of Ediacaran ages of ca. 558 ± 16 Ma and the Silurian ages of ca. 422 ± 13 Ma, indicating rapid exhumation shortly after emplacement to pass through the ZFT isotherm at these times. Meanwhile, the AFT ages are represented by three age spans of Carboniferous of 311 ± 12 Ma, Triassic of ca. 228 ± 10 Ma, and Cretaceous of ca. 82 ± 5 Ma. This cooling ages differential indicates different thermo-tectonic histories that are not related to lithology or formation ages but reflect differences in the exhumation (uplift–erosion) history.

6.1. Thermal-Tectonic History

The obtained thermochronologic ages and the t-T histories represent four cooling/exhumation events coinciding with four events: (1) The PAEE (Neoproterozoic–Cambrian) followed the EAO plutonism and continental thickening during the Neoproterozoic and affected the whole region with weathering and erosion, and a consequent rock uplift by isostatic rebound causing the studied samples to exhume to near the surface. Afterwards, the region was buried beneath Lower Paleozoic sediments, where thickness reached ca. 2.5 km. (2) The Hercynian tectonic event (Devonian–Carboniferous) caused uplifts to cool the studied sample from the ZFT PAZ to ca. 60 °C, which is equivalent to ca. 4.2 ± 1.4 km. This event caused the removal of the whole Lower Paleozoic succession and parts from the underlying basements. (3) The Gondwana breakup event (Cretaceous), caused localized uplifts. (4) The Gulf of Suez rifting (Oligocene–Miocene), which caused cooling and rock exhumation from depths equivalent to ca. 60 °C to the surface, which is equal to 1.2 ± 0.4 km of rock uplift.

6.2. The Gulf of Suez Rift

All the treated samples have AFT cooling ages that predate the Suez rifting; the HCTLs distributions indicate exhumation from the AFT PAZ. The t–T modelling suggests exhumation from depths equivalent to ca. 60 °C during the rift development (Figure 4), which is equivalent to ca. 1.2 ± 0.4 km of rock uplift. This information documents the absence of any additional thermal overprint on the northern Suez rift’s eastern flank. Meanwhile, reported thermochronological studies of the southern the area of study (Figure 1) reported AFT and AHe ages with the Gulf of Suez rifting event, and greater accompanying rock uplift of more than 2.4 km [22,24]. This may recommend a differential rift segmentation into the northern and southern areas. Consequently, the Gulf of Suez can be divided into northern and southern segments, where the southern segment is marked by increasing flanks tectonic uplift, rift axis extension, heat flow, and younger cooling ages, while the northern segment is marked by a decrease in flanks tectonic uplift, rift axis extension, heat flow, and older cooling ages (Figure 1). Additionally, the whole rift is characterized by the absence of any considerable volcanism. Consequently, the Suez rift is a passive mechanical rift type where the southern segment was probably influenced by a far-field thermal overprint.

7. Conclusions

The Wadi Agar area was constructed as part of the ANS during the EAO. Before the Cambrian, the ANS was eroded and, as a response, a huge exhumation occurred to bring rock to near the surface. Afterwards, the Lower Paleozoic sediments were deposited (ca. 2.5 km) and buried the whole region. Then, the Hercynian tectonic event (Devonian–Carboniferous) caused a rock uplift of ca. 4.2 ± 1.4 km. During the Cretaceous, the Gondwana breakup might have affected the region through localized uplifts. During the Oligocene–Miocene, the Gulf of Suez affected the whole region by ca. 1.2 ± 0.4 km of rift flanks uplift. Finally, these flanks were non-tectonically eroded to their current elevations.
The Gulf of Suez is a passive rift with a dominant mechanical component that is divided into two segments; the southern is characterized by an additional far-field thermal print causing younger cooling ages, elevated rift flanks, and an increase in heat flow. The northern segment was isolated structurally as indicated by its older cooling ages, low rift flanks, and decrease in heat flow.

Supplementary Materials

The following supporting information can be downloaded at: https://www.mdpi.com/article/10.3390/min13040574/s1. Datasets for this research are included in this paper and in the accompanying Supporting Information, which includes a detailed discussion about the sedimentological succession and the used methods. Furthermore, ZFT age versus uranium concentration and Dpar-AFT age plots as well as a table for the time–temperature modelling used constraints are provided. Figure S1: A plot of ZFT age versus uranium concentration does not show any systematic trend, thus ruling out a major effect of Metamictization on the ZFT data; Figure S2: Dpar-AFT age plot. AFT ages show no significant change with a change in Dpar values indicating the absence of apatites chemistry differentiation on the corresponding AFT ages; Figure S3: Thermal history modeling was obtained using HeFTy [56]. This figure show sample SA-13 which belongs to the older ZFT age group, when tested with the same constraints (as shown here) as other samples, it shows no possible t-T scenarios even after 200 thousand iterations; Figure S4: Thermal history modeling was obtained using HeFTy [56]. This figure shows our examination of the possibility of having higher temperatures during the AFT constraint as the provided t-T paths were restricted to their top part at ca. 60 °C; Table S1: The specifications of the time-temperature modeling used constraints; Table S2. Operating conditions for the LA-ICP-MS.

Author Contributions

Conceptualization, S.M. and N.H.; methodology, S.M. and N.H.; validation, S.M. and N.H.; formal analysis, A.T. and S.M.; investigation, S.M. and N.H.; resources, K.A. and M.S.F.; data curation, S.M.; writing—original draft preparation, S.M.; writing—review and editing, N.H., K.A. and M.S.F.; visualization, S.M.; supervision, N.H.; project administration, K.A. and M.S.F.; funding acquisition, K.A. and M.S.F. All authors have read and agreed to the published version of the manuscript.

Funding

This research was funded by Researchers Supporting Project number (RSP2023R351), King Saud University, Riyadh, Saudi Arabia.

Data Availability Statement

All datasets are available at the Mendeley Data repository at: Mansour, Sherif (2023), “W. Agar_Sinai”, Mendeley Data, V1, doi: 10.17632/txd9vw7vvz.1.

Acknowledgments

We acknowledge the financial support from Researchers Supporting Project number (RSP2023R351), King Saud University, Riyadh, Saudi Arabia.

Conflicts of Interest

The authors declare no conflict of interest.

References

  1. Meert, J.G. A Synopsis of Events Related to the Assembly of Eastern Gondwana. Tectonophysics 2003, 362, 1–40. [Google Scholar] [CrossRef]
  2. Kolodner, K.; Avigad, D.; McWILLIAMS, M.; Wooden, J.L.; Weissbrod, T.; Feinstein, S. Provenance of North Gondwana Cambrian–Ordovician Sandstone: U–Pb SHRIMP Dating of Detrital Zircons from Israel and Jordan. Geol. Mag. 2006, 143, 367–391. [Google Scholar] [CrossRef]
  3. Kohn, B.P.; Eyal, M.; Feinstein, S. A Major Late Devonian-Early Carboniferous (Hercynian) Thermotectonic Event at the NW Margin of the Arabian-Nubian Shield: Evidence from Zircon Fission Track Dating. Tectonics 1992, 11, 1018–1027. [Google Scholar] [CrossRef]
  4. Stampfli, G.M.; von Raumer, J.F.; Borel, G.D. Paleozoic Evolution of Pre-Variscan Terranes: From Gondwana to the Variscan Collision. In Variscan-Appalachian Dynamics: The Building of the Late Paleozoic Basement; Geological Society of America: Boulder, CO, USA, 2002; ISBN 978-0-8137-2364-8. [Google Scholar]
  5. Alsharhan, A.S.; Nairn, A.E.M. Sedimentary Basins and Petroleum Geology of the Middle East; Elsevier: Amsterdam, The Netherlands, 1997; ISBN 978-0-444-82465-3. [Google Scholar]
  6. Vermeesch, P.; Avigad, D.; McWilliams, M.O. 500 my. of Thermal History Elucidated by Multi-Method Detrital Thermochronology of North Gondwana Cambrian Sandstone (Eilat Area, Israel). Geol. Soc. Am. Bull. 2009, 121, 1204–1216. [Google Scholar] [CrossRef]
  7. Meneisy, M.Y. Mesozoic Igneous Activity in Egypt; Qatar University Science Bulletin: Doha, Qatar, 1986. [Google Scholar]
  8. Sakran, S.; Shehata, A.A.; Osman, O.; El-Sherbiny, M. Superposed Tectonic Regimes in West Beni Suef Basin, Nile Valley, Egypt: Implications to Source Rock Maturation and Hydrocarbon Entrapment. J. Afr. Earth Sci. 2019, 154, 1–19. [Google Scholar] [CrossRef]
  9. Shehata, A.A.; El Fawal, F.M.; Ito, M.; Aboulmagd, M.A.; Brooks, H.L. Senonian Platform-to-Slope Evolution in the Tectonically-Influenced Syrian Arc Sedimentary Belt: Beni Suef Basin, Egypt—ScienceDirect. J. Afr. Earth Sci. 2020, 170, 103934. [Google Scholar] [CrossRef]
  10. Yousif, M.; Hussien, H.M.; Abotalib, A.Z. The Respective Roles of Modern and Paleo Recharge to Alluvium Aquifers in Continental Rift Basins: A Case Study from El Qaa Plain, Sinai, Egypt. Sci. Total Environ. 2020, 739, 139927. [Google Scholar] [CrossRef]
  11. Khalil, M.M.; Hamer, K.; Pichler, T.; Abotalib, A.Z. Fault Zone Hydrogeology in Arid Environments: The Origin of Cold Springs in the Wadi Araba Basin, Egypt—Khalil—2021—Hydrological Processes—Wiley Online Library. Hydrol. Process. 2021, 35, e14176. [Google Scholar]
  12. Mansour, S.; Hasebe, N.; Meert, J.G.; Tamura, A.; Khalaf, F.I.; El-Shafei, M.K. Evolution of the Arabian-Nubian Shield in Gabal Samra Area, Sinai; Implications from Zircon U–Pb Geochronology. J. Afr. Earth Sci. 2022, 192, 104538. [Google Scholar] [CrossRef]
  13. Bojar, A.-V.; Fritz, H.; Kargl, S.; Unzog, W. Phanerozoic Tectonothermal History of the Arabian–Nubian Shield in the Eastern Desert of Egypt: Evidence from Fission Track and Paleostress Data. J. Afr. Earth Sci. 2002, 34, 191–202. [Google Scholar] [CrossRef]
  14. Feinstein, S.; Eyal, M.; Kohn, B.P.; Steckler, M.S.; Ibrahim, K.M.; Moh’d, B.K.; Tian, Y. Uplift and Denudation History of the Eastern Dead Sea Rift Flank, SW Jordan: Evidence from Apatite Fission Track Thermochronometry. Tectonics 2013, 32, 1513–1528. [Google Scholar] [CrossRef]
  15. Kohn, B.P.; Feinstein, S.; Foster, D.A.; Steckler, M.S.; Eyal, M. Thermal History of the Eastern Gulf of Suez, II. Reconstruction from Apatite Fission Track and K-Feldspar Measurements. Tectonophysics 1997, 283, 219–239. [Google Scholar] [CrossRef]
  16. Kroner, A.; Todt, W.; Hussein, I.; Mansour, M.; Rashwan, A. Dating of Late Proterozoic Ophiolites in Egypt and the Sudan Using the Single Grain Zircon Evaporation Technique. Precambrian Res. 1992, 59, 15–32. [Google Scholar] [CrossRef]
  17. Mansour, S.; Hasebe, N.; Azab, E.; Elnaggar, A.Y.; Tamura, A. Combined Zircon/Apatite U-Pb and Fission-Track Dating by LA-ICP-MS and Its Geological Applications: An Example from the Egyptian Younger Granites. Minerals 2021, 11, 1341. [Google Scholar] [CrossRef]
  18. Omar, G.I.; Steckler, M.S. Fission Track Evidence on the Initial Rifting of the Red Sea: Two Pulses, No Propagation. Science 1995, 270, 1341–1344. [Google Scholar] [CrossRef]
  19. Omar, G.I.; Kohn, B.P.; Lutz, T.M.; Faul, H. The Cooling History of Silurian to Cretaceous Alkaline Ring Complexes, South Eastern Desert, Egypt, as Revealed by Fission-Track Analysis. Earth Planet. Sci. Lett. 1987, 83, 94–108. [Google Scholar] [CrossRef]
  20. Omar, G.I.; Steckler, M.S.; Buck, W.R.; Kohn, B.P. Fission-Track Analysis of Basement Apatites at the Western Margin of the Gulf of Suez Rift, Egypt: Evidence for Synchroneity of Uplift and Subsidence. Earth Planet. Sci. Lett. 1989, 94, 316–328. [Google Scholar] [CrossRef]
  21. Steckler, M.S. Uplift and Extension at the Gulf of Suez: Indications of Induced Mantle Convection. Nature 1985, 317, 135–139. [Google Scholar] [CrossRef]
  22. Kohn, B.P.; Eyal, M. History of Uplift of the Crystalline Basement of Sinai and Its Relation to Opening of the Red Sea as Revealed by Fission Track Dating of Apatites. Earth Planet. Sci. Lett. 1981, 52, 129–141. [Google Scholar] [CrossRef]
  23. Mansour, S.E.E. Long-Term Topographic Evolution of the African Plate, Causes and Consequences for Surrounding Lithospheric Plates; Universität Heidelberg: Heidelberg, Germany, 2015. [Google Scholar]
  24. Morag, N.; Haviv, I.; Eyal, M.; Kohn, B.P.; Feinstein, S. Early Flank Uplift along the Suez Rift: Implications for the Role of Mantle Plumes and the Onset of the Dead Sea Transform. Earth Planet. Sci. Lett. 2019, 516, 56–65. [Google Scholar] [CrossRef]
  25. Barbarand, J.; Marques, F.O.; Hildenbrand, A.; Pinna-Jamme, R.; Nogueira, C.R. Thermal Evolution of Onshore West Iberia: A Better Understanding of the Ages of Breakup and Rift-to-Drift in the Iberia-Newfoundland Rift. Tectonophysics 2021, 813, 228926. [Google Scholar] [CrossRef]
  26. Mansour, S.; Glasmacher, U.A.; Krob, F.C.; Casillas, R.; Albinger, M. Timing of Rapid Cooling and Erosional Decay of Two Volcanic Islands of the Canary Archipelago: Implications from Low-Temperature Thermochronology. Int. J. Earth Sci. (Geol. Rundsch.) 2022, 112, 345–382. [Google Scholar] [CrossRef]
  27. Feinstein, S.; Kohn, B.P.; Steckler, M.S.; Eyal, M. Thermal History of the Eastern Margin of the Gulf of Suez, I. Reconstruction from Borehole Temperature and Organic Maturity Measurements. Tectonophysics 1996, 266, 203–220. [Google Scholar] [CrossRef]
  28. Bosworth, W.; Stockli, D.F.; Helgeson, D.E. Integrated Outcrop, 3D Seismic, and Geochronologic Interpretation of Red Sea Dike-Related Deformation in the Western Desert, Egypt—The Role of the 23Ma Cairo “Mini-Plume”. J. Afr. Earth Sci. 2015, 109, 107–119. [Google Scholar] [CrossRef]
  29. Kohn, B.; Weissbrod, T.; Chung, L.; Farley, K.; Bodorkos, S. Low-temperature Thermochronology of Francolite: Insights into Timing of Dead Sea Transform Motion. Terra Nova 2019, 31, 205–219. [Google Scholar] [CrossRef]
  30. Elhebiry, M.S.; Sultan, M.; Abu El-Leil, I.; Kehew, A.E.; Bekiet, M.H.; Abdel Shahid, I.; Soliman, N.M.A.; Abotalib, A.Z.; Emil, M. Paleozoic Glaciation in NE Africa: Field and Remote Sensing-Based Evidence from the South Eastern Desert of Egypt. Int. Geol. Rev. 2020, 62, 1187–1204. [Google Scholar] [CrossRef]
  31. Leroy, S.; Razin, P.; Autin, J.; Bache, F.; d’Acremont, E.; Watremez, L.; Robinet, J.; Baurion, C.; Denèle, Y.; Bellahsen, N.; et al. From Rifting to Oceanic Spreading in the Gulf of Aden: A Synthesis. Arab J. Geosci. 2012, 5, 859–901. [Google Scholar] [CrossRef]
  32. Pik, R.; Bellahsen, N.; Leroy, S.; Denèle, Y.; Razin, P.; Ahmed, A.; Khanbari, K. Structural Control of Basement Denudation during Rifting Revealed by Low-Temperature (U–Th–Sm)/He Thermochronology of the Socotra Island Basement—Southern Gulf of Aden Margin. Tectonophysics 2013, 607, 17–31. [Google Scholar] [CrossRef]
  33. Serra-Kiel, J.; Gallardo-Garcia, A.; Razin, P.; Robinet, J.; Roger, J.; Grelaud, C.; Leroy, S.; Robin, C. Middle Eocene-Early Miocene Larger Foraminifera from Dhofar (Oman) and Socotra Island (Yemen). Arab J. Geosci. 2016, 9, 344. [Google Scholar] [CrossRef]
  34. Watchorn, F.; Nichols, G.J.; Bosence, D.W.J. Rift-Related Sedimentation and Stratigraphy, Southern Yemen (Gulf of Aden). In Sedimentation and Tectonics in Rift Basins Red Sea: Gulf of Aden; Purser, B.H., Bosence, D.W.J., Eds.; Springer: Dordrecht, The Netherlands, 1998; pp. 165–189. ISBN 978-94-010-6068-4. [Google Scholar]
  35. Hempton, M.R. Structure and Deformation History of the Bitlis Suture near Lake Hazar, Southeastern Turkey. Geol. Soc. Am. Bull. 1985, 96, 233. [Google Scholar] [CrossRef]
  36. Kröner, A.; Kröger, J.; Rashwan, A.A.A. Age and Tectonic Setting of Granitoid Gneisses in the Eastern Desert of Egypt and South-West Sinai. Geol. Rundsch. 1994, 83, 502–513. [Google Scholar] [CrossRef]
  37. Bentor, Y.K. The Crustal Evolution of the Arabo-Nubian Massif with Special Reference to the Sinai Peninsula. Precambrian Res. 1985, 28, 1–74. [Google Scholar] [CrossRef]
  38. Stern, R.J.; Hedge, C.E. Geochronologic and Isotopic Constraints on Late Precambrian Crustal Evolution in the Eastern Desert of Egypt. Am. J. Sci. 1985, 285, 97. [Google Scholar] [CrossRef]
  39. Platt, J.P.; England, P.C. Convective Removal of Lithosphere beneath Mountain Belts; Thermal and Mechanical Consequences. Am. J. Sci. 1994, 294, 307–336. [Google Scholar] [CrossRef]
  40. Mansour, S.; Hasebe, N.; Tamura, A. Erosional Reservoir for the Northern Segment of the Arabian-Nubian Shield: Constrains from U-Pb Geochronology of the Lower Palaeozoic Succession, North Eastern Desert, Egypt. Precambrian Res. 2023, 388, 107017. [Google Scholar] [CrossRef]
  41. Bosworth, W.; Huchon, P.; McClay, K. The Red Sea and Gulf of Aden Basins. J. Afr. Earth Sci. 2005, 43, 334–378. [Google Scholar] [CrossRef]
  42. Klitzsch, E. Plate Tectonics and Cratonal Geology in Northeast Africa (Egypt, Sudan). Geol. Rundsch. 1986, 75, 755–768. [Google Scholar] [CrossRef]
  43. Klitzsch, E. Paleozoic. In The Geology of Egypt; Said, R., Ed.; Balkema: Rotterdam, The Netherlands, 1990; Volume 24, pp. 451–486. [Google Scholar]
  44. Moustafa, A.R.; Yousif, M.S.M. Structural Evolution of the Eastern Shoulder of the Suez Rift: Um Bogma Area. Neues Jahrb. Für Geol. Und Paläontologie Mon. 1993, 1993, 655–668. [Google Scholar] [CrossRef]
  45. Dewey, J.F.; Pitman, W.C.; Ryan, W.B.F.; Bonnin, J. Plate Tectonics and the Evolution of the Alpine System. Geol. Soc. Am. Bull. 1973, 84, 3137. [Google Scholar] [CrossRef]
  46. Girdler, R.W. Problems Concerning the Evolution of Oceanic Lithosphere in the Northern Red Sea. Tectonophysics 1985, 116, 109–122. [Google Scholar] [CrossRef]
  47. Shehata, A.A.; Sarhan, M.A.; Abdel-Fattah, M.I.; Mansour, S. Geophysical Assessment for the Oil Potentiality of the Abu Roash “G” Reservoir in West Beni Suef Basin, Western Desert, Egypt. J. Afr. Earth Sci. 2023, 13, 104845. [Google Scholar] [CrossRef]
  48. Boone, S.C.; Balestrieri, M.-L.; Kohn, B. Thermo-Tectonic Imaging of the Gulf of Aden-Red Sea Rift Systems and Afro-Arabian Hinterland. Earth Sci. Rev. 2021, 222, 103824. [Google Scholar] [CrossRef]
  49. Szymanski, E.; Stockli, D.F.; Johnson, P.R.; Hager, C. Thermochronometric Evidence for Diffuse Extension and Two-Phase Rifting within the Central Arabian Margin of the Red Sea Rift. Tectonics 2016, 35, 2863–2895. [Google Scholar] [CrossRef]
  50. Tewfik, N.; Harwood, C.; Deighton, I. The Miocene, Rudeis and Kareem Formations in the Gulf of Suez: Aspects of Sedimentology and Geochemistry. In 11th Petroleum Exploration and Production Conference; Cairn: Bend, OR, USA, 1992; Volume 11, pp. 84–113. [Google Scholar]
  51. Darwish, M.; El Araby, A. Petrography and Diagenetic Aspects of Some Siliclastic Hydrocarbon Reservoirs in Relation to Rifting of the Gulf of Suez, Egypt. Geodynamics and Sedimentation of the Red Sea—Gulf of Aden Rift System. Egyptian J. Geol. 1994, 3, 155–187. [Google Scholar]
  52. Wagner, G.A. Spaltspurenalter von Mineralen Und Natürlichen Gläsern: Eine Übersicht. Fortschr. Der Mineral. 1972, 49, 114–145. [Google Scholar]
  53. Gleadow, A.J.W.; Duddy, I.R. A Natural Long-Term Track Annealing Experiment for Apatite. Nucl. Tracks 1981, 5, 169–174. [Google Scholar] [CrossRef]
  54. Yamada, R.; Tagami, T.; Nishimura, S.; Ito, H. Annealing Kinetics of Fission Tracks in Zircon: An Experimental Study. Chem. Geol. 1995, 122, 249–258. [Google Scholar] [CrossRef]
  55. Donelick, R.A.; O’Sullivan, P.B.; Ketcham, R.A. 3. Apatite Fission-Track Analysis. In Low-Temperature Thermochronology; Reiners, P.W., Ehlers, T.A., Eds.; De Gruyter: Berlin, Germany; Boston, MA, USA, 2005; pp. 49–94. ISBN 978-1-5015-0957-5. [Google Scholar]
  56. Ketcham, R.A. Forward and Inverse Modeling of Low-Temperature Thermochronometry Data. Rev. Mineral. Geochem. 2005, 58, 275–314. [Google Scholar] [CrossRef]
  57. Hasebe, N.; Barbarand, J.; Jarvis, K.; Carter, A.; Hurford, A.J. Apatite Fission-Track Chronometry Using Laser Ablation ICP-MS. Chem. Geol. 2004, 207, 135–145. [Google Scholar] [CrossRef]
  58. Vermeesch, P. IsoplotR: A Free and Open Toolbox for Geochronology. Geosci. Front. 2018, 9, 1479–1493. [Google Scholar] [CrossRef]
  59. Garver, J.I. Etching Zircon Age Standards for Fission-Track Analysis. Radiat. Meas. 2003, 37, 47–53. [Google Scholar] [CrossRef]
  60. Rahn, M.K.; Brandon, M.T.; Batt, G.E.; Garver, J.I. A Zero-Damage Model for Fission-Track Annealing in Zircon. Am. Mineral. 2004, 89, 473–484. [Google Scholar] [CrossRef]
  61. Hurford, A.J. Cooling and Uplift Patterns in the Lepontine Alps South Central Switzerland and an Age of Vertical Movement on the Insubric Fault Line. Contrib. Mineral. Petrol. 1986, 92, 413–427. [Google Scholar] [CrossRef]
  62. Green, P.F.; Duddy, I.R.; Gleadow, A.J.W.; Tingate, P.R.; Laslett, G.M. Thermal Annealing of Fission Tracks in Apatite: 1. A Qualitative Description. Chem. Geol. Isot. Geosci. Sect. 1986, 59, 237–253. [Google Scholar] [CrossRef]
  63. Carlson, W.D.; Donelick, R.A.; Ketcham, R.A. Variability of Apatite Fission-Track Annealing Kinetics; I, Experimental Results. Am. Mineral. 1999, 84, 1213–1223. [Google Scholar] [CrossRef]
  64. Green, P.F.; Durrani, S.A. Annealing Studies of Tracks in Crystals. Nucl. Track Detect. 1977, 1, 33–39. [Google Scholar] [CrossRef]
  65. Donelick, R.A.; Ketcham, R.A.; Carlson, W.D. Variability of Apatite Fission-Track Annealing Kinetics; II, Crystallographic Orientation Effects. Am. Mineral. 1999, 84, 1224–1234. [Google Scholar] [CrossRef]
  66. Hurford, A.J. Standardization of Fission Track Dating Calibration: Recommendation by the Fission Track Working Group of the I.U.G.S. Subcommission on Geochronology. Chem. Geol. 1990, 80, 171–178. [Google Scholar] [CrossRef]
  67. Gleadow, A.J.W.; Duddy, I.R.; Green, P.F.; Lovering, J.F. Confined Fission Track Lengths in Apatite: A Diagnostic Tool for Thermal History Analysis. Contrib. Mineral. Petrol. 1986, 94, 405–415. [Google Scholar] [CrossRef]
  68. Said, R. The Geology of Egypt, 2nd ed.; A.A. Balkema: Rotterdam, The Netherlands, 1990. [Google Scholar]
  69. Seilacher, A. Paleozoic Trace Fossils. In Geology of Egypt; A.A. Balkema: Rotterdam, The Netherlands, 1990; pp. 113–156. [Google Scholar]
  70. Moustafa, A.R.; Fouda, H.G.A. Structural Architecture and Tectonic Evolution of the Yelleg Inverted Half Graben, Northern Sinai, Egypt. Mar. Pet. Geol. 2014, 51, 286–297. [Google Scholar] [CrossRef]
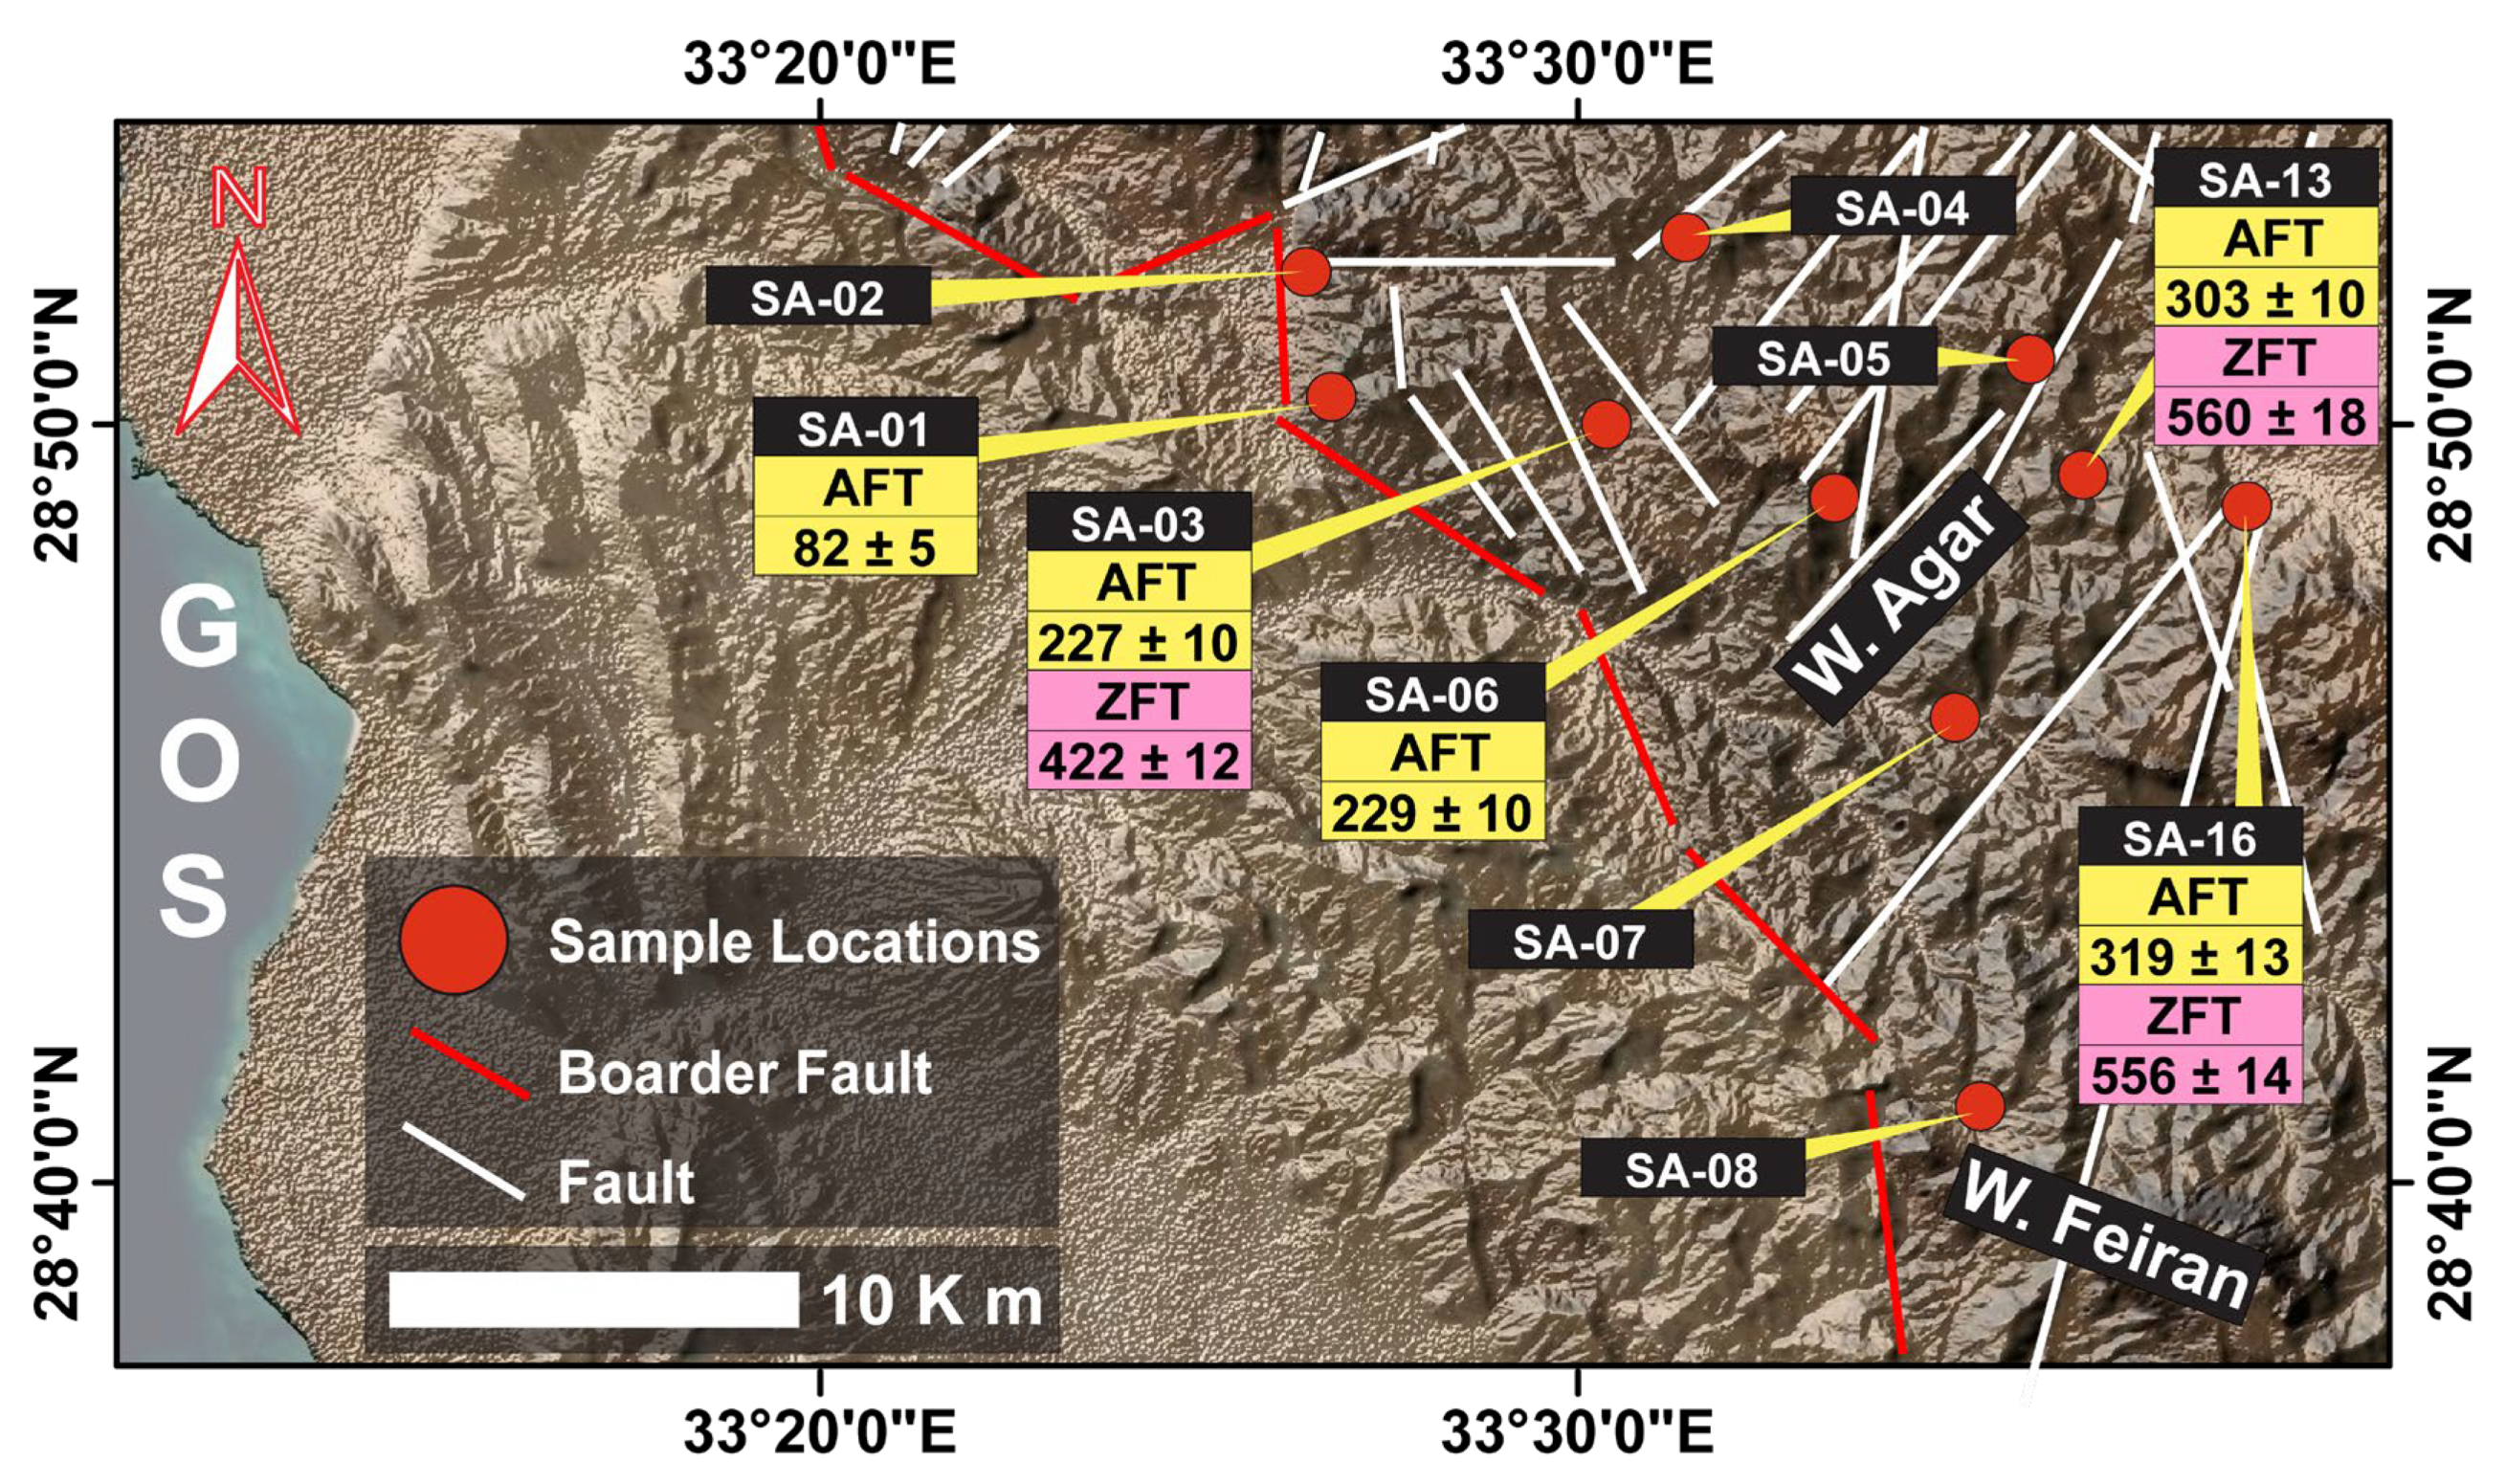
Figure 1. (A) Location map based on digital elevation model (www.geomapapp.org, accessed on 25 October 2022) representing the previous thermochronologic studies in the northern ANS and Sinai [6,14,15,17,20,22,23,24]. Where NED = Northeastern Desert; Ar = Ar-Ar dating; ZFT = zircon fission-track, ZHe; zircon (U-Th)/He, AFT = apatite fission-track, and AHe; apatite (U-Th)/He. (B) Digital elevation model (www.geomapapp.org) for the ANS representing the location of topographic cross sections (C) across the ANS in NED, the Gulf of Suez, the northern exposure of the ANS in Sinai, the Gulf of Aqaba, and the ANS in northern Arabia, (D) across the ANS in NED, the Gulf of Suez, the southern exposure of the ANS in Sinai, the Gulf of Aqaba, and the ANS in northern Arabia, (E) across the ANS in CED, the Red Sea, and the ANS in central Arabia.
Minerals 13 00574 g001
Figure 2. Location and structural map for Wadi Agar (based on Landsat8 and DEM images) representing locations of the studied samples collected from the ANS different components in Sinai [12], and ZFT and AFT ages.
Minerals 13 00574 g002
Figure 4. Thermal history models for all samples were obtained using HeFTy [56]. Resulting t–T curves show four different reliability levels—green paths: acceptable fit (all t–T paths with a merit function value of at least 0.05), purple paths: good fit (all t–T paths with a merit function value of at least 0.5), black line: best fit, and blue line: the weighted mean path [53,56], the dashed grey lines represent the time–temperature grid. Five search boxes were chosen to guide the randomness. Detailed information about the constraints is provided in Table S1. P: number of inverse models’ iterations, A: number of acceptable fit models, G: number of good fit models, D: determined FT age and CLs (1-σ error), M: modelled FT age and HCTs, G.O.F.: goodness of fit, N: number of single grains and HCTLs.
Minerals 13 00574 g004
Table 1. Zircon fission-track ages, data, and sample descriptions.
S.-No.Elev.CoordinatesLithology238UnρsNsχ2
[%]
W.M. Age
NE[µg/g](106 Track/cm2)[Ma]
SA-1378928.85947°33.5522°Gneiss268.51584.638970.9560.117.4
SA-1693528.83682°33.56992°Diorite403.021125.170921.0555.514.1
SA-0362428.86578°33.48112°Diorite207.62348.540281.0421.912.8
Sample information and zircon fission-track data are given as weighted mean ages (bold) with an uncertainty of 1-sigma calculated using IsopltR [58]. S.-No.; samples number, Elev.; elevation in meters above sea-level, U; uranium concentration in μg/g, n; the number of counted zircon grains, ρs; density of spontaneous tracks (106 tr/cm2), Ns; the number of spontaneous tracks, χ2; chi-square test: the probability of single grain ages belonging to one population. The test is passed if P(χ2) > 5% (Galbraith, 1981).
Table 2. Apatite fission-track ages, data, and sample descriptions.
S.-No.Elev.CoordinatesLithology238UnρsNsχ2
[%]
W.M. AgeLcDpar
NE[µg/g](106 Track/cm2)[Ma](µm)(µm)
SA-0145828.86651°33.44047°Monzogranite32.5211.04051.082.04.713.00.61.50.2
SA-0362428.86578°33.48112°Diorite18.3222.28561.0227.110.012.21.31.50.1
SA-0659528.85124°33.51373°Syenite23.7202.610480.9228.99.612.01.11.40.2
SA-1378928.85947°33.5522°Gneiss18.7203.412901.0303.29.712.21.11.50.2
SA-1693528.83682°33.56992°Diorite23.2203.97981.0319.213.311.41.01.40.2
Sample information and apatite fission-track data were given as weighted mean ages (bold) with an uncertainty of 1-sigma, calculated using IsopltR [58]. S.-No.; samples number, Elev.; elevation in meters above sea-level, U; uranium concentration in μg/g, n; the number of counted apatite grains, ρs; density of spontaneous tracks (106 tr/cm2), Ns; the number of spontaneous tracks, χ2; chi-square test: the probability of single grain ages belonging to one population. The test is passed if P(χ2) > 5% (Galbraith, 1981), W.M. age; weighted mean age (bold) in million years,1σ; 1-sigma error, Lc: C-axis projected horizontal confined track lengths (bold), Dpar: etch pit diameter (bold).
Table 3. Detailed length and Dpar data of the apatite horizontal confined track.
SampleHCTLs
No.
HCTLs Mean
(µm)
HCTLs Std.
(µm)
HCTLs
Skew.
Lc Mean
(µm)
Lc Std.
(µm)
Lc
Skew.
Dpar
No.
Dpar Mean
(µm)
Dpar Std.
(µm)
Dpar
Skew.
SA-016910.71.0−0.03913.00.60.262961.50.2−0.260
SA-03739.42.40.46612.21.31.071951.50.1−0.153
SA-06*810.30.70.72012.01.1−0.839221.40.20.402
SA-13799.91.80.66412.21.1−0.097991.50.2−0.549
SA-16*610.20.60.57011.41.00.627181.40.20.115
SA-01; sample symbol, SA-06*; sample with insufficient HCTLs number, HCTLs no.; the number of measured horizontal confined tracks, HCTLs mean; mean horizontal confined track length (bold), std; standard deviation, skew; skewness of distribution relative to the mean value (a measure of the asymmetry of the distribution), Lc mean; mean track length after c-axis correction (bold), Dpar no.; the number of measured etch pit diameters, Dpar mean; mean etch pit diameter (bold).
Disclaimer/Publisher’s Note: The statements, opinions and data contained in all publications are solely those of the individual author(s) and contributor(s) and not of MDPI and/or the editor(s). MDPI and/or the editor(s) disclaim responsibility for any injury to people or property resulting from any ideas, methods, instructions or products referred to in the content.

