
Silver(I) Recovery by Ion Flotation Process from Aqueous Solutions in Cells with Spargers
 , , , and
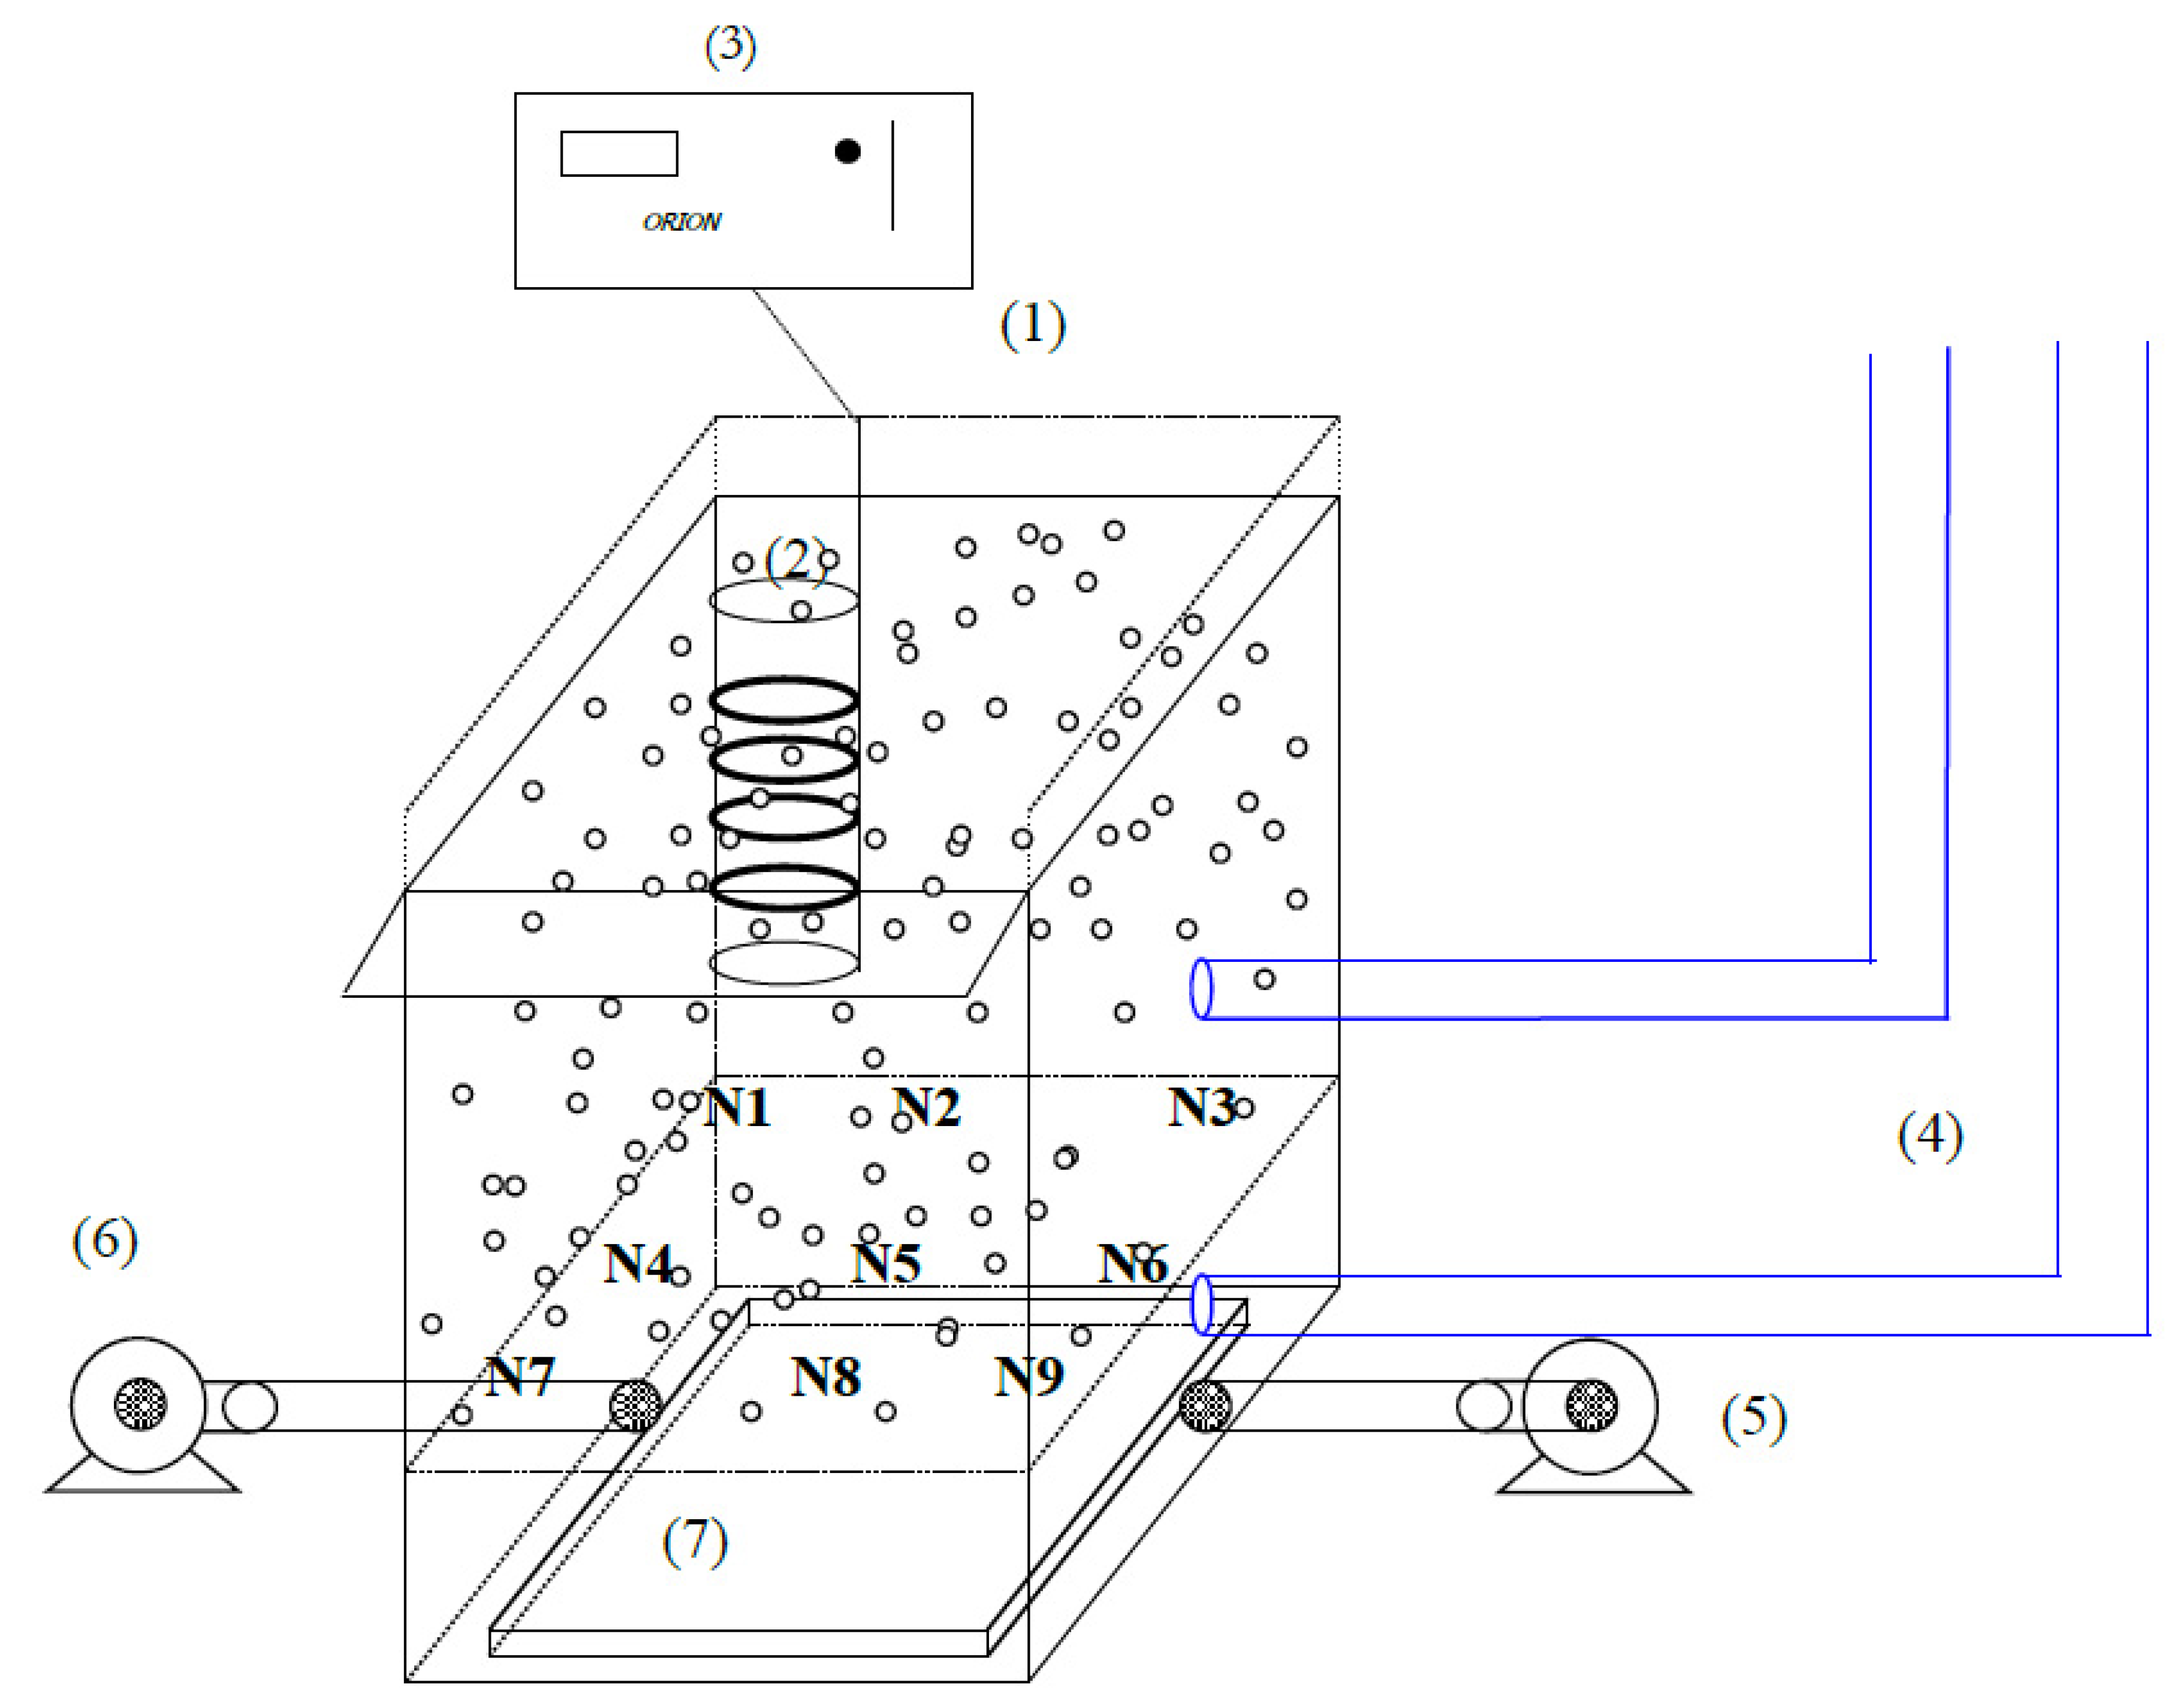
Abstract
:1. Introduction
2. Materials and Methods
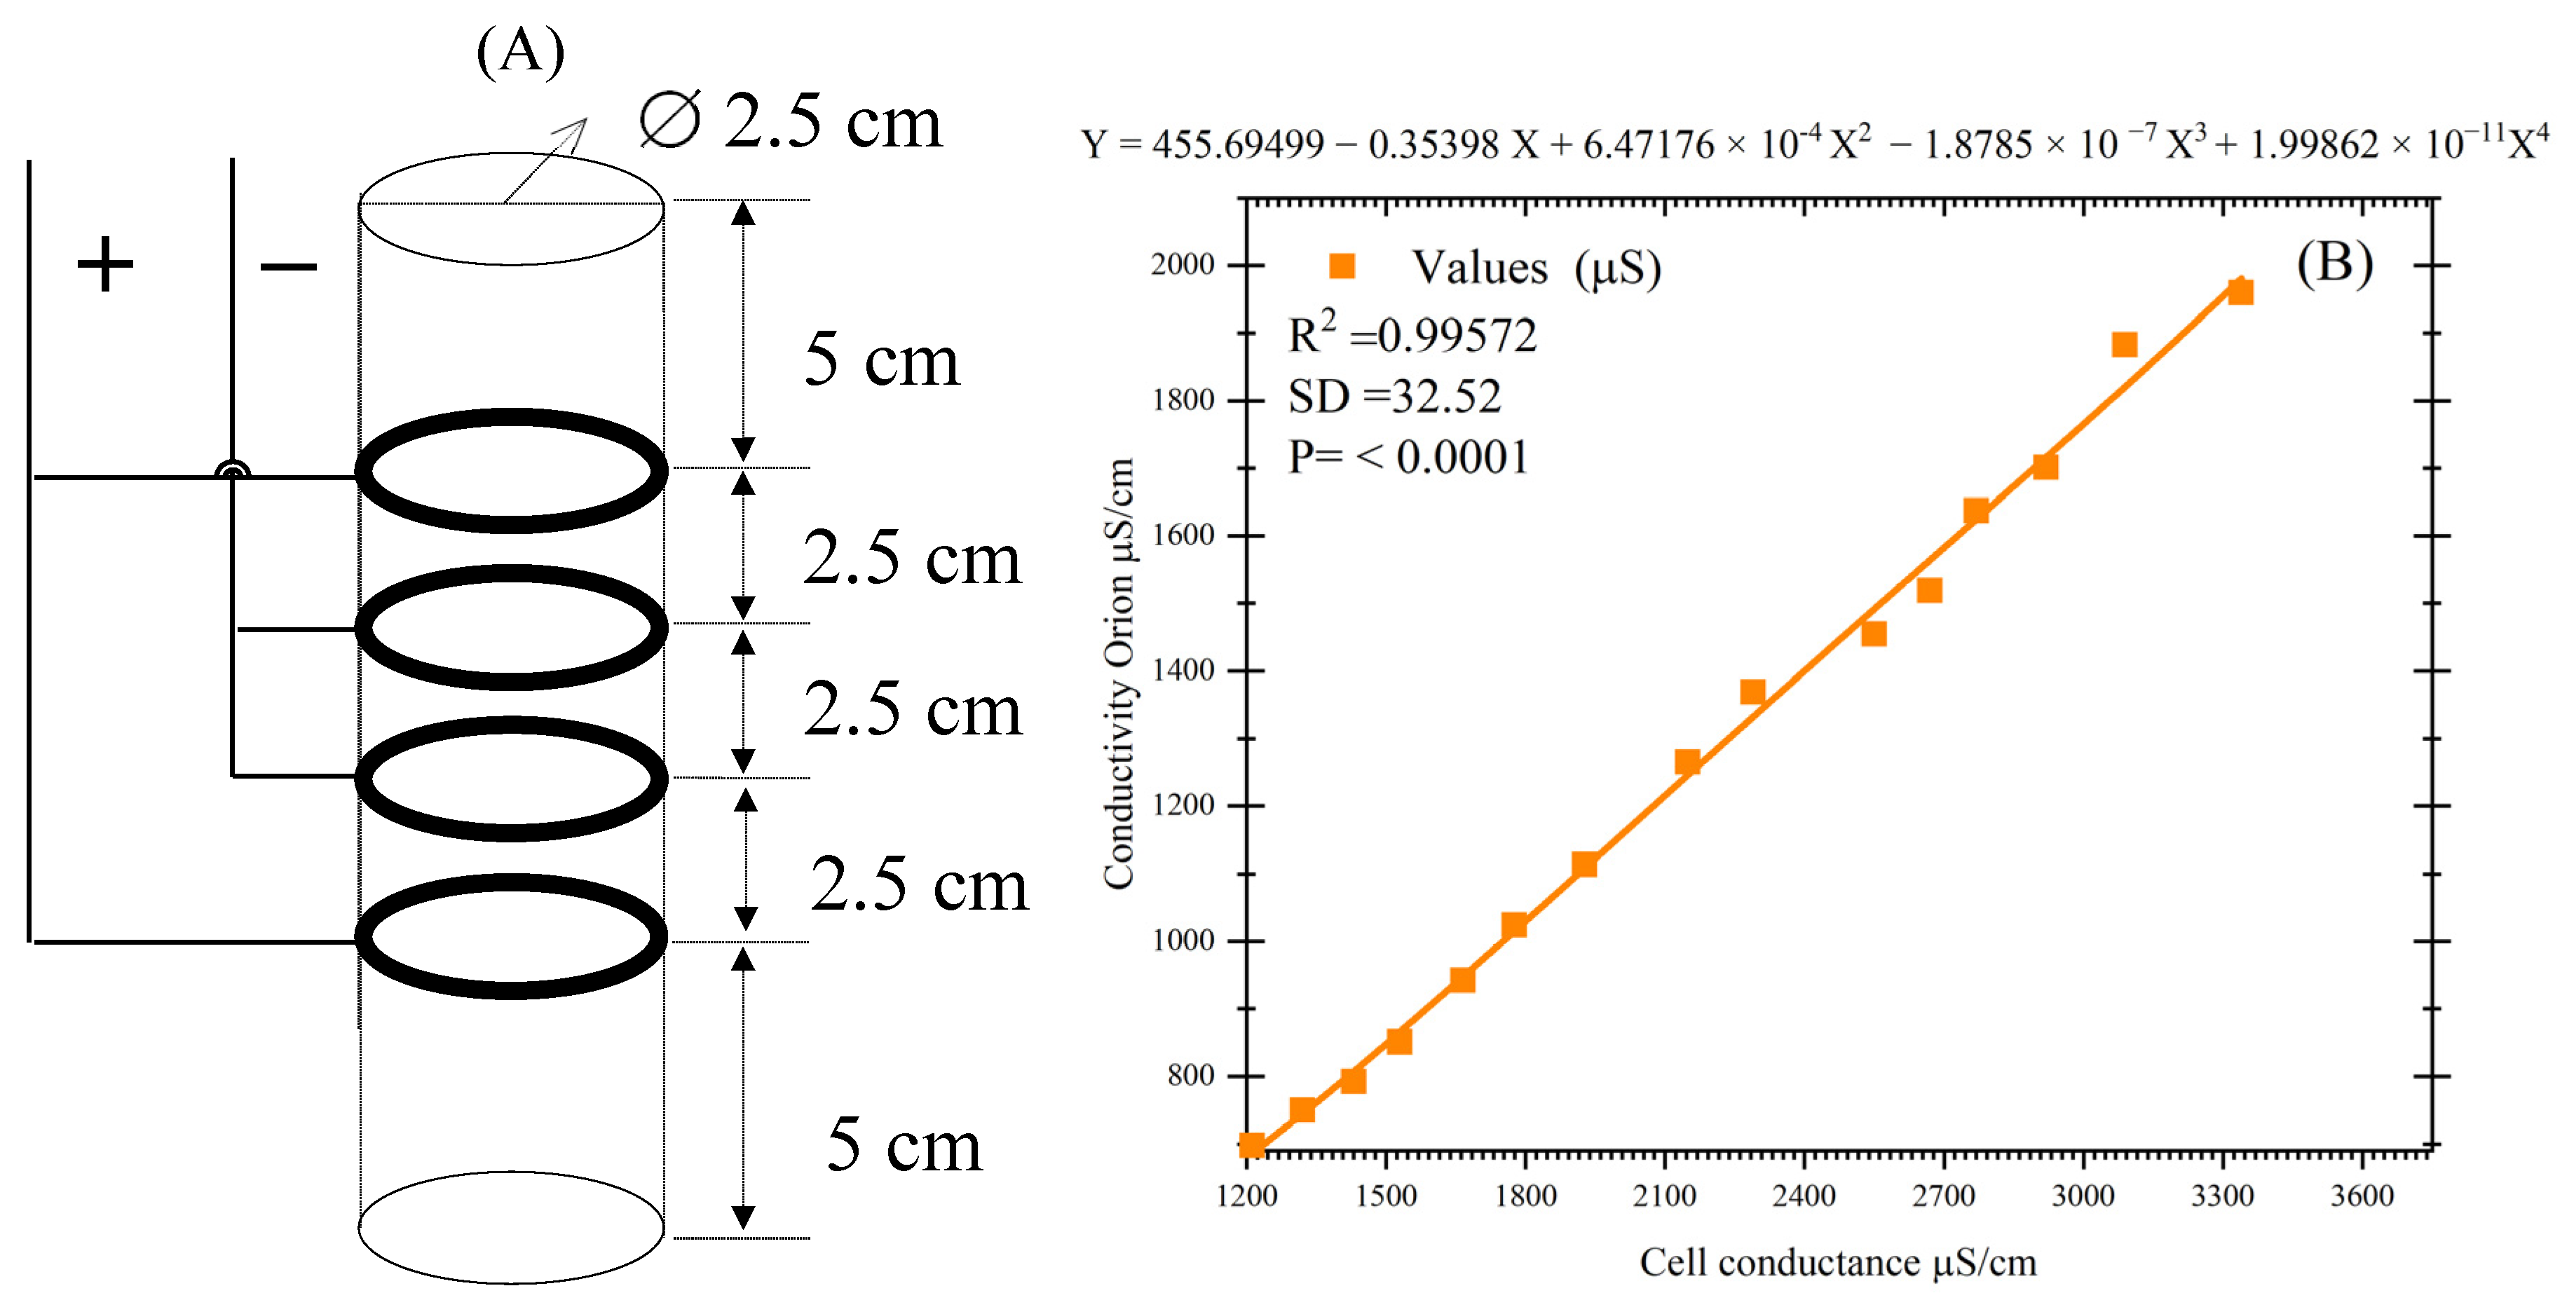
2.1. Equipment and Materials
2.2. Experimental Procedure
3. Results and Discussion
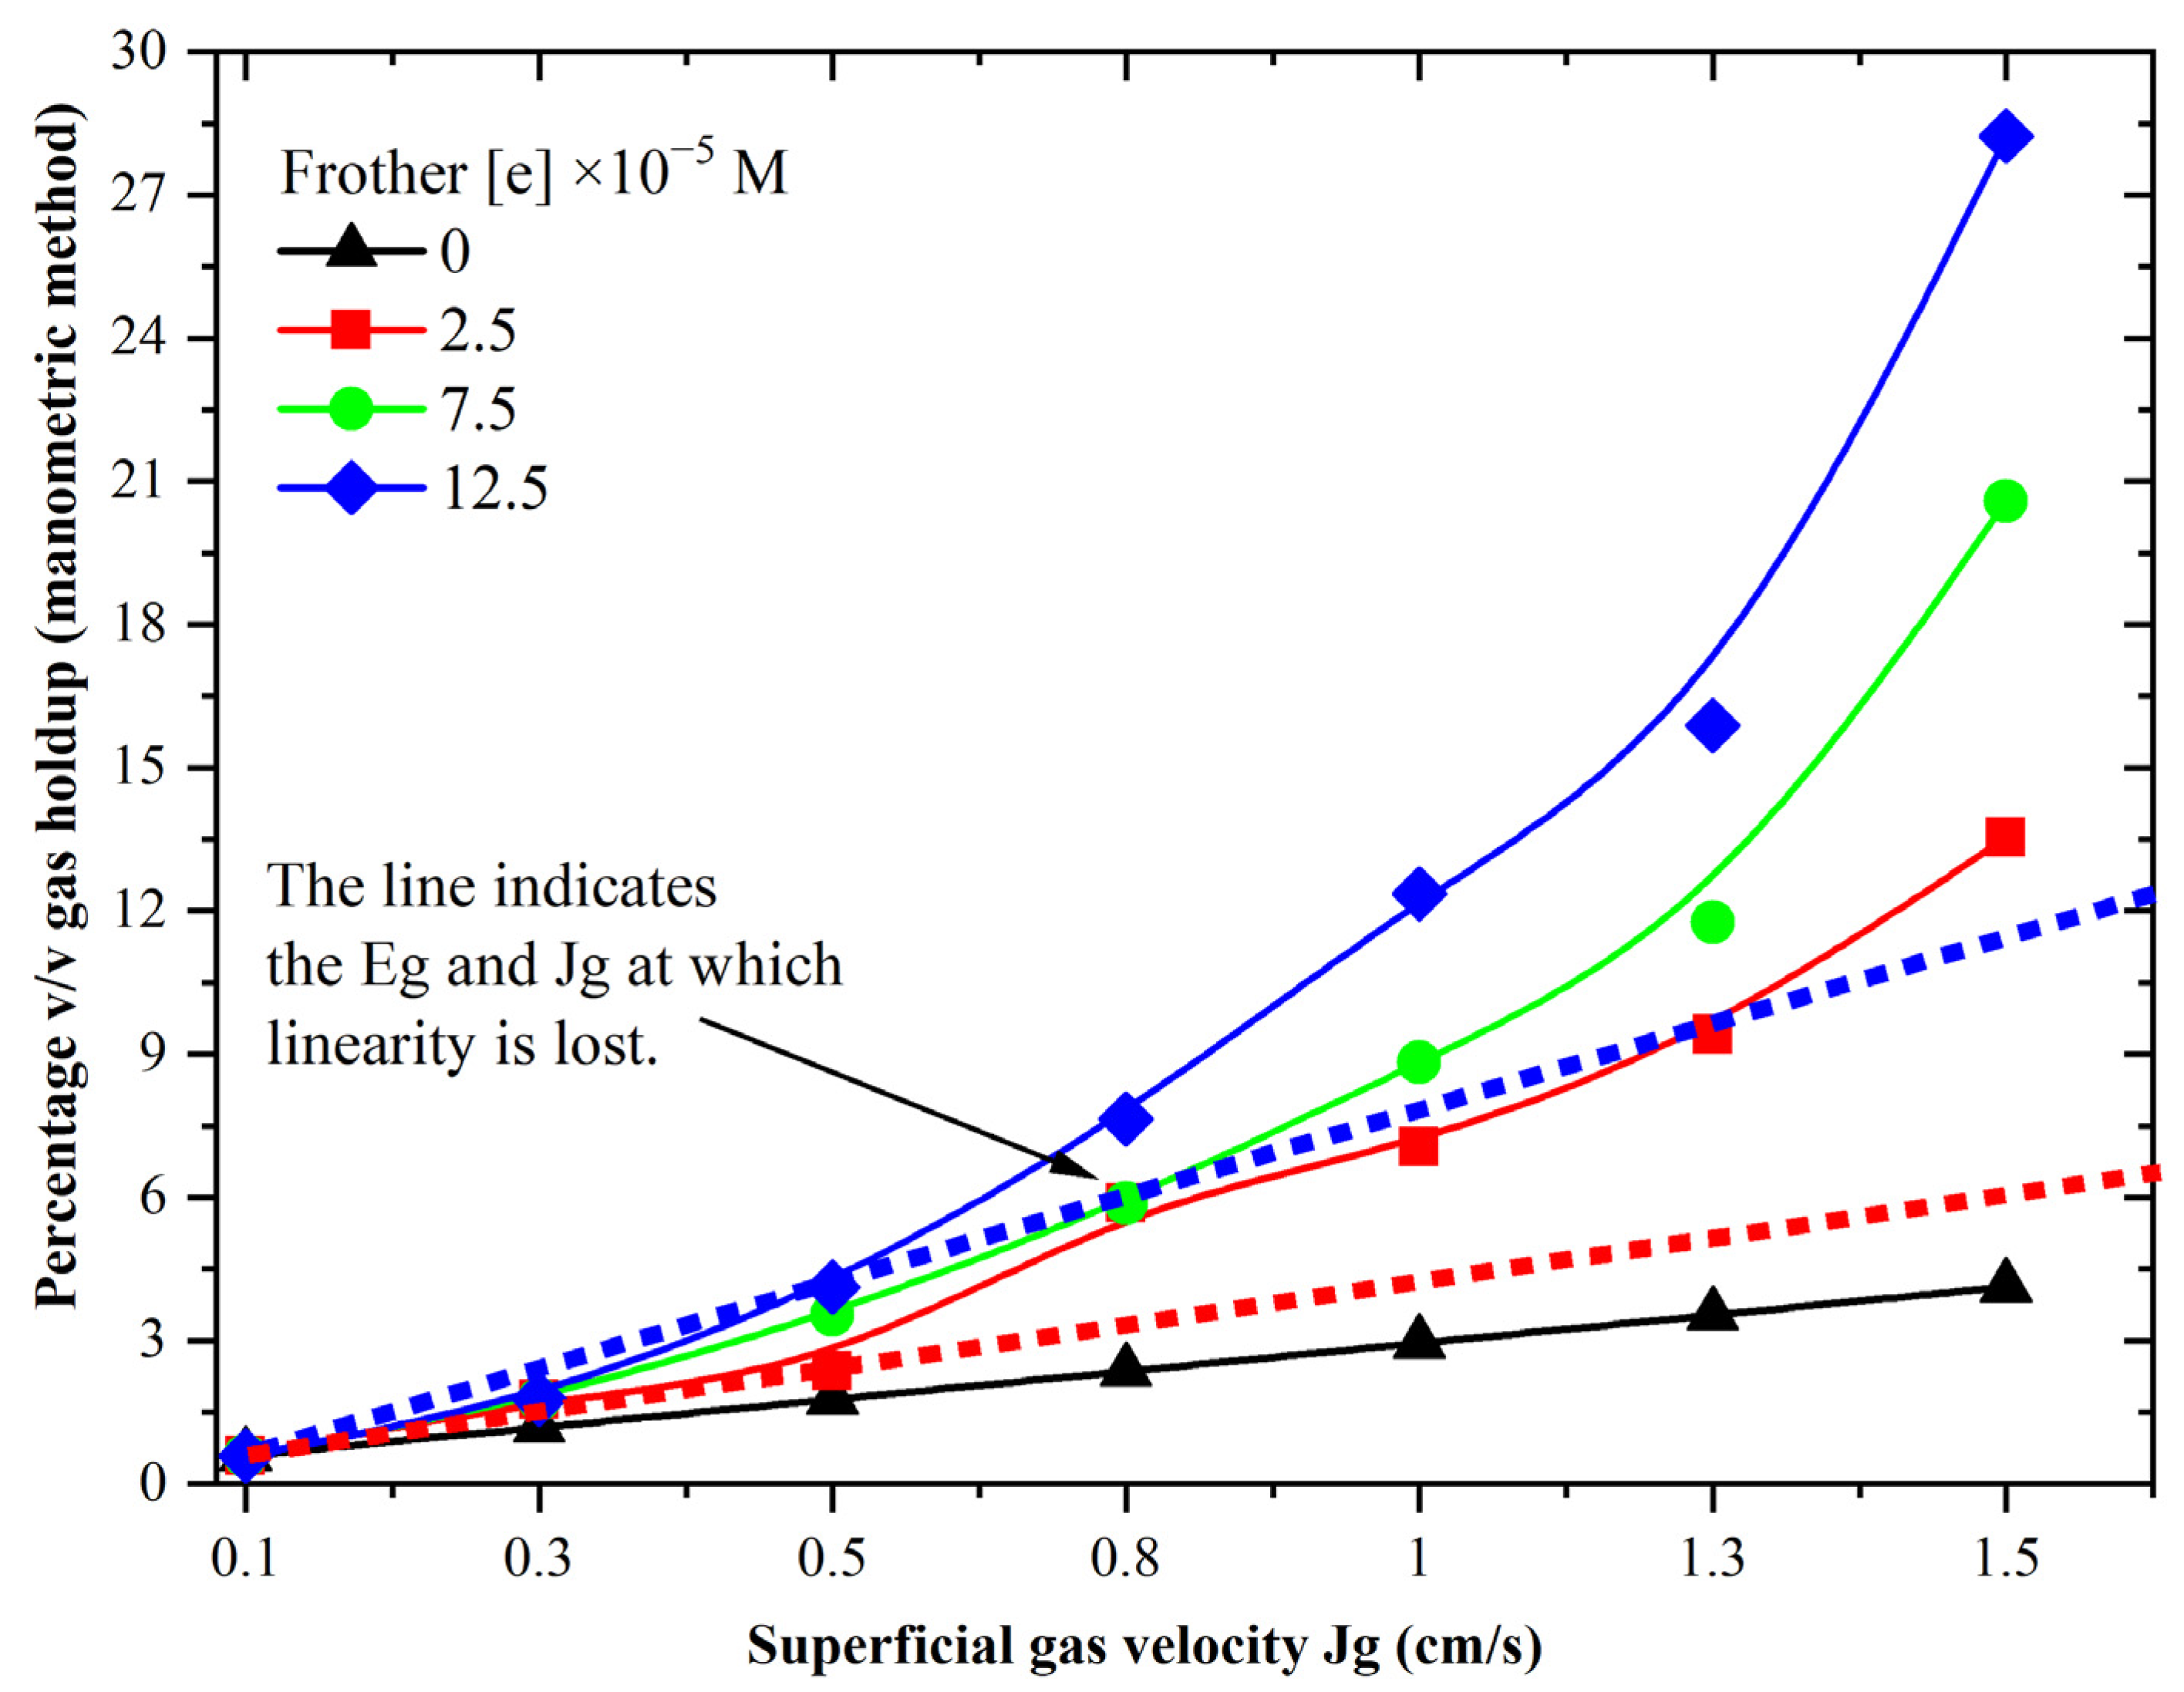
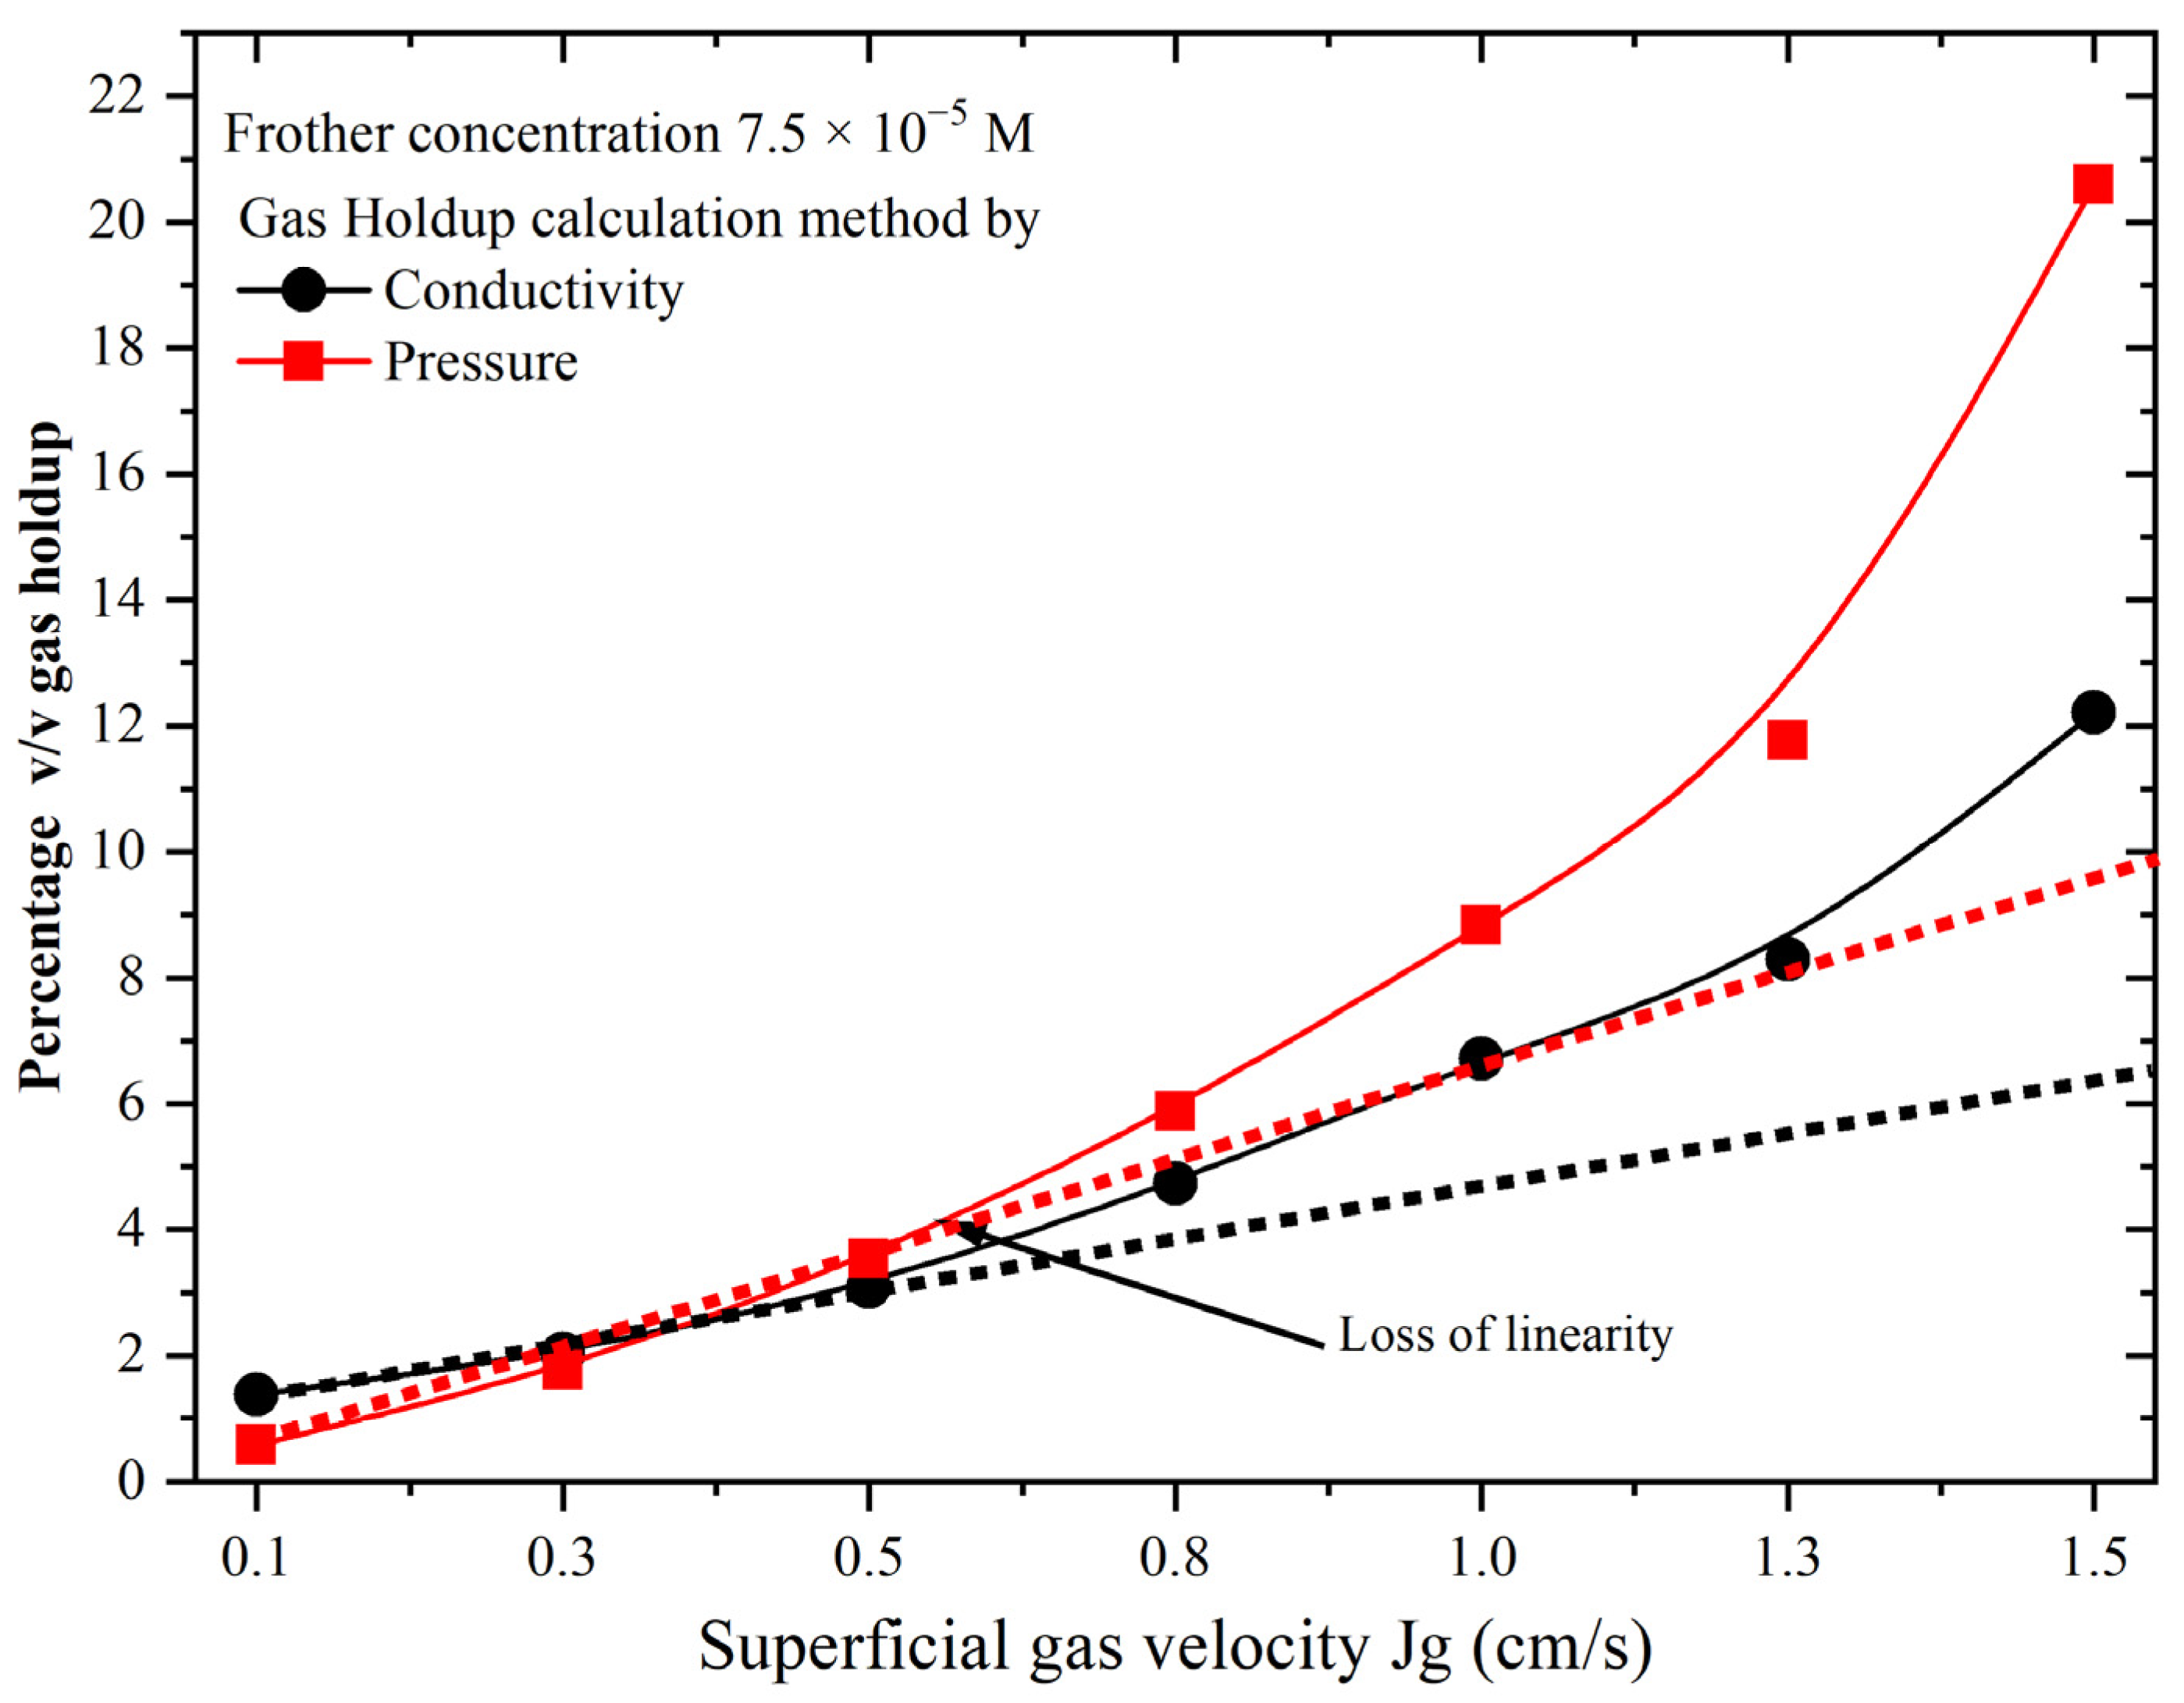
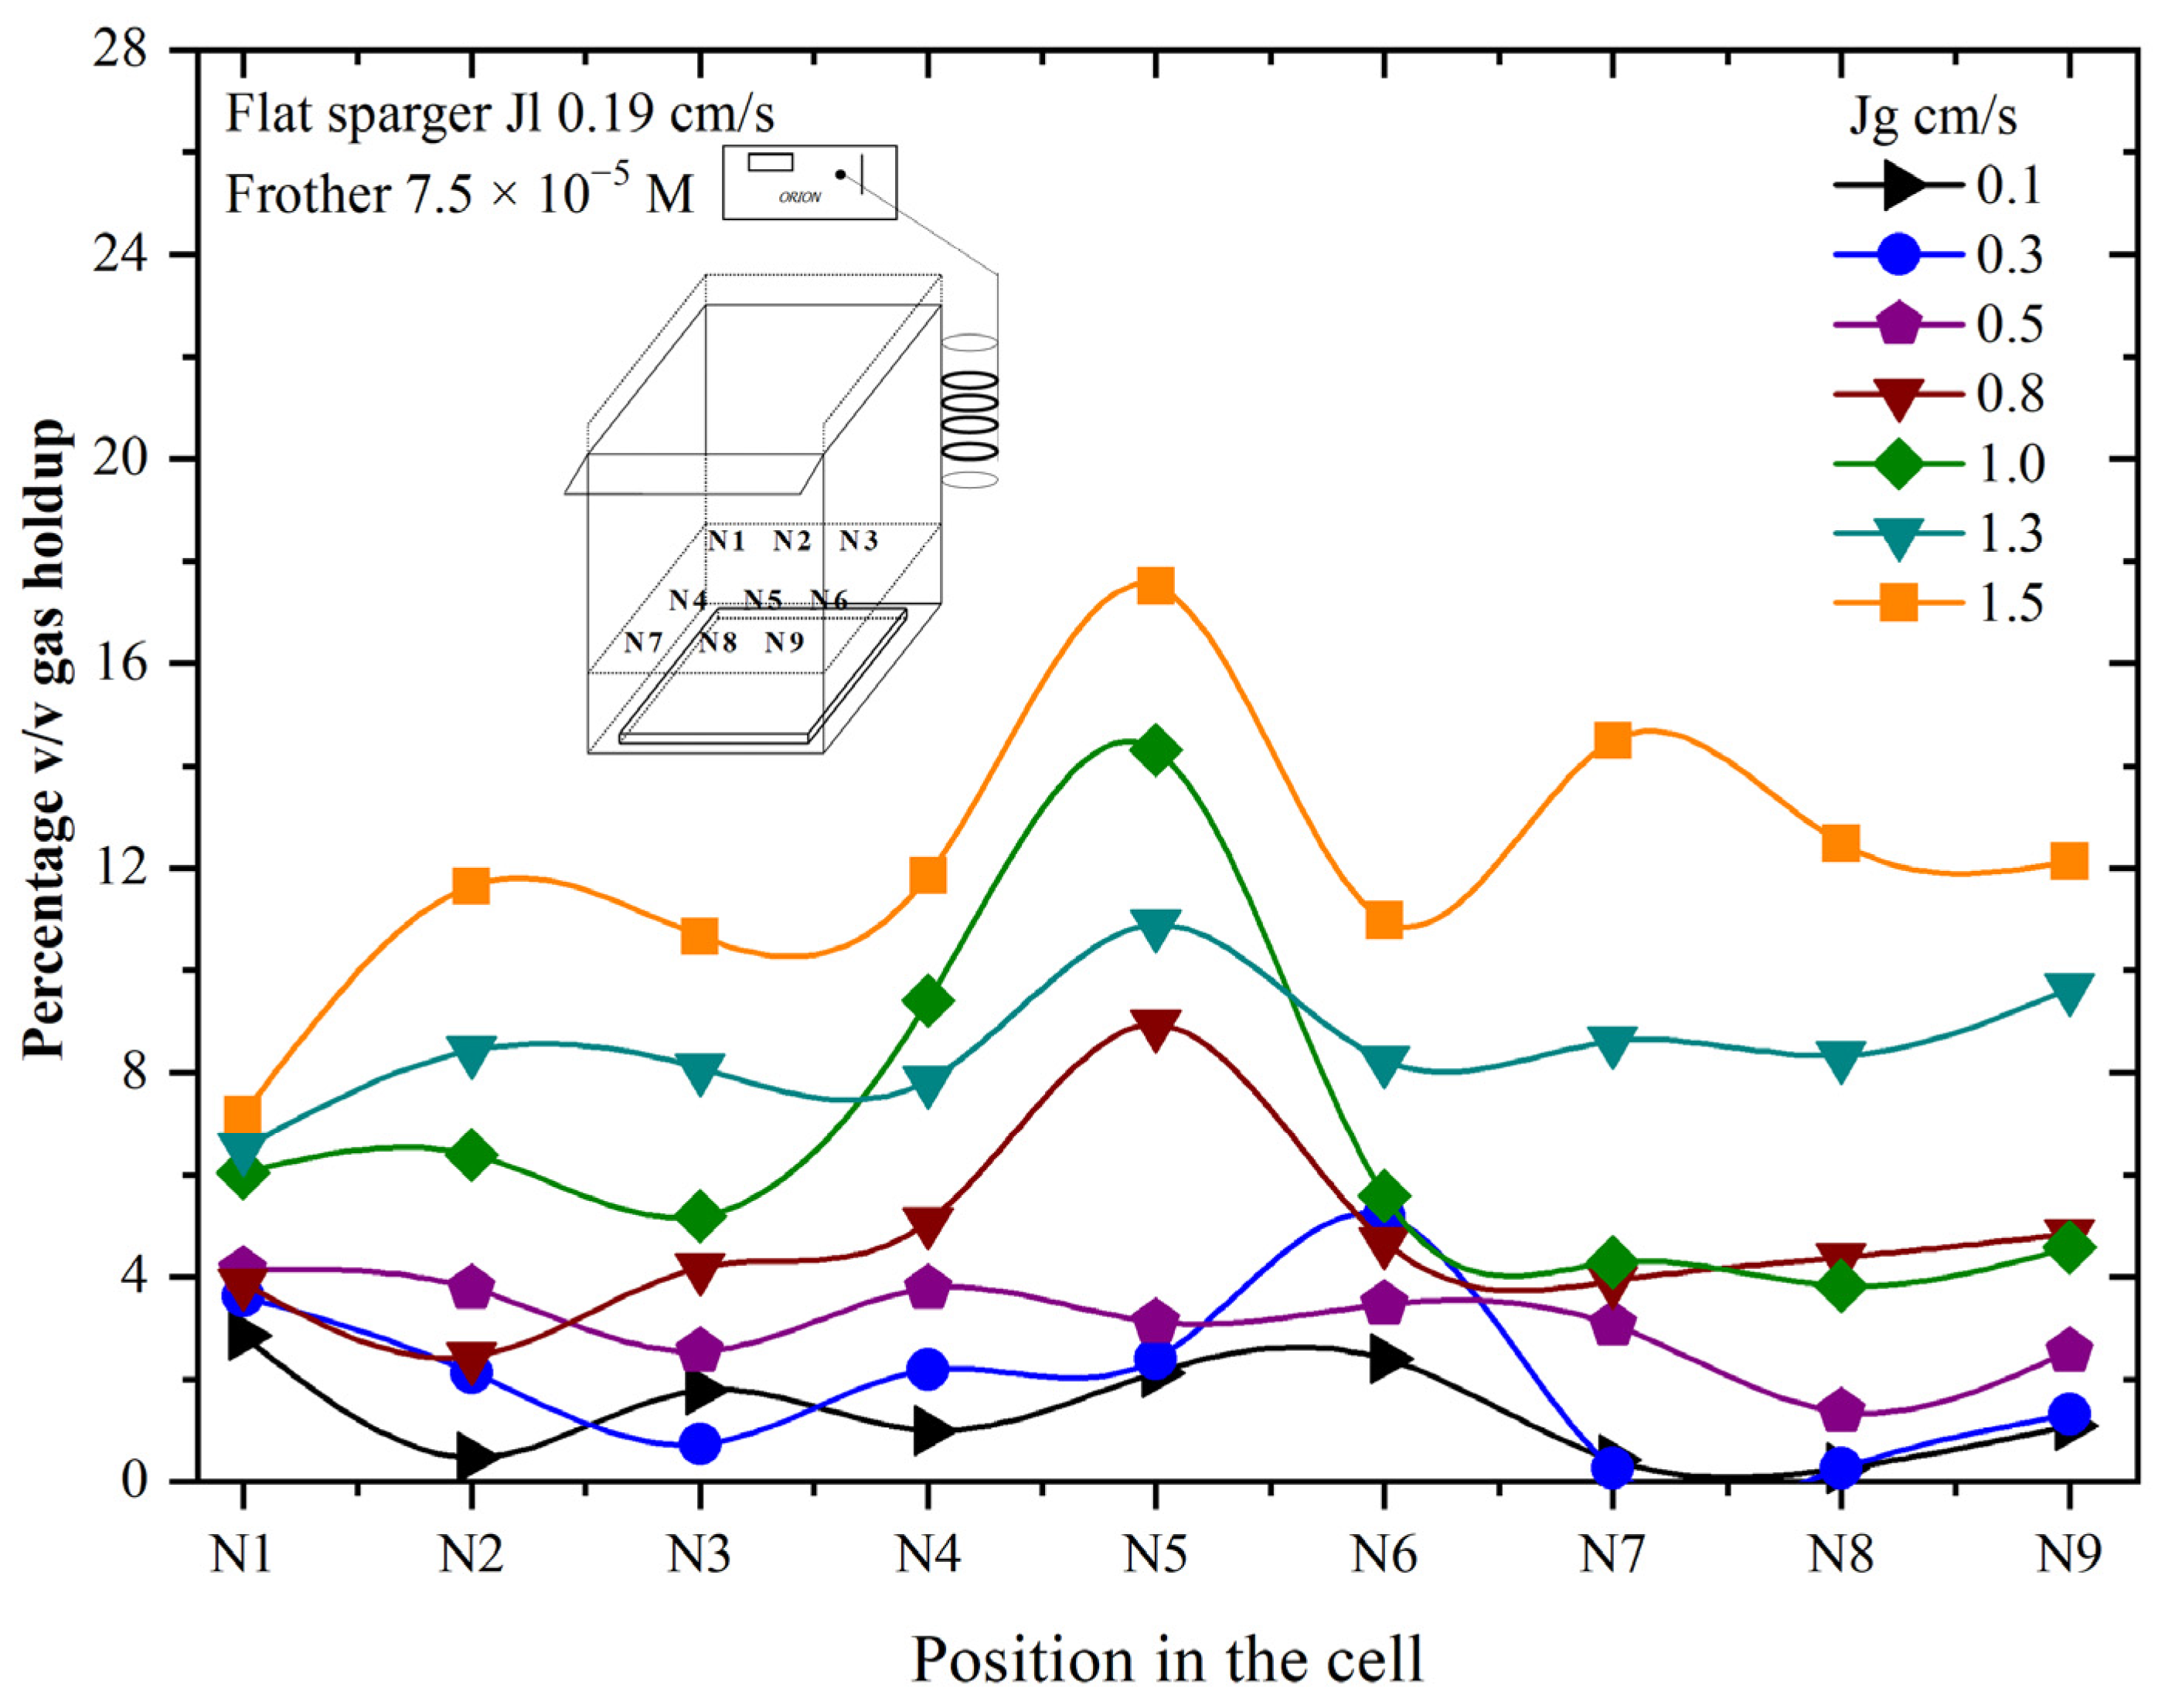
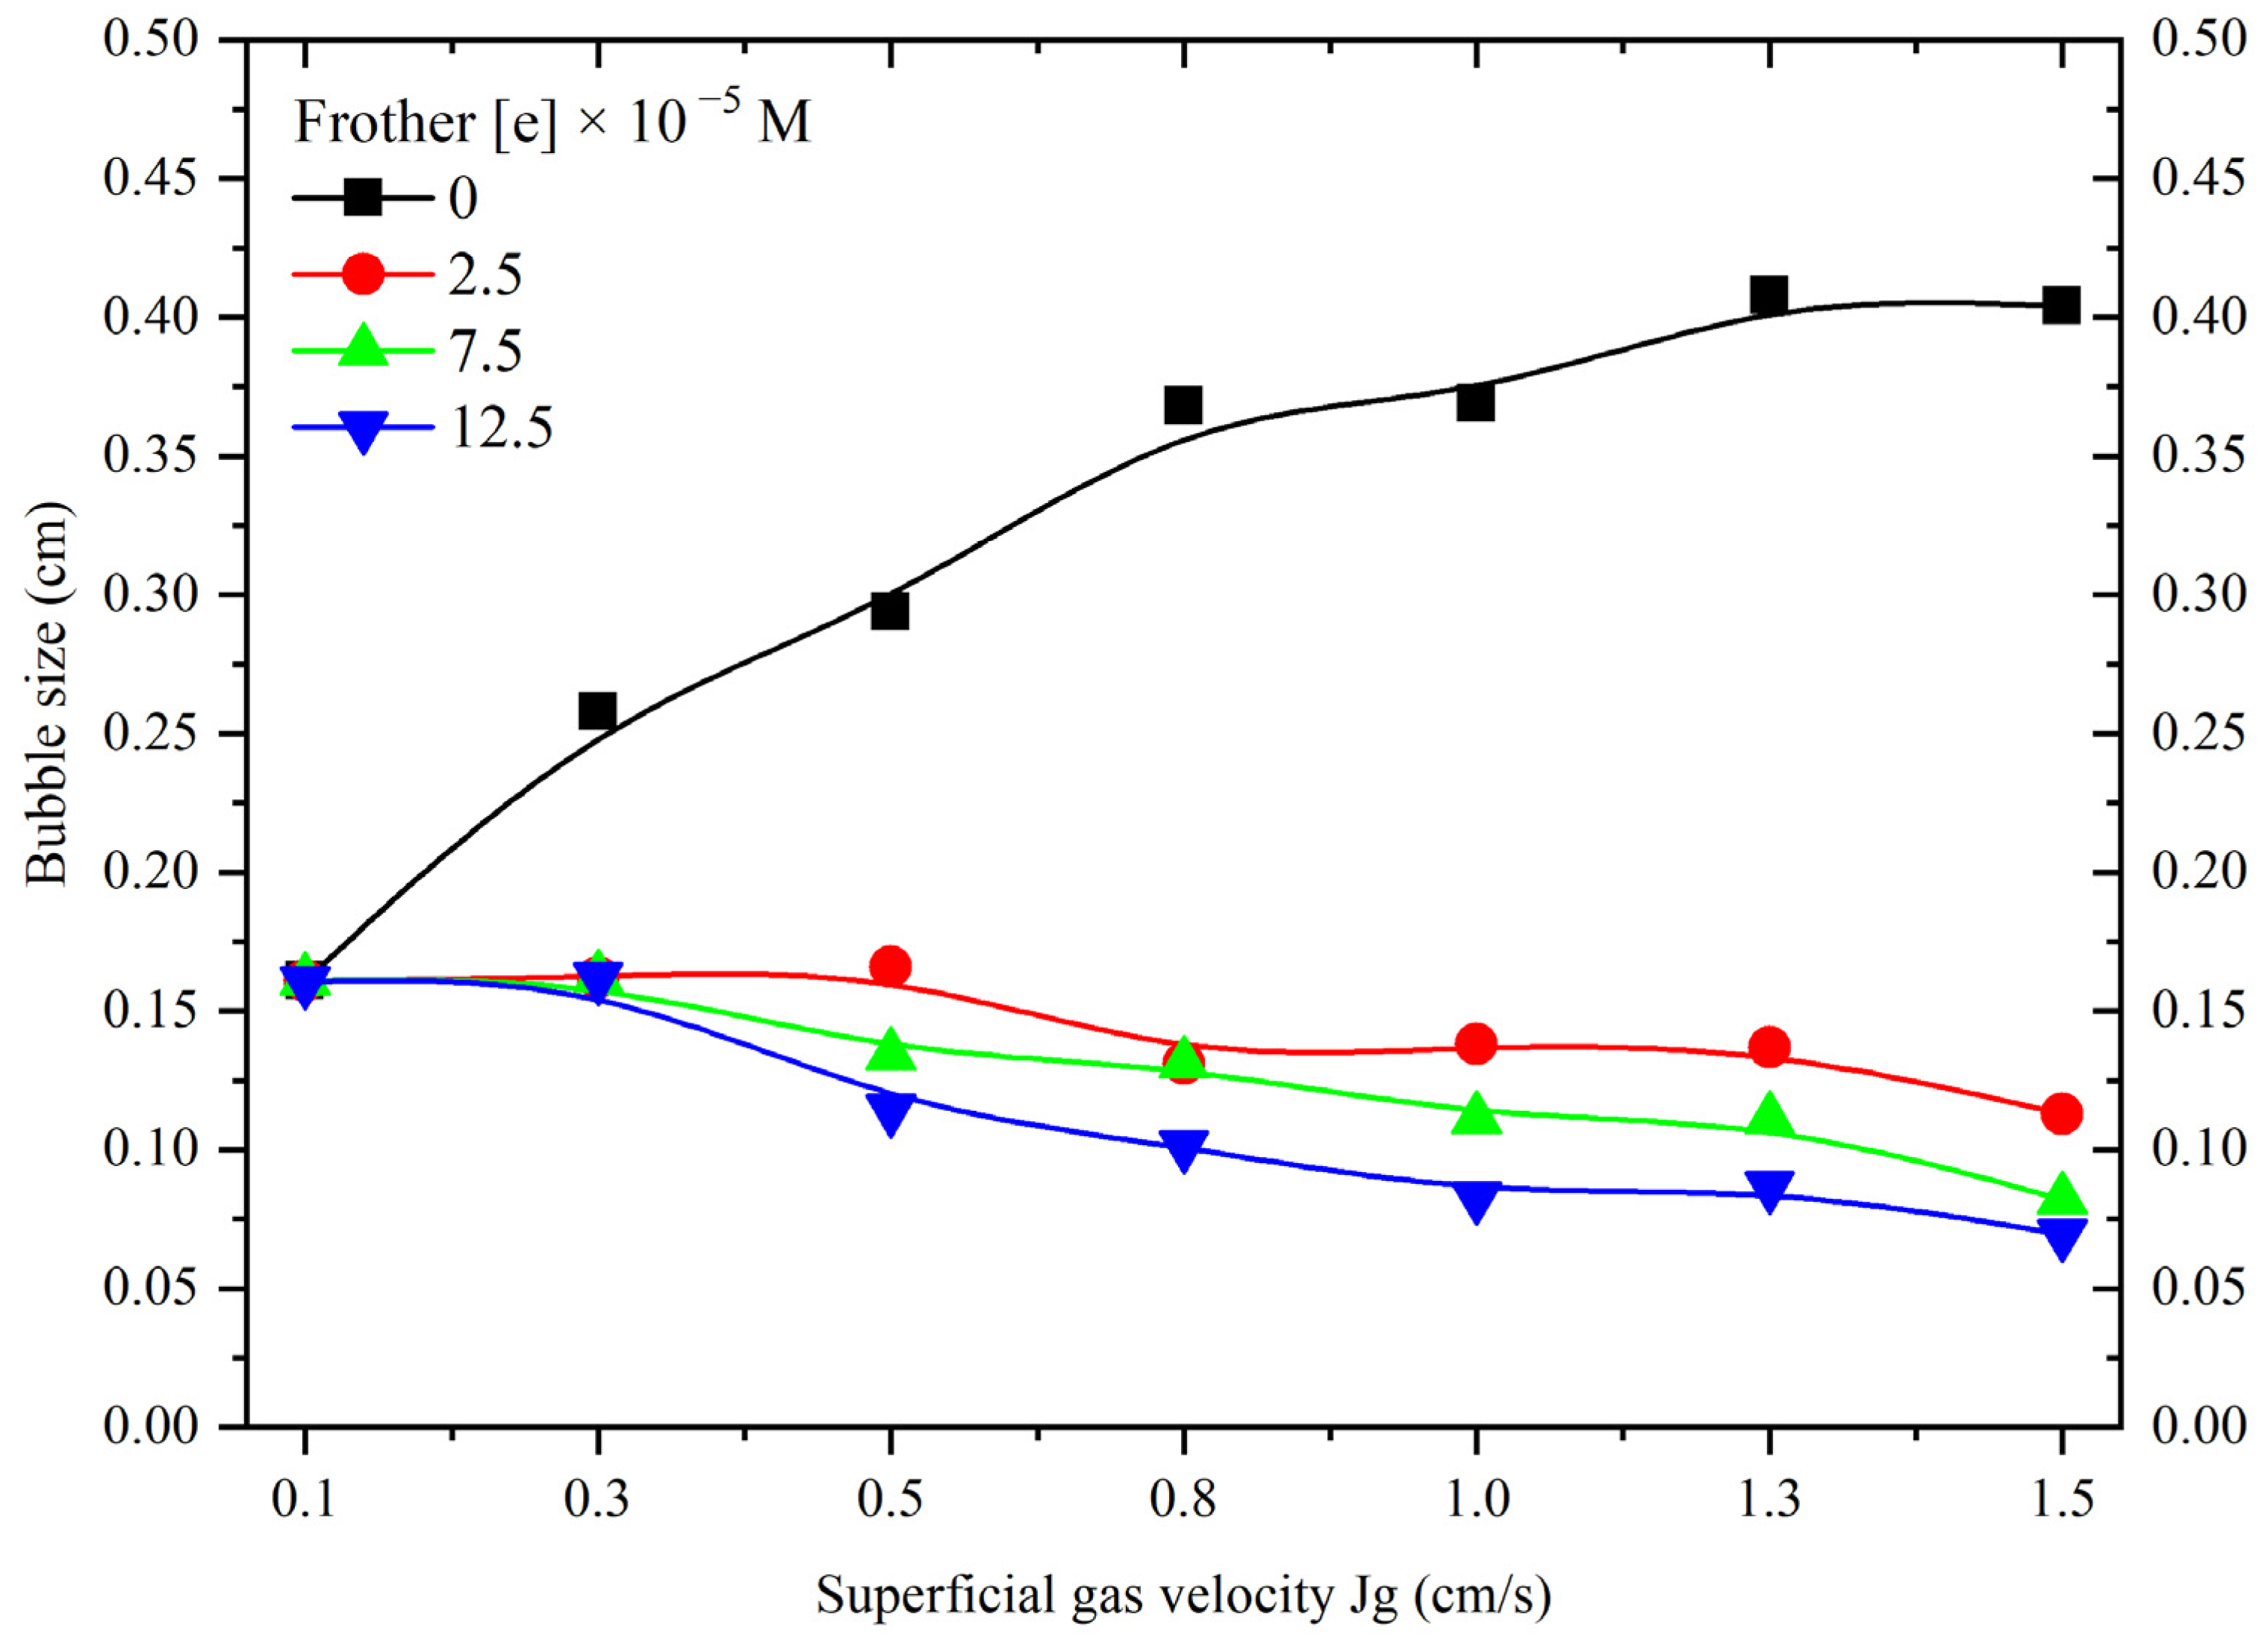
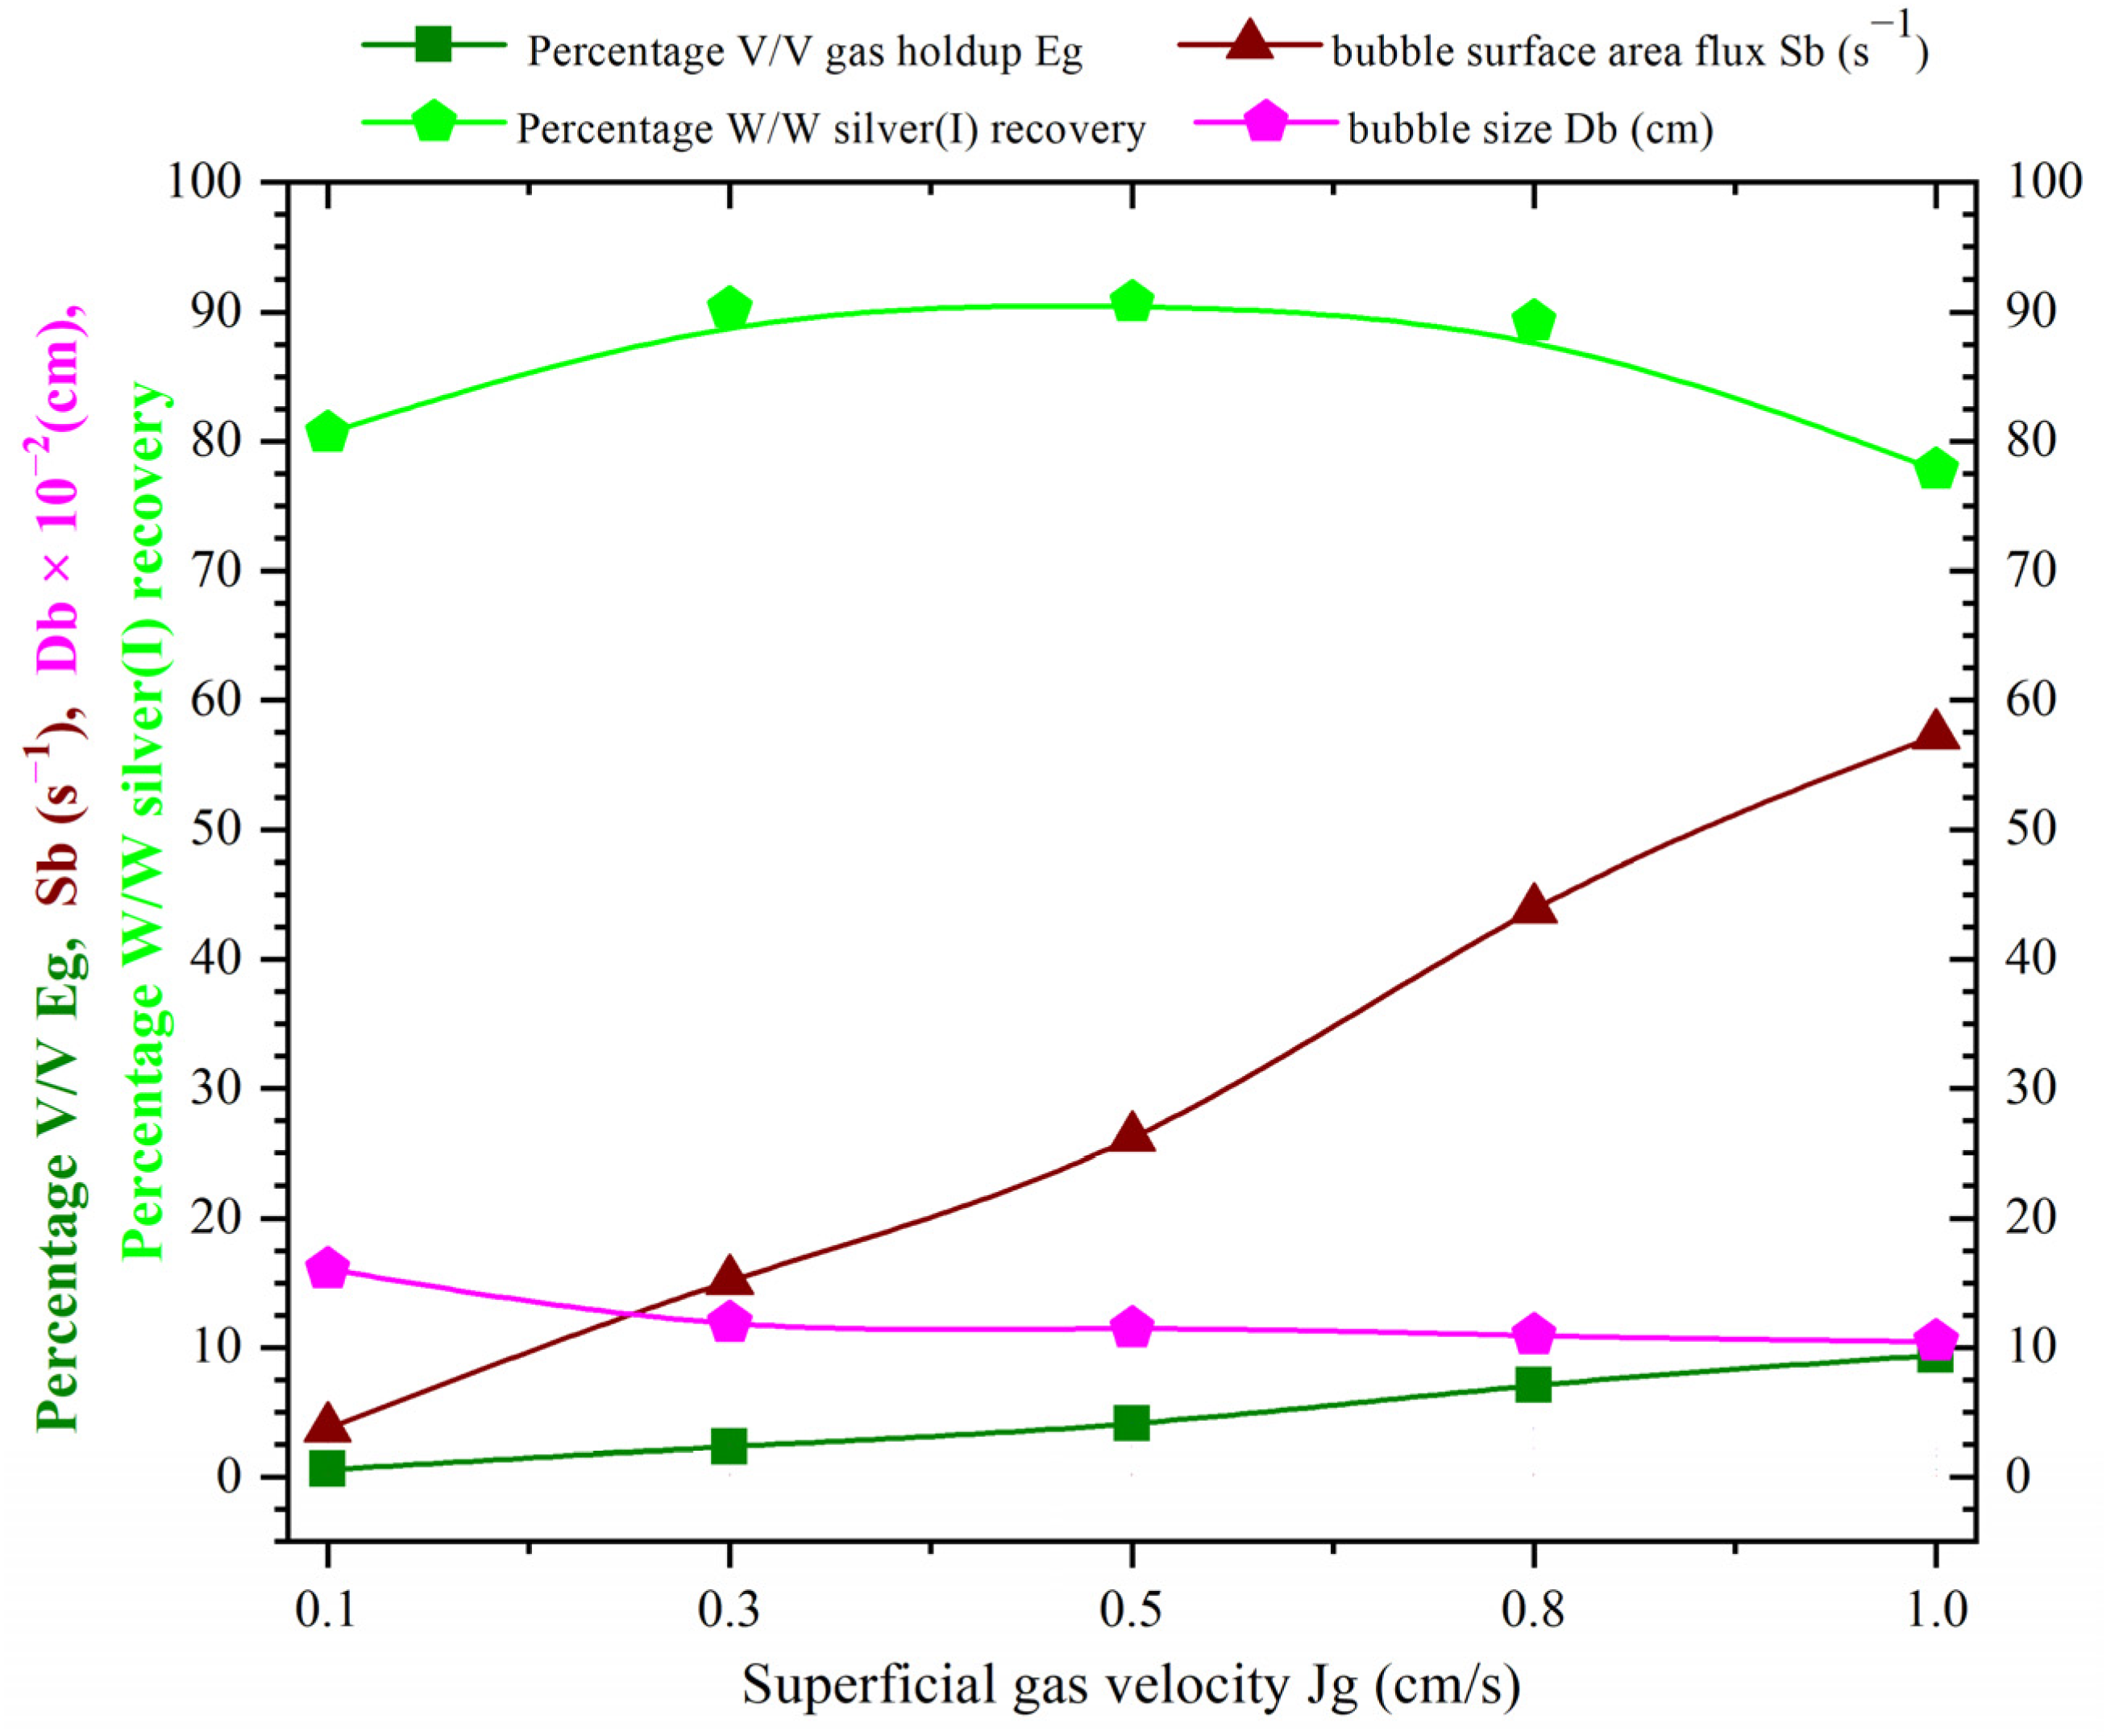
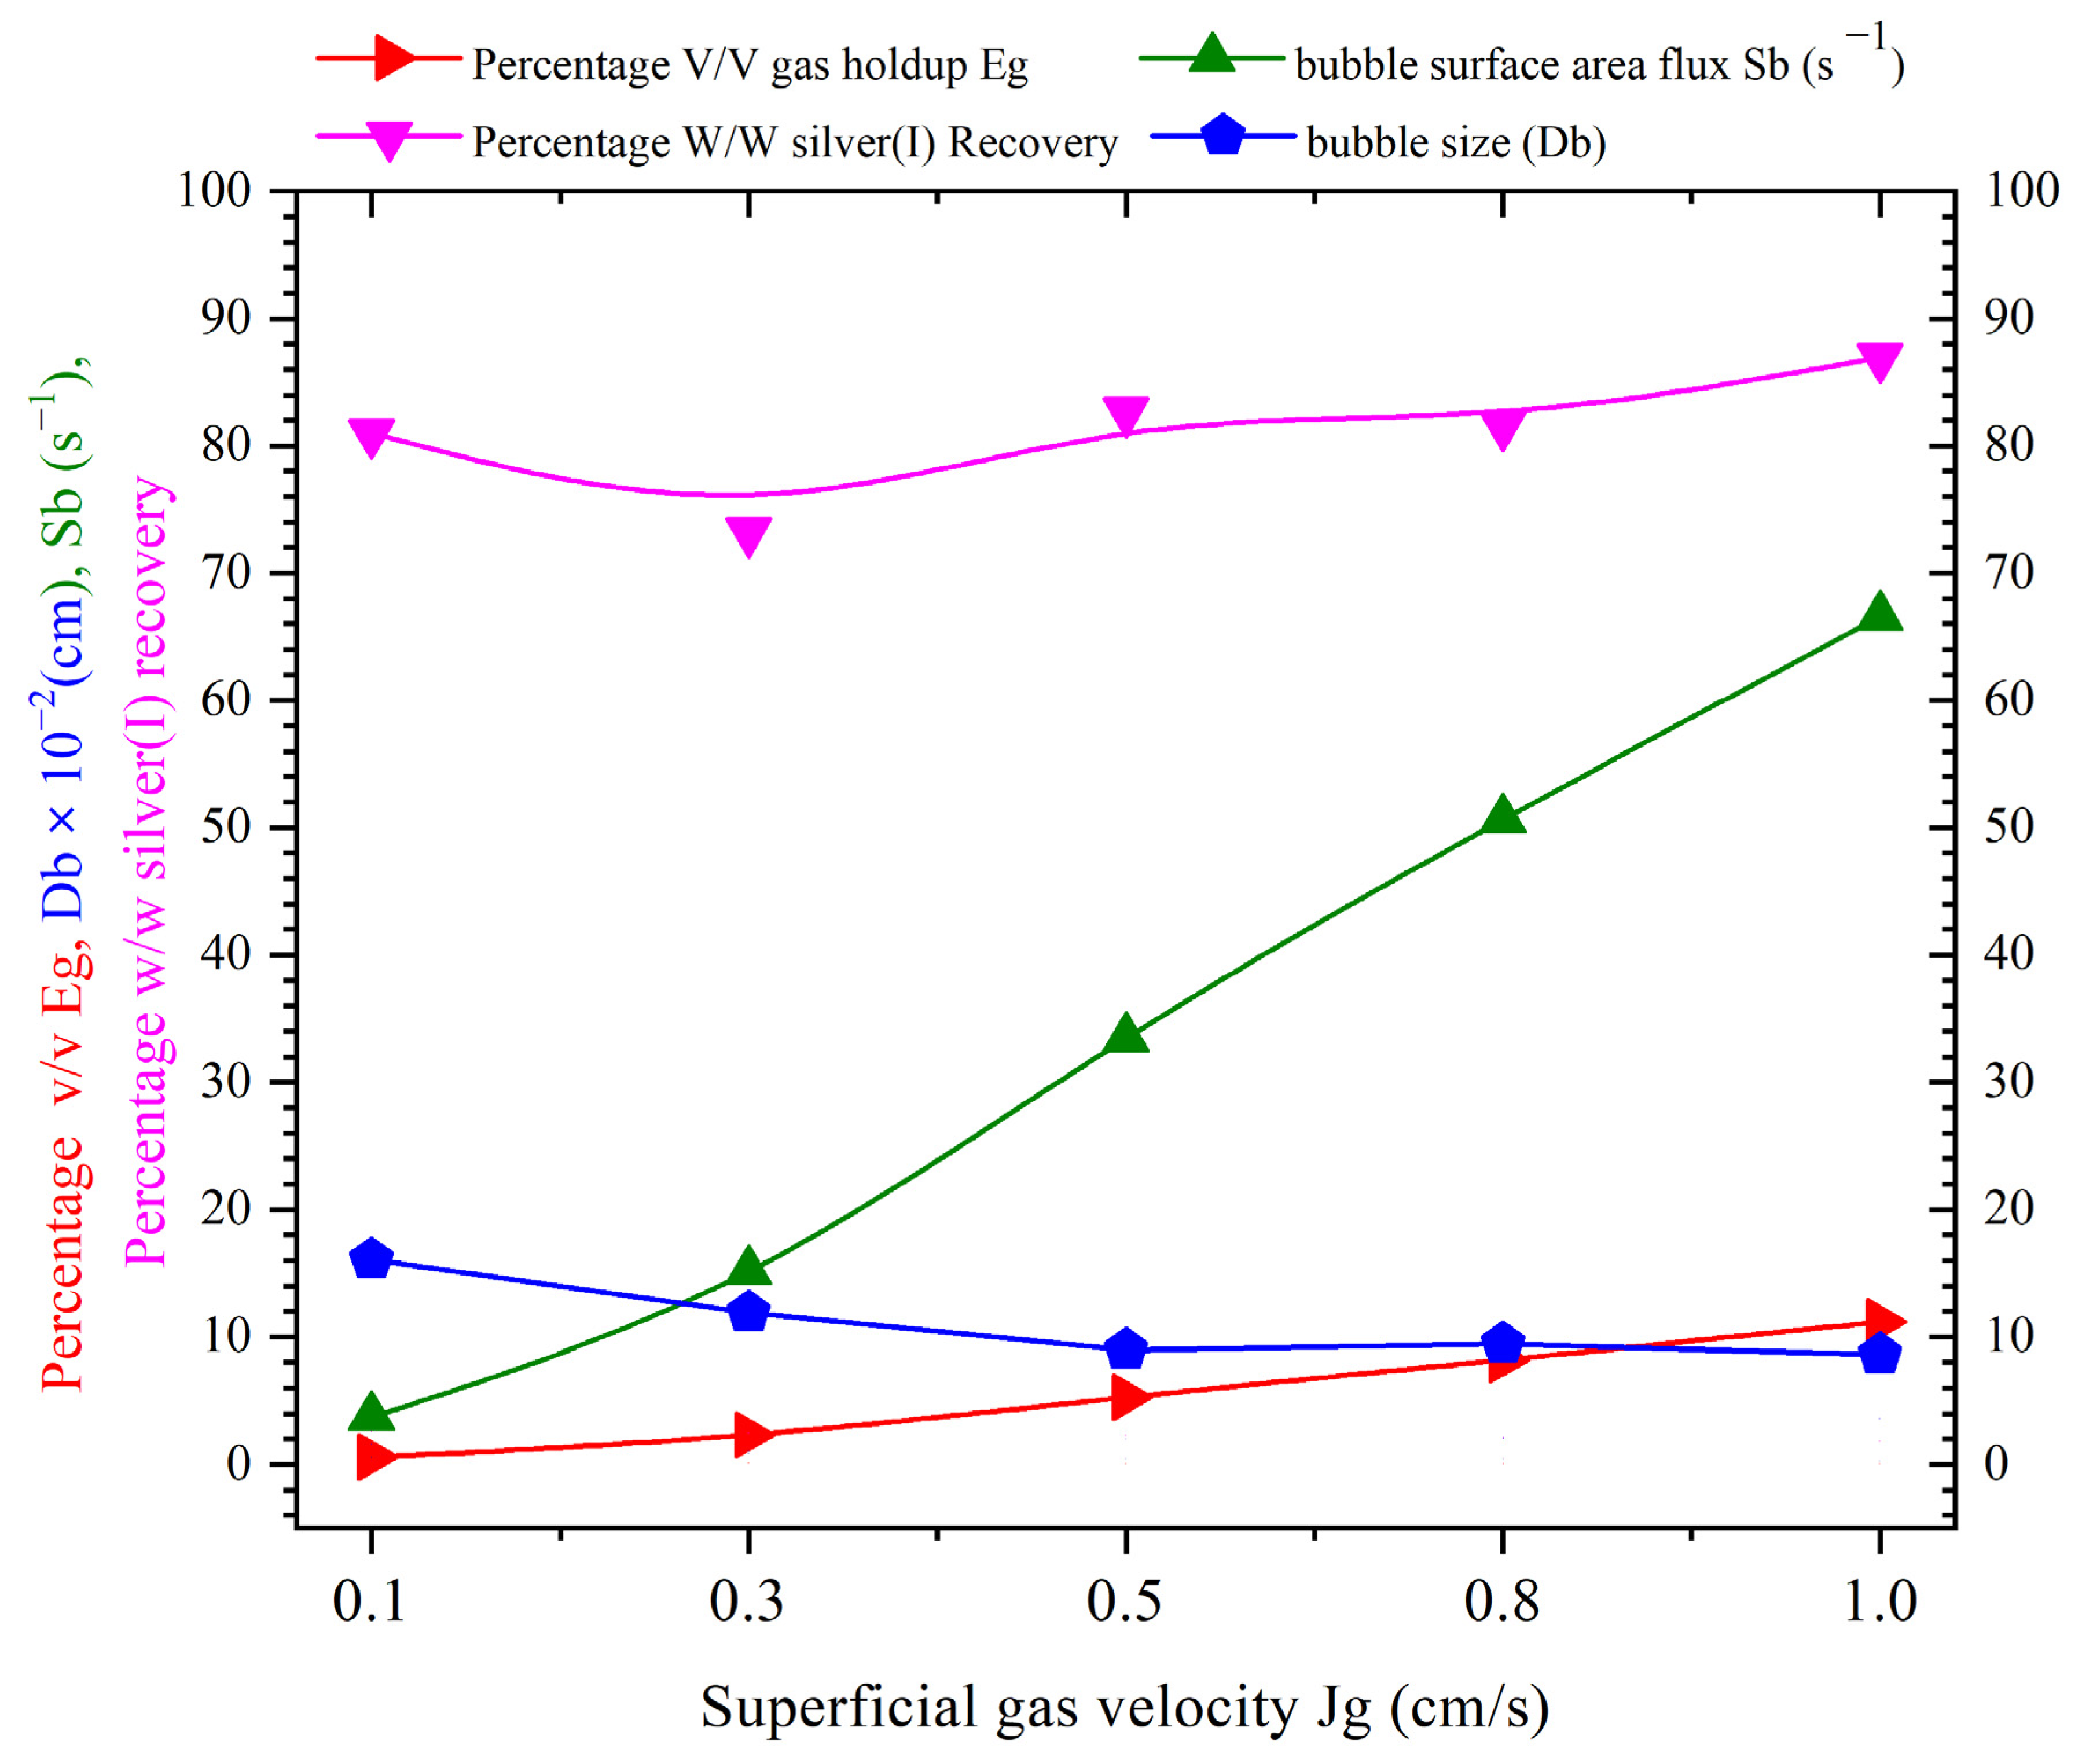
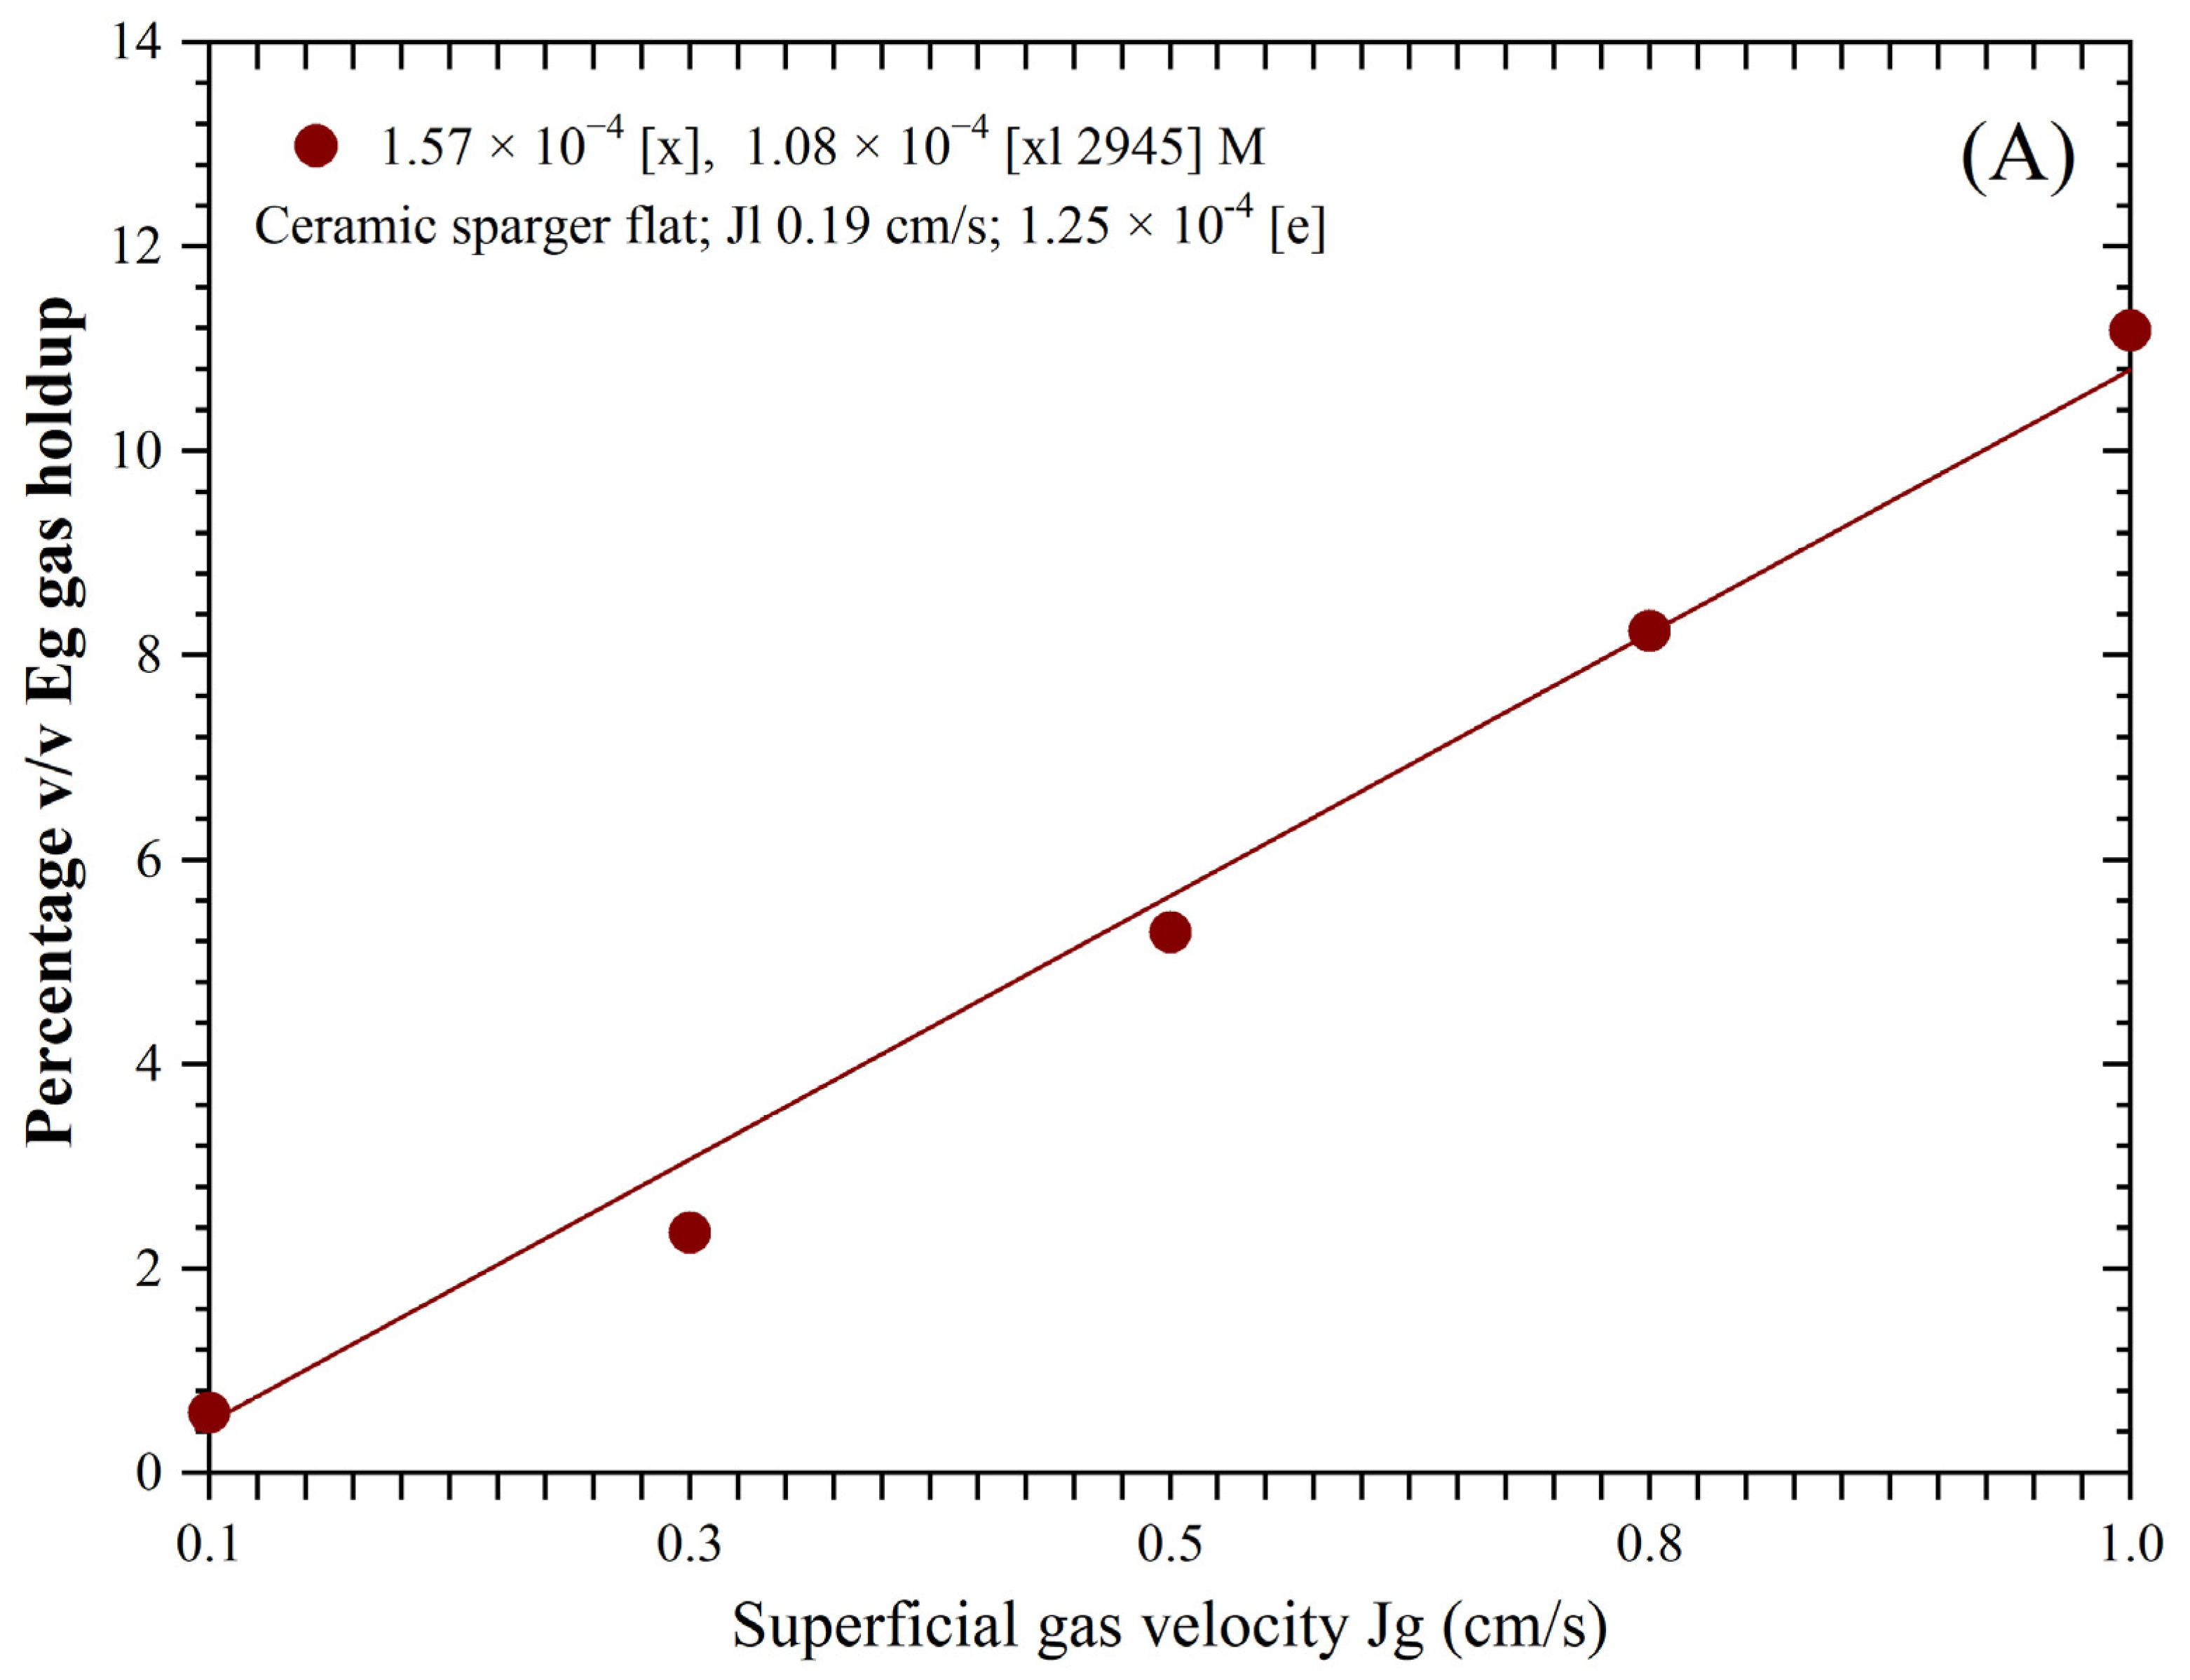
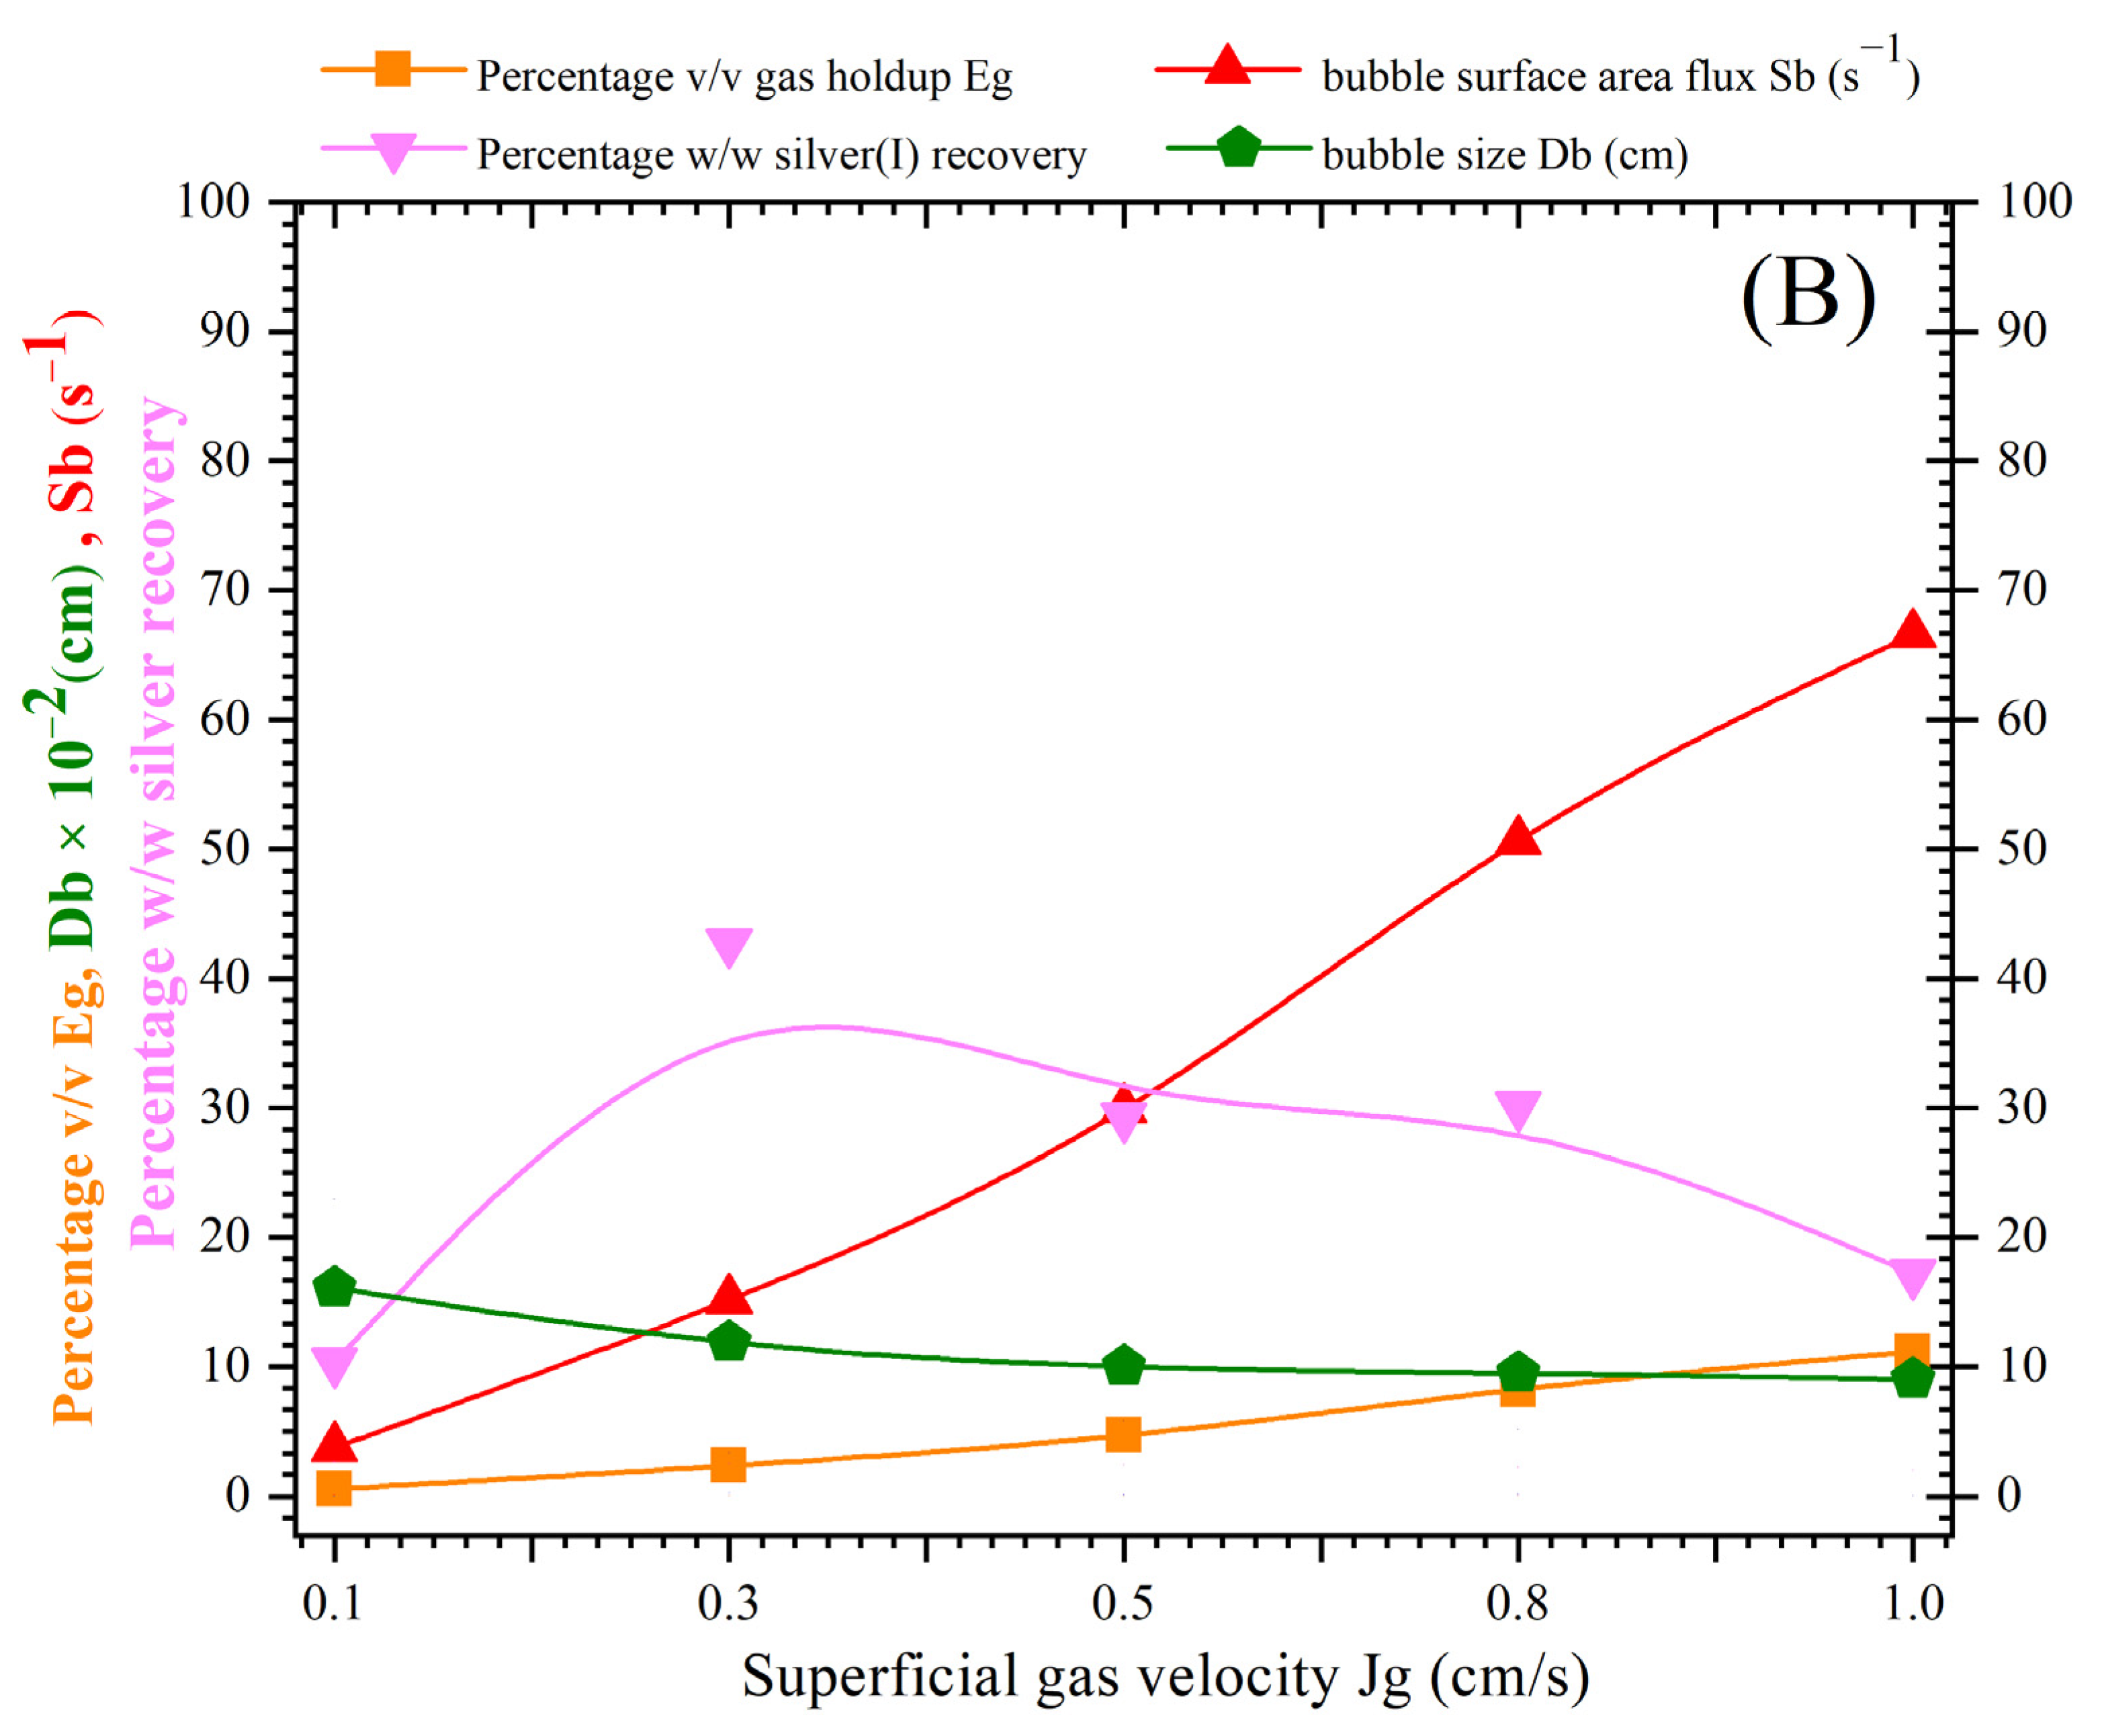
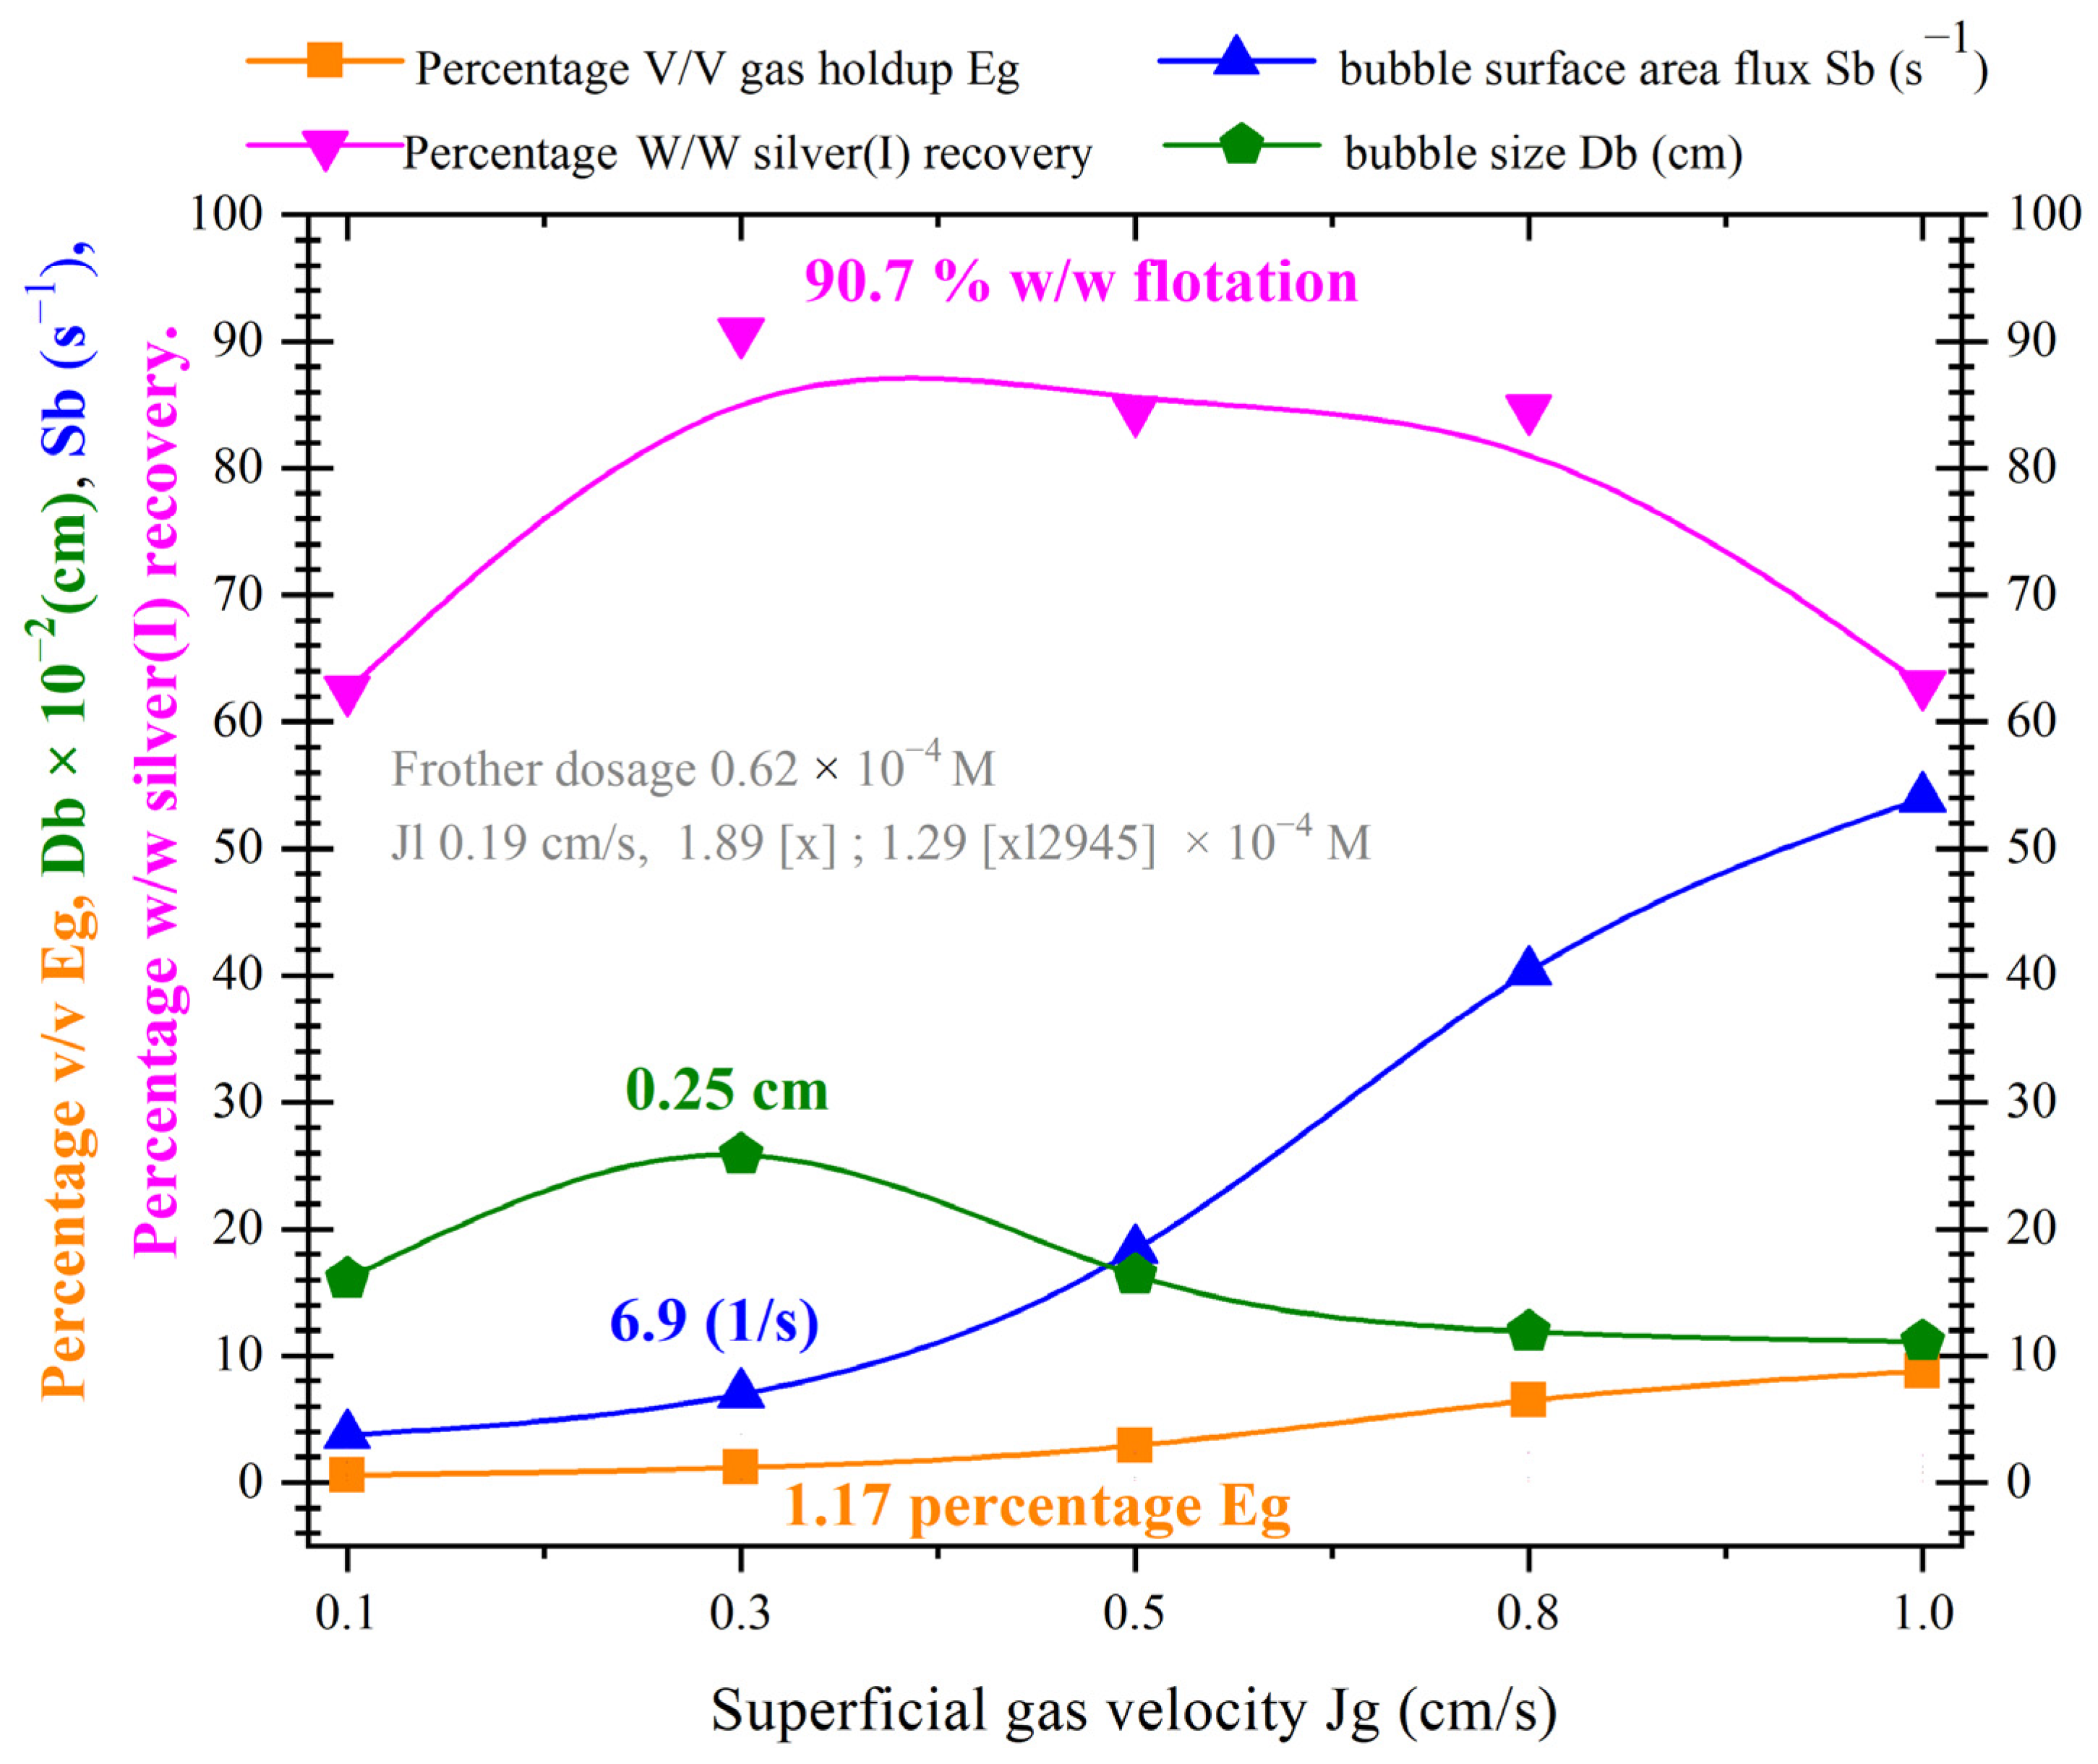
3.1. Flotation Cell Hydrodynamic Characterization
3.2. Ion Silver(I) Flotation
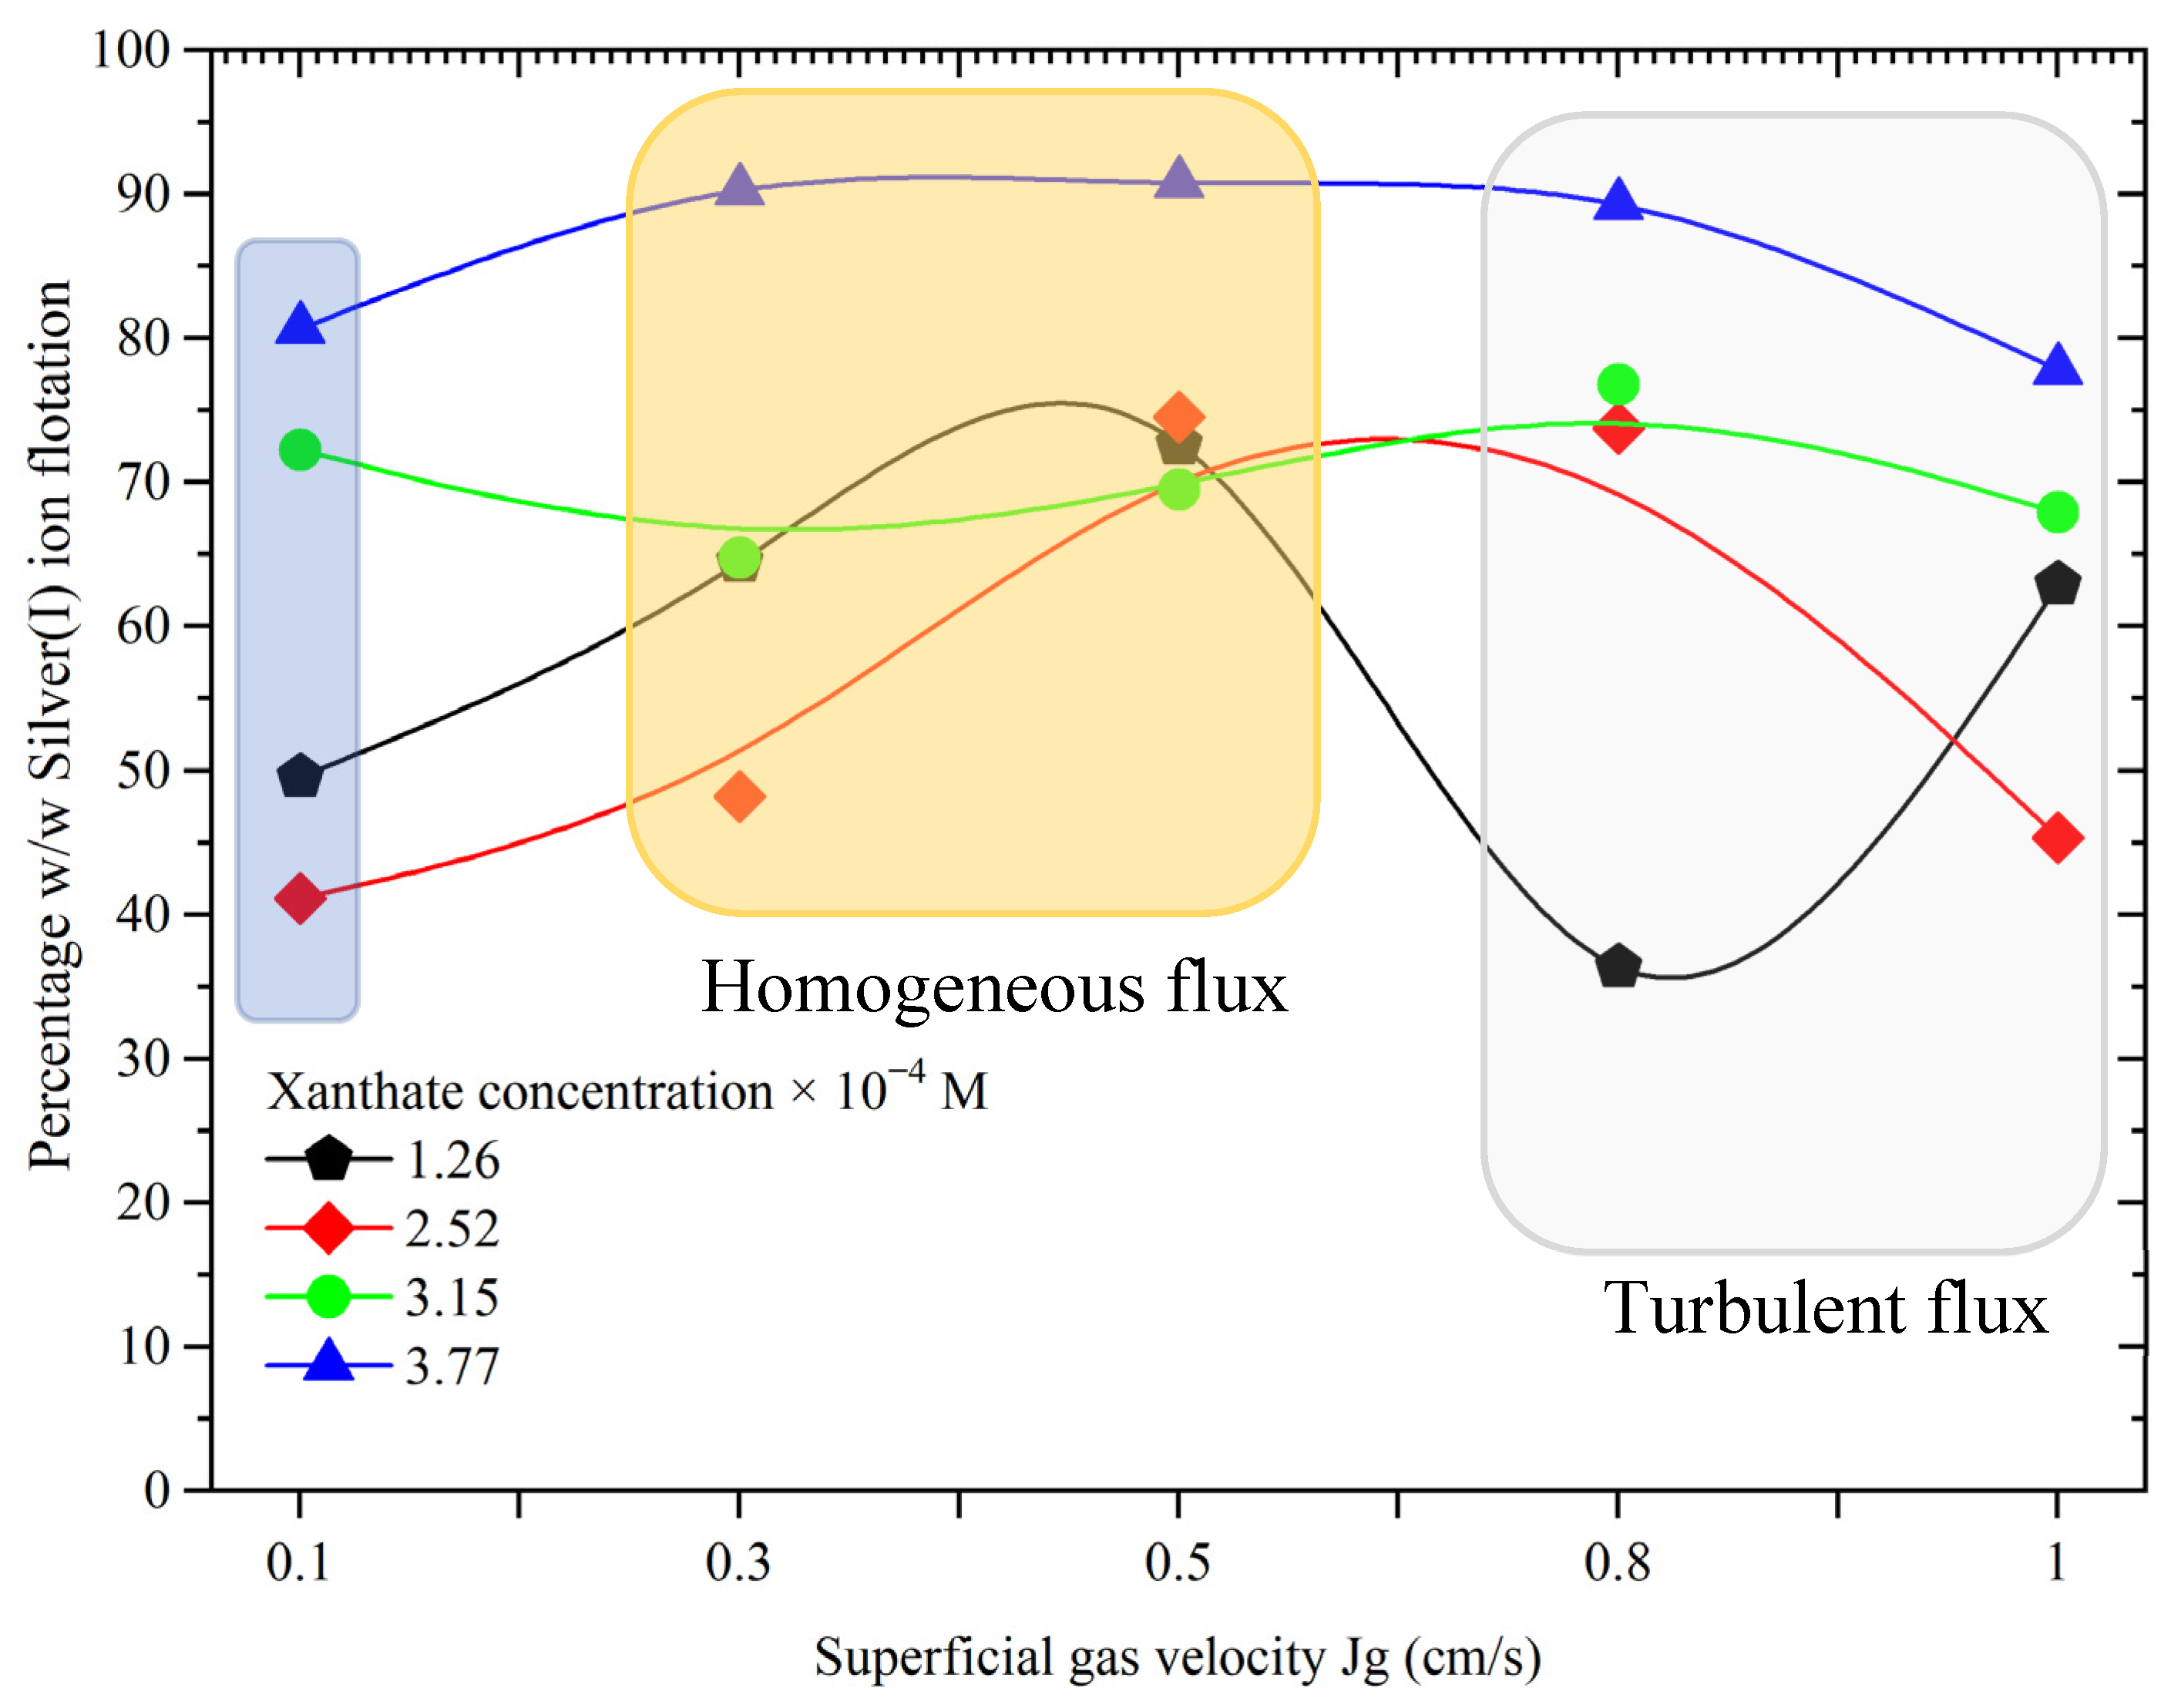
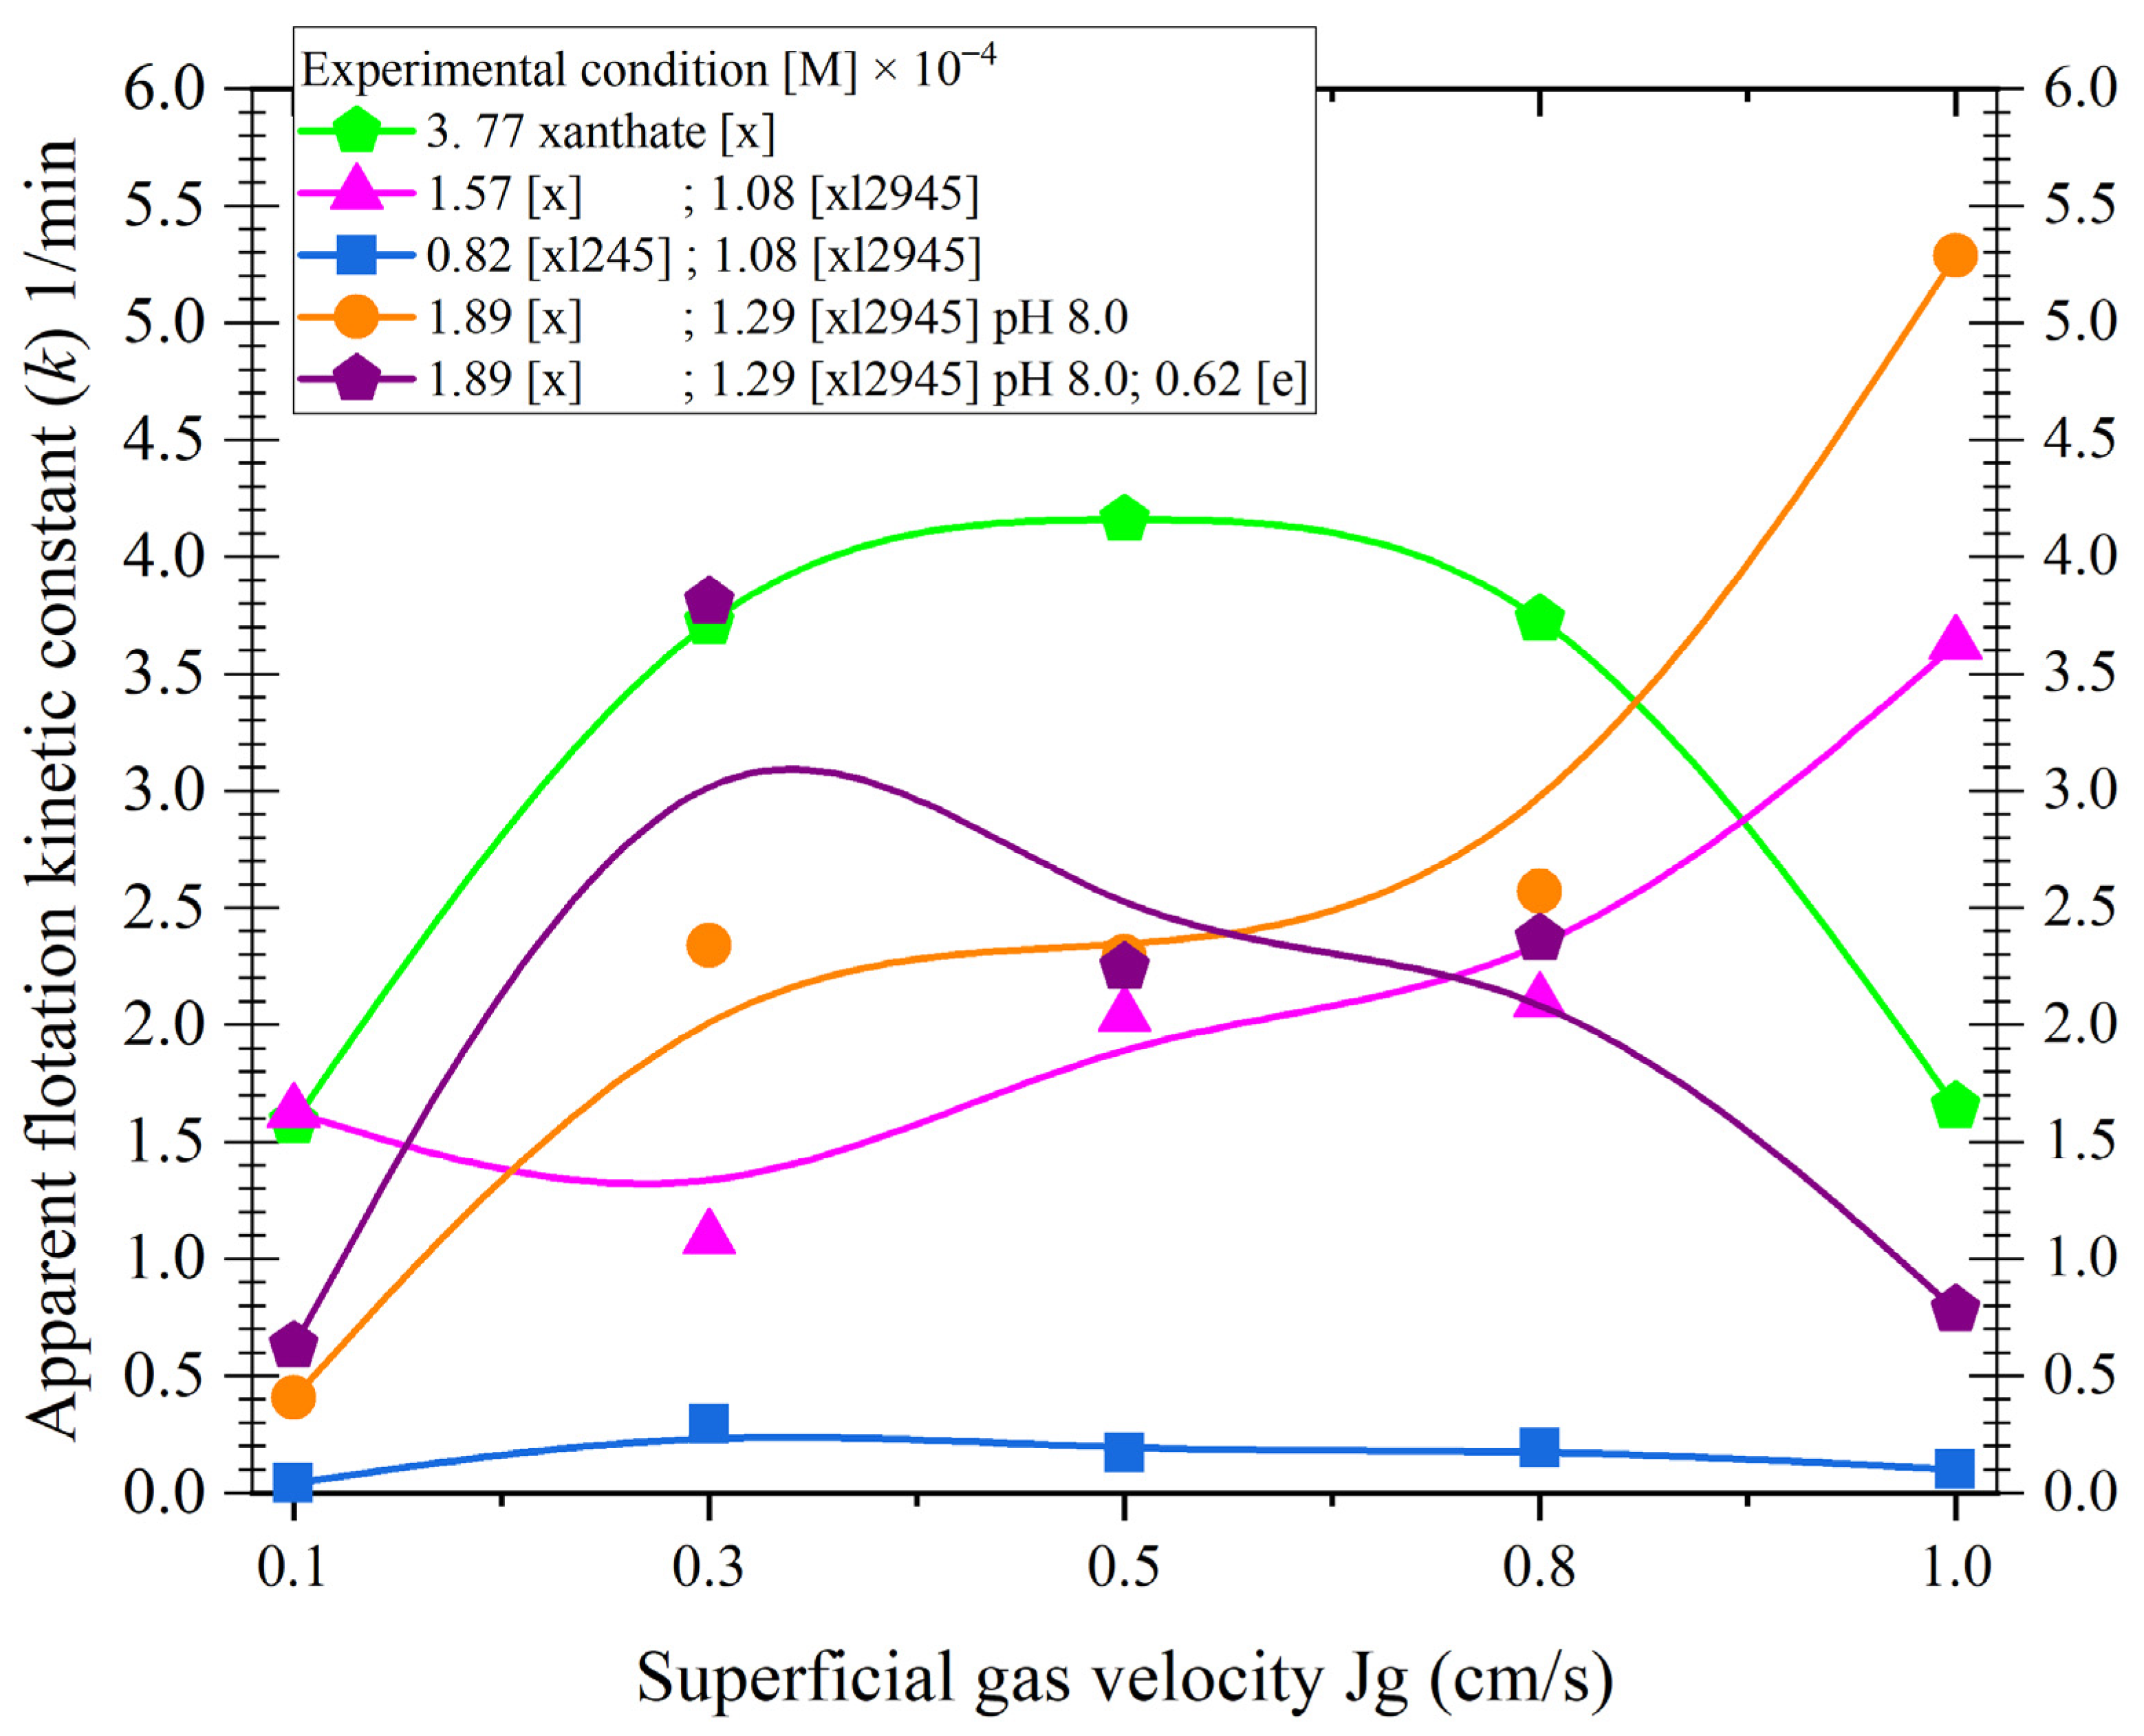
3.2.1. Effect of the Collector Concentration
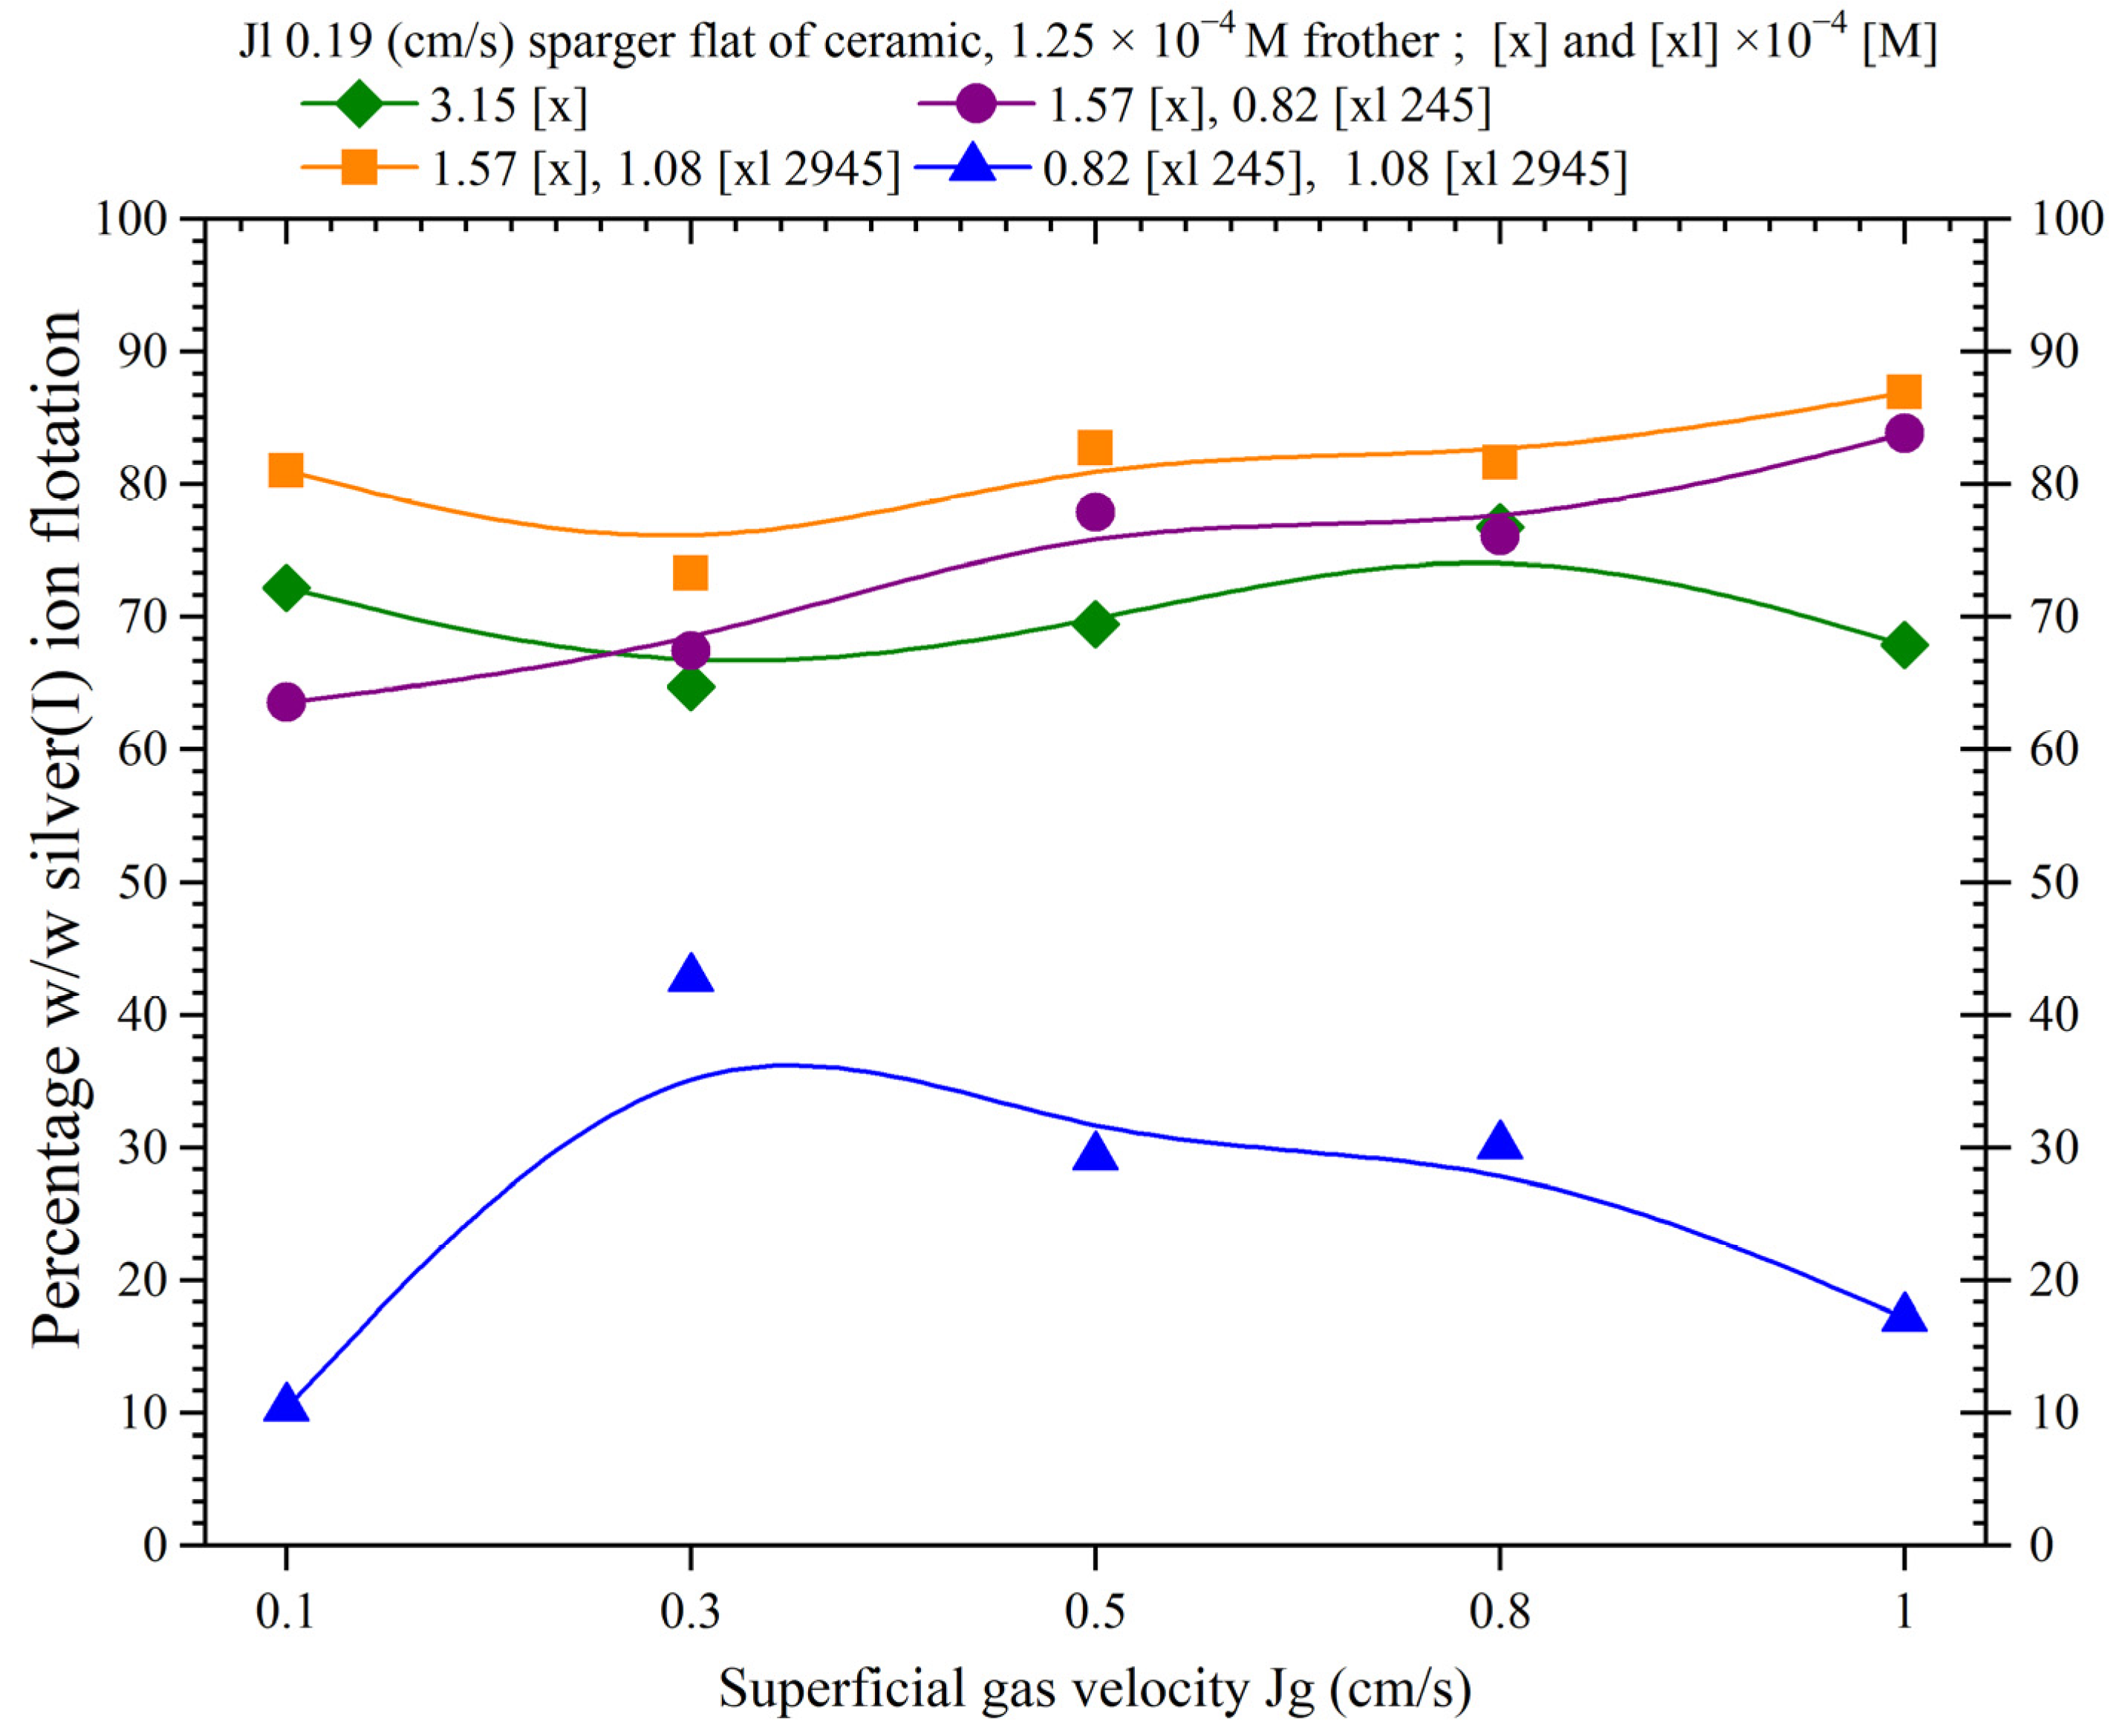
3.2.2. Collector—Promoter Effect
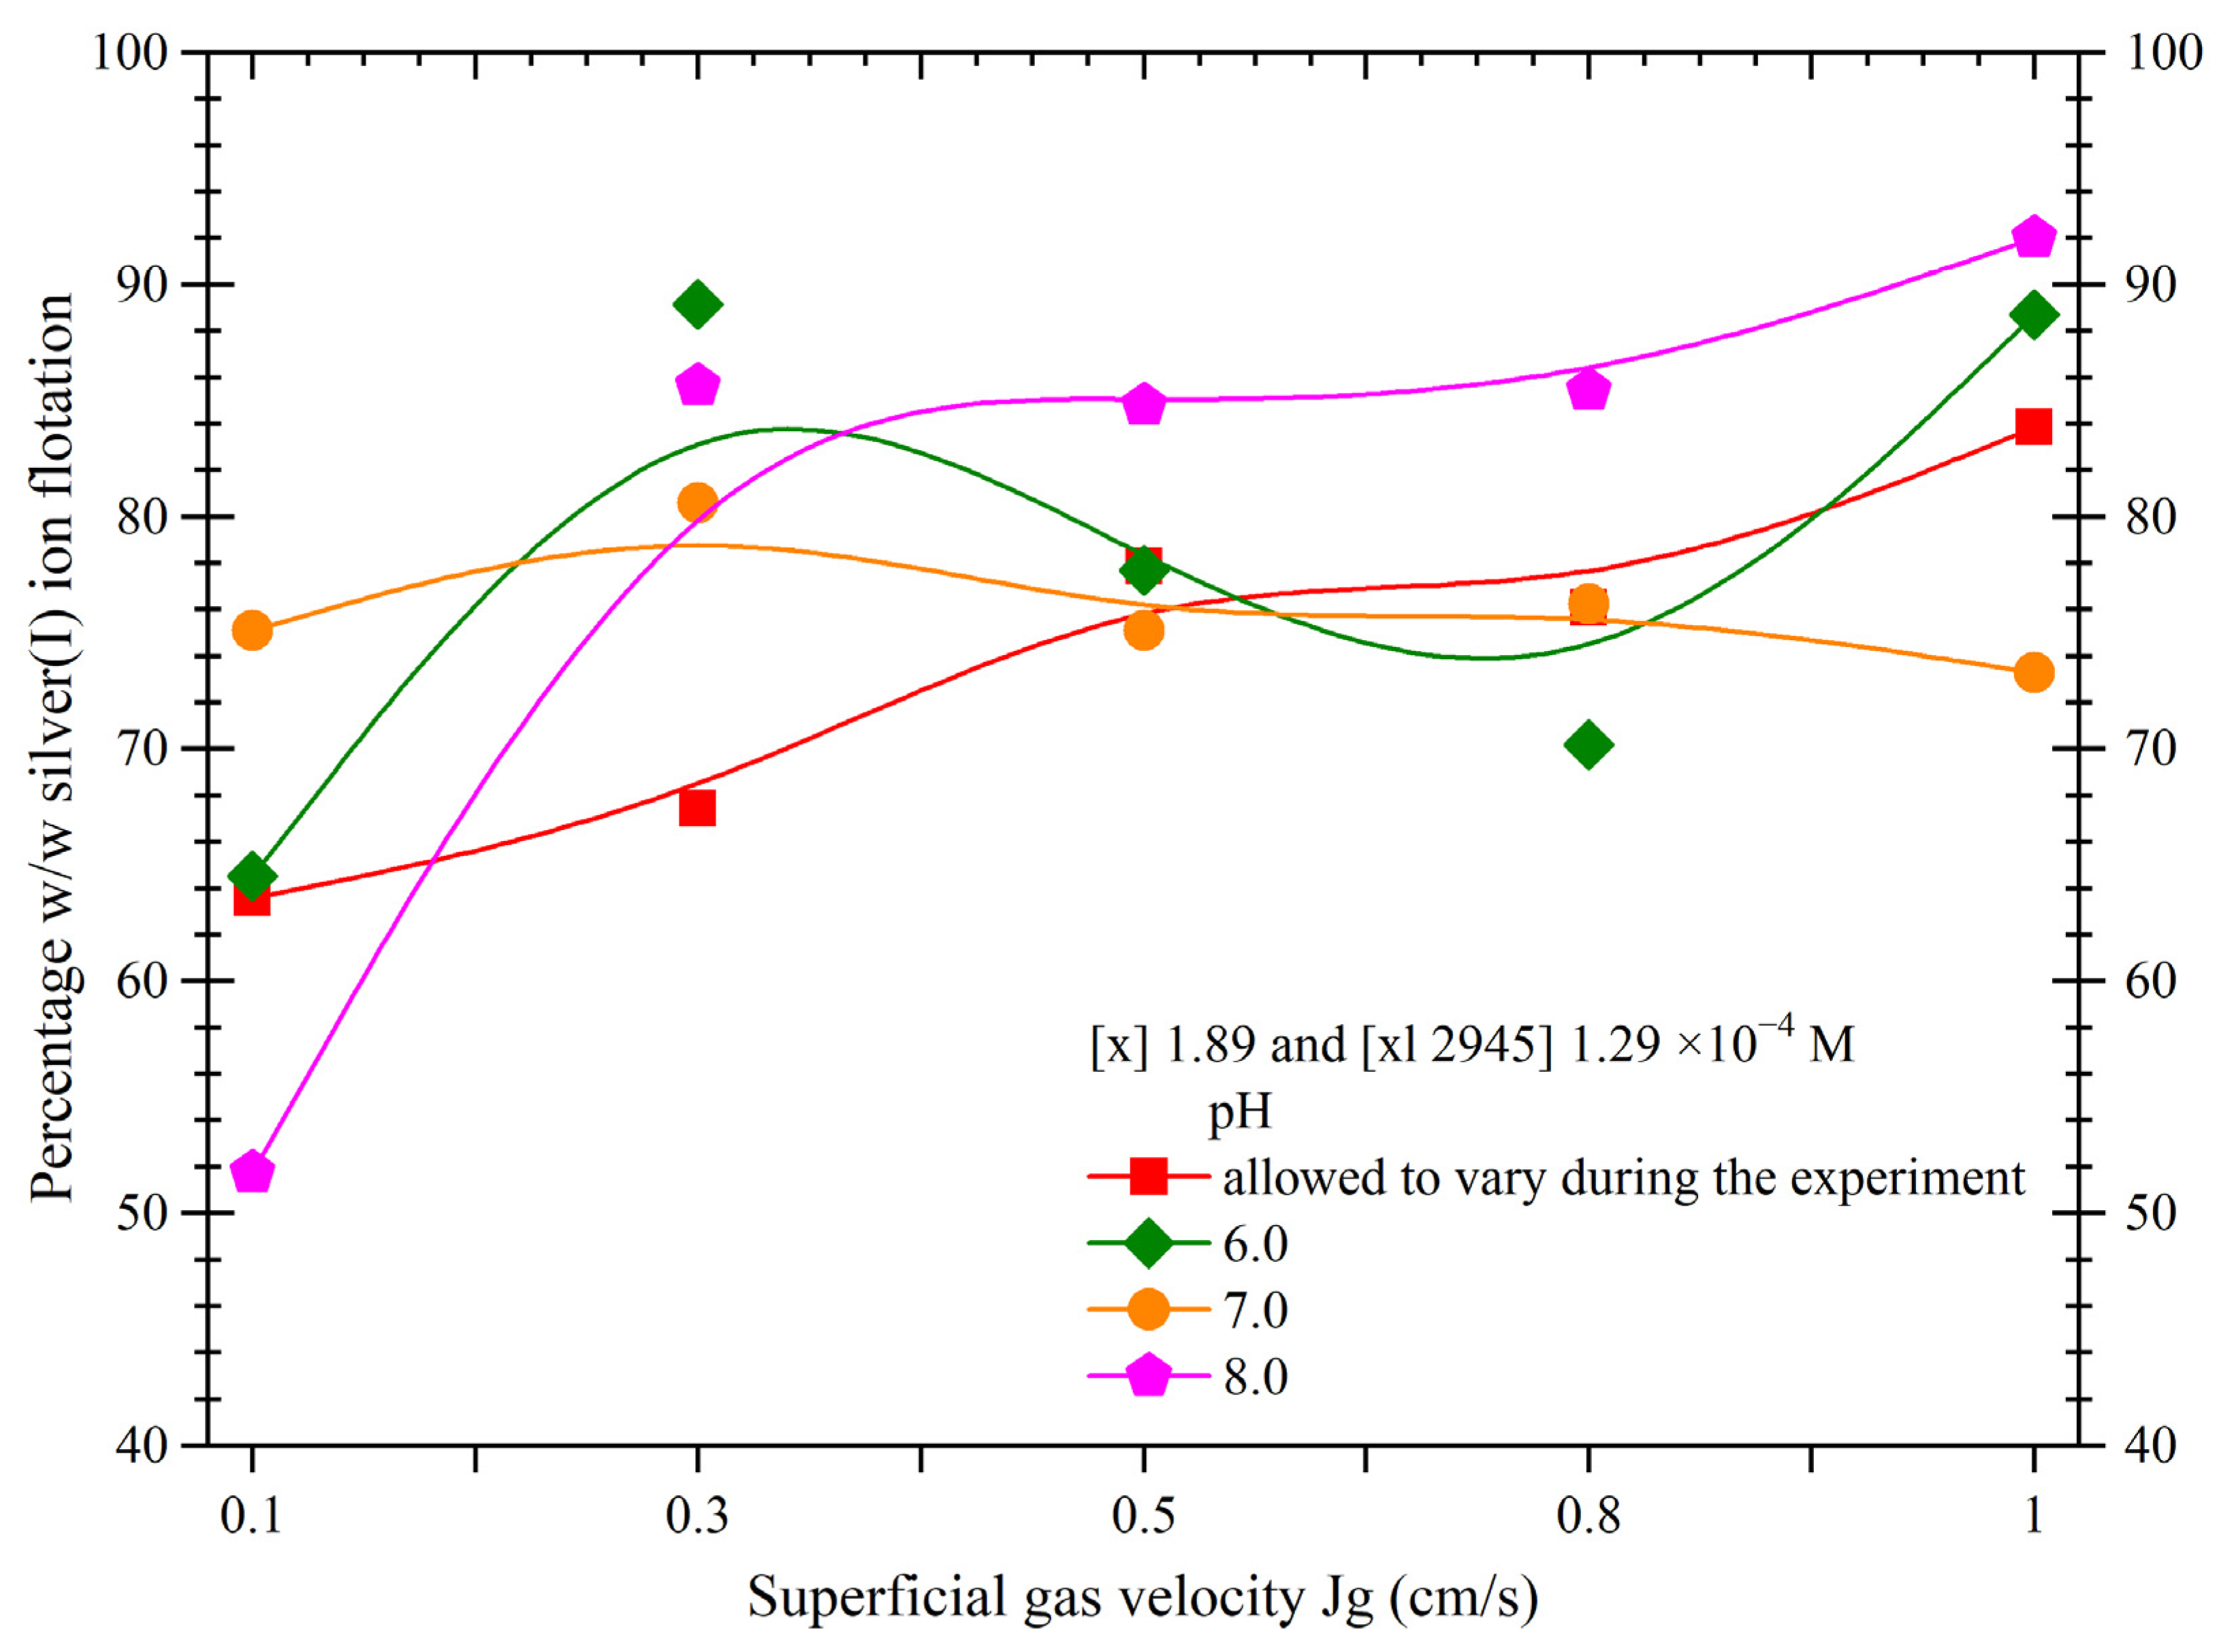
3.2.3. pH Effect
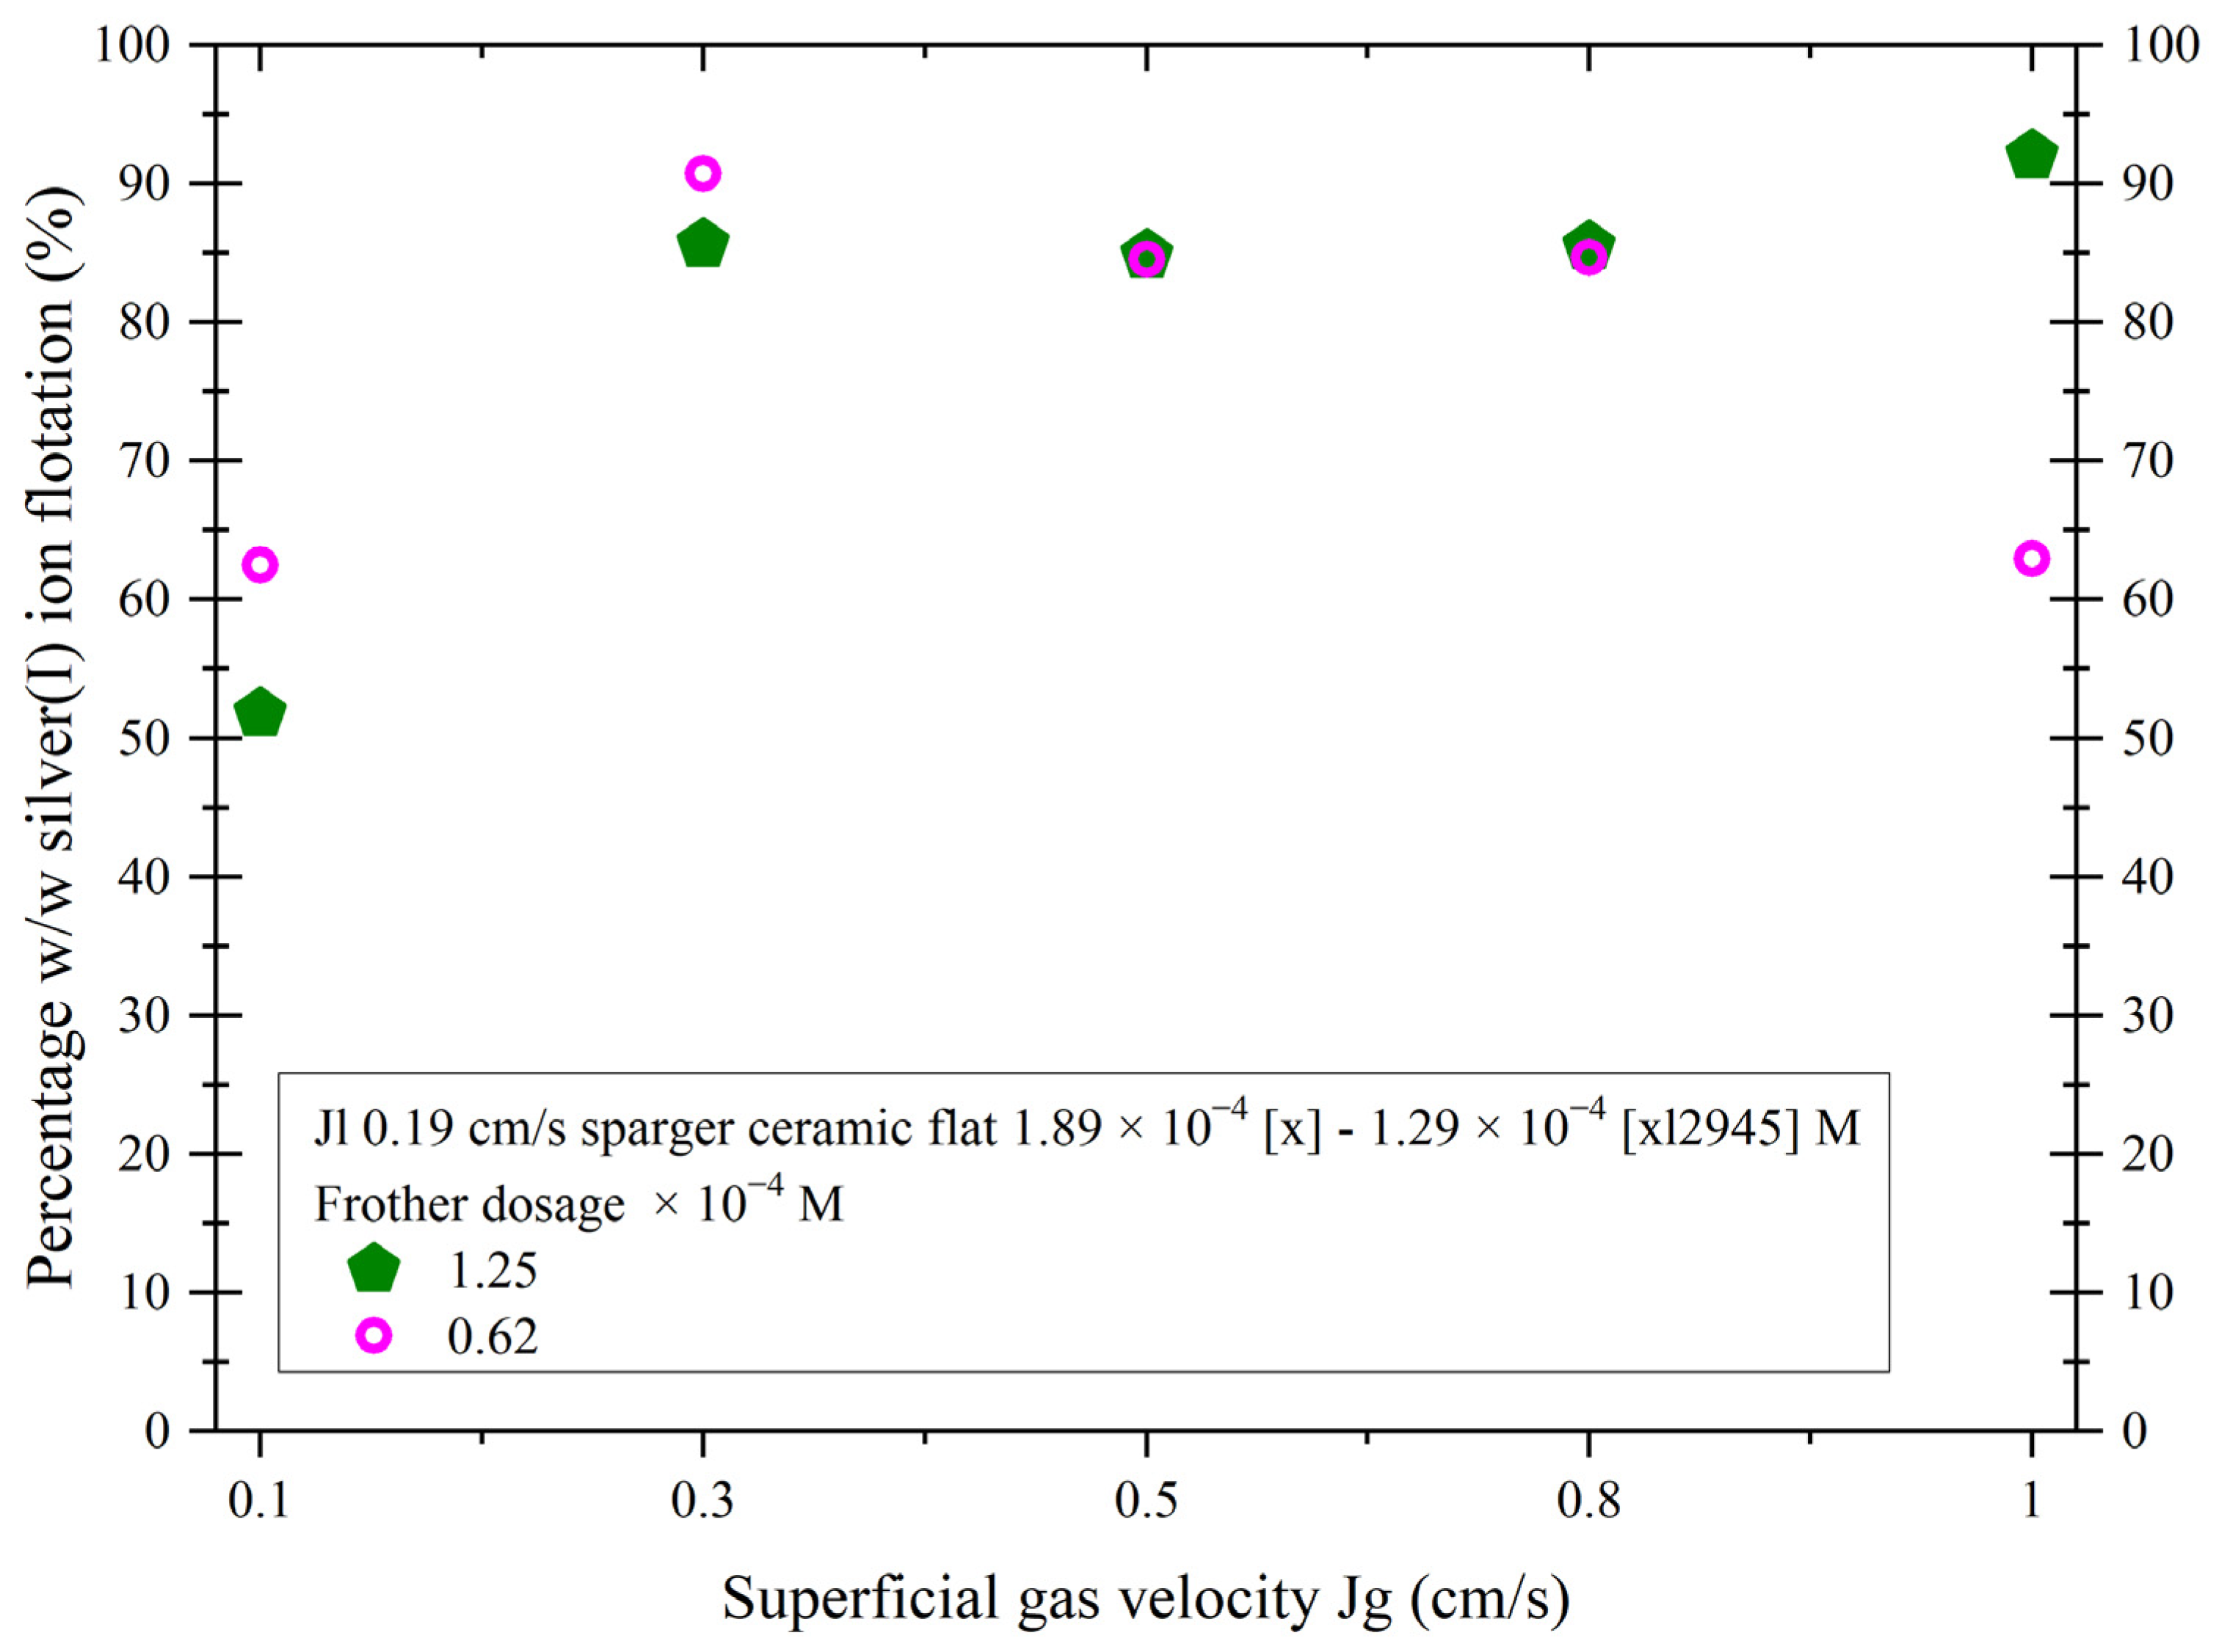
3.2.4. Frother Dosage
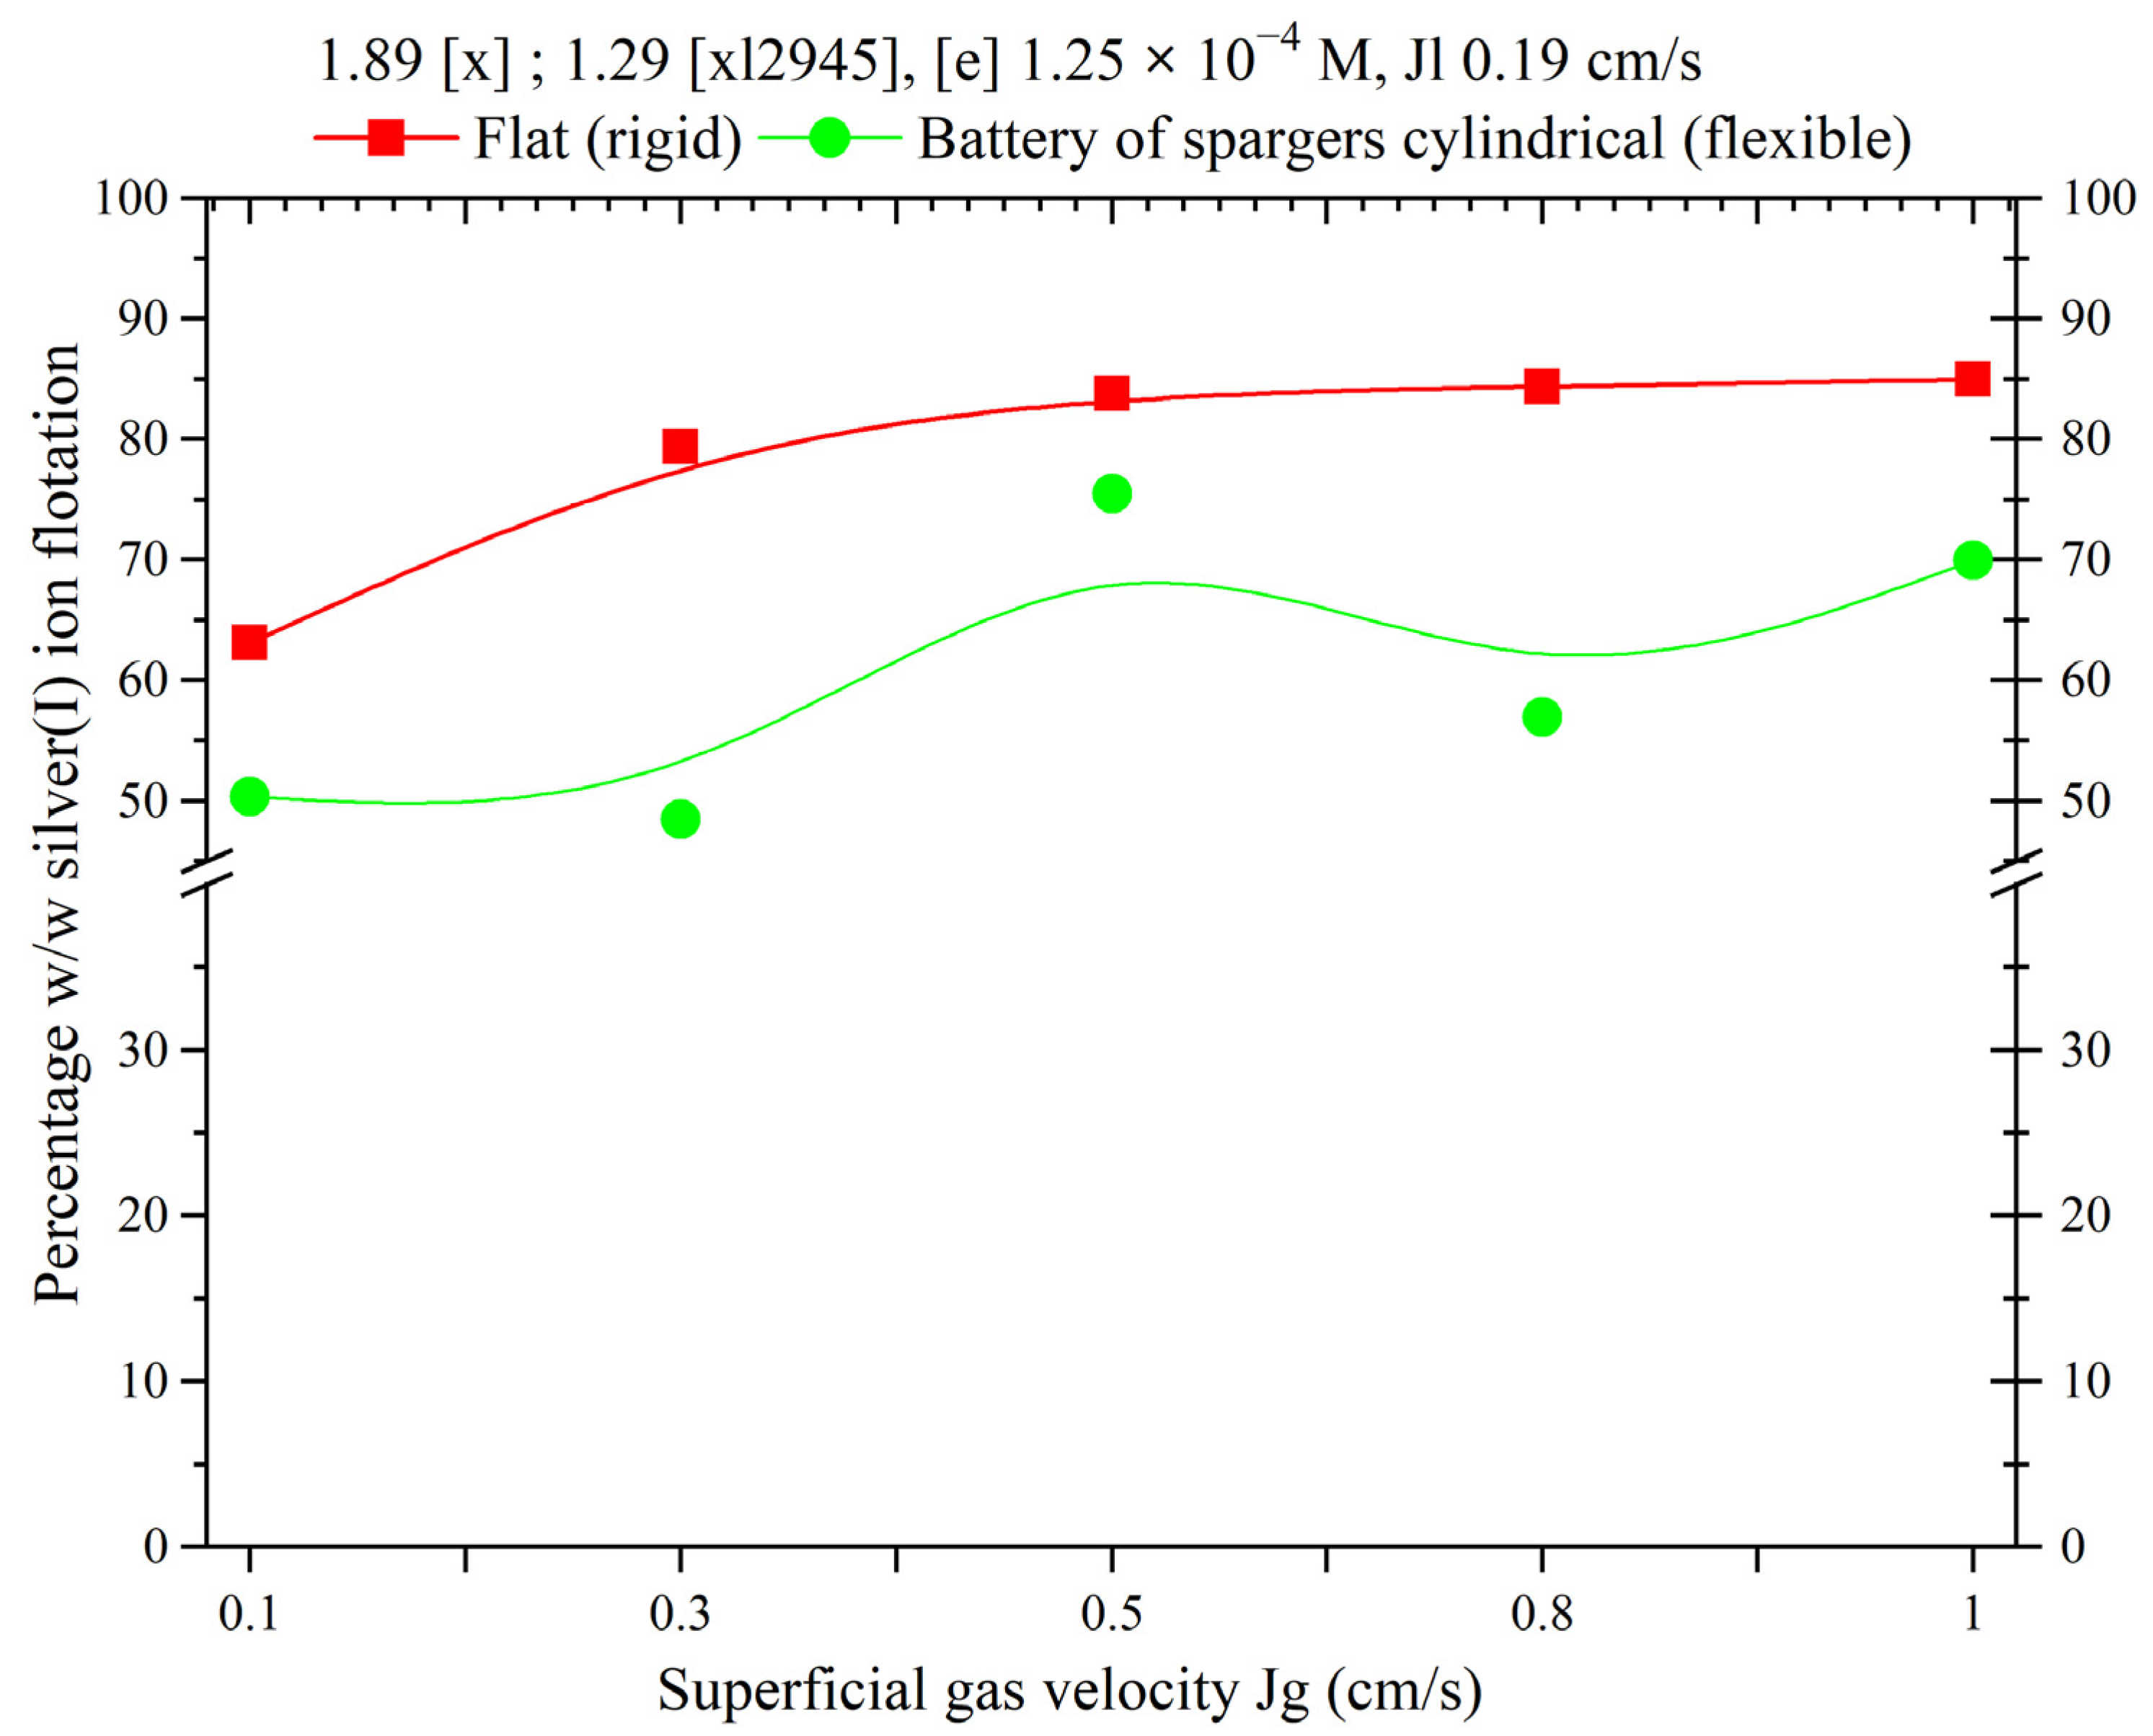
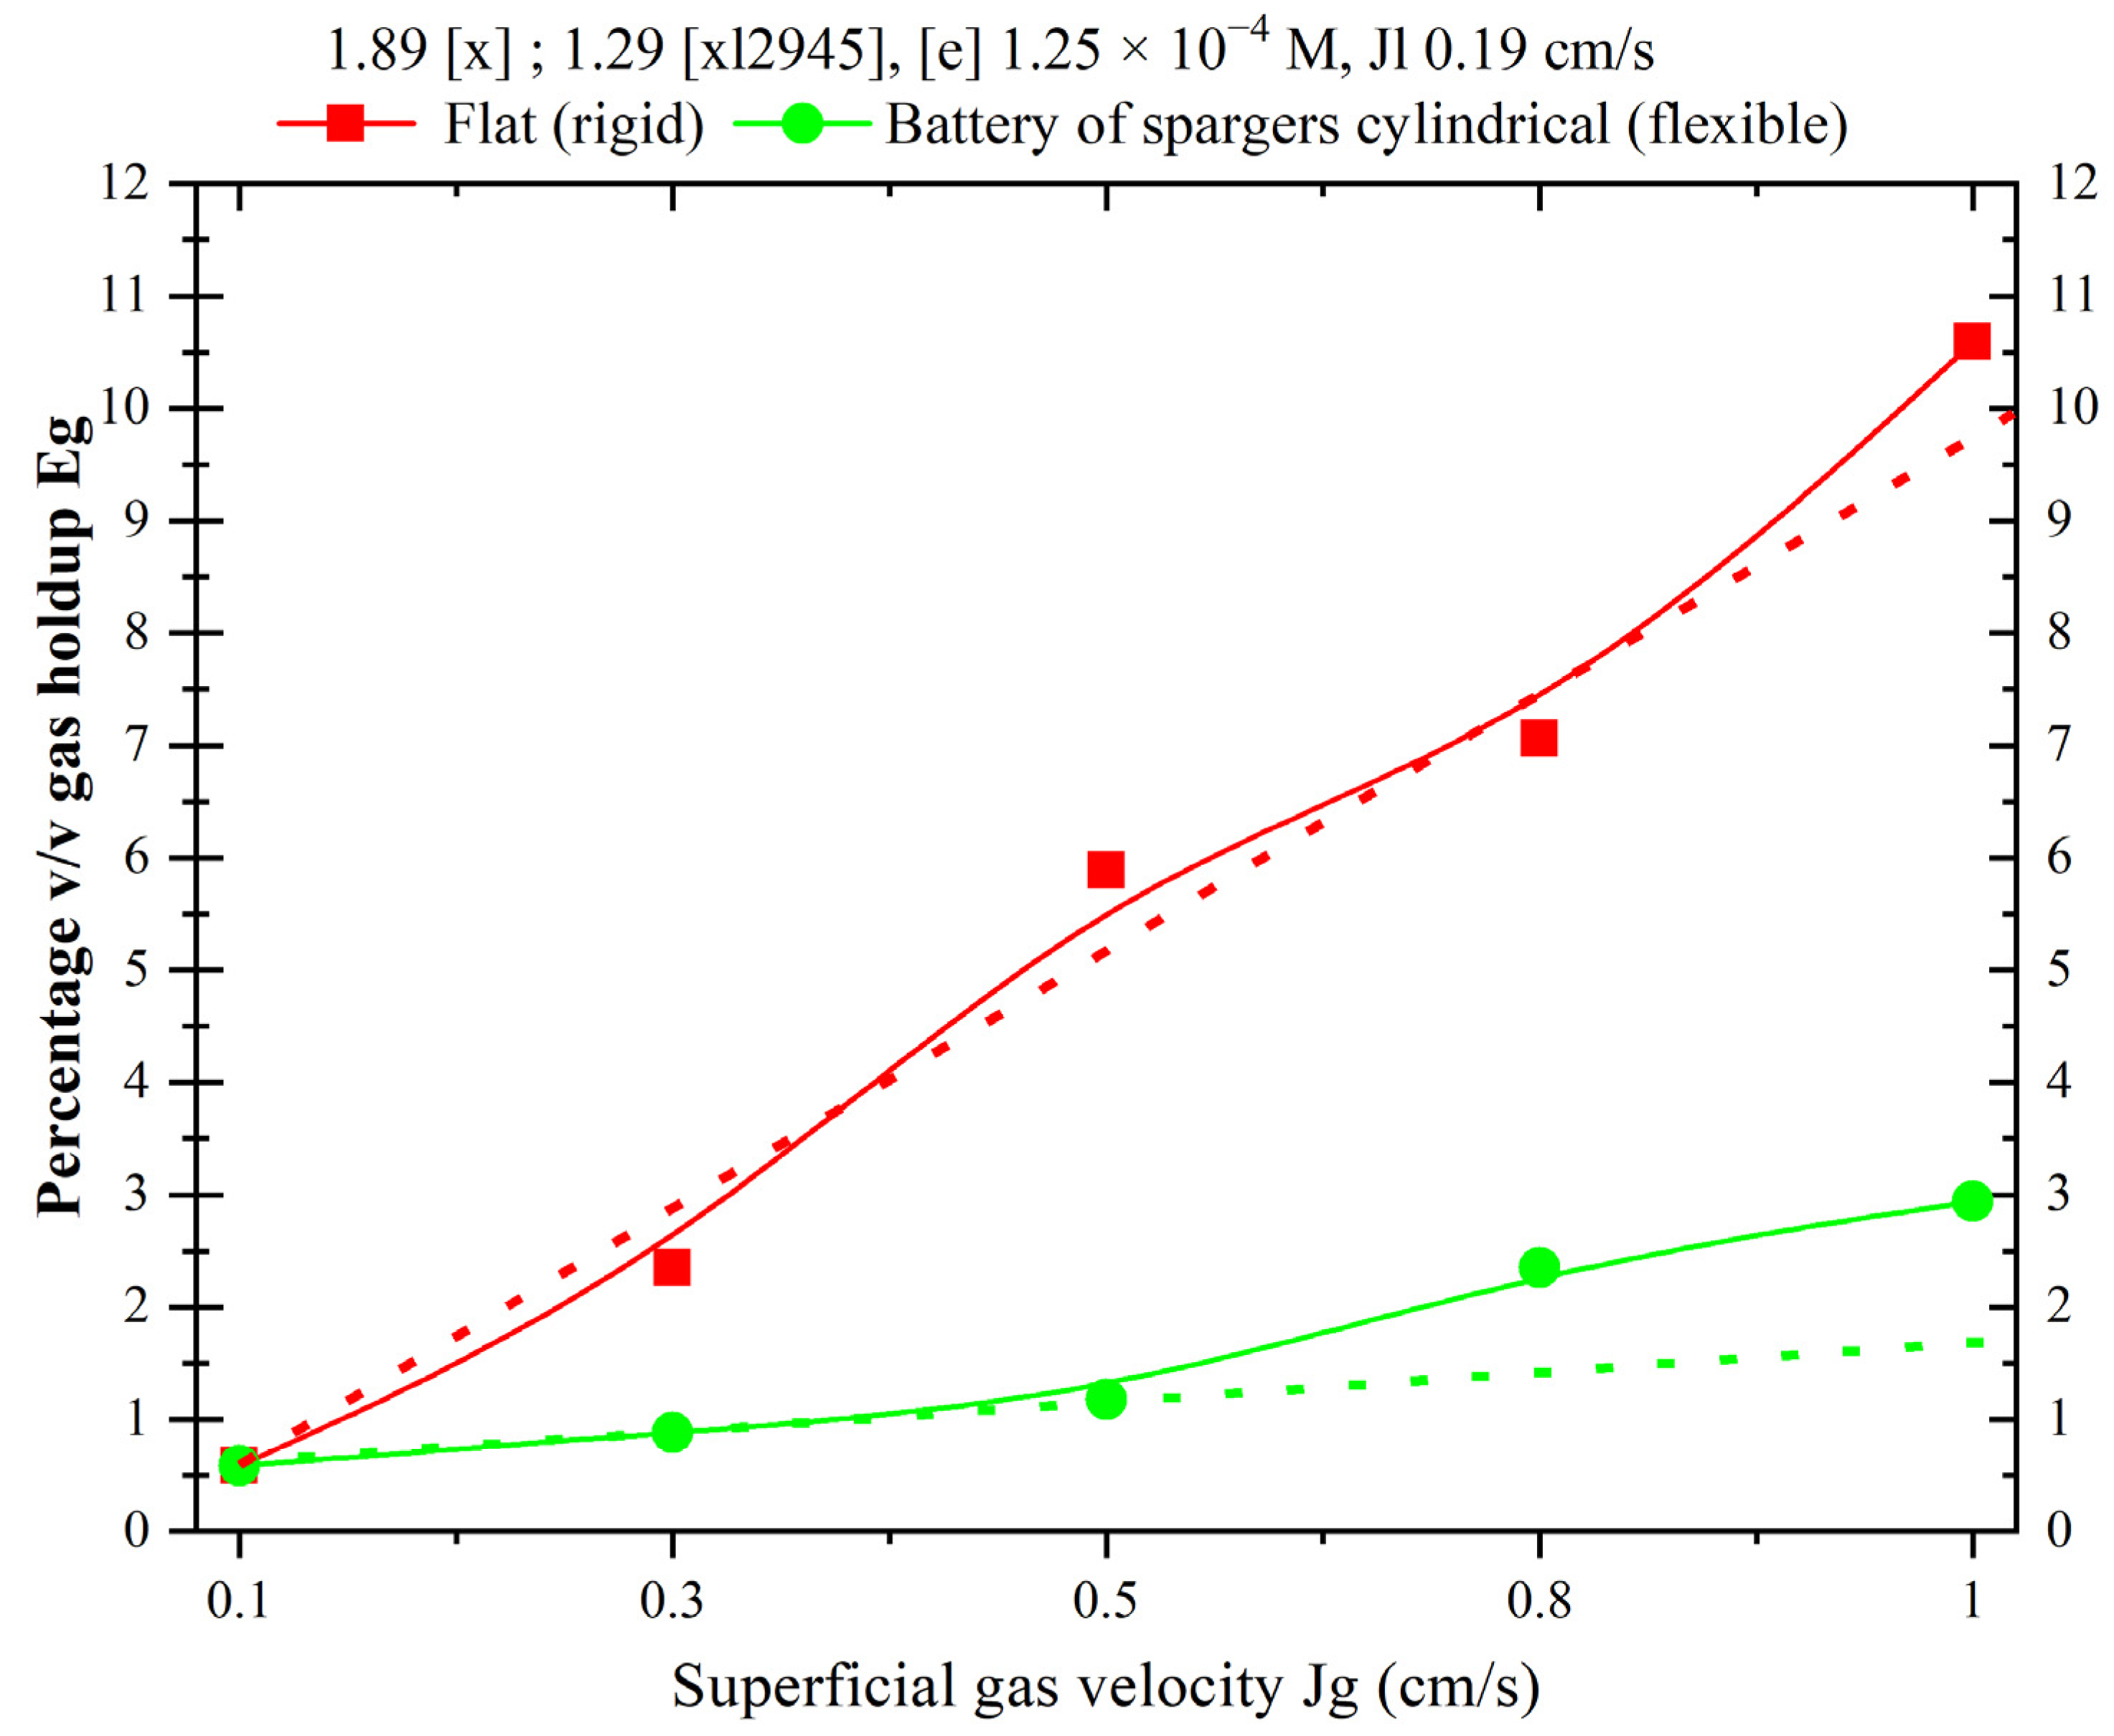
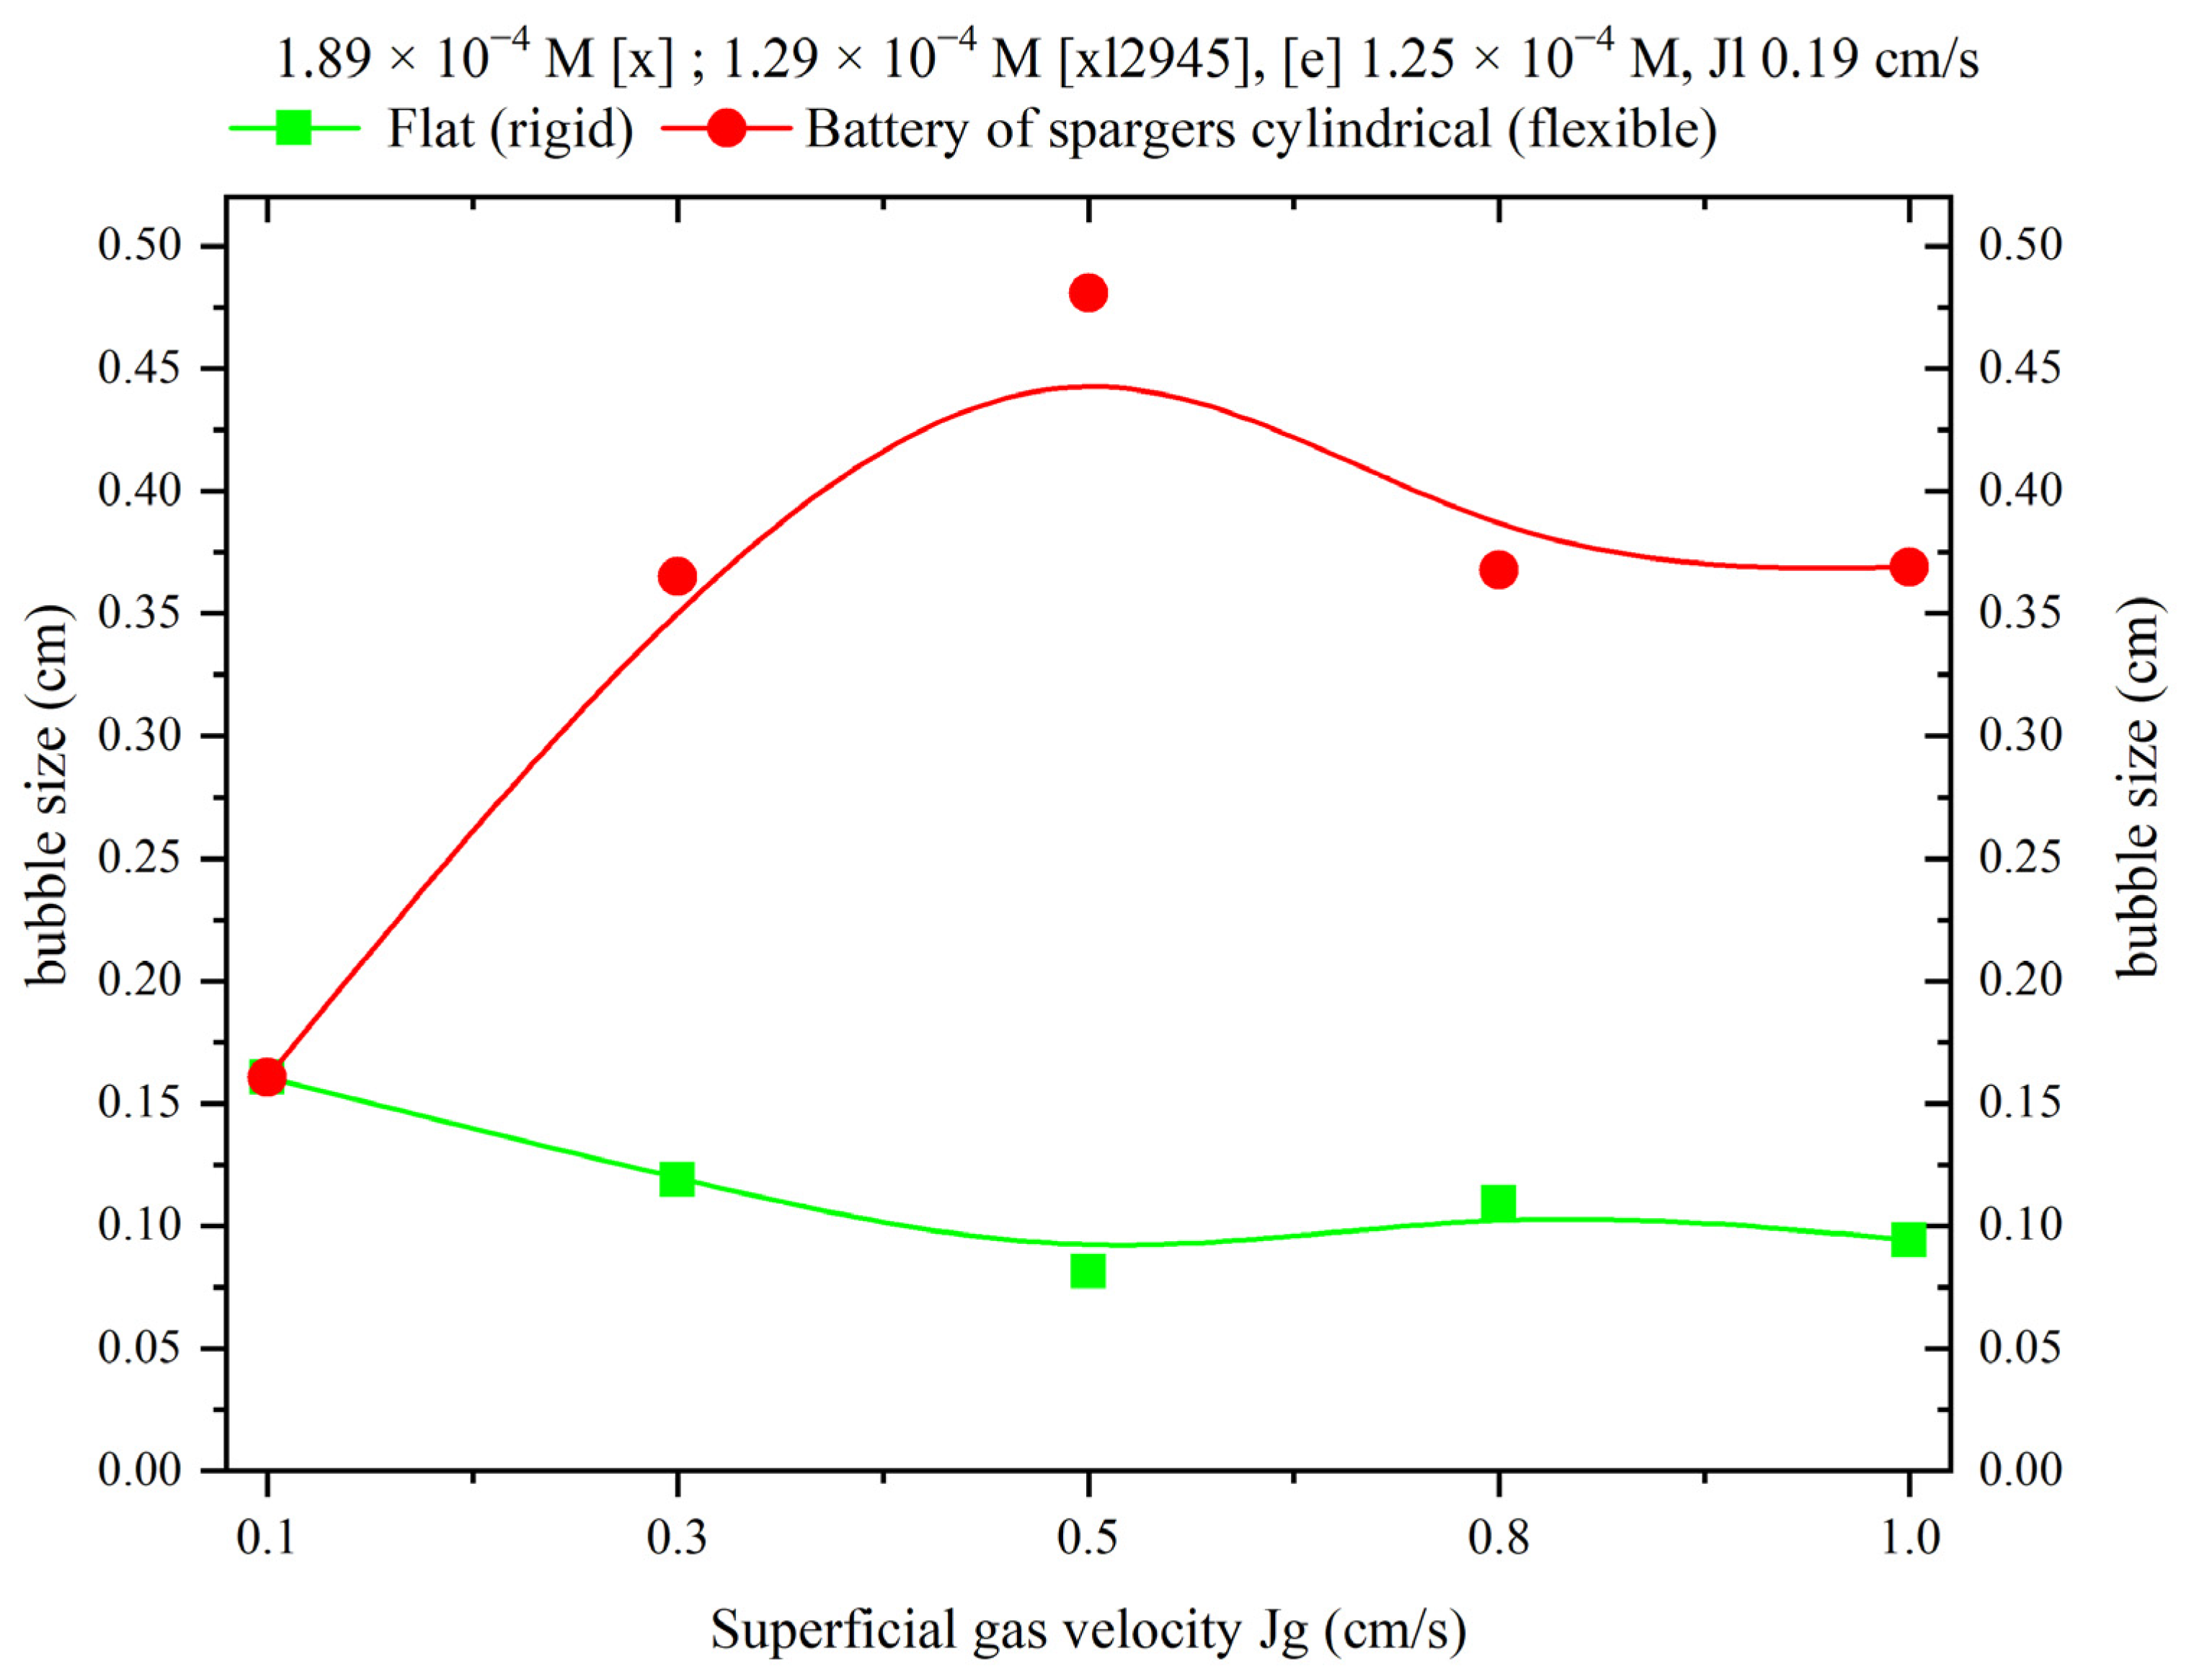
3.2.5. Evaluation of Geometry of the Dispersion System
4. Conclusions
Supplementary Materials
Author Contributions
Funding
Conflicts of Interest
References
- Arslan, F.; Bulut, G. Ion flotation and its applications on concentration, recovery, and removal of metal ions from solutions. Physicochem. Probl. Miner. Process. 2022, 58, 152061. [Google Scholar] [CrossRef]
- Reyes, M.; Patiño, F.; Escudero, R.; Pérez, M.; Flores, M.U.; Reyes, I.A. Kinetics and hydrodynamics of silver ion flotation. J. Mex. Chem. Soc. 2012, 56, 408–416. [Google Scholar]
- Zouboulis, A.I. Silver recovery from aqueous streams using ion flotation. Miner. Eng. 1995, 8, 1477–1488. [Google Scholar] [CrossRef]
- Ahlatci, F.I.R.A.T.; Yazici, E.Y.; Yilmaz, E.L.I.F.; Celep, O.K.T.A.Y.; Deveci, H.A.C.I. A novel method for the recovery of silver from thiosulphate leach solutions using trimercapto-s-triazine (TMT). Miner. Eng. 2022, 177, 107373. [Google Scholar] [CrossRef]
- Charewicz, W.A.; Holowiecka, B.A.; Walkowiak, W. Selective flotation of zinc (II) and silver (I) ions from dilute aqueous solutions. Sep. Sci. Technol. 1999, 34, 2447–2460. [Google Scholar] [CrossRef]
- Reyes, M.; Patiño, F.; Tavera, F.J.; Escudero, R.; Rivera, I.; Pérez, M. Kinetics and recovery of xanthate-copper compounds by ion flotation techniques. J. Mex. Chem. Soc. 2009, 53, 15–22. [Google Scholar] [CrossRef]
- Ahmed, S.H.; El Gammal, E.M.; Amin, M.I.; Yousef, W.M. Studying the Effect of Potassium Amyl Xanthate Surfactant on Fe, Cu and U Ions for the Pretreatment of Abu Zeneima Sulphate Leach Liquor. Period. Polytech. Chem. Eng. 2021, 65, 408–415. [Google Scholar] [CrossRef]
- Hoseinian, F.S.; Rezai, B.; Kowsari, E.; Safari, M. Kinetic study of Ni (II) removal using ion flotation: Effect of chemical interactions. Miner. Eng. 2018, 119, 212–221. [Google Scholar] [CrossRef]
- Khatir, M.Z.; Abdollahy, M.; Khalesi, M.R.; Rezai, B. The selective separation of neodymium from aluminum using ion flotation. Miner. Eng. 2022, 180, 107480. [Google Scholar] [CrossRef]
- Yenial, Ü.; Bulut, G. Examination of flotation behavior of metal ions for process water remediation. J. Mol. Liq. 2017, 241, 130–135. [Google Scholar] [CrossRef]
- Nafi, A.W.; Taseidifar, M. Removal of hazardous ions from aqueous solutions: Current methods, with a focus on green ion flotation. J. Environ. Manag. 2022, 319, 115666. [Google Scholar] [CrossRef] [PubMed]
- Chang, L.; Cao, Y.; Fan, G.; Li, C.; Peng, W. A review of the applications of ion floatation: Wastewater treatment, mineral beneficiation and hydrometallurgy. RSC Adv. 2019, 9, 20226–20239. [Google Scholar] [CrossRef] [PubMed]
- Hoseinian, F.S.; Rezai, B.; Safari, M.; Deglon, D.; Kowsari, E. Effect of hydrodynamic parameters on nickel removal rate from wastewater by ion flotation. J. Environ. Manag. 2019, 244, 408–414. [Google Scholar] [CrossRef] [PubMed]
- Sebba, F. Concentration by ion flotation. Nature 1959, 184, 1062–1063. [Google Scholar] [CrossRef]
- Peng, W.; Chang, L.; Li, P.; Han, G.; Huang, Y.; Cao, Y. An overview on the surfactants used in ion flotation. J. Mol. Liq. 2019, 286, 110955. [Google Scholar] [CrossRef]
- Deliyanni, E.A.; Kyzas, G.Z.; Matis, K.A. Various flotation techniques for metal ions removal. J. Mol. Liq. 2017, 225, 260–264. [Google Scholar] [CrossRef]
- Demissie, H.; Lu, S.; Jiao, R.; Liu, L.; Xiang, Y.; Ritigala, T.; Ajibade, F.O.; Mihiranga, H.K.M.; An, G.; Wang, D. Advances in micro interfacial phenomena of adsorptive micellar flocculation: Principles and application for water treatment. Water Res. 2021, 202, 117414. [Google Scholar] [CrossRef]
- Bulatovic, S.M. Handbook of Flotation Reagents: Chemistry, Theory and Practice: Volume 1: Flotation of Sulfide Ores; Elsevier: Amsterdam, The Netherlands, 2007. [Google Scholar]
- Grieves, R.B.; Bhattacharyya, D.; Ghosal, J.K. Surfactant-colligend particle size effects on ion flotation: Influences of mixing time, temperature, and surfactant chain length. Colloid Polym. Sci. 1976, 254, 507–515. [Google Scholar] [CrossRef]
- Lobacheva, O.; Dzhevaga, N.; Danilov, A. The method of removal yttrium (III) and ytterbium (III) from dilute aqueous solutions. J. Ecol. Eng. 2016, 17, 62284. [Google Scholar] [CrossRef]
- Taseidifar, M.; Makavipour, F.; Pashley, R.M.; Rahman, A.M. Removal of heavy metal ions from water using ion flotation. Environ. Technol. Innov. 2017, 8, 182–190. [Google Scholar] [CrossRef]
- Polat, H.; Erdogan, D. Heavy metal removal from waste waters by ion flotation. J. Hazard. Mater. 2007, 148, 267–273. [Google Scholar] [CrossRef] [PubMed]
- Galvin, K.P.; Engel, M.D.; Nicol, S.K. The potential for reagent recycle in the ion flotation of gold cyanide—A pilot scale field trial. Int. J. Miner. Process. 1994, 42, 75–98. [Google Scholar] [CrossRef]
- Walkowiak, W.; Ulewicz, M. Kinetics studies of ion flotation. Fizykochem. Probl. Miner. 1999, 33, 201–214. [Google Scholar]
- Walkowiak, W. Mechanism of selective ion flotation. 1. Selective flotation of transition metal cations. Sep. Sci. Technol. 1991, 26, 559–568. [Google Scholar] [CrossRef]
- Girek, T.; Kozlowski, C.A.; Koziol, J.J.; Walkowiak, W.; Korus, I. Polymerisation of β-cyclodextrin with succinic anhydride. Synthesis, characterisation, and ion flotation of transition metals. Carbohydr. Polym. 2005, 59, 211–215. [Google Scholar] [CrossRef]
- Finch, J.A.; Dobby, G.S. Column Flotation; Pergamon Press: Oxford, UK, 1990. [Google Scholar]
- Tavera, F.J.; Escudero, R.; Uribe, A.; Finch, J.A. Ni-DETA flotation in aqueous media: Application of flotation columns. Afinidad 2000, 57, 415–423. [Google Scholar]
- Gorain, B.K.; Franzidis, J.P.; Manlapig, E.V. Flotation Cell Design: Application of Fundamental Principles; Julius Kruttschnitt Mineral Research Centre: Indooroopilly, QLD, Australia, 2000; pp. 1502–1512. [Google Scholar]
- Tavera, F.J.; Gómez, C.O.; Finch, J.A. Conductivity flow cells for measurements on dispersions. Can. Metall. Q. 1998, 37, 19–25. [Google Scholar] [CrossRef]
- Tavera, F.J.; Escudero, R. Gas hold-up and solids hold-up in flotation columns: On-line measurement based on electrical conductivity. Miner. Process. Extr. Metall. 2002, 111, 94–99. [Google Scholar] [CrossRef]
- Tavera, F.J.; Gomez, C.O.; Finch, J.A. Estimation of gas holdup in froths by electrical conductivity: Application of the standard addition method. Miner. Eng. 1998, 11, 941–947. [Google Scholar] [CrossRef]
- Tavera, F.J.; Escudero, R.; Finch, J.A. Gas holdup in flotation columns: Laboratory measurements. Int. J. Miner. Process. 2001, 61, 23–40. [Google Scholar] [CrossRef]
- Celep, O.; Altinkaya, P.; Yazici, E.Y.; Deveci, H. Thiosulphate leaching of silver from an arsenical refractory ore. Miner. Eng. 2018, 122, 285–295. [Google Scholar] [CrossRef]
- Dobby, G.S.; Yianatos, J.B.; Finch, J.A. Estimation of bubble diameter in flotation columns from drift flux analysis. Can. Metall. Q. 1988, 27, 85–90. [Google Scholar] [CrossRef]
- Yianatos, J.B.; Finch, J.A.; Laplante, A.R. Holdup profile and bubble size distribution of flotation column froths. Can. Metall. Q. 1986, 25, 23–29. [Google Scholar] [CrossRef]
- Gomez, C.O.; Maldonado, M. Modelling Bubble Flow Hydrodynamics: Drift-Flux and Molerus Models. Minerals 2022, 12, 1502. [Google Scholar] [CrossRef]
- Lelinski, D.; Allen, J.; Redden, L.; Weber, A. Analysis of the residence time distribution in large flotation machines. Miner. Eng. 2002, 15, 499–505. [Google Scholar] [CrossRef]
- Xu, M.; Finch, J.A. Effect of sparger surface area on bubble diameter in flotation columns. Can. Metall. Q. 1989, 28, 1–6. [Google Scholar] [CrossRef]


Disclaimer/Publisher’s Note: The statements, opinions and data contained in all publications are solely those of the individual author(s) and contributor(s) and not of MDPI and/or the editor(s). MDPI and/or the editor(s) disclaim responsibility for any injury to people or property resulting from any ideas, methods, instructions or products referred to in the content. |
© 2023 by the authors. Licensee MDPI, Basel, Switzerland. This article is an open access article distributed under the terms and conditions of the Creative Commons Attribution (CC BY) license (https://creativecommons.org/licenses/by/4.0/).
Share and Cite
Palazuelos, L.P.Á.; Guerrero, M.U.F.; Labra, M.P.; Domínguez, I.A.R.; García, R.E.; Cardona, F.P.; Hernández, F.R.B.; Tapia, J.C.J.; Pérez, M.R. Silver(I) Recovery by Ion Flotation Process from Aqueous Solutions in Cells with Spargers. Minerals 2023, 13, 572. https://doi.org/10.3390/min13040572
Palazuelos LPÁ, Guerrero MUF, Labra MP, Domínguez IAR, García RE, Cardona FP, Hernández FRB, Tapia JCJ, Pérez MR. Silver(I) Recovery by Ion Flotation Process from Aqueous Solutions in Cells with Spargers. Minerals. 2023; 13(4):572. https://doi.org/10.3390/min13040572
Chicago/Turabian StylePalazuelos, Laura P. Ángeles, Mizraim U. Flores Guerrero, Miguel Pérez Labra, Iván A. Reyes Domínguez, Ramiro Escudero García, Francisco Patiño Cardona, Francisco R. Barrientos Hernández, Julio C. Juárez Tapia, and Martín Reyes Pérez. 2023. "Silver(I) Recovery by Ion Flotation Process from Aqueous Solutions in Cells with Spargers" Minerals 13, no. 4: 572. https://doi.org/10.3390/min13040572