


Polymetallic Uranium Mineralisation in Rohil, Rajasthan, Western India: Insights from Mode of Occurrences, Structural Controls, Alteration Geochemistry and Exploration
Abstract
:1. Introduction

| Deposit, Country, Resource in Kiloton U, Grade | Host Rocks (Rock Age) | Alteration Assemblage | Geochemistry | Formation Temp. | Ore Age (Ga) | References |
|---|---|---|---|---|---|---|
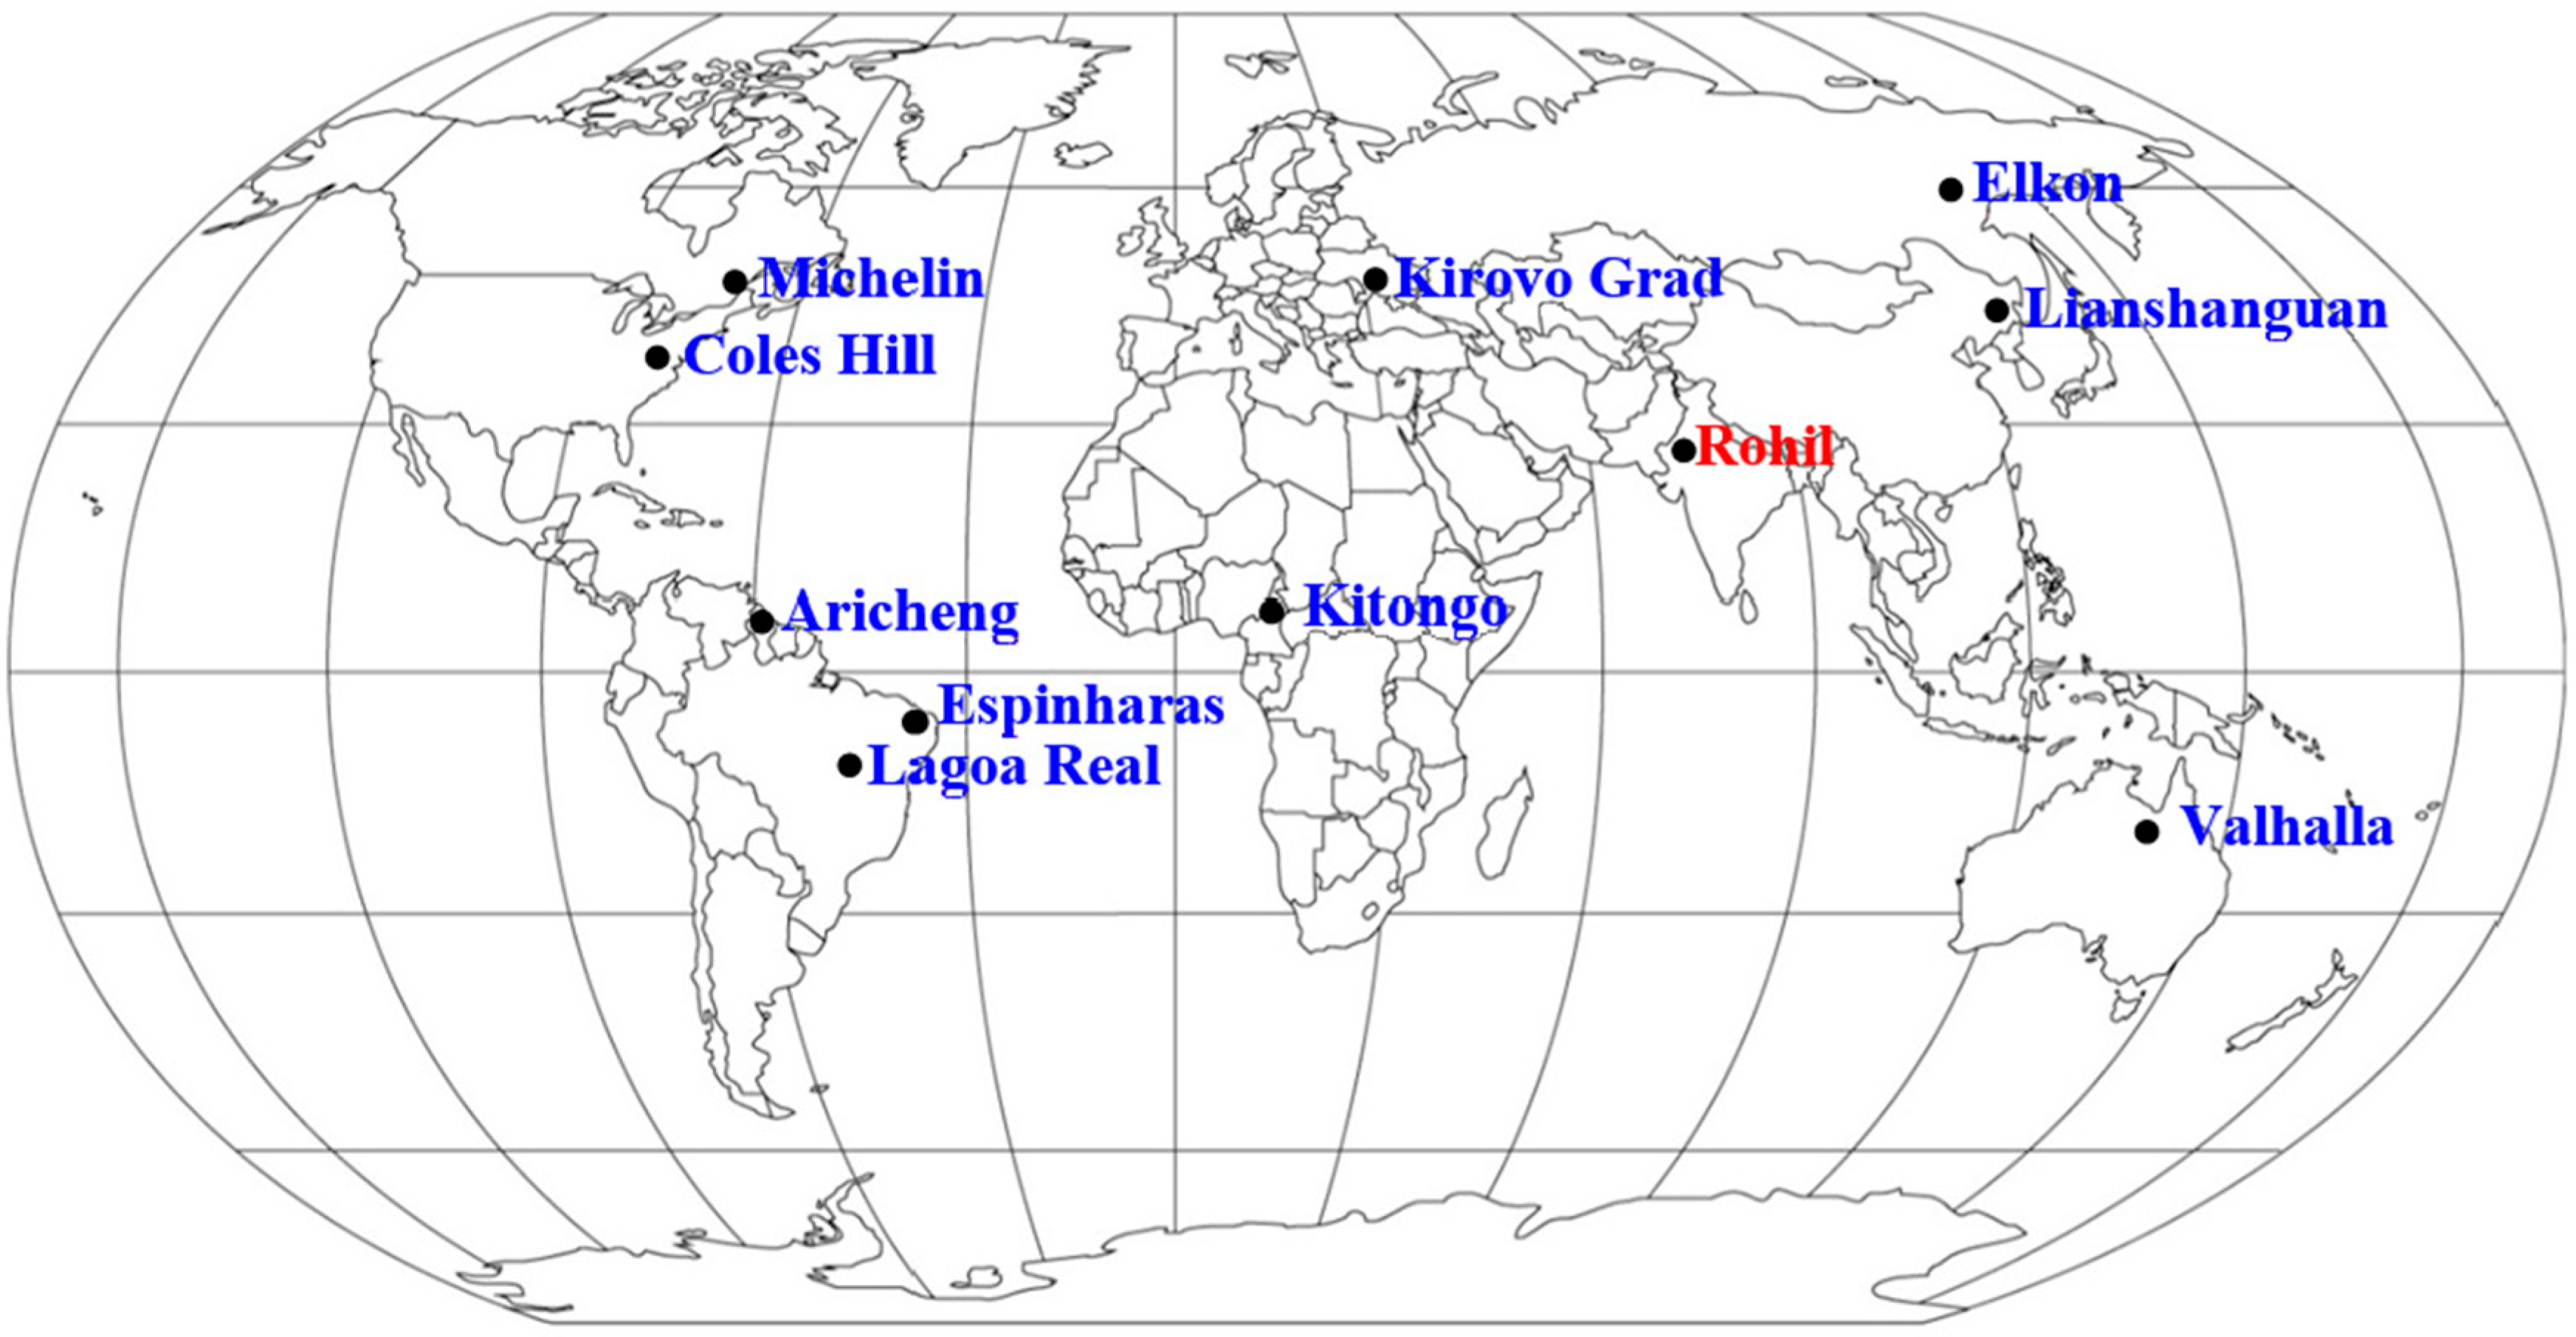
| Valhalla, Australia, 57, 0.07% | Mylonitised metabasalt and metasiltstone (Orosirian) | Early: albite, riebeckite, calcite Syn-U: apatite, zircon, brannerite Late: Uraninite, haematite, dolomite chlorite, coffinite, quartz, galena, pyrite, Cu-sulphides | Loss: Si (?), K, Ba, Rb Gain: Na, Ca, U, Zr, P, V, Y, Sr | 340–380 °C Isotope geochem. | 1.56–1.51 | [6] |
| KirovoGrad, Ukraine, >250, 0.07%–0.15% | Gneiss, granite, iron-rich rocks (Archaean–Orosirian) | Stage 1: riebeckite/arfvedsonite, albite, carbonate, magnetite, apatite Stage 2: albite, apatite, pyrite, zircon, hematite, uraninite Late: aegirine, calcite, hematite, Late U: uraninite, coffinite, calcite, dolomite, biotite, Fe oxides, chlorite, Fe–Cu–Pb sulphides | Loss: Si Gain: Na, Ca, U, Zr, P, V, Y, Sr | Stage 1 and 2 alteration 300– 500 °C. Late alteration 150–200 °C | 1.90–1.70 | [1,19] |
| Novokonstantinovskoye, Ukraine, 93, 0.14% | Granite, minor gabbro and monzonite (Palaeoproterozoic) | Epidote–chlorite and chlorite–albitite, uraninite, brannerite, pitchblende, coffinite | Loss: Si Gain: Na, Fe, U, Ti | 1.808 ± 0.027 | [1] | |
| Krivoy Rog, Ukraine, 0.07%–0.2% | Metasediments (carbonate, quartzite, schist, banded iron formations) (Proterozoic) | Carbonate–alkaline metasomatism Chlorite, carbonate and haematite, davidite, nenadkevite, pitchblende, coffinite | Loss: Si Gain: Na, Mg, Fe, U | 1.80–1.75 | [19] | |
| Elkon, Russia, <62, 0.05%–0.15% | Gneiss and migmatite, (Archaean–Palaeoproterozoic) | Stage 1: K metasomatism Stage 2: albite, sericite, adularia, illite, chlorite, haematite, pyrite, carbonate | Loss: Na, Al, Ca, Mg, Mn, P and Ti Gain: K, Fe, U, Au | 0.135 | [1] | |
| Coles Hill, USA, 45, 0.054% | Deformed granite, augen gneiss, amphibolite | Na- metasomatism Albite, calcite, apatite, chlorite, haematite, sericite, zeolite. | Loss: Si Gain: Na, U, Fe, P, Ca | 0.417 | [1] | |
| Lagoa Real, Brazil, 100, 0.12% | Mylonitised gneiss (large-scale ductile shear zone) Orosirian | Albite, pyroxene, garnet, uraninite, Zircon, allanite, carbonate | Loss: Si, K, Rb Gain: Na, Ca, Sr | 450 ± 50 °C Initial phase | 1.87 ± 0.07 | [13] |
| Michelin, Canada, 74, 0.07%–0.15% | Mylonitised metarhyolite, metavolcaniclastic rocks, metasediments, (Orosirian) | Quartz and K-feldspar with minor plagioclase, calcite, biotite, hornblende, pyroxene, magnetite, hematite, traces of titanite, apatite, zircon | Loss: Si, K Gain: Na, U, Zr, Mo, W | 1.83 ± 0.03 | [7,8] | |
| Espinharas, Brazil, 8, 0.12% | Leucocratic granites and orthogneisses + mesocratic biotite–amphibole paragneisses | Albite, riebeckite, chlorite, calcite, coffinite, apatite, Ti-silicates, xenotime | Loss: Si, K, Rb, Sr Gain: Na, Ca, Fe, U, Th, Nb, Y, Pb | 500 ± 50 °C Intial phase | 0.820± 0.01 | [17] |
| Itataia, Brazil, 142, 0.19% | Epigenetic whereby the fluids are of magmatic, metamorphic, and meteoric origin | Sodic alteration and silica leaching. Amorphous apatite (collophane) formation | Loss: Si, Fe, Mn Gain: Na, Ca, P, U, F | 250–200 °C; 50–130 °C | 0.63 | [18] |
| Kurupung, Aricheng Guyana, 60, 0.1% | Monzogranite, syenite, episyenite | Albite, carbonate, chlorite, hydrothermal zircon, uraninite, Ti-U oxides. | Loss: Si, Fe Gain: Na, Ti, U | 250–350 °C (fluid incl.); 210–280 °C (chlorite geochem.) | 1.995 ± 0.015 | [15] |
| Kitongo, Cameroon, <25, 0.09% | Granite | Two-stage albitisation, chlorite, calcite, apatite | Loss: K, Rb, Nb, Ba, Si Gain: Pb, Zn, Ga, Hf, Sr, Fe, Al, P, Zr, U, Na, Ca | 0.590–0.613 | [16] | |
| Lianshanguan, China | Granite, migmatite (Archaean–Proterozoic) | Albite, sericite, fluorite, carbonate, pitchblende, coffinite, sulphides | Gain: Fe, Pb, Zn, Cu, U | 280–350 °C | 1.894 | [1,10] |
| Rohil, India, >8, 0.06% | Metasediments—quartz biotite schist, quartzite, amphibole quartzite, carbonaceous (graphitic) phyllite | Albite, chlorite, hornblende, fluorite, uraninite, pyrite, chalcopyrite, pyrrhotite, molybdenite | Loss: Si, K (?) Gain: Fe, Na, Cu, Mo, Pb, Zn, Ni, Co | 350–400 °C (XRD study) | 0.826 | [21] |
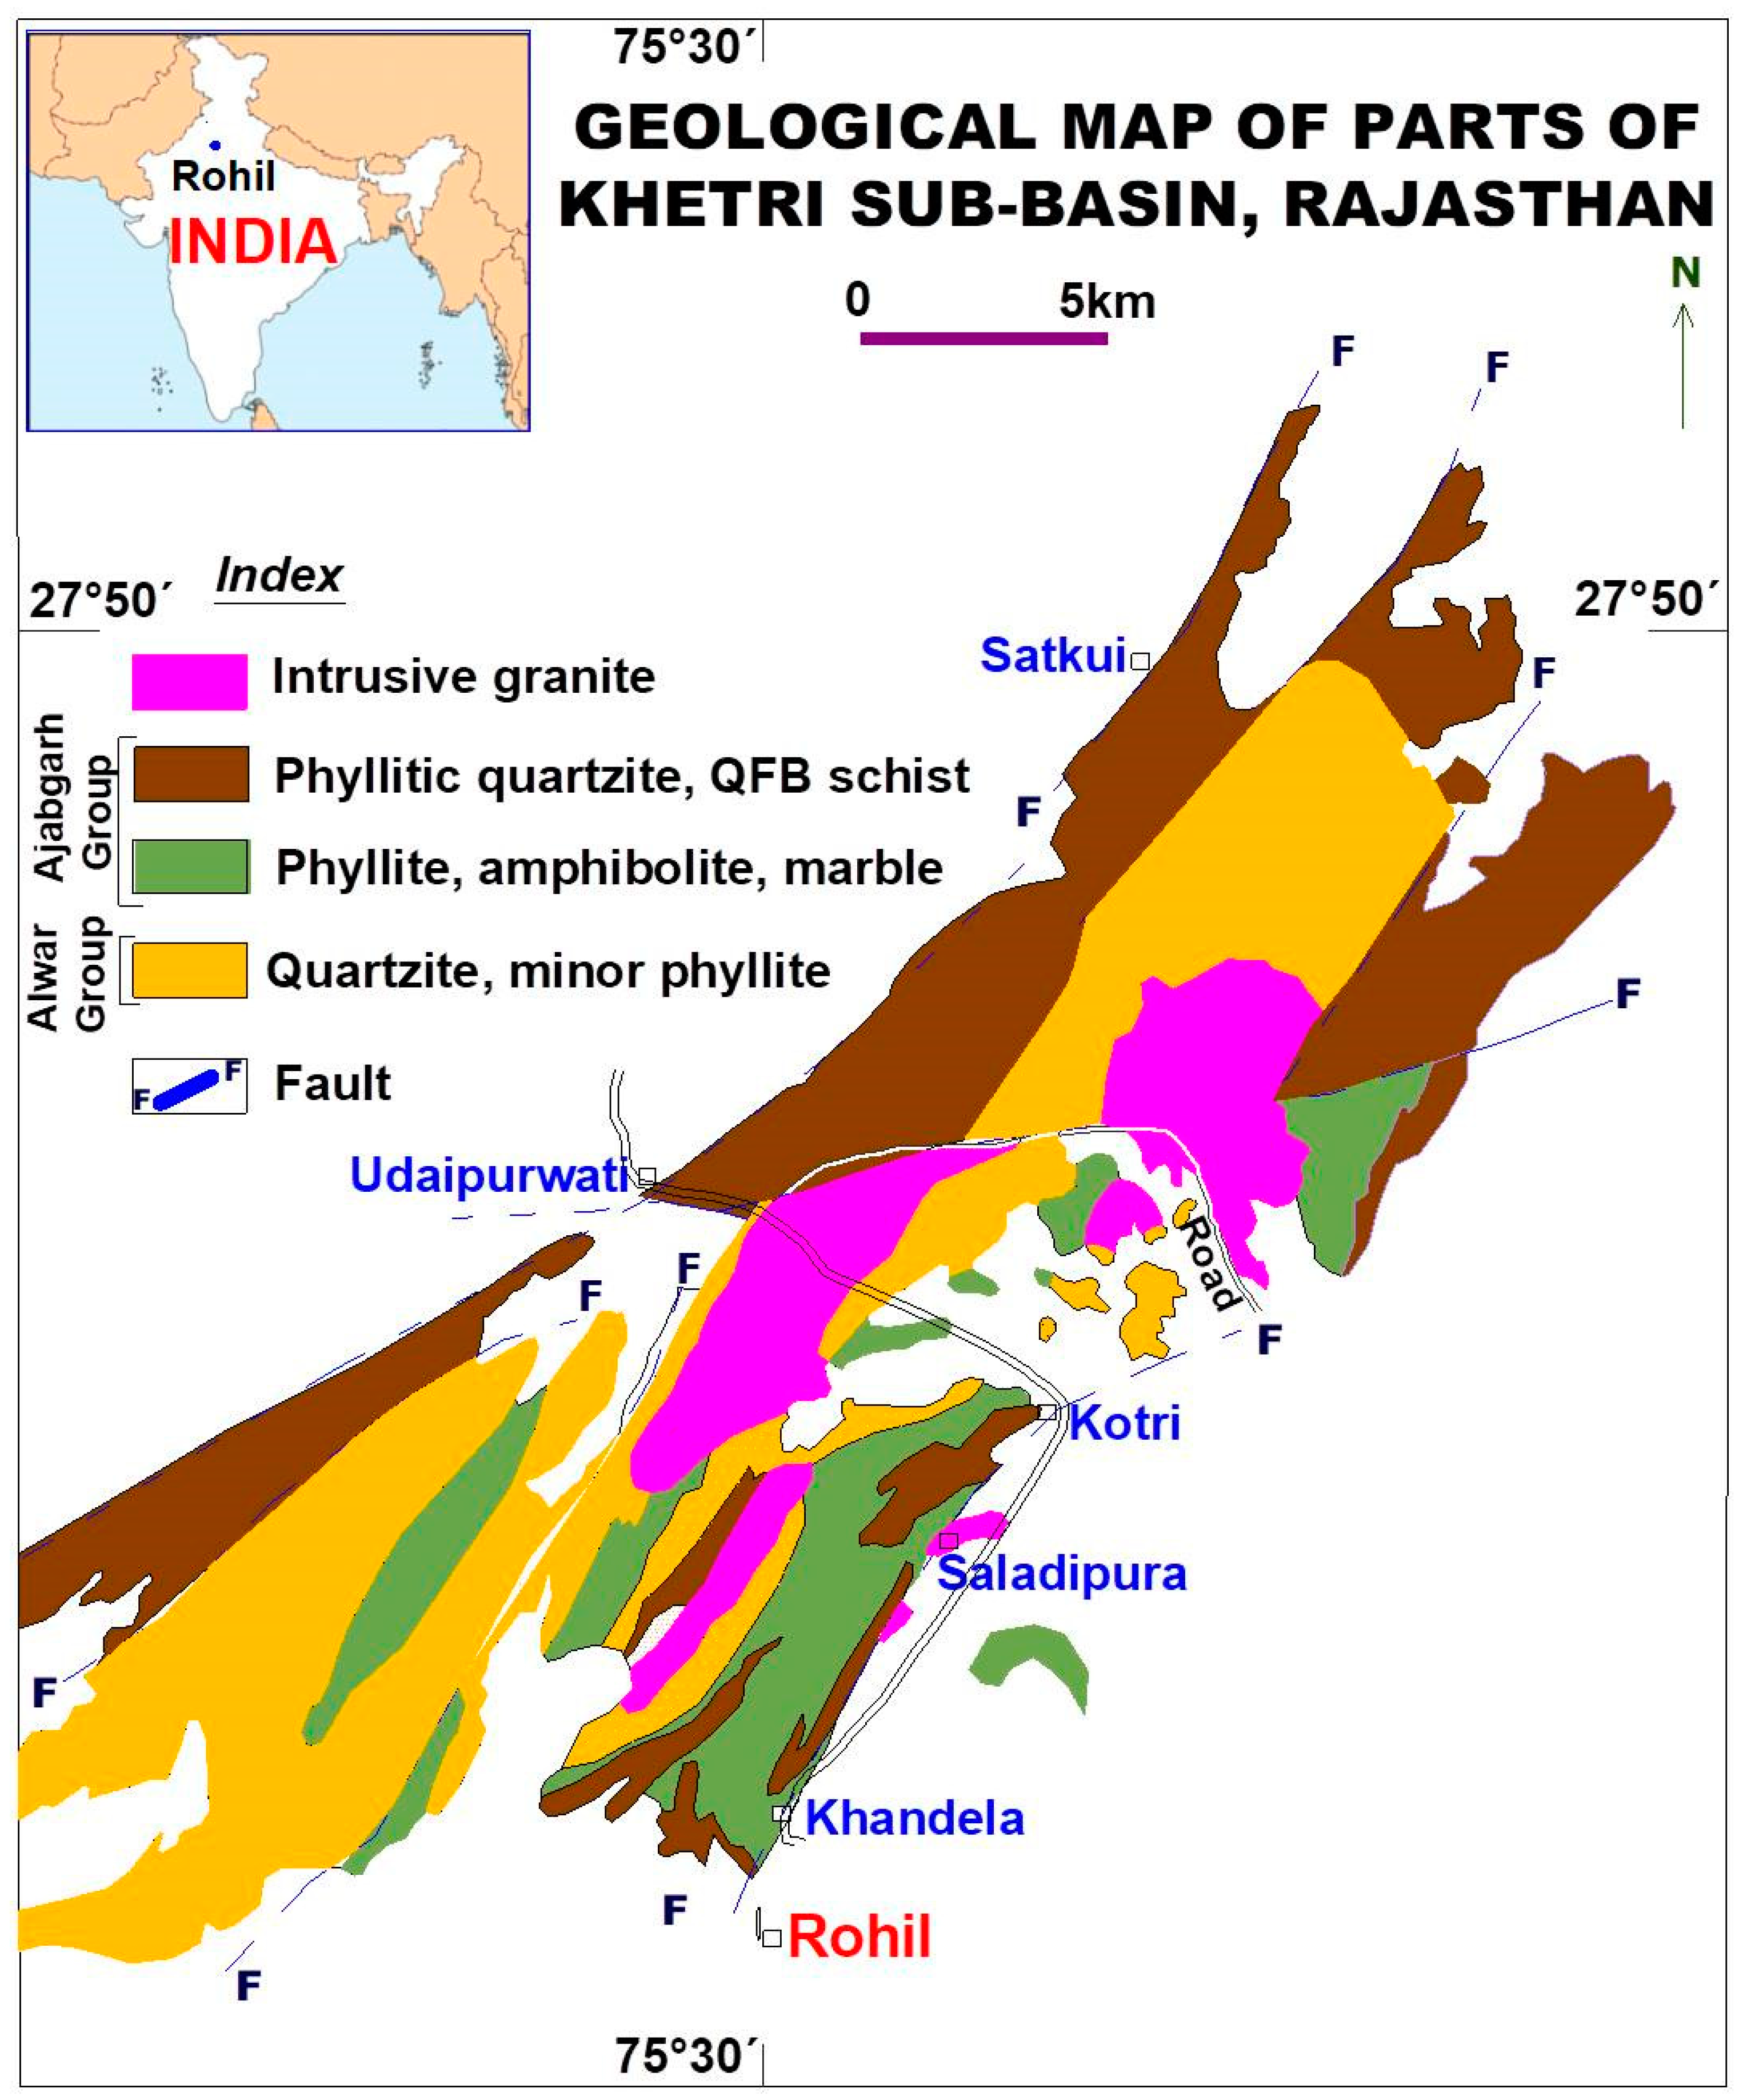
2. Regional Geology
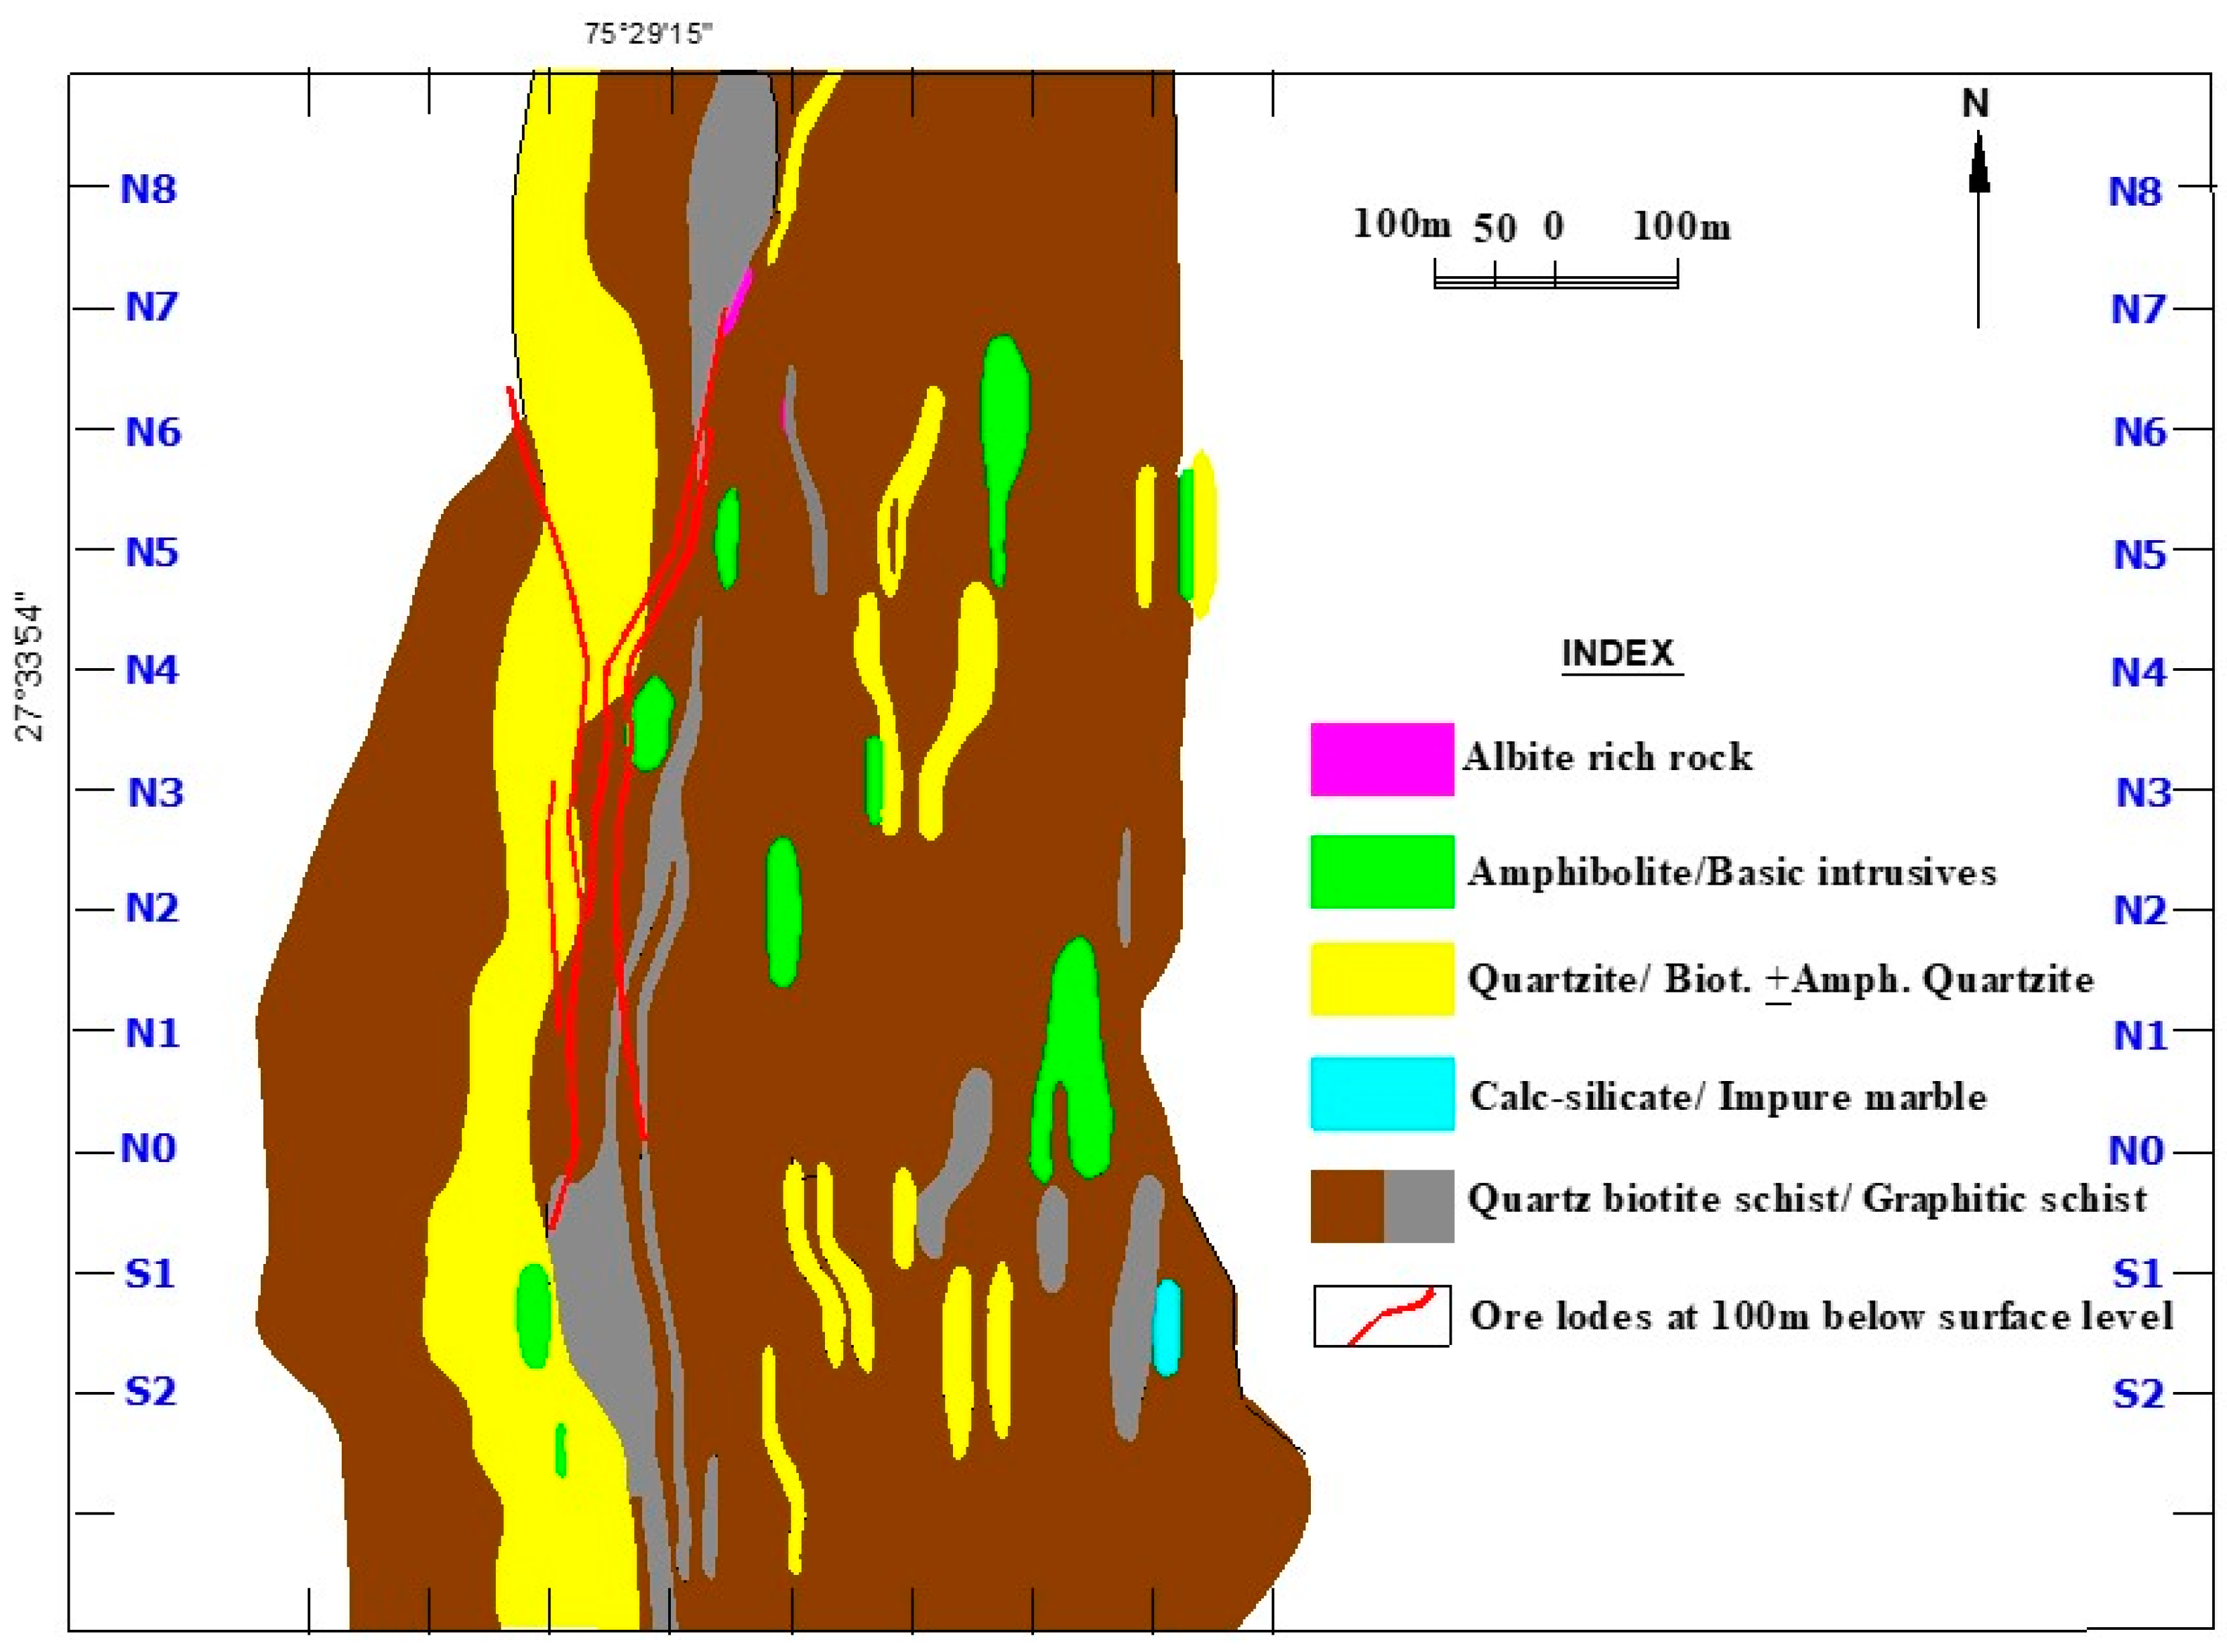
3. Deposit Geology
3.1. Lithology
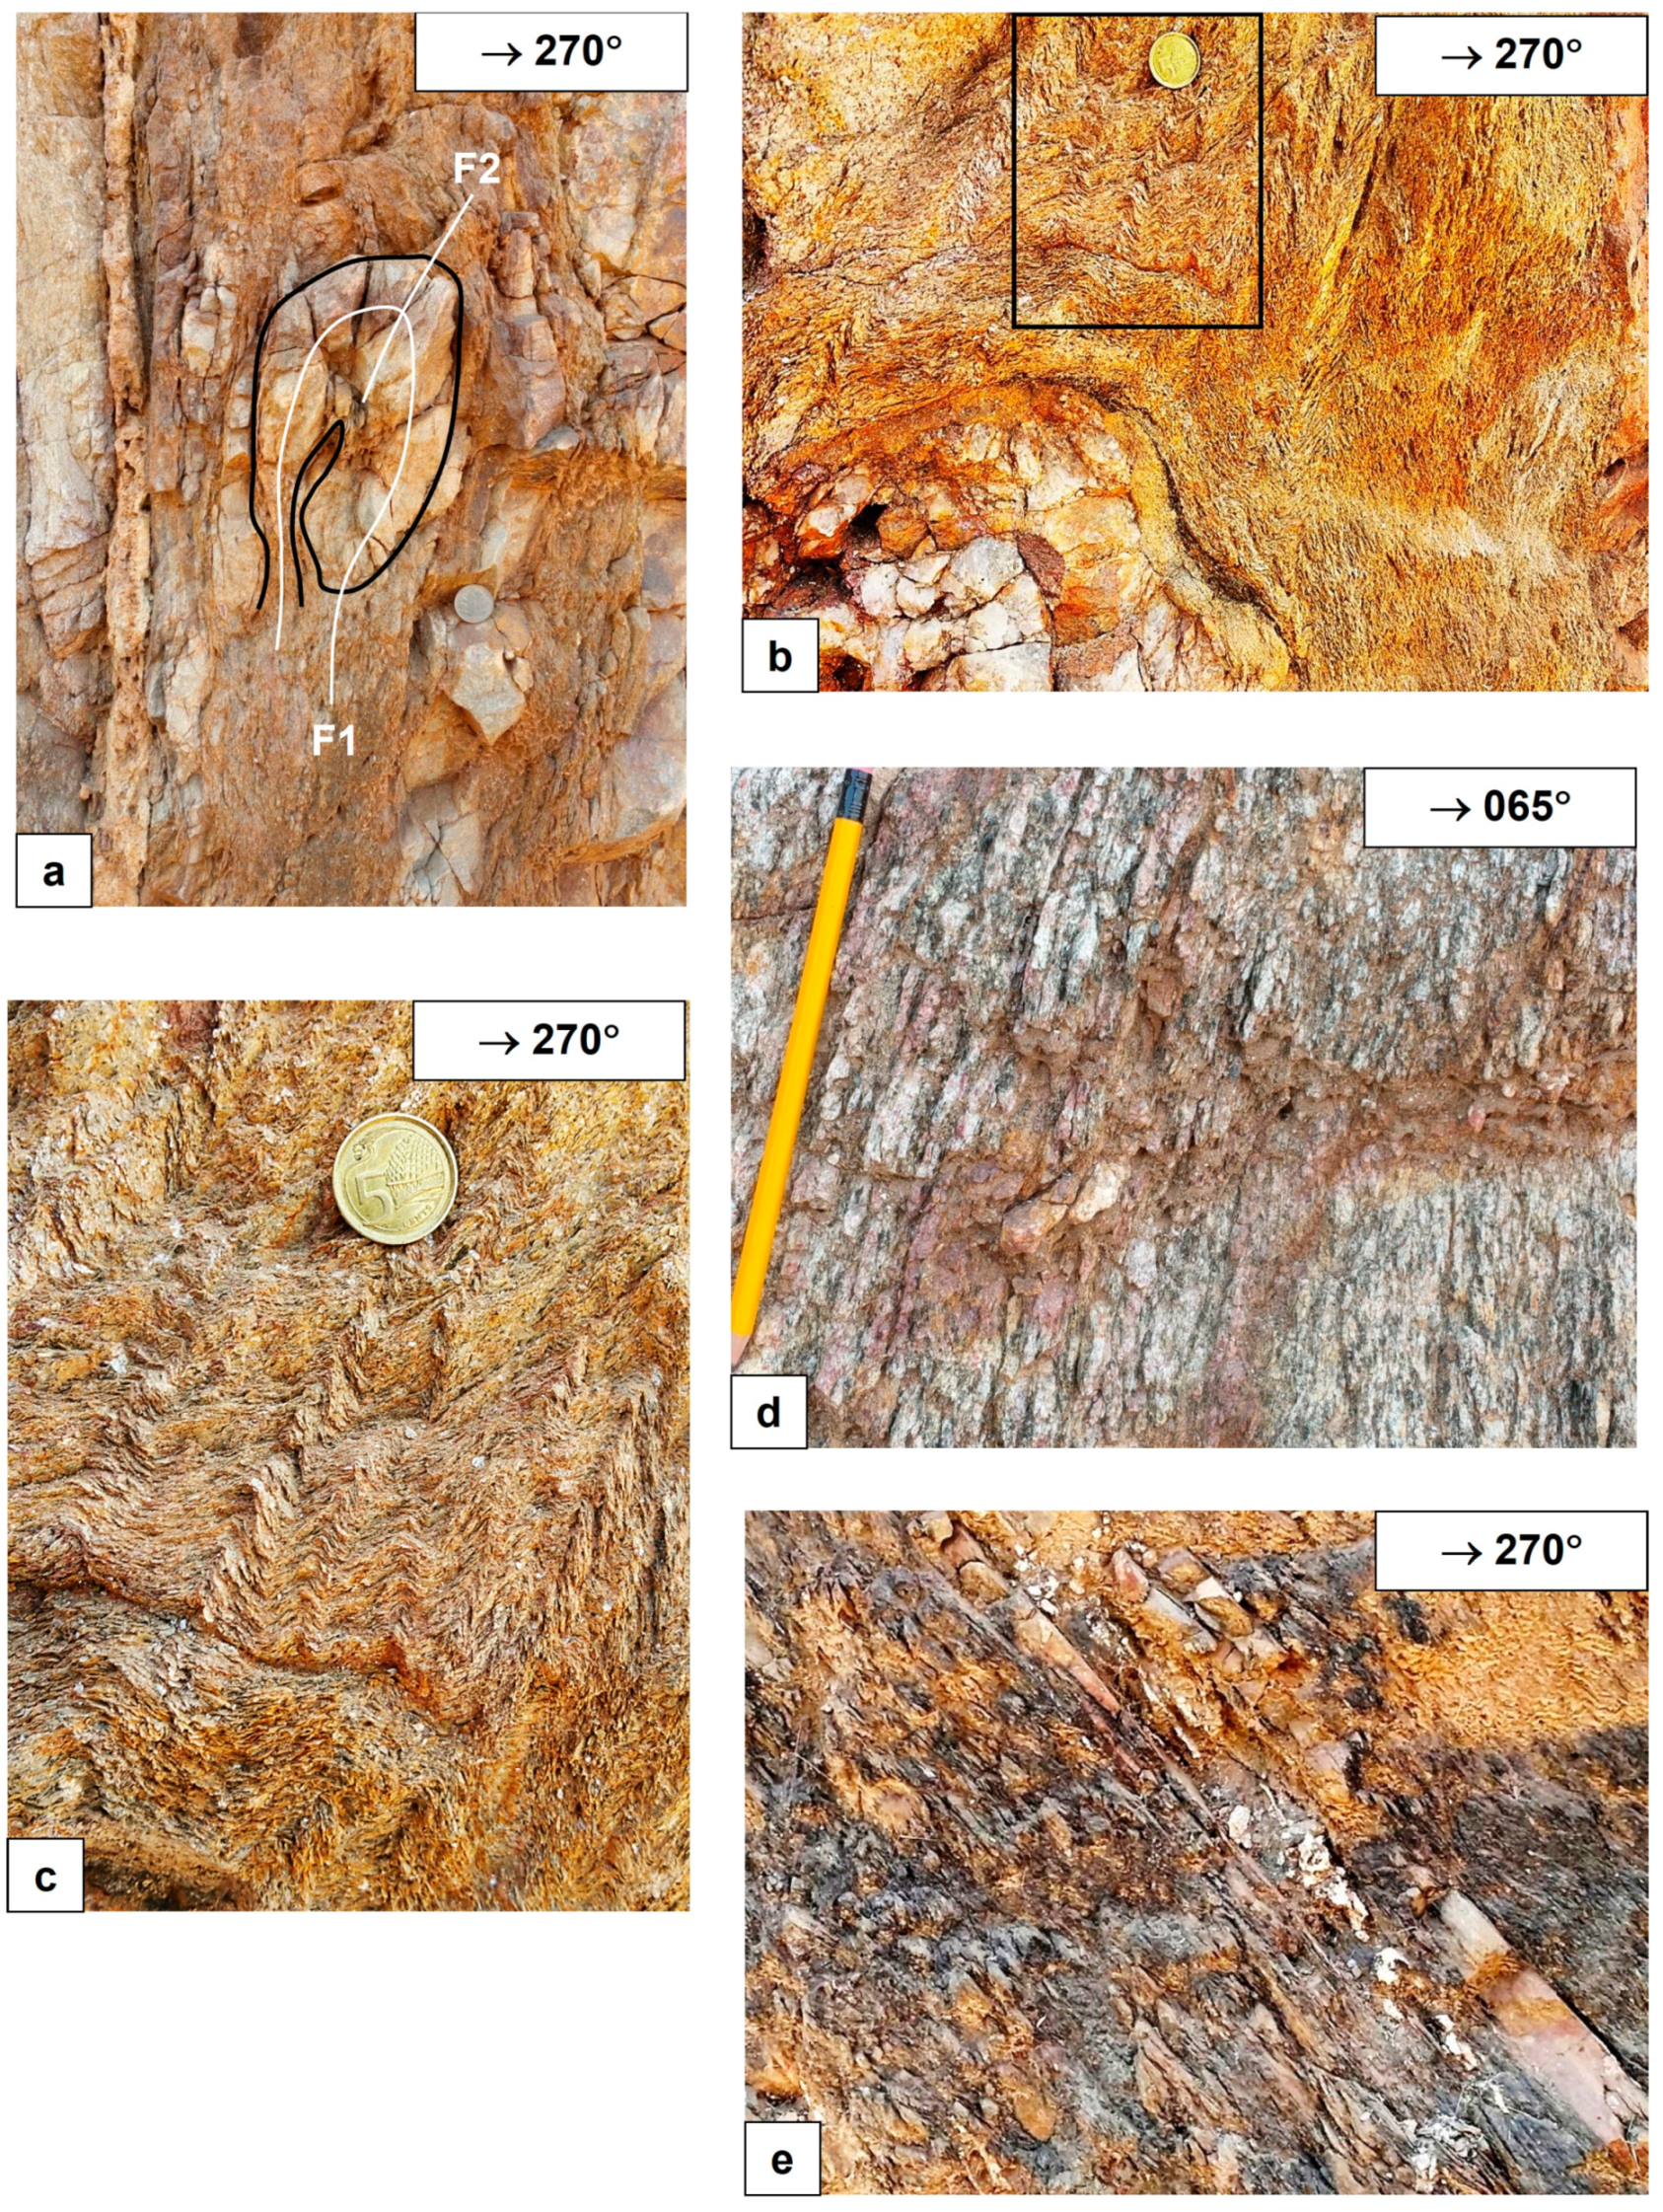
3.2. Structure
3.3. Mineralisation and Its Mode of Occurrence
4. Analytical Methods and Observations
4.1. Petrography
4.2. Electron Probe Microanalyses
4.3. Chemical Characterisation of Key Minerals by EPMA
- A.
- Feldspars
- B. Chlorites
- C. Sulphides
4.4. Whole Rock Geochemistry and Characterisation of Alteration
5. Discussion and Summary
5.1. Controls on Polymetallic Mineralisation
5.1.1. Structural Control
5.1.2. Na-K-Metasomatism
5.1.3. Episodic Hydrothermal Activity
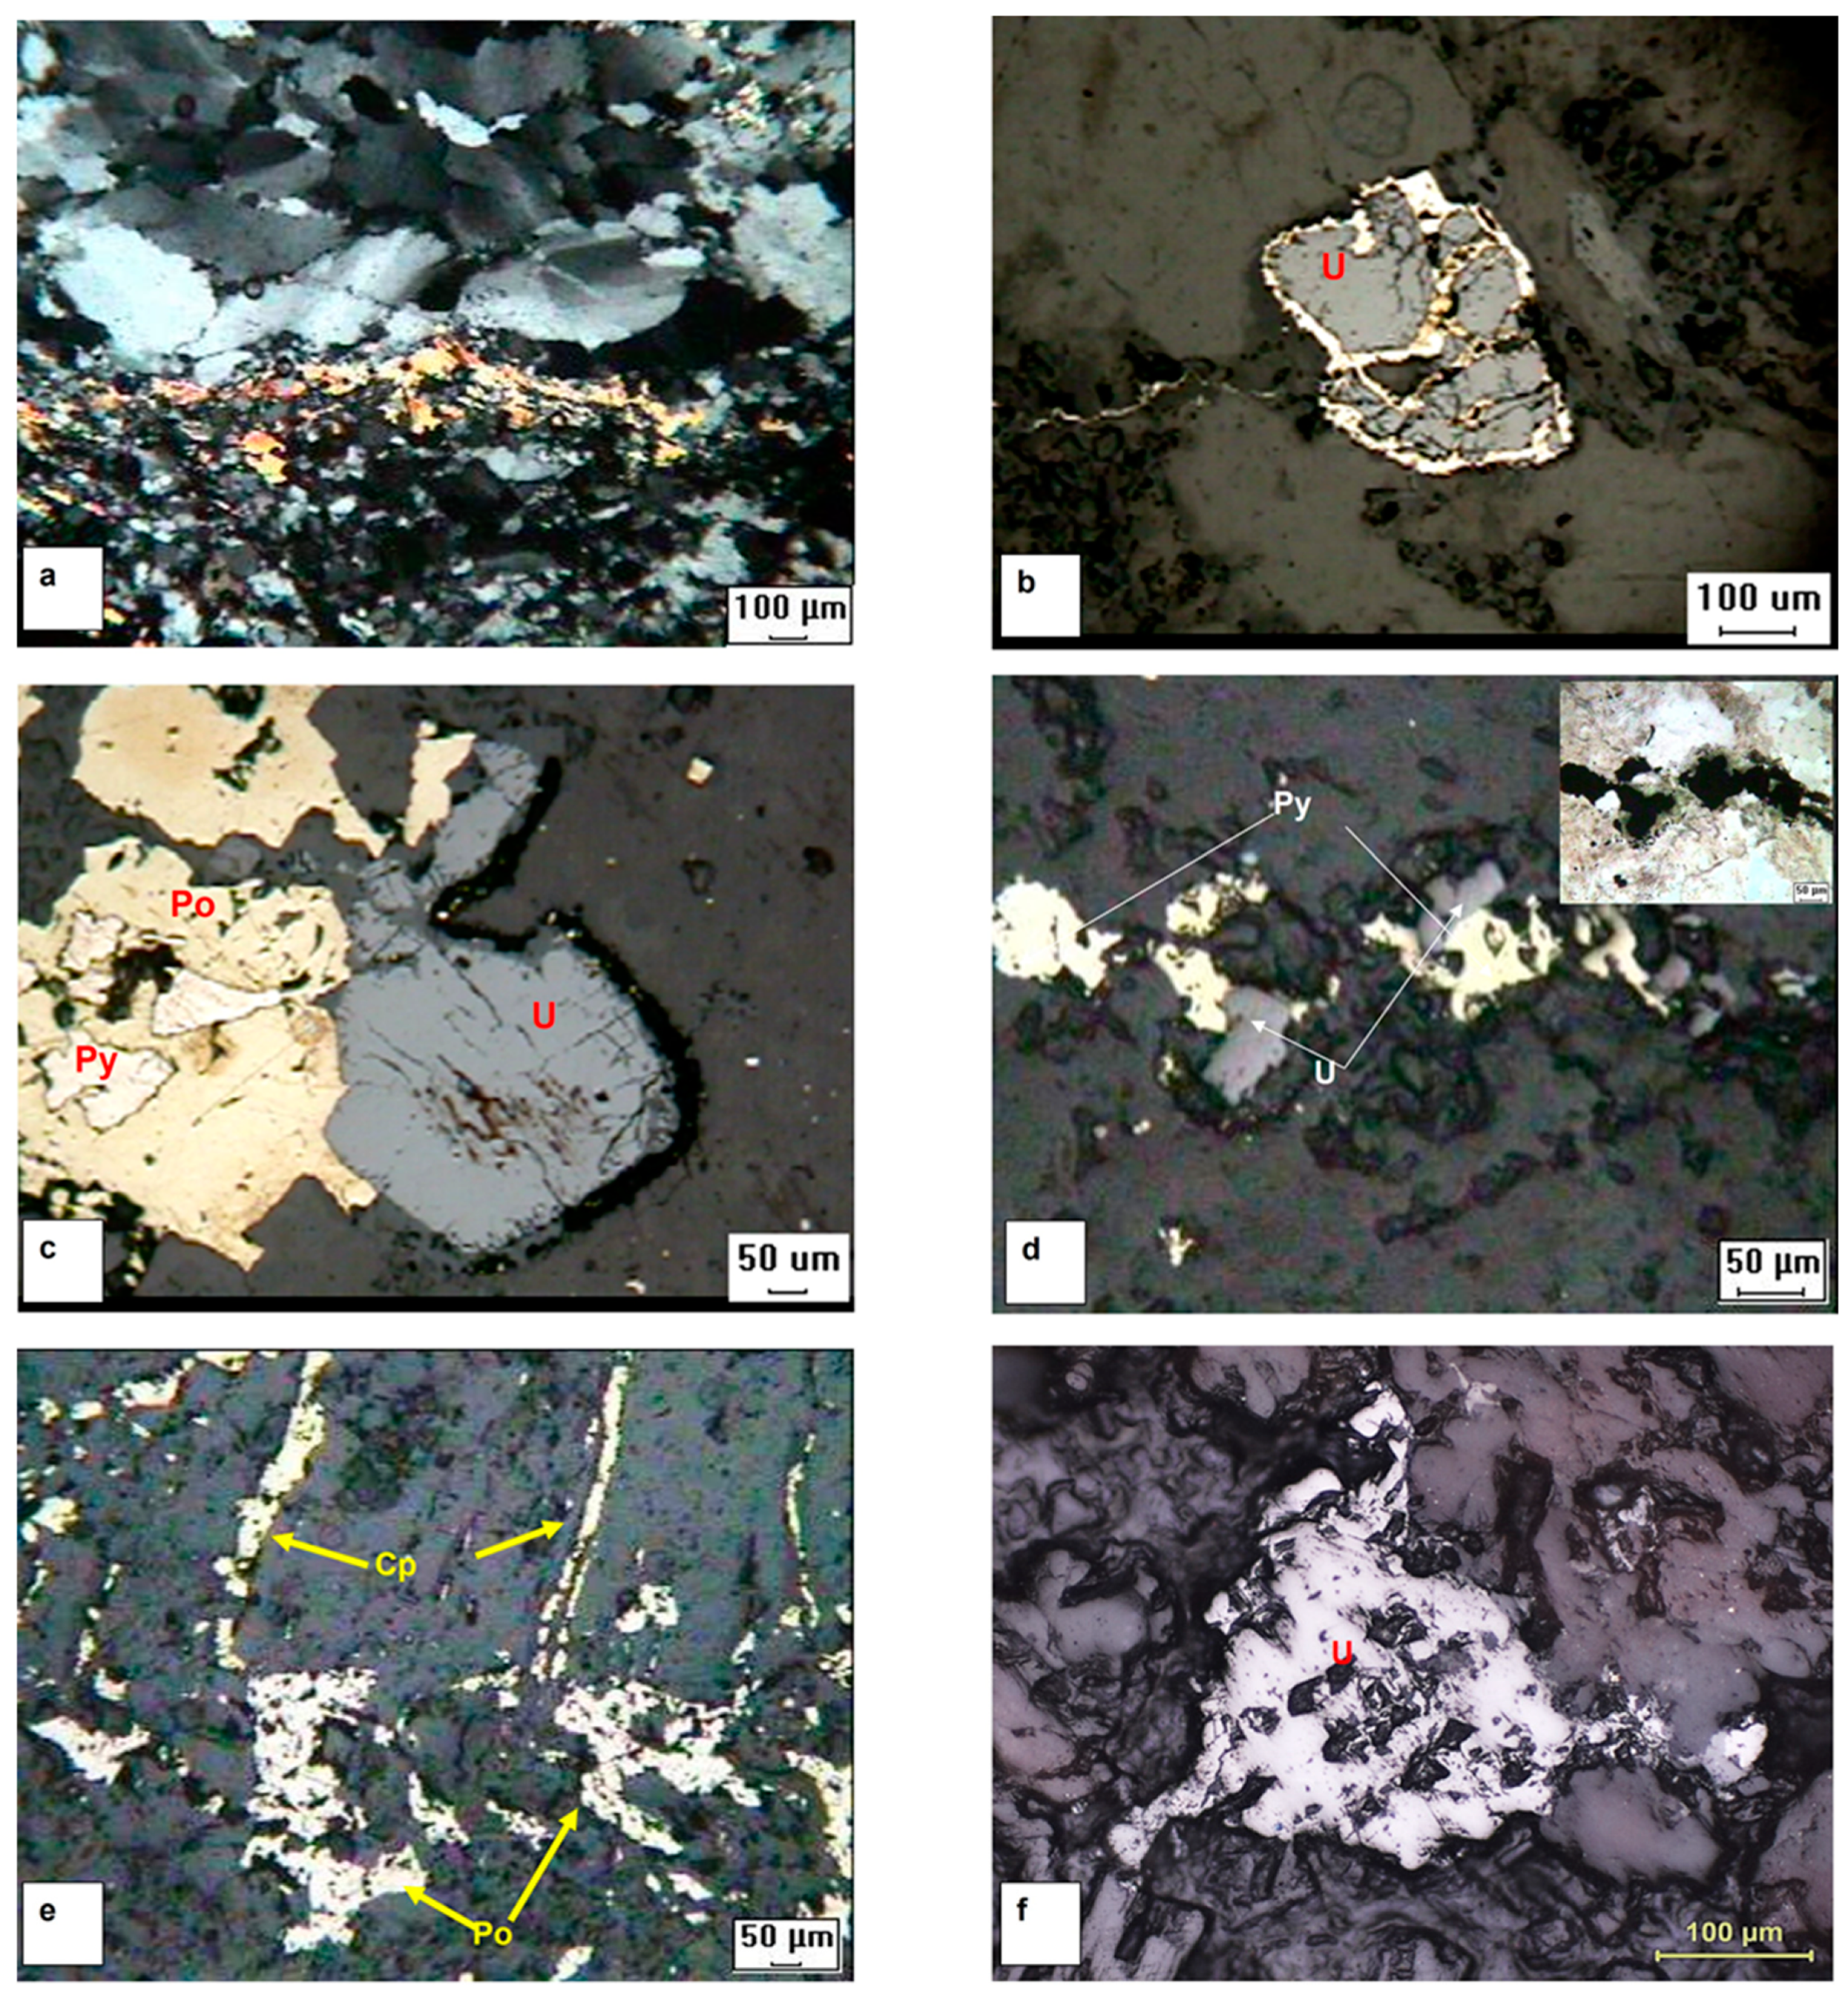
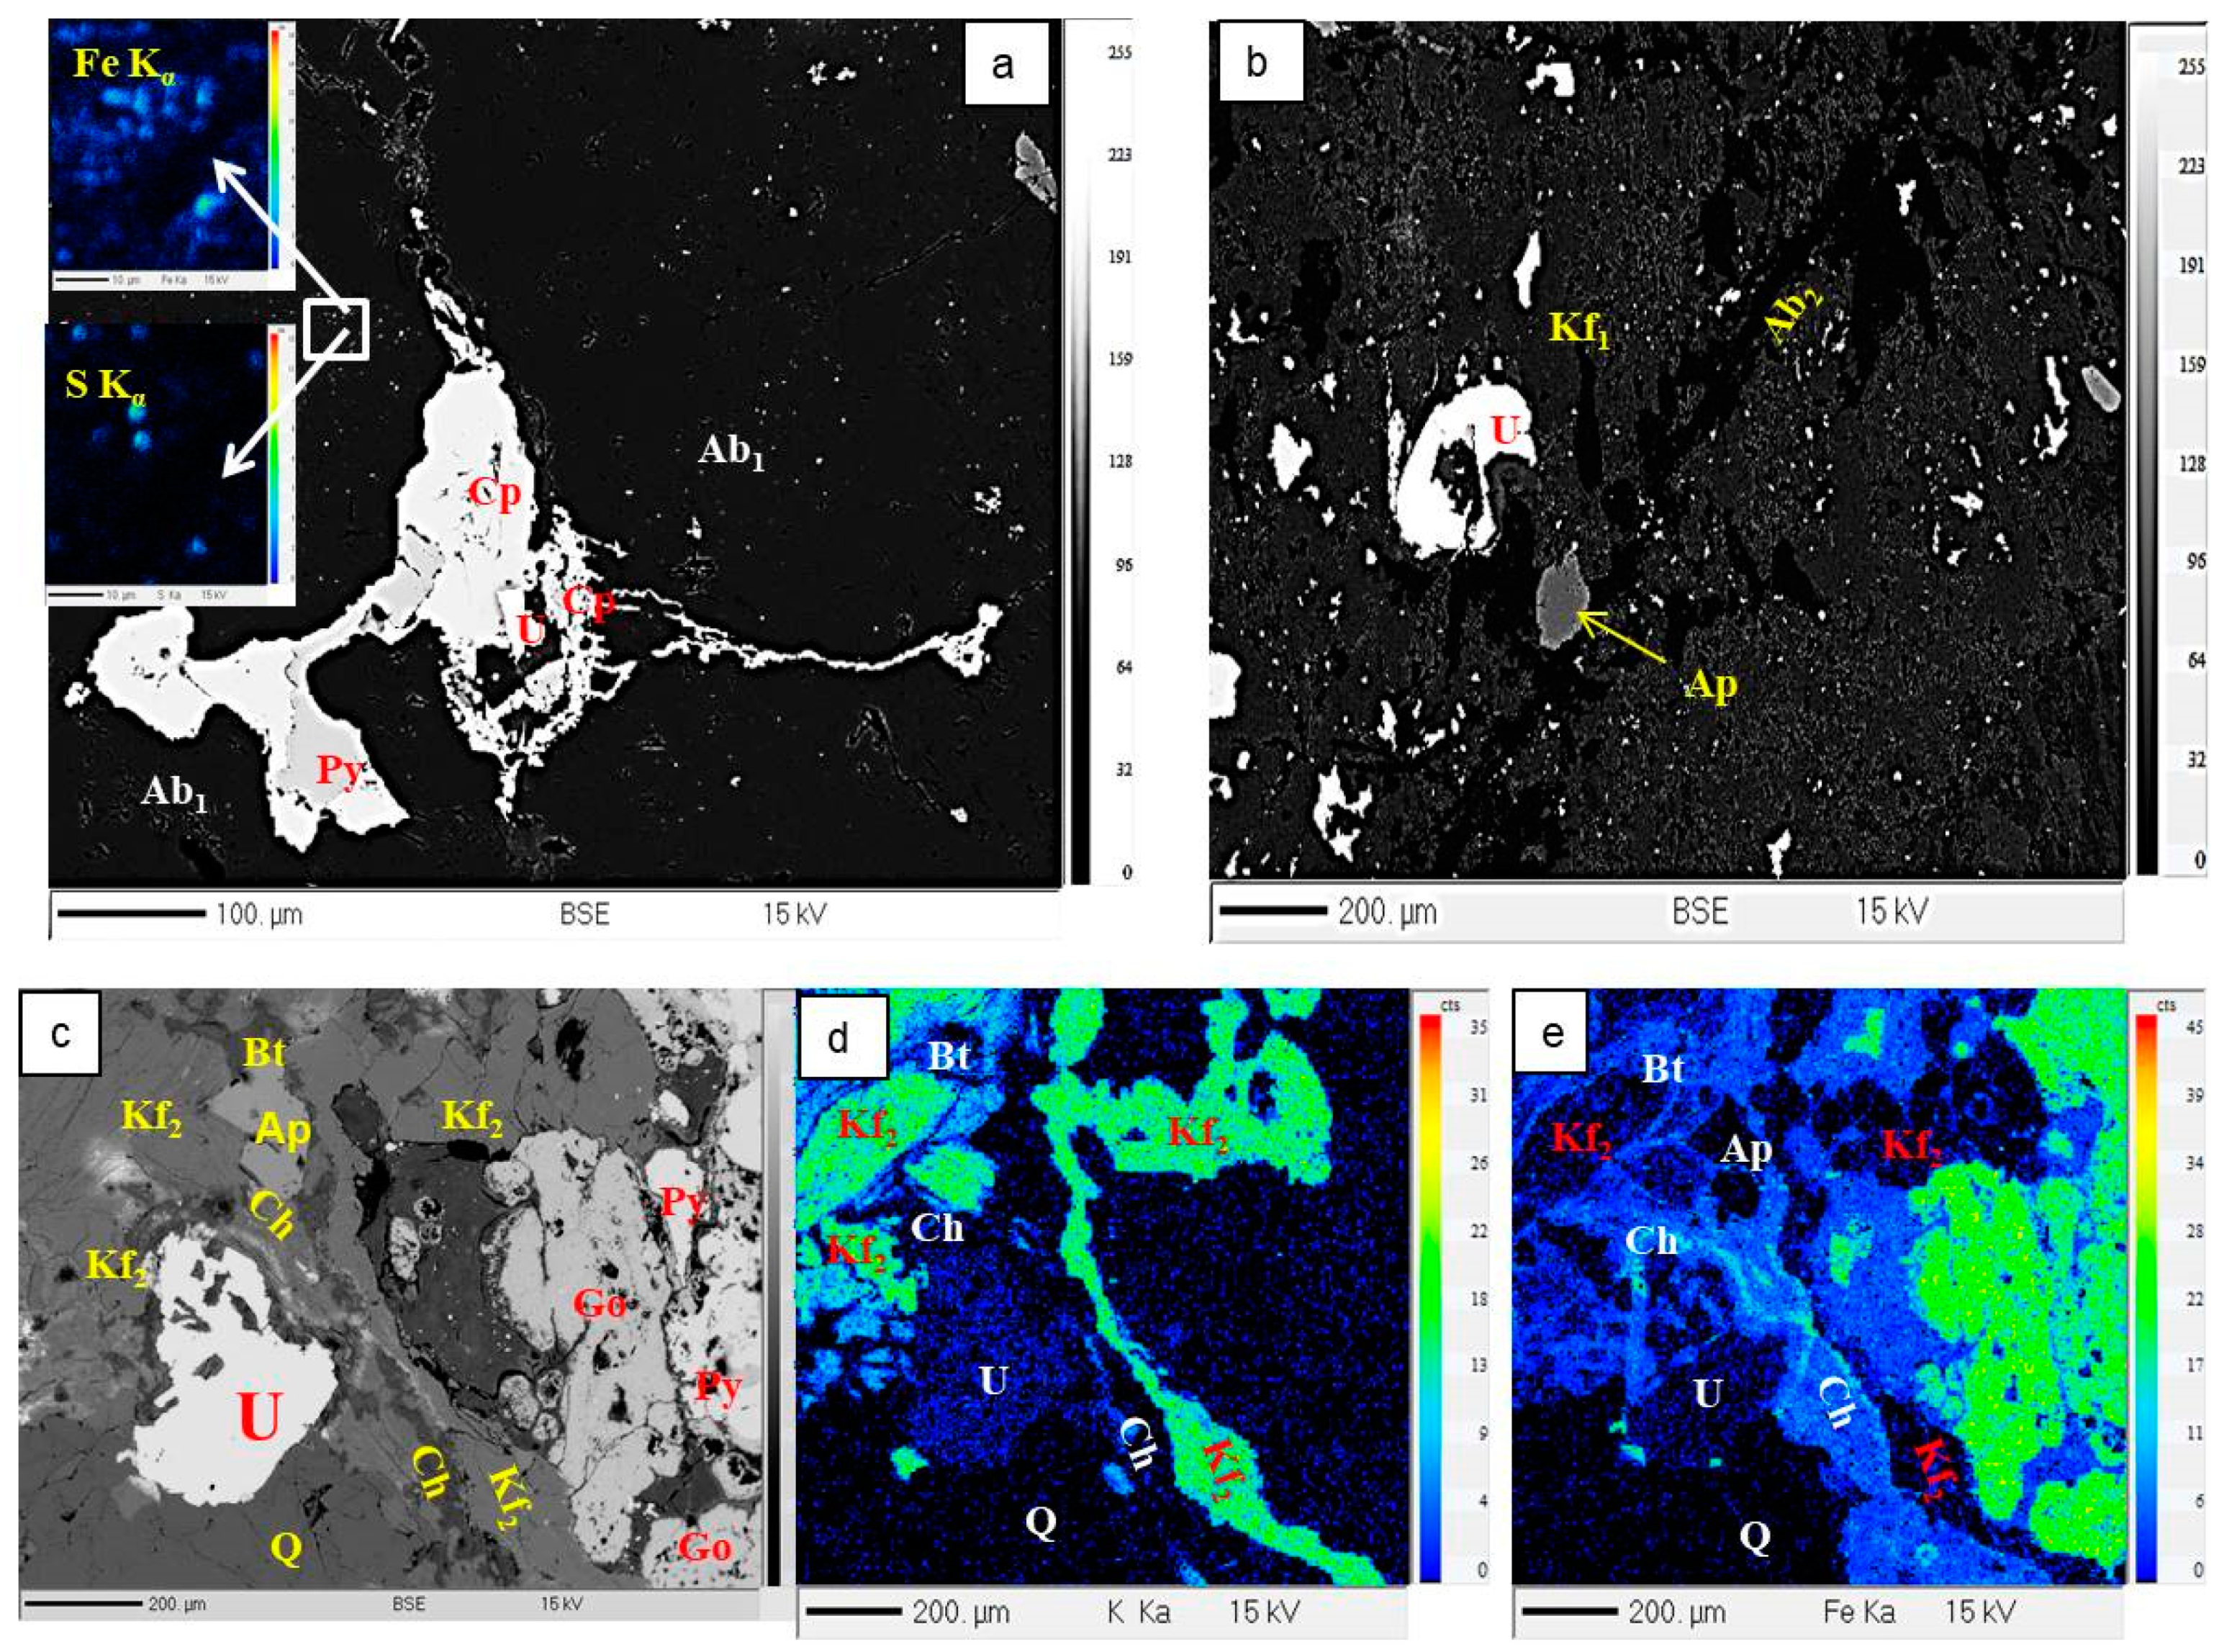
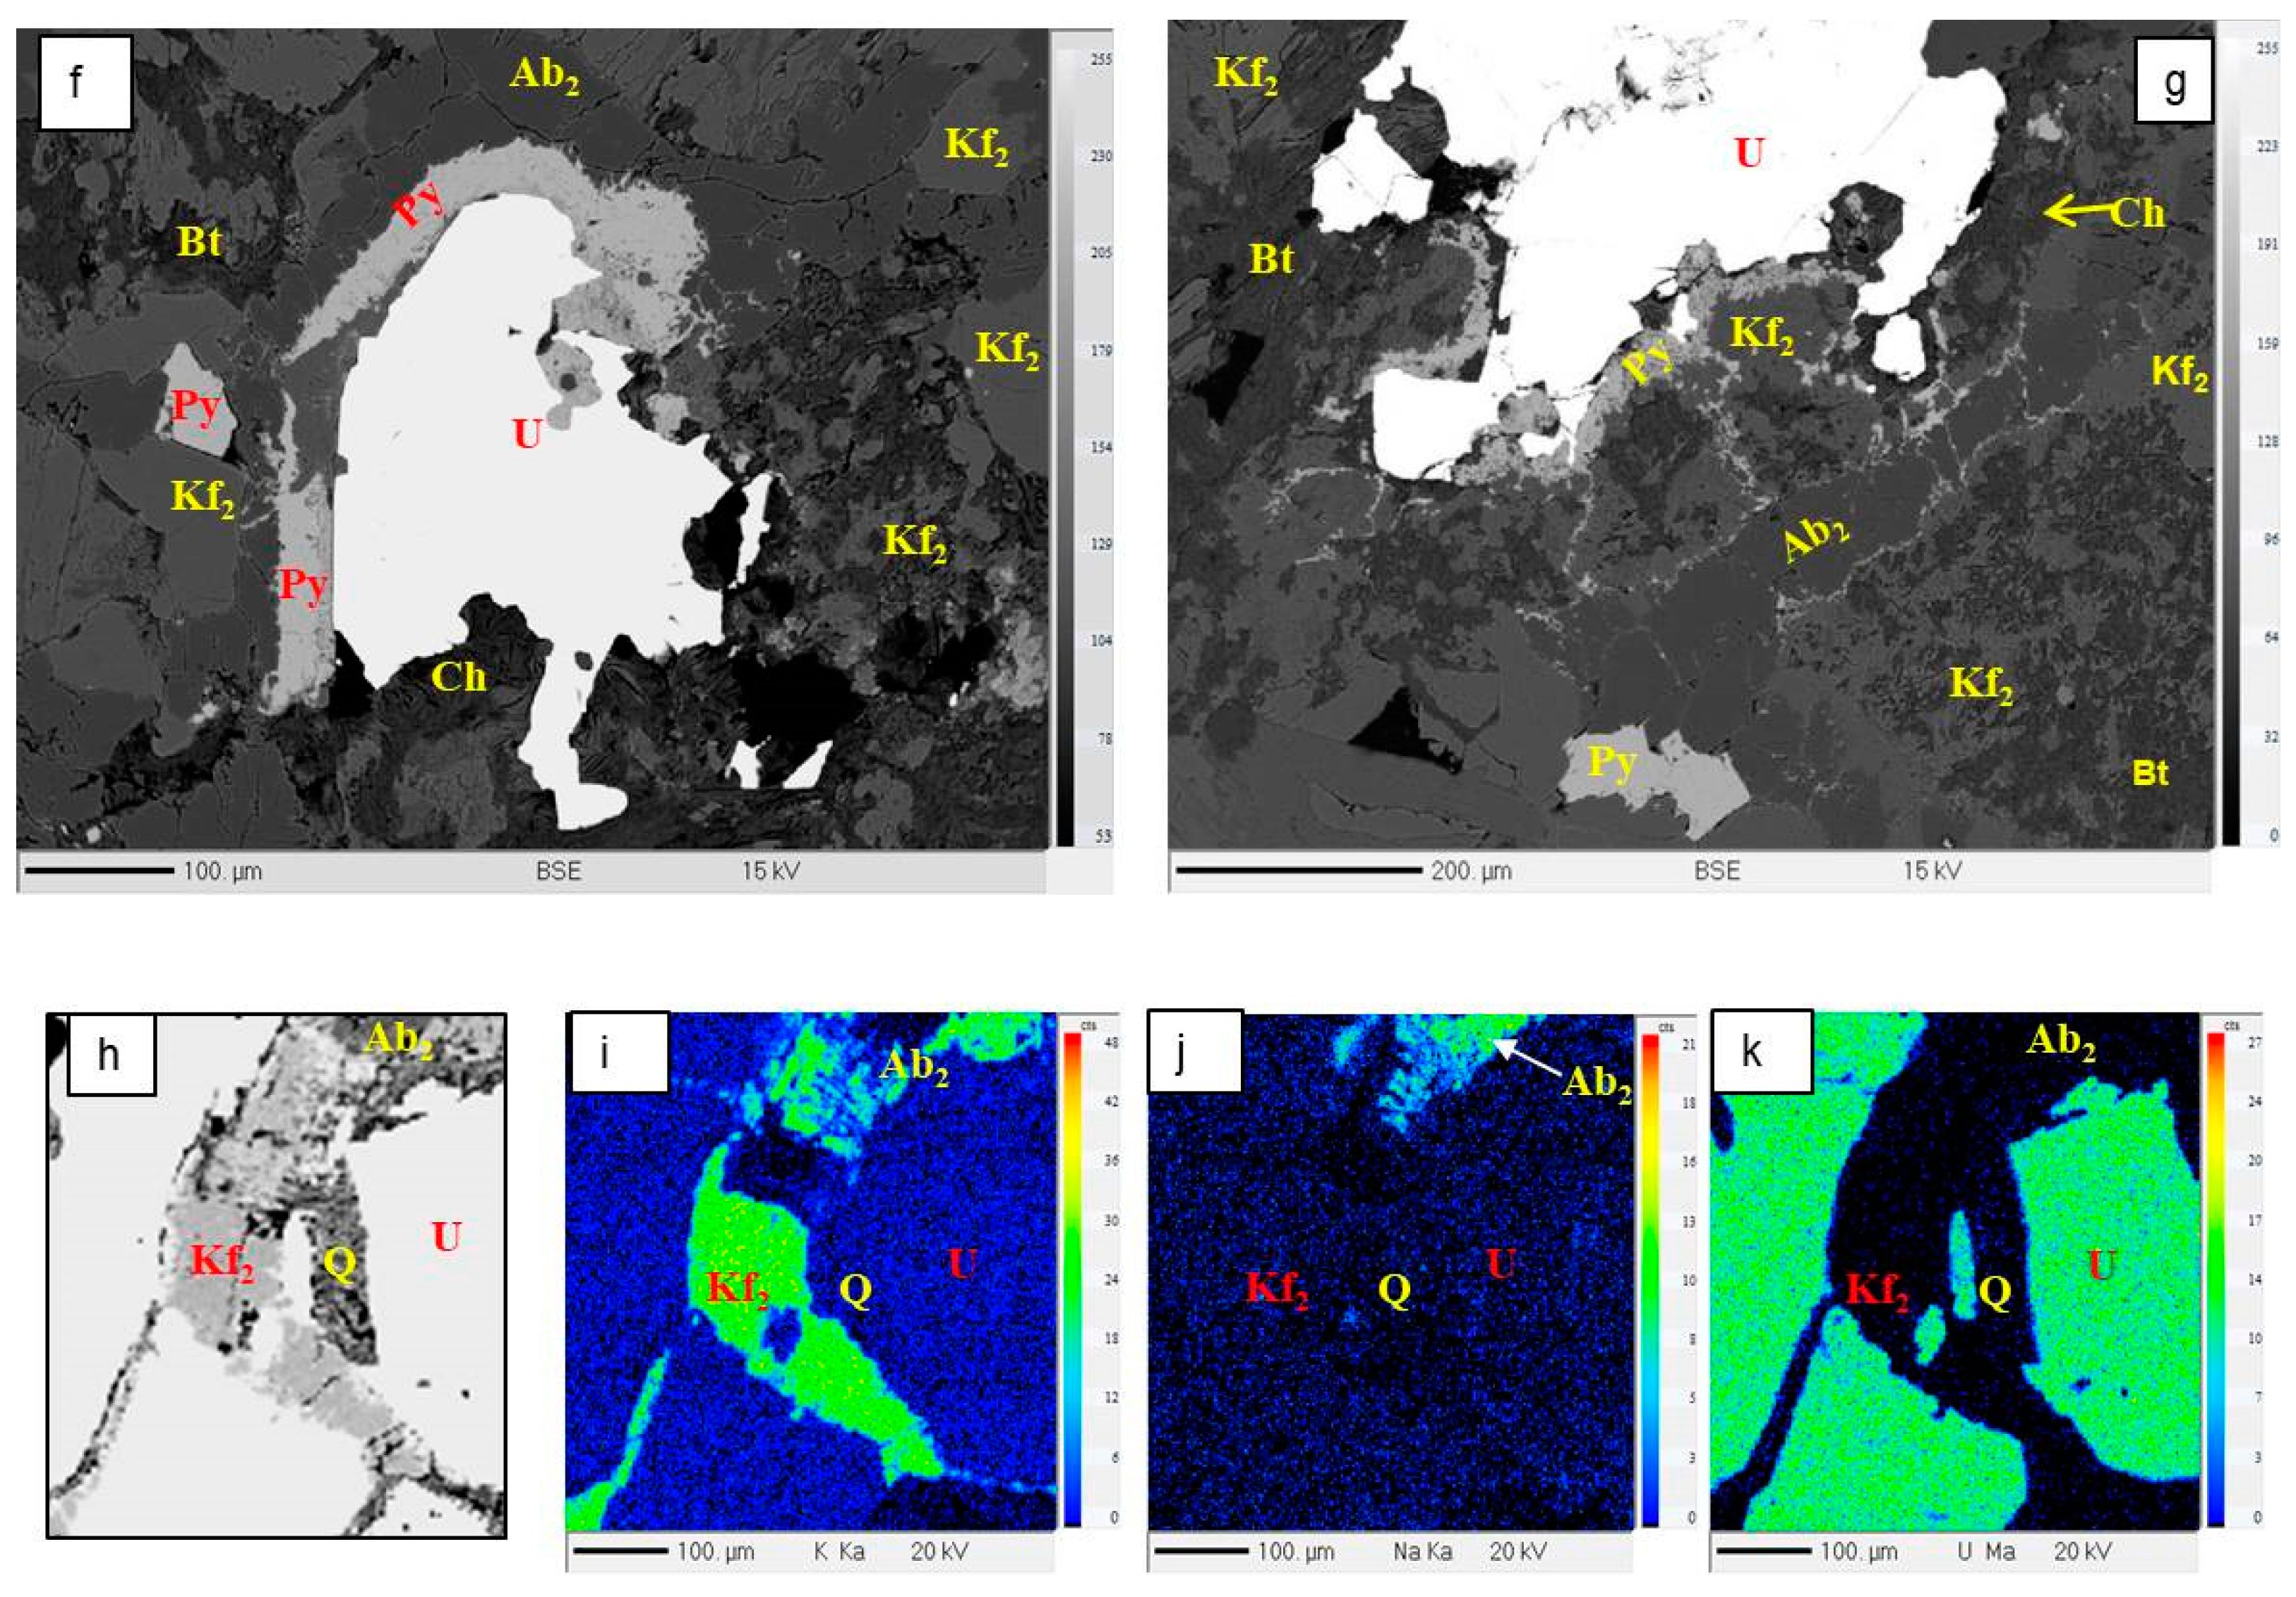
- The majority of uraninites are rimmed by pyrite and other sulphides. Uranyl ions must have been carried by sulphur-rich fluids, the latter forming later-stage sulphides.
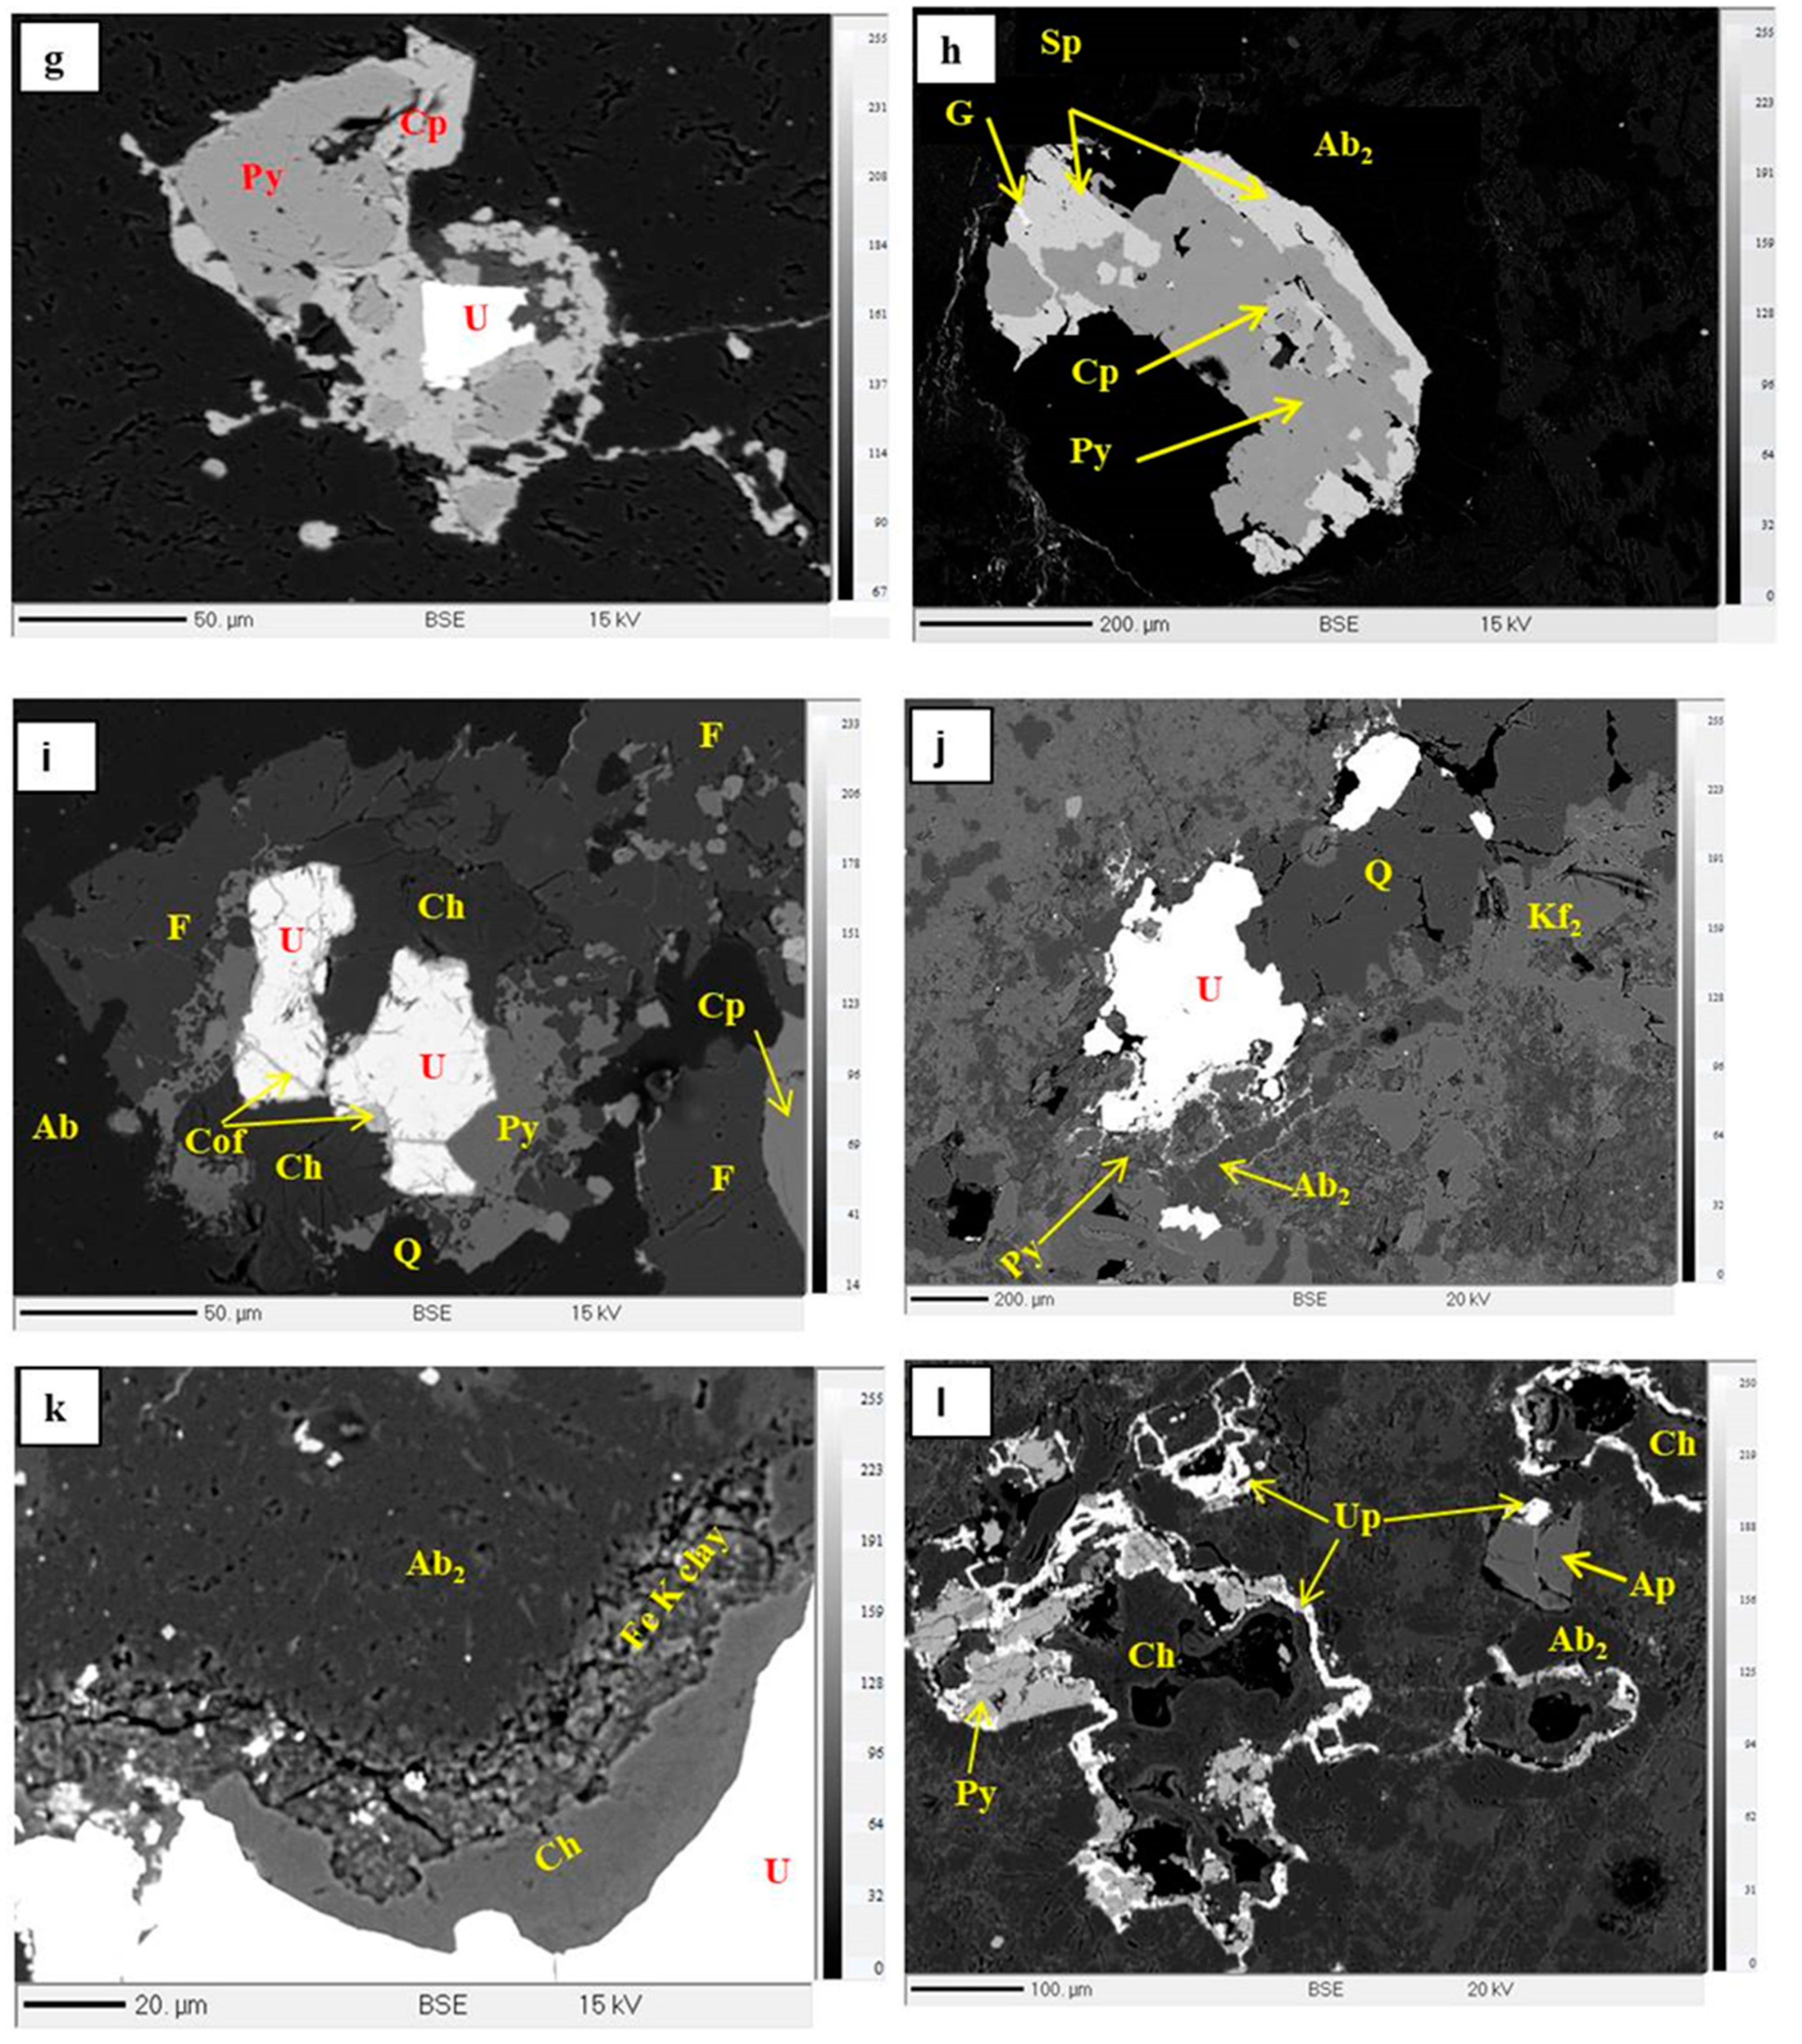
- Coffinitisation of uraninite along the fractures (Figure 10i) is indicative of the action of Si-rich fluids during the post-ore stage.
- Uranium phosphosilicate (Figure 10l) is a complex mineral that requires the presence of U-, P-, and Si- in the fluid phase within the system at the time of crystallisation.
5.2. Indications of Polymetallic Mineralisation
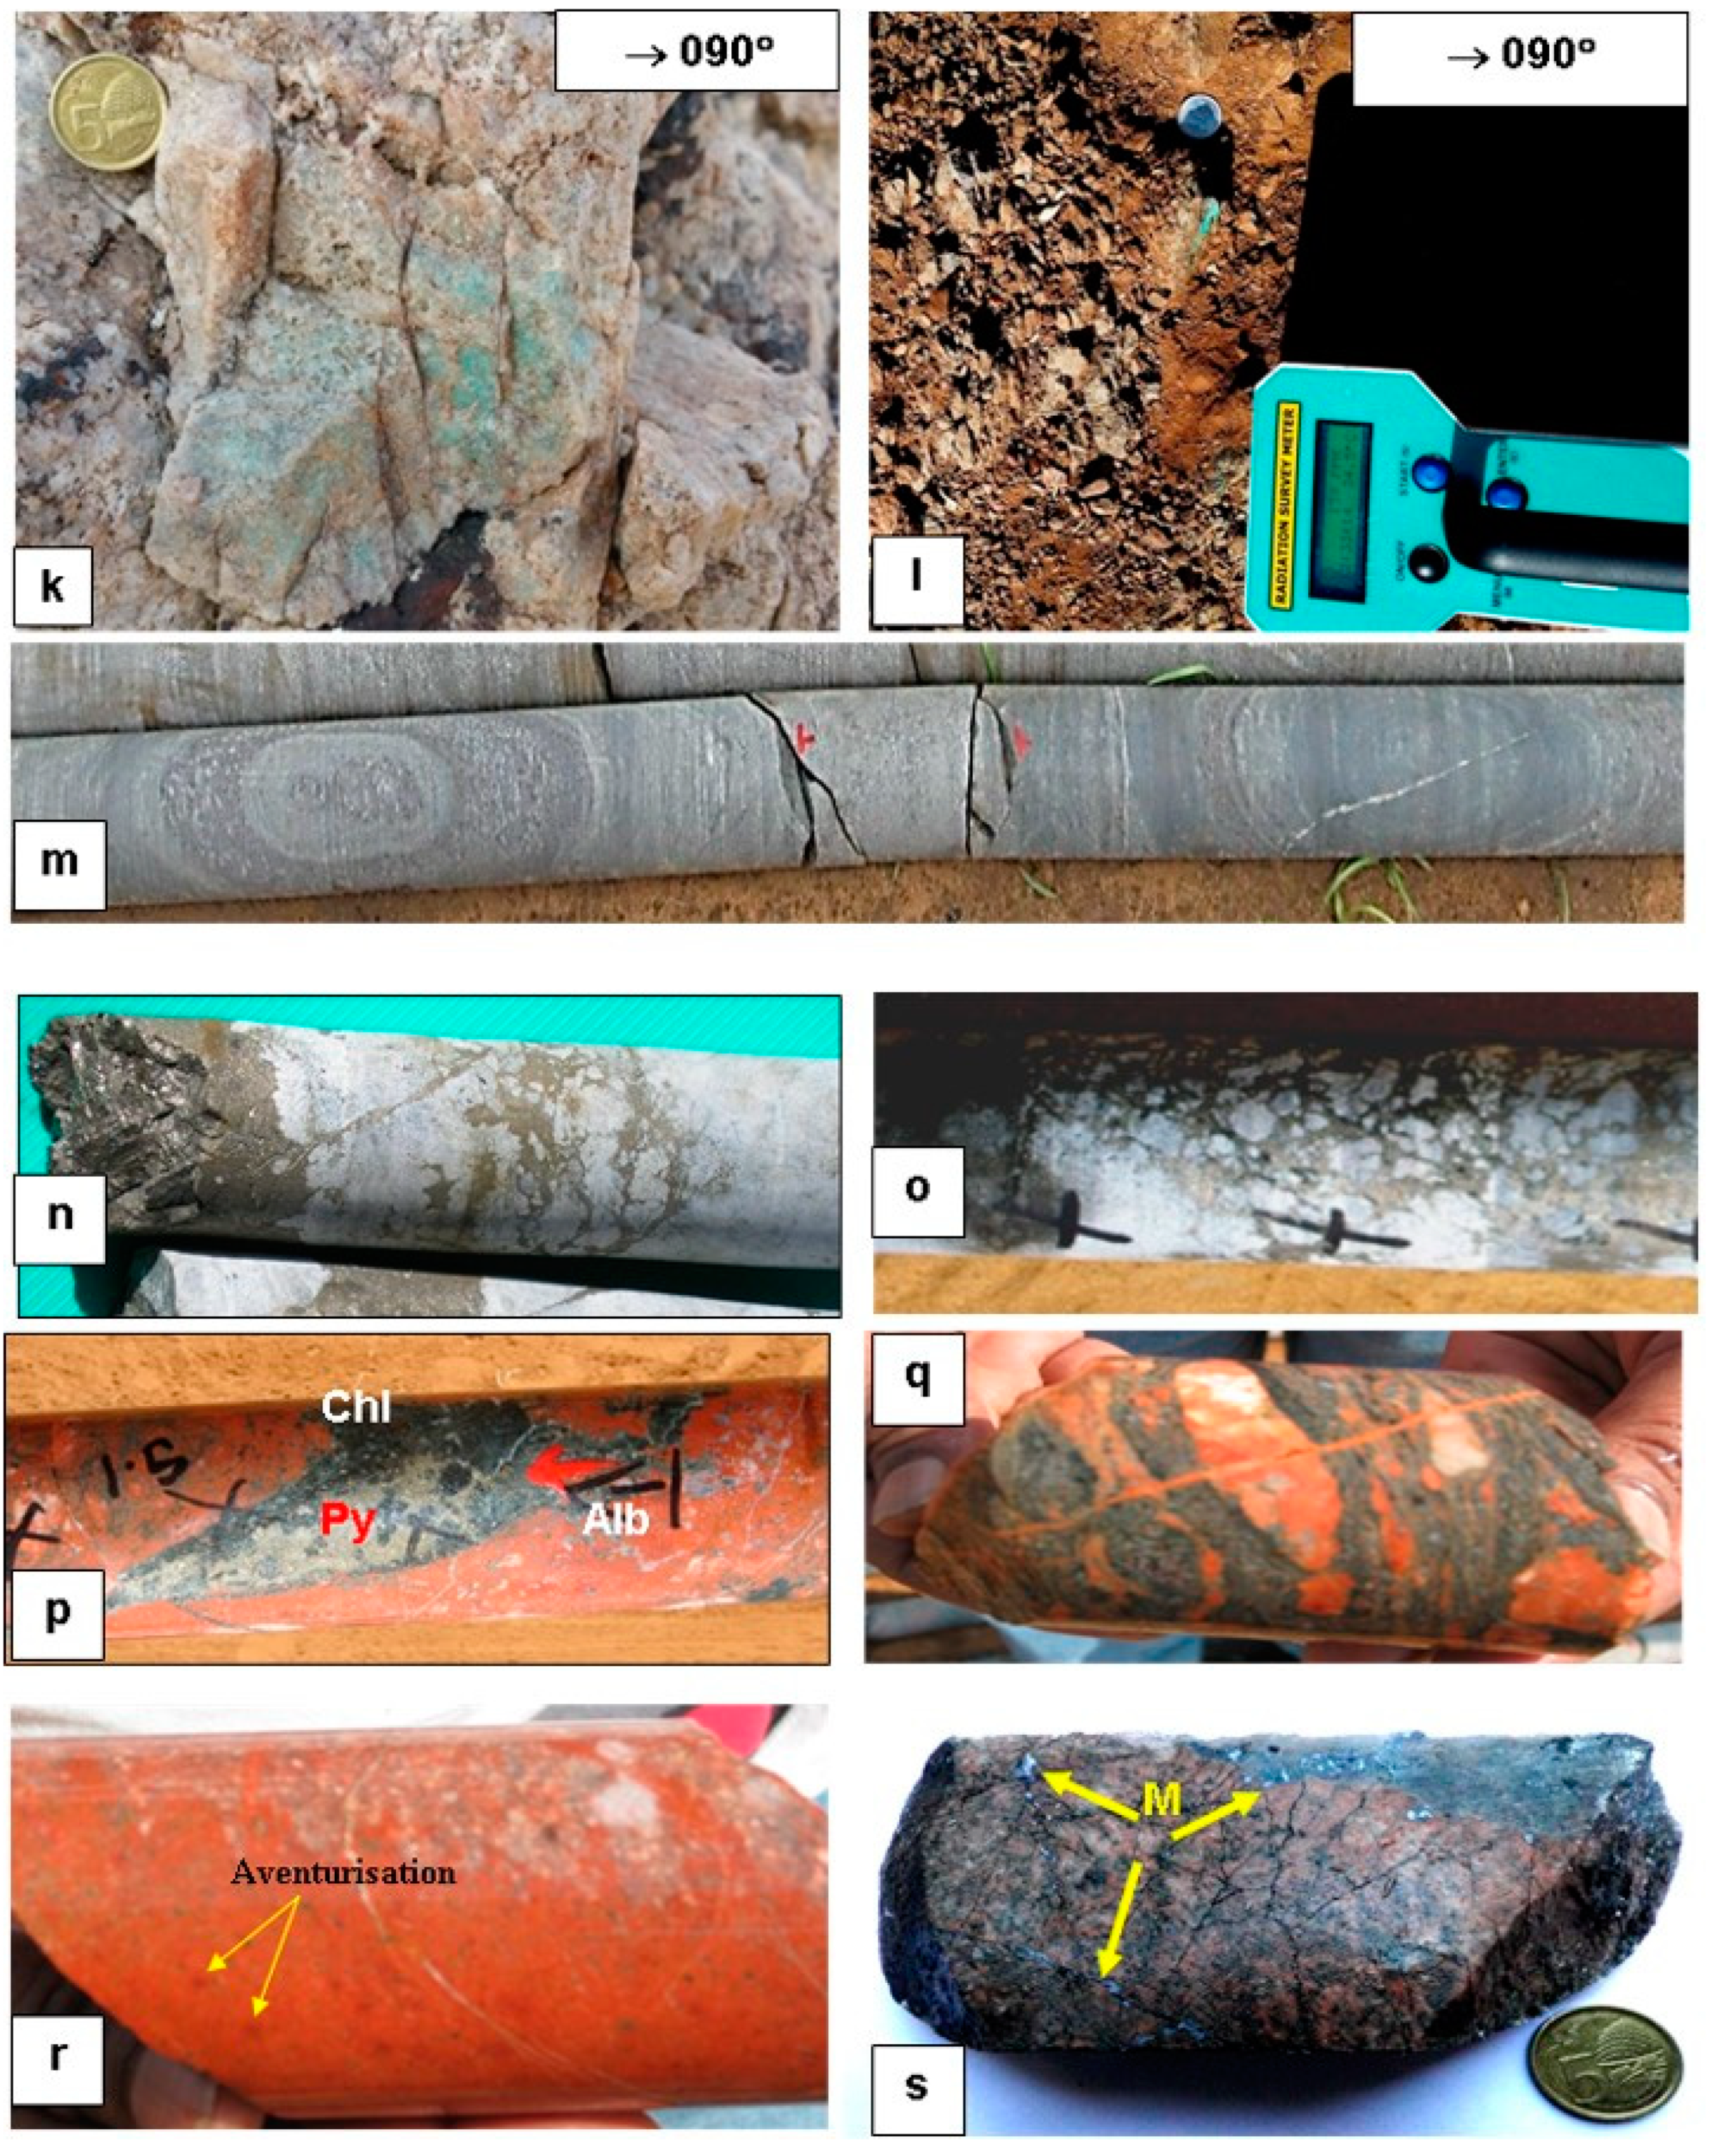
5.2.1. Aventurisation
5.2.2. Chloritisation and Sulphide Concentration
5.3. A Comparative Study of Rohil with Global Examples of Metasomatite Uranium Deposits
6. Conclusions
- I.
- The reaction-induced porosity and sawtooth-shaped intergrowths were developed during the alteration of microcline to albite, forming a network of microfractures that enables pervasive fluid flow.
- II.
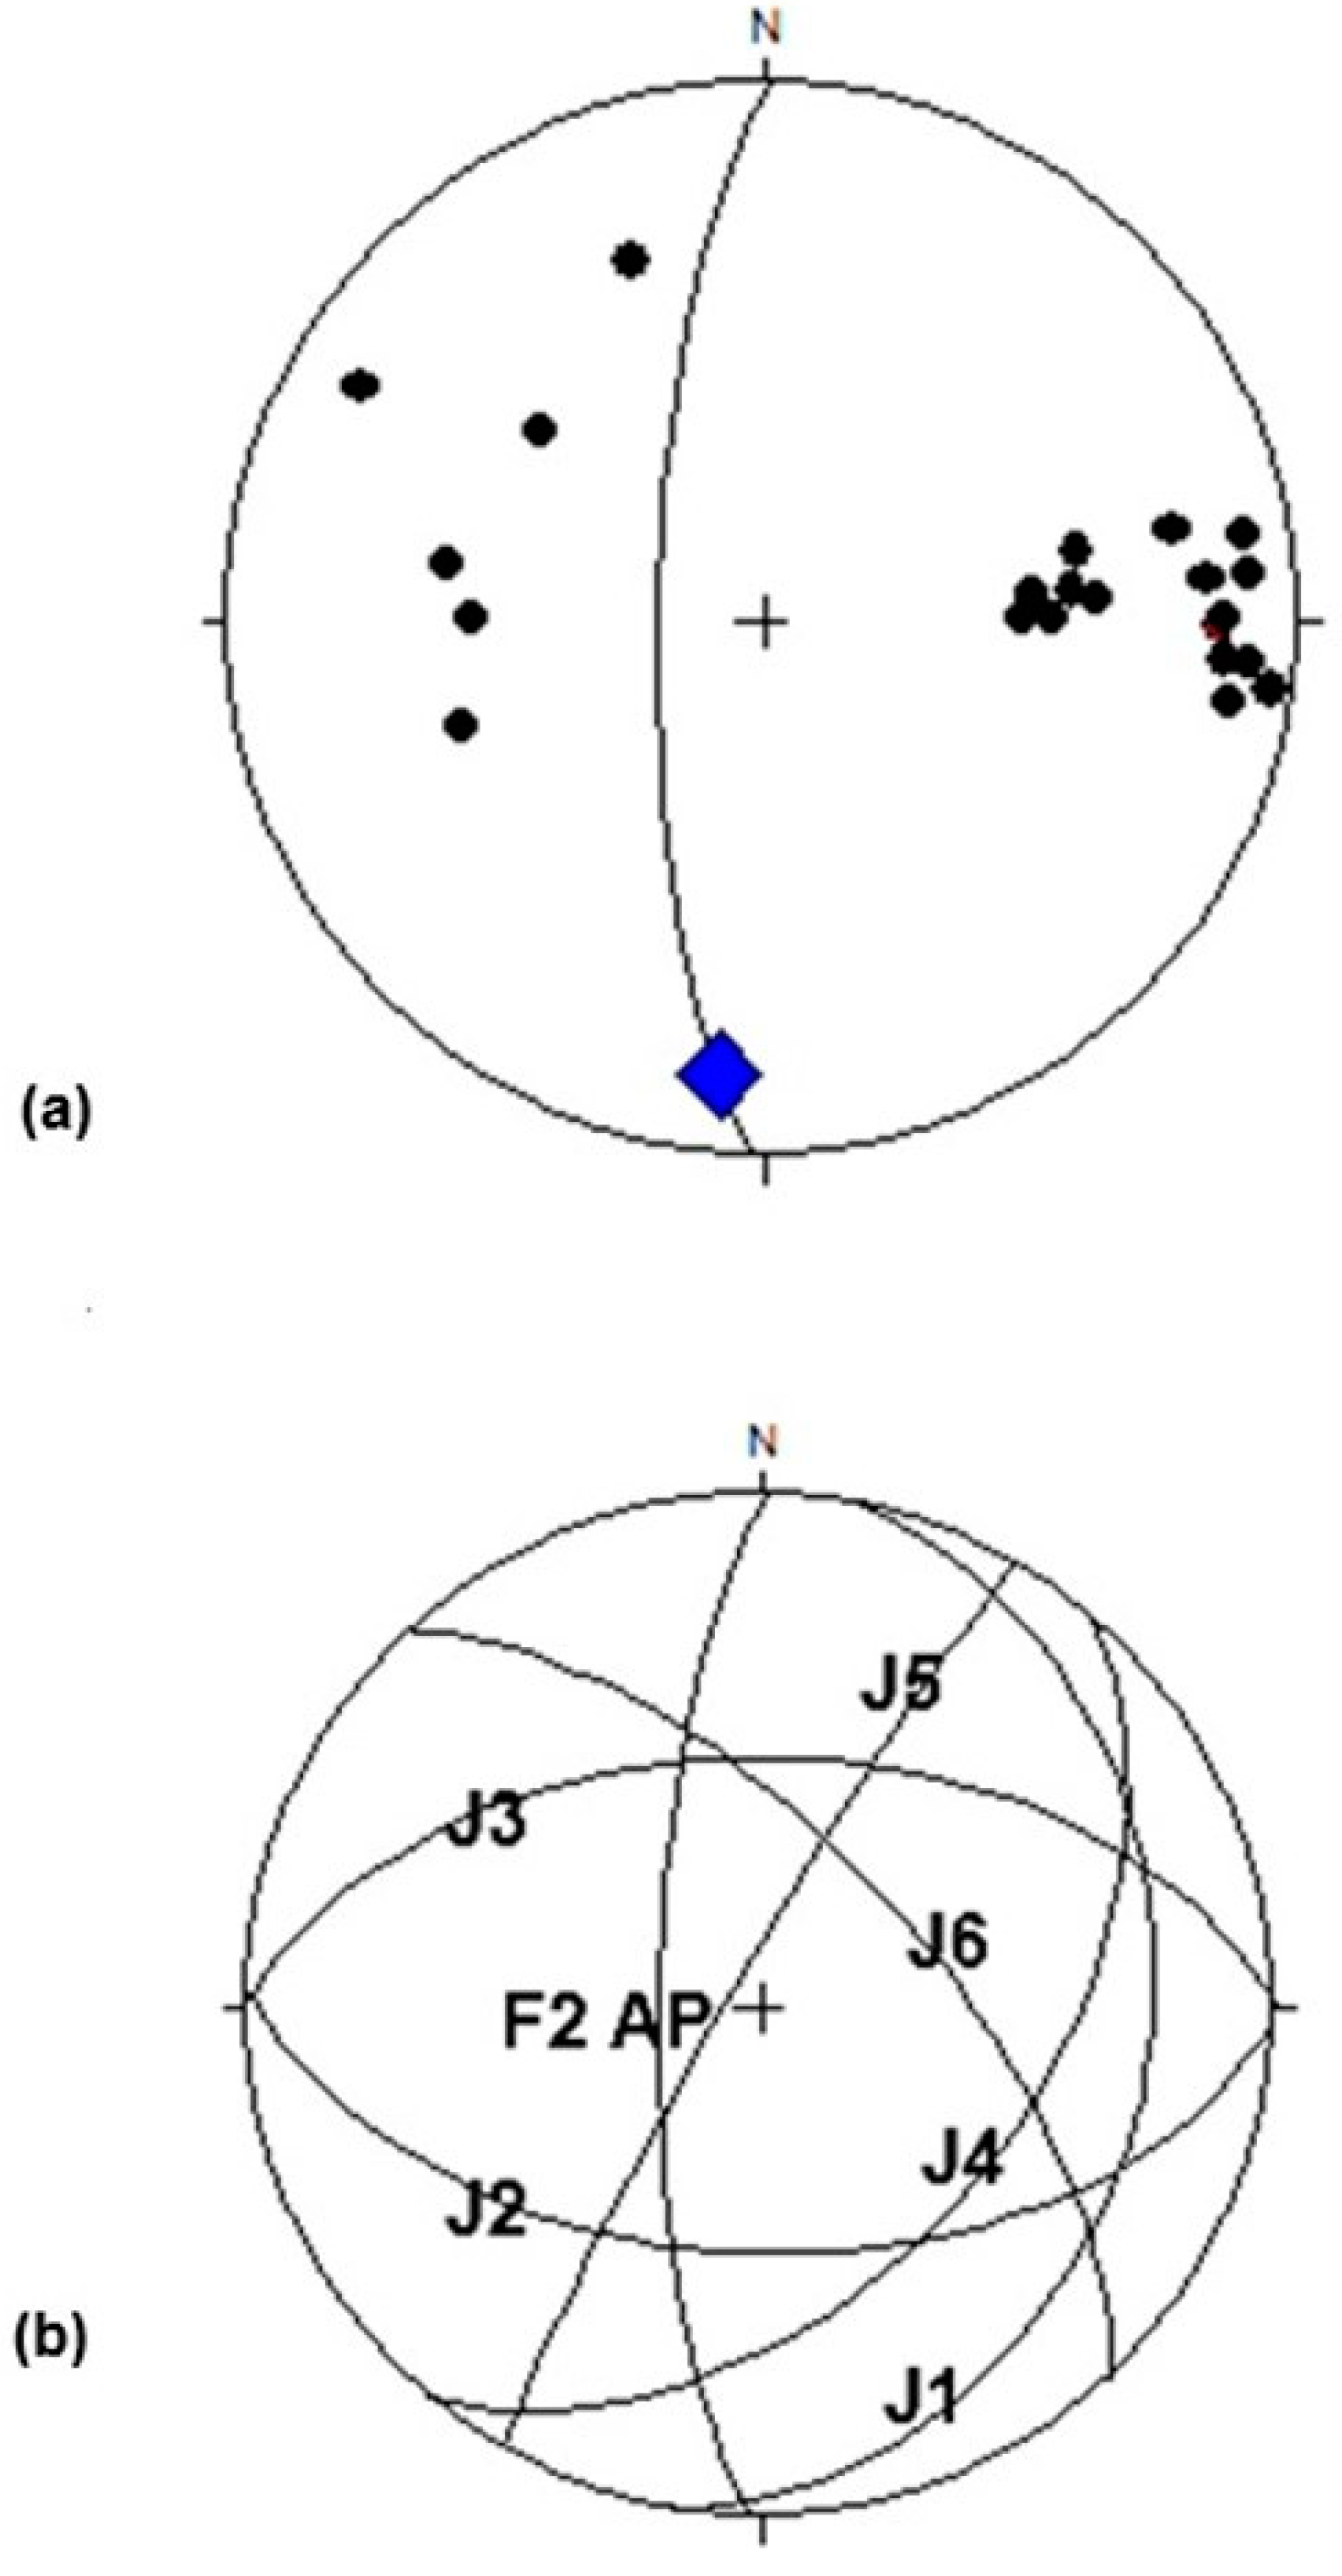
- Polymetallic mineralisation is structurally controlled and extends dominantly along the fractures that are parallel to the F2 axial surfaces. Mineralisation is syn- to post-kinematic and located along the N-S structural grain.
- III.
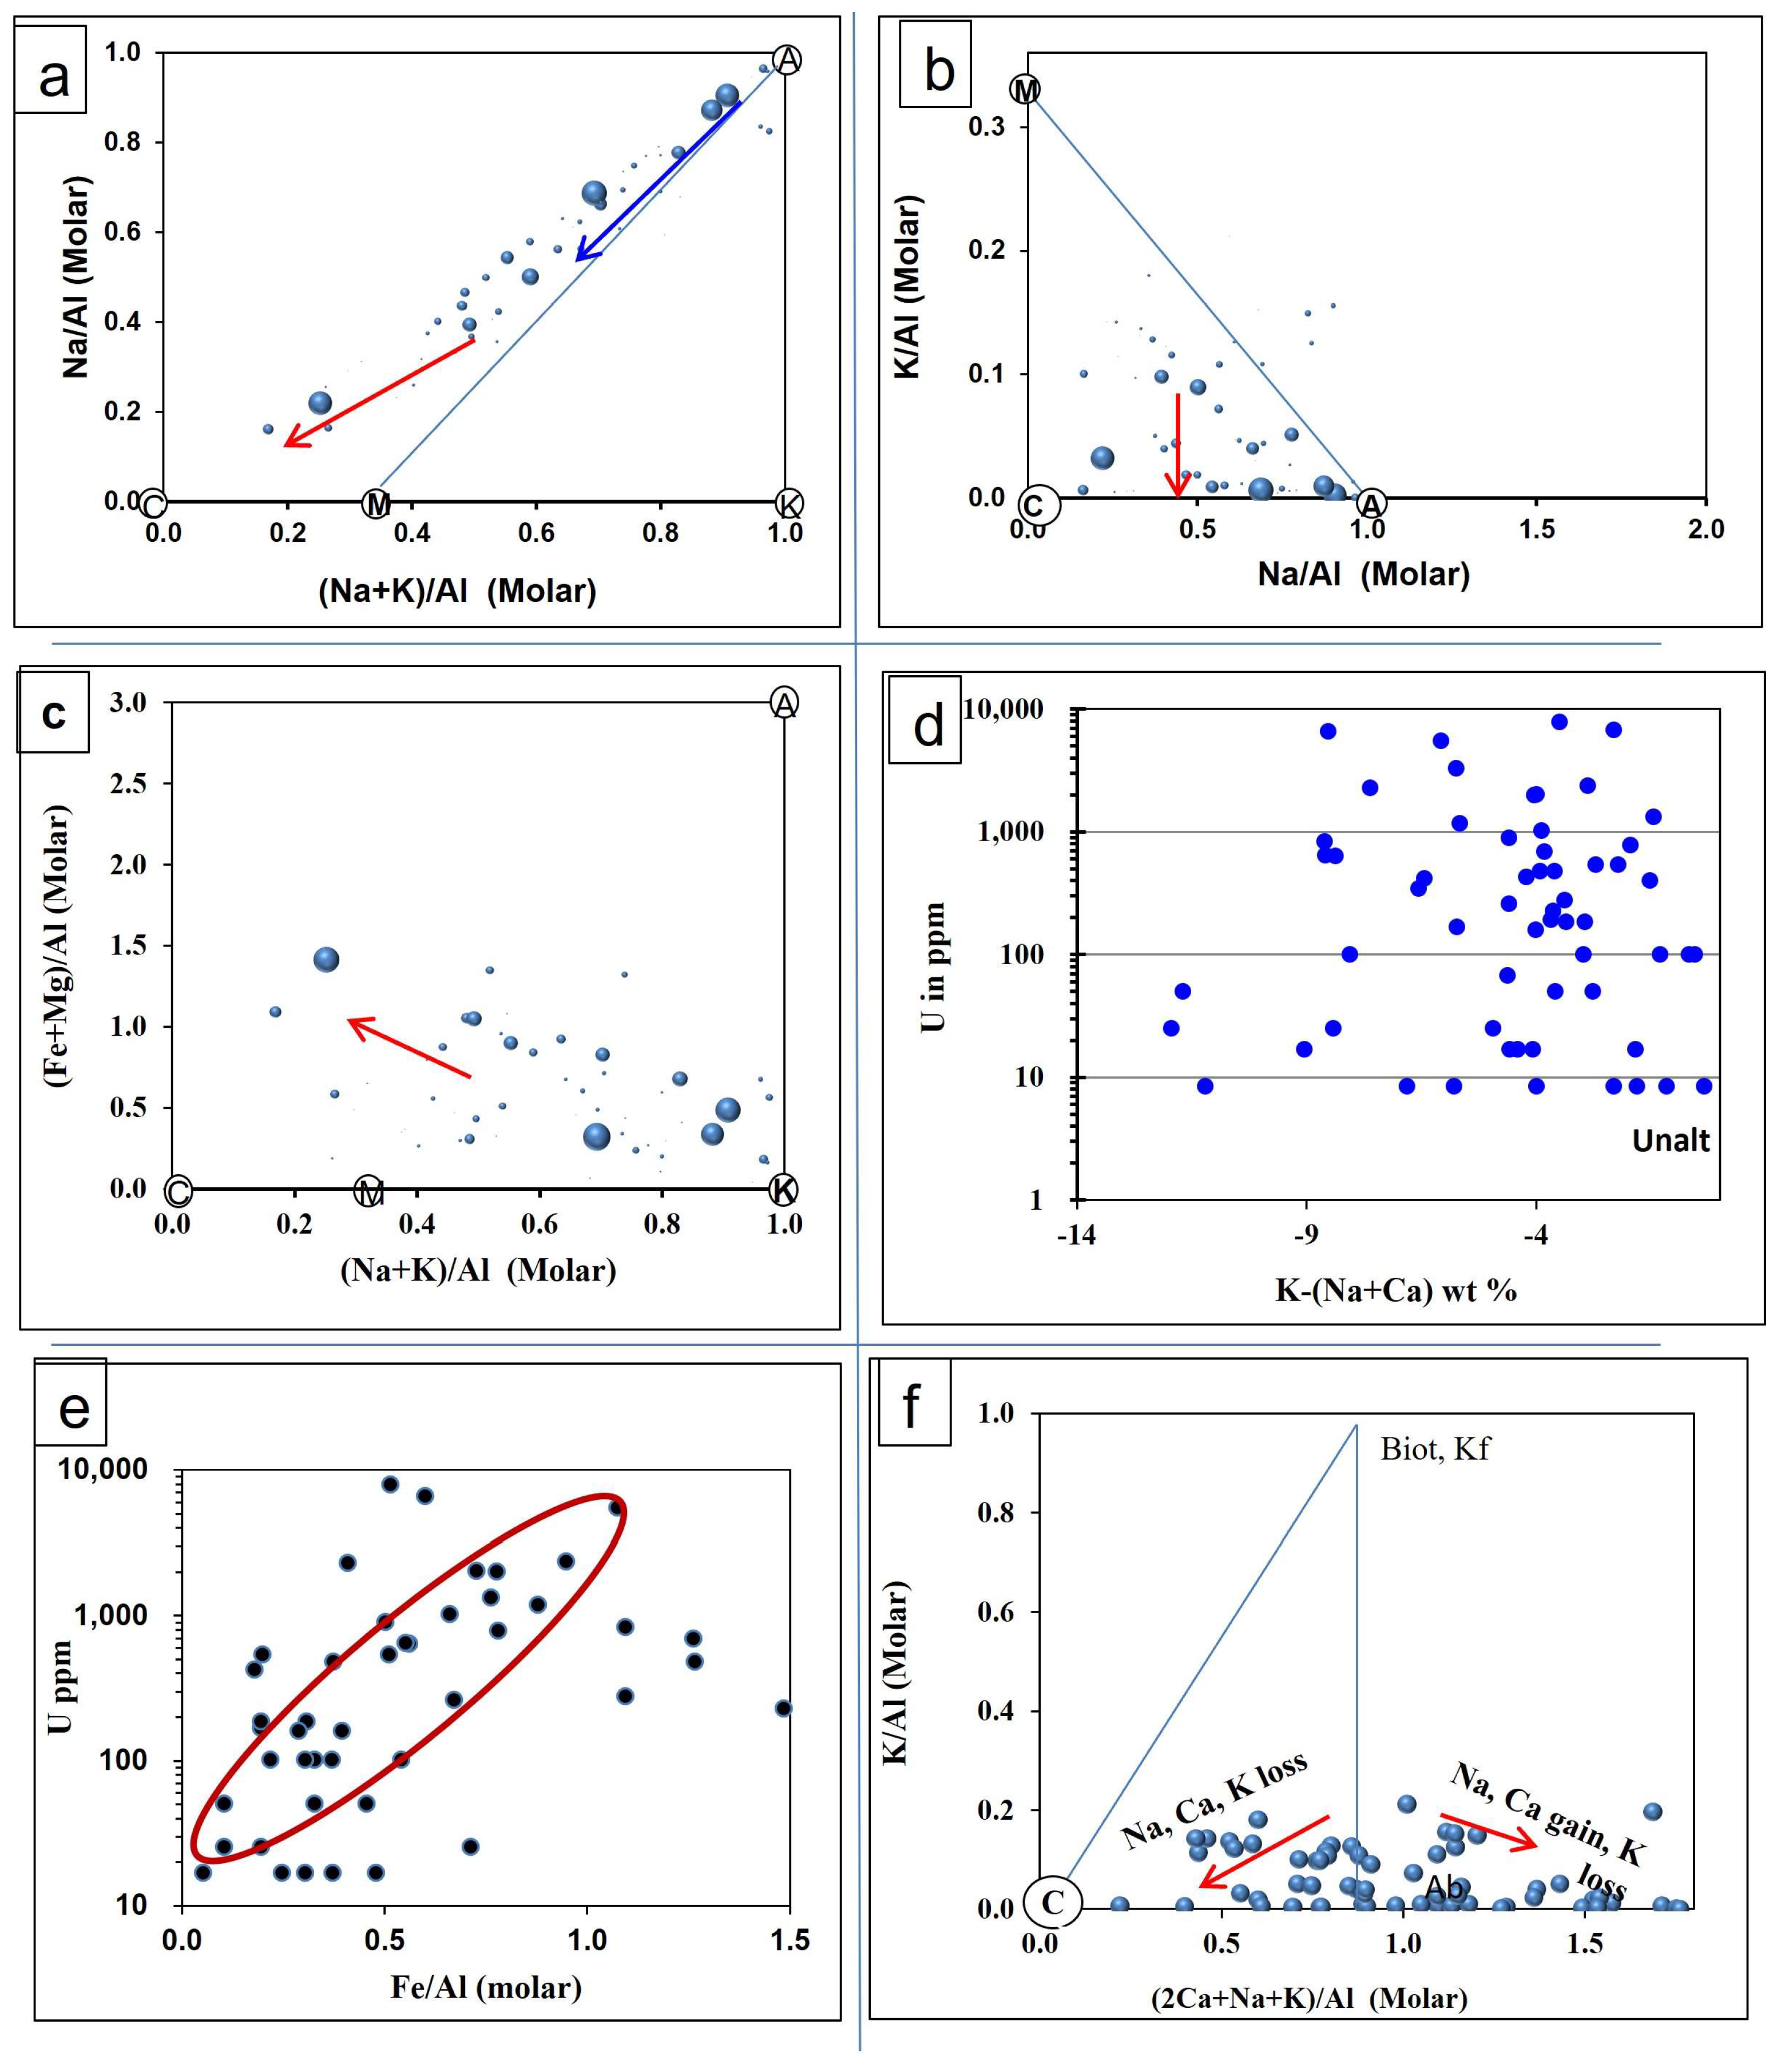
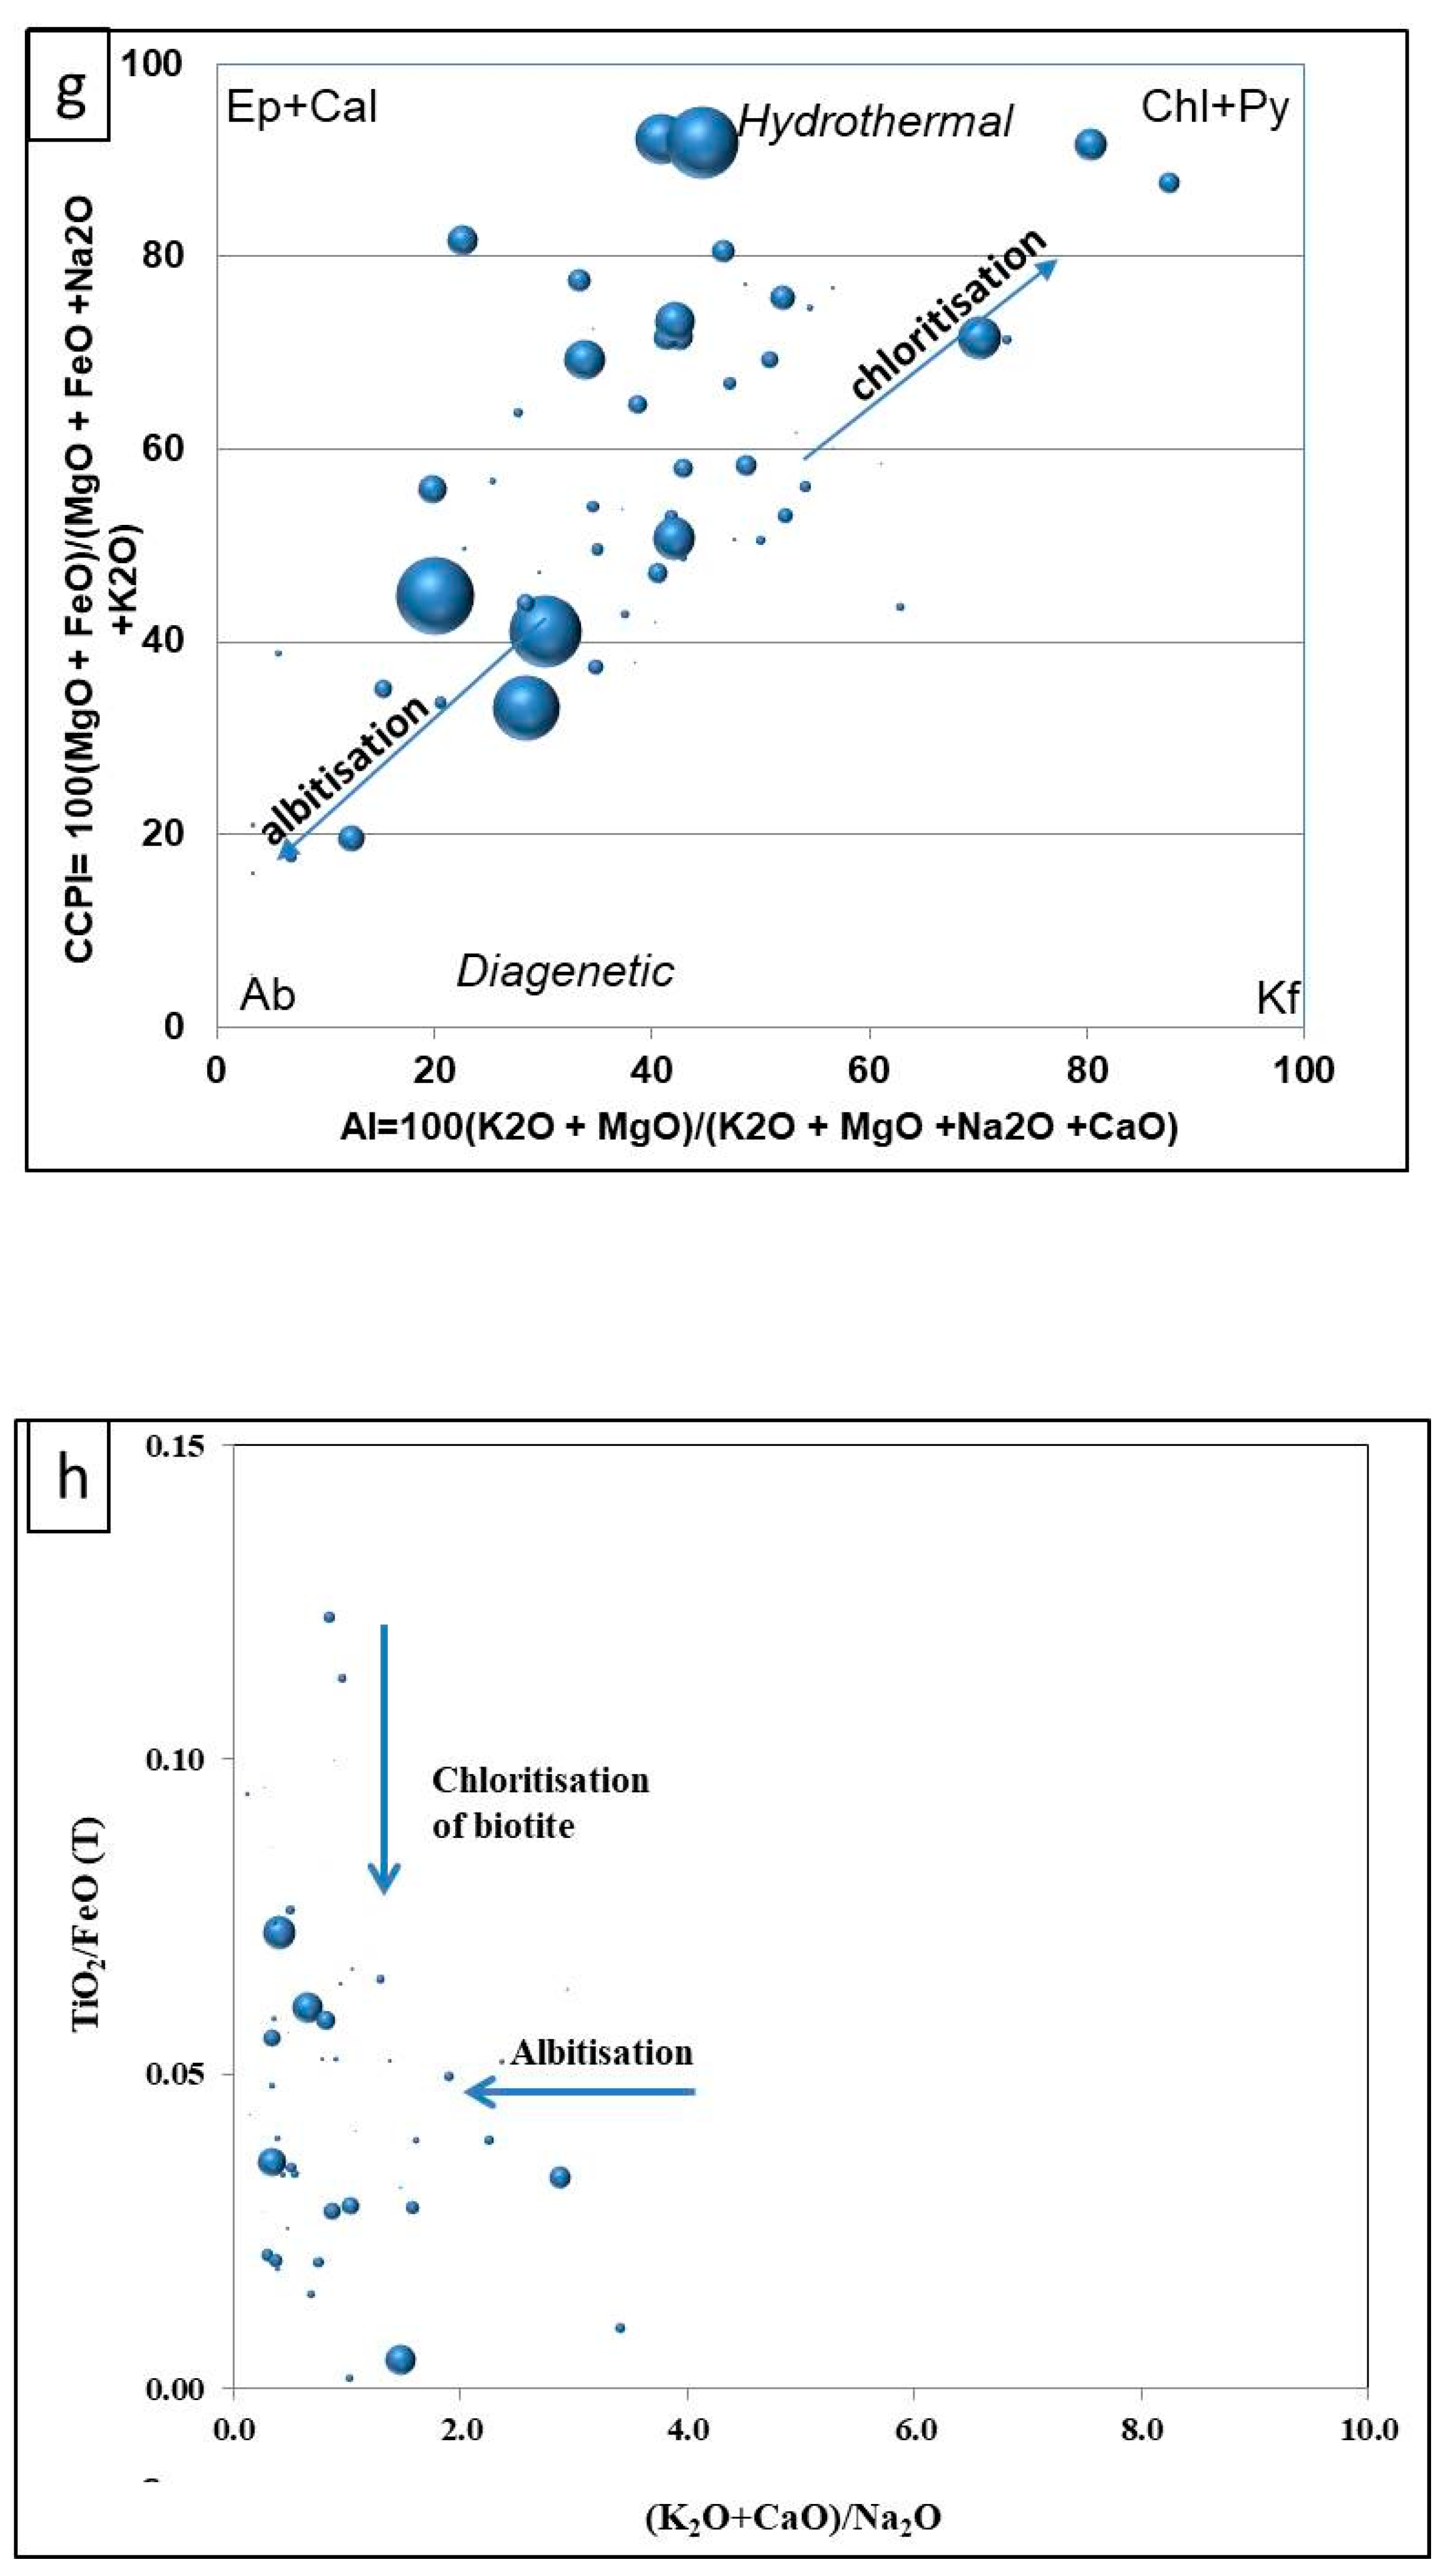
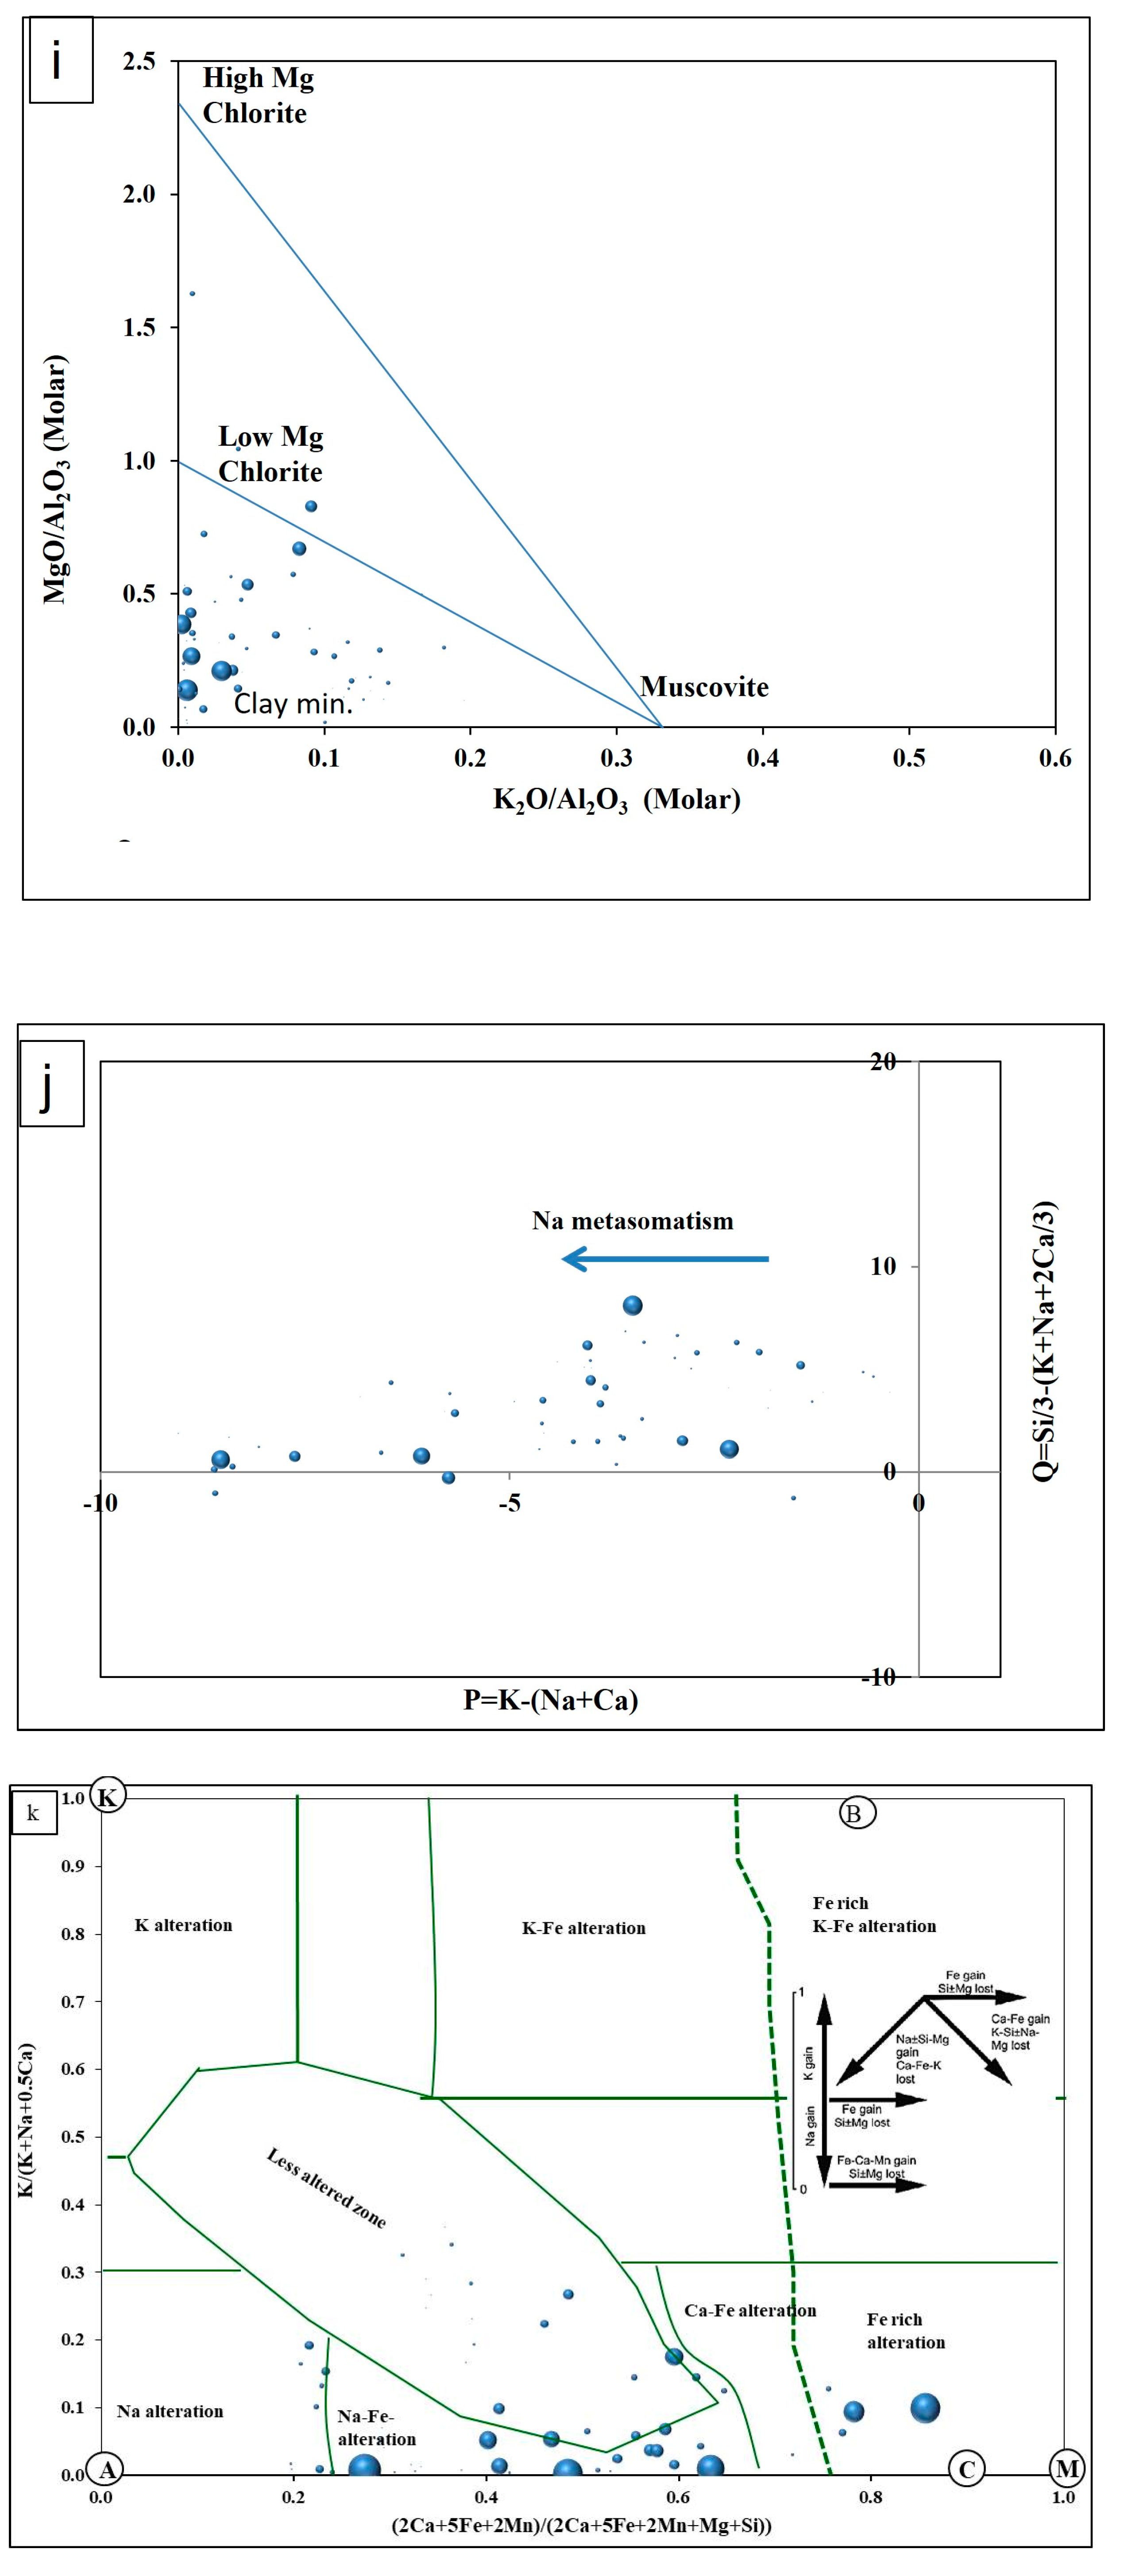
- Alteration diagrams substantiate the dominance of both albitisation and chloritisation as major phenomena and microclinisation as supportive wall-rock alterations.
- IV.
- Aventurisation of albite and microcline on the surface and subsurface can be helpful in prioritising future exploration targets for uranium mineralisation.
- V.
- An episodic variation (S-, F-, O-, and P-rich) in a hydrothermal fluid composition is established. The fluids responsible for alteration were also the principal carriers of epigenetic polymetallic mineralisation.
Author Contributions
Funding
Data Availability Statement
Acknowledgments
Conflicts of Interest
References
- IAEA. Geological Classification of Uranium Deposits and Description of Selected Examples. IAEA-TECDOC-1842. 2018, pp. 130–145. Available online: https://www.iaea.org/publications/12346 (accessed on 31 March 2019).
- Wilde, A. Towards a model for albitite-type uranium. Minerals 2013, 3, 36–48. [Google Scholar] [CrossRef]
- Dahlkamp, F.J. Uranium Ore Deposits; Springer: Berlin/Heidelberg, Germany, 2013; pp. 123–127. [Google Scholar]
- Rout, D.; Krishnamurthi, R.; Sinha, D.K. Mineralogy and paragenesis of the Meso-Proterozoic Rohil uranium deposit, North Delhi Fold Belt, Rajasthan, India. Ore Geol. Rev. 2022, 151, 105204. [Google Scholar] [CrossRef]
- Padhi, A.K.; Aravind, S.L.; Kumar, K.; Choudhury, D.K.; Purohit, R.K.; Nanda, L.K.; Rai, A.K. Uranium potential of North Delhi Fold Belt, Rajasthan, India: An overview. Expl. Res. Atom. Miner. 2016, 26, 53–70. Available online: https://www.researchgate.net/publication/330103872 (accessed on 24 February 2023).
- Polito, P.A.; Kyser, T.K.; Stanley, C. The Proterozoic albitite hosted Valhalla uranium deposit, Queensland, Australia: A description of the alteration assemblage associated with the uranium mineralization in diamond drill hole V39. Miner. Depos. 2007, 44, 11–40. [Google Scholar] [CrossRef]
- Hicks, C.; Wilton, D. Petrological and geochemical investigation into the Michelin Uranium Deposit, Central Mineral Belt, Labrador. GeoCanada 2010, 1–4. Available online: https://geoconvention.com/wpcontent/uploads/abstracts/2010/1030_GC2010_Petrological_and_Geochemical_Investigation.pdf (accessed on 10 April 2019).
- Sparkes, G.W.; Dunning, G.R.; Langille, A. The Michelin deposit: An example of albitite-hosted uranium mineralization within the central mineral belt of Labrador. In Current Research; Newfoundland and Labrador Department of Natural Resources Geological Survey: St. John’s, NL, Canada, 2017; Volume 17-1, pp. 219–238. [Google Scholar] [CrossRef]
- Khomich, V.G.; Boriskina, N.G.; Santosh, M. Geodynamic framework of large unique uranium ore belts in Southeast Russia and East Mongolia. J. Asian Earth Sci. 2016, 119, 145–166. [Google Scholar] [CrossRef]
- Zhong, J.; Zhitian, G. The geological characteristics and metallogenetic control factors of the Lianshanguan uranium deposit, northeast China. Precam. Res. 1988, 39, 51–64. [Google Scholar] [CrossRef]
- Dahlkamp, F.J. Uranium Deposits of the World-Asia; Springer: Berlin/Heidelberg, Germany, 2009; pp. 47–49. Available online: https://link.springer.com/content/pdf/bfm:978-3-540-78558-3/1 (accessed on 5 February 2019).
- Lobato, L.M.; Forman, J.M.A.; Fyfe, W.S.; Kerrich, R.; Barnett, R.L. Uranium enrichment in Archaean crustal basement associated with overthrusting. Nature 1983, 303, 235–237. [Google Scholar] [CrossRef]
- Chaves, A. New geological model of the Lagoa Real uraniferous albitites from Bahia (Brazil) Central. Eur. J. Geosci. 2013, 5, 354–373. [Google Scholar] [CrossRef]
- Alexandre, P. Mineralogy and geochemistry of the sodium metasomatism related uranium occurrences of Aricheng South, Guyana. Miner. Depos. 2010, 45, 351–367. [Google Scholar] [CrossRef]
- Renaud, J.A. The Aricheng Basement-Hosted Albitite-Type Uranium Deposit, Roraima Basin, Co-operative Republic of Guyana, South America. Ph.D. Thesis, University of Western Ontario, London, ON, Canada, 2014; pp. 143–154. Available online: http://ir.lib.uwo.ca/etd/1960 (accessed on 2 November 2019).
- Kouske, A.P.; Suh, C.E.; Ghogomu, R.T.; Ngako, V. Na-metasomatism and uranium mineralization during a two-stage albitization at Kitongo, northern Cameroon: Structural and geochemical evidence. Int. J. Geosci. 2012, 3, 258–279. [Google Scholar] [CrossRef]
- Silveira, C.L.P.; Schorscher, H.D.; Miekeley, N. The geochemistry of albitization and related uranium mineralization, Espinharas, Paraiba (PB), Brazil. J. Geochem. Expl. 1991, 40, 329–347. Available online: https://www.sciencedirect.com/science/article/abs/pii/037567429190046W (accessed on 1 October 2019). [CrossRef]
- Veríssimo, C.U.; Santos, R.V.; Parente, C.V.; de Oliveira, C.G.; Cavalcanti, J.A.; Neto, J.D. The Itataia phosphate-uranium deposit (Ceará, Brazil) new petrographic, geochemistry and isotope studies. J. S. Am. Earth Sci. 2016, 70, 115–144. [Google Scholar] [CrossRef]
- Cuney, M.; Emetz, A.; Mercadier, J.; Mykchaylov, V.; Shunko, V.; Yuslenko, A. Uranium deposits associated with Na-metasomatism from central Ukraine: A review of some of the major deposits and genetic constraints. Ore Geol. Rev. 2012, 44, 82–106. [Google Scholar] [CrossRef]
- Saxena, A.; Banerjee, A.; Mitra, N.; Couto, D.S.; Pandey, U.K.; Bisht, B.S.; Sinha, D.K. Comparison of metasomatic and pegmatite type of mineralization in and near Rohil Uranium Deposit, Sikar district, Rajasthan, India: An insight from field relations, petrography and mineral chemistry. J. Geol. Soc. Ind. 2022, 98, 1095–1103. [Google Scholar] [CrossRef]
- Khandelwal, M.K.; Bisht, B.S.; Tiwary, A.; Dash, S.K.; Mundra, K.L.; Padhi, A.K.; Nanda, L.K.; Maithani, P.B. Uranium-copper–molybdenum association in the Rohil Deposit, North Delhi Fold Belt, Rajasthan. Mem. Geol. Soc. Ind. 2008, 73, 117–130. Available online: https://www.researchgate.net/publication/281836873 (accessed on 24 February 2023).
- Khandelwal, M.K.; Jain, R.C.; Dash, S.K.; Padhi, A.K.; Nanda, L.K. Geological characteristics of Rohil uranium deposit, district Sikar, Rajasthan. Mem. Geol. Soc. Ind. 2010, 76, 75–85. Available online: https://www.researchgate.net/publication/281837792 (accessed on 24 February 2023).
- Katti, V.J.; Bisht, B.S.; Bhaumik, B.K.; Fogat, R.K.; Thangaraj, A. Integration of geophysical, geochemical and gamma-ray logging data of Rohil block of North Delhi Fold Belt in parts of Rajasthan for developing uranium exploration model. Ind. Miner. 2011, 45, 148–164. [Google Scholar] [CrossRef]
- Mishra, B.; Kumar, K.; Nanda, L.K.; Khandelwal, M.K. Uranium mineralization in the Khetri sub-basin, North Delhi Fold Belt, India. In Proceedings of the International Symposium on Uranium Raw Material for the Nuclear Fuel Cycle, Vienna, Austria, 25–29 June 2018; pp. 285–287. Available online: https://inis.iaea.org/collection/NCLCollectionStore/_Public/49/097/49097461.pdf (accessed on 4 November 2019).
- Pal, D.C.; Rhede, D. Geochemistry and chemical dating of uraninite in the Jaduguda uranium deposit, Singhbhum shear zone, India-implications for uranium mineralization and geochemical evolution of uraninite. Econ. Geol. 2013, 108, 1499–1515. [Google Scholar] [CrossRef]
- Sinha-Roy, S.; Malhotra, G.; Mohanty, M. Geology of Rajasthan; Geological Society of India: Bangalore, India, 1998; 278p. [Google Scholar]
- Gupta, P.; Guha, D.B.; Chattopadhyay, B. Basement-cover relationship in the Khetri copper belt and the emplacement mechanism of the granite massifs, Rajasthan, India. J. Geol. Soc. Ind. 1998, 52, 417–432. Available online: https://www.researchgate.net/publication/285679242 (accessed on 24 February 2023).
- Knight, J.; Lowe, J.; Joy, S.; Cameron, J.; Merrillees, J.; Nag, S.; Shah, N.; Dua, G.; Jhala, K. The Khetri Copper Belt Rajasthan: Iron oxide copper-gold terrain in the Proterozoic of NW India. In Hydrothermal Iron Oxide Copper-Gold and Related Deposits: A Global Perspective; Porter, T.M., Ed.; PGC Publishing: Adelaide, Australia, 2002; Volume 2, pp. 321–341. Available online: https://www.researchgate.net/publication/273393352 (accessed on 14 February 2020).
- Roy, A.B.; Jakhar, S.R. Geology of Rajasthan (Northwest India): Precambrian to Recent; Scientific Publishing: Jodhpur, India, 2002; 418p. [Google Scholar]
- Nanda, L.K.; Katti, V.J.; Maithani, P.B. Prospects and potentialities for uranium in North Delhi Fold Belt: A case study from Rohil, Rajasthan, India. In Proceedings of the International Symposium IAEA-URAM, Vienna, Austria, 22–26 June 2009; Available online: https://inis.iaea.org/search/search.aspx?orig_q=RN:41003240 (accessed on 13 November 2019).
- Kaur, P.; Zeh, A.; Okrusch, M.; Chaudhri, N.; Gerdes, A.; Brätz, H. Separating regional metamorphic and metasomatic assemblages and events in the northern Khetri complex, NW India: Evidence from mineralogy, whole-rock geochemistry and U-Pb monazite chronology. J. Asian Earth Sci. 2016, 129, 117–141. [Google Scholar] [CrossRef]
- Ray, S.K. The albitite line of Northern Rajasthan- a fossil intra-continental rift zone. J. Geol. Soc. Ind. 1990, 36, 413–423. Available online: https://www.researchgate.net/publication/293266638 (accessed on 24 February 2023).
- Das Gupta, S.P. The structural history of the Khetri Copper Belt, Jhunjhunu and Sikar districts, Rajasthan. Mem. Geol. Surv. Ind. 1968, 98, 170. [Google Scholar]
- Ray, S.K. Structural history of the Saladipura pyrite—Pyrrhotite deposit and associated rocks, Khetri copper belt, Rajasthan. J. Geol. Soc. Ind. 1974, 15, 227–238. Available online: https://www.researchgate.net/publication/284776408 (accessed on 20 September 2020).
- Naha, K.; Mukhopadhyay, D.K.; Mohanty, R. Structural evolution of the rocks of the Delhi Group around Khetri, northeastern Rajasthan. Mem. Geol. Soc. Ind. 1988, 7, 207–245. [Google Scholar]
- Yadav, O.P.; Saxena, S.K.; Pande, A.K.; Gupta, K.R. Sodic metasomatism- A feature of tectonomagmatic activation in Khetri sub-basin, Rajasthan, India. Geol. Surv. Ind. Spl. Publ. 2004, 72, 301–312. [Google Scholar]
- Roy, A.B.; Das, A.R. A study on the time relations between movements, metamorphism and Granite emplacement in the Middle Proterozoic Delhi Supergroup rocks of Rajasthan. J. Geol. Soc. Ind. 1985, 26, 726–733. [Google Scholar]
- Pandey, U.K.; Tripathi, B.K.; Bisht, B.S.; Sunil Kumar, T.S.; Saravanan, B.; Sinha, D.K. Age of Uranium Mineralisation from North Delhi Fold Belt (NDFB): Evidences from U-Pb, Pb-Pb and Sm-Nd Systematics. J. Geol. Soc. Ind. 2022, 98, 1085–1094. [Google Scholar] [CrossRef]
- Cmiral, M.; Fitz Gerald, J.D.; Faul, U.H.; Green, D.H. A close look at dihedral angles and melt geometry in olivine-basalt aggregates: A TEM study. Contrib. Mineral. Petrol. 1998, 130, 336–345. Available online: http://web.mit.edu/hufaul/www/UPubs/CmiralCMP98.pdf (accessed on 27 January 2021). [CrossRef]
- Putnis, A. Mineral replacement reactions. Rev. Min. Geochem. 2009, 70, 87–124. [Google Scholar] [CrossRef]
- Norberg, N.; Neusser, G.; Wirth, R.; Harlov, D. Microstructural evolution during experimental albitization of K-rich alkali feldspar. Contrib. Mineral. Petrol. 2011, 162, 531–546. [Google Scholar] [CrossRef]
- Mathieu, L. Quantifying hydrothermal alteration: A review of methods. Geosciences 2018, 8, 245. [Google Scholar] [CrossRef]
- Min, H.; Zhang, T.; Li, Y.; Zhao, S.; Li, J.; Lin, D.; Wang, J. The albitization of K-feldspar in organic- and silt-rich fine-grained rocks of the Lower Cambrian Qiongzhusi Formation in the southwestern Upper Yangtze region, China. Minerals 2019, 9, 620. [Google Scholar] [CrossRef]
- Holness, M.B. Growth and albitisation of K-feldspar in crystalline rocks in the shallow crust: A new kind of porosity? J. Geochem. Expl. 2003, 78–79, 173–177. [Google Scholar] [CrossRef]
- Large, R.R.; Gemmell, J.B.; Paulick, H.; Huston, D.L. The Alteration Box Plot: A simple approach to understanding the relationship between alteration mineralogy and lithogeochemistry associated with volcanic-hosted massive sulfide deposits. Eco. Geol. 2001, 96, 957–971. [Google Scholar] [CrossRef]
- Davies, J.F.; Whitehead, R.E. Alkali-alumina and MgO-alumina molar ratios of altered and unaltered rhyolites. Expl. Min. Geol. 2006, 15, 75–88. [Google Scholar] [CrossRef]
- Shanks III, W.C. Hydrothermal alteration in volcanogenic massive sulfide occurrence model. In Scientific Investigations Report 2010-5070-C; U.S. Geological Survey: Reston, VA, USA, 2012; pp. 169–177. Available online: https://www.researchgate.net/publication/285359754 (accessed on 30 April 2022).
- Stanley, C.R. Molar element ratio analysis of lithogeochemical data: A toolbox for use in mineral exploration and mining. Geochem. Explor. Environ. Anal. 2019, 20, 233–256. [Google Scholar] [CrossRef]
- Stanley, C.R.; Madeisky, H.E. Lithogeochemical exploration of metasomatic zones associated with volcanic-hosted massive sulfide deposits using Pearce element ratio analysis. Intl. Geol. Rev. 1993, 35, 1121–1148. [Google Scholar] [CrossRef]
- Madeisky, H.E.; Coyner, A.R.; Fahey, P.L. A lithogeochemical and radiometric study of hydrothermal alteration and metal zoning at the Cinola epithermal gold deposit, Queen Charlotte Islands, British Columbia. Geol. Ore Depos. Am. Cordill. 1996, 3, 1153–1185. [Google Scholar]
- Siani, M.G.; Lentz, D.R. Lithogeochemistry of various hydrothermal alteration types associated with precious and base metal epithermal deposits in the Tarom-Hashtjin metallogenic province, NW Iran: Implications for regional exploration. J. Geochem. Explor. 2022, 232, 106903. [Google Scholar] [CrossRef]
- Vonopartis, L.; Nex, P.; Kinnaird, J.; Robb, L. Evaluating the changes from endogranitic magmatic to magmatic-hydrothermal mineralization: The Zaaiplaats tin granites, Bushveld Igneous Complex, South Africa. Minerals 2020, 10, 379. [Google Scholar] [CrossRef]
- Debon, F.; Lefort, P. A chemical–mineralogical classification of common plutonic rocks and associations. Trans. R. Soc. Edinb. Earth Sci. 1983, 73, 135–149. [Google Scholar] [CrossRef]
- Olivier, V.; André-Mayer, A.; Mbaguedje, D.; Eglinger, A.; Ohnenstetter, M.; Isseini, M.; Cuney, M.; Poujol, M.; Van Lichtervelde, M. Uranium mineralization associated with late magmatic ductile to brittle deformation and Na–Ca metasomatism of the Pan-African A-type Zabili syntectonic pluton (Mayo-Kebbi massif, SW Chad). Miner. Depos. 2020, 56, 1297–1319. [Google Scholar] [CrossRef]
- Montreuil, J.; Corriveau, L.; Grunsky, E.C. Compositional data analysis of hydrothermal alteration in IOCG systems, Great Bear magmatic zone, Canada: To each alteration type its own geochemical signature. Geochem. Explor. Environ. Anal. 2013, 13, 229–247. [Google Scholar] [CrossRef]
- Saleh, D.; Mohammad, Y.; Mohammad, R.R.; Mehrdad, B. Alkali metasomatism as a process for Ti–REE–Y–U–Th mineralization in the Saghand anomaly 5, Central Iran: Insights from geochemical, mineralogical and stable isotope data. Ore Geol. Rev. 2018, 93, 308–336. [Google Scholar] [CrossRef]
- Sinha, D.K.; Fahmi, S.; Bhatt, A.K.; Singh, G.; Singh, R. Evidences for soda metasomatism in Ladera-Sakhun area, northeastern Rajasthan. J. Geol. Soc. Ind. 2000, 56, 573–582. Available online: https://www.researchgate.net/publication/291860710 (accessed on 24 February 2023).
- Cuney, M. The extreme diversity of uranium deposits. Miner. Depos. 2009, 44, 3–9. [Google Scholar] [CrossRef]


| Albite | ||||||||||||||
| Mol wt% | G1 | G2 | G3 | G4 | G5 | G6 | G7 | G8 | G9 | G10 | G11 | G12 | Min | Max |
| SiO2 | 68.6 | 69.28 | 68.23 | 67.61 | 68.54 | 66.24 | 69.11 | 67.66 | 67.71 | 68.29 | 71.24 | 71.49 | 67.61 | 71.49 |
| TiO2 | bdl | 0.01 | bdl | bdl | bdl | 0.1 | bdl | bdl | bdl | bdl | bdl | bdl | bdl | 0.1 |
| Al2O3 | 19.32 | 19.8 | 18.87 | 19.51 | 20.57 | 19.78 | 18.89 | 19.34 | 19.14 | 18.65 | 19.52 | 20.01 | 18.65 | 20.57 |
| FeO | 0.02 | 0.06 | bdl | 0.23 | 0.05 | 0.85 | 0.21 | 0.03 | 0.03 | 0.06 | 0.38 | 0.07 | bdl | 0.85 |
| MnO | 0.04 | bdl | 0.05 | 0.02 | 0.02 | 0.02 | 0.07 | 0.14 | 0.05 | 0.01 | 0.06 | 0.03 | bdl | 0.14 |
| MgO | 0.01 | bdl | bdl | 0.01 | 0.03 | 0.52 | bdl | bdl | 0.01 | 0.01 | 0.02 | bdl | bdl | 0.52 |
| CaO | bdl | 0.01 | 0.02 | 0.13 | 1.02 | 0.23 | 0.19 | 0.22 | 0.27 | 0.14 | 0.23 | 0.27 | bdl | 1.02 |
| Na2O | 11.35 | 10.51 | 11.28 | 9.98 | 10.73 | 10.45 | 10.66 | 9.08 | 8.66 | 11.2 | 9.66 | 9.53 | 8.66 | 11.35 |
| K2O | 0.02 | 0.04 | bdl | 0.1 | 0.16 | 0.11 | 0.82 | 0.24 | 0.03 | 0.09 | 0.09 | 0.12 | bdl | 0.82 |
| BaO | bdl | bdl | bdl | bdl | bdl | bdl | bdl | bdl | bdl | bdl | bdl | bdl | bdl | bdl |
| 99.36 | 99.71 | 98.45 | 97.59 | 101.12 | 98.30 | 99.95 | 96.71 | 95.90 | 98.45 | 101.20 | 101.52 | 95.90 | 101.52 | |
| Microcline | ||||||||||||||
| Mol wt% | G1 | G2 | G3 | G4 | G5 | G6 | G7 | G8 | G9 | G10 | G11 | G12 | Min | Max |
| SiO2 | 64.05 | 63.21 | 65.82 | 62.67 | 66.76 | 61.78 | 64.24 | 63.52 | 63.61 | 63.5 | 63.15 | 62.75 | 61.78 | 66.76 |
| TiO2 | bdl | 0.03 | 0.01 | 0.02 | 0.08 | bdl | bdl | bdl | bdl | bdl | bdl | bdl | bdl | 0.08 |
| Al2O3 | 17.64 | 17.7 | 18.03 | 18.47 | 18.21 | 18.19 | 17.78 | 17.54 | 17.29 | 17.48 | 17.14 | 17.47 | 17.14 | 18.47 |
| FeO | 0.34 | 1.29 | 0.1 | 0.61 | 0.23 | 0.36 | 0.13 | 0.19 | 0.08 | 0.04 | 0.16 | 0.03 | 0.03 | 1.29 |
| MnO | bdl | bdl | bdl | bdl | bdl | bdl | bdl | 0.03 | 0.04 | bdl | bdl | bdl | bdl | 0.04 |
| MgO | bdl | bdl | bdl | bdl | bdl | bdl | bdl | bdl | bdl | 0.03 | bdl | bdl | bdl | 0.03 |
| CaO | bdl | 0.04 | bdl | 0.05 | bdl | 0.07 | bdl | bdl | bdl | bdl | bdl | bdl | bdl | 0.07 |
| Na2O | 0.17 | 0.2 | 0.21 | 0.35 | 0.2 | 0.28 | 0.29 | 0.28 | 0.32 | 0.3 | 0.2 | 0.08 | 0.08 | 0.35 |
| K2O | 15.67 | 15.51 | 16.07 | 15.38 | 15.84 | 15.17 | 15.77 | 15.58 | 15.89 | 15.79 | 15.92 | 15.72 | 15.38 | 16.07 |
| BaO | 0.05 | 0.02 | 0.2 | 0.75 | 0.07 | 1.13 | bdl | bdl | bdl | bdl | bdl | bdl | bdl | 1.13 |
| TOTAL | 97.92 | 98.00 | 100.44 | 98.30 | 101.39 | 96.98 | 98.21 | 97.14 | 97.23 | 97.14 | 96.57 | 96.08 | 96.08 | 101.39 |
| Mol wt% | 1 | 2 | 3 | 4 | 5 | 6 | 7 | 8 | 9 | 10 | 11 | 12 | 13 | 14 | 15 | 16 | 17 | 18 | Min | Max |
|---|---|---|---|---|---|---|---|---|---|---|---|---|---|---|---|---|---|---|---|---|
| SiO2 | 32.60 | 34.79 | 32.44 | 29.77 | 31.97 | 32.44 | 35.43 | 28.10 | 29.64 | 28.53 | 28.24 | 29.29 | 30.81 | 28.92 | 29.01 | 28.29 | 27.97 | 27.70 | 27.71 | 35.43 |
| TiO2 | bdl | bdl | 0.02 | 0.02 | bdl | bdl | 0.03 | 0.08 | 0.01 | bdl | 0.05 | bdl | 0.03 | bdl | 0.03 | bdl | 0.01 | 0.01 | bdl | 0.08 |
| Al2O3 | 17.24 | 15.61 | 16.61 | 19.26 | 18.18 | 16.17 | 14.44 | 16.02 | 16.25 | 15.67 | 16.55 | 16.11 | 16.52 | 16.01 | 15.93 | 16.18 | 15.70 | 15.53 | 14.44 | 19.26 |
| Cr2O3 | bdl | bdl | bdl | bdl | bdl | bdl | bdl | bdl | bdl | bdl | bdl | bdl | bdl | bdl | bdl | bdl | bdl | bdl | bdl | bdl |
| Fe2O3 | 2.85 | 4.71 | 3.44 | 2.02 | 3.38 | 2.80 | 4.42 | 0.55 | 1.03 | 0.65 | 0.83 | 1.05 | 2.25 | 1.08 | 0.88 | 0.80 | 1.37 | 0.95 | 0.55 | 4.71 |
| FeO | 14.56 | 13.13 | 14.98 | 18.38 | 16.60 | 13.77 | 11.38 | 24.56 | 20.54 | 25.09 | 23.76 | 20.73 | 19.35 | 22.97 | 24.36 | 24.15 | 27.42 | 26.65 | 11.38 | 27.42 |
| MnO | 0.19 | 0.14 | 0.14 | 0.13 | 0.13 | 0.18 | 0.13 | 0.29 | 0.23 | 0.19 | 0.29 | 0.25 | 0.09 | 0.30 | 0.23 | 0.17 | 0.31 | 0.35 | 0.09 | 0.35 |
| MgO | 21.02 | 18.91 | 19.12 | 18.52 | 17.99 | 21.12 | 21.25 | 15.95 | 18.61 | 15.89 | 15.86 | 18.02 | 17.58 | 16.38 | 16.29 | 15.79 | 12.04 | 13.21 | 12.04 | 21.25 |
| CaO | 0.34 | 0.84 | 0.50 | 0.15 | 0.22 | 0.49 | 0.78 | 0.09 | 0.11 | 0.09 | 0.14 | 0.14 | 0.21 | 0.07 | 0.08 | 0.08 | 0.18 | 0.14 | 0.07 | 0.84 |
| Na2O | 0.02 | 0.09 | 0.04 | bdl | 0.05 | 0.05 | 0.04 | 0.08 | 0.09 | 0.04 | 0.09 | 0.09 | 0.06 | 0.08 | 0.05 | 0.07 | 0.12 | 0.07 | bdl | 0.12 |
| K2O | 0.06 | 0.08 | 0.02 | 0.08 | 0.20 | 0.01 | 0.04 | 0.01 | 0.03 | 0.02 | 0.04 | 0.04 | 0.17 | 0.03 | 0.02 | 0.06 | 0.02 | 0.04 | 0.01 | 0.20 |
| H2O * | 12.15 | 12.08 | 11.87 | 11.86 | 11.98 | 11.93 | 12.16 | 11.12 | 11.49 | 11.15 | 11.18 | 11.35 | 11.60 | 11.22 | 11.30 | 11.12 | 10.81 | 10.80 | 10.80 | 12.16 |
| Total | 101.05 | 100.39 | 99.18 | 100.20 | 100.70 | 98.97 | 100.11 | 96.90 | 98.08 | 97.36 | 97.07 | 97.11 | 98.71 | 97.09 | 98.23 | 96.77 | 95.99 | 95.51 | 95.51 | 101.05 |
| FeO/MgO | 0.82 | 0.92 | 0.95 | 1.09 | 1.09 | 0.77 | 0.72 | 1.57 | 1.15 | 1.62 | 1.55 | 1.20 | 1.22 | 1.46 | 1.54 | 1.58 | 2.38 | 2.08 | 0.72 | 2.38 |
| Chalcopyrite | Molybdenite | Molybdenite (Altered) | |||||||||||||
| Wt% | G1 * | G2 | G3 | G4 | G5 | G6 | Avg | G1 | G2 | G3 | Avg | G1 | G2 | G3 | Avg |
| S | 31.77 | 31.57 | 31.43 | 31.75 | 31.54 | 31.85 | 31.65 | 38.67 | 38.59 | 38.38 | 38.55 | 35.01 | 35.79 | 34.57 | 35.12 |
| Fe | 29.17 | 30.62 | 30.55 | 29.06 | 29.32 | 29.66 | 29.73 | 0.04 | 0.02 | 0.05 | 0.04 | 0.05 | 0.06 | 0.08 | 0.06 |
| Co | 0.04 | 0.09 | 0.23 | <0.01 | <0.01 | <0.01 | 0.06 | <0.01 | <0.01 | 0.03 | 0.03 | <0.01 | <0.01 | <0.01 | <0.01 |
| Ni | 0.01 | 0.11 | 0.18 | <0.01 | 0.01 | <0.01 | 0.05 | <0.01 | 0.02 | <0.01 | 0.02 | 0.01 | <0.01 | 0.02 | 0.02 |
| Cu | 34.72 | 32.20 | 31.92 | 34.74 | 34.68 | 35.11 | 33.89 | <0.01 | <0.01 | <0.01 | <0.01 | 0.01 | <0.01 | <0.01 | <0.01 |
| Zn | 0.01 | <0.01 | <0.01 | <0.01 | <0.01 | <0.01 | <0.01 | 0.05 | 0.03 | <0.01 | 0.04 | <0.01 | 0.01 | 0.02 | 0.01 |
| As | <0.01 | <0.01 | <0.01 | <0.01 | <0.01 | <0.01 | <0.01 | <0.01 | 0.02 | <0.01 | 0.02 | <0.01 | 0.01 | <0.01 | <0.01 |
| Mo | 0.60 | 0.63 | 0.66 | 0.63 | 0.65 | 0.54 | 0.62 | 59.33 | 59.87 | 59.85 | 59.68 | 56.22 | 56.09 | 55.40 | 55.90 |
| Pb | 0.13 | 0.19 | 0.18 | 0.08 | 0.12 | 0.04 | 0.12 | <0.01 | <0.01 | <0.01 | <0.01 | <0.01 | 0.01 | <0.01 | <0.01 |
| Total | 96.44 | 95.41 | 95.14 | 96.26 | 96.31 | 97.20 | 96.13 | 98.12 | 98.57 | 98.32 | 98.34 | 91.46 | 91.98 | 90.14 | 91.19 |
| Sphalerite | Galena | Pyrite | Pyrrhotite | ||||||||||||
| Wt% | G1 | G2 | G3 | Avg | G1 | G2 | Avg | G1 | G2 | G3 | Avg | G1 | G2 | G3 | Avg |
| S | 28.44 | 27.73 | 27.42 | 27.86 | 12.15 | 12.10 | 12.12 | 50.10 | 49.21 | 49.32 | 45.96 | 36.67 | 36.25 | 36.48 | 36.47 |
| Fe | 0.71 | 1.07 | 0.58 | 0.79 | 0.26 | 0.10 | 0.18 | 43.52 | 46.10 | 43.61 | 41.90 | 59.01 | 58.98 | 58.72 | 58.90 |
| Co | 0.02 | 0.02 | 0.02 | 0.02 | <0.01 | 0.02 | 0.01 | 0.78 | 0.03 | 0.68 | 0.32 | 0.19 | 0.20 | 0.17 | 0.19 |
| Ni | 0.05 | 0.02 | <0.01 | 0.02 | <0.01 | 0.01 | <0.01 | 1.59 | 0.03 | 1.37 | 0.61 | 0.19 | 0.15 | 0.12 | 0.15 |
| Cu | 0.05 | 0.05 | 0.04 | 0.05 | 0.03 | 0.07 | 0.05 | 0.16 | <0.01 | 0.02 | 0.06 | <0.01 | <0.01 | 0.01 | <0.01 |
| Zn | 67.86 | 67.32 | 66.23 | 67.14 | 3.99 | <0.01 | 2.00 | <0.01 | 0.09 | 0.12 | 0.09 | 0.02 | <0.01 | 0.03 | 0.02 |
| As | <0.01 | <0.01 | <0.01 | <0.01 | <0.01 | <0.01 | <0.01 | <0.01 | 0.29 | <0.01 | 0.23 | 0.06 | 0.04 | 0.05 | 0.05 |
| Mo | 0.61 | 0.62 | 0.49 | 0.58 | 0.13 | 0.27 | 0.20 | 0.89 | 0.76 | 0.79 | 0.78 | 0.60 | 0.68 | 0.66 | 0.64 |
| Ag | 0.05 | 0.02 | <0.01 | 0.03 | <0.01 | <0.01 | <0.01 | 0.01 | 0.01 | <0.01 | <0.01 | <0.01 | <0.01 | <0.01 | <0.01 |
| Pb | 0.06 | 0.05 | 0.24 | 0.12 | 85.21 | 85.61 | 85.41 | 0.38 | 0.02 | 0.48 | 0.23 | <0.01 | 0.08 | 0.14 | 0.07 |
| Total | 98.62 | 97.05 | 95.28 | 96.99 | 101.88 | 98.24 | 100.06 | 97.43 | 96.55 | 96.39 | 96.97 | 96.75 | 96.37 | 96.38 | 96.50 |
| Oxides | 1 | 2 | 3 | 4 | 5 | 6 | 7 | 8 | 9 | 10 | 11 | 12 | 13 | 14 | 15 | 16 | 17 | 18 | 19 | 20 |
|---|---|---|---|---|---|---|---|---|---|---|---|---|---|---|---|---|---|---|---|---|
| SiO2 % | 57.86 | 69.78 | 60.76 | 58.35 | 66.36 | 53.10 | 51.10 | 60.12 | 57.38 | 45.75 | 54.27 | 38.91 | 38.05 | 49.05 | 53.02 | 49.15 | 52.95 | 59.44 | 67.14 | 39.21 |
| TiO2 % | 0.88 | 0.72 | 0.44 | 0.85 | 0.58 | 0.64 | 0.50 | 0.48 | 0.26 | 0.74 | 0.81 | 0.59 | 0.50 | 0.69 | 0.66 | 0.51 | 0.47 | 0.50 | 0.43 | 0.55 |
| Al2O3 % | 13.66 | 13.20 | 16.92 | 15.55 | 13.88 | 14.60 | 12.58 | 14.30 | 8.88 | 10.36 | 10.86 | 7.26 | 6.11 | 11.30 | 19.30 | 16.30 | 13.20 | 18.85 | 13.58 | 14.20 |
| Fe2O3 % | 1.56 | 1.28 | 0.30 | 0.76 | 1.66 | 12.44 | 5.58 | 0.95 | 2.60 | 19.68 | 15.63 | 29.04 | 31.84 | 18.87 | 4.86 | 2.97 | 0.19 | 1.19 | 0.55 | 2.70 |
| FeO % | 7.80 | 2.90 | 4.38 | 3.58 | 1.98 | 3.45 | 4.56 | 6.58 | 1.75 | 3.96 | 2.67 | 4.70 | 4.76 | 3.17 | 5.75 | 10.19 | 16.17 | 6.32 | 3.31 | 8.62 |
| MgO % | 7.28 | 1.92 | 4.06 | 3.35 | 1.50 | 1.90 | 4.16 | 7.12 | 0.92 | 3.31 | 1.81 | 2.17 | 3.50 | 3.27 | 3.36 | 5.54 | 1.91 | 3.47 | 3.62 | 10.30 |
| MnO % | 0.06 | 0.06 | 0.04 | 0.04 | 0.06 | 0.02 | 0.14 | 0.06 | 0.06 | 0.01 | 0.01 | 0.01 | 0.02 | 0.02 | 0.04 | 0.04 | 0.01 | 0.02 | 0.05 | 0.07 |
| CaO % | 1.12 | 0.90 | 0.72 | 4.65 | 2.58 | 0.72 | 6.45 | 0.50 | 12.12 | 1.04 | 0.38 | 0.82 | 2.26 | 1.42 | 3.24 | 8.30 | 4.93 | 1.29 | 1.85 | 7.85 |
| Na2O % | 4.50 | 4.88 | 7.10 | 6.95 | 6.32 | 6.04 | 4.82 | 3.10 | 4.16 | 5.26 | 5.94 | 5.67 | 4.05 | 5.67 | 4.31 | 3.98 | 3.50 | 3.77 | 3.50 | 4.31 |
| K2O % | 0.06 | 1.54 | 0.06 | 0.06 | 0.10 | 0.06 | 0.14 | 2.38 | 0.05 | 1.20 | 1.56 | 1.32 | 0.48 | 1.56 | 2.29 | 0.60 | 0.54 | 2.29 | 1.45 | 0.25 |
| P2O5 % | 0.10 | 0.12 | 0.06 | 0.04 | 0.12 | 0.18 | 3.42 | 0.10 | 0.55 | 0.34 | 0.19 | 0.33 | 0.16 | 0.16 | 0.36 | 0.33 | 0.29 | 0.27 | 0.30 | 0.49 |
| U3O8 ppm | 20 | 120 | 200 | 30 | 500 | 30 | 120 | 120 | 60 | 270 | 330 | 230 | 510 | 570 | 570 | 760 | 1400 | 10 | 640 | 770 |
| U ppm | 17 | 102 | 170 | 25 | 424 | 25 | 102 | 102 | 51 | 229 | 280 | 195 | 432 | 483 | 483 | 644 | 1187 | 8 | 543 | 653 |
| Oxides | 21 | 22 | 23 | 24 | 25 | 26 | 27 | 28 | 29 | 30 | 31 | 32 | 33 | 34 | 35 | 36 | 37 | 38 | 39 | 40 |
| SiO2 % | 65.73 | 57.35 | 32.56 | 56.72 | 64.49 | 72.89 | 49.36 | 55.77 | 57.49 | 56.32 | 47.62 | 55.60 | 56.04 | 57.83 | 64.13 | 22.73 | 65.50 | 42.91 | 59.43 | 58.81 |
| TiO2 % | 0.20 | 0.69 | 1.06 | 1.13 | 0.56 | 0.44 | 0.65 | 0.59 | 0.55 | 0.45 | 0.32 | 0.53 | 0.49 | 0.10 | 0.38 | 0.17 | 0.50 | 0.36 | 0.61 | 0.45 |
| Al2O3 % | 13.91 | 12.04 | 7.98 | 13.02 | 10.21 | 8.38 | 10.34 | 21.66 | 17.89 | 19.96 | 16.15 | 21.04 | 20.20 | 16.81 | 19.01 | 12.06 | 21.68 | 16.38 | 17.65 | 18.78 |
| Fe2O3 % | 0.24 | 3.24 | 0.32 | 0.32 | 3.86 | 4.83 | 14.04 | 1.60 | 8.46 | 4.34 | 11.09 | 2.66 | 3.87 | 0.79 | 0.20 | 18.81 | 0.23 | 8.11 | 0.16 | 0.65 |
| FeO % | 3.59 | 9.41 | 31.18 | 8.91 | 3.88 | 1.72 | 5.75 | 5.57 | 0.63 | 4.65 | 5.04 | 5.22 | 5.16 | 1.72 | 1.22 | 19.50 | 2.94 | 10.27 | 5.96 | 4.09 |
| MgO % | 4.11 | 2.58 | 5.35 | 4.50 | 28.00 | 1.16 | 3.65 | 3.16 | 3.38 | 2.08 | 1.10 | 2.86 | 2.29 | 0.45 | 0.29 | 2.54 | 1.60 | 8.35 | 5.73 | 4.94 |
| MnO % | 0.04 | 0.02 | 0.03 | 0.05 | 0.02 | 0.02 | 0.04 | 0.01 | 0.10 | 0.01 | 0.20 | 0.01 | 0.60 | 0.01 | 0.01 | 0.31 | 0.01 | 0.59 | 0.38 | 0.01 |
| CaO % | 2.17 | 1.10 | 6.29 | 2.82 | 0.67 | 1.32 | 1.70 | 0.67 | 0.57 | 0.57 | 1.02 | 0.63 | 0.06 | 8.46 | 4.71 | 1.99 | 1.64 | 0.47 | 2.82 | 6.22 |
| Na2O % | 3.17 | 4.85 | 2.43 | 4.45 | 3.50 | 3.50 | 3.64 | 3.50 | 2.83 | 4.04 | 4.58 | 2.97 | 4.99 | 8.08 | 7.80 | 1.61 | 3.37 | 1.61 | 3.35 | 3.32 |
| K2O % | 0.65 | 0.45 | 0.66 | 0.87 | 1.02 | 0.05 | 0.10 | 2.29 | 2.35 | 2.53 | 0.28 | 2.77 | 2.29 | 0.10 | 0.12 | 0.36 | 0.10 | 0.10 | 0.10 | 0.10 |
| P2O5 % | 0.25 | 0.19 | 0.24 | 0.27 | 0.19 | 0.10 | 0.23 | 0.05 | 0.06 | 0.05 | 0.11 | 0.10 | 0.11 | 0.01 | 0.04 | 0.08 | 0.03 | 0.04 | 0.02 | 0.04 |
| U3O8 ppm | 220 | 2400 | 3940 | 1070 | 640 | 9390 | 820 | 10 | 120 | 120 | 1210 | 10 | 20 | 30 | 20 | 8100 | 60 | 1580 | 20 | 10 |
| U ppm | 187 | 2035 | 3341 | 907 | 543 | 7963 | 695 | 8 | 102 | 102 | 1026 | 8 | 17 | 25 | 17 | 6869 | 51 | 1340 | 17 | 8 |
| Oxides | 41 | 42 | 43 | 44 | 45 | 46 | 47 | 48 | 49 | 50 | 51 | 52 | 53 | 54 | 55 | 56 | 57 | 58 | 59 | 60 |
| SiO2 % | 63.79 | 59.08 | 56.88 | 62.39 | 72.92 | 64.90 | 59.69 | 49.80 | 55.60 | 14.90 | 33.30 | 53.90 | 52.70 | 57.60 | 49.10 | 42.60 | 48.40 | 51.90 | 42.10 | 49.10 |
| TiO2 % | 0.18 | 0.28 | 0.12 | 0.29 | 0.29 | 0.37 | 0.45 | 0.33 | 0.50 | 0.17 | 0.34 | 0.62 | 0.38 | 0.41 | 1.30 | 0.47 | 0.36 | 0.67 | 0.66 | 0.55 |
| Al2O3 % | 14.60 | 13.56 | 11.30 | 9.35 | 11.38 | 12.48 | 14.72 | 17.38 | 13.90 | 4.33 | 8.07 | 15.16 | 13.59 | 14.57 | 11.04 | 12.45 | 11.58 | 13.07 | 12.09 | 14.59 |
| Fe2O3 % | 2.55 | 2.69 | 9.75 | 6.18 | 2.37 | 4.85 | 2.17 | 10.81 | 12.46 | 52.73 | 33.30 | 9.60 | 10.74 | 6.86 | 16.36 | 20.07 | 19.85 | 12.28 | 20.34 | 15.31 |
| FeO % | 4.07 | 6.29 | 3.64 | 4.67 | 2.79 | 3.00 | 5.76 | NA | NA | NA | NA | NA | NA | NA | NA | NA | NA | NA | NA | NA |
| MgO % | 3.00 | 5.02 | 3.18 | 4.01 | 0.22 | 1.24 | 1.54 | 4.37 | 3.24 | 0.42 | 2.78 | 7.15 | 5.09 | 3.34 | 3.33 | 3.70 | 1.65 | 5.03 | 3.22 | 6.98 |
| MnO % | 0.01 | 0.04 | 0.05 | 0.03 | 0.04 | 0.04 | 0.10 | 0.04 | 0.03 | 0.01 | 0.02 | 0.05 | 0.03 | 0.03 | 0.05 | 0.03 | 0.02 | 0.04 | 0.04 | 0.05 |
| CaO % | 0.71 | 2.59 | 2.78 | 2.55 | 0.49 | 1.40 | 2.51 | 1.74 | 2.10 | 2.32 | 1.96 | 1.86 | 4.45 | 4.33 | 5.61 | 2.37 | 5.01 | 4.51 | 1.98 | 1.44 |
| Na2O % | 5.43 | 2.62 | 1.13 | 3.09 | 4.78 | 4.51 | 6.08 | 8.45 | 6.70 | 2.88 | 4.39 | 5.50 | 7.61 | 8.42 | 7.28 | 6.99 | 6.79 | 7.19 | 6.41 | 5.53 |
| K2O % | 0.64 | 1.22 | 1.05 | 0.08 | 1.14 | 2.44 | 2.07 | 1.77 | 0.33 | 0.01 | 0.17 | 1.27 | 0.29 | 0.03 | 0.01 | 0.01 | 0.01 | 0.03 | 0.11 | 0.63 |
| P2O5 % | 0.14 | 0.54 | 0.09 | 0.14 | 0.10 | 0.17 | 0.65 | 0.15 | 0.12 | 0.01 | 0.03 | 0.12 | 0.12 | 0.11 | 0.01 | 0.08 | 0.10 | 0.01 | 0.24 | 0.12 |
| U3O8 ppm | 10 | 60 | 930 | 2370 | 220 | 10 | 20 | <10 | <10 | <10 | <10 | <10 | <10 | <10 | <10 | <10 | 990 | 7800 | 6550 | 310 |
| U ppm | 8 | 51 | 789 | 2010 | 187 | 8 | 17 | <10 | <10 | <10 | <10 | <10 | <10 | <10 | <10 | <10 | 840 | 6614 | 5554 | 263 |
| Phases | Minerals | Pre-Ore Stage | Ore Stage | Post-Ore Stage |
|---|---|---|---|---|
| Oxides | Ilmenite |  | ||
| Titanite |  | |||
| Sphene |  | |||
| Magnetite |  | |||
| Uraninite |  | |||
| Goethite |  | |||
| Sulphides | Pyrite |  |  |  |
| Pyrrhotite |  |  | ||
| Molybdenite |  | |||
| Chalcopyrite |  | |||
| Galena |  | |||
| Sphalerite |  | |||
| Others | Coffinite |  | ||
| U phosphate |  |
Disclaimer/Publisher’s Note: The statements, opinions and data contained in all publications are solely those of the individual author(s) and contributor(s) and not of MDPI and/or the editor(s). MDPI and/or the editor(s) disclaim responsibility for any injury to people or property resulting from any ideas, methods, instructions or products referred to in the content. |
© 2023 by the authors. Licensee MDPI, Basel, Switzerland. This article is an open access article distributed under the terms and conditions of the Creative Commons Attribution (CC BY) license (https://creativecommons.org/licenses/by/4.0/).
Share and Cite
Padhi, A.K.; Mukherjee, M.K.; Tripathi, B.K.; Pande, D.; Bisht, B.S.; Sarkar, B.C. Polymetallic Uranium Mineralisation in Rohil, Rajasthan, Western India: Insights from Mode of Occurrences, Structural Controls, Alteration Geochemistry and Exploration. Minerals 2023, 13, 555. https://doi.org/10.3390/min13040555
Padhi AK, Mukherjee MK, Tripathi BK, Pande D, Bisht BS, Sarkar BC. Polymetallic Uranium Mineralisation in Rohil, Rajasthan, Western India: Insights from Mode of Occurrences, Structural Controls, Alteration Geochemistry and Exploration. Minerals. 2023; 13(4):555. https://doi.org/10.3390/min13040555
Chicago/Turabian StylePadhi, Ajoy Kumar, Mrinal Kanti Mukherjee, Brajesh Kumar Tripathi, Dheeraj Pande, Balbir Singh Bisht, and Bhabesh Chandra Sarkar. 2023. "Polymetallic Uranium Mineralisation in Rohil, Rajasthan, Western India: Insights from Mode of Occurrences, Structural Controls, Alteration Geochemistry and Exploration" Minerals 13, no. 4: 555. https://doi.org/10.3390/min13040555