Article

Palaeoenvironmental Evolution Based on Elemental Geochemistry of the Wufeng-Longmaxi Shales in Western Hubei, Middle Yangtze, China

1
Department of Shale Gas Geological Survey, Hubei Geological Survey, Wuhan 430000, China
2
Key Laboratory of Continental Shale Hydrocarbon Accumulation and Efficient Development, Ministry of Education, Northeast Petroleum University, Daqing 163318, China
3
Departament de Mineralogia, Petrologia i Geologia Aplicada, Facultat de Ciències de la Terra, Universitat de Barcelona (UB), c/Martí i Franquès s/n, 08028 Barcelona, Spain
4
Hubei Coal Geological Exploration Institute, Wuhan 430000, China
*
Author to whom correspondence should be addressed.
Minerals 2023, 13(4), 502; https://doi.org/10.3390/min13040502
Submission received: 7 February 2023 / Revised: 23 March 2023 / Accepted: 27 March 2023 / Published: 31 March 2023

Abstract

:
The organic-rich shales found in the Wufeng–Longmaxi Formation are typically deposited in oxygen-deficient reducing environments. One of the primary sources of debate revolves around the question of whether the anoxic bottom water found in these shales is either euxinic or ferruginous, and this matter remains unresolved. Previous studies have mostly focused on the Wufeng–Longmaxi Formation as a whole in order to understand the key factors that control organic matter accumulation (OMA). However, research on OMA for each member, including the Wufeng Formation (WF), the lower Longmaxi Formation (LLM), and the upper Longmaxi Formation (ULM), has been insufficient. This paper aims to investigate the palaeoenvironmental conditions and OMA mechanisms of the Wufeng–Longmaxi shales in western Hubei by integrating data on total organic carbon (TOC) content, mineral compositions, major and trace elements, and iron speciation. The results indicate that the Wufeng–Longmaxi shales were deposited under highly restricted hydrographic conditions, except for relatively open and upwelling conditions in the upper WF. Silica in the upper WF was primarily biogenic origin and not hydrothermal. Ferruginous conditions were the primary redox conditions for organic-rich shales except for minor formations in the lower LLM that were deposited under euxinic conditions. Due to the tectonic uplift caused by the Kwangsian Orogeny in the upper LLM, the palaeoenvironment was characterized by a warmer and wetter climate, high terrigenous influx, oxic conditions, and low productivity as the result of the insufficient nutrients caused by the weak upwelling, leading to the turnover of graptolite biozones from LM5 to LM6. The factors influencing OMA changed vertically. TOC contents have a highly positive correlation with Al content, indicating that terrigenous influx was the main factor affecting OMA in the WF, which significantly differed from patterns found in other regions. This suggests that the sedimentation rate of organic matter was higher than the terrigenous dilution rate during the WF stage. The combination of redox conditions and productivity were the main factors affecting OMA in the LLM, while terrigenous influx was the key factor controlling OMA in the ULM, resulting in the dilution of organic matter. Regions in the eastern Yiling block, which are close to the Qinling Ocean, show better prospects for shale gas exploration. This research will further facilitate the development of shale gas in this area.

1. Introduction

During the late Ordovician to early Silurian period, black shales in the Wufeng–Longmaxi Formation were widespread on the upper and middle Yangtze Platforms [1,2,3,4,5], and are now considered among the most promising hydrocarbon source rocks in South China [6,7]. In recent years, large-scale commercial developments in shale gas have achieved success in the Jiaoshiba block of the southeastern Sichuan Basin [8,9,10], and significant shale gas sources have been discovered in the Yiling block of western Hubei [2,3,11]. Consequently, considerable attention has been given to studying the palaeoenvironmental characteristics and organic matter accumulation (OMA) mechanisms of these blocks [5,12,13,14,15], which are vital for hydrocarbon generation and play a crucial role in determining the physical properties of shale reservoirs [1,2,3].
Previous studies have demonstrated that the Wufeng Formation (WF) and lower Longmaxi Formation (LLM) are organic-rich shales [3,13,16] deposited in the deep shelf [15,17] during a large-scale transgression [16,18]. These formations experienced warm and humid climates [5,14], dysoxic to anoxic conditions [13], and high productivity [3,15,16]. Moving upward to the upper Longmaxi Formation (ULM), the palaeoenvironmental became characterized by a warmer and wetter climate, high terrigenous influx [15,16], and the oxic conditions of bottom water due to the fall in sea level caused by the intense tectonic uplift of the Chuanzhong and Xuefeng uplifts [16,19], leading to the formation of organic-lean shales. Remarkably, the fall in sea level during the ULM stage was caused by the Kwangsian Orogeny, which was a tectonic event dominated by horizontal movement with local vertical uplift movement, occurring from the southeast of Guangxi province to the northwest of Hunan province during the late Ordovician to the late Silurian [16,20,21], leading to the change of the environment from anoxic to oxic conditions, and turnover of the graptolite biozone LM5 in the Rhuddanian to LM6 in the Aeronian (Figure 1d) [21]. However, further research is necessary to fully understand the transition from LM5 to LM6.
Recently, iron speciation has been utilized to distinguish ferruginous and euxinic bottom water conditions in the Wufeng–Longmaxi Formation of the Sichuan Basin [22,23,24,25]. For instance, formations in the upper WF and lower LLM in well PY1 in the Sichuan Basin and in well Shenci-1 near the Qinling Ocean are apparently deposited under euxinic conditions [23]. However, the anoxic bottom water conditions in the Yichang area of western Hubei may be different from those in the regions near the depocenter of the Sichuan Basin and Qinling Sea in northern Yangtze, due to the different sedimentary facies. Therefore, further studies are required to determine the anoxic-ferruginous or anoxic-euxinic conditions of organic-rich shales in the WF and LLM in western Hubei. Additionally, the upwelling intensity of the bottom water may differ in different regions of the middle and upper Yangtze, owing to the varying sedimentary facies [12].
Generally, the OMA mechanism can be explained by the preservation model and productivity model [2,26], which indicate that redox conditions [5,27] and productivity [3,28] are the two main factors that influence OMA in the Wufeng–Longmaxi Formation. Previous studies have mostly focused on the Wufeng–Longmaxi Formation as a whole in order to understand the key factors that control organic matter accumulation (OMA). However, research on OMA for each member, including the WF, LLM, and ULM, has been insufficient.
Considering the inadequate research on the palaeoenvironmental evolution and OMA mechanism, we collected 24 samples from well YD1 of the Yiling block for geochemical testing to analyze the associated palaeoenvironmental conditions and OMA mechanism (Figure 1d). Moreover, we conducted further studies on the differences in geological conditions between the Yiling block and Jiaoshiba block [6,13]. The geological significance of this study lies in providing a geochemical basis for shale gas exploration in the area.

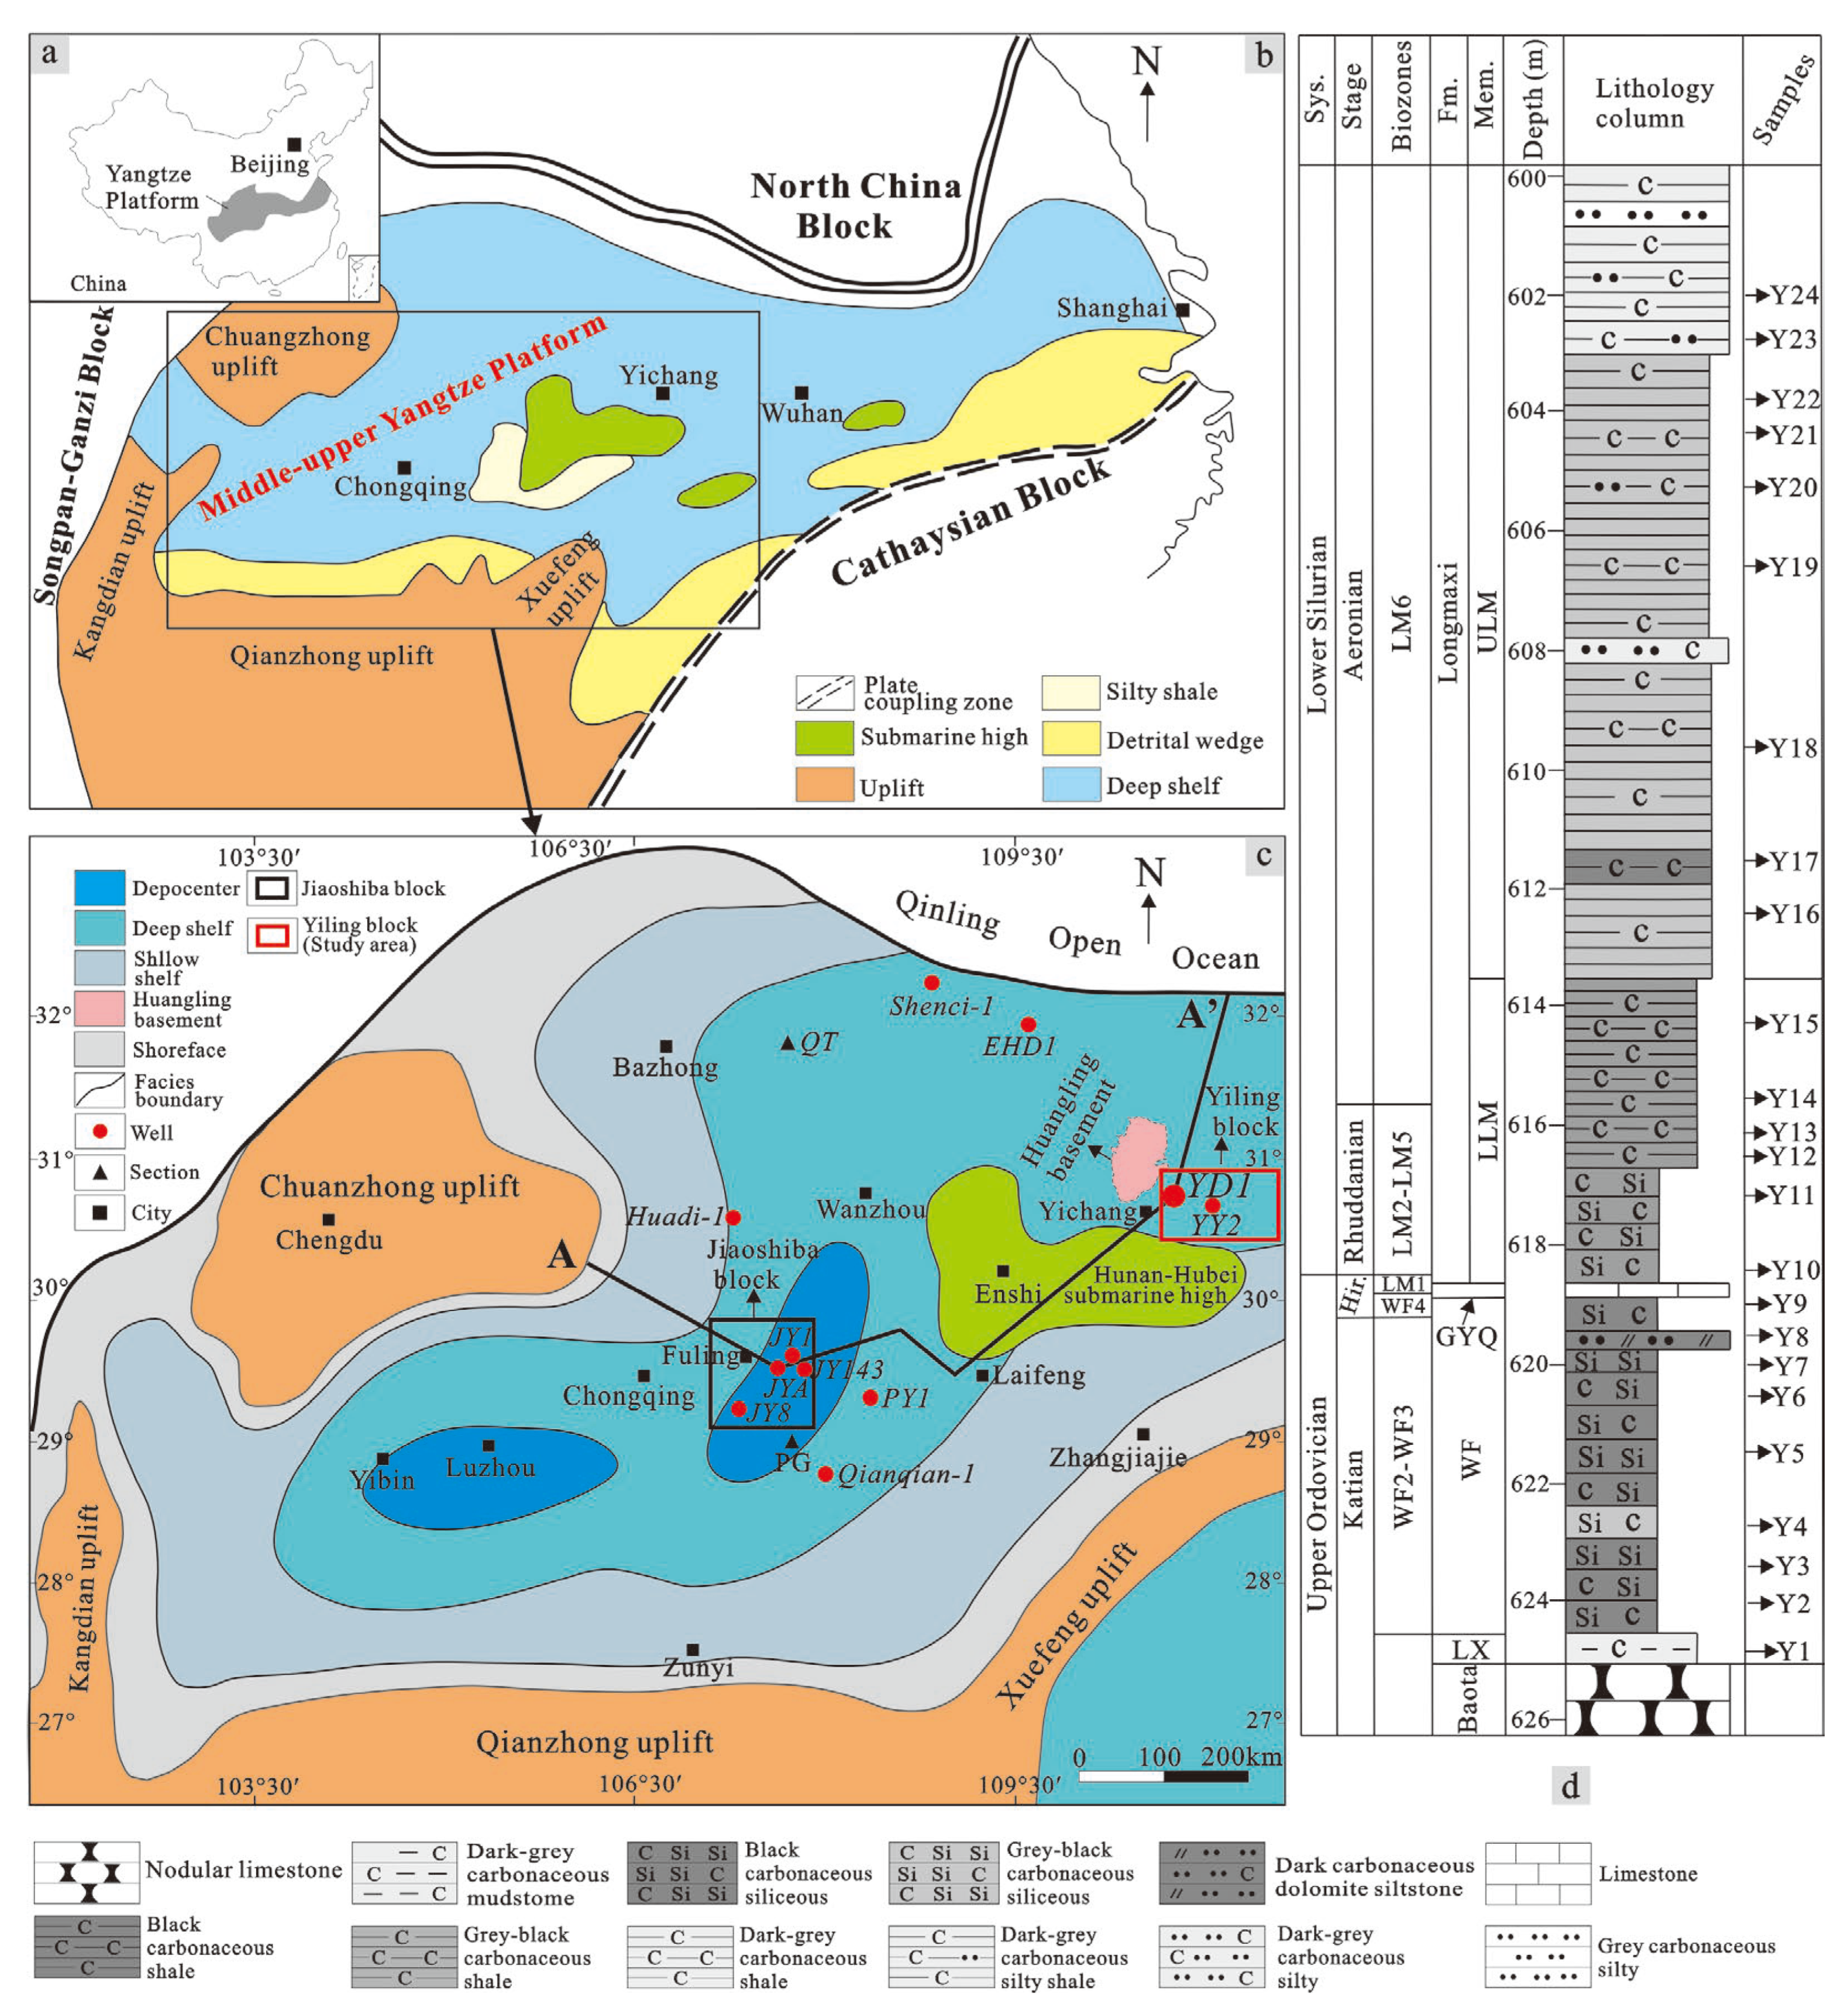
2. Geological Setting

The Yangtze Platform, located in central China, is divided into the upper, middle, and lower regions based on sedimentary facies (Figure 1a). The middle-upper Yangtze Platform lies in the central and western parts of the region and is bordered by various uplifts and blocks, such as the Kangdian uplift to the southwest, Chuanzhong uplift to the northwest, Qinling Ocean and North China Block to the north, Qianzhong uplift to the south, and Xuefeng uplift and Cathaysia Block to the southeast (Figure 1b) [4,16]. During the late Ordovician to early Silurian, the Cathaysia Block subducted and extruded the middle-upper Yangtze Platform due to the Caledonian movement, forming a tectonic pattern with alternating uplifts and depressions and a semi-closed marine environment [4,15]. The Wufeng–Longmaxi shales were deposited in these depressions, with two main depocenters in the southern and eastern Sichuan Basin, respectively [29]. Additionally, the Hunan–Hubei submarine high was formed between the cities of Chongqing and Yichang (Figure 1b and c) during the WF stage of the late Ordovician due to the collision between the Cathaysia Block and the Yangtze Platform [15,16,30].
The Fuling Jiaoshiba block, located in the southeastern Sichuan Basin and depicted in the black rectangle in Figure 1c, is the oldest commercial shale gas development block in China [6]. Recently, significant shale gas sources have also been discovered in the Yiling block in the study area [2], which is situated southeast of the Huangling basement and indicated by the red rectangle in Figure 1c. Well YD1, which targets the Wufeng–Longmaxi shales, is located in the Yiling block (Figure 1c). Generally, the Wufeng–Longmaxi Formation can be vertically divided into the Katian, Hirnantian, Rhuddanian, and Aeronian stages according to graptolite biozones [21]. According to lithological characteristics, it can be further divided into the LX, WF, GYQ, LLM, and ULM sections [2]. Among these, the LX section is composed of dark grey carbonaceous mudstone, the WF section is primarily composed of black carbonaceous siliceous rock interbedded with minor dolomite siltstone, the lower and upper LLM sections are mainly composed of black carbonaceous siliceous rock and black carbonaceous argillaceous shale, respectively, and the ULM section is mainly composed of dark grey carbonaceous shale (Figure 1d).

3. Methodology

3.1. Samples and Methods

Twenty-four fresh shale samples were collected from well YD1 in the Yiling block, comprising one sample from the LX (Y1), eight samples from the WF (Y2–Y9), six samples from the LLM (YA10–YA15), and nine samples from the ULM (YA16–YA24). After recovery, the samples were immediately placed in paper bags and analyzed by the State Key Laboratory of Biogeology and Environmental Geology in China for their TOC content, mineral compositions, major, trace, and rare earth elements, as well as iron speciation.
Among these, the TOC content was tested with a Multi EA 4000 carbon-sulfur tester, and 200 mesh samples of 0.1~0.3 g were treated with dilute hydrochloric acid to remove inorganic carbon and dried at 60~80 ℃ before the experiment, using the test methods and procedures following Chinese National Standard GB/T19145-2003. Mineral compositions were tested by a Rigaku SmartLab SE X-ray diffractometer, and approximately 5 g of evenly mixed sample powder was taken out for X-ray diffraction analysis, using test methods and procedures following China Petroleum Industry Standard SY/T 5163-2018. Major elements were analysed by a ZSXPrimus Ⅱ X-ray fluorescence spectrometer, using test methods and procedures following Chinese National Standard GB/T 14506.28-2010. Trace and rare earth elements were determined with a multireceiver cup inductively coupled plasma source mass spectrometer, using test methods and procedures following Chinese National Standard GB/T14506.30-2010. Total iron content (FeT) was determined by the sulfosalicylic acid spectrophotometric method. Highly reactive iron (FeHR) includes iron in pyrite (Fepy), carbonate (Fecarb), magnetite (Femag), and ferric oxides (Feox). Fepy content was calculated from the concentration of pyrite sulfur (FeS2) extracted using CrCl2 reduction and precipitated as Ag2S in silver nitrate traps [26]. Fecarb, Feox, and Femag fractions were extracted by the sequential procedure described in Poulton and Canfield (2005) [31] and measured by atomic absorption spectroscopy. All of the tests were conducted under an ambient laboratory temperature approximately 24 °C; relative humidity was maintained at 65%; and analytical errors were less than 5%.

3.2. Data Presentation

The enrichment factor (EF) can be applied to evaluate the degree of elements enrichment in sediments using the following equation [32]:
EF = (X/Al)sample/(X/Al)PAAS
where (X/Al)sample is the ratio of element X to Al measured in the sample, and (X/Al)PAAS is the ratio of element X to Al in post Archean Australian shale (PAAS) [33]. Generally, EF > 3, 1 < EF < 3, and EF < 1 were interpreted to reflect apparent enrichment, moderate enrichment, and depletion, respectively, relative to the PAAS standard [34].
In palaeomarine environments, the element concentration in sediments includes both non-biogenic and biogenic components. The concentration of elements derived from biogenic sources equals the total concentration in every sample minus its non-biogenic influx, and can therefore be calculated as follows [33,35]:
Xbio = XSample − AlSample × (X/Al)PAAS
where Xbio is the biogenic part of element X, and Xsample, and Alsample are the contents of elements X and Al measured in the sample, respectively. (X/Al)PAAS is the ratio of X to Al in the PAAS.
The chemical index of alteration (CIA), which was originally proposed by Nesbitt and Young (1982) to determine the chemical weathering intensity of the provenance of clastic rock, was calculated following the formula below [36]:
CIA = molar (Al2O3/[(Al2O3 + CaO* + Na2O + K2O)]×100)
All major element concentrations are calculated in mole fractions. CaO* refers to CaO in silicate. The method of indirect calculation of the value of CaO* as follows [5]: CaORemain = molar (CaO-P2O5 × 10/3), if molar (CaORemain) < molar (Na2O), then molar (CaO*) = molar (CaORemain); if molar (CaORemain) > molar (Na2O), then molar (CaO*) = molar (Na2O). Generally, CIA values change greatly in different palaeoclimates, and CIA values range from 50 to 70, 70 to 80, and 80 to 100, indicating low, moderate, and high degrees of chemical weathering, respectively [14]. In general, weak weathering is associated with cold and arid climates, whereas intense weathering is associated with hot and wet climates. New K was introduced by K metasomatism during diagenesis, resulting in low CIA values. Therefore, it was necessary to correct it. Generally, the CIA values before K metasomatism (CIAcorr) value can be calculated by Al2O3–CaO* + Na2O–K2O ternary diagrams [35].
Additionally, La–Th–Sc and Th–Sc–Zr/10 ternary discrimination diagrams are used to infer the tectonic settings [37,38]. The CIAcorr value, Sr/Cu, and Rb/Sr ratios are used to reconstruct palaeoclimate conditions [39,40]. The Al/(Al + Fe + Mn) and (Fe+Mn)/Ti ratios are used to evaluate hydrothermal deposition [15,41]. The Sibio/(Sibio + Febio + Al + Cabio) ratio is used to distinguish biogenic sources, where a ratio of > 0.8 indicates an absolute biogenic source [17,35]. The Al content is used to study the level of terrigenous influx [15,16]. The V/Cr, Ni/Co, U/Th, and Fe/Al ratios are used to reflect palaeoredox conditions [14,42,43,44,45]. A Fepy/FeHR vs. FeHR/FeT discrimination diagram is used to distinguish euxinic and ferruginous conditions [46,47]. The Mo vs. TOC discrimination diagram and proxy Co × Mn are used to evaluate palaeohydrography [48,49]. The proxies Sibio, (Ni + Cu + Zn)bio, P/Ti, and Cu/Al are used to evaluate palaeoproductivity [3,13,15,40]. The LaN/YbN ratio is used to reflect the deposition rate [35], where subscripts N represents the chondrite normalization [50].

4. Results

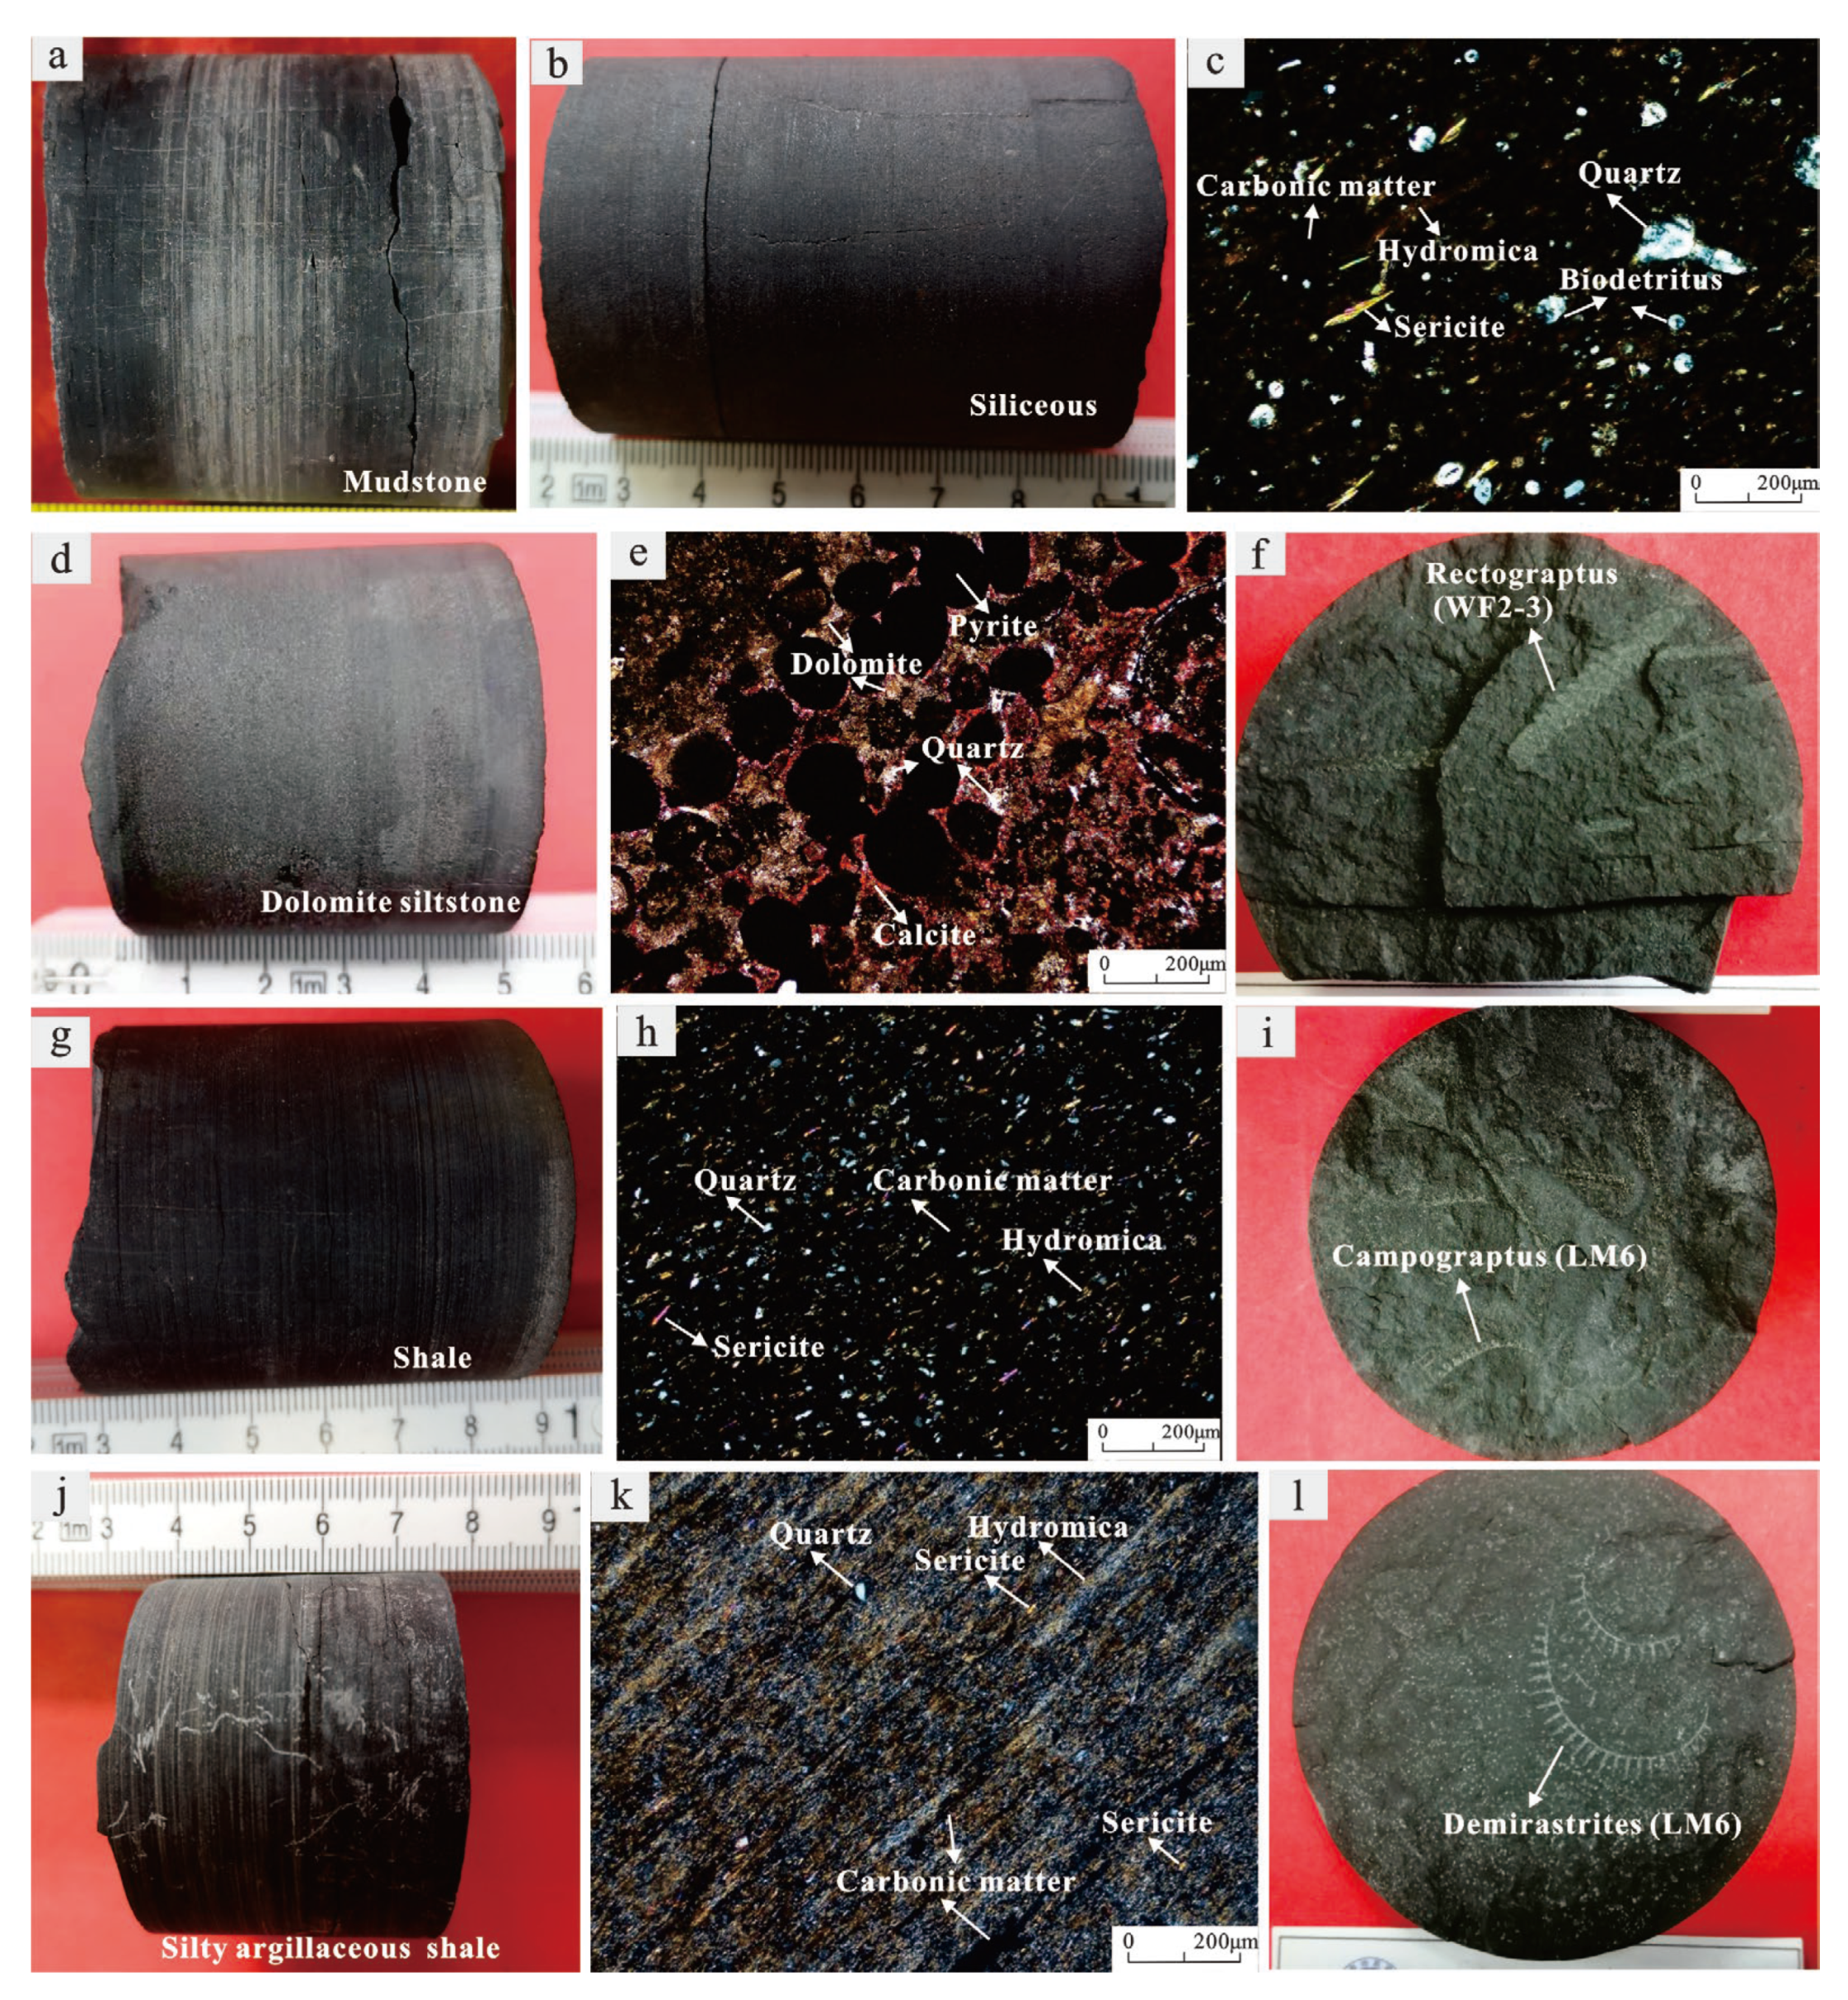
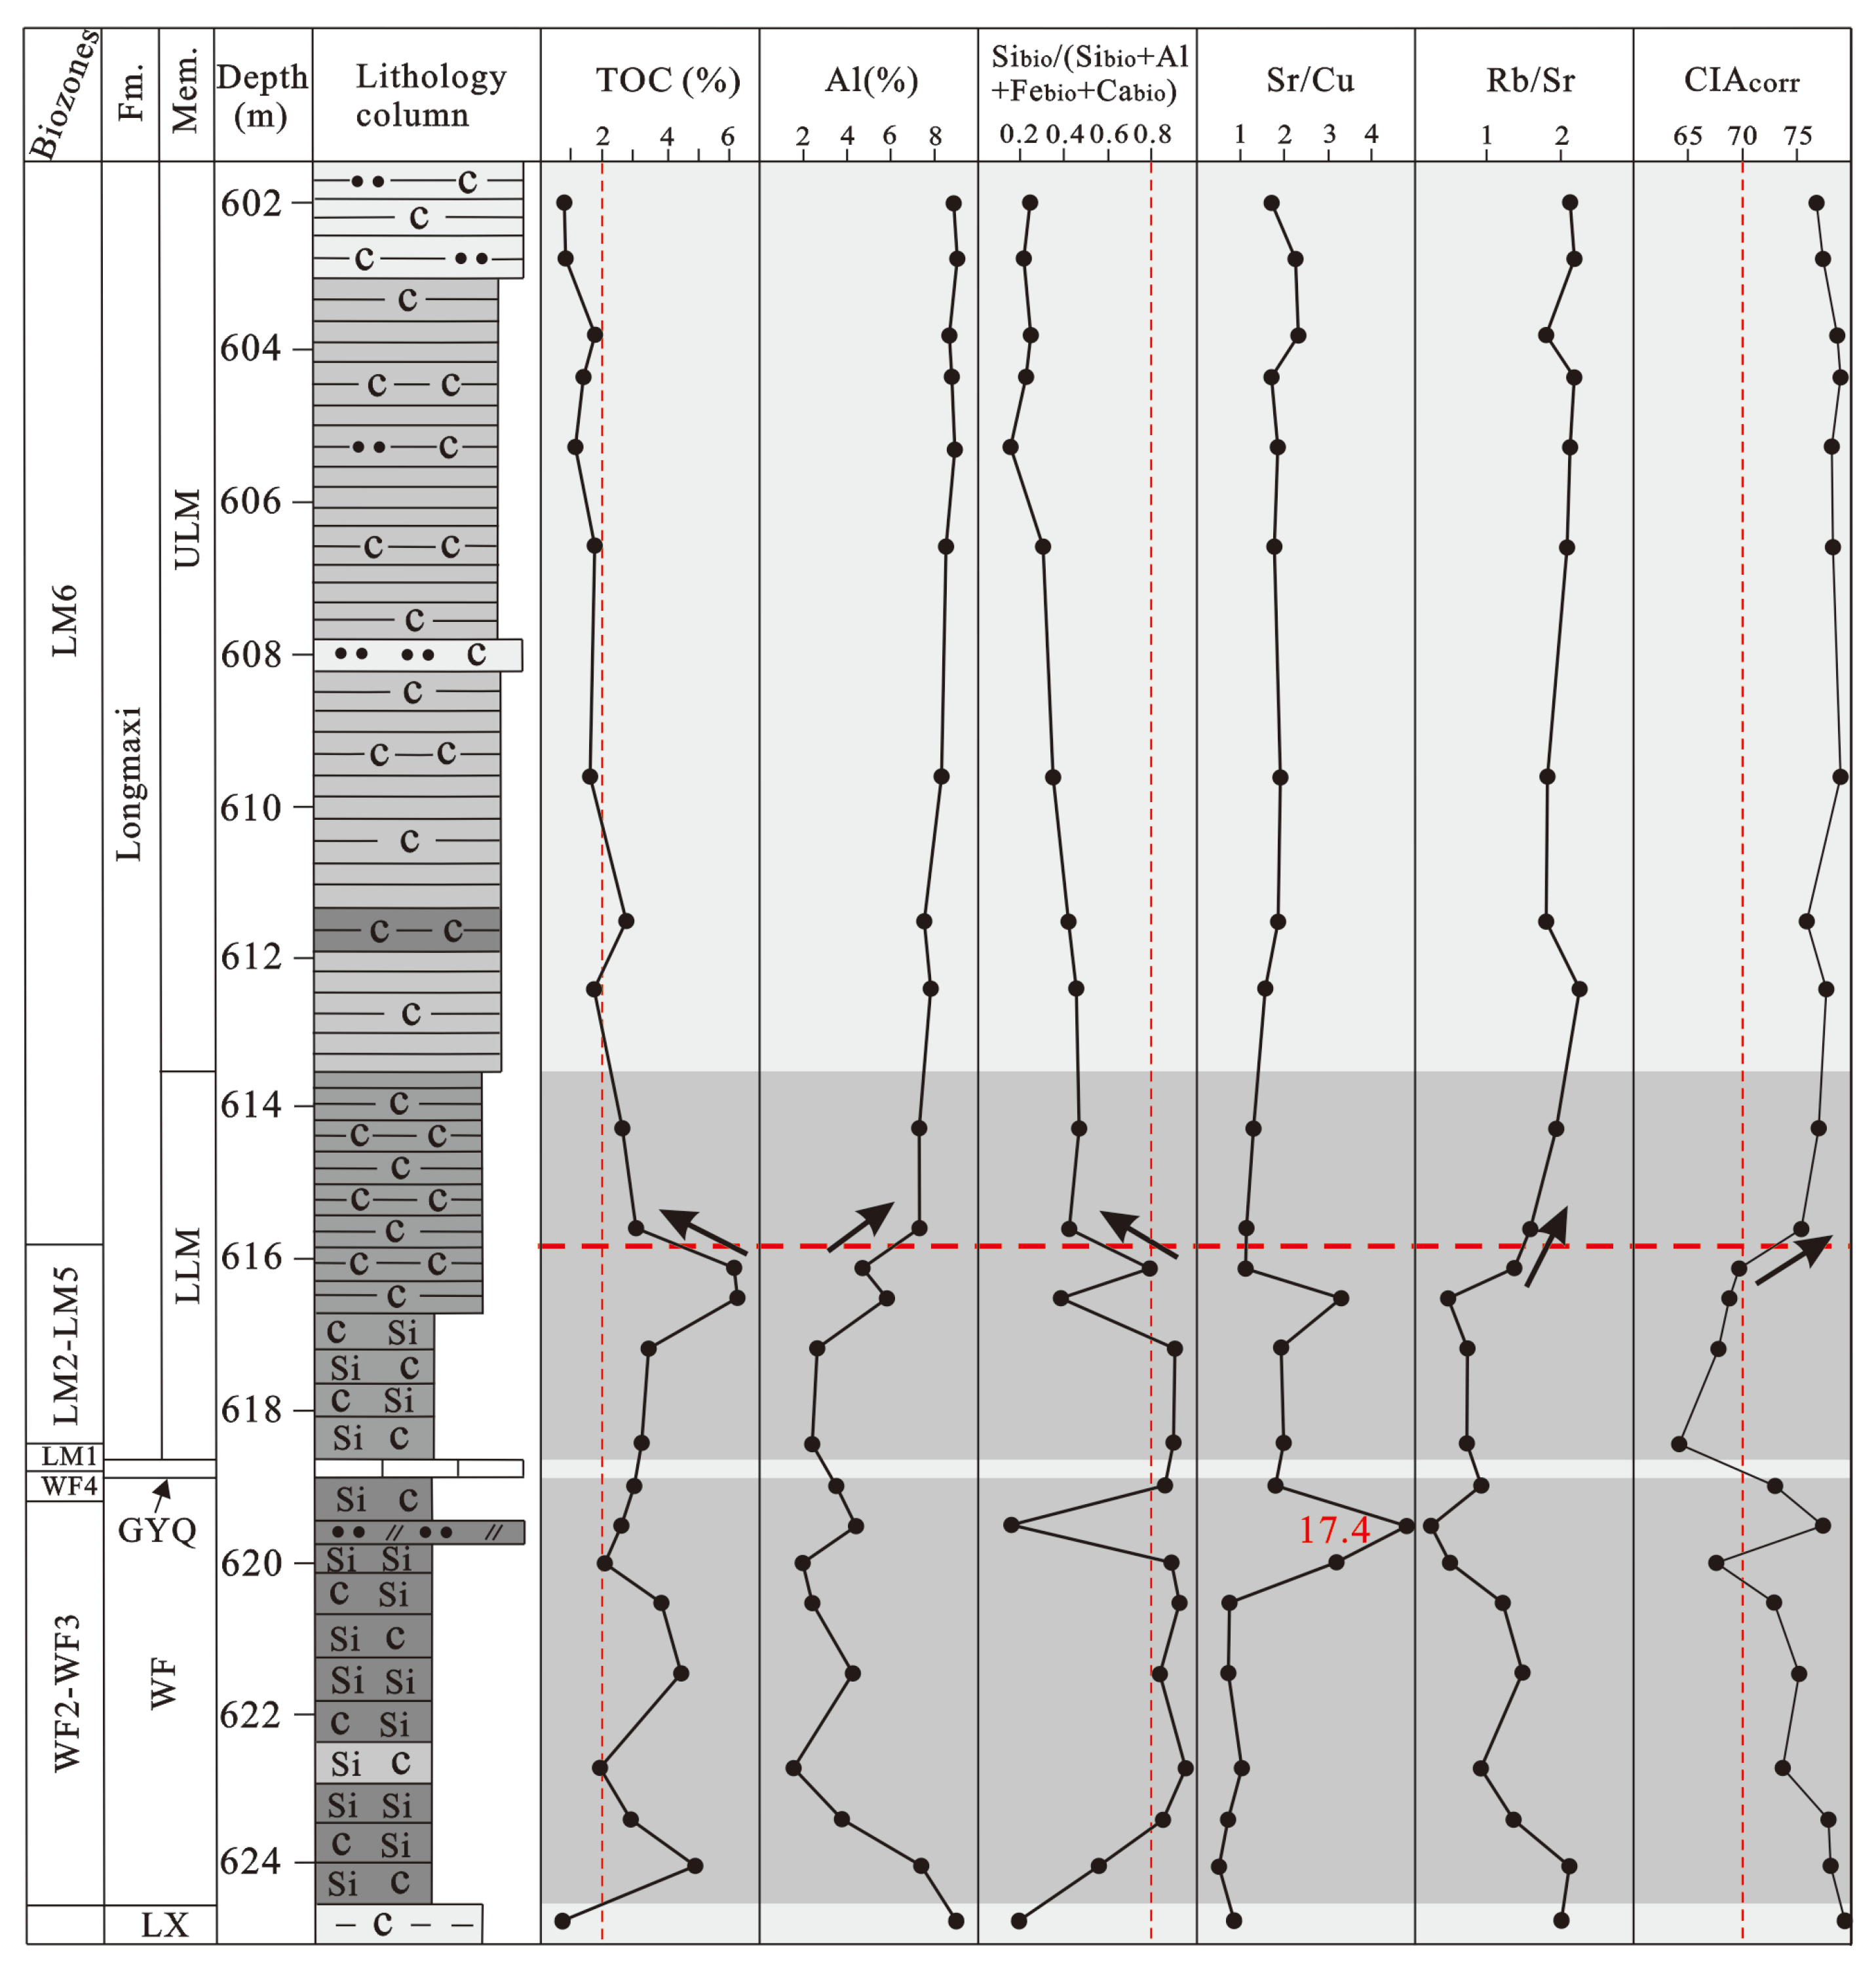
4.1. Lithology and Graptolite Biozones
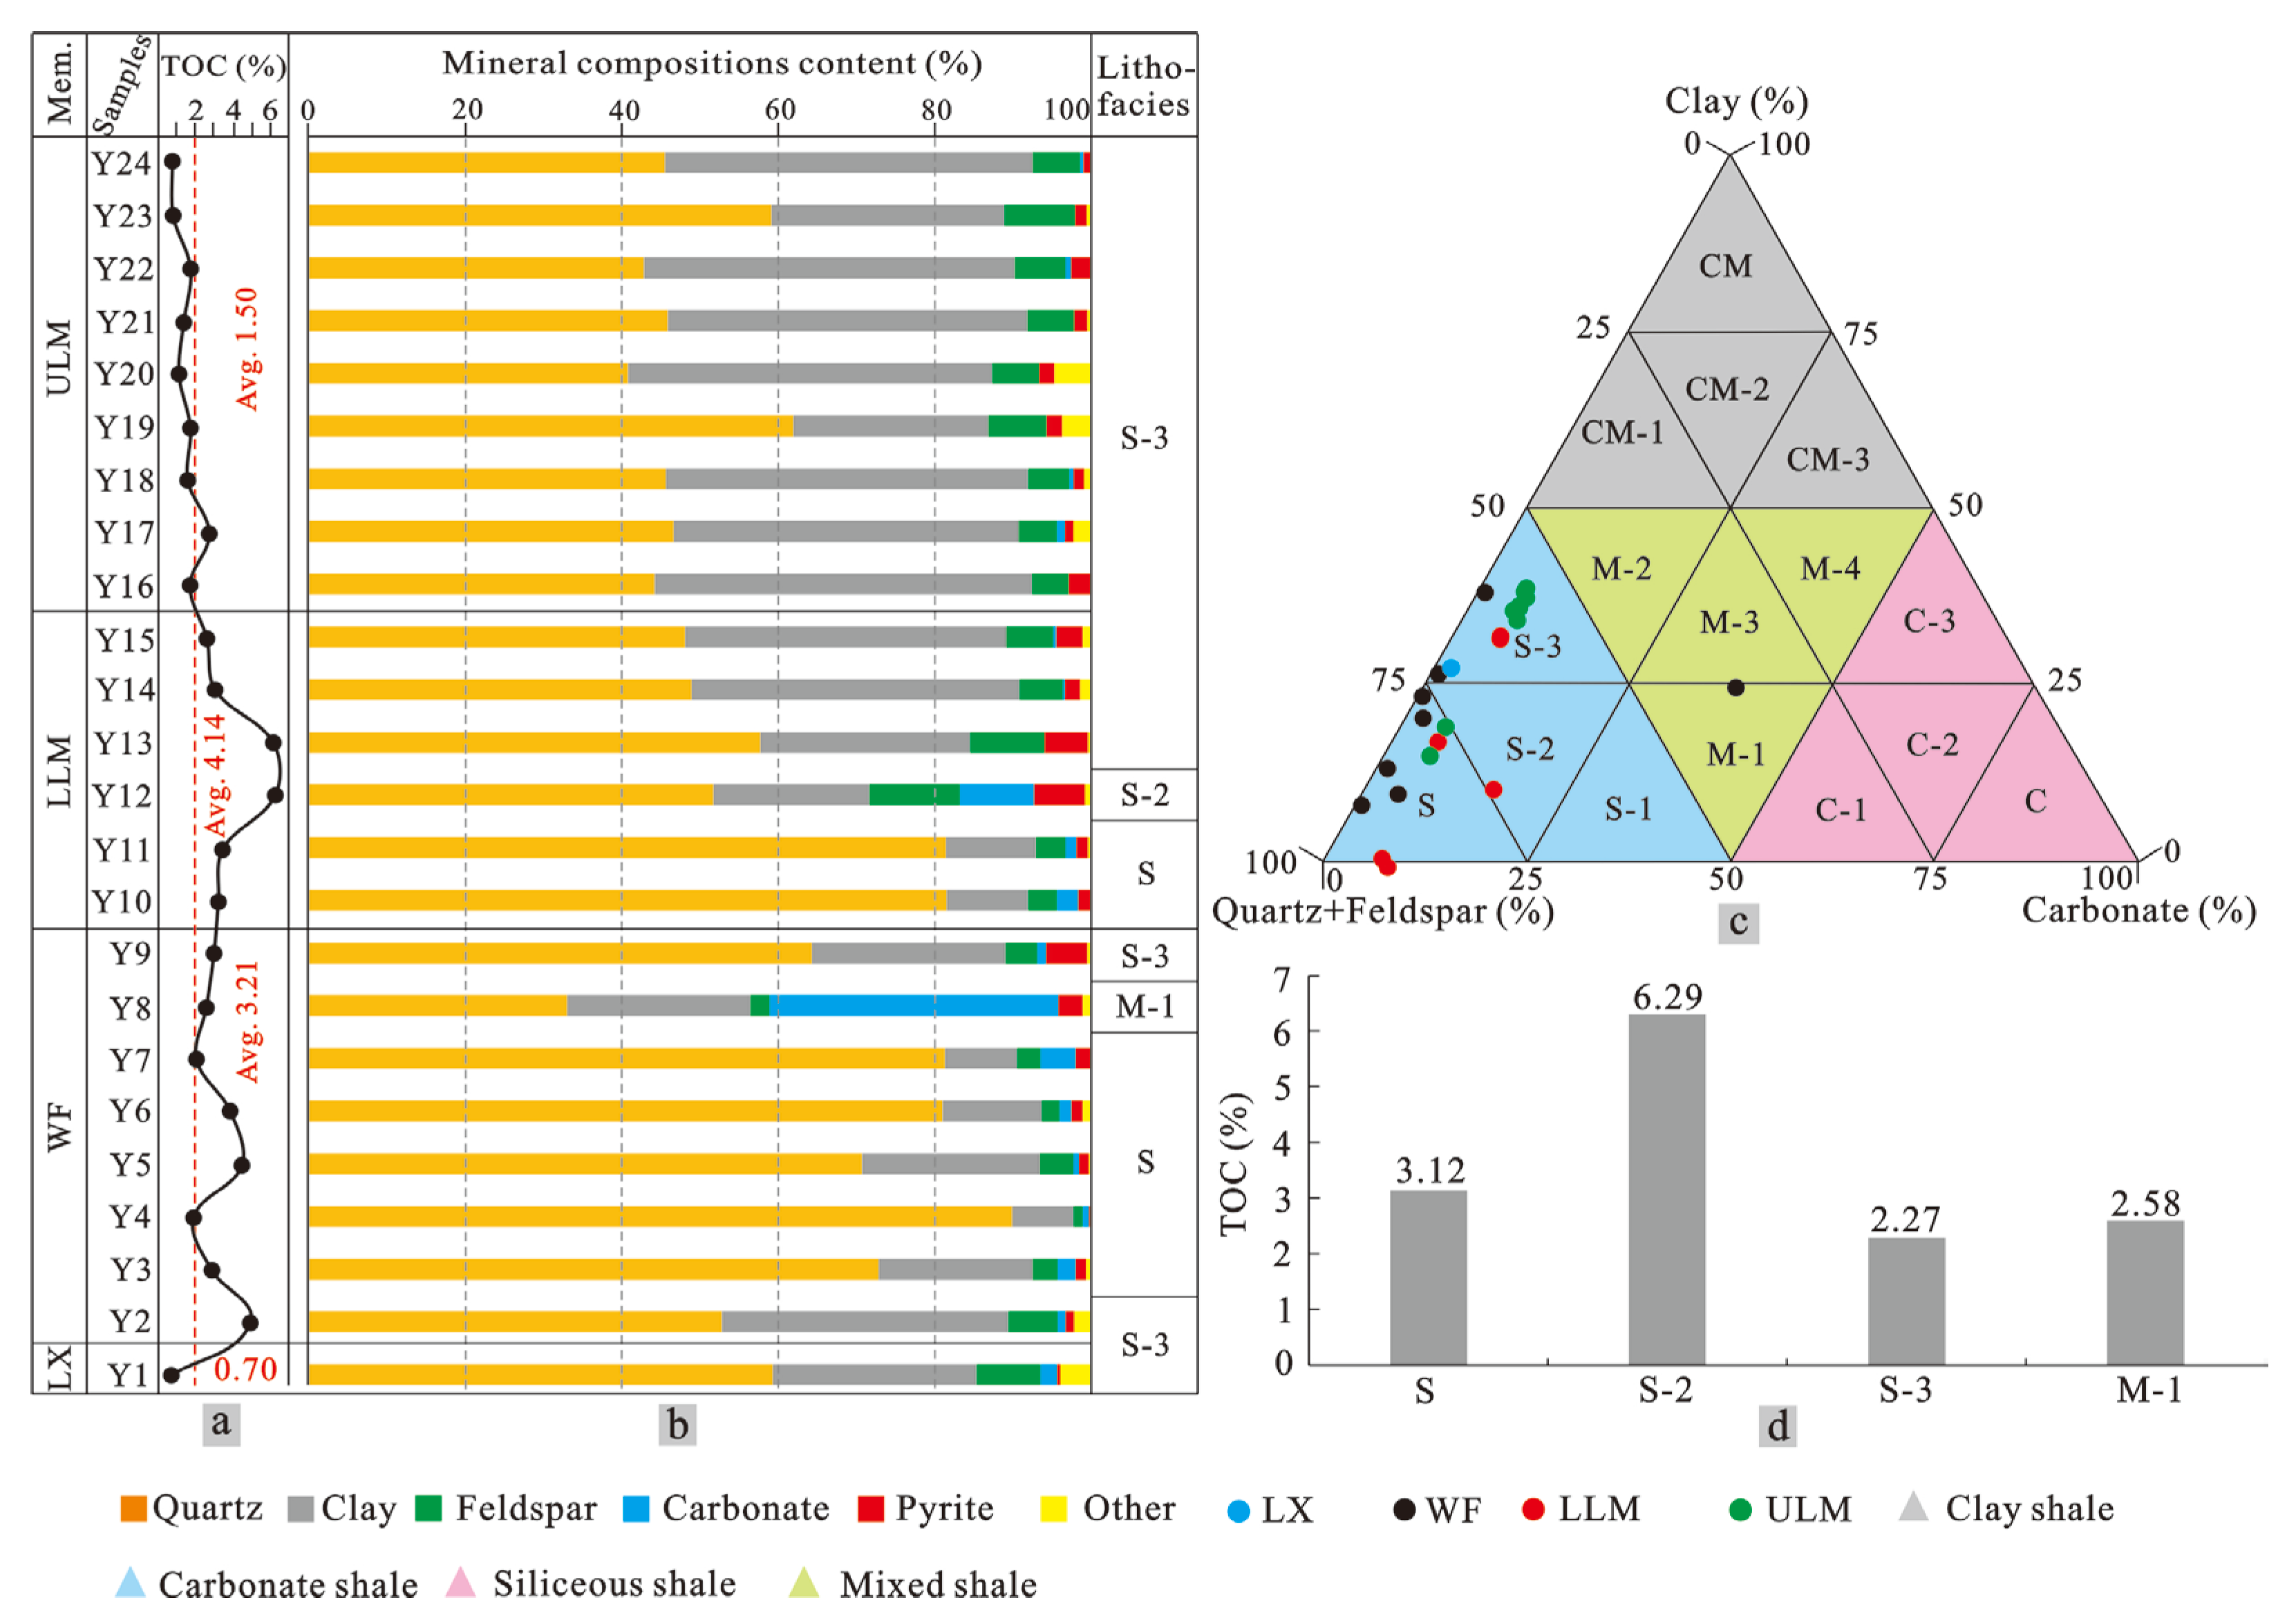
Core and thin section images are shown in Figure 2. The LX is composed of dark grey carbonaceous mudstone (Figure 2a). The WF is primarily composed of black carbonaceous siliceous rock (Figure 2b) with larger quartz grains and many bioclasts (Figure 2c) interbedded with minor dolomite siltstone (Figure 2d) containing much calcite and dolomite (Figure 2e). Rectograptus of the WF2-3 graptolite biozones was clearly observed in the bedding plane (Figure 2f). The LLM is mainly composed of black carbonaceous argillaceous shale with clear laminated bedding (Figure 2g), the mineral compositions are slightly oriented, and the particle size of quartz is obviously smaller than that in the WF (Figure 2h). Campograptus of graptolite biozone LM6 was clearly observed in the bedding plane (Figure 2i). The ULM is mainly composed of dark grey carbonaceous shale (Figure 2j), and the mineral compositions are apparently oriented with many hydromica minerals (Figure 2k). Demirastrite graptolites of the LM6 biozone are clearly observed in the bedding plane (Figure 2l).

4.2. TOC Content

Generally, organic-rich and organic-lean shales are characterized by TOC contents of greater than 2%, and lower than 2%, respectively [51]. The TOC values are presented in Table 1 and Figure 3a. The TOC content is less than 1% in the LX with a value of only 0.7%, and it ranges from 1.90% to 4.94% (avg. 3.21%), 2.61% to 6.29% (avg. 4.14%), and 0.76% to 2.74% (avg. 1.50%) in the WF, LLM, and ULM, respectively. The results show that the WF and LLM include organic-rich shales, and the LX and ULM include organic-lean shales. Additionally, the results show a significant decrease in TOC content from 6.18% of sample Y13 to 3.05% of sample Y14 in the LLM.

4.3. Mineral Compositions and Lithofacies

Mineral compositions are mainly composed of quartz and clay in all of the samples, for which quartz contents reach 59.3%, 33.0%–89.9% (avg. 68.3%), 48.1%–81.5% (avg. 61.6%), and 40.8%–61.9% (avg. 48.0%) in the LX, WF, LLM, and ULM, respectively, showing a decreasing trend from the bottom to the top. In contrast, clay contents reach 26.0%, 7.8%–36.6% (avg. 19.6%), 10.4%–41.9% (avg. 25.3%), 24.9%–48.2% (avg. 42.2%), showing an increasing trend from bottom to top. Contents of feldspar, carbonate, and pyrite are low in all of the samples, and the feldspar, carbonate, and pyrite contents are higher in the ULM, WF, and LLM, respectively (Figure 3b).
Shale can be divided into four lithofacies types (siliceous, calcareous, clay, and mixed shales) [52]. These can further be subdivided into sixteen lithofacies types according to a three-end element map of clay, carbonate, and felsic rocks content [53]. The results show that most samples are plotted in the siliceous shale field except for sample Y8 of the WF, which is plotted in the mixed shale field, for which organic-rich shales in the WF and LLM are primarily plotted as subclass lithofacies type S, and organic-lean shales in the LX and ULM are primarily plotted as subclass lithofacies type S-3 (Figure 3c).

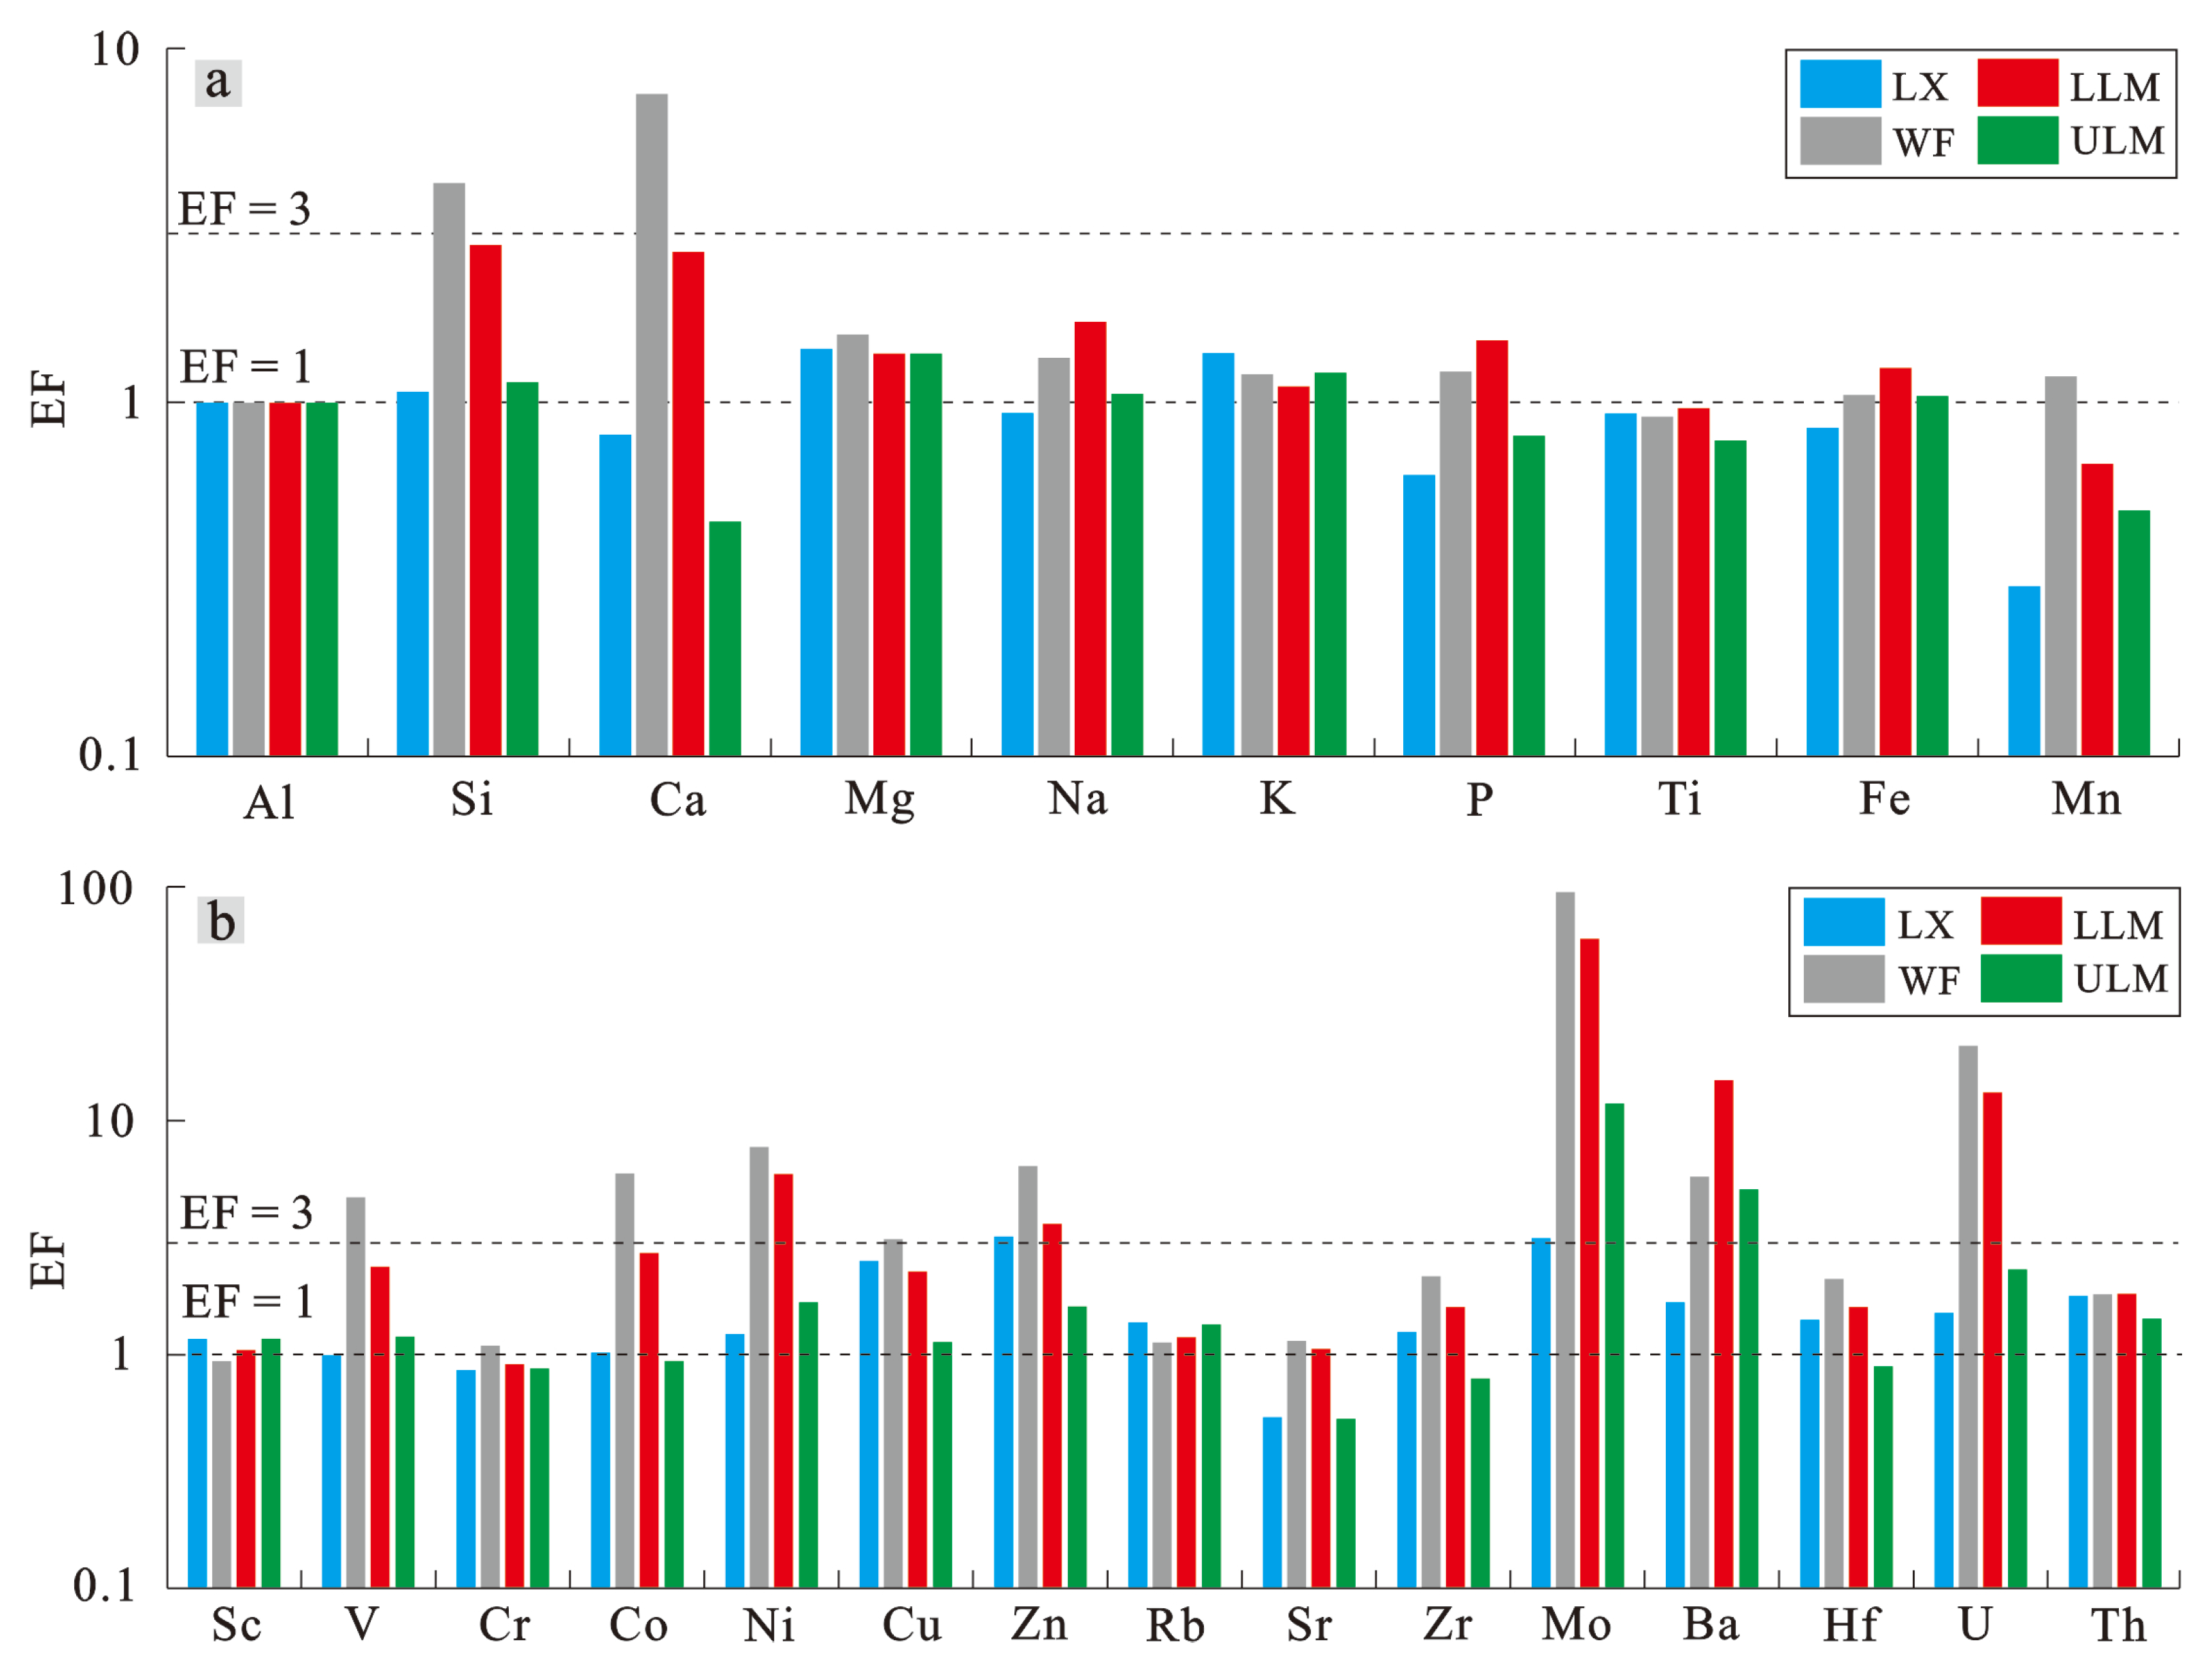
4.4. Major and Trace Elements

The results regarding major elements are listed in Table 1. Major oxides mainly include SiO2 and Al2O3 in all of the formations, where organic-rich shales have higher contents of SiO2 in the WF (34.74%–89.92%, avg. 72.97%) and LLM (48.92%–82.04%, avg. 67.13%), and organic-lean shales have higher contents of Al2O3 in the LX (17.07%) and ULM (14.24%–17.10%, avg. 16.08%). Additionally, organic-rich shales are relatively rich in CaO, while organic-lean shales are relatively rich in MgO, Na2O, and K2O. The EF value shows that Si, Ca, Na, P, and Fe contents in the organic-rich shales are higher than those of the organic-lean shales with moderate to apparent enrichment relative to PAAS (Figure 4a).
The results of the trace elements are listed in Table 2. V, Co, Ni, Mo, and U are rich in organic-rich shales, while Sc, Cr, Rb, Hf, and Th are rich in organic-lean shales. The EF values show that V, Co, Ni, Cu, Zn, Mo, Ba, and U contents in organic-rich shales are higher than those of organic-lean shales with moderate to apparent enrichment relative to PAAS (Figure 4b).

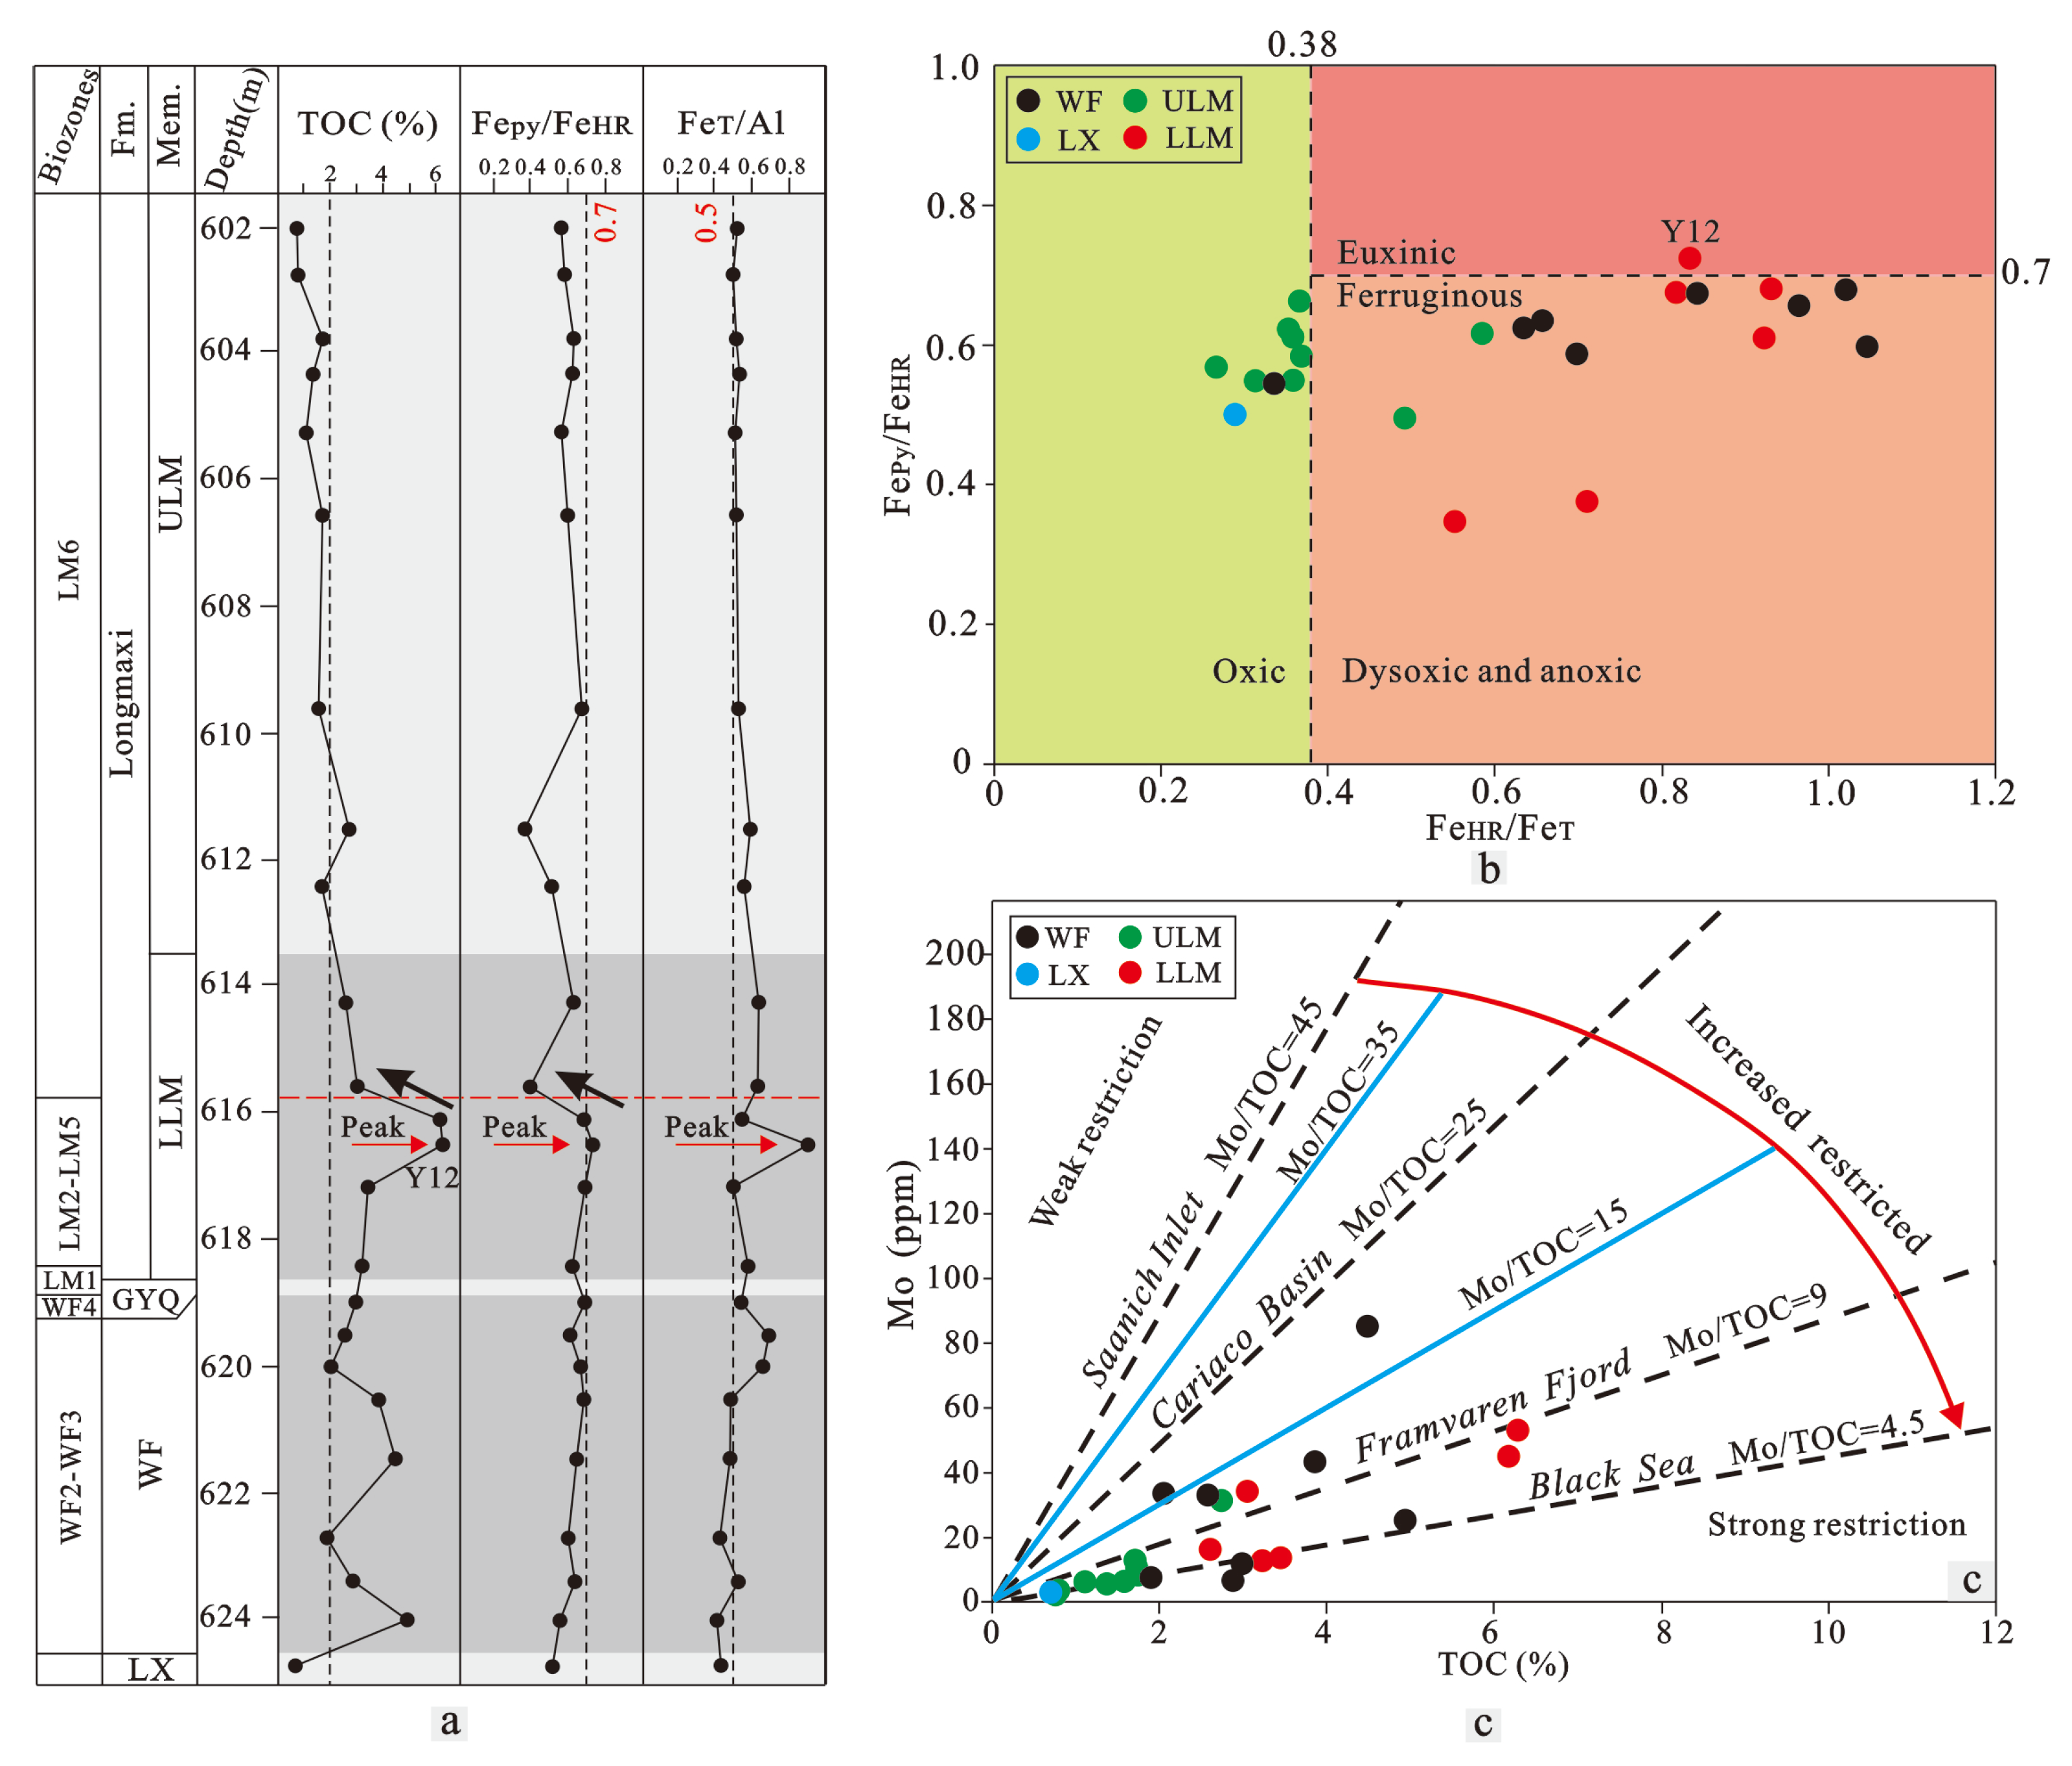
4.5. Iron Speciation

The iron speciation results are listed in Table 1. Fepy and FeHR contents are characterized as follows: the LLM (avg. 1.52% and 2.50%, respectively) > the ULM (avg. 0.92% and 1.70%, respectively) > the WF (avg. 0.89% and 1.43%, respectively) > the LX (0.56% and 1.12%, respectively). Average contents of FeT are characterized as follows: the ULM (avg. 4.46%) > the LX (3.86%) > the LMX (avg. 3.29%) > the WF (avg. 1.88%).

5. Discussion

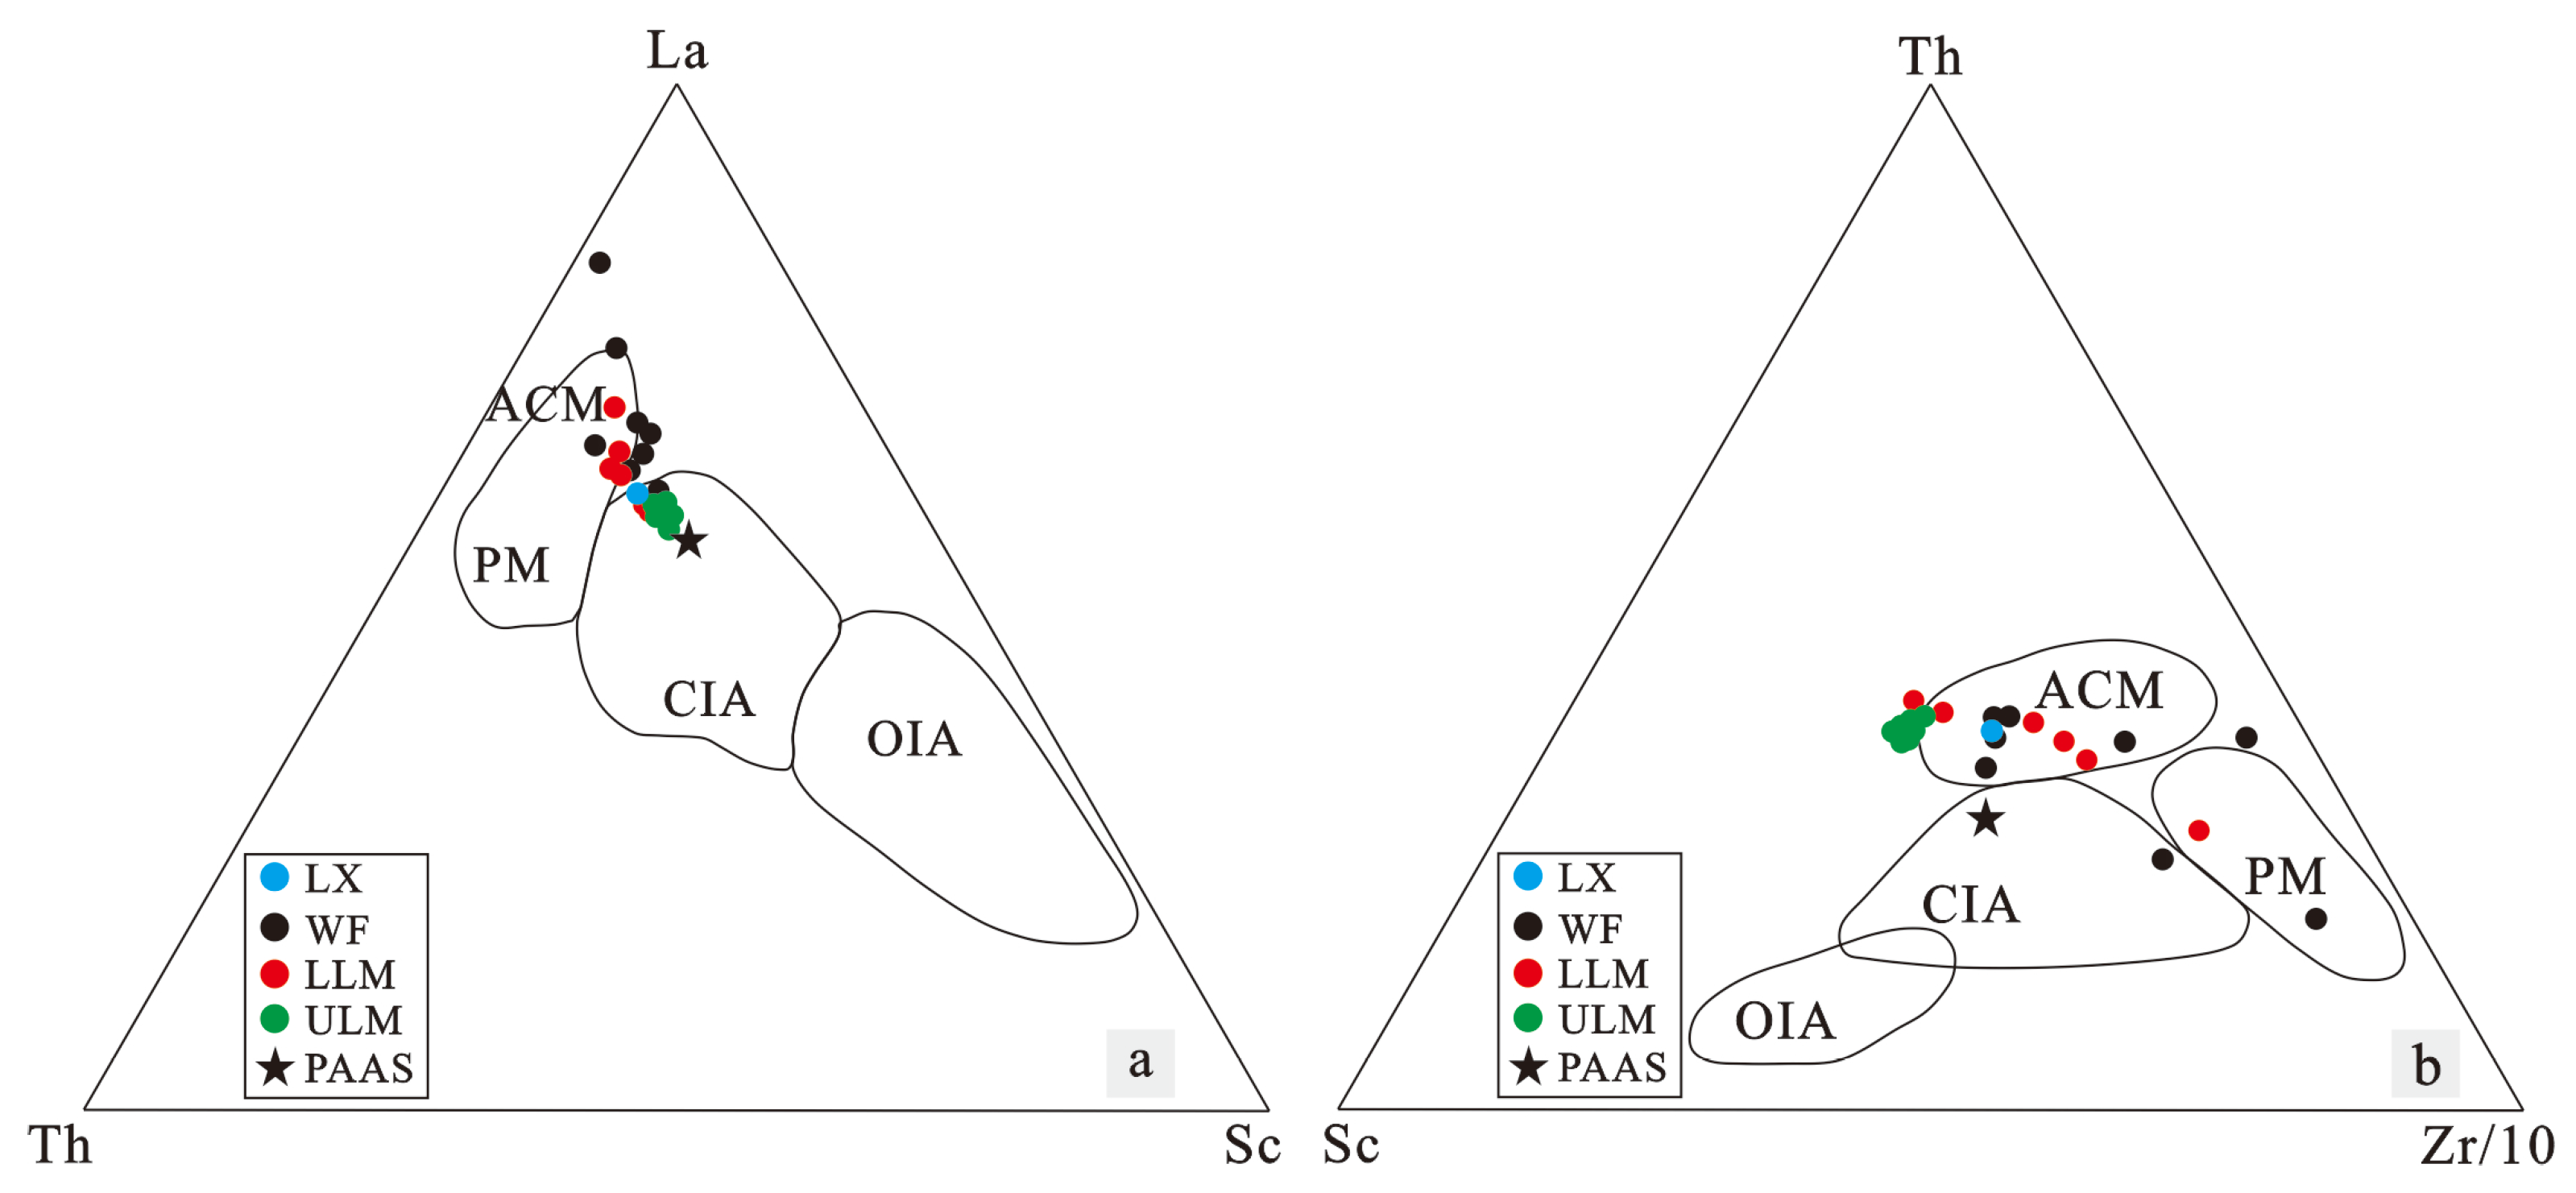
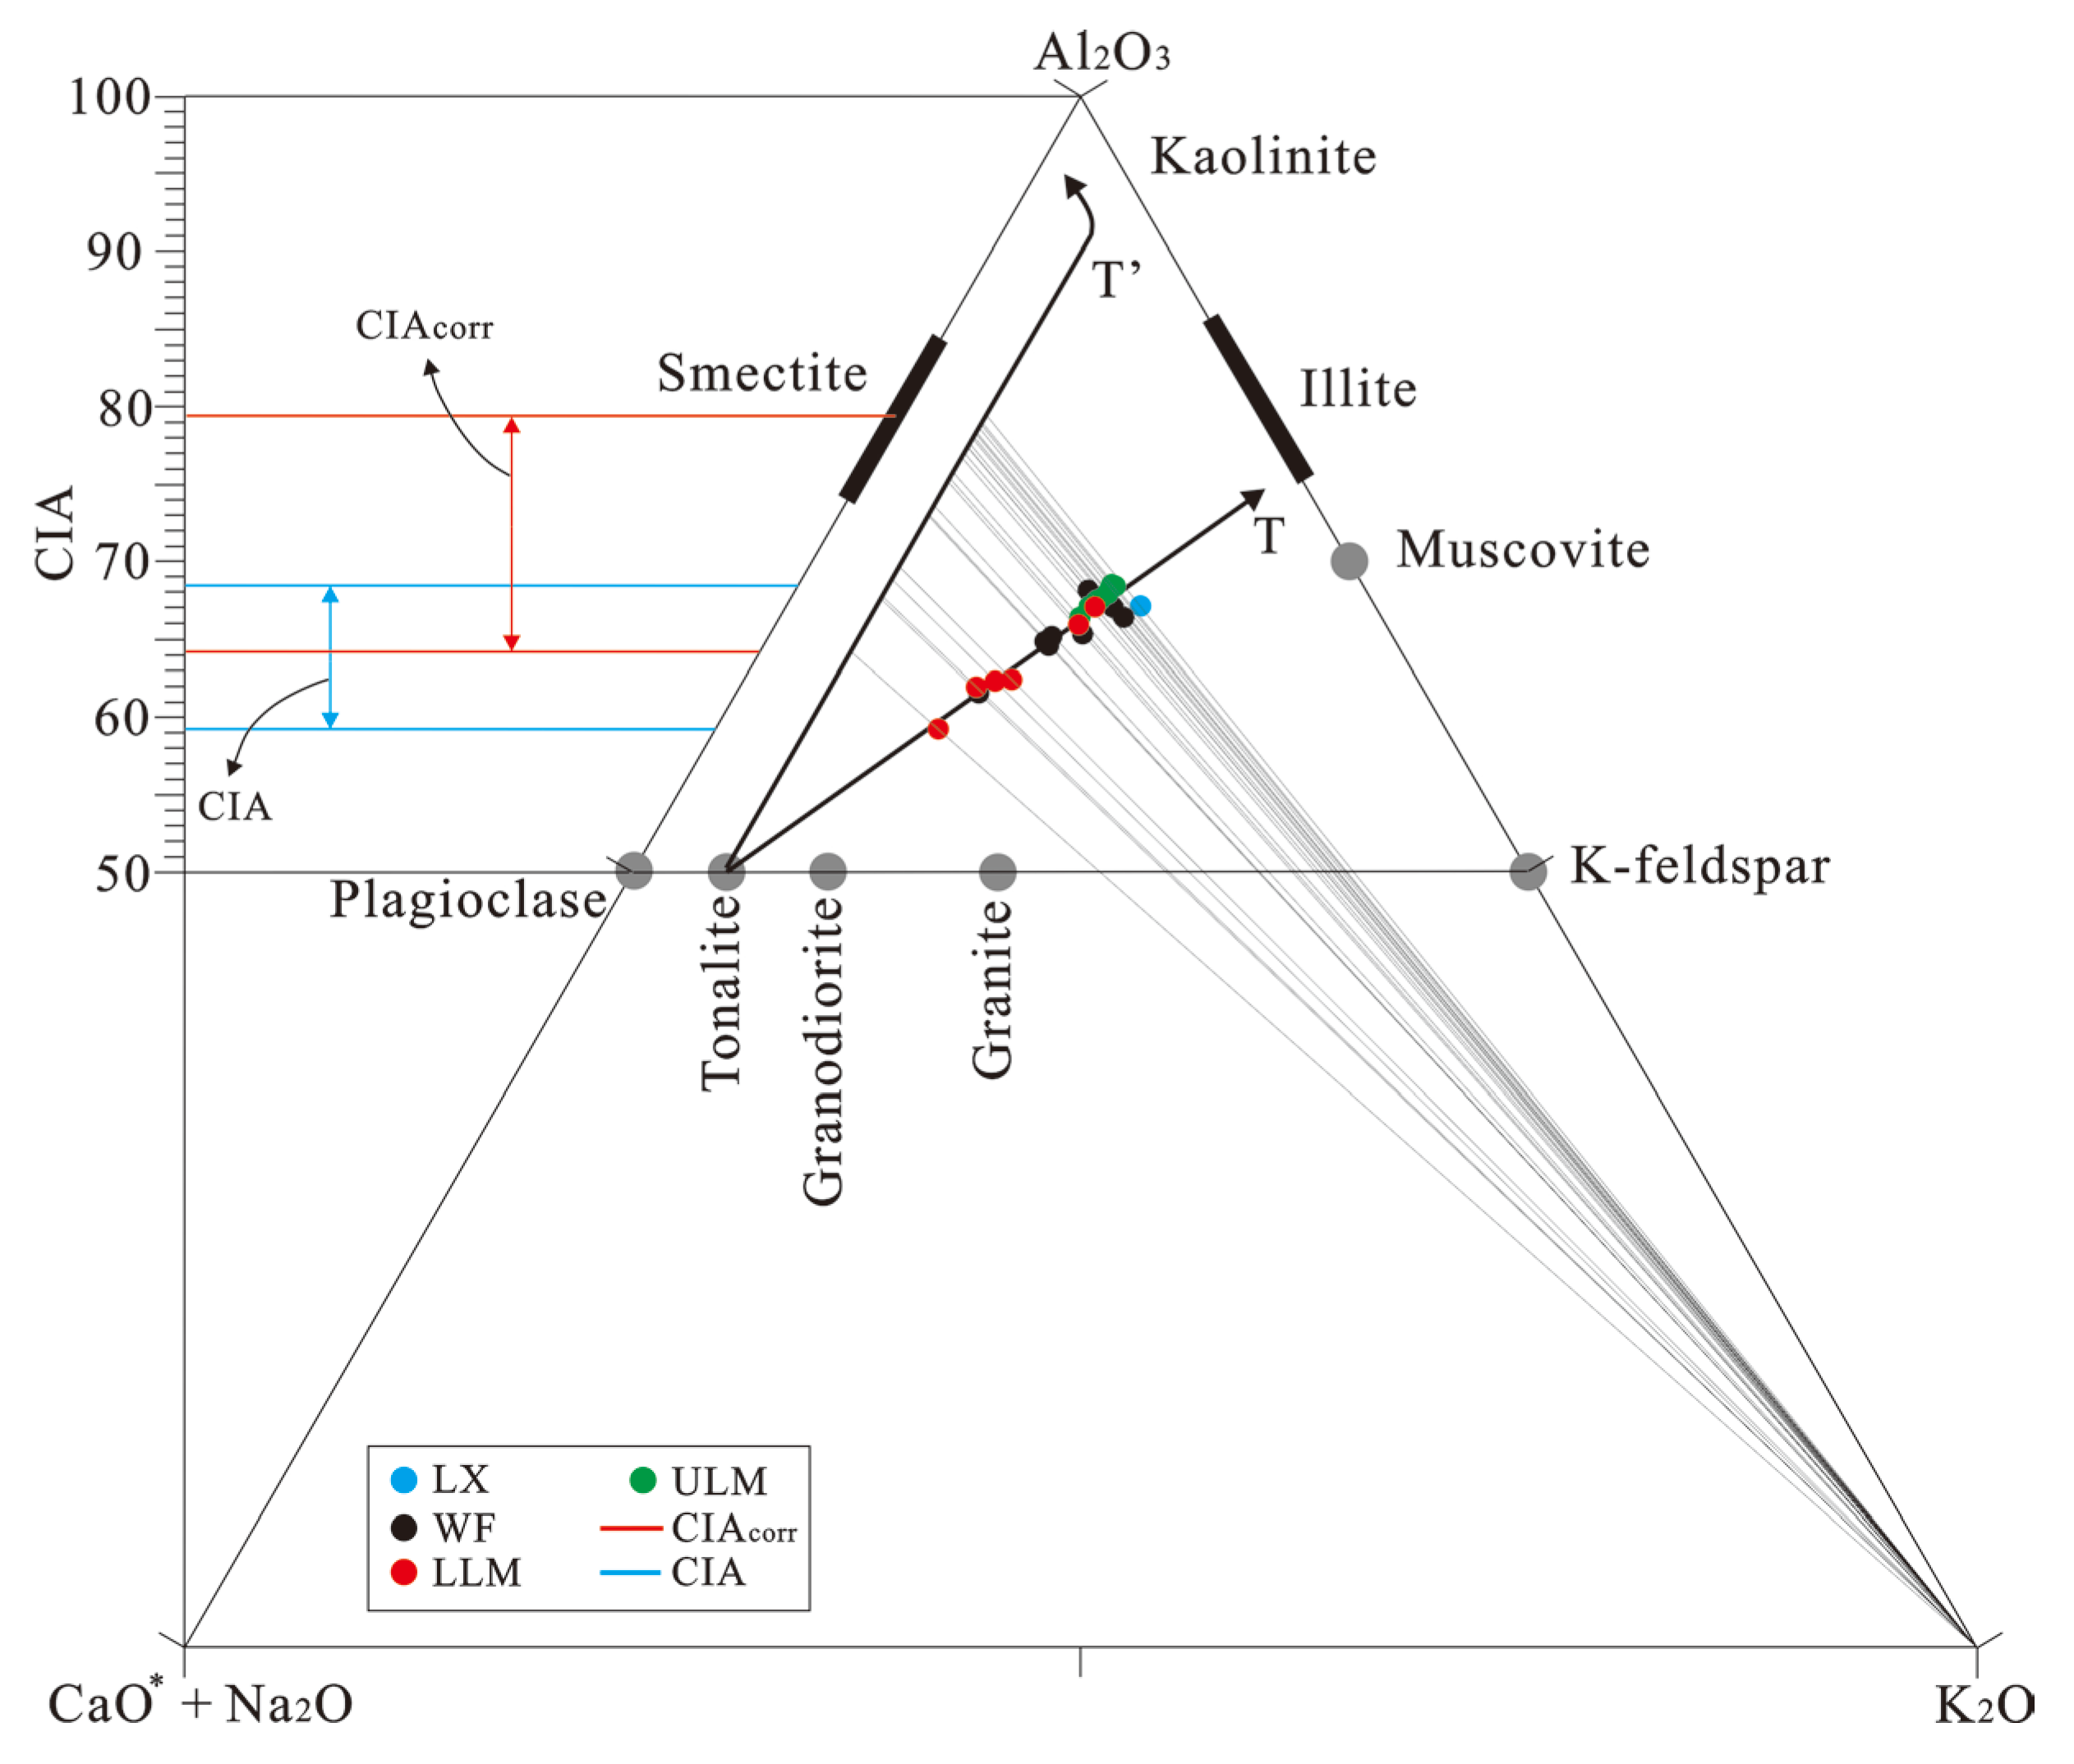
5.1. Tectonic Setting

Trace element discrimination diagrams have also been used to distinguish tectonic settings [37,38]. In the diagrams of La-Th-Sc and Th-Sc-Zr/10 (Figure 5a,b) proposed by Bhatia and Crook (1986) [37], most samples mainly plot within or near the field of the active continental margin, and minor samples fall within the field of the continental island arc, which is consistent with that of the Huadi-1 well in the southeastern Sichuan Basin [38]. These results show that from the late Ordovician to the early Silurian, the subduction of the Proto-Tethys oceanic crust towards the South China Plate led to the convergence and compression between the Cathysia Block and Yangtze Platform [16], forming a tectonic setting of mainly active continental margins.

5.2. Palaeoenvironment

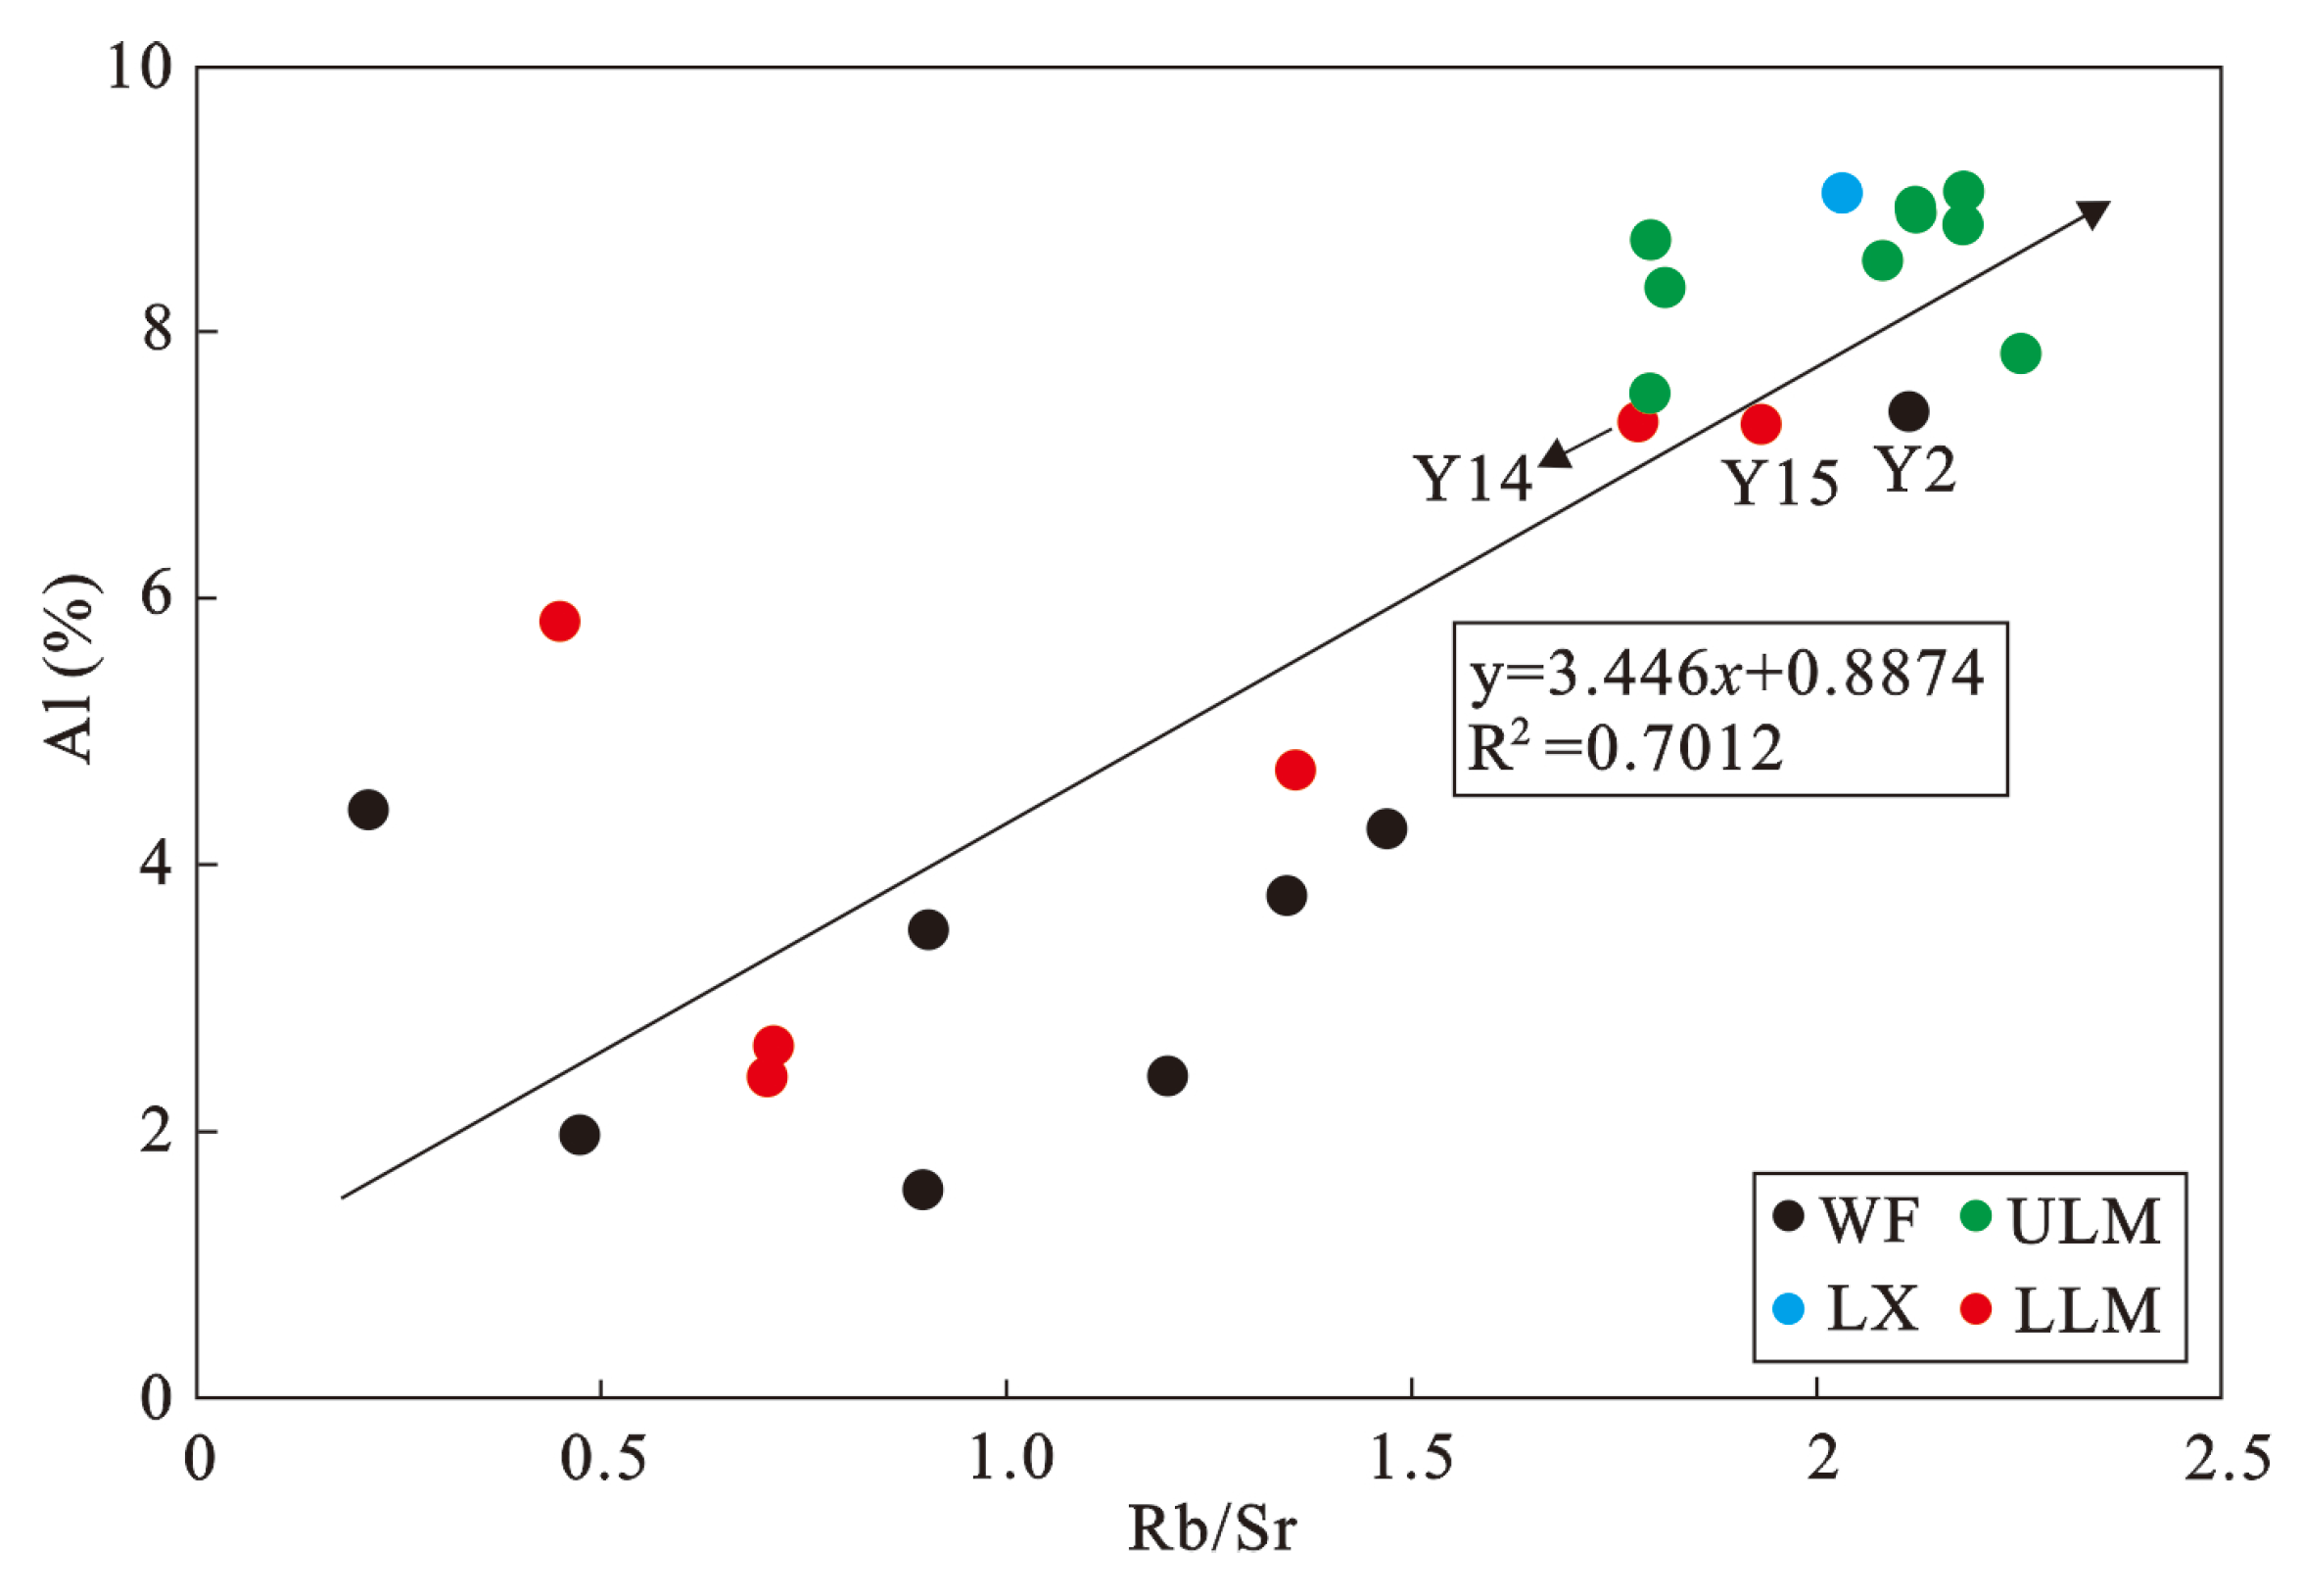
5.2.1. Palaeoclimate

The palaeoclimate controls levels of the humidity and weathering, thus affecting terrigenous influx and the sediment supply in sedimentary rocks [41]. The chemical index of alteration (CIA) has been widely used to reconstruct the palaeoclimate, and the formula of CIA is shown in Section 3.2 [5,16,35]. The Sr/Cu ratio is an effective indicator for evaluating palaeoclimate change, with ratios of <5, 5–10, and >10 indicating humid, semihumid-semiarid, and arid palaeoclimates, respectively [40,54]. Additionally, because Rb is relatively stable under weathering, whereas Sr is prone to leaching during weathering, the Rb/Sr ratio is often used to study palaeoclimate in provenance, with high and low ratios indicating a warm and humid climate with a high degree of weathering and an arid climate with a low degree of weathering, respectively [39,55].
The Al2O3–CaO* + Na2O–K2O ternary diagrams (Figure 6) show that the predicted weathering trend line (T’) is parallel to the Al2O3–CaO* + Na2O line and points towards the endmember of Al2O3. Starting from the K2O end member, crossing the sample data point and intersecting with T’, the CIAcorr values can be obtained [35].
The results show that the CIAcorr value is highest in the LX with the value of 79.5, and it ranges from 67.6 to 78.1 (avg. 74.5), 64.2 to 77.0 (avg. 70.5), 75.9 to 79.0 (avg. 77.9), and 57.4 to 75.7 (avg. 72.1), respectively, which indicate mainly a moderate degree of chemical weathering and imply a warm and humid climate in the Wufeng–Longmaxi Formation. Comparatively speaking, the CIAcorr values of the LX and ULM are higher than that of the WF and LLM, which indicates a much warmer and wetter climate in the organic-lean shales (Table 1; Figure 6 and Figure 7).
As shown in Figure 7, the Sr/Cu ratios of most samples are lower than 5 except for sample Y8 of dolomite siltstone from the WF, which has a Sr/Cu ratio of 17.4, denoting a primarily warm and humid climate in the Wufeng–Longmaxi Formation and a much drier climate in the formation enriched with carbonate minerals.
The profiles of Rb/Sr ratios and CIAcorr values are nearly consistent, which shows that from the bottom to the top, the climate was moderately warm and humid in the LX and the lower WF. Then, there was slight warmth and humidity in the upper WF. Further upwards, cold and arid conditions occurred in the GYQ due to Gondwanan continental glaciation at the end of the late Ordovician [16,56]. Subsequently, with the melting of Gondwanan continental glaciers in the early Silurian [16,18], the climate gradually changed to slight warmth and humidity in the lower LLM. Then, the Kwangsian Orogeny intensified in the Yangtze Platform with strong tectonic uplift, leading to the sea level dropping rapidly [20,21] and the palaeoenvironment changing significantly. Remarkably, there is a significant decrease in TOC content from 6.18% in sample Y13 below the red dotted line to 3.05% in sample Y14 above the red dotted line, a significant increase in Al content from 8.9% to 13.83%, and a significant increase in Rb/Sr ratios and CIAcorr value, indicating that the climate rapidly changed from slightly warm and humid in the lower LLM to moderately warm and humid in the upper LLM. Accordingly, the significant variation in the palaeoclimate during the LLM stage was one of the key factors that led to the turnover of graptolite biozones from LM5 to LM6. After this, the climate was much hotter and wetter in the ULM with high Rb/Sr ratios, leading to a high degree of chemical weathering [13,16].
The variation of the palaeoclimate in well YD1 is consistent with that of well YY2 in the Yiling block [2] and well JY8 in the Jiaoshiba block [16], indicating that the palaeoclimate of the middle Yangtze Platform is similar to that of the upper Yangtze Platform. Additionally, we found that the climate of organic-rich shales in the WF and LLM is neither cold and arid like that of the GYQ nor hot and wet like that of organic-lean shales in the LX and ULM. The climate during the WF and LLM stages can be described as moderately warm and humid.

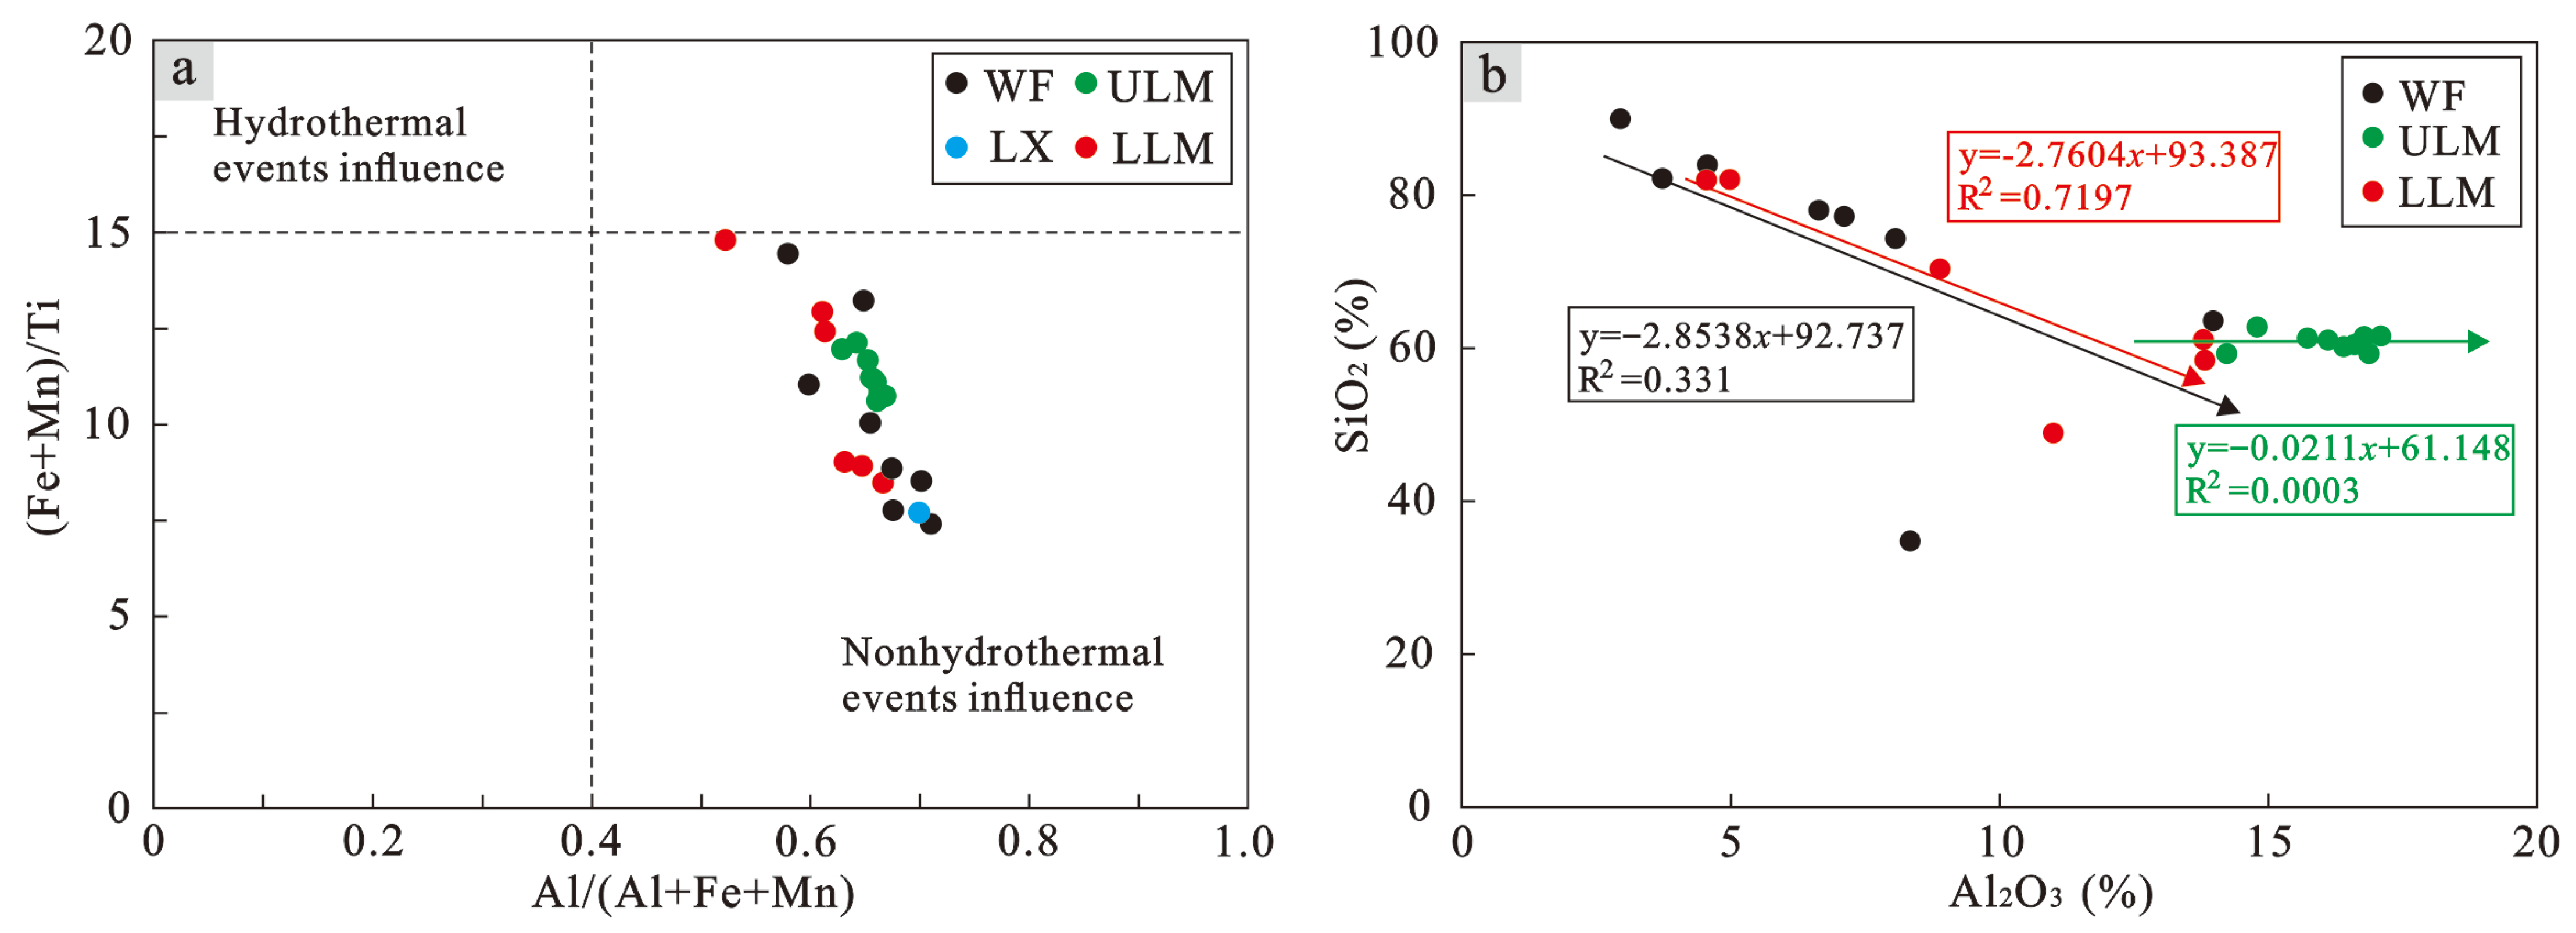
5.2.2. Origin of Silica and Terrigenous Influx

Previous studies have identified three primary sources of siliceous sediments in marine environments: hydrothermal fluids, siliceous organisms, and silica-rich terrigenous clastics [57]. In sedimentary rocks, Fe and Mn are generally enriched with hydrothermal deposits, and in typical sediments influenced by hydrothermal events, the (Fe + Mn)/Ti and Al/(Al + Fe + Mn) ratios are generally valued at >15 and < 0.4, respectively [41]. The analysis shows that all of the samples plot in the nonhydrothermal field, implying that silica mainly had a nonhydrothermal origin (Figure 8a).
Al is generally considered an indicator element for terrigenous clastic material [5,15]; therefore, the crossplots of SiO2 vs. Al2O3 are usually used to distinguish terrestrial and biogenic silica with a positive correlation, no apparent correlation, and a negative correlation reflecting mainly terrestrial silica, mixed origin of terrestrial and biogenic silica, and biogenic silica, respectively [35]. The results show that silica mainly had a biogenic origin in the WF and LLM, and a mixed terrestrial and biogenic origin in the ULM (Figure 8b). The results show that graptolites are the main sources of biogenic silica in the Wufeng–Longmaxi Formation [13,48] (Figure 2), and there is also a small amount of sponge spicules and radiolarians [13,48,58].
Additionally, the Sibio/(Sibio + Febio + Al + Cabio) ratios of most samples of organic-rich shales in the WF and the lower LLM are higher than 0.8, indicating an absolute biogenic silica [17,59]. In contrast, the low Sibio/(Sibio + Febio + Al + Cabio) ratios of samples from the LX, upper LLM, and ULM suggest that silica partly originated from terrigenous clasts. Remarkably, the Sibio/(Sibio + Febio + Al + Cabio) ratios of the LM6 graptolite biozone of the Aeronian above the red dotted line are significantly lower than those of the LM5 graptolite biozone of the Rhuddanian below the red dotted line (Table 1; Figure 7). The reason is that, as a result of the Kwangsian Orogeny [60], the sea level dropped rapidly due to the large-scale uplift in the Yangtze Platform, which led to a decrease in the quantity of graptolites and contents of biogenic silica.
The influx of terrigenous clastic material is a key factor that influences black shale composition and OMA [15,35,42]. The results show that Al contents are higher in organic-lean shales in the LX (9.04%) and ULM (avg. 8.51%) and lower in organic-rich shales in the WF (avg. 3.67%) and LLM (avg. 5.04%) (Table 1; Figure 7). The variation of Al content in the Yiling block is consistent with that in the JY8 well and PG section of the southeastern Sichuan Basin (Figure 1c) [16,34]. Specifically, Al content of the LM6 graptolite biozone in the Aeronian is significantly higher than those of the LM5 graptolite biozone in the Rhuddanian (Table 1; Figure 7), which indicates that as a result of the Kwangsian Orogeny [58], the Chuangzhong and Qianzhong uplifts were significantly uplifted, coupled with a warm and wet climate (Figure 7) [16], resulting in a significant increase in terrigenous influx.
As shown in Figure 9, Al contents show a highly positive correlation with the palaeoclimate proxy Rb/Sr ratio, implying that terrigenous influx is significantly influenced by the palaeoclimate. Generally, warm and humid palaeoclimates lead to a relatively high degree of weathering [14,35,36], which facilitates the weathering and transport of terrigenous clasts from surrounding palaeohighs into the Yangtze Sea. Additionally, Xuefeng uplift was exposed to erosion and became one of the source areas during the early Silurian [16], which is a direct influencing factor leading to a much stronger terrigenous influx in the ULM (Table 1 and Figure 7).

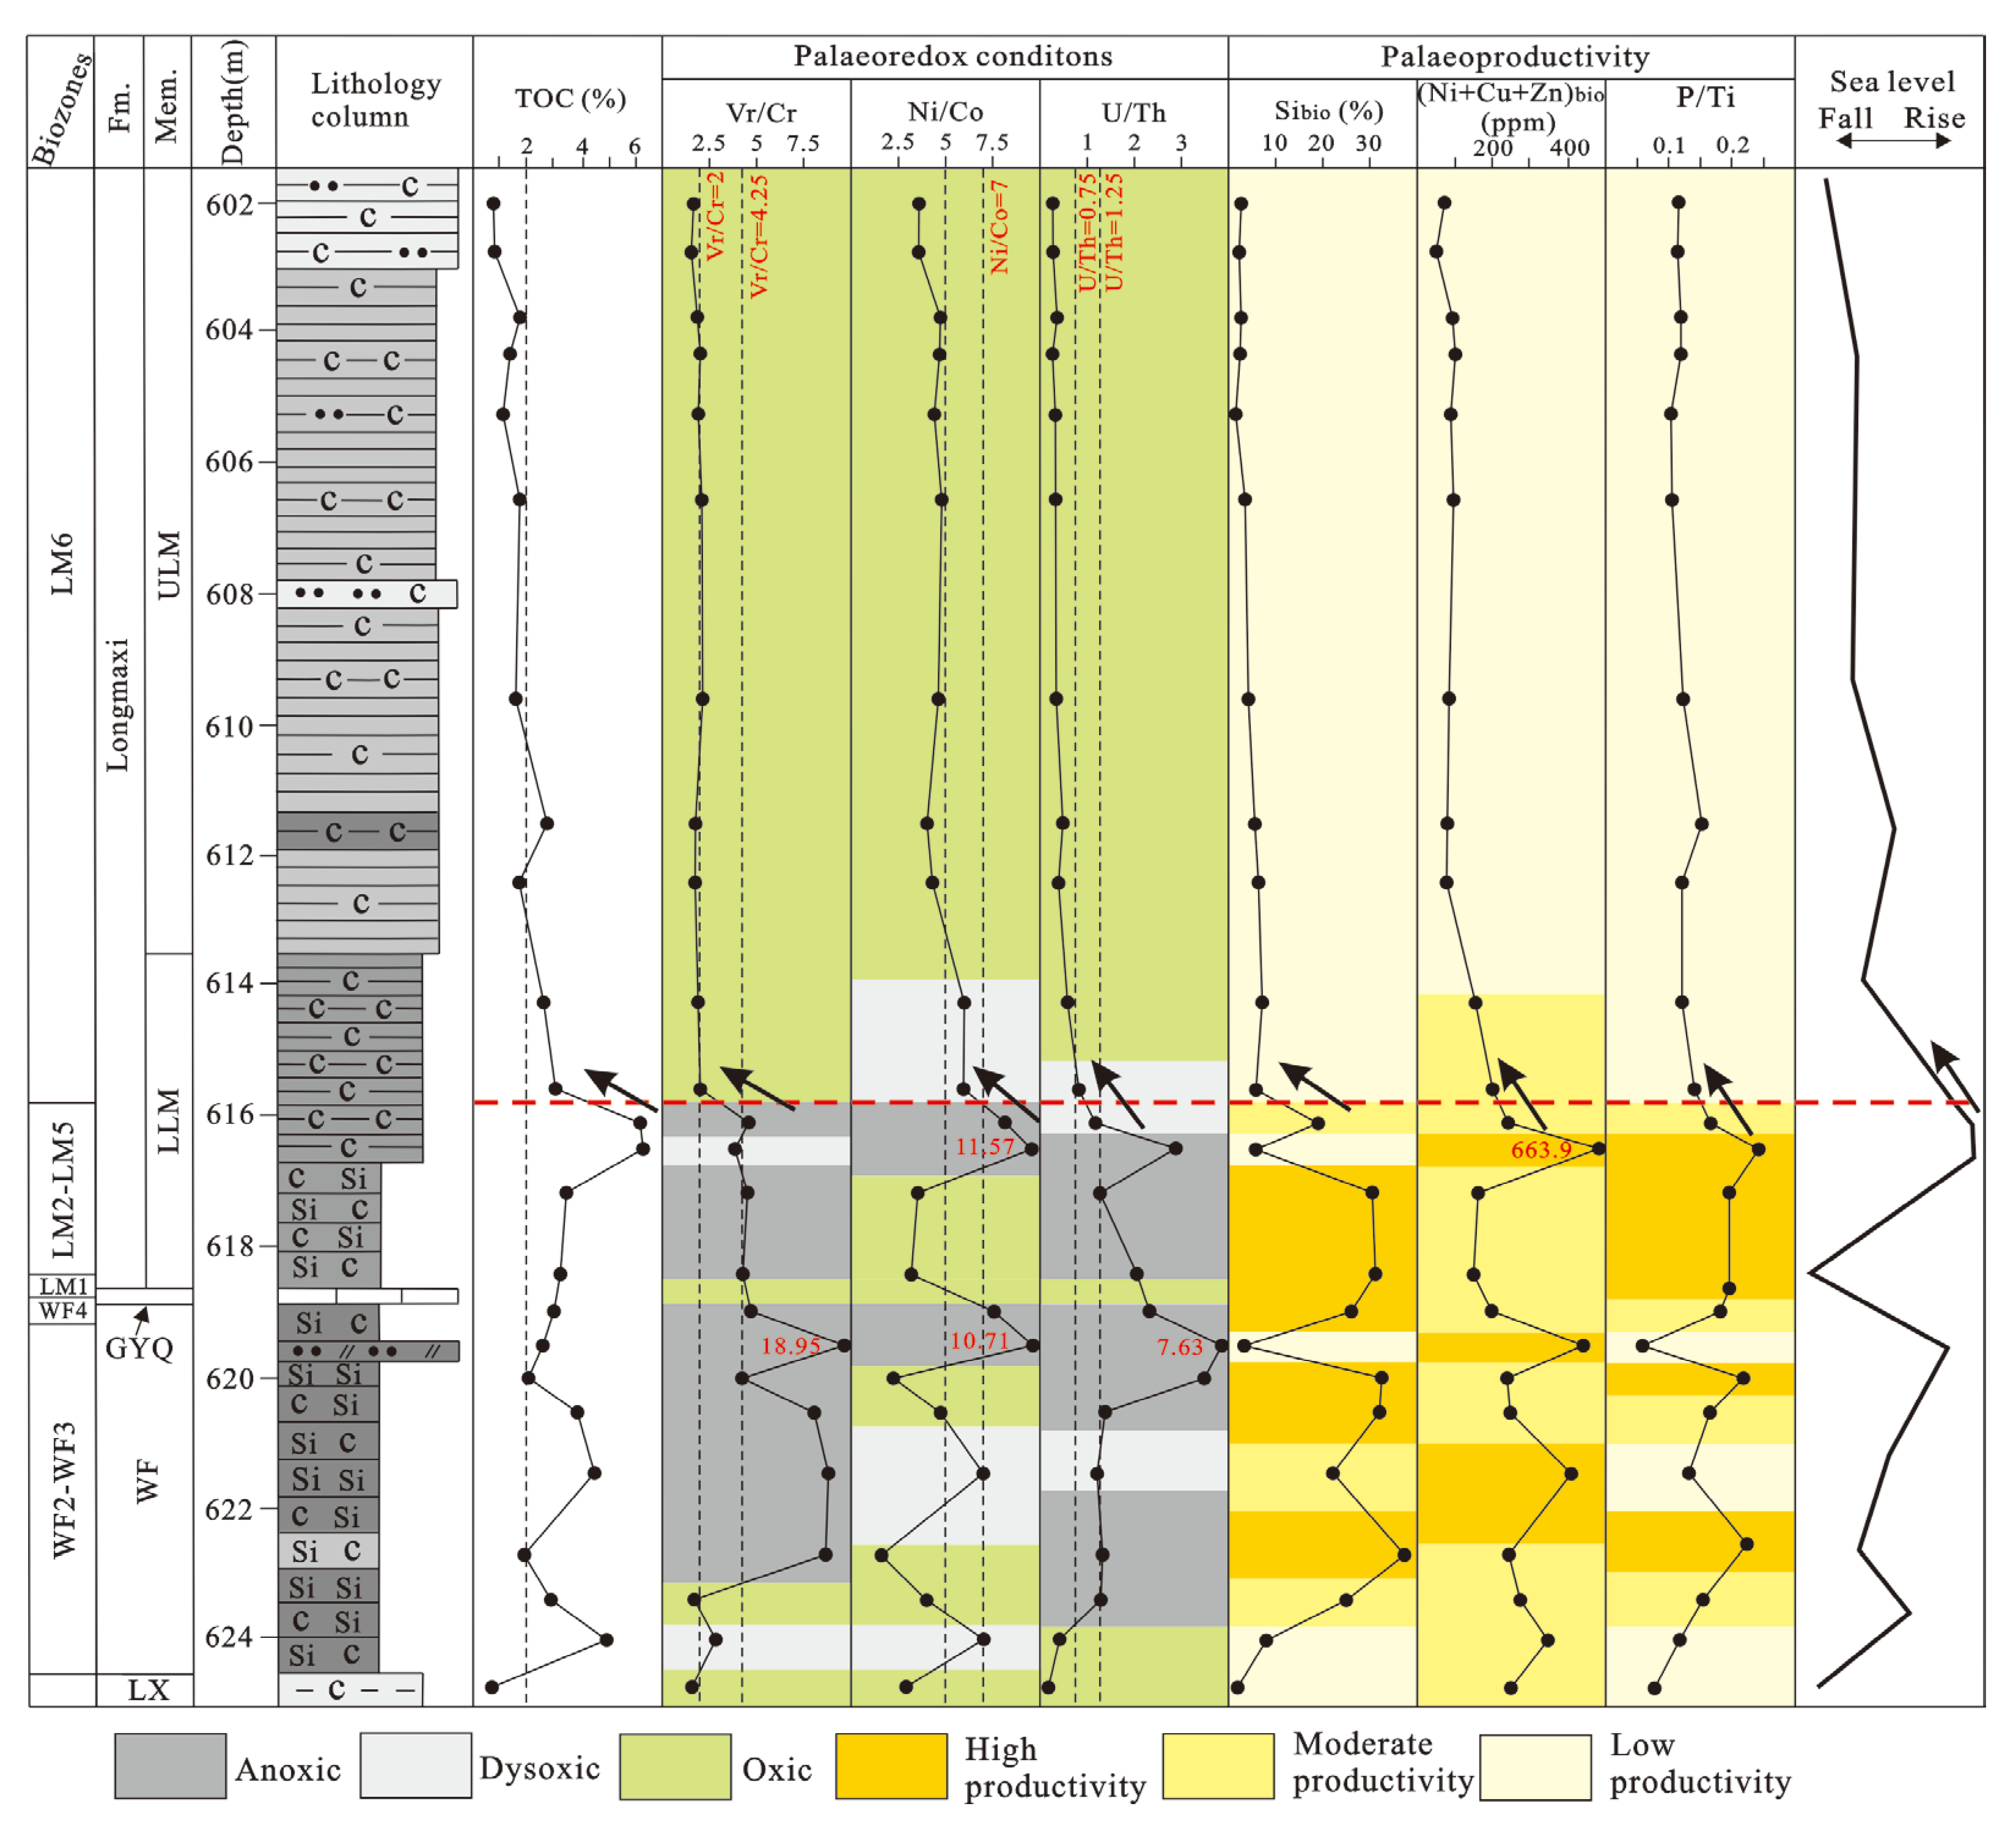
5.2.3. Palaeoredox Conditions

Some trace elements such as Ni, Co, V, Cr, Th, U, and Mo in sedimentary rocks are redox sensitive. Thus, they are usually used to reflect redox conditions due to their differentiation under different bottom water conditions [32]. The ratios of some trace elements such as V/Cr, Ni/Co, and U/Th are widely used tools in the reconstruction of benthic oceanic redox conditions since these trace metals can coprecipitate with organic matter or metal sulphides under anoxic conditions [61,62].
In general, V/Cr < 2, Ni/Co < 5, and U/Th < 0.75 indicate oxic conditions; 2 < V/Cr < 4.25, 5 < Ni/Co < 7, and 0.75 < U/Th < 1.25 indicate dysoxic conditions; and V/Cr > 4.25, Ni/Co > 7, and U/Th > 1.25 indicate anoxic conditions [14,15,44,45,61,62]. Additionally, iron speciation proxies FeHR/FeT and Fepy/FeHR are usually used to evaluate the bottom water redox conditions of ancient oceans [46,63]. In general, FeHR/FeT values < 0.38 and > 0.38 indicate oxic and anoxic conditions, respectively. For anoxic conditions, Fepy/FeHR < 0.7−0.8 and > 0.7−0.8 indicate ferruginous and euxinic conditions, respectively [47]. Furthermore, the FeT/Al ratio is an effective indicator with which to evaluate bottom water redox conditions [43]. Generally, FeT/Al ratios are valued at > 0.5 in deep-water basins under anoxic conditions. Remarkably, the FeT/Al ratios in the sediments under euxinic conditions are 2~3 times those of the sediments under oxic conditions.
The results show that the curve graphs of V/Cr and U/Th are relatively consistent, and they are apparently different from the Ni/Co curve graph (Figure 10). Therefore, the V/Cr and U/Th ratios are used to evaluate redox conditions. From the bottom to the top, the LX and the bottom of the WF are mainly deposited under oxic conditions that rapidly changed to anoxic conditions in the middle-upper WF. At the end of the late Ordicivian, the GYQ was largely deposited under oxic conditions in the middle Yangtze Platform as a result of the significant drop in global sea level [56]. Subsequently, with the melting of the Gondwanan continental glaciers and the influxing of the freshwater in the early Silurian, the sea level rose rapidly, and the seawater formed a stable stratified water body due to density differences, which resulted in clear vertical difference between the surface and bottom layers with the low content of dissolved oxygen in the bottom water [18,64,65], leading to mainly anoxic conditions of bottom water in the lower LLM. During the upper LLM and ULM stages, as the Kwangsian Orogeny with compressive stress continuously transferred from the South China Plate to the Yangtze Platform in the northwest, Xuefeng uplift was elevated rapidly and even exposed to erosion [16,60], leading to the fall of sea level in the long term. Thus, from sample Y14 in the upper LLM, the bottom water started to change from anoxic to mainly oxic, which is not beneficial to the preservation of organic matter such as the species of graptolite, radiolarian, and sponge spicule, leading to a significant drop in TOC content above the red dotted line.
As shown in Figure 11, the average Fepy/FeHR and FeT/Al ratios of the LX, WF, LLM, and ULM are 0.50 and 0.43, 0.62 and 0.52, 0.61 and 0.63, and 0.55 and 0.53, respectively. Therefore, the bottom water in the LLM shows the highest level of anoxia, especially in sample Y12, and the bottom water is in a euxinic condition with peak values of Fepy/FeHR ratios, FeT/Al ratios, and TOC content. Subsequently, the Fepy/FeHR ratios significantly decreased from graptolite biozones LM5 to LM6, which implies that bottom water conditions transformed from ferruginous conditions in the Rhuddanian to oxic conditions in the Aeronian (Figure 11a).
The Fepy/FeHR vs. FeHR/FeT discrimination diagram shows that the LX and ULM were mainly deposited under oxic conditions and that the WF and the LLM were primarily deposited under ferruginous conditions except for sample Y12 with a Fepy/FeHR ratio of 0.72, implying euxinic conditions during this period (Figure 11b). There are three main reasons for the euxinic conditions found in sample Y12 from the LLM. with the first reason regards the melting of Gondwanan continent glaciers and the influencing of the salinity stratification, which led to an anoxic reducing environment in bottom water [18,65]. In addition, in the early Silurian, tectonic compression and uplift continuously transferred from Xuefeng uplift in the southeast to the Yangtze Platform in the northwest [16], leading to strong tectonic subsidence and the formation of a deep-water basin during the Longmaxi stage. Furthermore, the seawater in the study area was confined by the Huangling basement (a submarine high), Hunan–Hubei submarine high, and Xuefeng uplift (Figure 1c), leading to a strongly restricted basin, which was beneficial for forming euxinic conditions.
The results show that the redox conditions of organic-rich shales in well YD1 of the Yiling block are similar to those in well Qianqian-1 [24] and different from those in well PY1 in the southeastern Sichuan Basin [23] and well Shenci-1 in northern Hubei [22]. The bottom water of well Qianqian-1 is mainly under oxic to dysoxic conditions because it is close to the Qianzhong uplift, and the bottom water is primarily under ferruginous to euxinic conditions in well PY1 in the southeastern Sichuan Basin and well Shenci-1 in northern Hubei close to the Qingling Ocean because of the oxygen-deficient environment in the deep shelf resulting in anoxic conditions. In contrast, the bottom water of well YD1 mainly shows oxic to dysoxic conditions except for minor formations deposited under euxinic conditions (Figure 11a,b), which infer a much shallower palaeoocean in the Yiling block relative to the regions of the southeastern Sichuan Basin and northwestern Qinling Ocean.
Overall, the redox conditions of the Wufeng–Longmaxi Formation in the Yiling block show oxic conditions mainly in the LX, lower WF, upper LLM, and ULM, and anoxic conditions in the middle-upper WF and lower LLM, which is consistent with the Jiaoshiba block [13]. Previous studies have shown that anoxic conditions are directly caused by the rapid transgressive events during the middle-upper WF and lower LLM stages [12,16]. Oxic conditions are mainly attributed to the shallow water environment present during the LX and lower WF stages [12], while oxic conditions are directly caused by the fall of sea level as a result of the continuous elevation of the Chuanzhong and Xuefeng uplifts during the upper LLM and ULM stages [16].

5.2.4. Palaeohydrography

Hydrographic conditions are essential to controlling nutrients obtained from the deep ocean to the shallow shelf, and thus can influence palaeoproductivity and OMA [35]. Usually, Mo is a common redox-sensitive element and is abundant only under sulfurated conditions [66], and the Mo−TOC discrimination diagram is usually used to determine hydrographic conditions. Basins can be classified as presenting three levels of restriction: strongly restricted (Mo/TOC < 15 × 10−4), moderately restricted (15 × 10−4 < Mo/TOC < 35 × 10−4), and weakly restricted (Mo/TOC > 35 × 10−4) [67]. The results show that the average Mo/TOC ratios in the LX, WF, LLM, and ULM are 4.06 × 10⁻⁴, 9.32 × 10⁻⁴, 6.83 × 10⁻⁴, and 5.56 × 10⁻⁴, respectively (Table 2), and the Mo/TOC ratios of most samples are lower than 15 × 10−4 except for two samples in the WF with Mo/TOC ratios of greater than 15 × 10−4, indicating mainly a strongly restricted basin in the Wufeng-Longmaxi Formation, and minor formations in the middle-upper WF were deposited under a moderately restricted basin (Figure 11c).
Given that the Co × Mn values were observed to show significant differences between sediments from the upwelling and restricted settings, Sweere et al. (2016) [49] proposed that Co × Mn values can be used to evaluate upwelling intensity, with values of <0.4 and >0.4 indicating upwelling and restricted settings, respectively. The results show that most samples plot within the restricted field except for minor samples of organic-rich shales mainly found in the WF that fall within the open and upwelling field, implying that the WF showed much stronger upwelling intensity, followed by the lower LLM, and that the LX, upper LLM and ULM showed weak upwelling intensity (Figure 12a,b), leading to the insufficient nutrients transportation from the deep ocean to the shallow shelf [2,3], which was not beneficial for the survival of graptolites at the stages of the upper LLM and ULM. Thus, the graptolite abundance and quantity rapidly decreased due to the oligotrophic seawater caused by the weak upwelling, which was probably another important factor that led to the turnover of graptolite biozones from LM5 to LM6.
Overall, both the Mo/TOC and Co × Mn proxies show that the Wufeng–Longmaxi Formation of well YD1 mainly formed in a highly restricted setting except for minor samples that formed in a moderately restricted setting in the WF. In fact, the hydrographic conditions of the Wufeng–Longmaxi Formation are closely related to the sedimentary location [12]. The sedimentary basin in the Yiling block is a highly restricted setting, as it is surrounded by the Xuefeng uplift, the Hunan–Hubei submarine high, and Huangling basement, a submarine high formed in the Sinian (Figure 1c) [68]. The southeastern Sichuan Basin, where wells PY1 and JY143 are located, is a moderately restricted setting because it is a depocentre that has a relatively good connection with the Qinling Ocean [12,68]. The sedimentary basin, where well EHD1 is located, is weakly restricted because it is much closer to the Qinling Ocean, showing the highest level of upwelling intensity [12].

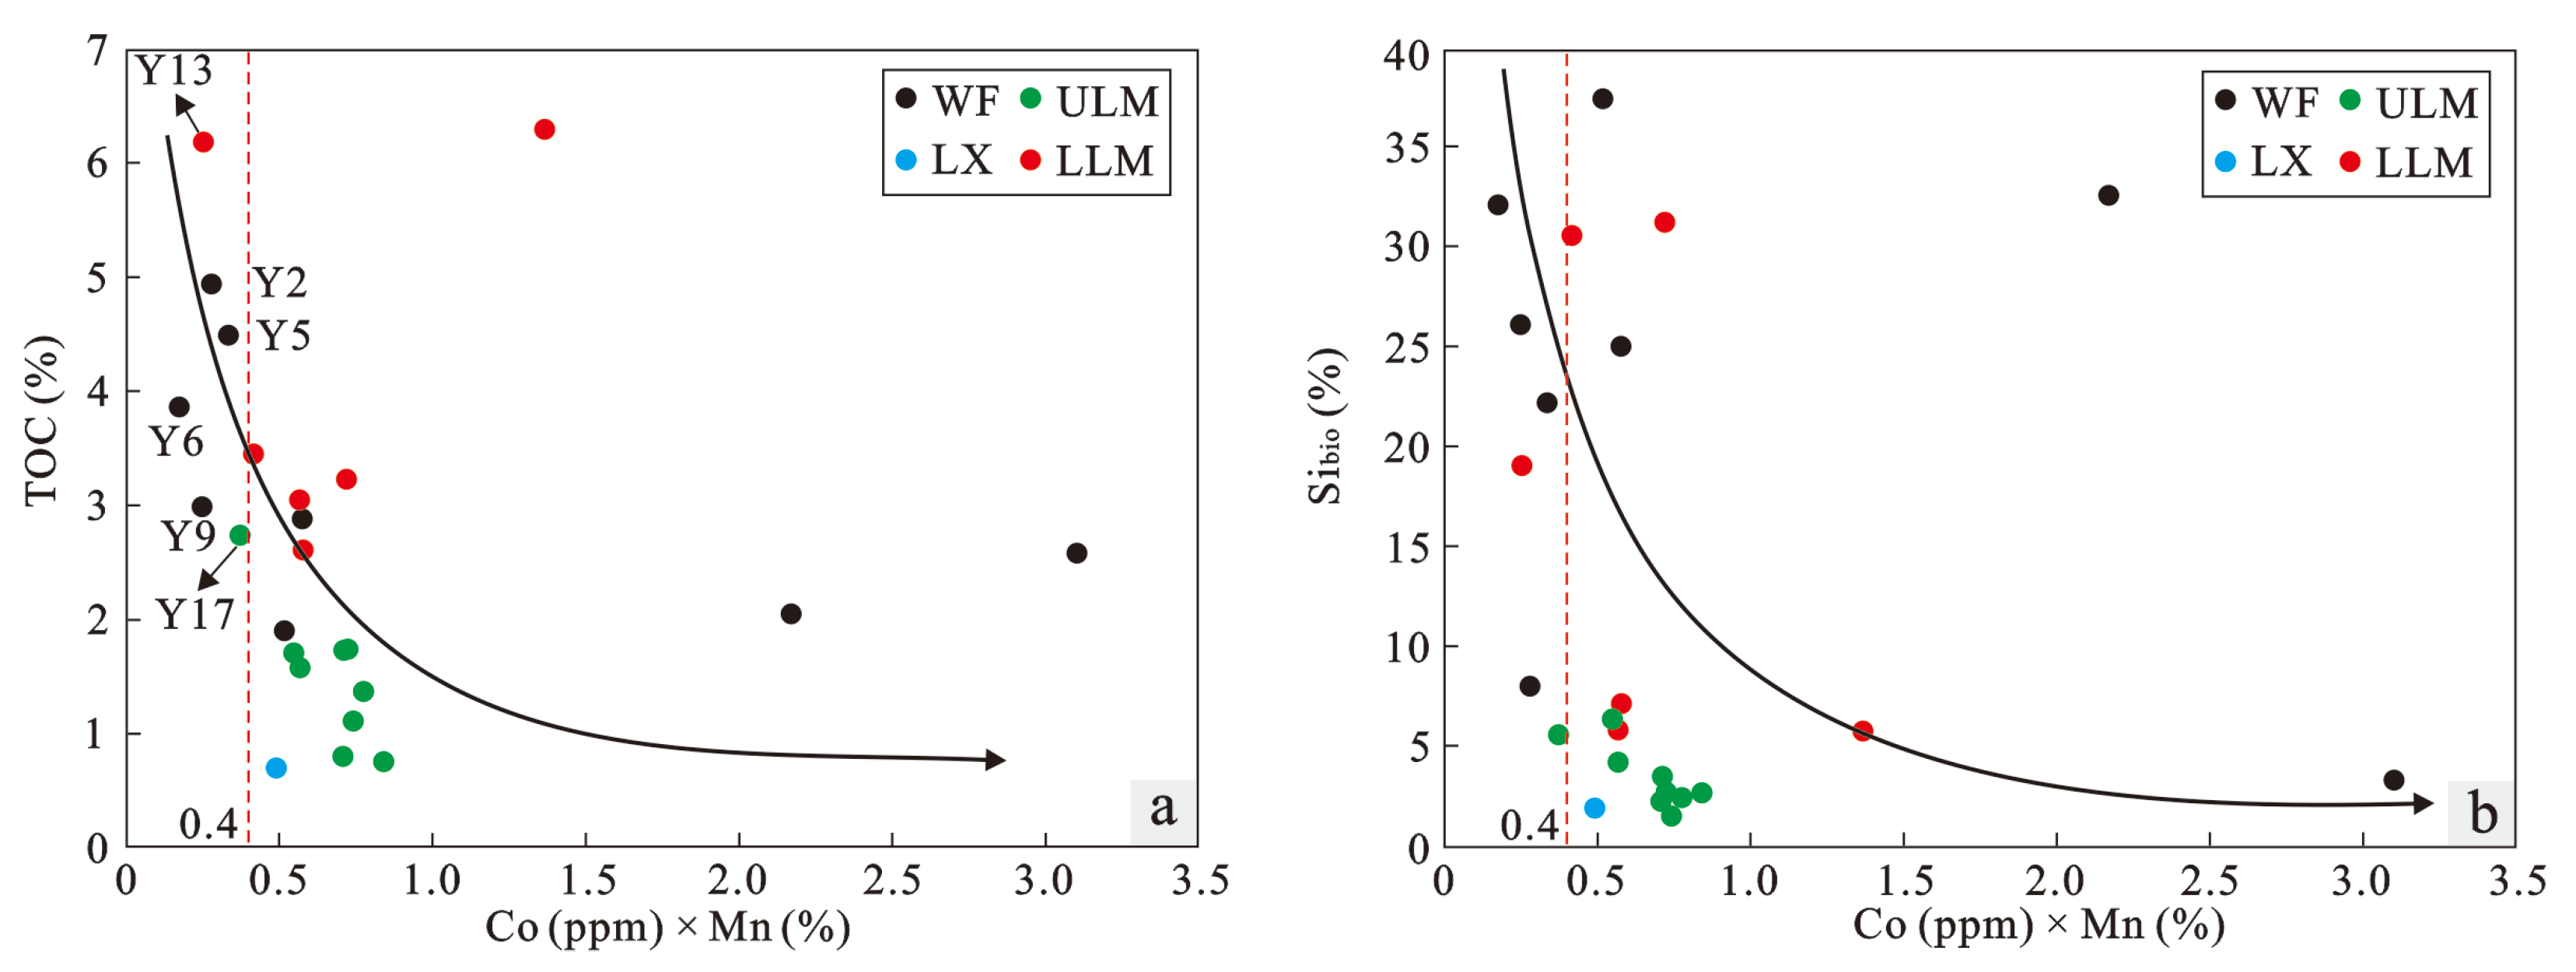
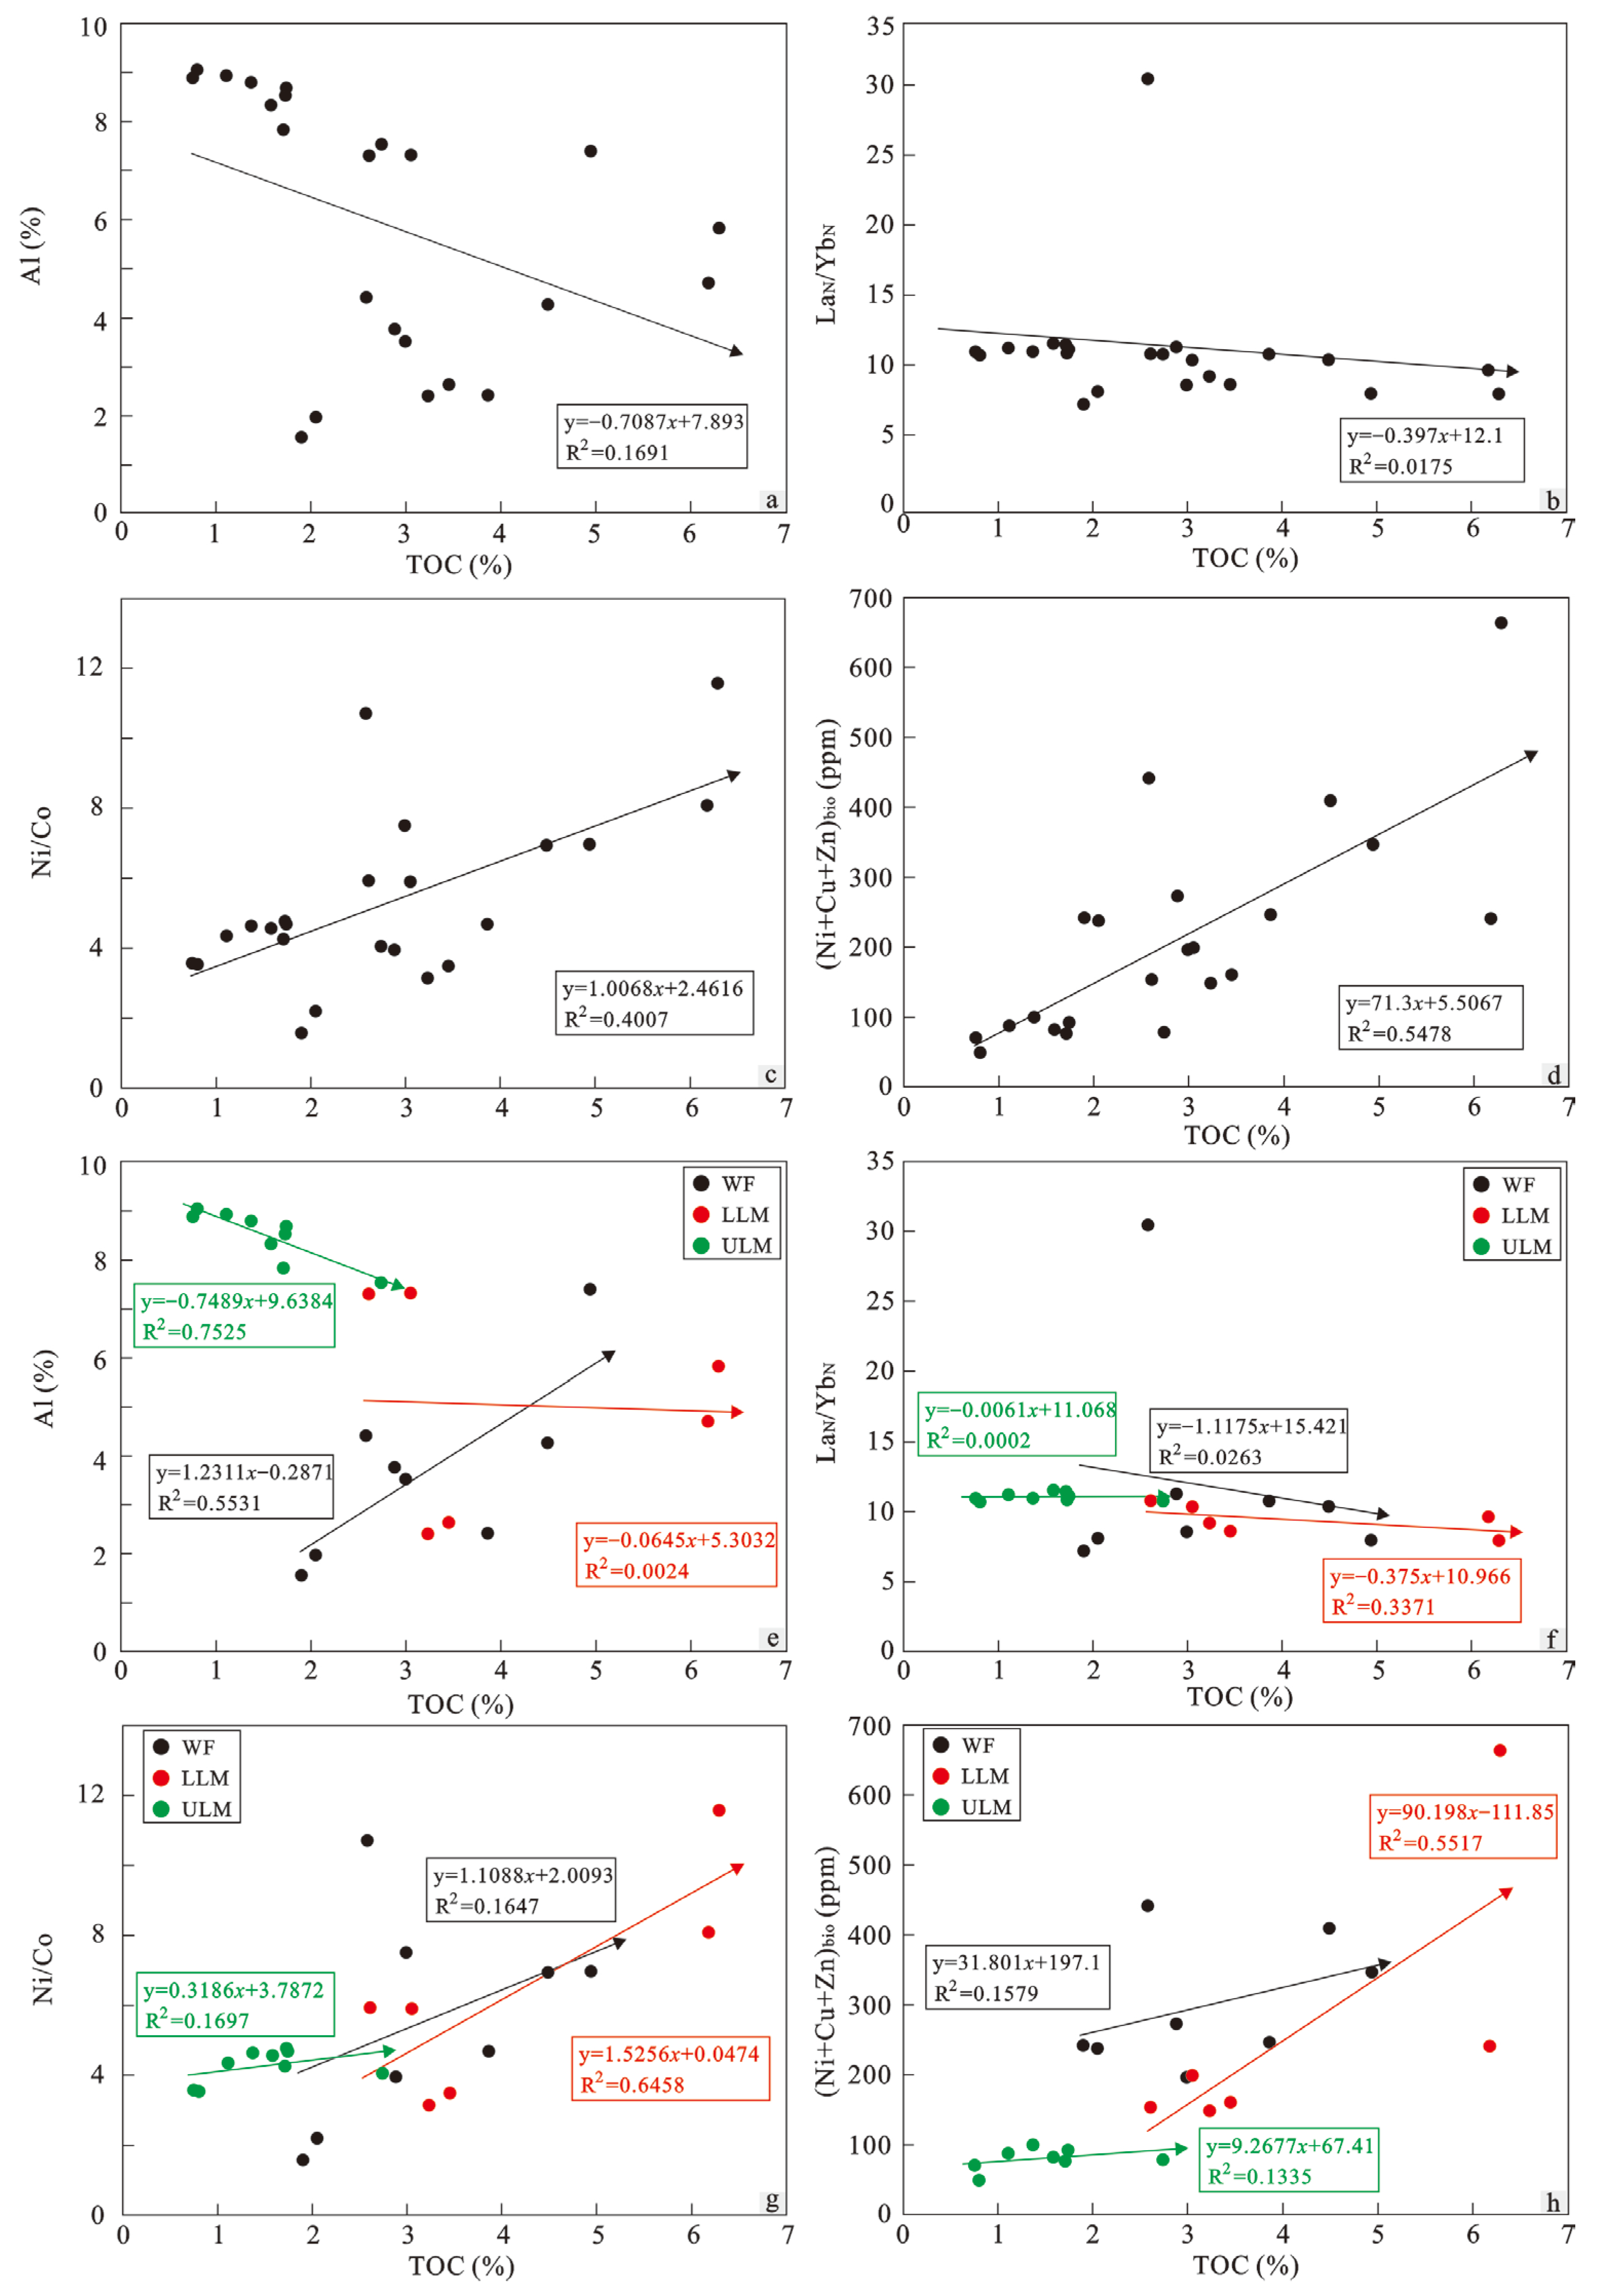
5.2.5. Palaeoproductivity

TOC is the surface productivity of the ocean reflected in sediments, and thus, it is regarded as a most direct primary productivity indicator [69]. Cu, Ni, and Zn are micronutrients for marine microbes that are complex with organic matter under reducing conditions [15,32]. Thus, these elements are typical indicators of marine primary productivity. A large number of radiolarians and graptolites in the shale confirmed the biological contribution of silica in the Wufeng–Longmaxi Formation. Thus, Sibio can be used as a productivity indicator [16,70]. P is involved in most of the metabolic activities of organisms and is usually regarded as one of the most extensively applicable and reliable productivity indicators [71]. To eliminate the terrestrial part of P content, proxy P/Ti is used to estimate primary productivity [72].
The results show that the profiles of TOC, Sibio, (Ni + Cu + Zn)bio and P/Ti generally have similar variation trends with only a small difference in local formation (Figure 10). In the LX and lower WF, palaeoproductivity was low to moderate, apparently increased to high palaeoproductivity in the middle-upper WF, and suddenly decreased in the upper WF. Palaeoproductivity was generally low in the GYQ, which was caused by mass extinction as a result of Hirnantian glaciation at the end of the late Ordovician [14,16]. In the lower LLM in the early Silurian, palaeoproductivity was high and peaked in sample Y12 of graptolite biozone LM5, and then gradually decreased in graptolite biozone LM6 in the upper LLM shown above the red dotted line, maintaining a low level of palaeoproductivity throughout the ULM stage. The decline in palaeoproductivity in the upper LLM and ULM is closely related to the Kwangsian Orogeny, which resulted in the uplift of the Longmaxi Formation and the fall of sea level [20,21,61], and the sedimentary facies gradually changed from deep shelf to shallow shelf, which resulted in a large number of graptolites that cannot be deposited and preserved due to the influence of tides and waves in the shallower water, leading to a decrease in graptolite abundance and quantity [21,73,74,75], as well as a low palaeoproductivity level with low TOC and Sibio content and Sibio/(Sibio + Febio + Al + Cabio) ratios (Figure 7 and Figure 10). Overall, theses analyses show that palaeoproductivity was high in organic-rich shales with peak values occurring in the lower LLM and significantly low values occurring in organic-lean shales in the Yiling block, and the trend of palaeoproductivity variation is consistent with that found in other regions of the middle-upper Yangtze Platform [12,13,15].
Previous studies have shown that palaeoproductivity is strongly related to the upwelling of nutrients [3] because upwelling can usually bring nutrients from the deep ocean to the shallow shelf, which results in plankton flourishing in surface seawater. The scatter plots show that the Co × Mn values have a perceptible negative correlation with palaeoproductivity proxies TOC and Sibio in well YD1 (Figure 12a,b), which indicates that palaeoproductivity is apparently influenced by upwelling. Remarkably, palaeoproductivity is primarily controlled by upwelling in the WF and the high TOC and Sibio contents of the four samples with Co× Mn values of less than 0.4. Additionally, in the region close to the Qinling Ocean (well EHD1) with strong upwelling, palaeoproductivity is higher than that far from the Qinling Ocean (well JY143) (Figure 1c) [12].

5.3. OMA Mechanism

5.3.1. Lithofacies Types Influencing OMA

The sedimentary environment controlled the lithofacies types of shale. Previous studies have suggested that siliceous shale in the Wufeng–Longmaxi Formation has relatively high TOC content, which is beneficial for preserving organic matter [51,53]. The results show that siliceous shale has the highest TOC content (Figure 3d), which is consistent with previous research results [52]. TOC levels are higher in subclass lithofacies S and S-2, and relatively lower in subclass lithofacies M-1 and S-3. Lithofacies S and S-2 are mainly distributed in the WF and LLM with anoxic conditions, high palaeoproductivity, and low terrigenous influx, which are conducive to OMA (Figure 3 and Figure 10). In contrast, lithofacies M-1 is distributed in the WF with low palaeoproductivity and moderate terrigenous influx, and the lithofacies S-3 is mainly distributed in the ULM with oxic conditions, low palaeoproductivity, and high terrigenous influx (Figure 3 and Figure 10). Thus, they are generally not beneficial to OMA.

5.3.2. Main Controlling Factor of OMA

In general, OMA occurred for three reasons: organic matter input (palaeoproductivity), organic matter preservation (palaeoredox conditions and deposition rates), and organic matter dilution (terrigenous detrital influx) [35,76], and the correlations between TOC content and the terrigenous influx proxy Al, deposition rate proxy LaN/YbN, palaeoredox proxy Ni/Co, and palaeoproductivity proxy (Ni + Cu + Zn)bio are used to study the main controlling factors of OMA in well YD1. The results show that TOC contents have a weak positive correlation with Al content (Figure 13a), have no obvious correlation with the LaN/YbN ratio (Figure 13b), and have an apparent correlation with the Ni/Co ratios and (Ni + Cu + Zn)bio concentrations (Figure 13c,d). These analysis results are consistent with previous studies showing redox conditions and productivity to be the key factors of OMA in the Wufeng–Longmaxi Formation [3,5].
However, we further found that the factors that influence OMA changed vertically (Figure 13e–h). In the WF, TOC contents have a highly positive correlation with Al content, indicating that terrigenous influx is the main controlling factor of OMA, which is significantly different from other regions, inferring that the sedimentation rate of organic matter is higher than the terrigenous dilution rate in well YD1. In the LLM, TOC contents have no correlation with Al content, a weak negative correlation with the LaN/YbN ratios, and positive correlations with the Ni/Co ratios and (Ni + Cu + Zn)bio concentrations, indicating that combined redox conditions and productivity influence OMA. In the ULM, TOC contents have strongly negative correlations with Al content and no significant correlations with the LaN/YbN and the Ni/Co ratios, as well as the (Ni + Cu + Zn)bio concentrations, indicating that terrigenous influx is the main controlling factor of OMA and implying that terrigenous influx led to the dilution of organic matter, which was not conducive to OMA.

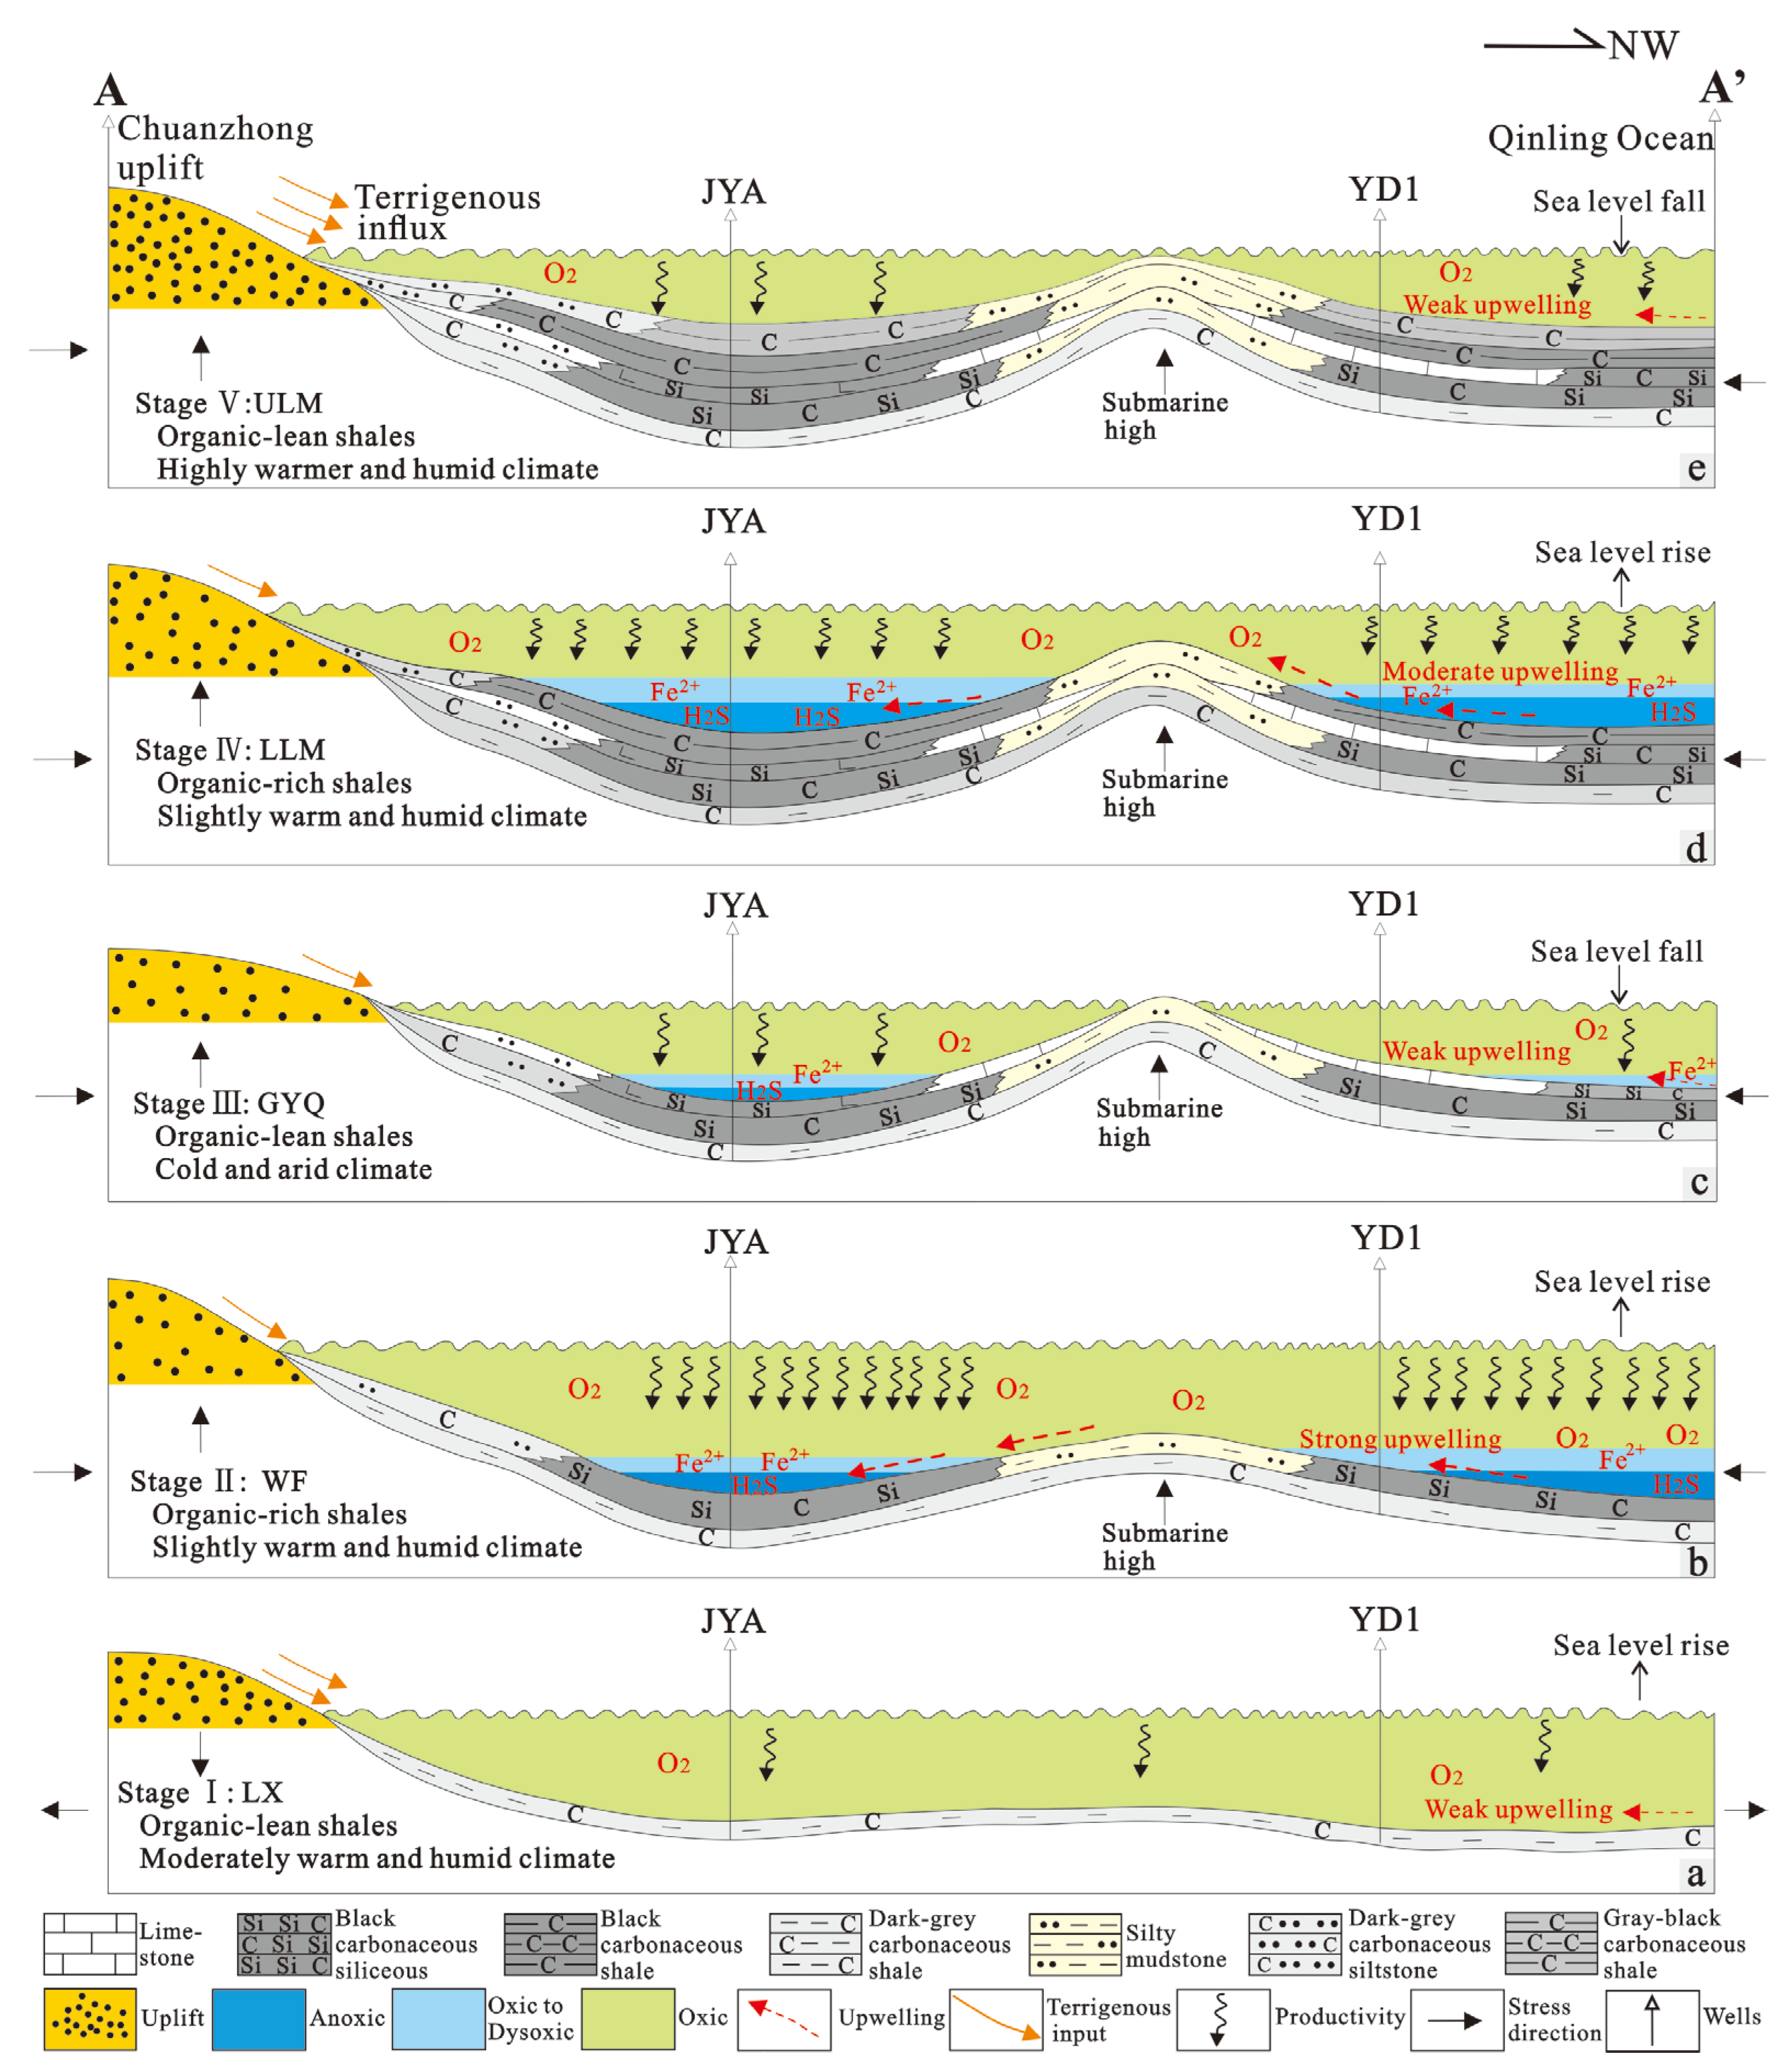
5.4. Evolution Model

A palaeoenvironmental evolutionary model of the Wufeng–Longmaxi Formation is established for the study area, including the LX, WF, GYQ, LLM, and ULM stages (Figure 14). The routing of the model starts from the Chuanzhong uplift (point A), passes through the Jiaoshiba block, the Hunan–Hubei submarine high, the Yiling block, and ends in the Qinling Ocean (point A’) (Figure 1c).
During the LX stage, the middle-upper Yangtze Platform was deposited under a tension setting [16] with a broad, flat, and shallow sea environment [30]. The palaeoenvironment was characterized by a moderately warm and humid climate, moderate terrigenous influx, low productivity, and oxic bottom water conditions, which were not beneficial to OMA (Figure 7, Figure 10 and Figure 14a).
During the WF stage, the sea level started to rise, and the middle-upper Yangtze platform was deposited under a compressive tectonic setting caused by the subduction of the Cathaysia Block towards the Yangtze Platform [16], which led to the formation of the Hunan-Hubei submarine high and sedimentary depressions. The palaeoenvironment was characterized by a slightly warm and humid climate, low terrigenous influx, anoxic bottom water conditions, and high productivity with strong upwelling, which was conducive to OMA and the formation of black siliceous rock (Figure 7, Figure 10 and Figure 14b).
During the GYQ stage, the Hirnantian glaciation caused a significant drop in global sea levels [16,56], and the Hunan–Hubei submarine high was gradually exposed at Earth’s surface [30]. At this time, the climate was cold and arid [14,77], and weak upwelling led to low productivity in both the middle and upper Yangtze Platforms. The depositional basins were mainly deposited under oxic conditions, except for minor formations in the depocentre of the Sichuan Basin that were still deposited under anoxic conditions [14,78]. The cold glacial climate and poor nutrition in the water body are the important reasons for the global biological extinction event in late Ordovician, with a large number of graptolites disappearing [79]. However, Hirnantia Fauna (Brachiopoda), which benefited from a cold climate and oxygen-rich bottom water, survived (Figure 7, Figure 10 and Figure 14c) [80].
During the LLM, the sea level rose rapidly and seawater formed a stable stratified water body due to the melting of the Gondwanan Glacier [16,64,65]. The palaeoenvironment was characterized by a slightly warm and humid climate, low terrigenous influx, anoxic bottom water and even euxinic conditions (Figure 11), and high palaeoproductivity (Figure 7, Figure 10 and Figure 14d). In addition, the accommodating space of the deep basin significantly increased as a result of continuous tectonic compression [16], leading to the deposition of the thickest organic-rich siliceous and argillaceous shales in the Wufeng–Longmaxi Formation. Remarkably, during the upper LLM stage, the climate became much warmer and wetter, and the sea level gradually dropped due to the strong tectonic uplift as a result of the Kwangsian Orogeny [21,81], which led to dysoxic to oxic bottom water conditions. Meanwhile, the graptolite biozones changed significantly from LM5 in the Rhuddanianto LM6 in the Aeronian (Figure 7 and Figure 10).
During the ULM stage, the palaeoenvironment was characterized by a highly warm and humid climate, similar to that of the upper LLM stage, as well as oxic and low productivity conditions. Remarkably, the Xuefeng uplift continued to rise and was gradually exposed at Earth’s surface, finally forming an uplift due to continuous orogenic movement [16], which became a provenance and supplied terrigenous clasts to the middle-upper Yangtze Platform, leading to the highest terrigenous influx in the Wufeng–Longmaxi Formation, which diluted organic matter and was not conductive to OMA (Figure 7, Figure 10 and Figure 14e).
Overall, organic-rich shales in the WF and LLM of the Yiling block are the high-quality shale gas reservoirs, which are characterized by shale thicknesses of 10–20 m, TOC contents of 3%–4%, and total gas contents of 1–3 m3/t [11]. Although gas contents in the Yiling block are slightly lower than those in the Jiaoshiba block [6,13], prospects for shale gas exploration are still excellent due to high TOC contents, anoxic conditions, and high productivity [2,11]. Remarkably, regions in the eastern Yiling block close to the Qinling Ocean show better prospects for shale gas exploration because of the thicker organic-rich shales caused by deeper water, euxinic bottom water conditions, and higher productivity as a result of the strong upwelling.

6. Conclusions

The Wufeng–Longmaxi shales were primarily deposited in a highly restricted basin, except for the relatively open and upwelling setting of the upper WF. These organic-rich shales were formed in a warm and humid climate with low terrigenous influx, anoxic conditions, and high productivity. The silica in the shales had a primarily nonhydrothermal origin, with an entirely biogenic source only in the upper WF.
In the southeastern Sichuan Basin, the bottom water of organic-rich shales is mainly characterized by anoxic–euxinic conditions, while in the study area, it is primarily dominated by anoxic–ferruginous conditions, suggesting a shallower water depth.
Compared to previous studies, our research provides further evidence that the Kwangsian Orogeny had a rapid and significant impact on the palaeoenvironment of the Wufeng–Longmaxi Formation in western Hubei. This environmental shift is observed in the black shale of the LLM stage, resulting in a warmer and wetter climate, a notable decrease in productivity due to inadequate nutrients caused by weak upwelling, an evident increase in terrigenous input, and a shift in bottom water from anoxic to oxic conditions. These changes led to a decrease in graptolite abundance and the transition of graptolite biozones from LM5 to LM6.
Previous studies have established that redox conditions and productivity were the primary controlling factors for OMA, while our research indicates that the factors influencing OMA change vertically, with terrigenous influx mainly influencing OMA in the WF and ULM, and both redox conditions and productivity affecting OMA in the LLM. Notably, the WF stands out from other regions in that TOC contents have a highly positive correlation with Al content, which indicate that the terrigenous influx is the primary factor influencing OMA, suggesting a higher sedimentation rate of organic matter during this stage.
Despite having slightly lower gas contents than the Jiaoshiba block, the organic-rich shales in the WF and LLM of the Yiling block are still considered high-quality shale gas reservoirs with the organic-rich shale thicknesses exceeding 10 meters. Notably, the eastern regions of the Yiling block that are closer to the Qinling Ocean exhibit even better prospects for shale gas exploration.

Author Contributions

Conceptualization, L.X. and Y.W.; methodology, S.H. and M.S.; software, L.X.; validation, L.X., S.H. and Y.W.; formal analysis, L.X.; investigation, L.X.; resources, L.X.; data curation, W.C.; writing—original draft preparation, L.X.; writing—review and editing, S.H. and M.S.; visualization, F.L. and H.Z.; supervision, L.X. and Y.Z.; project administration, Y.Z.; funding acquisition, L.X. All authors have read and agreed to the published version of the manuscript.

Funding

The authors disclosed receipt of the following financial support for the research, authorship, and/or publication of this article: this work is supported by the scientific research project of Department of Natural Resources of Hubei Province (Grant No. ZRZY2021KJ22). The authors also acknowledge fundings by National Natural Science Foundation of China (Nos. 42202155 and 42272159), China Postdoctoral Science Foundation (No. 2021MD703807), Heilongjiang Provincial Postdoctoral Science Foundation (No. LBH-Z20121), China Scholarship Council (No. 202008230018), and Youth Foundation of the Northeast Petroleum University (No. 2019QNL-21).

Institutional Review Board Statement

Not applicable.

Informed Consent Statement

Not applicable.

Data Availability Statement

Data is unavailable due to privacy restrictions.

Acknowledgments

We would like to thank laboratory staff who helped with the experiments. Careful reviews and constructive suggestions of the manuscript by anonymous reviewers are also greatly appreciated.

Conflicts of Interest

The authors declared no potential conflict of interest with respect to the research, authorship, and/or publication of this article.

References

  1. Zhang, L.C.; Xiao, D.S.; Lu, S.F.; Jiang, S.; Chen, L.; Guo, T.L.; Wu, L.Y. Pore development of the Lower Longmaxi shale in the southeastern Sichuan Basin and its adjacent areas: Insights from lithofacies identification and organic matter. Mar. Pet. Geol. 2020, 122, 104662. [Google Scholar] [CrossRef]
  2. Chen, L.; Jiang, S.; Chen, P.; Chen, X.H.; Zhang, B.M.; Zhang, G.T.; Lin, W.B.; Lu, Y.C. Relative sea-level changes and organic matter enrichment in the Upper Ordovician-Lower Silurian Wufeng-Longmaxi Formations in the Central Yangtze area, China. Mar. Pet. Geol. 2021, 124, 104809. [Google Scholar] [CrossRef]
  3. Dong, T.; Wang, C.; Liang, X.; Wang, G.C.; Jiang, S. Paleodepositional conditions and organic matter accumulation mechanisms in the Upper Ordovician-lower Silurian Wufeng-Longmaxi shales, Middle Yangtze region, South China. Mar. Pet. Geol. 2022, 143, 105823. [Google Scholar] [CrossRef]
  4. Huang, H.Y.; He, D.F.; Li, Y.Q.; Li, J.; Zhang, L. Silurian tectonic-sedimentary setting and basin evolution in the Sichuan area, southwest China: Implications for palaeogeographic reconstructions. Mar. Pet. Geol. 2018, 92, 403–423. [Google Scholar] [CrossRef]
  5. Chen, C.; Mu, C.L.; Zhou, K.K.; Liang, W.; Ge, X.Y.; Wang, X.P.; Wang, Q.Y.; Zheng, B.S. The geochemical characteristics and factors controlling the organic matter accumulation of the Late Ordovician-Early Silurian black shale in the Upper Yangtze Basin, South China. Mar. Pet. Geol. 2016, 76, 159–175. [Google Scholar] [CrossRef]
  6. Guo, X.S.; Hu, D.F.; Li, Y.P.; Wei, Z.H.; Wei, X.F.; Liu, Z.J. Geological factors controlling shale gas enrichment and high production in Fuling shale gas field. Petrol. Explor. Dev. 2017, 44, 513–523. [Google Scholar] [CrossRef]
  7. Guo, T.L. Key geological issues and main controls on accumulation and enrichment of Chinese shale gas. Petrol. Explor. Dev. 2016, 43, 349–359. [Google Scholar] [CrossRef]
  8. Jin, Z.J.; Nie, H.K.; Liu, Q.Y.; Zhao, J.H.; Jiang, T. Source and seal coupling mechanism for shale gas enrichment in upper Ordovician Wufeng Formation—Lower Silurian Longmaxi Formation in Sichuan Basin and its periphery. Mar. Pet. Geol. 2018, 97, 78–93. [Google Scholar] [CrossRef]
  9. Tang, X.L.; Jiang, S.; Jiang, Z.X.; Li, Z.; He, Z.L.; Long, S.X.; Zhu, D.Y. Heterogeneity of Paleozoic Wufeng-Longmaxi formation shale and its effects on the shale gas accumulation in the Upper Yangtze Region, China. Fuel 2019, 239, 387–402. [Google Scholar] [CrossRef]
  10. Yi, J.Z.; Bao, H.Y.; Zheng, A.W.; Zhang, B.Q.; Shu, Z.G.; Li, J.Q.; Wang, C. Main factors controlling marine shale gas enrichment and high-yield wells in South China: A case study of the Fuling shale gas field. Mar. Pet. Geol. 2019, 103, 114–125. [Google Scholar] [CrossRef]
  11. Cai, Q.S.; Chen, X.H.; Zhang, B.M.; Liu, A.; Han, J.; Zhang, G.T.; Li, Y.G. Origin of siliceous minerals in the black shale of the Wufeng and Longmaxi Formations in the Yichang area, western Hubei Province: Geological significance for shale gas. Acta Geol. Sin. 2020, 94, 931–946. [Google Scholar]
  12. Lu, Y.B.; Jiang, S.; Lu, Y.C.; Xu, S.; Shu, Y.; Wang, Y.X. Productivity or preservation? The factors controlling the organic matter accumulation in the late Katian through Hirnantian Wufeng organic-rich shale, South China. Mar. Pet. Geol. 2019, 109, 22–35. [Google Scholar] [CrossRef]
  13. Wang, Y.X.; Xu, S.; Hao, F.; Lu, Y.B.; Shu, Z.G.; Yan, D.T.; Lu, Y.C. Geochemical and petrographic characteristics of Wufeng-Longmaxi shales, Jiaoshiba area, southwest China: Implications for organic matter differential accumulation. Mar. Pet. Geol. 2019, 102, 138–154. [Google Scholar] [CrossRef]
  14. Yan, D.T.; Chen, D.Z.; Wang, Z.Z.; Li, J.; Yang, X.R.; Zhang, B. Climatic and oceanic controlled deposition of Late Ordovician-Early Silurian black shales on the North Yangtze platform, South China. Mar. Pet. Geol. 2019, 110, 112–121. [Google Scholar]
  15. Zhang, L.C.; Xiao, D.S.; Lu, S.; Jiang, S.; Lu, S.F.; Jiang, S.; Lu, S.D. Effect of sedimentary environment on the formation of organic-rich marine shale: Insights from major/trace elements and shale composition. Int. J. Coal Geol. 2019, 204, 34–50. [Google Scholar] [CrossRef]
  16. Huang, H.Y.; He, D.F.; Li, D.; Li, Y.Q.; Zhang, W.K.; Chen, J.J. Geochemical characteristics of organic-rich shale, Upper Yangtze Basin: Implications for the Late Ordovician–Early Silurian orogeny in South China. Paleogeogr. Paleoclimatol. Paleoecol. 2020, 554, 109822. [Google Scholar] [CrossRef]
  17. Lei, Z.H.; Dashtgard, S.E.; Wang, J.; Li, M.; Feng, Q.L.; Yu, Q.; Zhao, A.K.; Du, L.T. Origin of chert in Lower Silurian Longmaxi Formation: Implications for tectonic evolution of Yangtze Block, South China. Paleogeogr. Paleoclimatol. Paleoecol. 2019, 529, 53–66. [Google Scholar] [CrossRef]
  18. Brenchley, P.J.; Marshall, J.D.; Carden, G.A.F.; Robertson, D.B.R.; Long, D.G.F.; Meidla, T.; Anderson, T.F. Bathymetric and isotopic evidence for a short-lived Late Ordovician glaciation in a greenhouse period. Geology 1994, 22, 295–298. [Google Scholar] [CrossRef]
  19. Yao, W.H.; Li, Z.X. Tectonostratigraphic history of the Ediacaran-Silurian Nanhua foreland basin in South China. Tectonophysics 2016, 674, 31–51. [Google Scholar] [CrossRef]
  20. Chen, X.; Zhang, Y.D.; Fan, J.X.; Tang, L.; Sun, H.Q. Onset of the Kwangsian Orogeny as evidenced by biofacies and lithofacies. Sci. China Earth Sci. 2012, 55, 1592–1600. [Google Scholar] [CrossRef]
  21. Chen, X.; Chen, Q.; Zhen, Y.Y.; Wang, H.Y.; Zhang, L.N.; Zhang, J.P.; Wang, W.H.; Xiao, Z.H. Circumjacent distribution pattern of the Lungmachian graptolitic black shale (early Silurian) on the Yichang Uplift and its peripheral region. Sci. China Earth Sci. 2018, 61, 1195–1203. [Google Scholar] [CrossRef]
  22. Li, N.; Algeo, T.J.; Cheng, M.; Jin, C.S.; Zhu, G.Y.; Fan, J.X.; Sun, Z.Y. Redox changes in the outer Yangtze Sea (South China) through the Hirnantian Glaciation and their implications for the end-Ordovician biocrisis. Earth-Sci. Rev. 2021, 212, 103443. [Google Scholar] [CrossRef]
  23. Li, N.; Li, C.; Fan, J.X.; Algeo, T.J.; Yan, D.T.; Zhu, G.Y.; Wu, S.Y.; Tang, S.D.; Cheng, M.; Jin, C.S. Sulfate-controlled marine euxinia in the semi-restricted inner Yangtze Sea (South China) during the Ordovician-Silurian transition. Paleogeogr. Paleoclimatol. Paleoecol. 2019, 534, 109–281. [Google Scholar] [CrossRef]
  24. Jin, C.S.; Liao, Z.W.; Lash, G.G. High-frequency redox variation across the Ordovician–Silurian transition, South China. Paleogeogr. Paleoclimatol. Paleoecol. 2021, 566, 110218. [Google Scholar] [CrossRef]
  25. Zhou, X.L.; Liu, Y.; Cao, H.Y.; Zhong, H.T.; Li, Y.C. Responses of oceanic chemistry to climatic perturbations during the Ordovician-Silurian transition: Implications for geochemical proxies and organic accumulations. Mar. Pet. Geol. 2021, 134, 105341. [Google Scholar] [CrossRef]
  26. Tribovillard, N.; Bialkowski, A.; Tyson, R.V.; Lallier-Verges, E.; Deconinck, J.F. Organic facies variations in the late Kimmeridgian of the Boulonnais area (northernmost France). Mar. Petrol. Geol. 2001, 18, 371–389. [Google Scholar] [CrossRef] [Green Version]
  27. Rimmer, S.M.; Thompson, J.A.; Goodnight, S.A.; Robl, T.L. Multiple controls on the preservation of organic matter in Devonian–Mississippian marine black shales: Geochemical and petrographic evidence. Paleogeogr. Paleoclimatol. Paleoecol. 2004, 215, 125–154. [Google Scholar] [CrossRef]
  28. Sageman, B.B.; Murphy, A.E.; Werne, J.P.; Straeten, C.A.V.; Hollander, D.J.; Lyons, T.W. A tale of shales: The relative roles of production, decomposition, and dilution in the accumulation of organic-rich strata, Middle-Upper Devonian, Appalachian basin. Chem. Geol. 2003, 195, 229–273. [Google Scholar] [CrossRef]
  29. Wang, X.; Tian, J.C.; Lin, X.B.; Chen, W.Z.; Yi, D.X. Sedimentary Environment and Controlling Factors of Organic Matter Accumulation in Wufeng-Longmaxi Formations: A case study of Jielong section in eastern Chongqing. Acta Sedimentol. Sin. 2022. [Google Scholar] [CrossRef]
  30. Rong, J.Y.; Chen, X. Faunal differentiation, biofacies and lithofacies pattern of late Ordovician (Ashgillian) in south China. Acta Palaeontol. Sin. 1987, 26, 507–535. [Google Scholar]
  31. Poulton, S.W.; Canfield, D.E. Development of a sequential extraction procedure for iron: Implications for iron partitioning in continentally derived particulates. Chem. Geol. 2005, 214, 209–221. [Google Scholar] [CrossRef]
  32. Tribovillard, N.; Algeo, T.J.; Lyons, T.; Riboulleau, A. Trace metals as paleoredox and paleoproductivity proxies: An update. Chem. Geol. 2006, 232, 12–32. [Google Scholar] [CrossRef]
  33. Ross, D.J.K.; Bustin, R.M. Investigating the use of sedimentary geochemical proxies for paleoenvironment interpretation of thermally mature organic-rich strata: Examples from the Devonian-Mississippian shales, Western Canadian Sedimentary Basin. Chem. Geol. 2009, 260, 1–19. [Google Scholar] [CrossRef]
  34. Wang, X.Q.; Zhu, Y.M.; Lash, G.G.; Wang, Y. Multi-proxy analysis of organic matter accumulation in the Upper Ordovician–Lower Silurian black shale in the upper Yangtze Platform, south China. Mar. Pet. Geol. 2019, 103, 473–484. [Google Scholar] [CrossRef]
  35. Wu, W.; Liu, W.Q.; Mou, C.L.; Liu, H.; Qiao, Y.; Pan, J.N.; Ning, S.Y.; Zhang, X.X.; Yao, J.X.; Liu, J.D. Organic-rich siliceous rocks in the upper Permian Dalong Formation (NW middle Yangtze): Provenance, paleoclimate and paleoenvironment. Mar. Pet. Geol. 2021, 123, 104728. [Google Scholar] [CrossRef]
  36. Nesbitt, H.W.; Young, G.M. Early proterozoic climates and plate motions inferred from major element chemistry of lutites. Nature 1982, 299, 715–717. [Google Scholar] [CrossRef]
  37. Bhatia, M.R.; Crook, K.A.W. Trace element characteristics of graywackes and tectonic setting discrimination of sedimentary basins. Contrib. Mineral. Petrol. 1986, 92, 181–193. [Google Scholar] [CrossRef]
  38. Ge, X.Y.; Mou, C.L.; Yu, Q.; Liu, W.; Men, X.; He, J.L. The geochemistry of the sedimentary rocks from the Huadi No. 1 well in the Wufeng-Longmaxi formations (Upper Ordovician-Lower Silurian), South China, with implications for paleoweathering, provenance, tectonic setting and paleoclimate. Mar. Pet. Geol. 2019, 103, 646–660. [Google Scholar] [CrossRef]
  39. Fritz, M.; Unkel, I.; Lenz, J.; Gajewski, K.; Frenzel, P.; Paquette, N.; Lantuit, H.; Körte, L.; Wetterich, S. Regional environmental change versus local signal preservation in Holocene thermokarst lake sediments: A case study from Herschel Island, Yukon (Canada). J. Paleolimnol. 2018, 60, 77–96. [Google Scholar] [CrossRef] [Green Version]
  40. Xu, C.; Shan, X.L.; He, W.T.; Zhang, K.; Rexiti, Y.L.K.; Su, S.Y.; Liang, C.; Zou, X.T. The influence of paleoclimate and a marine transgression event on organic matter accumulation in lacustrine black shales from the Late Cretaceous, southern Songliao Basin, Northeast China. Int. J. Coal Geol. 2021, 246, 103842. [Google Scholar] [CrossRef]
  41. Shi, J.; Zou, Y.R.; Cai, Y.L.; Zhan, Z.W.; Sun, J.N.; Liang, T.; Peng, P.A. Organic matter enrichment of the Chang 7 member in the Ordos Basin: Insights from chemometrics and element geochemistry. Mar. Pet. Geol. 2022, 135, 105404. [Google Scholar] [CrossRef]
  42. Rimmer, S.M. Geochemical paleoredox indicators in Devoniane Mississippian black shales, central Appalachian basin (USA). Chem. Geol. 2004, 206, 373–391. [Google Scholar] [CrossRef]
  43. Lyons, T.W.; Severmann, S. A critical look at iron paleoredox proxies: New insights from modern euxinic marine basins. Geochim. Cosmochim. Acta 2006, 70, 5698–5722. [Google Scholar] [CrossRef]
  44. Trela, W.; Podhalańska, T.; Smolarek, J.; Marynowski, L. Llandovery green/grey and black mudrock facies of the northern Holy Cross Mountains (Poland) and their relation to early Silurian sea-level changes and benthic oxygen level. Sediment. Geol. 2016, 342, 66–77. [Google Scholar] [CrossRef]
  45. Smolarek, J.; Marynowski, L.; Trela, W.; Kujawski, P.; Simoneit, B.R.T. Redox conditions and marine microbial community changes during the end-Ordovician mass extinction event. Global Planet Change 2017, 149, 105–122. [Google Scholar] [CrossRef]
  46. Yuan, Y.Y.; Cai, C.F.; Wang, T.K.; Xiang, L.; Jia, L.Q.; Chen, Y. Redox condition during Ediacaran-Cambrian transition in the Lower Yangtze deep water basin, South China: Constraints from iron speciation and δ13Corg in the Diben section, Zhejiang. Chin. Sci. Bull. 2014, 59, 3638–3649. [Google Scholar] [CrossRef]
  47. Lei, L.D.; Shen, J.; Li, C.; Algeo, T.J.; Chen, Z.Q.; Feng, Q.L.; Cheng, M.; Jin, C.S.; Huang, J.H. Controls on regional marine redox evolution during Permian-Triassic transition in South China. Paleogeogr. Paleoclimatol. Paleoecol. 2017, 486, 17–32. [Google Scholar] [CrossRef]
  48. Ma, Y.Q.; Fan, M.J.; Lu, Y.C.; Guo, X.S.; Hu, H.Y.; Chen, L.; Wang, C.; Liu, X.C. Geochemistry and sedimentology of the Lower Silurian Longmaxi mudstone in southwestern China: Implications for depositional controls on organic matter accumulation. Mar. Petrol. Geol. 2016, 75, 291–309. [Google Scholar] [CrossRef] [Green Version]
  49. Sweere, T.; van den Boorn, S.; Dickson, A.J.; Reichart, G.J. Definition of new trace-metal proxies for the controls on organic matter enrichment in marine sediments based on Mn, Co, Mo and Cd concentrations. Chem. Geol. 2016, 441, 235–245. [Google Scholar] [CrossRef]
  50. Nancet, W.B.; Taylor, S.R. Rare earth element patterns and crustal evolution–I. Australian post-Archean sedimentary rocks. Geochim. Cosmochim. Acta 1976, 40, 1539–1551. [Google Scholar] [CrossRef]
  51. Wang, C.; Zhang, B.Q.; Shu, Z.G.; Lu, Y.C.; Lu, Y.Q.; Bao, H.Y.; Li, Z.; Liu, C. Lithofacies types and reservoir characteristics of marine shales of the Wufeng Formation-Longmaxi Formation in Fuling area, the Sichuan Basin. Oil Gas Geol. 2018, 39, 485–497. [Google Scholar]
  52. Wang, E.Z.; Guo, T.L.; Li, M.W.; Li, C.R.; Dong, X.X.; Zhang, N.X.; Feng, Y. Exploration potential of different lithofacies of deep marine shale gas systems: Insight into organic matter accumulation and pore formation mechanisms. Mar. Petrol. Geol. 2022, 102, 104563. [Google Scholar] [CrossRef]
  53. Zhai, G.Y.; Wang, Y.F.; Liu, G.H.; Lu, Y.C.; He, S.; Zhou, Z.; Li, J.; Zhang, Y. Accumulation model of the Sinian-Cambrian shale gas in western Hubei Province, China. J. Geomech. 2020, 26, 696–713. [Google Scholar]
  54. Adegoke, A.K.; Abdullah, W.H.; Hakimi, M.H.; Sarki Yandoka, B.M. Geochemical characterisation of Fika Formation in the Chad (Bornu) Basin, northeastern Nigeria: Implications for depositional environment and tectonic setting. Appl. Geochem. 2014, 43, 1–12. [Google Scholar] [CrossRef]
  55. Chang, H.; An, Z.S.; Wu, F.; Jin, Z.D.; Liu, W.G.; Song, Y.G. A Rb/Sr record of the weathering response to environmental changes in westerly winds across the Tarim Basin in the late Miocene to the early Pleistocene. Paleogeogr. Paleoclimatol. Paleoecol. 2013, 386, 364–373. [Google Scholar] [CrossRef]
  56. Haq, B.U.; Schutter, S.R. A chronology of Paleozoic sea-level changes. Science 2008, 322, 64–68. [Google Scholar] [CrossRef] [PubMed]
  57. Van den Boorn, S.H.J.M.; van Bergen, M.J.; Nijman, W.; Vroon, P.Z. Dual role of seawater and hydrothermal fluids in Early Archean chert formation: Evidence from silicon isotopes. Geology 2007, 35, 939–942. [Google Scholar] [CrossRef]
  58. Khan, M.Z.; Feng, Q.L.; Zhang, K.; Guo, W. Biogenic silica and organic carbon fluxes provide evidence of enhanced marine productivity in the Upper Ordovician-Lower Silurian of South China. Paleogeogr. Paleoclimatol. Paleoecol. 2019, 534, 109–278. [Google Scholar] [CrossRef]
  59. Garbán, G.; Martínez, M.; Márquez, G.; Rey, O.; Escobar, M.; Esquinas, N. Geochemical signatures of bedded cherts of the upper La Luna Formation in Táchira State, western Venezuela: Assessing material provenance and paleodepositional setting. Sediment. Geol. 2017, 347, 130–147. [Google Scholar] [CrossRef]
  60. Chen, X.; Fan, J.X.; Chen, Q.; Tang, L.; Hou, X.D. Toward a stepwise Kwangsian Orogeny. Sci. China Earth Sci. 2014, 57, 379–387. [Google Scholar] [CrossRef]
  61. Jones, B.; Manning, D.A.C. Comparison of geochemical indices used for the interpretation of palaeoredox conditions in ancient mudstones. Chem. Geol. 1994, 111, 111–129. [Google Scholar] [CrossRef]
  62. Algeo, T.J.; Maynard, J.B. Trace-element behavior and redox facies in core shales of Upper Pennsylvanian Kansas-type cyclothems. Chem. Geol. 2004, 206, 289–318. [Google Scholar] [CrossRef]
  63. Poulton, S.W.; Canfield, D.E. Ferruginous conditions: A dominant feature of the ocean through Earth’s history. Elements 2011, 7, 107–112. [Google Scholar] [CrossRef] [Green Version]
  64. Kwak, D.H.; Song, Y.S.; Choi, Y.H.; Kim, K.M.; Jeong, Y.H. Influence of sluice gate operation on salinity stratification and hypoxia development in a brackish estuary dam. Reg. Stud. Mar. Sci. 2023, 57, 102731. [Google Scholar] [CrossRef]
  65. Van Soelen, E.E.; Twitchett, R.J.; Kürschner, W.M. Salinity changes and anoxia resulting from enhanced run-off during the late Permian global warming and mass extinction event. Clim. Past 2018, 14, 441–453. [Google Scholar] [CrossRef] [Green Version]
  66. Algeo, T.J.; Tribovillard, N. Environmental analysis of paleoceanographic systems based on molybdenum–uranium covariation. Chem. Geol. 2009, 268, 211–225. [Google Scholar] [CrossRef]
  67. Algeo, T.J.; Lyons, T.W. Mo-total organic carbon covariation in modern anoxic marine environments: Implications for analysis of paleoredox and paleohydrographic conditions. Paleoceanography 2006, 21, PA101623. [Google Scholar] [CrossRef]
  68. Zhang, J.F.; Xu, H.; Zhou, Z.; Ren, P.F.; Guo, J.Z.; Wang, Q. Geological characteristics of shale gas reservoir in Yichang area, western Hubei. Acta Pet. Sin. 2019, 40, 887–899. [Google Scholar]
  69. Canfield, D.E. Factors influencing organic carbon preservation in marine sediments. Chem. Geol. 1994, 114, 315–329. [Google Scholar] [CrossRef]
  70. Zhang, K.; Li, X.; Wang, Y.; Liu, W.; Yu, Y.; Zhou, L.; Feng, W. Paleo-environments and organic matter enrichment in the shales of the Cambrian Niutitang and Wunitang Formations, south China: Constraints from depositional environments and geochemistry. Mar. Pet. Geol. 2021, 134, 105329. [Google Scholar] [CrossRef]
  71. Brumsack, H.J. The trace metal content of recent organic carbon-rich sediments: Implications for cretaceous black shale formation. Palaeogeogr. Palaeoclimatol. Palaeoecol. 2006, 232, 344–361. [Google Scholar] [CrossRef]
  72. Algeo, T.J.; Kuwahara, K.; Sano, H.; Bates, S.; Lyons, T.; Elswick, E.; Maynard, J.B. Spatial variation in sediment fluxes, redox conditions, and productivity in the Permian–Triassic Panthalassic Ocean. Palaeogeogr. Palaeoclimatol. Palaeoecol. 2011, 308, 65–83. [Google Scholar] [CrossRef]
  73. Cai, Q.S.; Chen, X.H.; Wang, C.S.; Zhang, B.M.; Han, J.; Zhang, G.T.; Liu, A.; Luo, S.Y.; Li, H.; Zhang, M.; et al. Occurrence characteristics and depositional model of Graptolites from the black shale in the Upper Ordovician Wufeng Formation and lower Silurian Longmaxi Formation. Bull. Geol. Sci. Tech. 2020, 39, 43–53. [Google Scholar]
  74. Wang, H.Y.; Shi, Z.S.; Sun, S.S. Biostratigraphy and reservoir characteristics of the Ordovician Wufeng Formation Silurian Longmaxi Formation shale in the Sichuan Basin and its surrounding areas, China. Petrol. Explor. Dev. 2021, 48, 1019–1032. [Google Scholar] [CrossRef]
  75. Qiu, Z.; Zou, C.N.; Li, X.Z.; Wang, H.Y.; Dong, D.Z.; Lu, B.; Zhou, S.W.; Shi, Z.S.; Feng, Z.Q.; Zhang, M.Q. Discussion on the contribution of graptolite to organic enrichment and gas shale reservoir: A case study of the Wufeng–Longmaxi shales in South China. J. Nat. Gas Geosci. 2018, 3, 147–156. [Google Scholar] [CrossRef]
  76. Cirilli, S.; Panfili, G.; Buratti, N.; Frixa, A. Paleoenvironmental reconstruction by means of palynofacies and lithofacies analyses: An example from the Upper Triassic subsurface succession of the Hyblean Plateau Petroleum System (SE Sicily, Italy). Rev. Paleobot. Palynol. 2018, 253, 70–87. [Google Scholar] [CrossRef]
  77. Armstrong, H.A.; Turner, B.R.; Makhlouf, I.M.; Weedon, G.P.; Williams, M.; Al Smadi, A.; Salah, A.A. Origin, sequence stratigraphy and depositional environment of an upper Ordovician (Hirnantian) deglacial black shale, Jordan. Palaeogeogr. Palaeoclimatol. Palaeoecol. 2005, 220, 273–289. [Google Scholar] [CrossRef]
  78. Wang, Y.M.; Dong, D.Z.; Huang, J.L.; Li, X.J.; Wang, S.F. Guanyinqiao Member lithofacies of the Upper Ordovician Wufeng Formation around the Sichuan Basin and the significance to shale gas plays, SW China. Petrol. Explor. Dev. 2016, 43, 42–50. [Google Scholar] [CrossRef]
  79. Finnegan, S.; Heim, N.A.; Peters, S.E.; Fischer, W.W. Climate change and the selective signature of the Late Ordovician mass extinction. Proc. Natl. Acad. Sci. USA 2012, 109, 6829–6834. [Google Scholar] [CrossRef] [Green Version]
  80. Rong, J.Y.; Chen, X.; Happer, D.A.T. The latest Ordovician Hirnantia Fauna (Brachiopoda) in time and space. Lethaia 2002, 35, 231–249. [Google Scholar]
  81. Yang, X.R.; Yan, D.T.; Zhang, B.; Zhang, L.W.; Wei, X.S.; Li, T.; He, J.; Shangguan, Y.F.; Zhang, M.X.; She, X.H. The depositional mechanism of organic-rich siliceous shales in Upper Yangtze area: Response to the Kwangsian Orogeny in South China. J. Pet. Sci. Eng. 2020, 192, 107–310. [Google Scholar] [CrossRef]
Figure 1. (a) Location of the Yangtze Platform in South China. (b) Palaeogeography of the Yangtze Platform in South China in the early Silurian (simplified from Zhang et al., 2019a [15]). (c) Palaeogeography of the middle-upper Yangtze Platform in the early Silurian showing the study area of the Yiling block in the southeastern Huangling basement (modified from Huang et al., 2020 [16]). (d) Lithostratigraphic column of well YD1 in the Yiling block showing black siliceous rock in the WF, black siliceous rock and argillaceous shales in the LLM are organic-rich shales. Note: LX, WF, GYQ, LLM, and ULM are the abbreviations for the Linxiang, Wufeng, Guanyinqiao, and lower and upper Longmaxi formations, respectively.
Minerals 13 00502 g001
Figure 2. (a) Core image of dark grey carbonaceous mudstone in the LX, sample Y1 with a depth of 625 m. (b,c) Core and thin section images of black carbonaceous siliceous rock in the WF, sample Y9 with a depth of 618.46 m. (d,e) Core and thin section images of grey-black carbonaceous dolomite siltstone in the WF, sample Y8 with a depth of 619.5 m. (f) Rectograptus image of graptolite biozones WF2-3 in the WF, depth 621.26 m. (g,h) Core and thin section images of black carbonaceous shale in the LLM, sample Y13 with a depth of 616.1 m. (i) Campograptus image of graptolite biozone LM6 in the LLM, depth 615.6 m. (j,k) Core and thin section images of dark grey carbonaceous silty shale in the UMX, sample Y20 with a depth of 605.26 m. (l) Demirastrite image of graptolite biozone LM6 in the ULM, depth 610.71 m.
Minerals 13 00502 g002
Figure 3. (a) Vertical variation in TOC content shows that the WF and LLM include organic-rich shales. (b) The percentage of bulk mineral compositions shows that quartz contents decrease and clay contents increase from the bottom to the top. (c) The lithofacies classification shows that most samples are potted in the field of siliceous shales. (d) TOC contents in different subclass lithofacies show that S-2 and S have higher TOC values. Note: CM, CM-1, CM-2, and CM-3 represent mudstone, siliceous argillaceous shale, argillaceous shale, and calcareous argillaceous shale, respectively. C, C-1, C-2, and C-3 represent limestone, siliceous calcareous shale, calcareous shale, and argillaceous calcareous shale, respectively. S, S-1, S-2, and S-3 represent siliceous rock, calcareous siliceous shale, siliceous shale, and argillaceous siliceous shale, respectively. M-1, M-2, M-3, and M-4 represent calcareous siliceous mixed shale, argillaceous siliceous mixed shale, mixed shale, and argillaceous calcareous mixed shale, respectively.
Minerals 13 00502 g003
Figure 4. (a) Enrichment factors of the major element’s values show that Si, Ca, Na, P, and Fe contents in organic-rich shales are higher than those of organic-lean shales, with moderate to apparent enrichment contents compared to those of PAAS. (b) Enrichment factors of the trace elements show that V, Co, Ni, Cu, Zn, Mo, Ba, and U contents in organic-rich shales are higher than those of organic-lean shales, with moderate to apparent enrichment relative to those of PAAS. The dotted line with EF = 1 highlights enrichment or depletion, and the dotted line with EF = 3 highlights apparent or moderate enrichment.
Minerals 13 00502 g004
Figure 5. (a) La–Th–Sc and (b) Th–Sc–Zr/10 ternary diagrams (modified from Ge et al., 2019 [38]) showing mainly active continental margin tectonic settings. Note: OIA, CIA, ACM, and PM are the abbreviations for the oceanic island arc, continental island arc, active continental margin, and passive margin, respectively.
Minerals 13 00502 g005
Figure 6. Al2O3–CaO* + Na2O–K2O ternary diagrams exhibiting weathering degree (all in mole percentages). The CIAcorr values of most samples range from 70 to 80, indicating a moderate degree of chemical weathering and a warm and humid palaeoclimate. Note: T and T’ are the actual and predicted weathering trends, respectively.
Minerals 13 00502 g006
Figure 7. Vertical variation in TOC contents, terrigenous influx proxy Al contents, biogenic source discrimination proxy Sibio/(Sibio + Febio + Al + Cabio), palaeoclimate proxies Sr/Cu and Rb/Sr, and CIAcorr of the Wufeng–Longmaxi Formation in well YD1, showing that the organic-rich shales in the WF and LLM mainly deposited in the warm and humid climate, and the organic-lean shales in the LX and ULM mainly deposited in a warmer and wetter climate. Remarkably, the significant variation of palaeoenvironment caused by the Kwangsian Orogeny [20,21] directly led to the turnover of graptolite biozones from the LM5 in Rhuddanian to the LM6 in Aeronian. Note: The red dotted line represents the boundary of Rhuddanian and Aeronian.
Minerals 13 00502 g007
Figure 8. (a) Crossplots of (Fe + Mn)/Ti vs. Al/(Al + Fe + Mn) showing that the silica mainly had a nonhydrothermal origin. (b) Crossplots of SiO2 vs. Al2O3 showing a negative correlation in the WF and LLM, implying a mainly source of biogenic silica and no significant correlation in the ULM, implying that silica probably had a mixed biogenic and terrigenous clastic origin.
Minerals 13 00502 g008
Figure 9. Crossplots of terrigenous influx proxy Al vs. palaeoclimate proxy Rb/Sr show that higher terrigenous influx is closely associated with the warmer and wetter palaeoclimate in the LX, lower WF (sample Y2), upper LLM (samples Y14 and Y15), and ULM.
Minerals 13 00502 g009
Figure 10. Vertical variations in TOC content; palaeoredox proxies V/Cr, Ni/Co, and U/Th and palaeoproductivity proxies Sibio, (Ni + Cu + Zn)bio, and P/Ti of the Wufeng–Longmaxi Formation in well YD1 showing mainly anoxic conditions and high productivity in organic-rich shales of the middle-upper WF and the lower LLM.
Minerals 13 00502 g010
Figure 11. (a) Vertical variation in palaeoredox condition proxies Fepy/FeHR and FeT/Al in the Wufeng–Longmaxi Formation in well YD1 showing mainly ferruginous conditions except for one sample in the lower LLM that was deposited under euxinic conditions. (b) Crossplots of redox proxies Fepy/FeHR vs. FeHR/FeT showing that LX and ULM were mainly deposited under oxic conditions and WF and LLM were primarily deposited under ferruginous conditions. (c) Crossplots of TOC vs. Mo showing that the Mo/TOC values of most samples are lower than 15 × 10−4 [15], indicating a strong degree of restriction.
Minerals 13 00502 g011
Figure 12. (a) Crossplots of TOC content vs. Co × Mn values and (b) crossplots of Sibio content vs. Co×Mn values indicating that the WF showed much stronger upwelling and a negative correlation between palaeoproductivity and upwelling intensity, implying that strong upwelling could bring nutrients from the deep ocean to the shallow shelf, leading to high palaeoproductivity.
Minerals 13 00502 g012
Figure 13. Correlations between TOC content and the factors that influence OMA. (ad) Crossplots of TOC vs. terrigenous influx proxy Al, deposition rates proxy LaN/YbN, palaeoredox proxy Ni/Co, and palaeoproductivity proxy (Ni + Cu + Zn)bio of the Wufeng–Longmaxi Formation, respectively. (eh) Crossplots of TOC vs. Al, LaN/YbN, Ni/Co, and (Ni + Cu + Zn)bio of the WF, LLM, and ULM, respectively. Overall, OMA is controlled by both redox conditions and productivity. However, the factors that influence OMA change vertically, and OMA is mainly influenced by terrigenous influx in the WF and ULM and controlled by redox conditions and productivity in the LLM.
Minerals 13 00502 g013
Figure 14. The model of the palaeoenvironmental evolution of the Wufeng–Longmaxi Formation in well YD1. (a) The palaeoenvironmental conditions in the LX stage showing moderate terrigenous influx, moderately warm and humid climate, oxic conditions and low productivity. (b) The palaeoenvironmental conditions in the WF stage showing low terrigenous influx, slightly warm and humid climate, ferruginous anoxic conditions conditions and high productivity. (c) The palaeoenvironmental conditions in the GYQ stage showing low terrigenous influx, cold and arid climate, oxic conditions and low productivity. (d) The palaeoenvironmental conditions in the LLM stage showing low terrigenous influx, slightly warm and humid climate, ferruginous to euxinic anoxic conditions conditions and moderate to high productivity. Remarkably, euxinic conditions in the lower LLM are mainly attributed to the rise in sea level caused by the melting of Gondwanan continental glaciers and strong tectonic subsidence caused by continuous compression from the Xuefeng uplift to the Yangtze Platform [16], leading to the formation a deep-water basin. (e) The palaeoenvironmental conditions in the ULM stage showing high terrigenous influx caused by the Kwangsian Orogeny, highly warm and humid climate, oxic conditions and low productivity.
Minerals 13 00502 g014
Table 1. TOC and major elements contents of the Wufeng–Longmaxi Formation in well YD1.
Sample No.TOC (%)SiO2 (%)TiO2 (%)Al2O3 (%)Fe2O3 (%)MnO (%)MgO (%)CaO (%)Na2O (%)K2O (%)P2O5 (%)FeT (%)Fepy (%)FeHR (%)Al (%)Sibio (%)Sibio/(Sibio + Febio + Al + Cabio)Al/(Al + Fe+Mn)(Fe + Mn)/TiCIAcorrP/TiFepy/FeHRFeHR/FeTFeT/Al
Y240.7661.50.6916.796.550.062.680.481.213.90.114.590.791.448.892.660.240.6611.1976.80.120.550.310.52
Y230.8061.60.717.16.380.052.710.431.184.050.114.470.681.29.052.230.210.6710.7377.40.110.570.270.49
Y221.7460.20.6716.416.340.052.590.511.043.920.114.440.971.578.692.640.240.6611.1478.70.120.620.350.51
Y211.3760.40.6716.626.650.052.660.551.043.950.114.651.021.678.802.420.220.6511.6879.00.120.610.360.53
Y201.1159.30.716.886.440.052.710.621.094.040.14.510.891.628.941.480.150.6610.8378.20.100.550.360.50
Y191.73610.6916.126.230.052.60.611.043.840.14.360.941.618.533.480.300.6610.6378.30.110.580.370.51
Y181.5861.30.6515.746.230.042.50.420.983.760.114.361.061.68.334.200.340.6511.2679.00.120.660.370.52
Y172.7459.30.6214.246.330.032.280.571.13.320.134.430.852.457.545.570.410.6311.9775.90.150.350.550.59
Y161.7162.80.614.86.20.042.380.361.013.510.14.341.062.147.846.340.450.6412.1477.70.120.500.490.55
Y152.6161.10.613.86.610.042.360.940.983.30.14.631.672.717.317.110.460.6112.9477.00.120.620.590.63
Y143.0558.40.6213.836.570.032.080.751.093.270.124.61.233.277.325.800.420.6112.4375.40.140.380.710.63
Y136.1870.40.488.93.650.021.240.960.981.980.112.561.412.094.7119.040.790.658.9369.70.170.670.820.54
Y126.2948.90.611.017.550.062.412.51.272.330.25.293.194.415.835.760.380.5214.8168.80.240.720.830.91
Y113.45820.264.991.870.020.61.280.610.990.071.310.831.222.6430.550.900.678.4967.80.200.680.930.50
Y103.23820.264.551.980.030.711.750.660.880.071.380.781.282.4131.190.900.639.0364.20.200.610.920.58
Y92.99780.246.642.70.020.621.450.611.470.061.891.311.933.5226.090.860.6513.2373.00.180.681.020.54
Y82.5834.70.378.344.340.223.6218.90.581.850.033.041.93.184.423.280.150.5814.4577.40.060.601.050.69
Y72.0582.10.23.731.850.040.622.870.460.750.061.290.821.251.9732.550.890.6011.0567.60.220.660.970.66
Y63.8683.90.224.571.660.010.630.70.421.040.051.160.660.982.4232.070.920.678.8672.90.170.670.840.48
Y54.4974.30.448.072.910.021.280.940.651.990.082.030.851.344.2722.170.830.687.7775.20.130.630.660.48
Y41.989.90.132.950.940.010.410.810.260.660.040.660.270.461.5637.390.950.708.5473.70.220.590.700.42
Y32.8877.20.337.122.810.031.031.410.471.780.071.960.781.253.7724.990.850.6510.0577.90.150.620.640.52
Y24.9463.60.6813.984.290.032.170.650.923.710.1130.551.017.407.990.550.717.4278.10.120.540.340.41
Y10.760.80.8417.075.520.032.810.951.014.60.093.860.561.129.041.890.190.707.7179.50.080.500.290.43
PAAS/62.8118.97.220.112.21.31.23.70.16/////////////
Table 2. Trace elements contents of the Wufeng–Longmaxi Formation in well YD1.
Sample No.Y24Y23Y22Y21Y20Y19Y18Y17Y16Y15Y14Y13Y12Y11Y10Y9Y8Y7Y6Y5Y4Y3Y2Y1PAAS
Sc (ppm)16.3316.8516.5216.8717.5415.4515.1614.1513.9013.7513.407.6510.203.883.524.821.572.693.968.002.446.3116.0216.8416
V (ppm)139.18134.34158.23175.24166.84171.58166.72131.83125.06134.55144.00218.36228.99128.6199.23123.3277.9083.90279.34571.00234.4096.02329.21134.65150
Cr (ppm)83.4886.6984.9087.1387.0481.6477.7174.6871.6470.7971.1047.4859.3028.3723.1826.204.1119.8034.6064.7027.0056.40115.4885.18110
Co (ppm)18.0818.2618.6820.0219.1518.3718.3116.0017.6618.6624.4016.3429.4026.8930.9816.0218.2070.0022.5121.6066.7724.7712.0021.1423
Ni (ppm)64.2364.5387.4792.8683.4687.2583.6864.8475.25110.77144.00132.13340.2293.9197.50120.29195.00154.00105.60150.00105.2998.0483.6260.8355
Cu (ppm)50.4839.3446.0751.6848.9348.6350.4849.1747.1164.7575.3058.0778.5831.1226.7432.5314.8019.3051.2682.4032.0374.03159.46113.7150
Zn (ppm)124.79111.17123.66122.29124.99120.96107.02107.72102.87116.80119.00140.06355.7885.8969.91110.44308.00102.00135.52258.00135.07172.61244.17245.2785
Rb (ppm)184.08194.66193.04193.38193.17180.57175.65164.80167.13162.99153.0088.32117.1842.9937.6653.2654.8029.4046.2787.8029.8071.74172.53197.96160
Sr (ppm)86.6689.16107.4888.6590.9886.6996.8591.7974.1584.3185.9065.02260.6560.2553.3358.84257.0061.9038.5459.7033.1953.2681.5897.36200
Zr (ppm)146.84144.92150.92146.13144.68139.68137.26137.50125.47130.30144.00134.52213.5891.31152.60146.99186.00243.0056.26113.0077.5498.31216.38236.25210
Mo (ppm)2.163.258.175.456.2010.526.2731.2912.7516.2334.1045.0053.0513.5412.6811.7533.0033.5043.2685.207.516.5825.202.841
Ba (ppm)1606.32037.36096.11374.81202.81662.15645.04164.01127.6879.7958.0873.226770.3896.71025.61284.22732.01106.0893.3951.0743.9995.6818.6981.3650
Hf (ppm)3.883.984.033.973.883.633.603.723.343.583.893.615.532.212.893.187.985.151.322.950.872.694.316.375
U (ppm)4.824.916.784.986.135.905.838.436.3810.1314.5014.9751.178.5414.5325.5687.7021.508.0613.504.3112.887.894.223.1
Th (ppm)17.5417.6118.5718.5418.6317.6916.7817.2916.1217.2117.5012.6517.716.697.0510.9611.506.155.8111.103.249.9418.8023.4214.6
La (ppm)45.9547.0848.2048.5747.1445.7545.3144.0742.6243.5944.1032.8346.4718.8823.0529.0962.1025.5019.5734.1011.1026.5452.8460.3338
Yb (ppm)2.792.932.912.952.802.782.622.732.512.692.842.273.901.461.672.271.362.101.212.191.031.574.433.892.8
Sr/Cu1.722.272.331.721.861.781.921.871.571.301.141.123.321.941.991.8117.363.210.750.721.040.720.510.86/
Rb/Sr2.122.181.802.182.122.081.811.802.251.931.781.360.450.710.710.910.210.471.201.470.901.352.112.03/
Sr/Ba0.050.040.020.060.080.050.020.020.070.100.090.070.010.070.050.050.090.060.040.060.040.050.100.10/
V/Cr1.671.551.862.011.922.102.151.771.751.902.034.603.864.534.284.7118.954.248.078.838.681.702.851.58/
U/Th0.280.280.370.270.330.330.350.490.400.590.831.182.891.282.062.337.633.501.391.221.331.300.420.18/
Ni/Co3.553.534.684.644.364.754.574.054.265.945.908.0811.573.493.157.5110.712.204.696.941.583.966.972.88/
Cu/Al5.684.355.305.875.475.706.066.526.018.8610.2812.3213.4811.7811.109.253.359.7721.1919.2920.5119.6421.5512.58/
Mo/TOC
(×10−4)
2.854.044.703.985.596.083.9711.427.466.2211.187.288.433.923.933.9312.7916.3411.2118.983.952.285.104.06/
Co × Mn
(×10−8)
0.840.710.720.780.740.710.570.370.550.580.570.251.370.420.720.253.102.170.170.330.520.580.280.49/
(Ni + Cu + Zn)bio (ppm)70.7249.0392.2399.7587.6894.7982.9578.5876.46153.60199.27240.79663.90160.75148.41196.50441.22237.80246.44409.27242.73273.10346.71248.21/
LaN/YbN10.9610.7111.0610.9611.2210.9811.5410.7711.3210.7810.359.627.948.619.188.5530.448.1010.7610.387.2011.277.9510.349.05
Disclaimer/Publisher’s Note: The statements, opinions and data contained in all publications are solely those of the individual author(s) and contributor(s) and not of MDPI and/or the editor(s). MDPI and/or the editor(s) disclaim responsibility for any injury to people or property resulting from any ideas, methods, instructions or products referred to in the content.

