
Application of ASTER Remote Sensing Data to Porphyry Copper Exploration in the Gondwana Region
by
 , and
, and
Chunhui Liu
1,
Chunxia Qiu
1,*,
Luoqi Wang
2,3,
Jie Feng
2,3,
Sensen Wu
2,3 and
Yuanyuan Wang
3,4 1
College of Geomatics, Xi’an University of Science and Technology, Xi’an 710054, China
2
School of Earth Sciences, ZheJiang University, Hangzhou 310027, China
3
Zhejiang Provincial Key Laboratory of Geographic Information Science, Hangzhou 310028, China
4
Ocean Academy, Zhejiang University, Zhoushan 316021, China
*
Author to whom correspondence should be addressed.
Minerals 2023, 13(4), 501; https://doi.org/10.3390/min13040501
Submission received: 2 March 2023
/
Revised: 27 March 2023
/
Accepted: 30 March 2023
/
Published: 31 March 2023
(This article belongs to the Special Issue Mineral Exploration Based on Remote Sensing)
Abstract
:Porphyry copper ore is a vital strategic mineral resource. It is often associated with significant hydrothermal alteration, which alters the original mineralogical properties of the rock. Extracting alteration information from remote sensing data is crucial for porphyry copper exploration. However, the current method of extracting hydrothermal alteration information from ASTER remote sensing data does not consider the influence of disturbing factors, such as topography, and ignores the weak report of surface minerals, which has significant limitations. Therefore, this paper selects the Gondwana region of the East Tethys–Himalayan tectonic domain as the study area, combines waveform calculation with principal component analysis methods, proposes a spectral feature-enhanced principal component analysis (EPCA) method, and constructs a model to complete the automatic selection of principal components for each scene image. The results show that the etching information extracted by the EPCA method is significantly better than the traditional Crosta method in terms of etching area and spatial aggregation and discovers several prospective mineralization areas that have not yet been explored and exploited, such as Sakya and Xietongmen counties in Rikaze, providing theoretical support for subsequent mineralization exploration and large-scale mineral extraction. Meanwhile, obtaining the alteration information of the whole area can help to understand the distribution of mineralizing elements from a macroscopic perspective in the future, which is of great scientific significance in order to deeply analyze the formation process of metal deposits in mineralizing areas and improve the theory of porphyry mineralization.
1. Introduction
Porphyry copper ore is a vital strategic mineral resource composed of hydrothermal alteration products, such as porphyry, gabbro-saprolite, and granite [1]. One of the most important geological conditions for the formation of porphyry copper ore is the intrusion of basaltic magma [2]. Basaltic magma is mainly made up of medium-basic, acidic clastic rocks, with some clastic and volcanic rocks. Due to its particular tectonic position, basaltic magma often interacts with other rocks during the intrusion. When these rocks simultaneously undergo secondary hydrothermal metamorphism, altering the original mineralogical characteristics of the rocks, porphyry copper deposits formed [3]. The application of remote sensing technology to extract alteration information has become an essential tool in porphyry copper ore exploration and discovery, especially in areas with harsh natural conditions and inaccessibility, where the use of remote sensing technology has apparent advantages in finding ores [4,5,6]. Geotectonically, most porphyry copper mines are developed on plate margins or inland orogenic zones [7]. For these reasons, fast and economic multi-source remote sensing satellite data, including multispectral and hyperspectral satellite images, are widely used to detect porphyry copper ore mineralization worldwide [8,9,10,11].
The Advanced Spaceborne Thermal Emission and Reflection Radiometer (ASTER) images on board Terra satellites have higher spectral resolution in the short-wave infrared compared to multispectral data, such as Landsat. They were used for distinguishing different iron oxides as well as Al-OH and Mg-OH alteration minerals, such as kaolinite, montmorillonite, dolomite, and yellow potassium–iron alum. In previous studies, they have also proven to be effective regarding their visible NIR and short-wave IR bands for hydrothermal alteration extraction and mineral exploration [12,13,14,15]. As a result, ASTER data have become the most commonly used remote sensing data for extracting hydrothermal alteration mineral information from porphyry copper mines. However, widely used ASTER erosion information extraction methods, such as traditional principal component analysis (PCA), remove band correlation through mathematical dimensionality reduction and highlight the primary information for principal component analysis, which does not take into account the influence of distracting factors, such as topography, and ignores the weak transmission of the data [16].
The East Tethys–Himalayan tectonic domain is one of the three most challenging mineralized domains in the world [17,18], where the Gangetic region of the southern Tibetan Plateau is driven by deep aerodynamics and magma-hydrothermal interactions to form rich magmatic arc porphyry copper ores [19]. The porphyry-type deposits, such as Drive Dragon and Kema, which are developed within the Gangdis mineralized belt, are world-class mines of 10 million tons. However, traditional mineral exploration is characterized by high exploration costs and difficulty in obtaining mineralization information due to the remote and inaccessible nature of the area. At the same time, the low vegetation cover, the widespread exposure of rock masses, and the extensive hydrothermal alterations are well suited to geochemical and remote sensing mineral exploration dominated by alteration minerals. Scholars have combined geochemistry and infrared spectroscopy to conduct a pilot investigation with sericite as the object of study, and the results revealed that the mineral spectra showed distinct zonation, which closely correlated with the ore bodies [20]. The remote sensing alteration information of large mining areas, such as Qulong and Jiama, has also been extensively studied, but macroscopic mineral alteration studies for the whole area of the study area still need to be effectively carried out [21,22].
In this context, this paper selects the Gondwana region of the East Tethys–Himalayan tectonic domain as the study area, proposes a spectral feature-enhanced principal component analysis (EPCA) method for ASTER data, constructs an EPCA model to complete the automatic selection of main components for each scene, completes the extraction of hydrothermal alteration mineral information for large-scale porphyry copper ore, locates the strongly altered area based on the extraction results, narrows the target area, and analyses the regional lithology-tectonic-alteration multi-source geological elements to delineate the target area and reveal the mineralization pattern. The results of this study not only help the understanding of mineralization exploration in the entire Gondian metallogenic belt but also have important scientific significance for the later stage of the macroscopic geochemical distribution of mineralized elements from a geological point of view, for the in-depth analysis of the formation process of metal deposits in the metallogenic belt, and for the improvement of the porphyry mineralization theory.
2. Geological Background of the Study Area
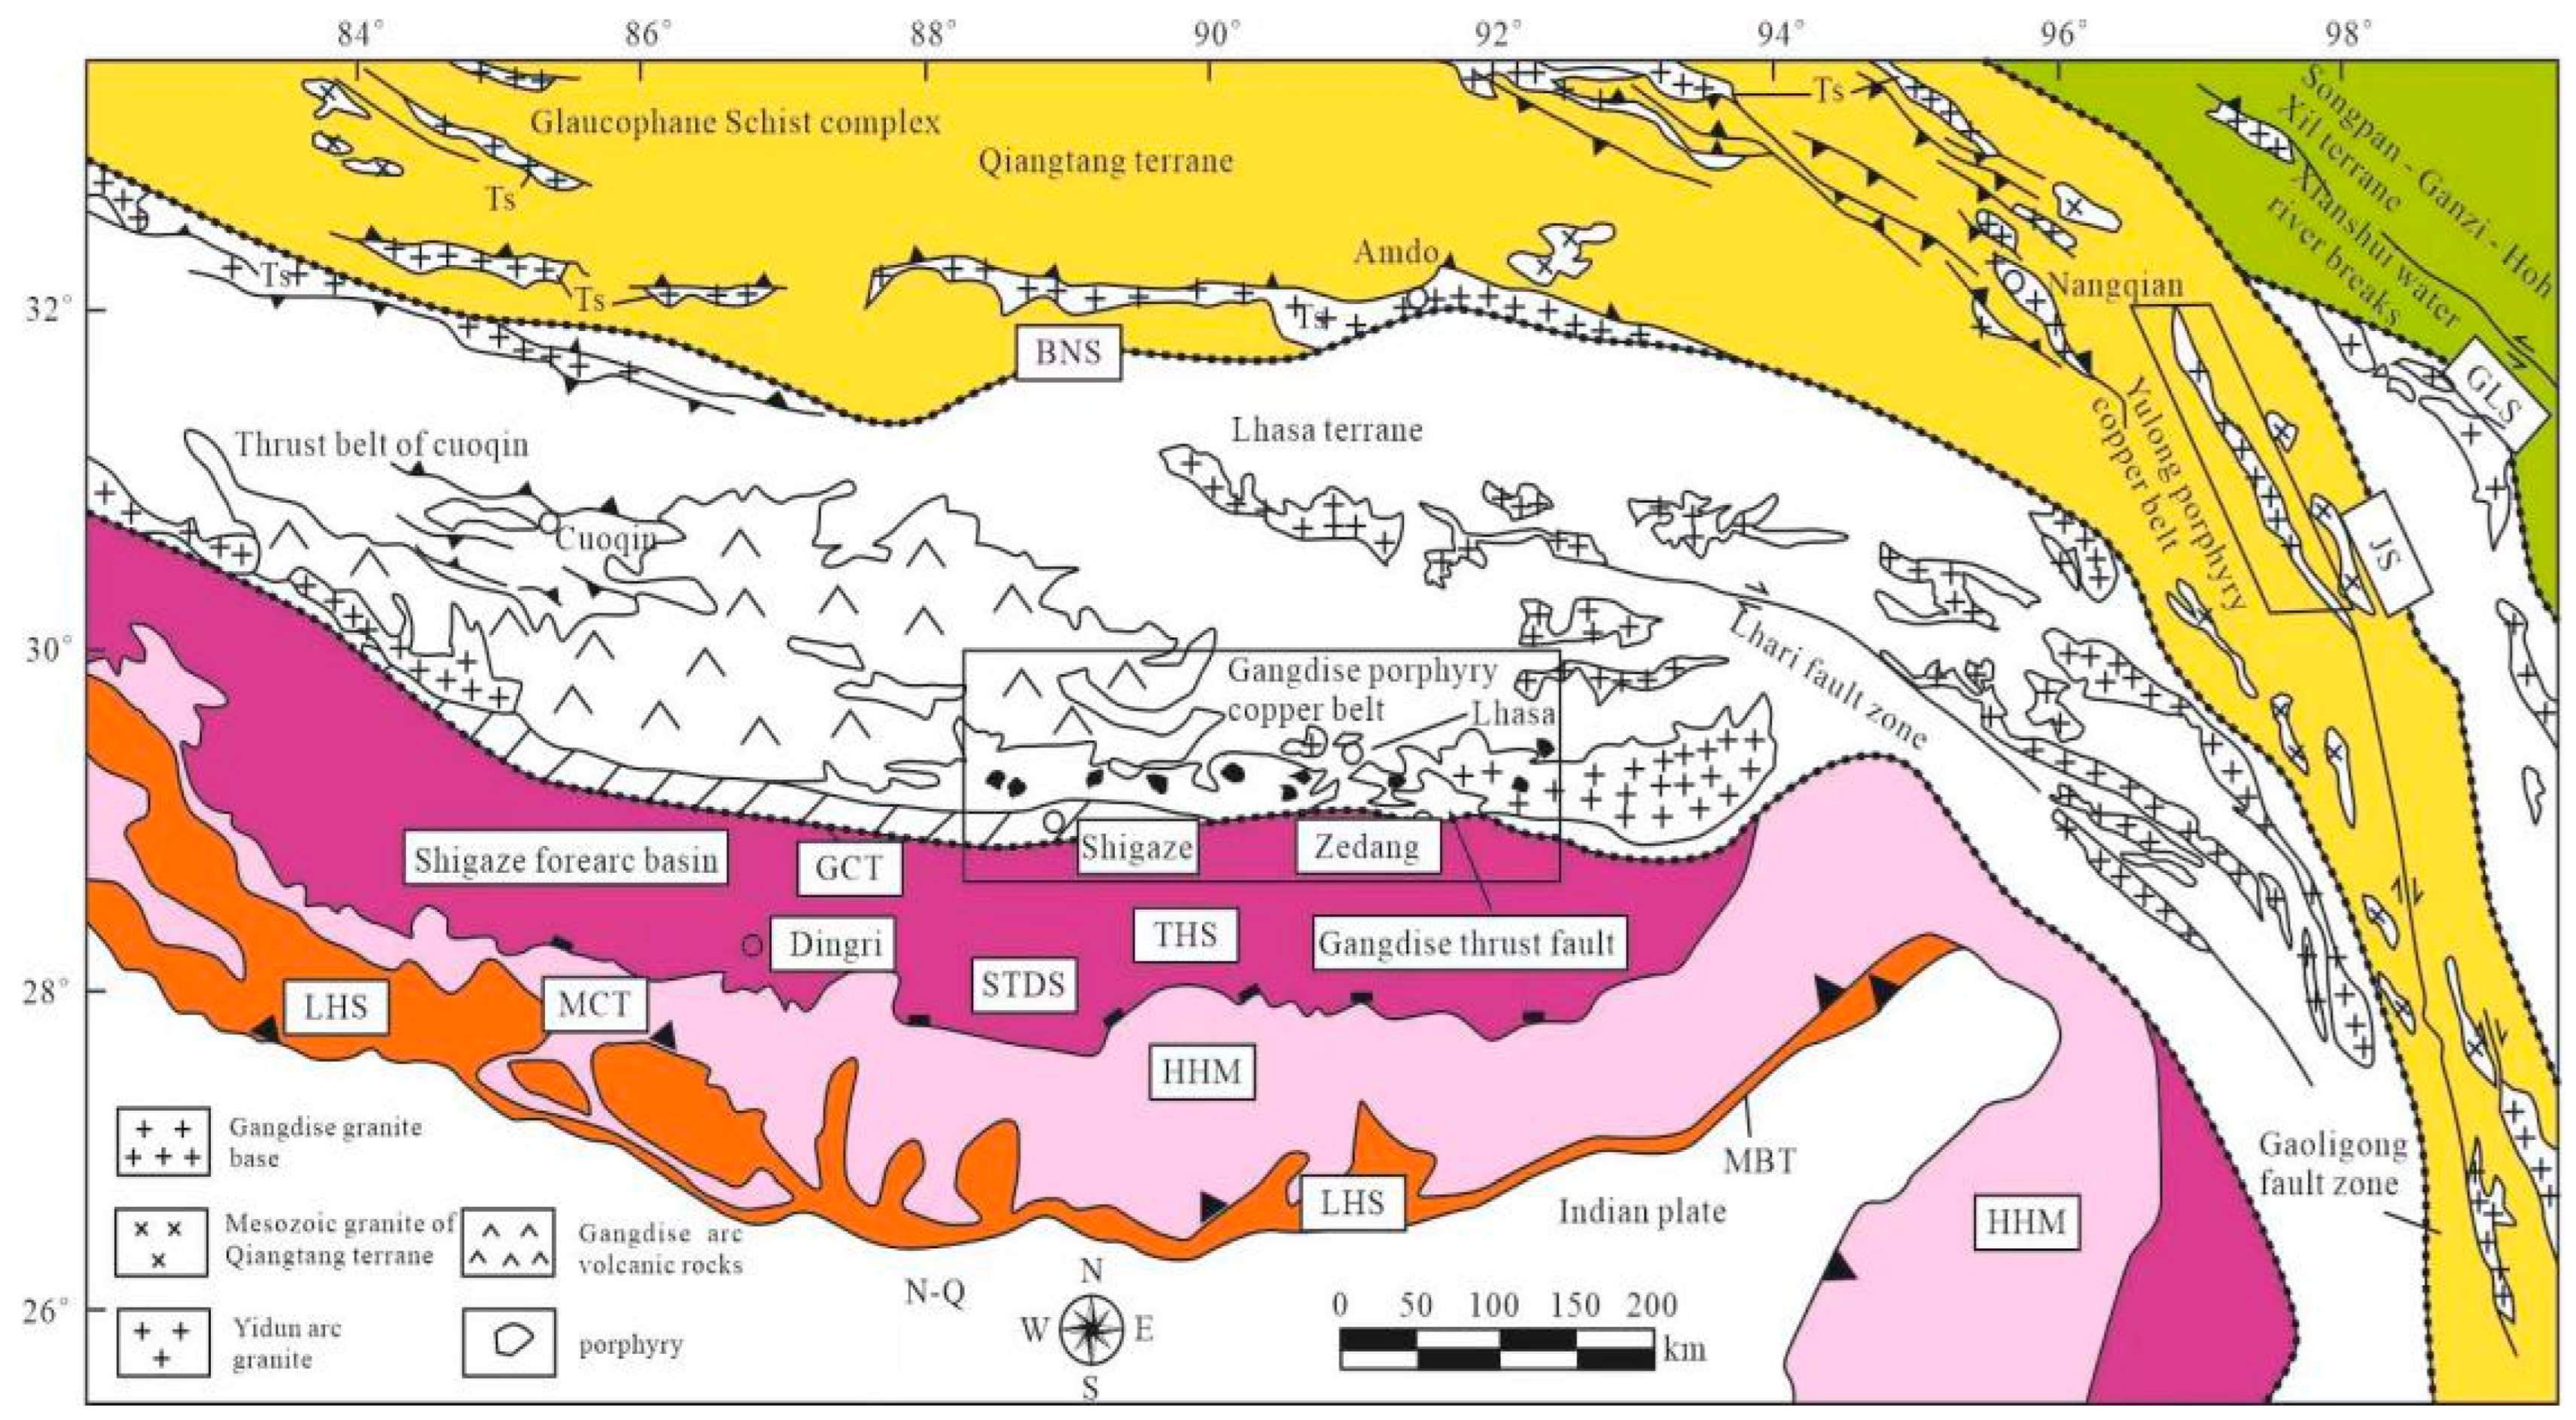
The study area (28°00′–31°00′ N, 88°00′–93°00′ E) is located at the northern edge of the middle section of the East Tethys–Himalayan tectonic domain, in the zone between the Yarlung Tsangpo River (suture zone) and the southern Tibetan detachment system (Figure 1) [23,24]. The area experienced Late Triassic–Late Cretaceous marine sedimentation on the south side of the Neotethys Ocean, with large-scale magmatism. Continental rifting in the Early Cretaceous (130–135 Ma), accompanied by the rapid uplift and denudation of the Gangetic basement, the intrusion of Miocene mineral-bearing porphyry into the Gangetic granite basement and Triassic–Cretaceous strata, and multiple phases of complex and intense tectonic movement and large-scale magmatism that produced a mega porphyry copper-molybdenum belt dominated by porphyry copper-molybdenum mineralization and siliciclastic copper–lead–zinc mineralization. Due to climatic factors and altitude, it is not easy to make breakthroughs in traditional geological prospecting due to difficult working conditions [25,26,27]. At the same time, the area is sparsely vegetated, which is suitable for taking advantage of remote sensing for large-area exploration and is a good testing ground for carrying out remote sensing for mineral exploration.
3. Data and Methods
3.1. Multi-Source Satellite Remote Sensing Data and Features
The ASTER sensor spatial resolution and spectral resolution are well suited for the extraction of mineral alteration information. It consists of three independent subsystems covering a total of 14 bands of data in three channels: visible near-infrared (VNIR), shortwave infrared (SWIR), and thermal infrared (TIR), with a spatial resolution of 15 m, 30 m, and 90 m for the three channels, respectively, the main technical parameters of which are shown in Table 1. Each image is 60 × 60 square kilometers. The data for this paper were obtained from the NASA website (https://search.earthdata.nasa.gov/search?fi=ASTER (accessed on 1 June 2007)), and 93 ASTER 1T-scale images were downloaded from the study area covering the Gondwana porphyry copper belt, for a total study area of more than 150,000 km2. Precisely topographically corrected registered At-Sensor radiance (AST_L1T) data containing calibrated At-Sensor radiance equivalent to the ASTER Level 1B (AST_L1B), geometrically corrected and rotated to the northward upper UTM projection, at a total 36.51 GB.
3.2. Wave Spectral Characteristics of Alteration Minerals
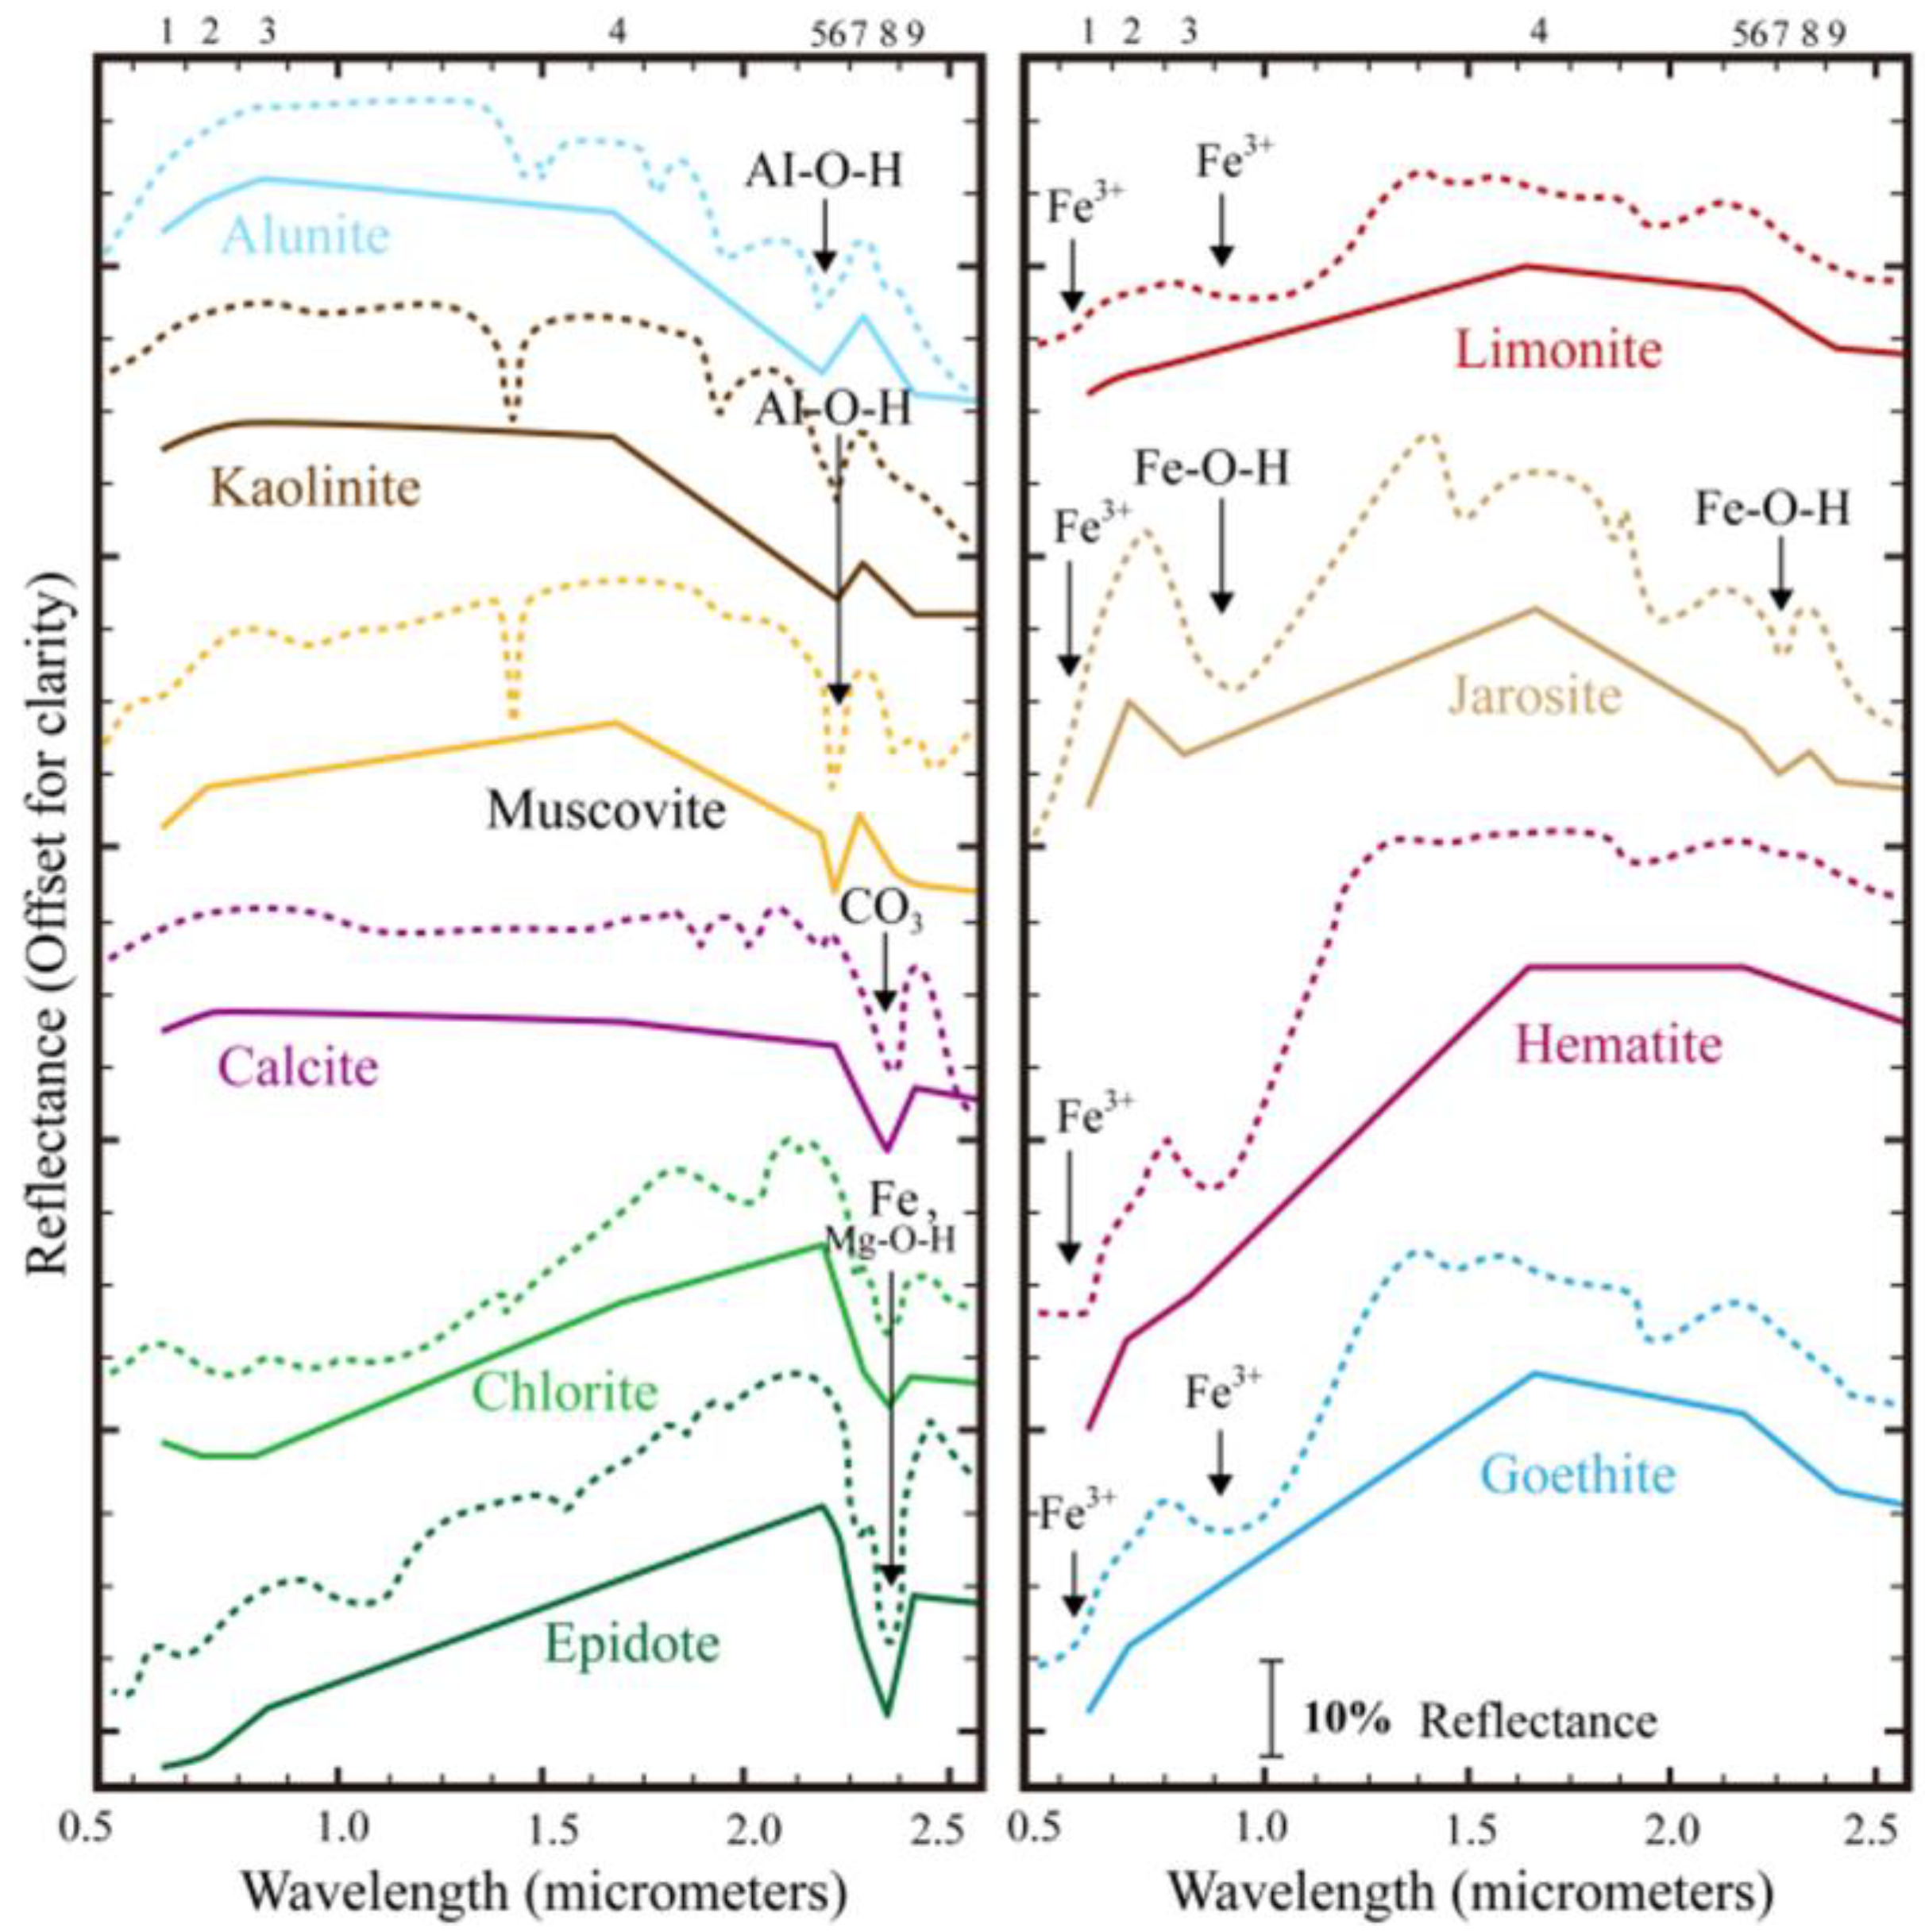
At this stage, the mineralization alterations that can be identified using multi-spectral remote sensing data are mainly iron staining anomalies and hydroxyl anomalies [30]. The iron staining anomaly reflects the richness of hematite, limonite, and yellow potassium iron oxide in the striatum. The hydroxyl anomaly demonstrates the presence of hydroxyl-bearing minerals, such as kaolinite, sericite, chlorite, and chlorite, in the strata. Using ASTER data in multiple bands in the infrared spectral range further distinguishes aluminum hydroxyl minerals, such as kaolinite, from magnesium hydroxyl minerals, such as chlorite and calcite [31,32,33]. As mineral spectra may vary slightly from region to region, to gain a more accurate understanding of the spectral distribution of the three alteration minerals in the Gondwana region, the laboratory spectra of iron oxide minerals, aluminum hydroxyl minerals, and magnesium hydroxyl minerals were obtained by applying infrared spectroscopy to the minerals in the study area to remove spurious peak interference, based on the United States Geological Survey (USGS) wave spectral database for mineral resource development (Figure 2).
3.3. Data Pre-Processing
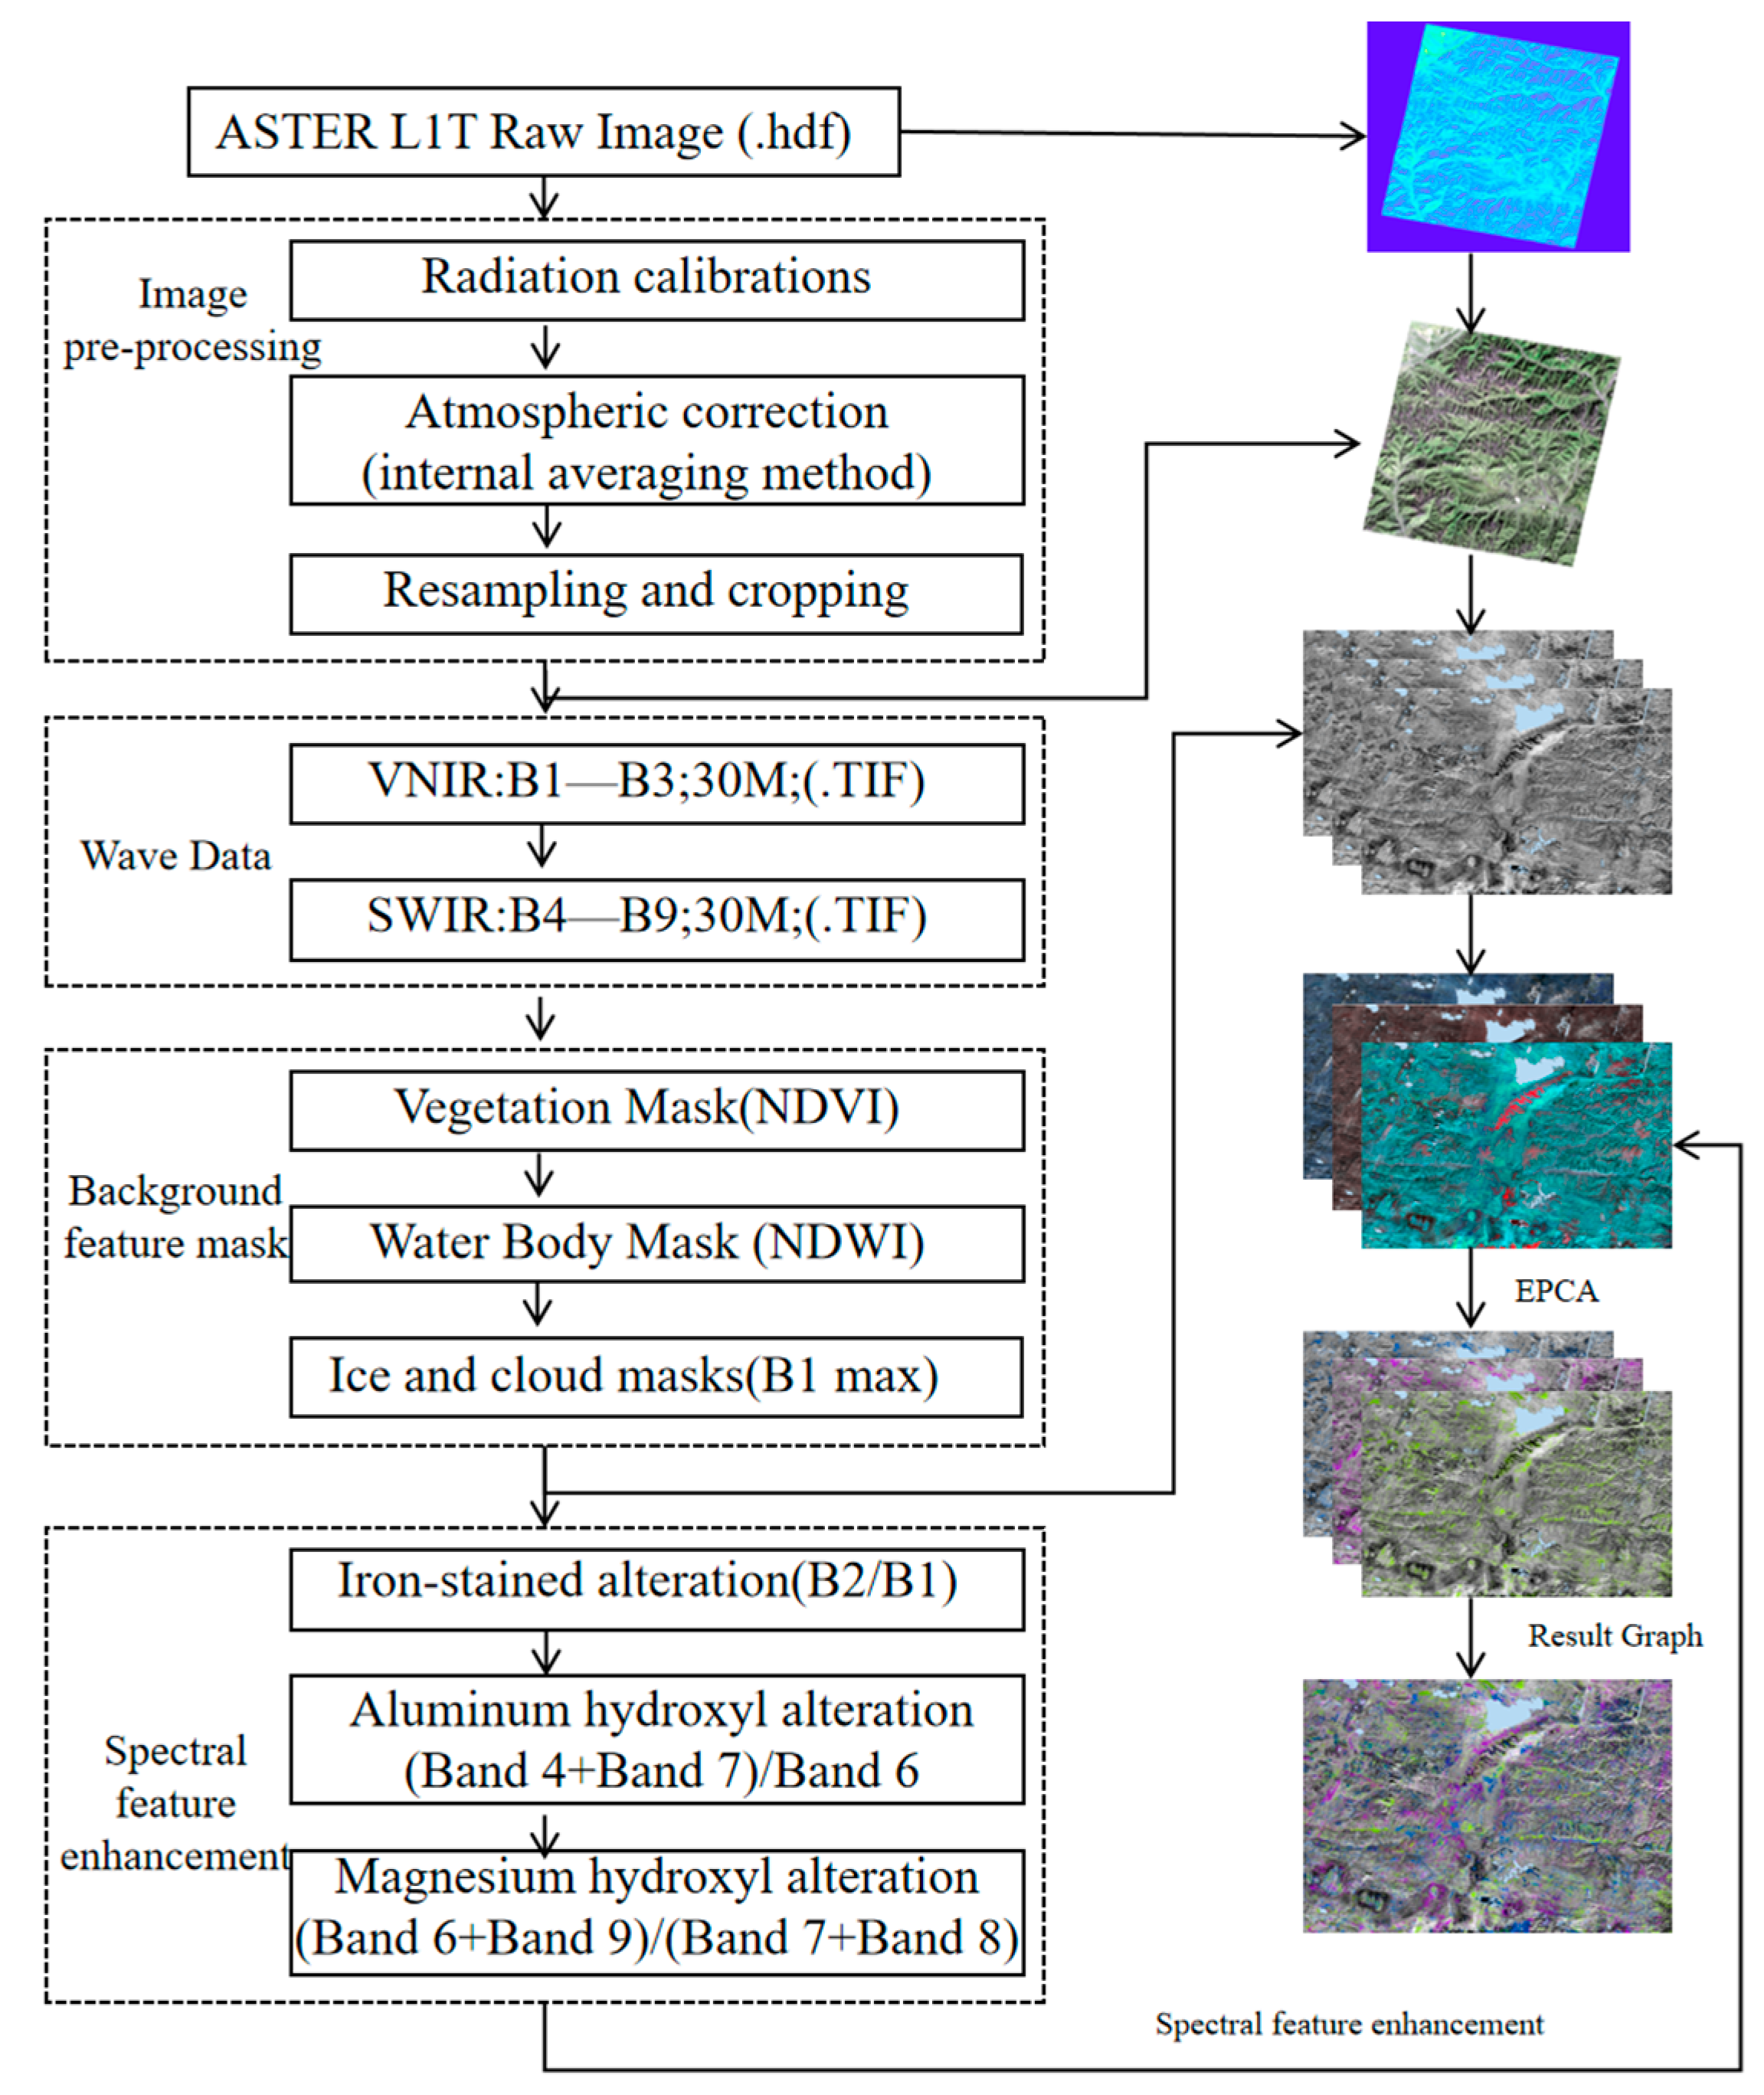
Pre-processing begins with a band split to separate the channels for better follow-up. The L1T source image used here has been crosstalk-corrected and does not require de-crosstalking. Therefore, the image pre-processing consists of three parts: radiometric calibration, atmospheric correction and resampling, and background feature mask extraction [35,36].
The correction of the distortion in the image data dependent on the radiant brightness, the image calibrated by radiation using the internal averaging method for atmospheric correction, that is, the average radiant brightness of the whole scene image after radiation calibration, and then divide the radiant brightness of each image element by the average level to obtain the result of the relative reflectance of the feature, eliminating the influence of atmospheric and lighting factors on the reflection of the feature [37,38]. The ASTER L1T image was resampled and cropped to obtain reflectance data, containing only the visible-near-infrared (VNIR) and shortwave infrared (SWIR) bands in the image’s central region, a total of nine times and at a resolution of 30 m.
Considering that the spectral information of background features such as clouds, water bodies, and vegetation can impact the final etching results, they are masked to exclude their interference with the etching extraction results [39]. Since cloudy features have a strong reflectivity in the visible first band, they can be removed by high values in this band. Let the maximum value of the first band of the visible band be B1max, then take [B1max—T1, B1max] as the threshold interval and remove the pixels contained within it by masking. For water features, the common normalized difference water index (NDWI) was used to enhance the water information in the images, and then T2 was set to remove the mask for pixels with NDWI > T2. For vegetation features, the normalized difference vegetation index (NDVI) was calculated to enhance the vegetation information, and T3 was set to remove the mask from pixels with NDVI > T3. The thresholds T1, T2, and T3 were set to 0.1, 0.2, and 0.8, respectively, considering the study area. Figure 3 designs the methodological flowchart about ASTER data pre-processing and spectral feature enhancement in this study.
3.4. Principal Component Analysis Methods for Spectral Feature Enhancement
The principal component analysis is a primary method for extracting remote sensing alteration information. The main component analysis method analyses all bands of a multi-spectral image in the visible-shortwave-infrared region in order to generate a series of principal components, then determines the top features of alteration information based on the spectral characteristics of the target alteration and the eigenvector matrix and, finally, uses processing methods, such as threshold segmentation and color synthesis, to highlight the abnormal alteration information in the principal components [40]. Crosta and Moore first applied an improved PCA method to extract iron-stained and mud-stained alteration information and mineralogical mapping from residual soils in the western subtropical region of Minas Gerais, Brazil [41]. Since then, the Crosta technique has been widely used to extract iron-stained and mud-stained alteration information from remotely sensed images and has been improved in the process [42,43]. However, as the actual mineral spectral features of the ASTER data are not prominent and fit poorly with the typical rock reflectance spectral components extracted in the laboratory, the Crosta method is heavily disturbed by topography in the extraction and weak information is challenging to remove.
Therefore, based on the Crosta method, this paper proposes a spectral feature enhancement using the principal component analysis (EPCA) method to suppress the influence of topography and enhance weak information. A total of nine bands of VNIR and SWIR from ASTER remote sensing images were selected to determine the spectral range of the ratio enhancement process based on the characteristic spectra of minerals to determine the interval with the most remarkable change in slope, as well as the reflection peak and absorption valley on the curve. The ratio of the reflection peak and absorption valley is used to enhance the spectral differences of various lithologies as the principal component in concert with the Crosta method for the combination of alteration EPCA analysis, color synthesis with appropriate band ratios, and threshold segmentation using the threshold method combined with the base map to form images of iron-stained alterations, magnesium hydroxyl alterations, and aluminum hydroxyl alterations in the study area, highlighting alteration information [44].
Due to the large number of images used in the study area and the selection of principal components being a complex mechanical operation, following the basic principles of principal component analysis, the spectrally enhanced band results with the initial nine bands of ASTER images were used as ten variables to construct a 93 × 10 matrix (Equations (1) and (2)) for the 93 scenes of the study area, which was transformed to a 10 × 10 matrix (Equations (3) and (4)) by principal component transformation. An EPCA model was written in R to automatically select PC1, PC2, PC3, and PC4 for each image scene and to determine the primary contribution sources for principal component analysis.
Using ASTER image data as sample information, Here, p represents the number of image bands and n represents the number of frames used, and observing p variables X1, X2, …, Xp, the data information array for n samples is
The principal component analysis combines p observed variables into p new variables (composite variables). That is, the dimensionality reduction process of principal component analysis.
When F satisfies the relevant conditions for principal component analysis, a 10 × 10 transformation matrix W can be constructed:
4. Results and Analysis
4.1. Extraction of Alteration Information
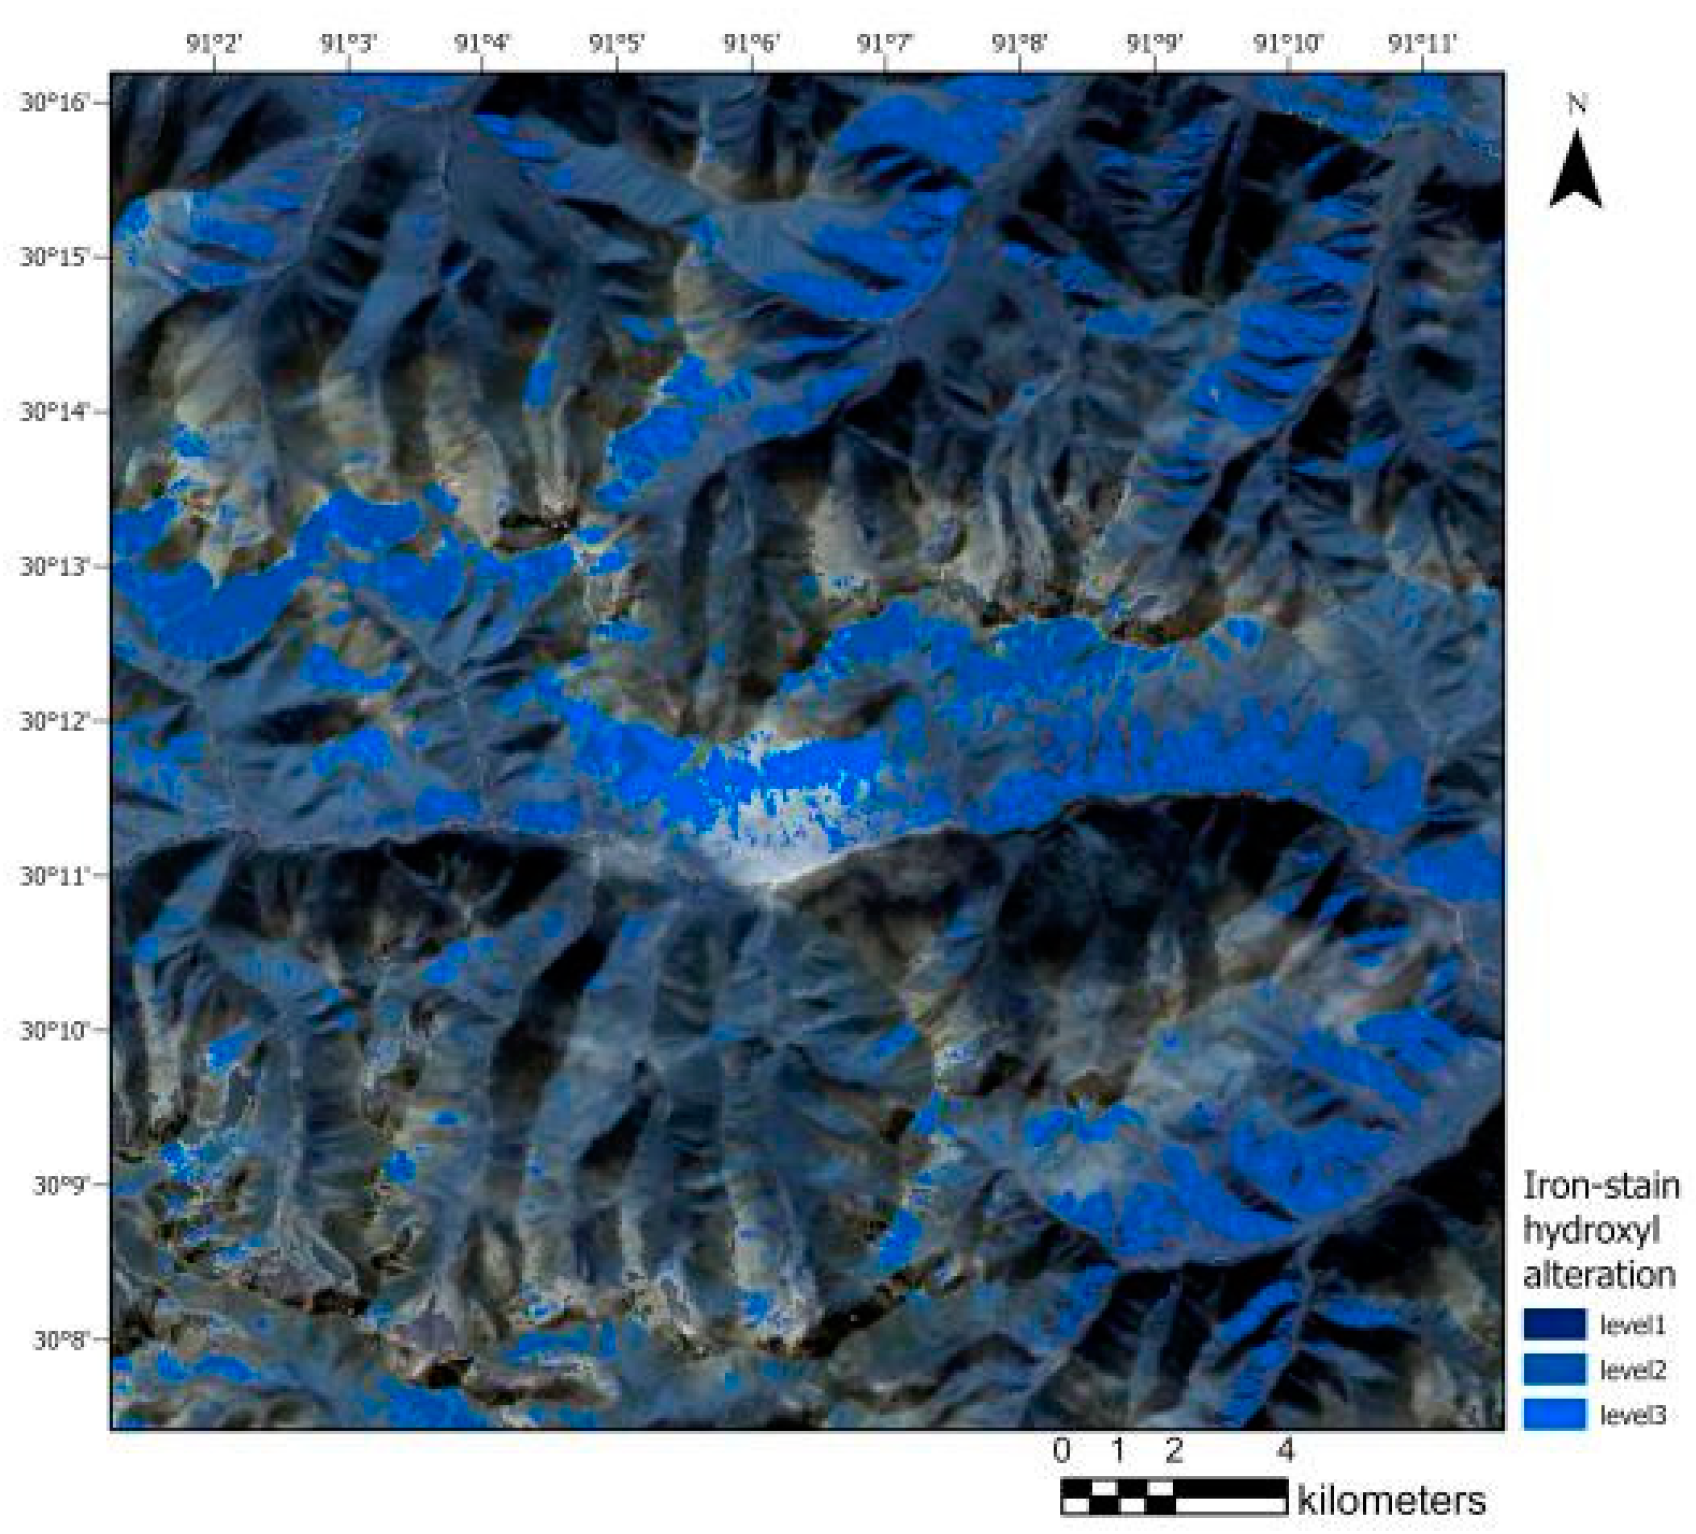
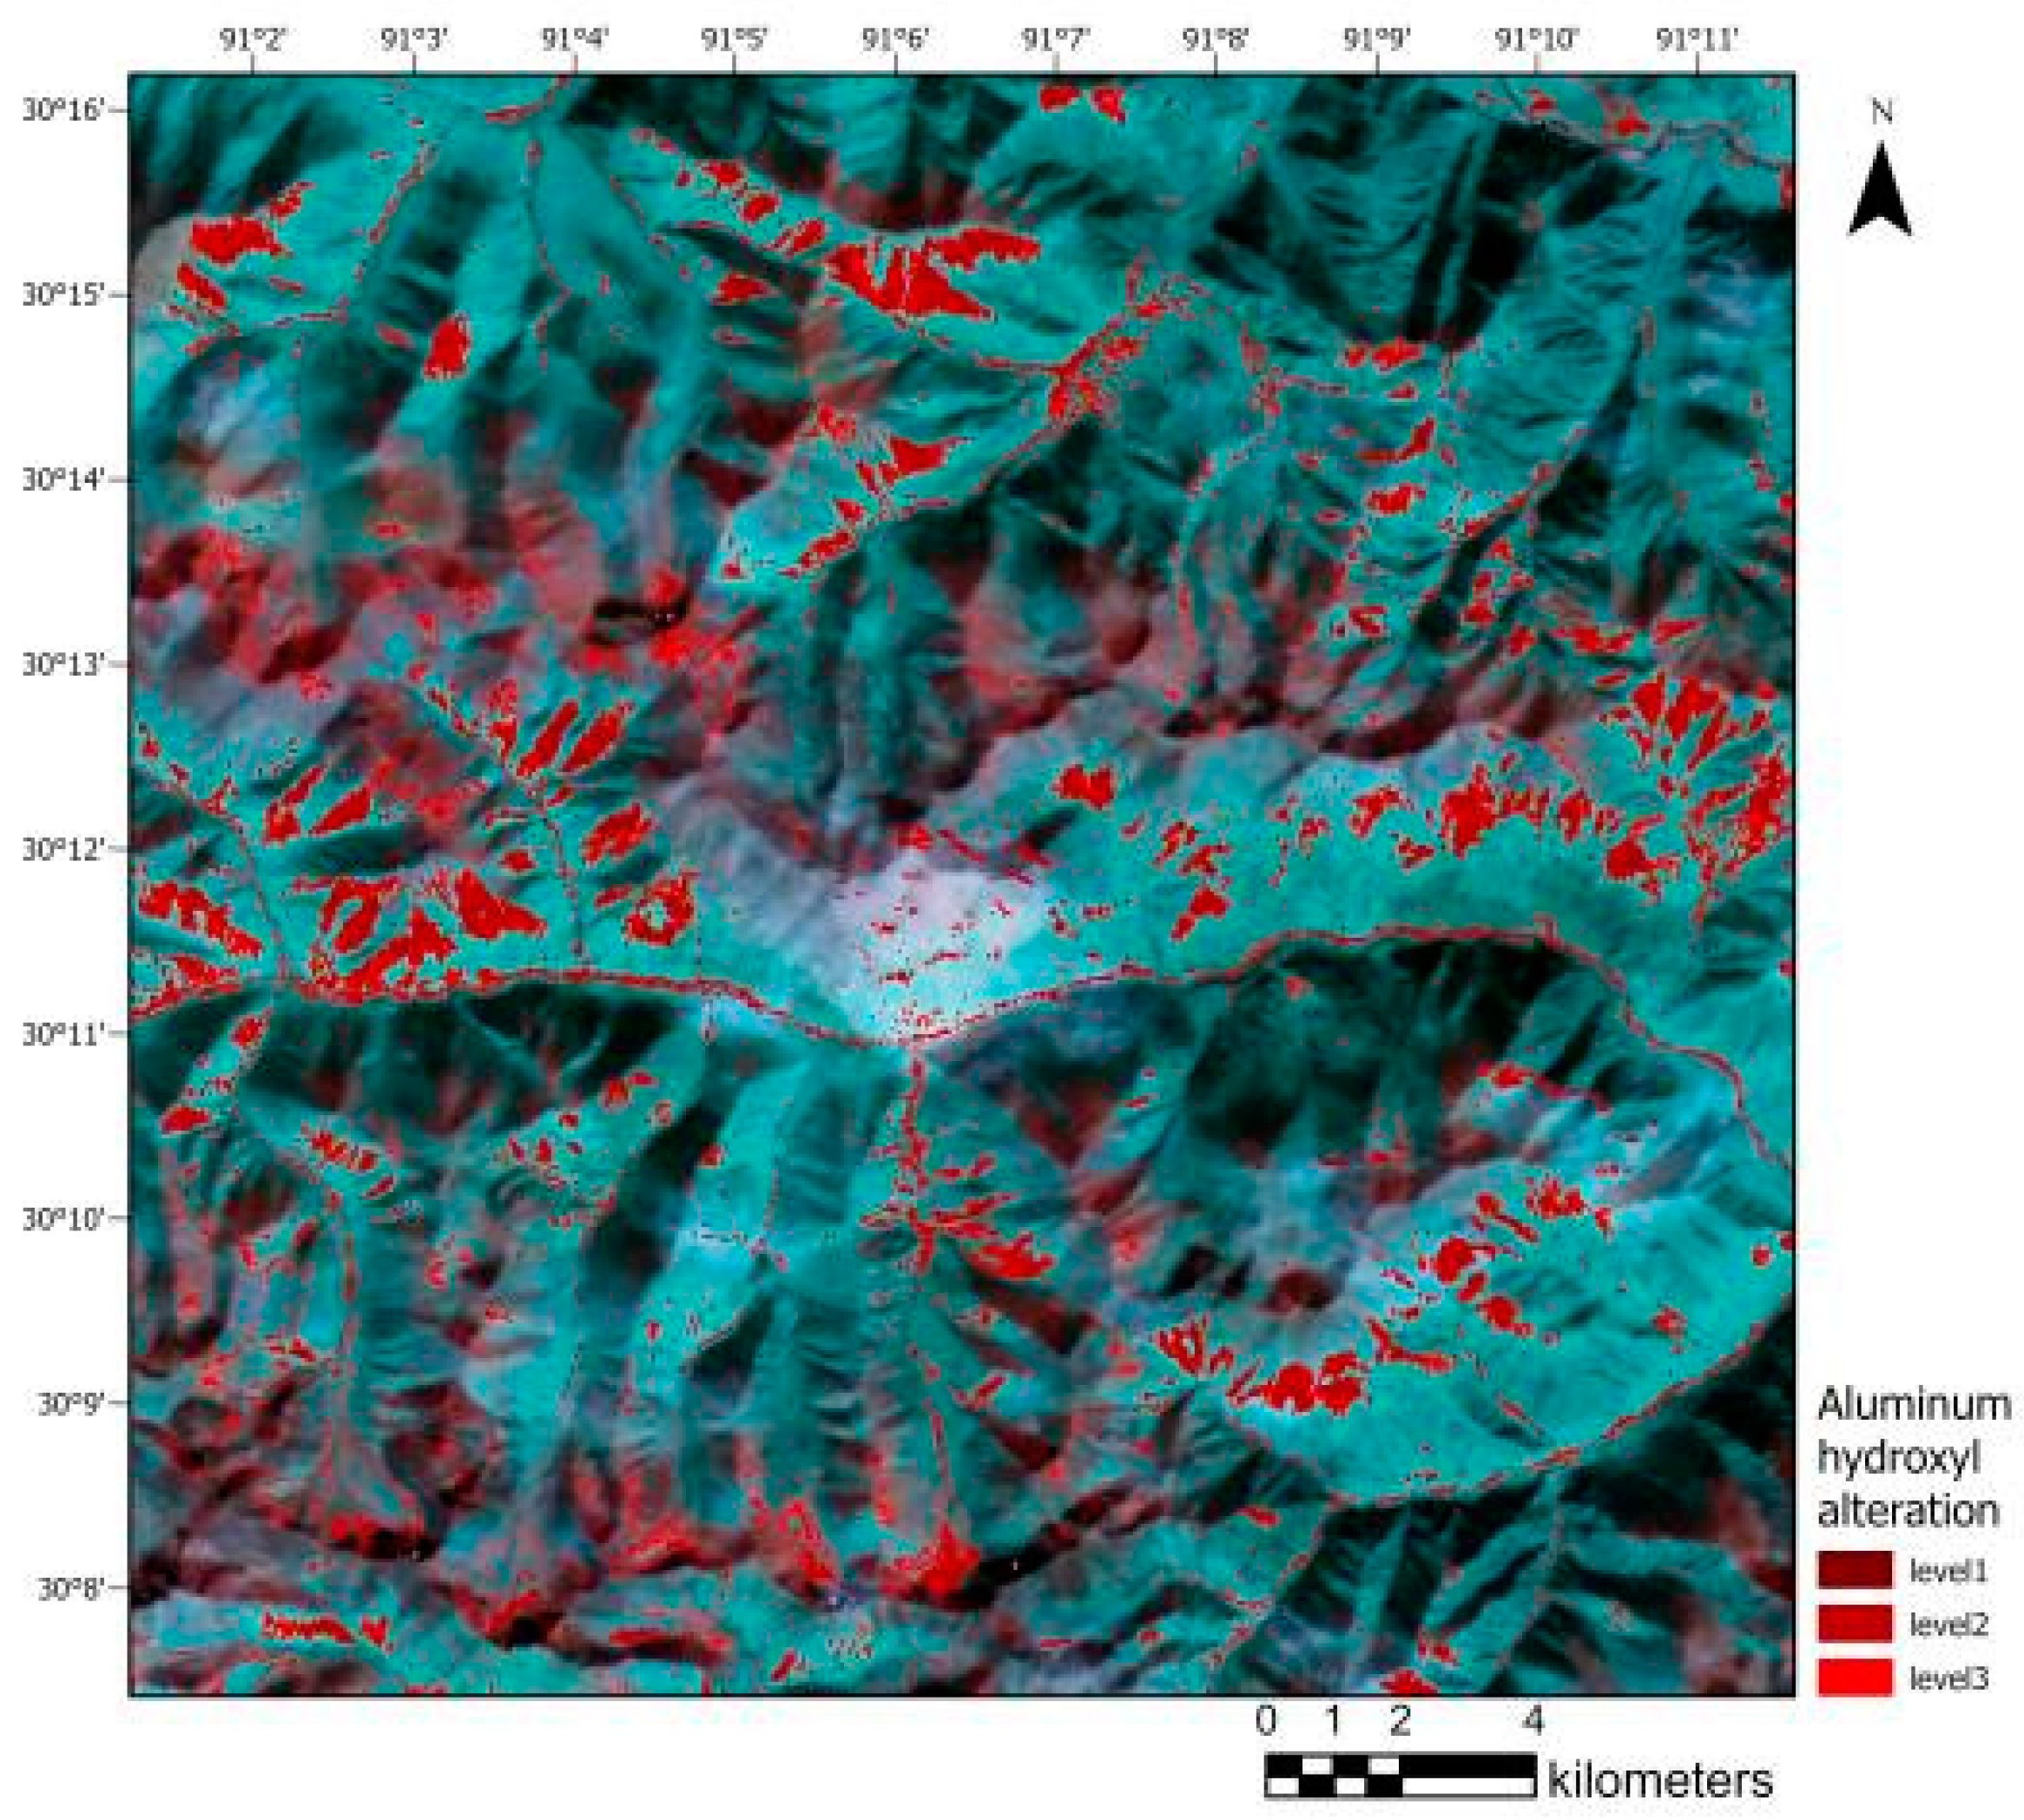
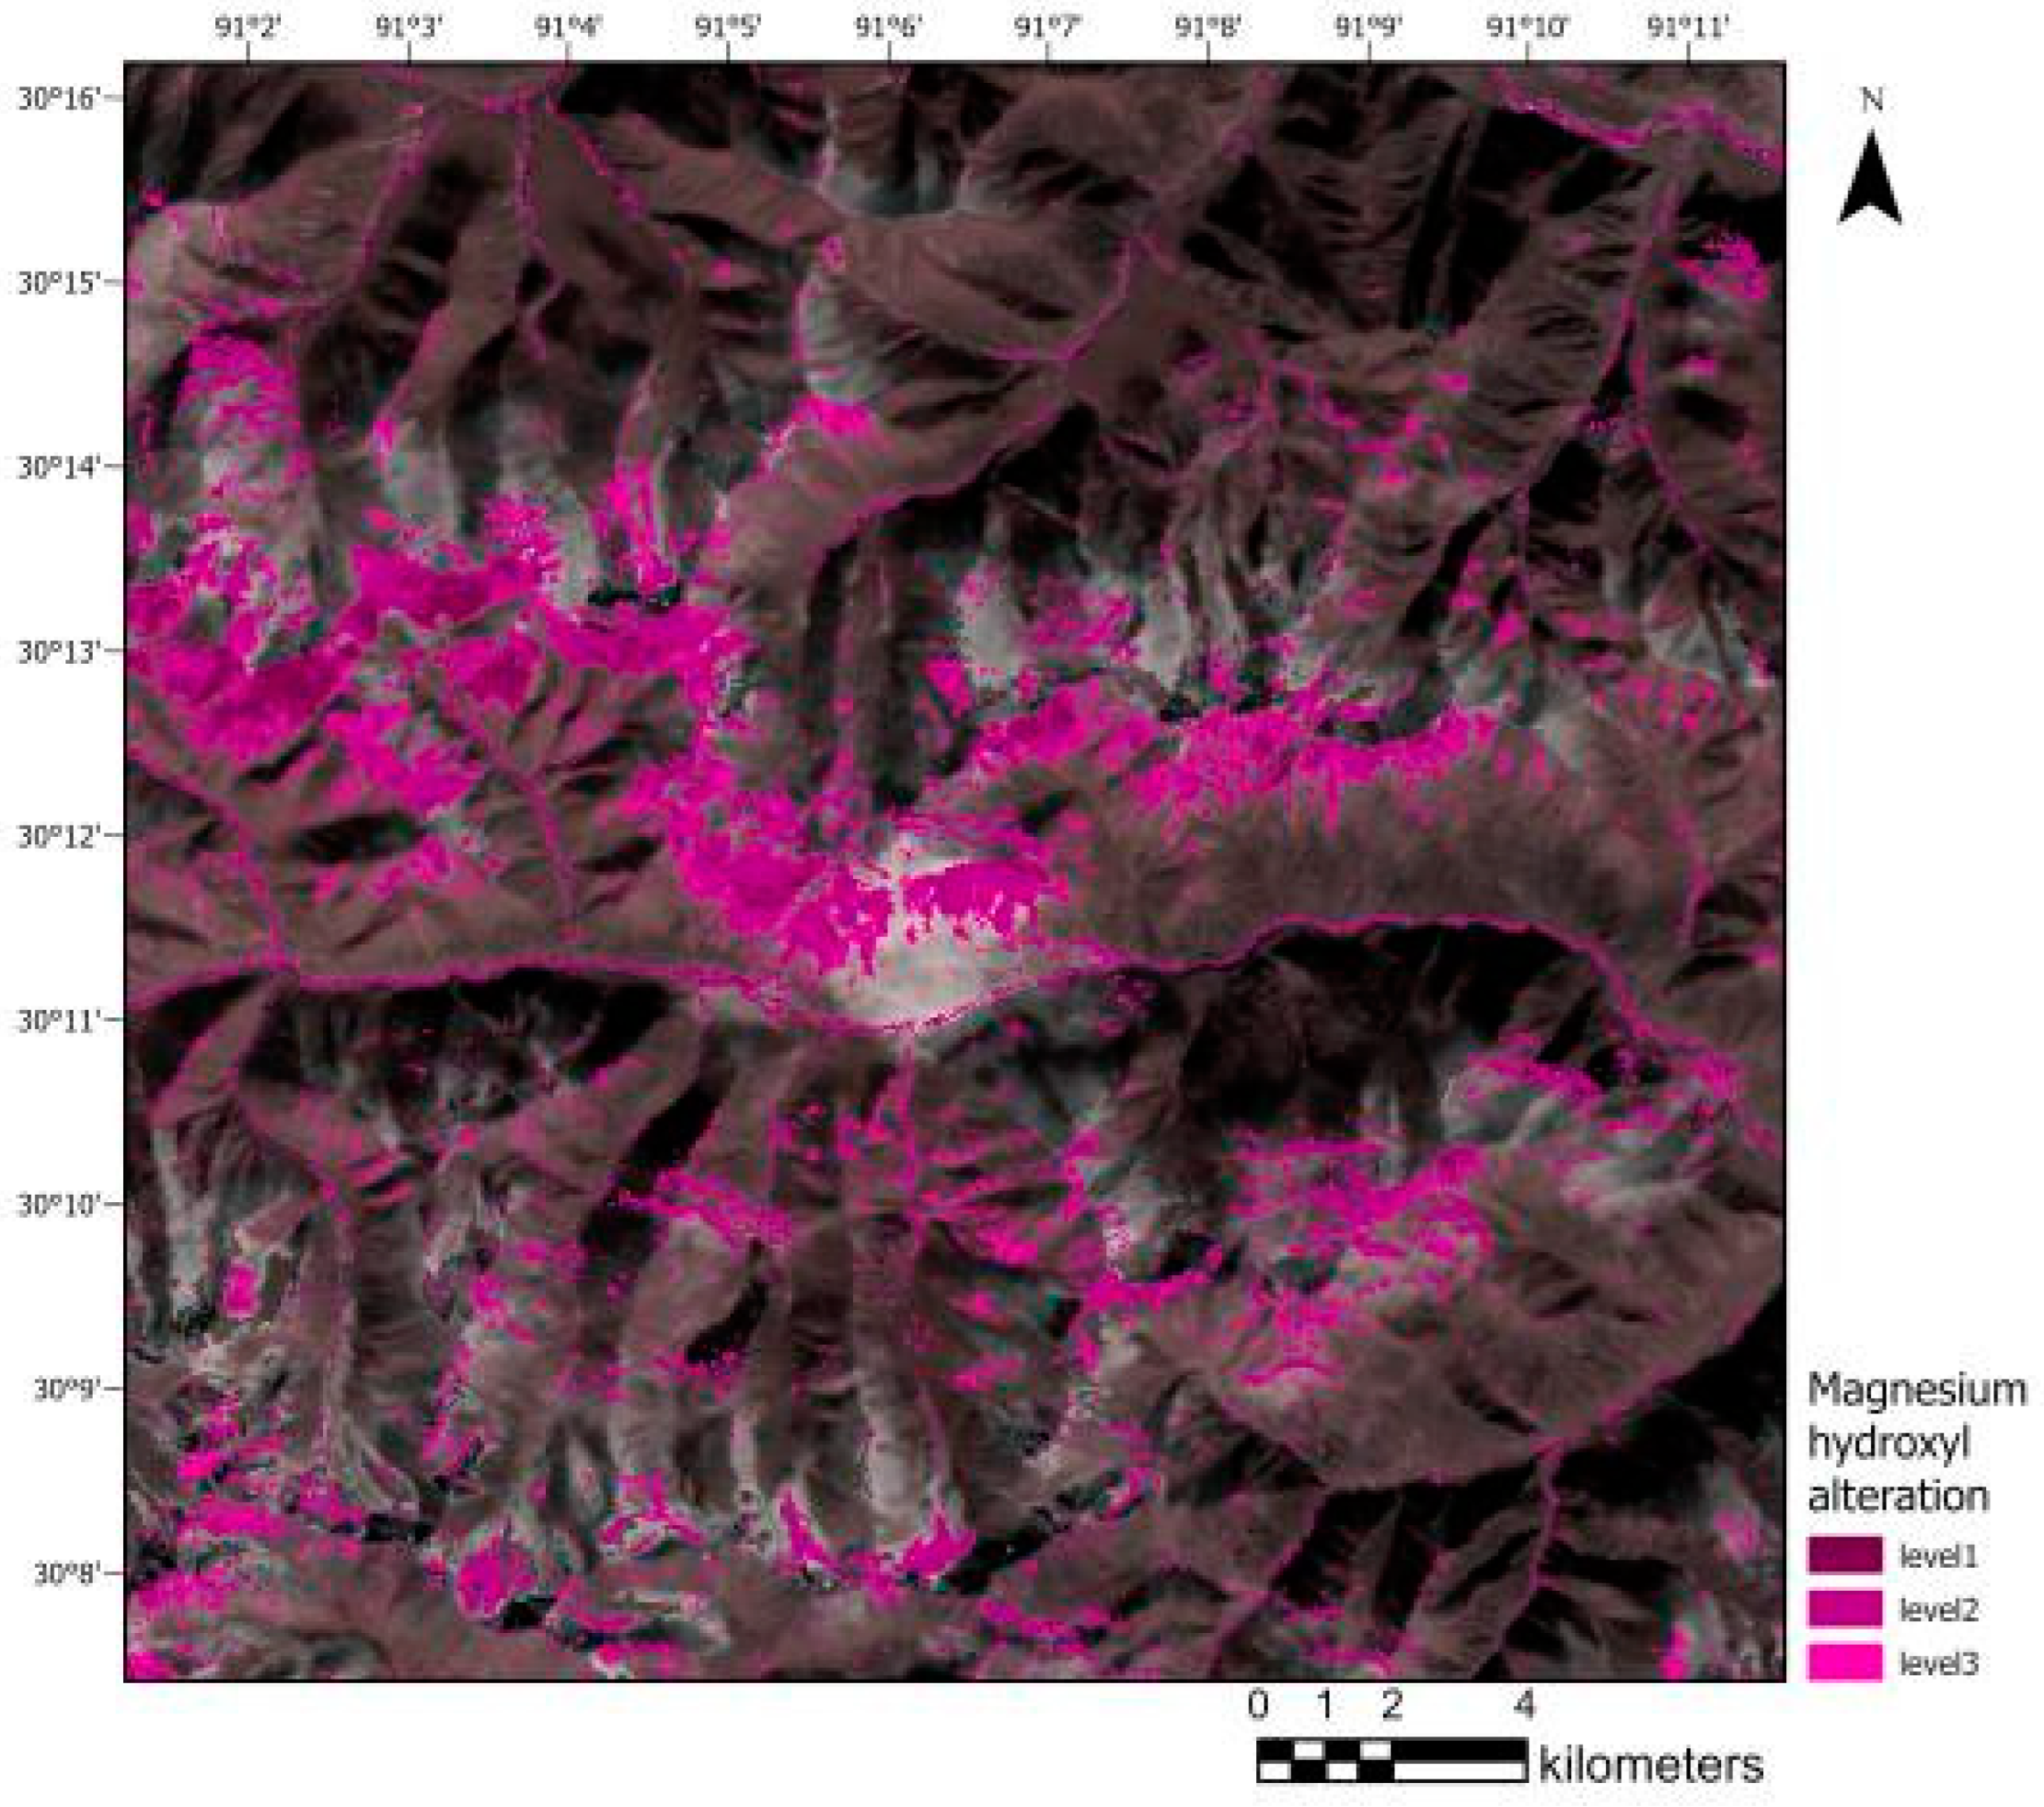
The iron-stained alteration in the ASTER data in Figure 2 shows a weak absorption valley at Band 1 and a high reflection peak at Band 2. The spectral features are first enhanced by Band 2/Band 1 and then combined with Band 2, 3, and 4 for principal component analysis, which meets the requirements of iron-stained alteration information extraction. The Al-OH-like alteration minerals represented by alunite, kaolinite, and montmorillonite corresponded to absorption valleys formed by Band 6 of ASTER images and reflection peaks created at Band 4 and Band 7, selected (Band 4 + Band 7)/Band 6 for spectral feature enhancement, and also combined with Band 4, 6, and 7 for principal component analysis. The Mg-OH-like alteration minerals, represented by chlorite and chrysoprase, have a distinct absorption valley near Band 7 and Band 8 of the ASTER data, a weak reflection peak at Band 6, and a high reflection peak at Band 9. (Band 6 + Band 9)/(Band 7 + Band 8) was calculated for spectral feature enhancement. This was combined with Band 7, 8, and 9 for principal component analysis.
To compare the results of the improved spectral feature enhanced principal component analysis (EPCA) method with the conventional Crosta method in extracting hydrothermal alteration information. The statistical analysis of the alteration information in the study area yielded 3.48%, 4.12%, and 6.89% in the study area, extracted with the conventional Crosta method, of iron-stained alteration (blue), aluminum hydroxyl alteration (yellow), and magnesium hydroxyl alteration (green), respectively. In contrast, the percentages of the three alteration results obtained by the EPCA method extraction over the study area were 8.11%, 6.80%, and 8.34%, respectively.
The further comparison of the selected study areas (Figure 4) shows that the alteration results obtained by EPCA are significantly better than those of the traditional Crosta method in terms of spatial aggregation; at the same time, the alteration results are enhanced considerably after spectral enhancement, especially the iron-stained alteration, and the three alteration results extracted by the improved EPCA method can be spatially generalized to a specific aggregation pattern, which can be integrated with multi-source geological elements through geological mineral analysis. The three alteration results extracted by the improved EPCA method can be spatially aggregated. They can be analyzed employing geological-mineralogical analysis and integrated with multi-source geological elements, which has a tremendous advantage for the subsequently incorporated mineralization exploration.
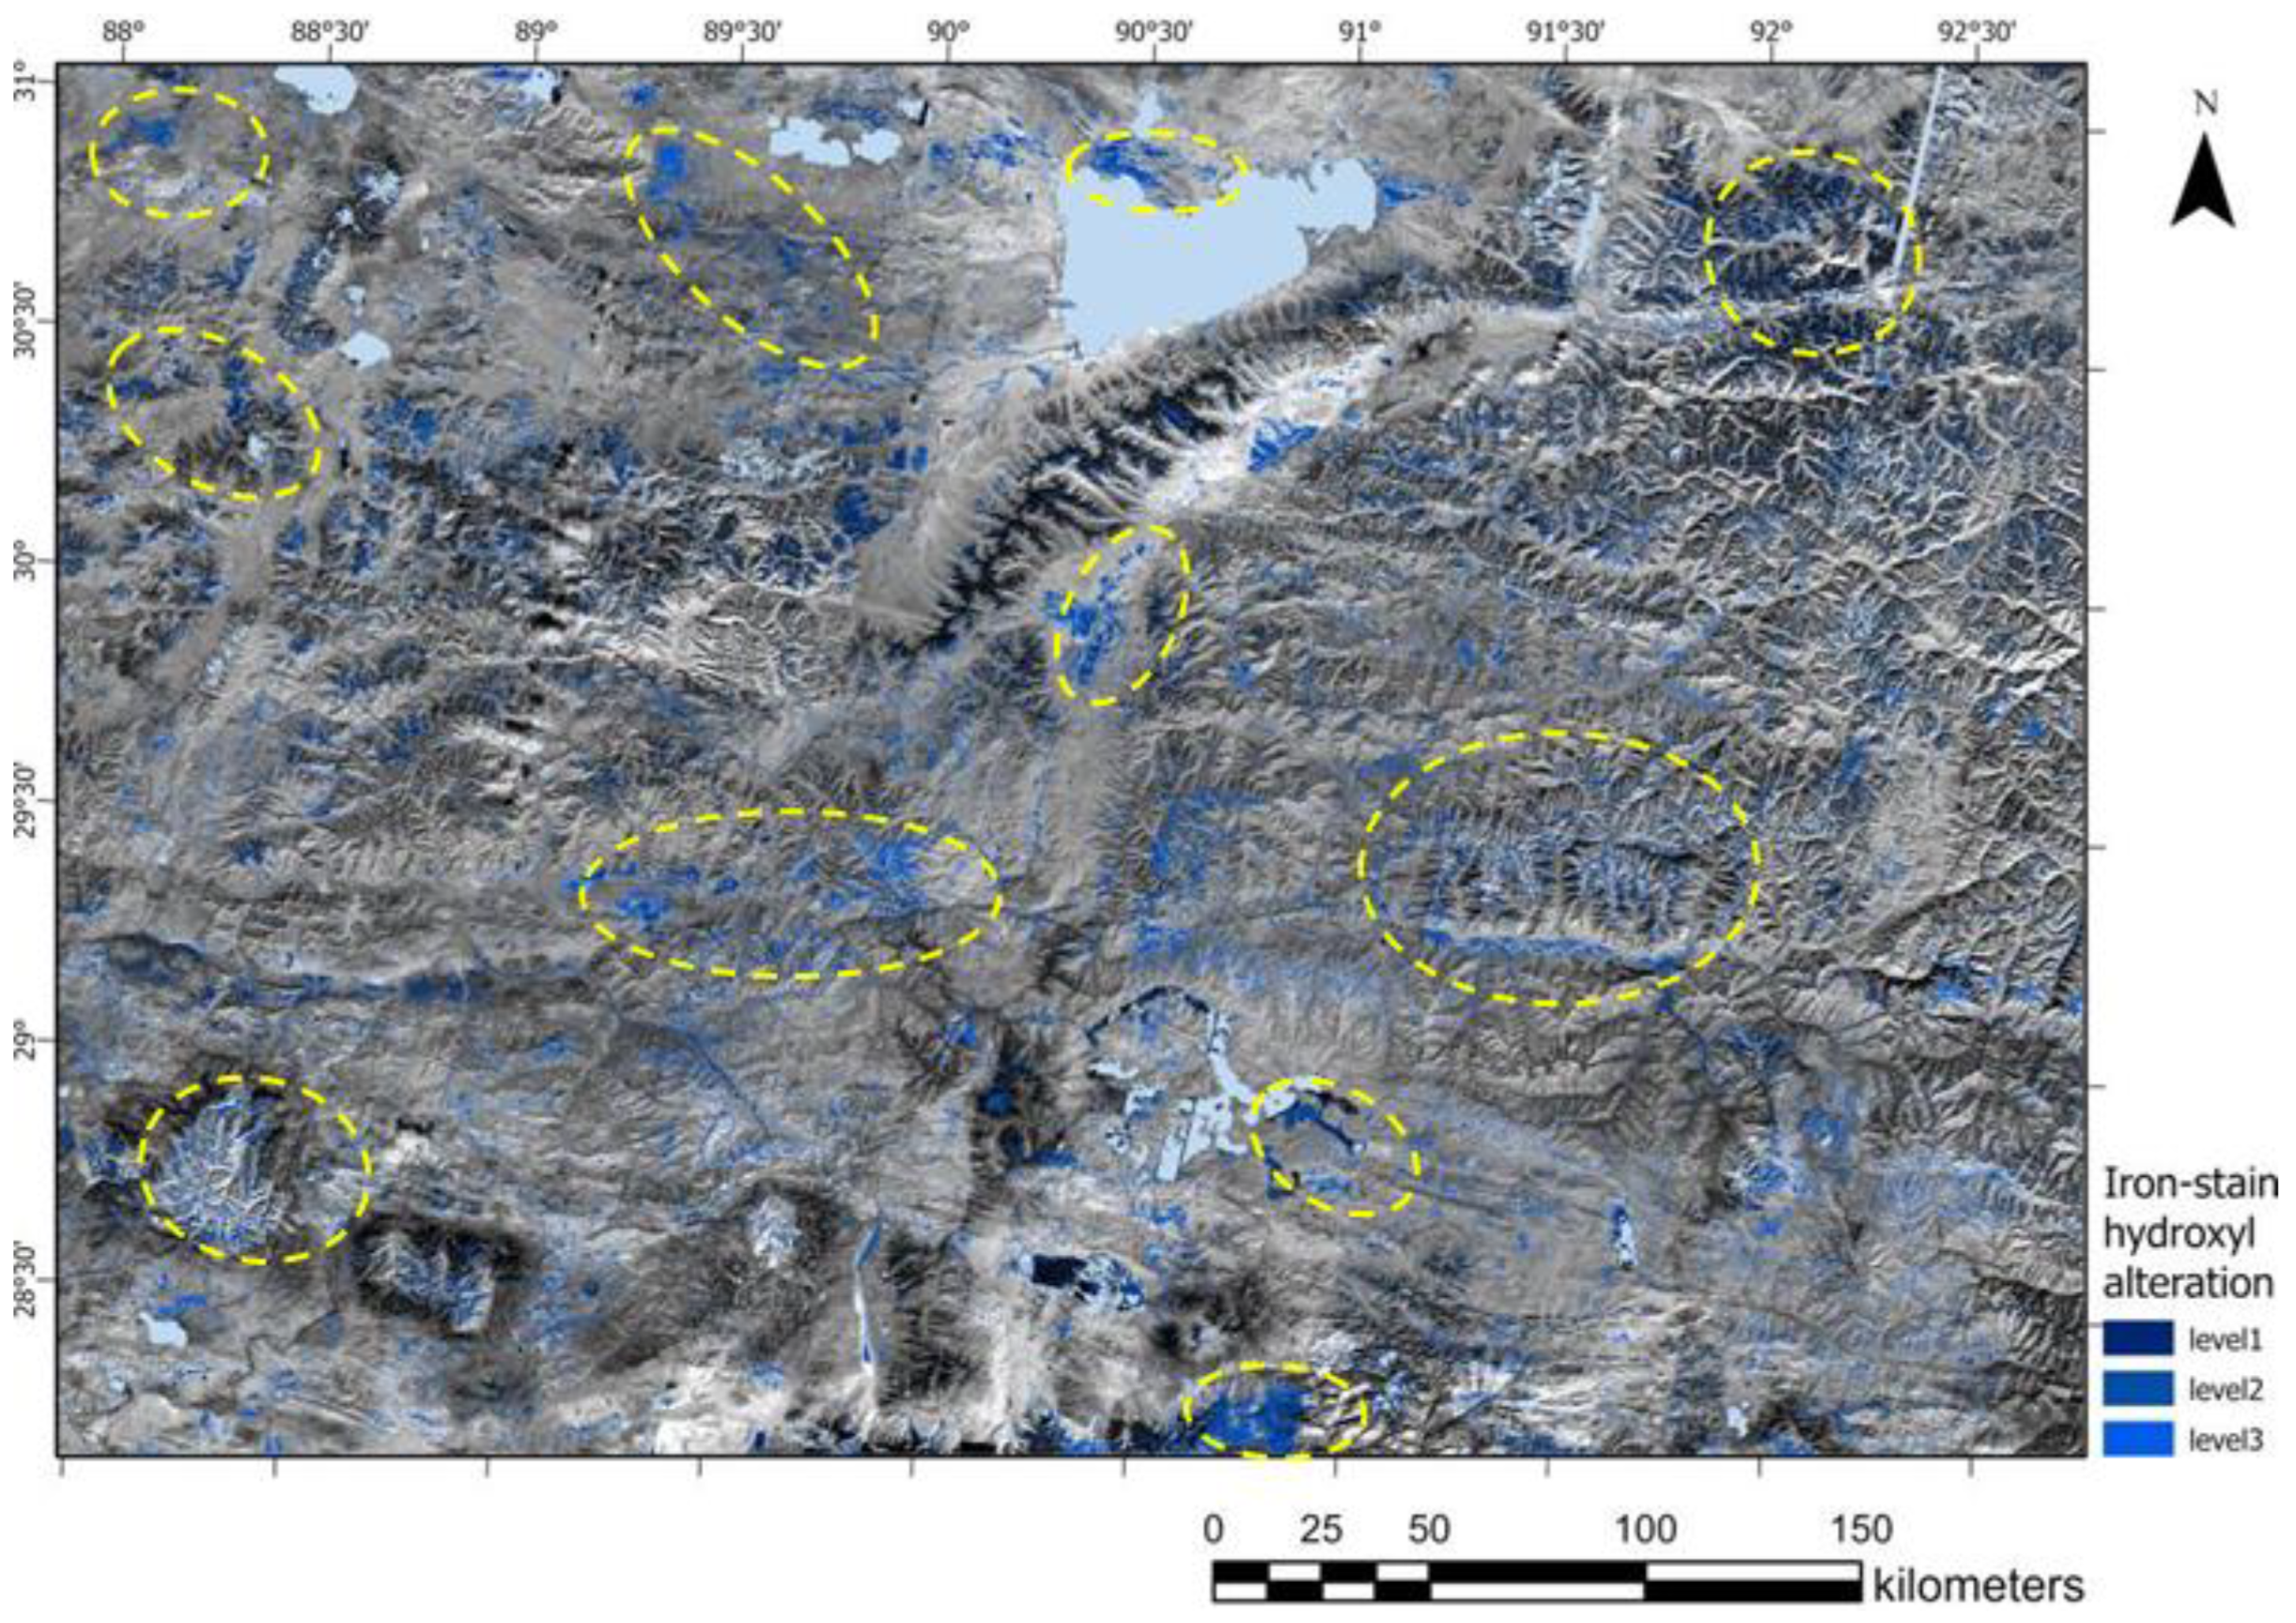
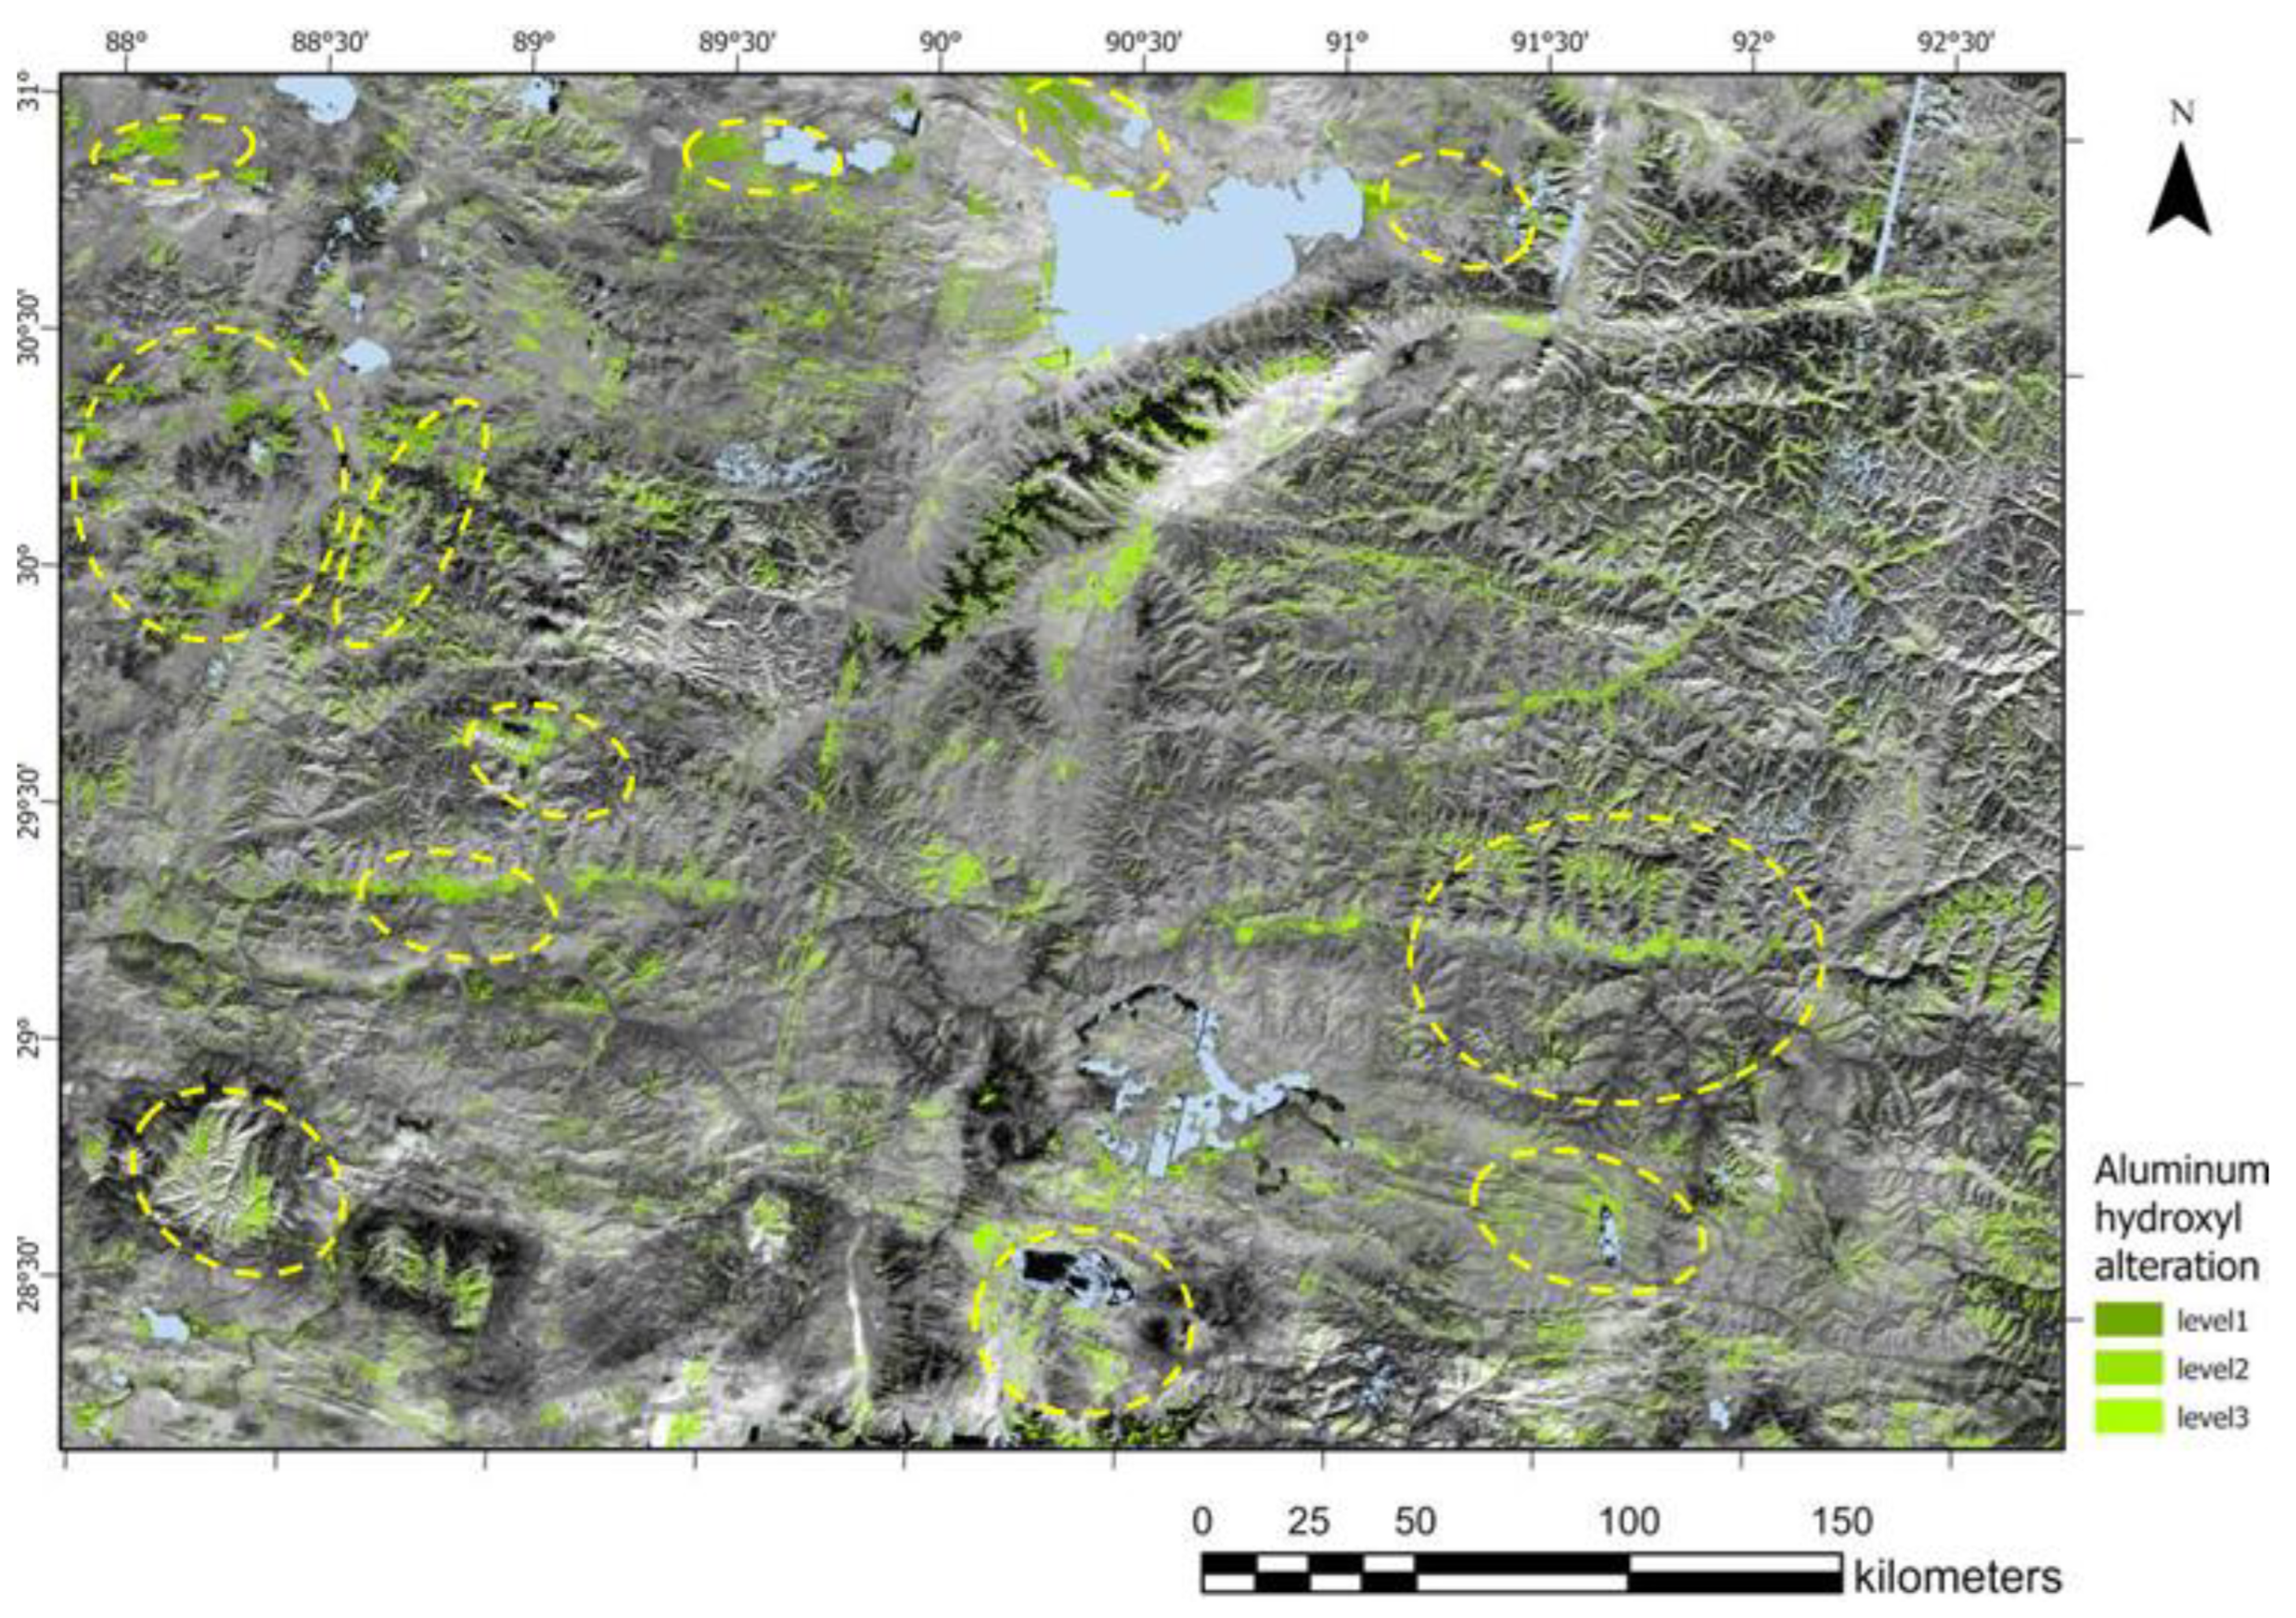
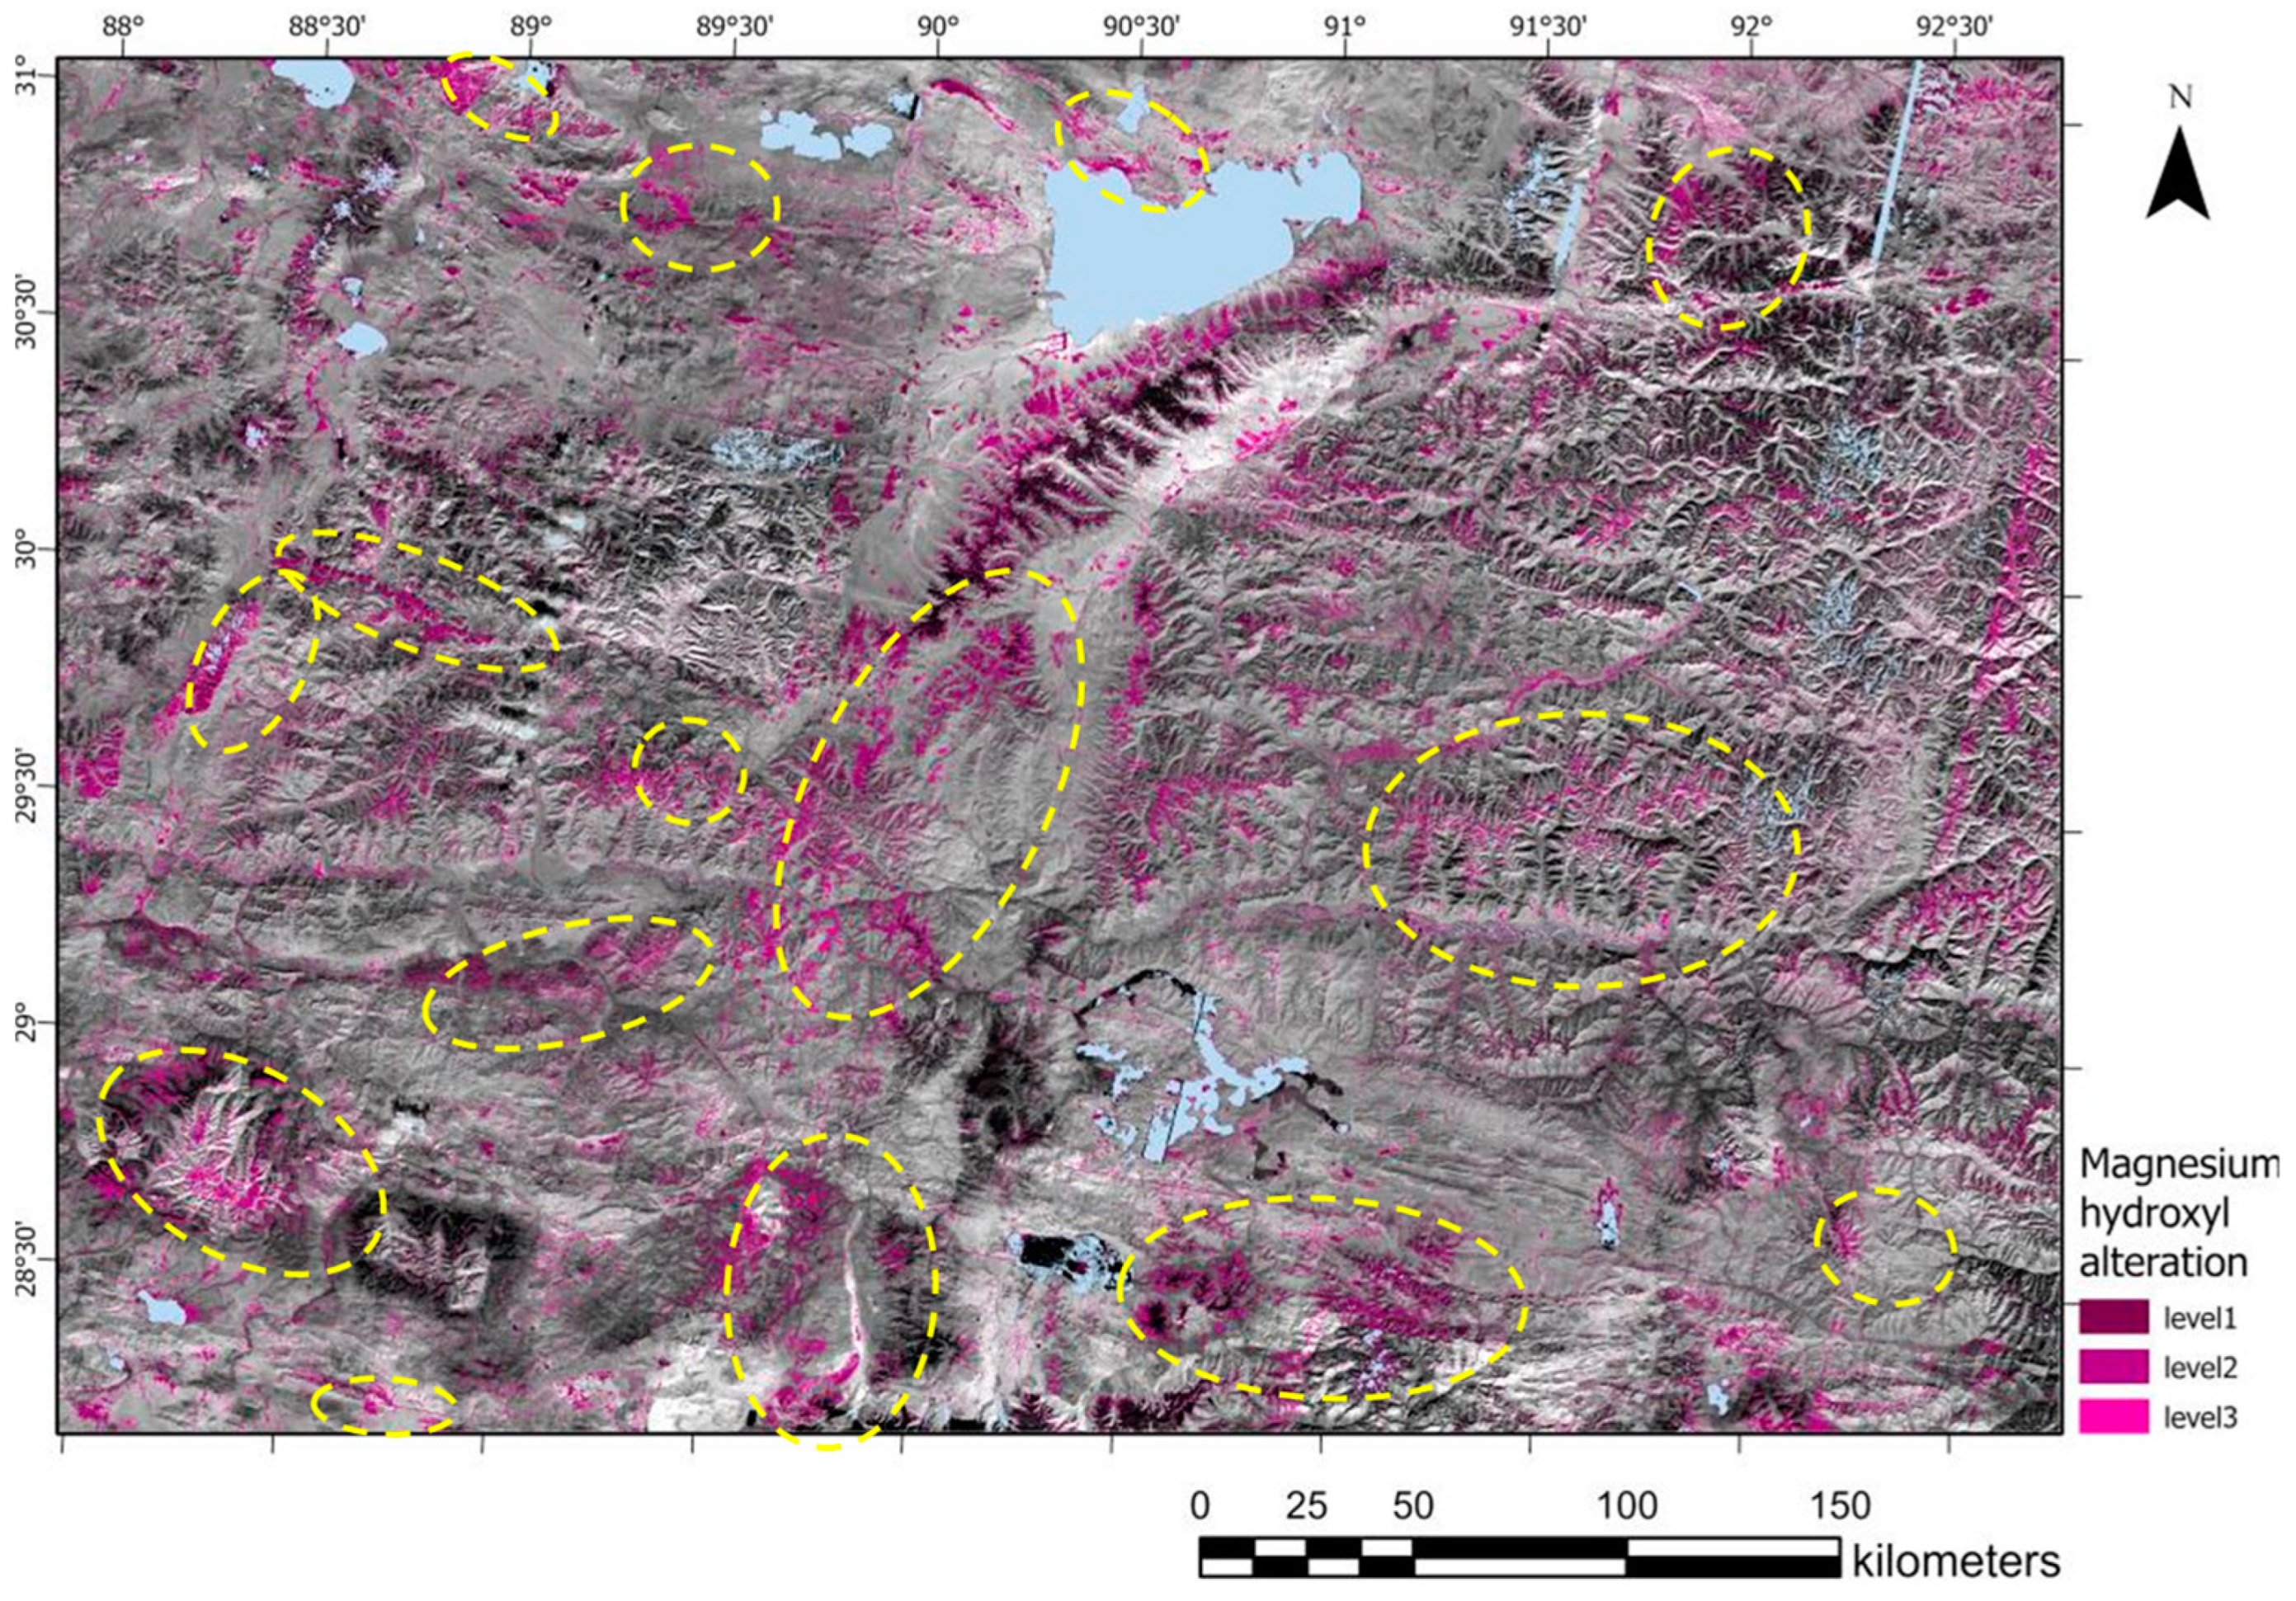
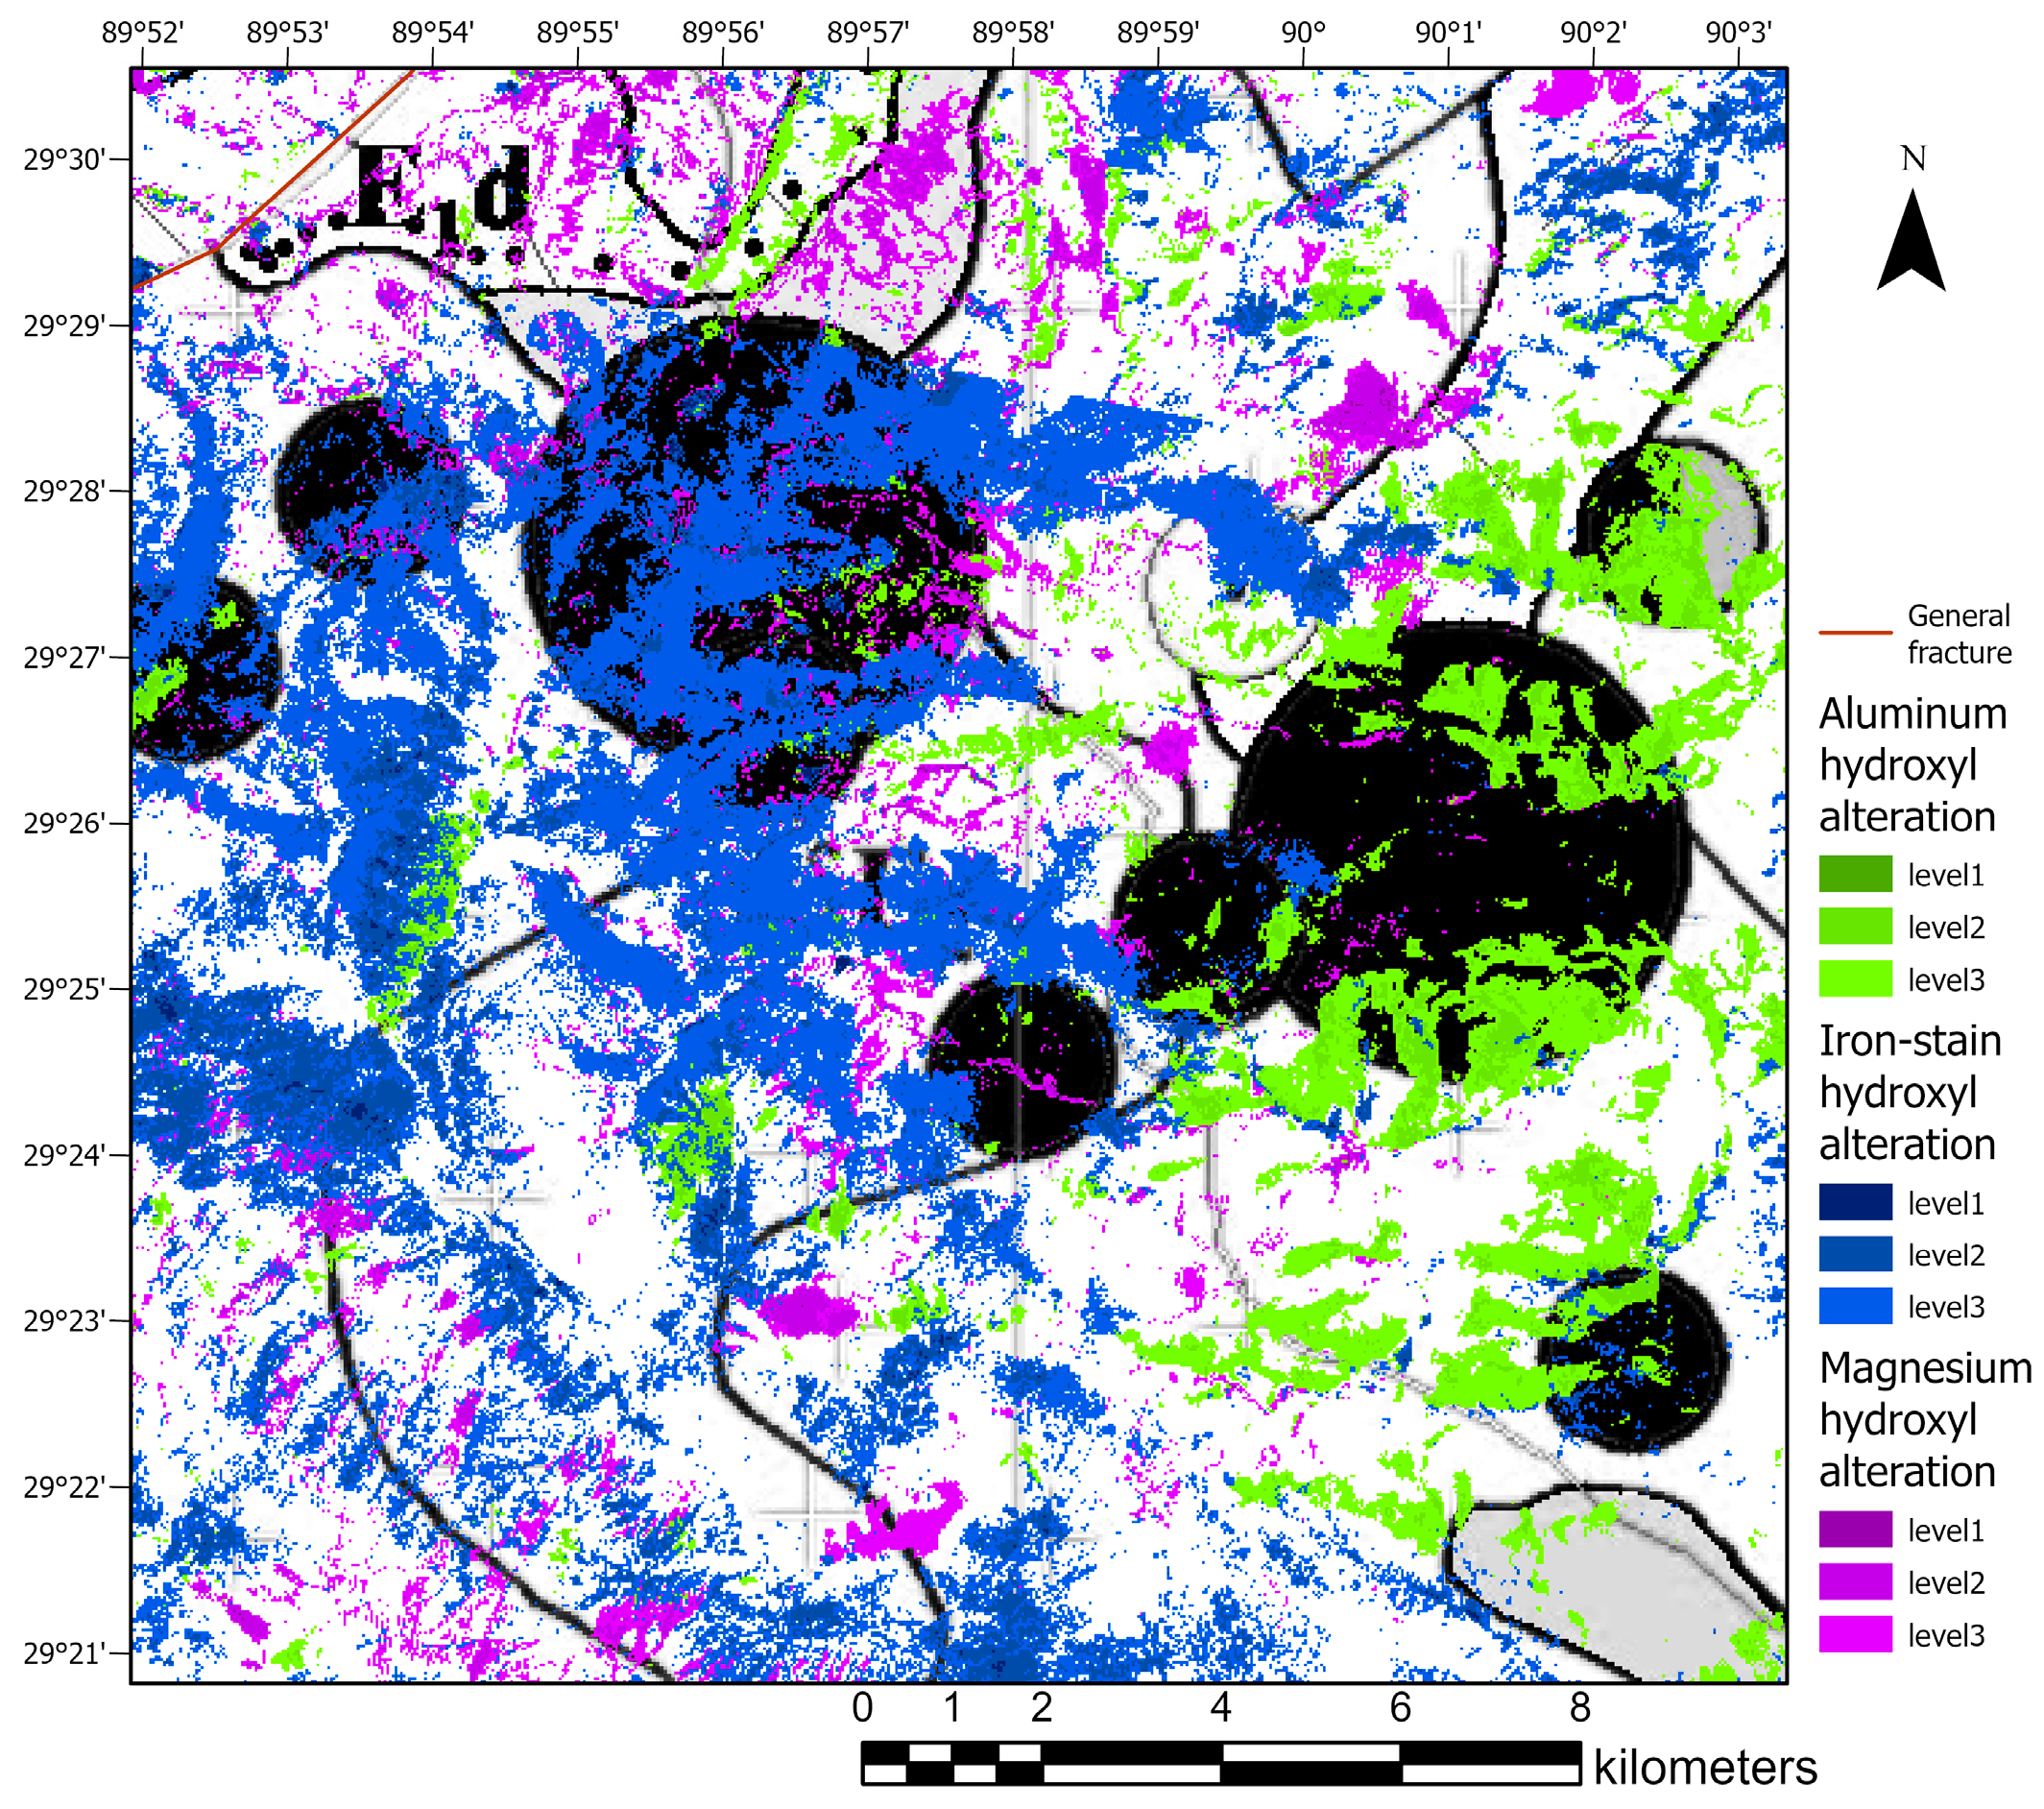
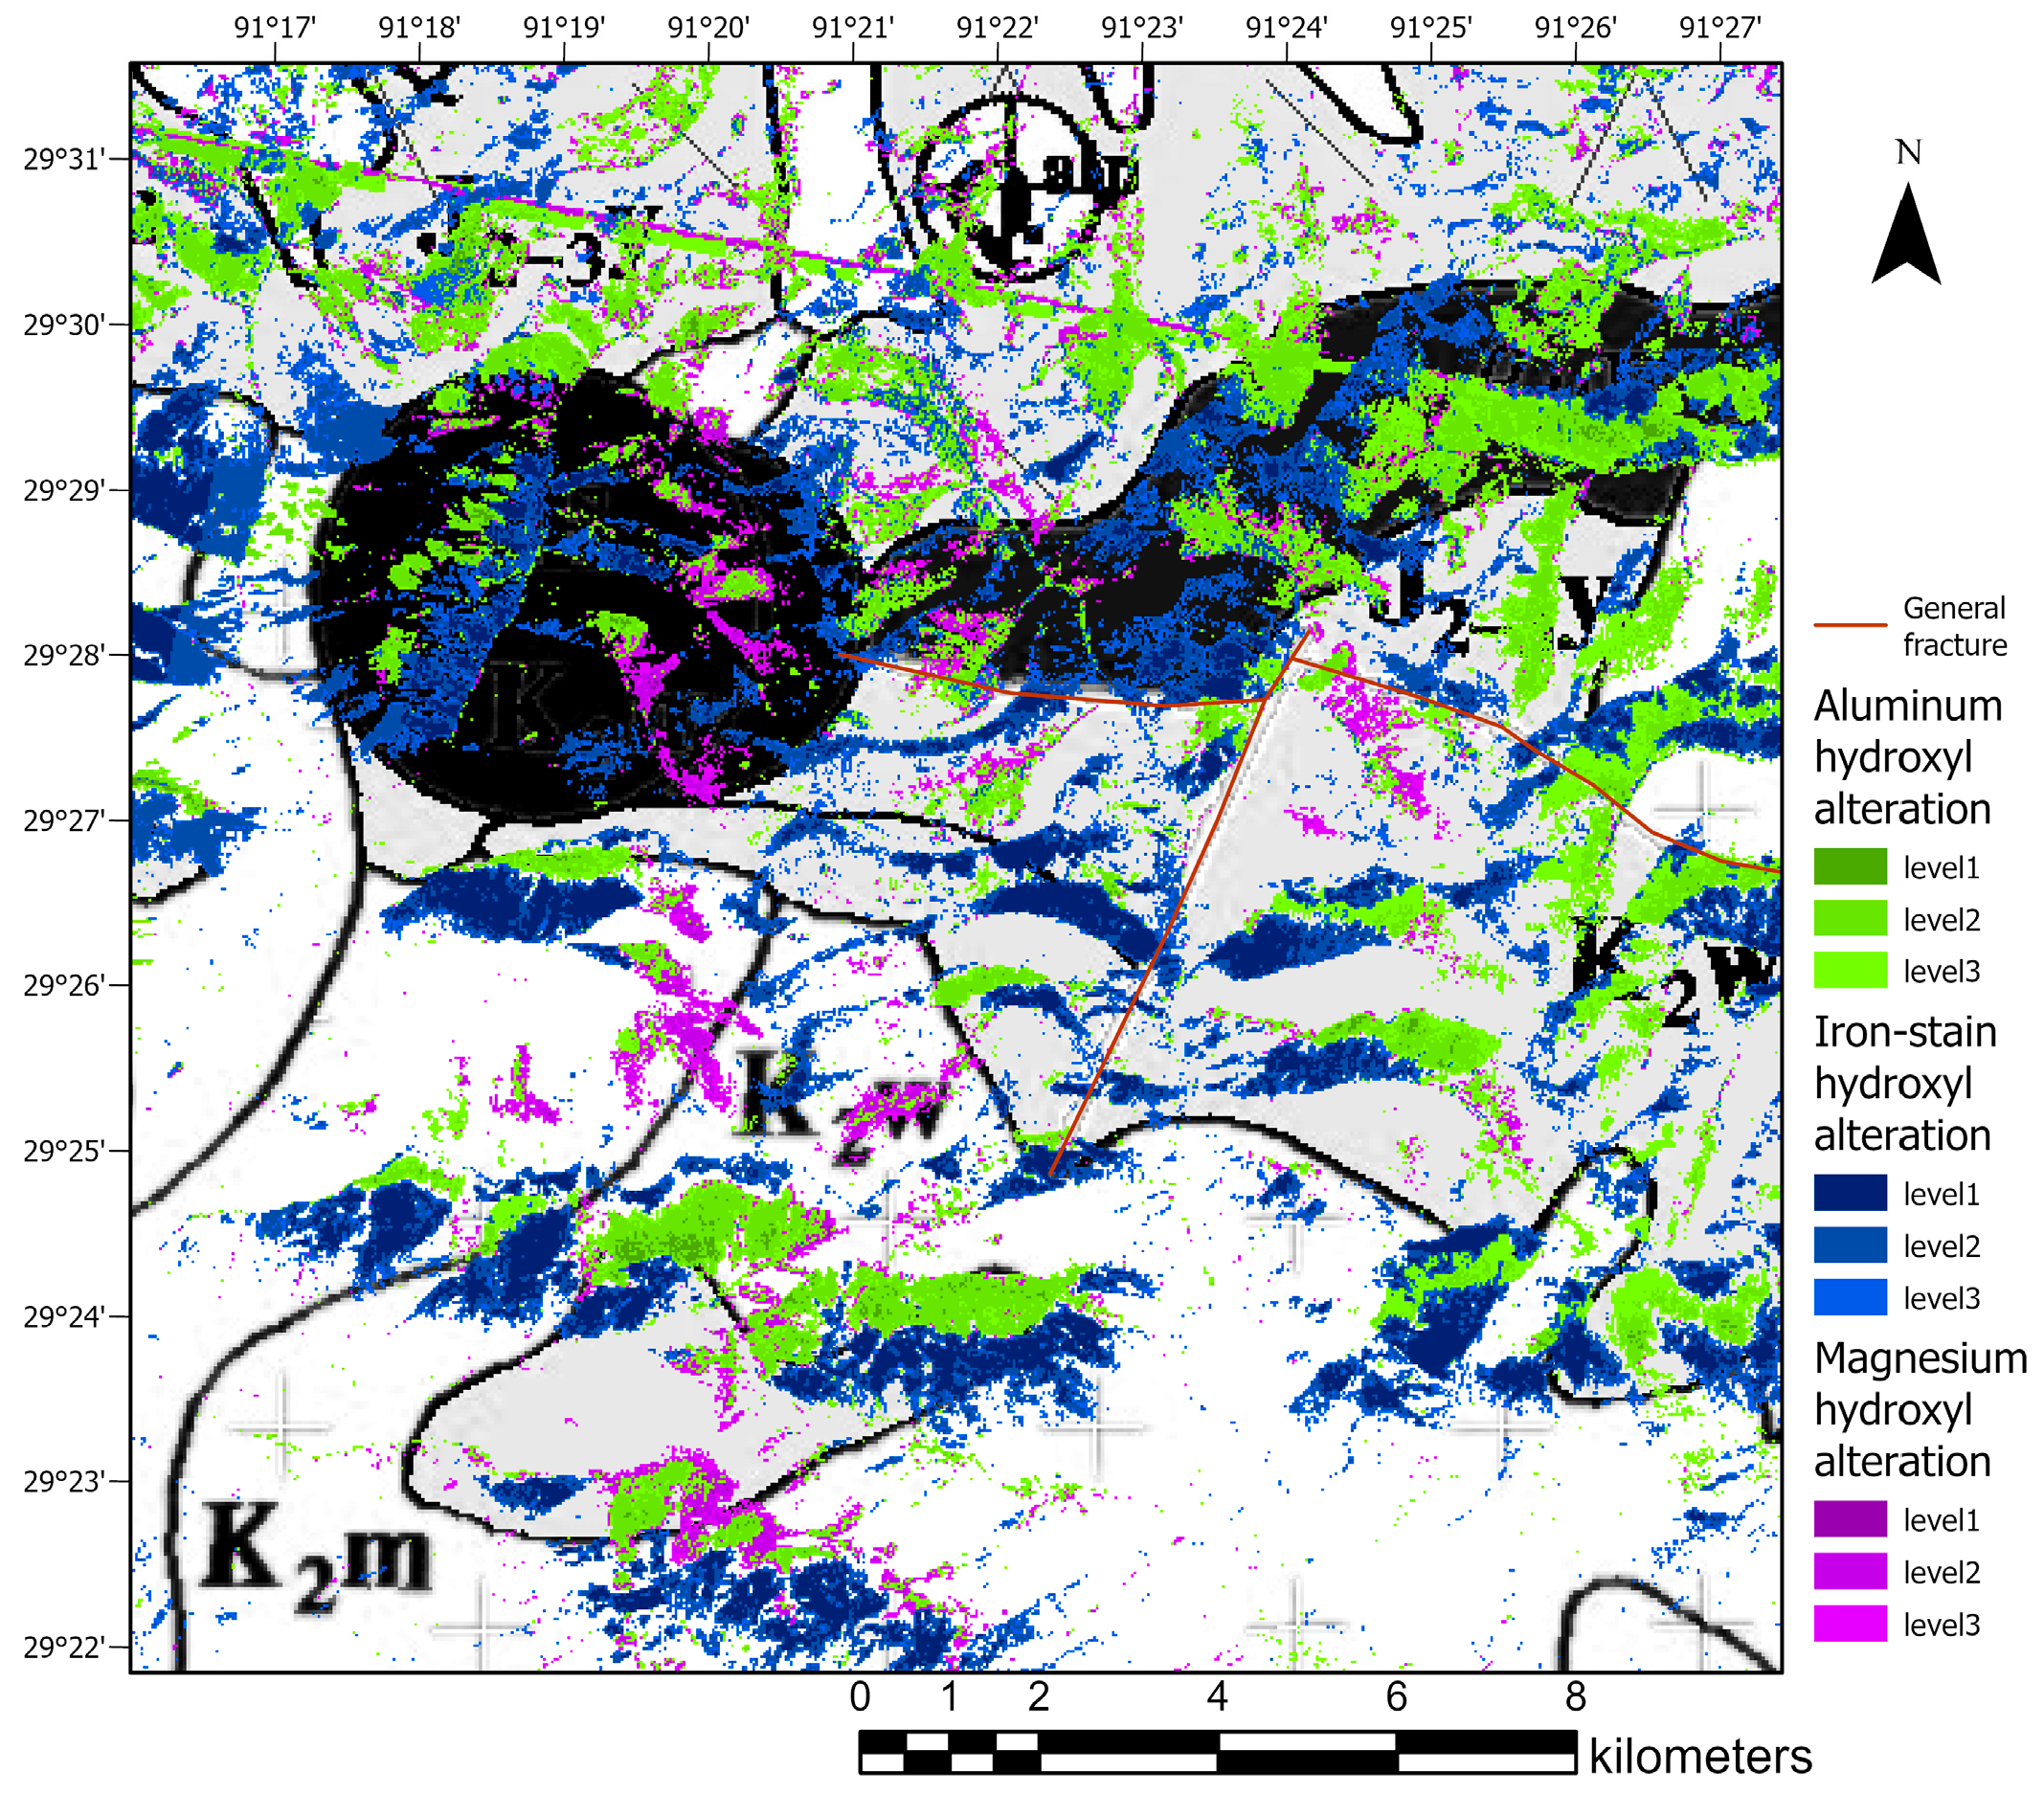
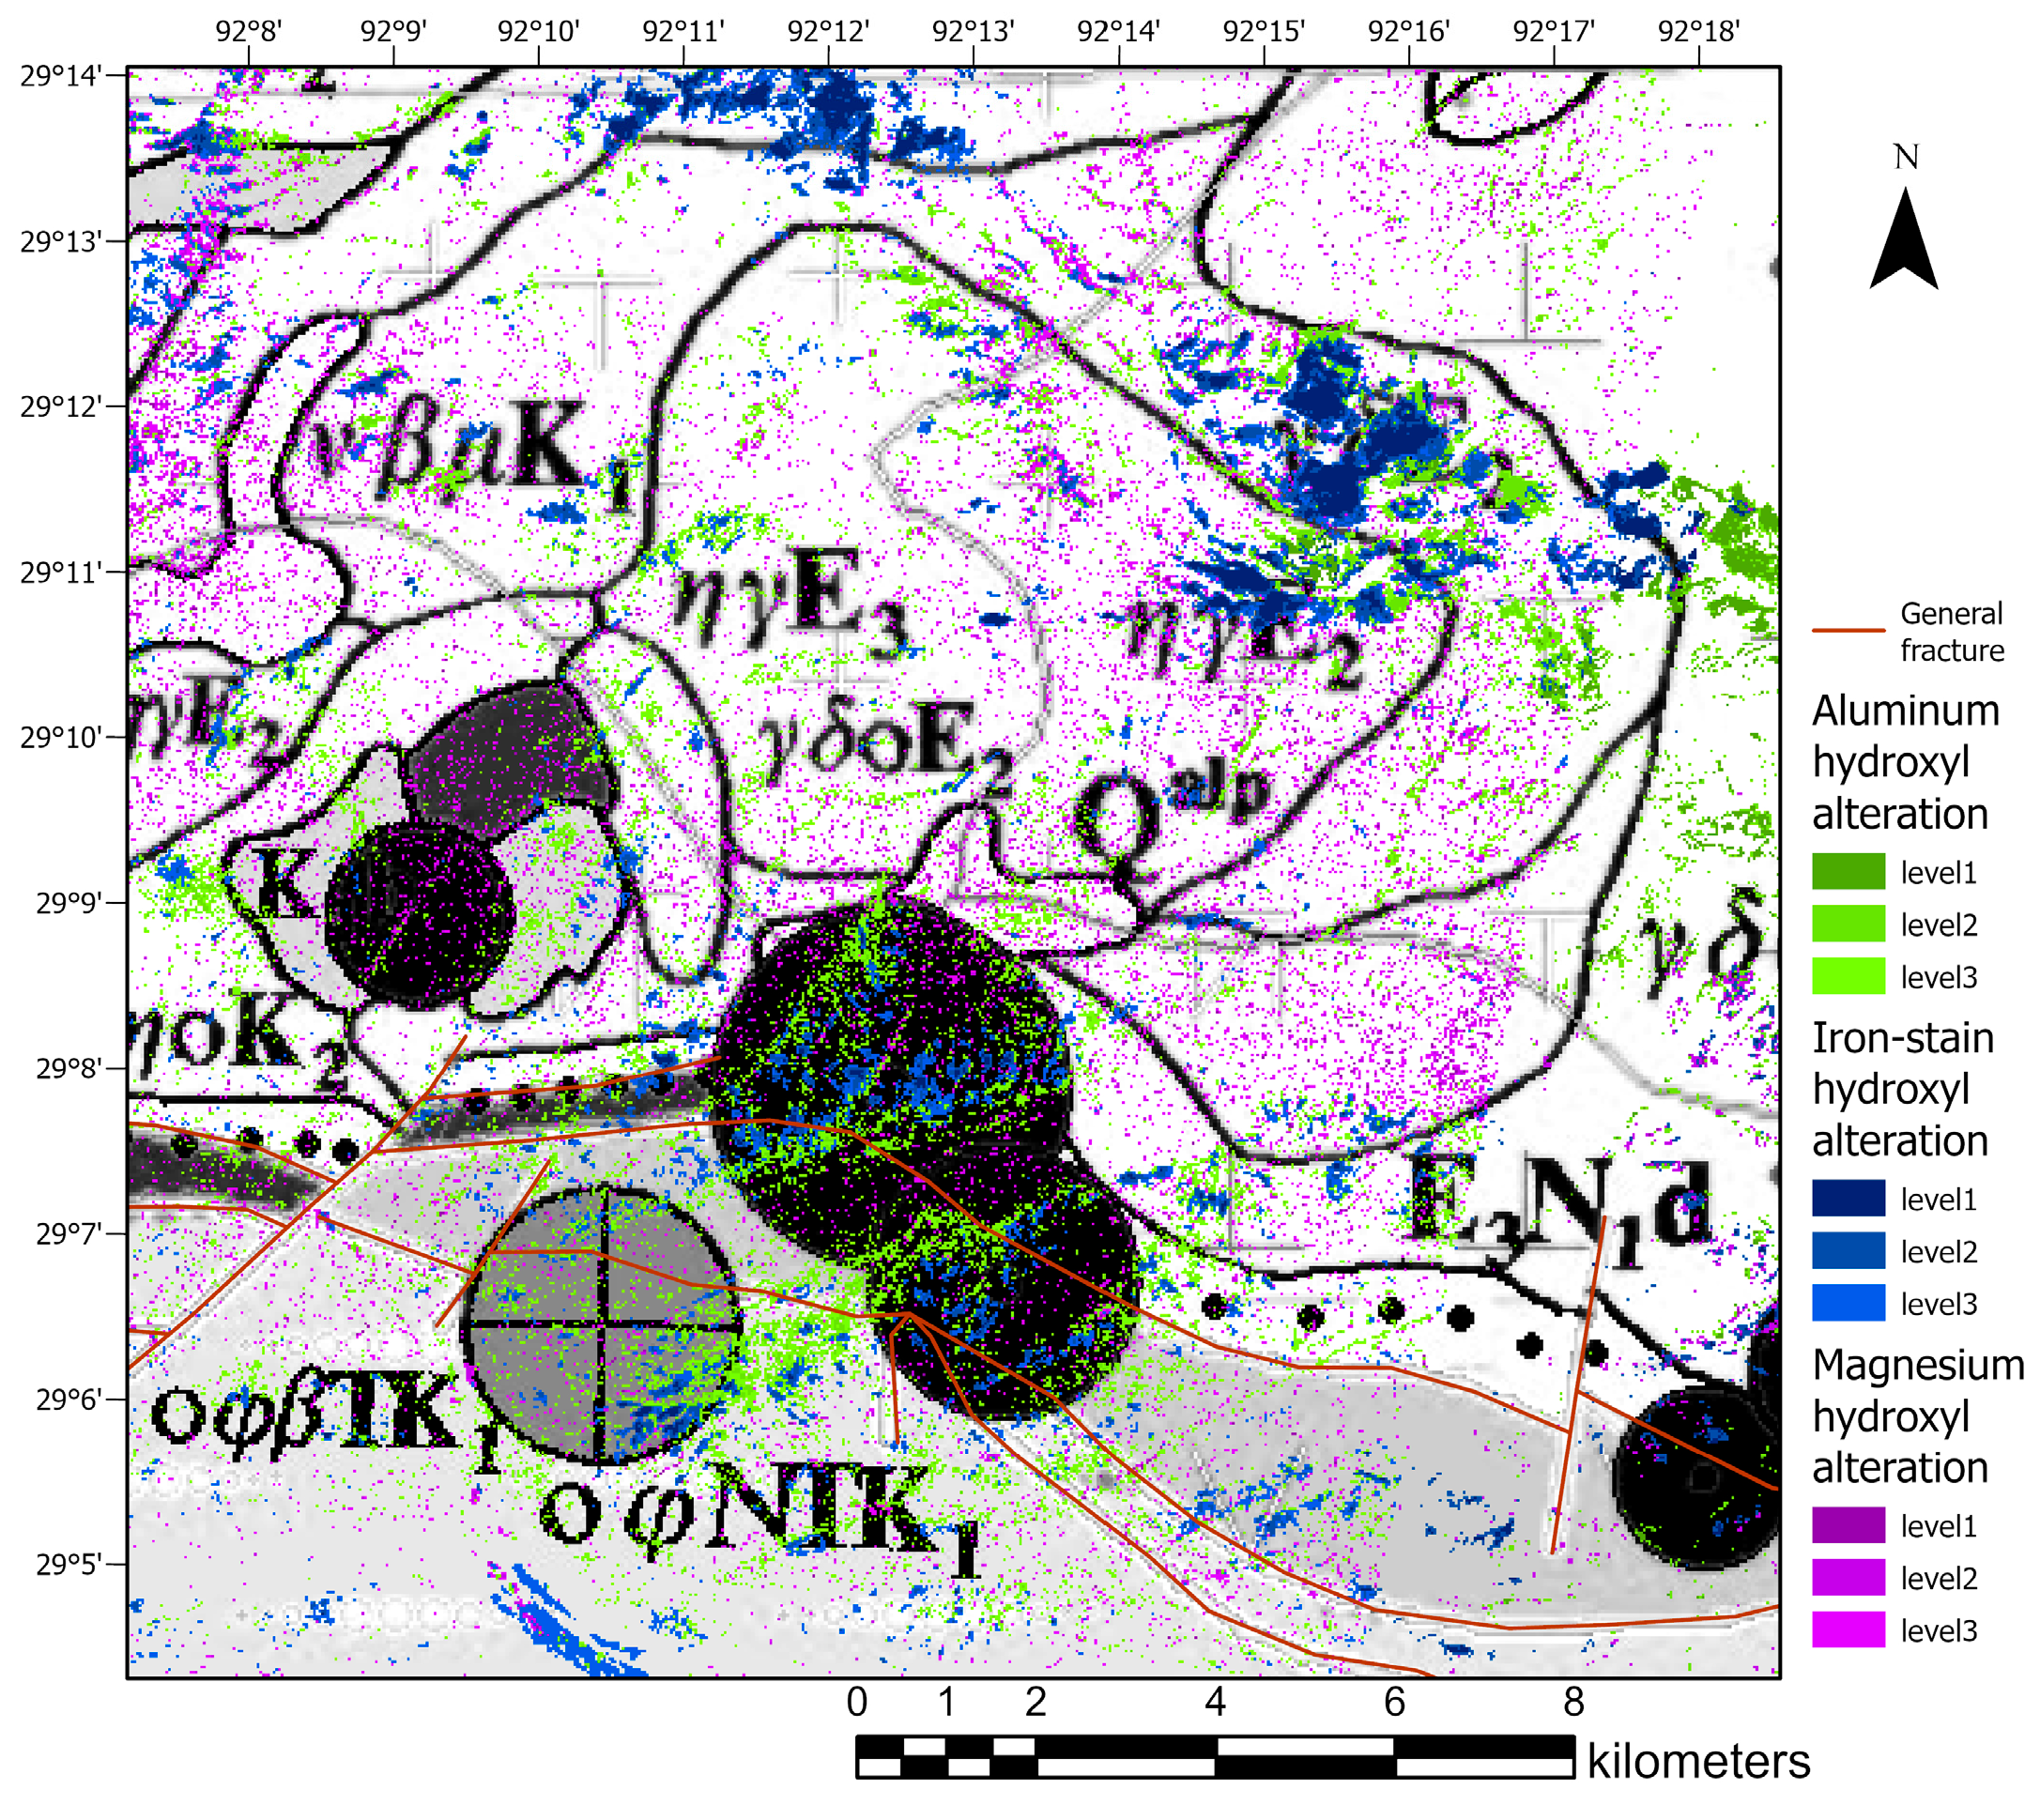
The results obtained by the EPCA method for Fe-stained alteration, Al-hydroxy alteration, and Mg-hydroxy alteration in the study area are classified into three levels of intensity, level 1, level 2, and level 3, respectively. Figure 5, Figure 6, Figure 7, Figure 8, Figure 9 and Figure 10 show the spectral enhancement effects calculated for the three warp bands. Finally, the results are overlaid on the ASTER remote sensing image base map to produce alteration maps, as shown in Figure 11, Figure 12 and Figure 13.
Figure 5, Figure 6, Figure 7, Figure 8, Figure 9 and Figure 10 highlight the better fit of the image spectra to the alteration results after the band calculation, indicating that the improved EPCA method enhances the image weak information after the targeted enhancement of the ranges of the target alteration minerals as the most significant contributing source in the principal component analysis, excluding the influence of topography and other factors.
Figure 11.
Iron-stained alteration map of the Gondwana region obtained by the EPCA method. (The yellow dashed boxes in the figure indicate the more pronounced spatial aggregation of alteration information).
Figure 11.
Iron-stained alteration map of the Gondwana region obtained by the EPCA method. (The yellow dashed boxes in the figure indicate the more pronounced spatial aggregation of alteration information).

Figure 12.
Al hydroxyl alteration map of the Gondwana region obtained by the EPCA method. (The yellow dashed boxes in the figure indicate the more pronounced spatial aggregation of alteration information).
Figure 12.
Al hydroxyl alteration map of the Gondwana region obtained by the EPCA method. (The yellow dashed boxes in the figure indicate the more pronounced spatial aggregation of alteration information).

Figure 13.
Mg hydroxyl alteration map of the Gondwana region obtained by the EPCA method. (The yellow dashed boxes in the figure indicate the more pronounced spatial aggregation of alteration information).
Figure 13.
Mg hydroxyl alteration map of the Gondwana region obtained by the EPCA method. (The yellow dashed boxes in the figure indicate the more pronounced spatial aggregation of alteration information).

Combining the image features and hydrothermal alteration mineralization theory, Figure 11, Figure 12 and Figure 13 reflect that the overall alteration information in the study area is widely distributed, mainly occurring in folded zones and linear-annular tectonic zones, with solid spatial signals and some spots showing apparent spatial aggregation, providing a basis for the further narrowing of the mineralization target area. The yellow dashed box in the figure indicates the spatial accumulation of alteration information, and it can be clearly seen that the three alteration aggregation areas tend to be unified, which is a very encouraging signal that the study has a vital role in narrowing the mineralization target area. The aggregated information in these boxes is important for the subsequent delineation of the prospective mineralized areas.
4.2. Integrated Analysis of Multi-Source Geological Elements
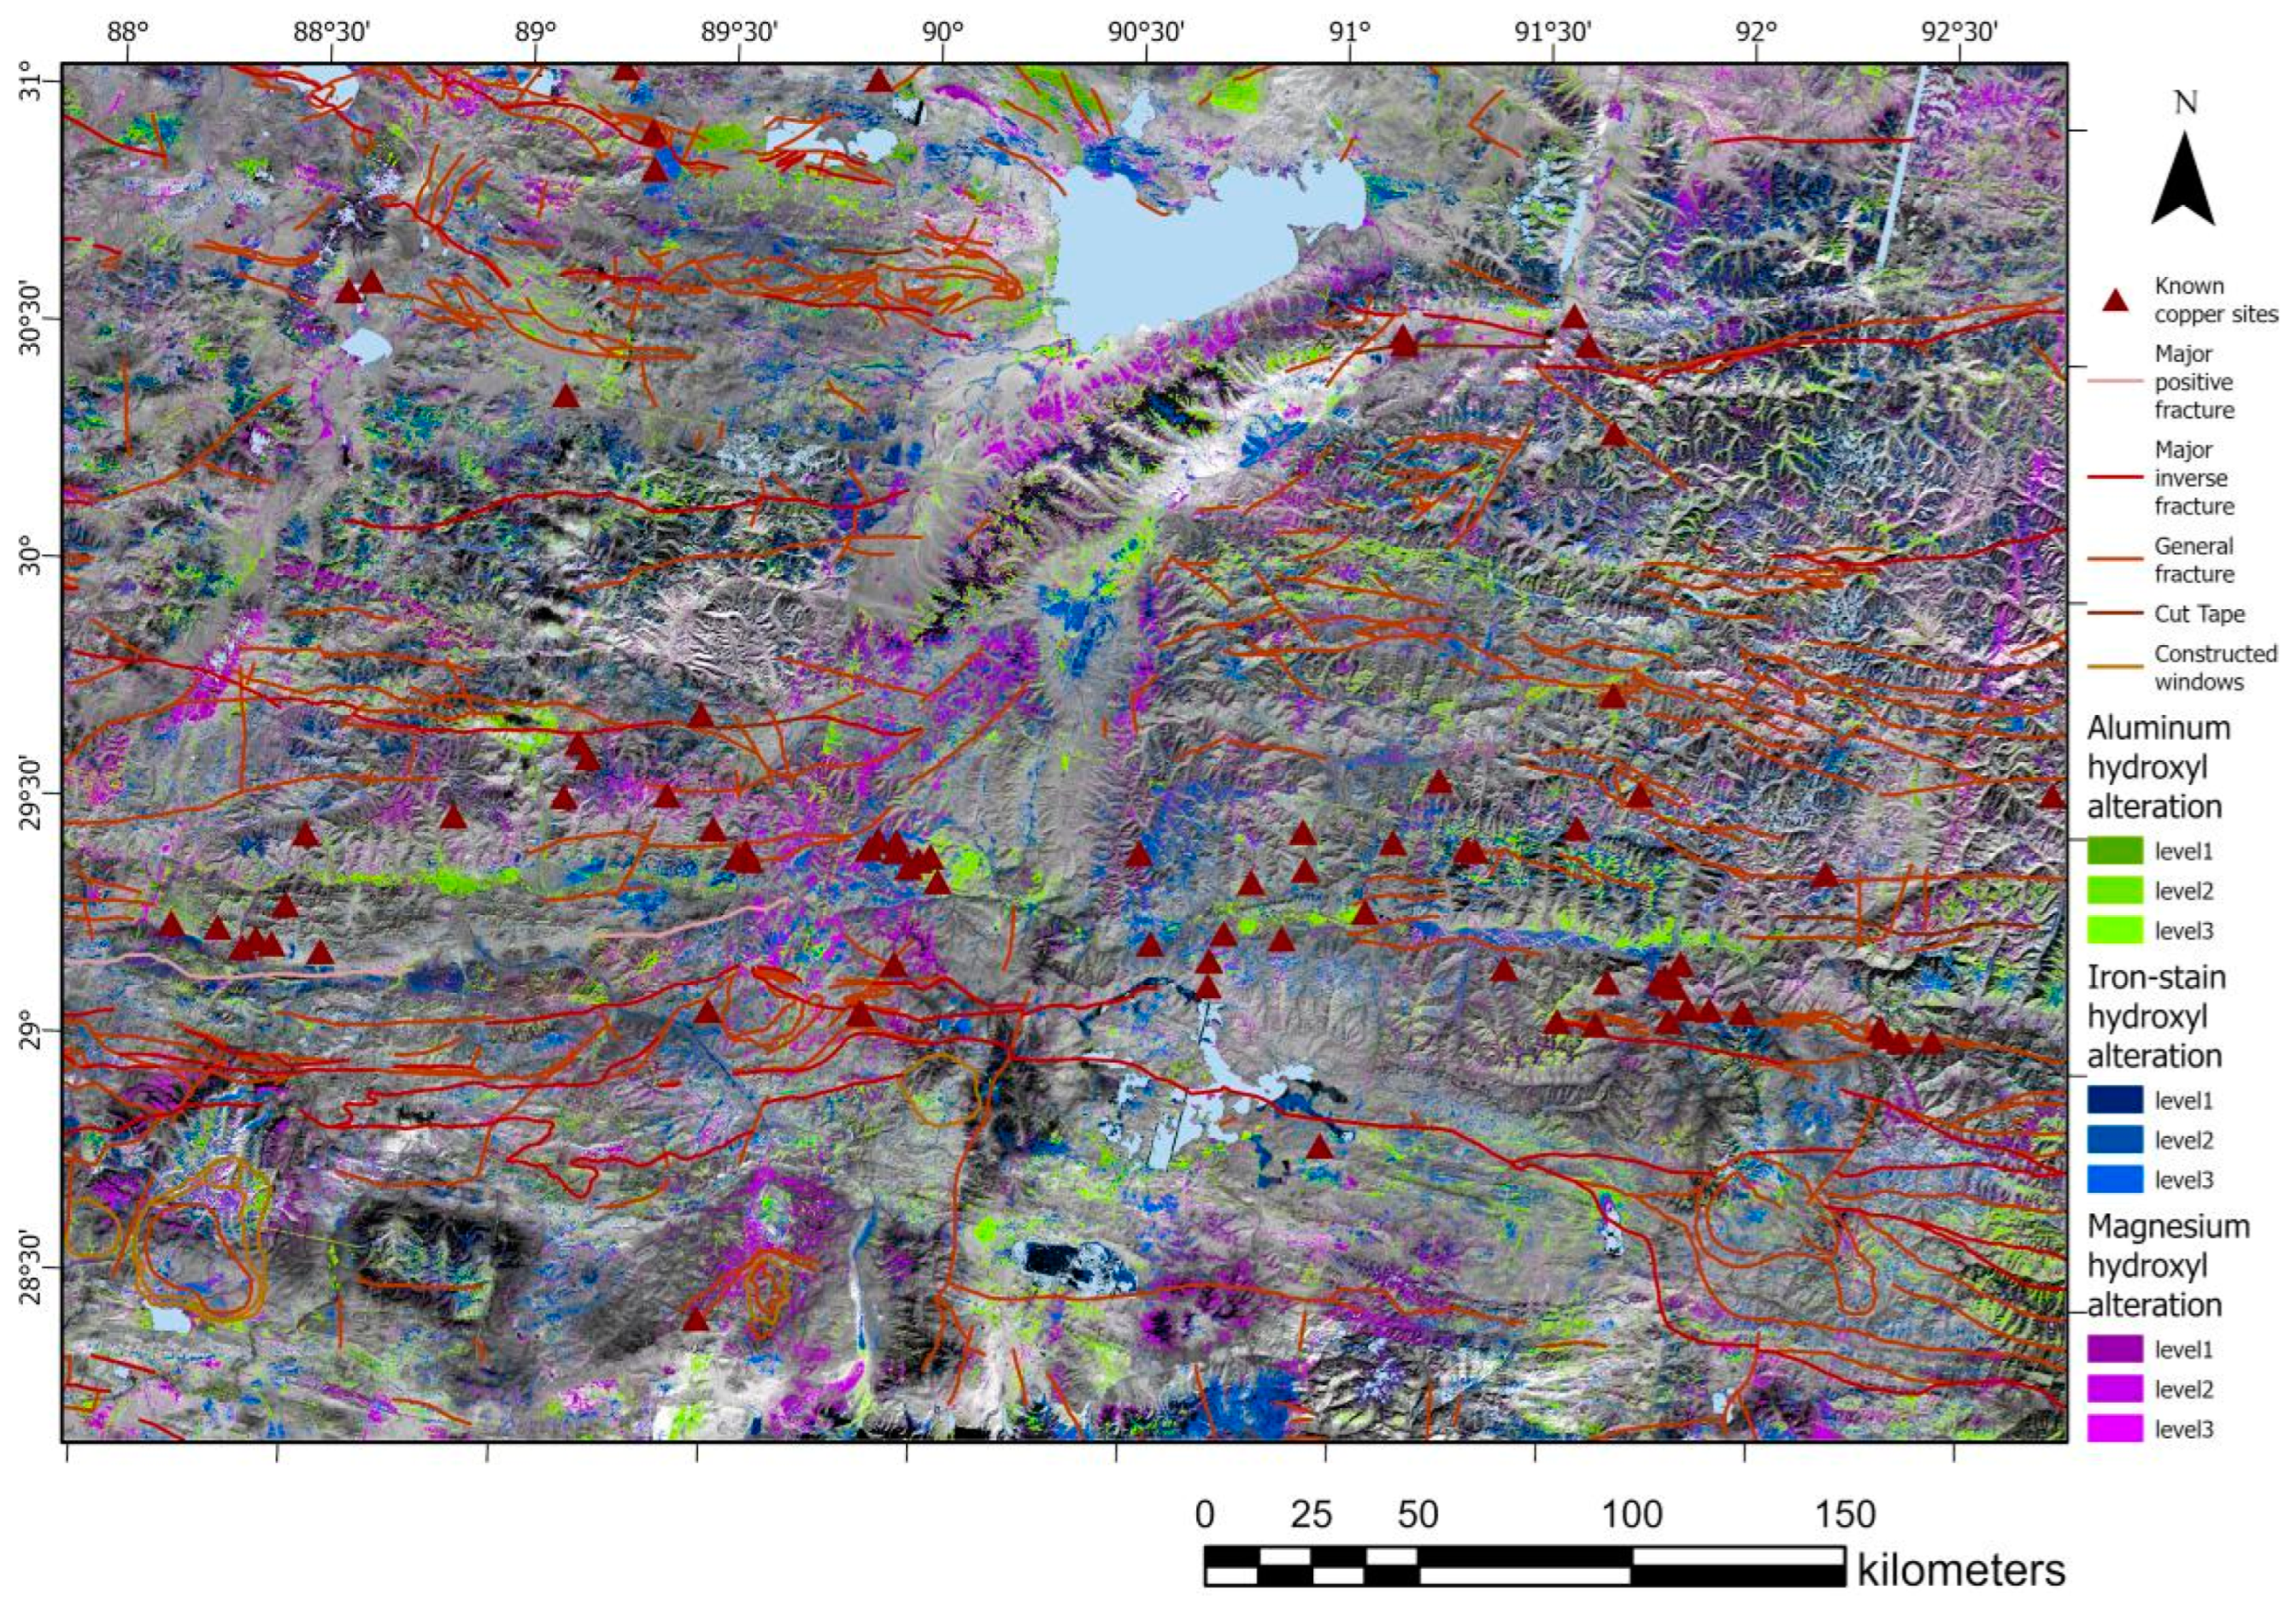
To better visualize the regional overview of alteration occurrence and summarize and apply the mineralization rules, multi-source geological information, such as stratigraphic lithology, linear tectonics, ring tectonics, geomorphology, and water systems related to mineralization, must be integrated to obtain an information-rich image (Figure 14). Known porphyry copper occurrences are also marked on the map, and these occurrences are distributed in the areas mentioned above of the solid alteration range. To better understand the extent to which the above information matches the actual situation, the above elements are overlaid on the geological and mineral map of the Tibetan Gondian metallogenic belt prepared by the Chengdu Institute of Geology and Mineral Resources in 2008 based on comprehensive data. Additionally, the lineaments, including major fracture zones and general fracture zones, are plotted in a geological rose diagram (Figure 15), and it is obvious that the geological structures in the WSW-ENE and SW-NE directions are the most obvious in the area, which are formed due to Himalayan orogeny and plate collision. This is also the reason for the generation of magmatic hydrothermal activity mentioned earlier, which is closely related to the development of alteration minerals. Three representative areas of the Chengba copper mine, Benglong copper mine, and Sangri copper mine were selected for display (Figure 16, Figure 17 and Figure 18). Under the comprehensive analysis of lithology–tectonic alteration multi-source geological information, the mineralization target area can be effectively located, providing a theoretical basis for actual exploration.
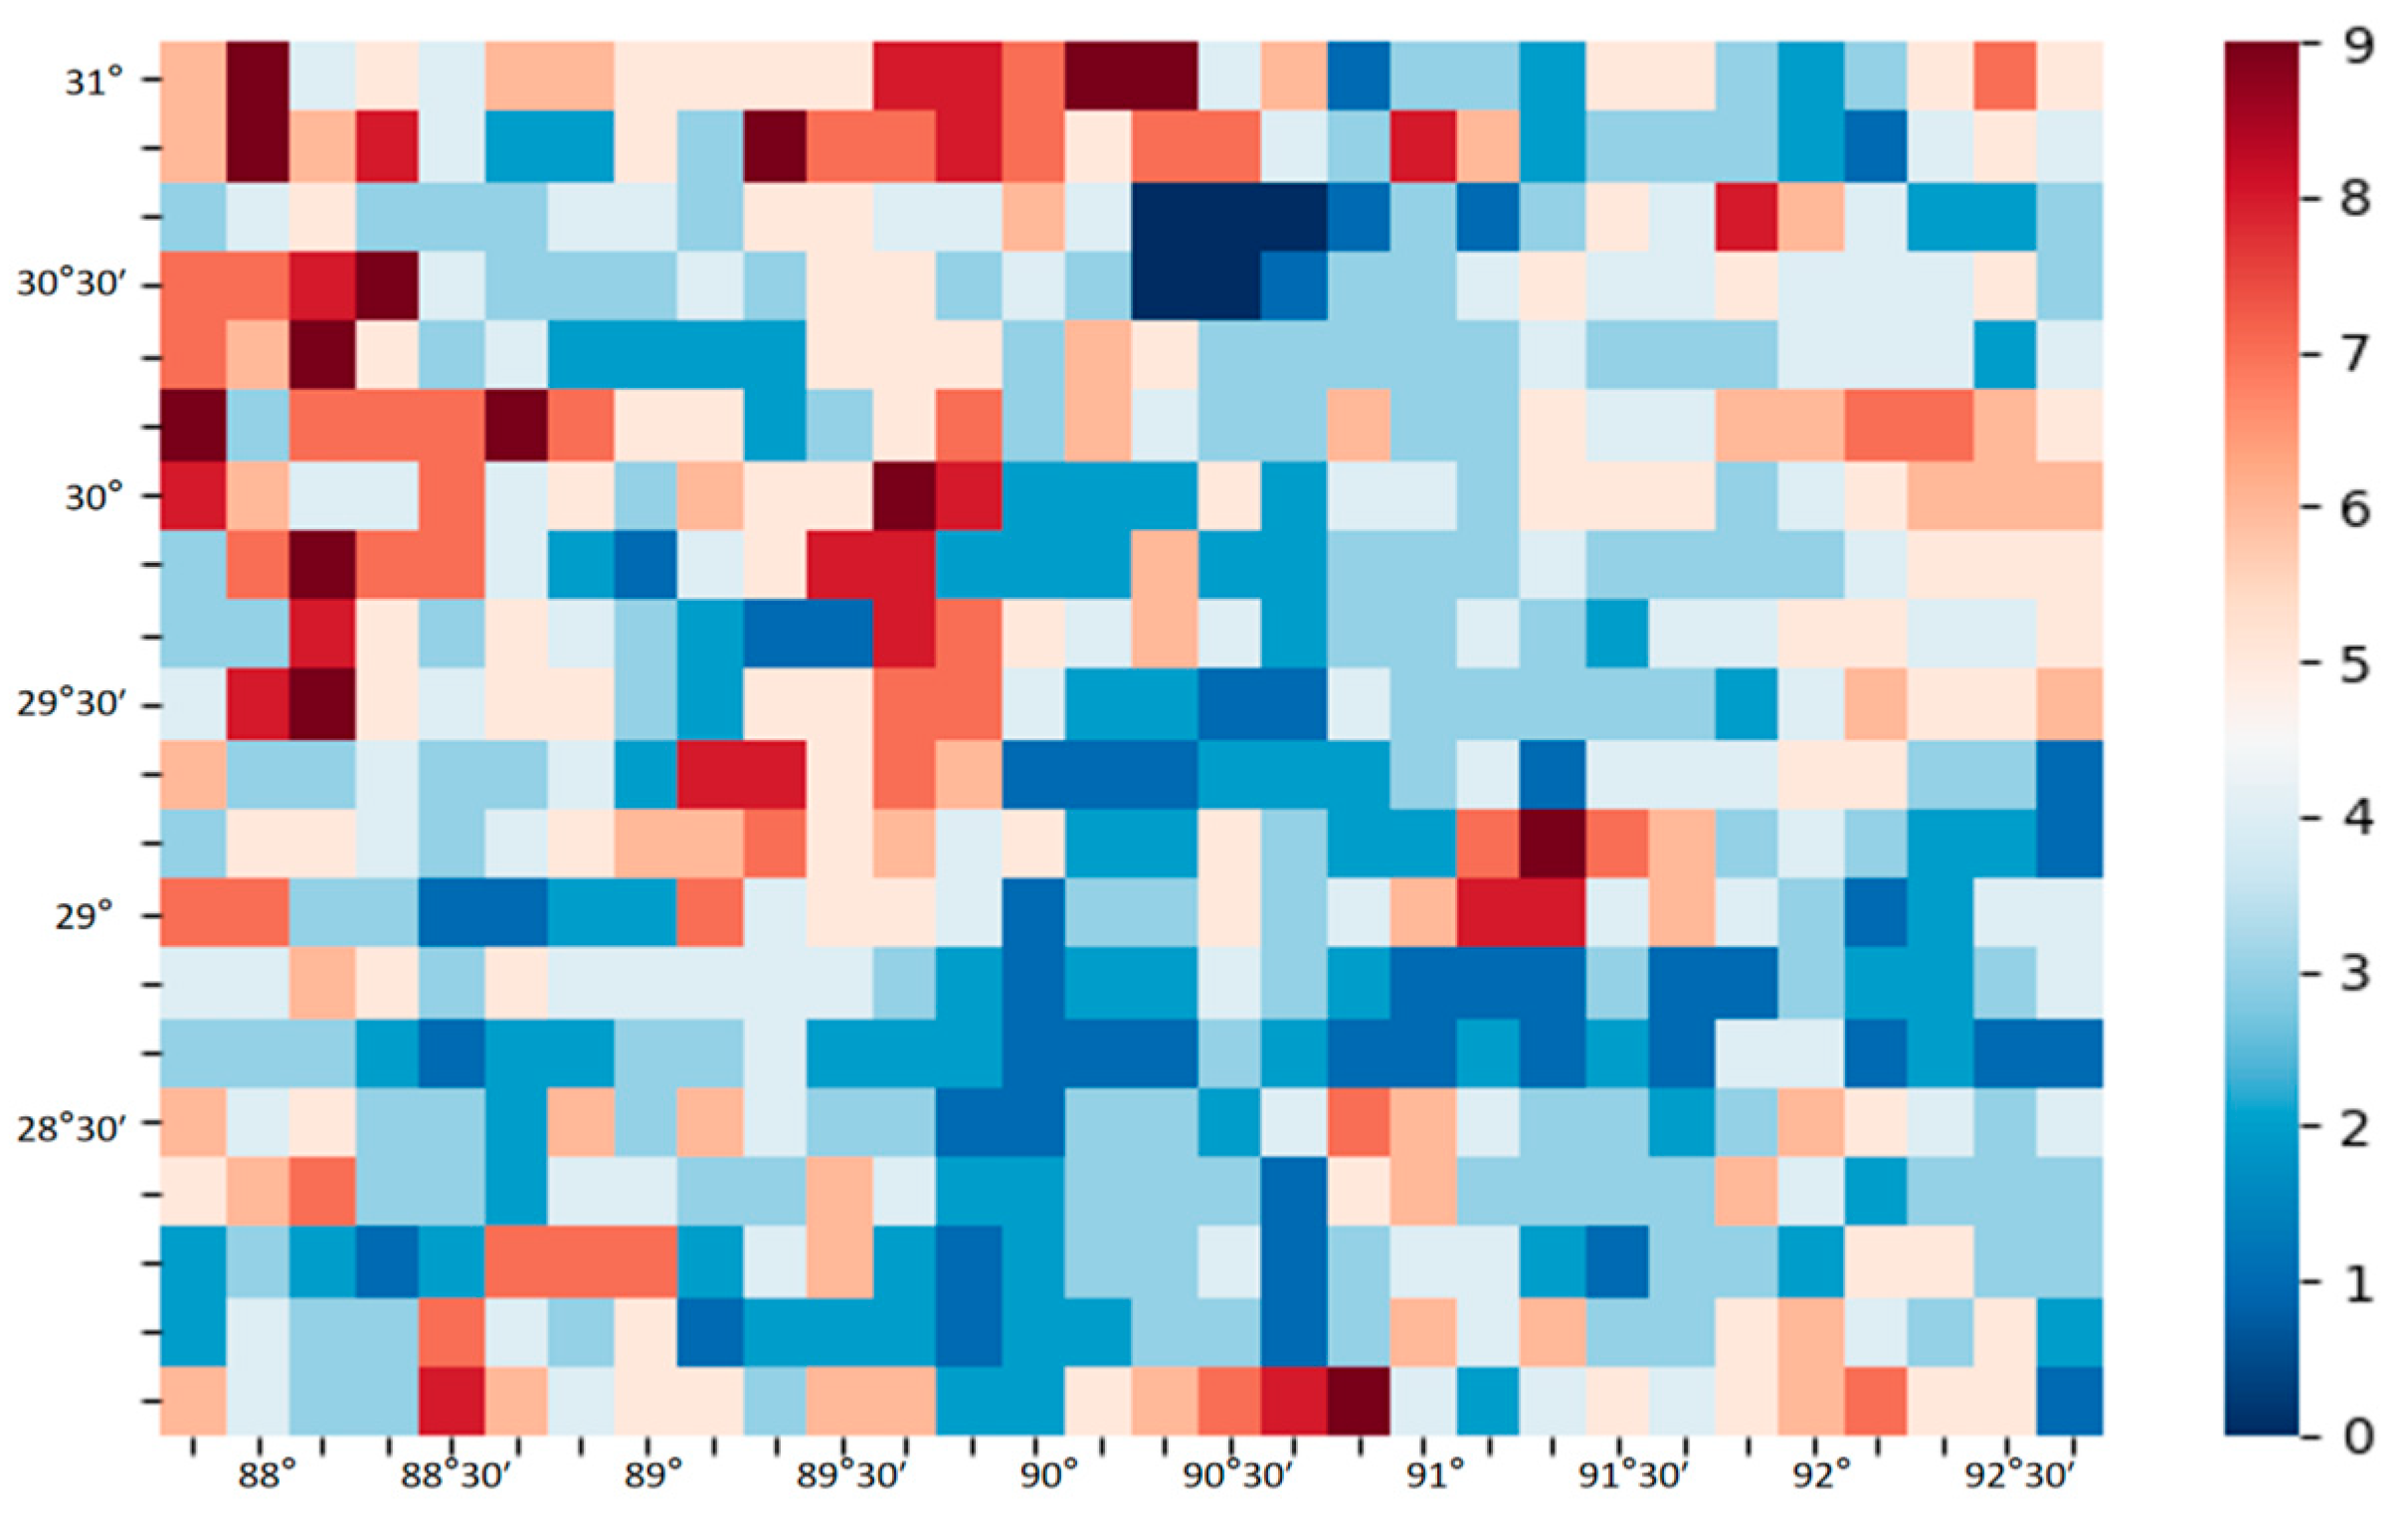
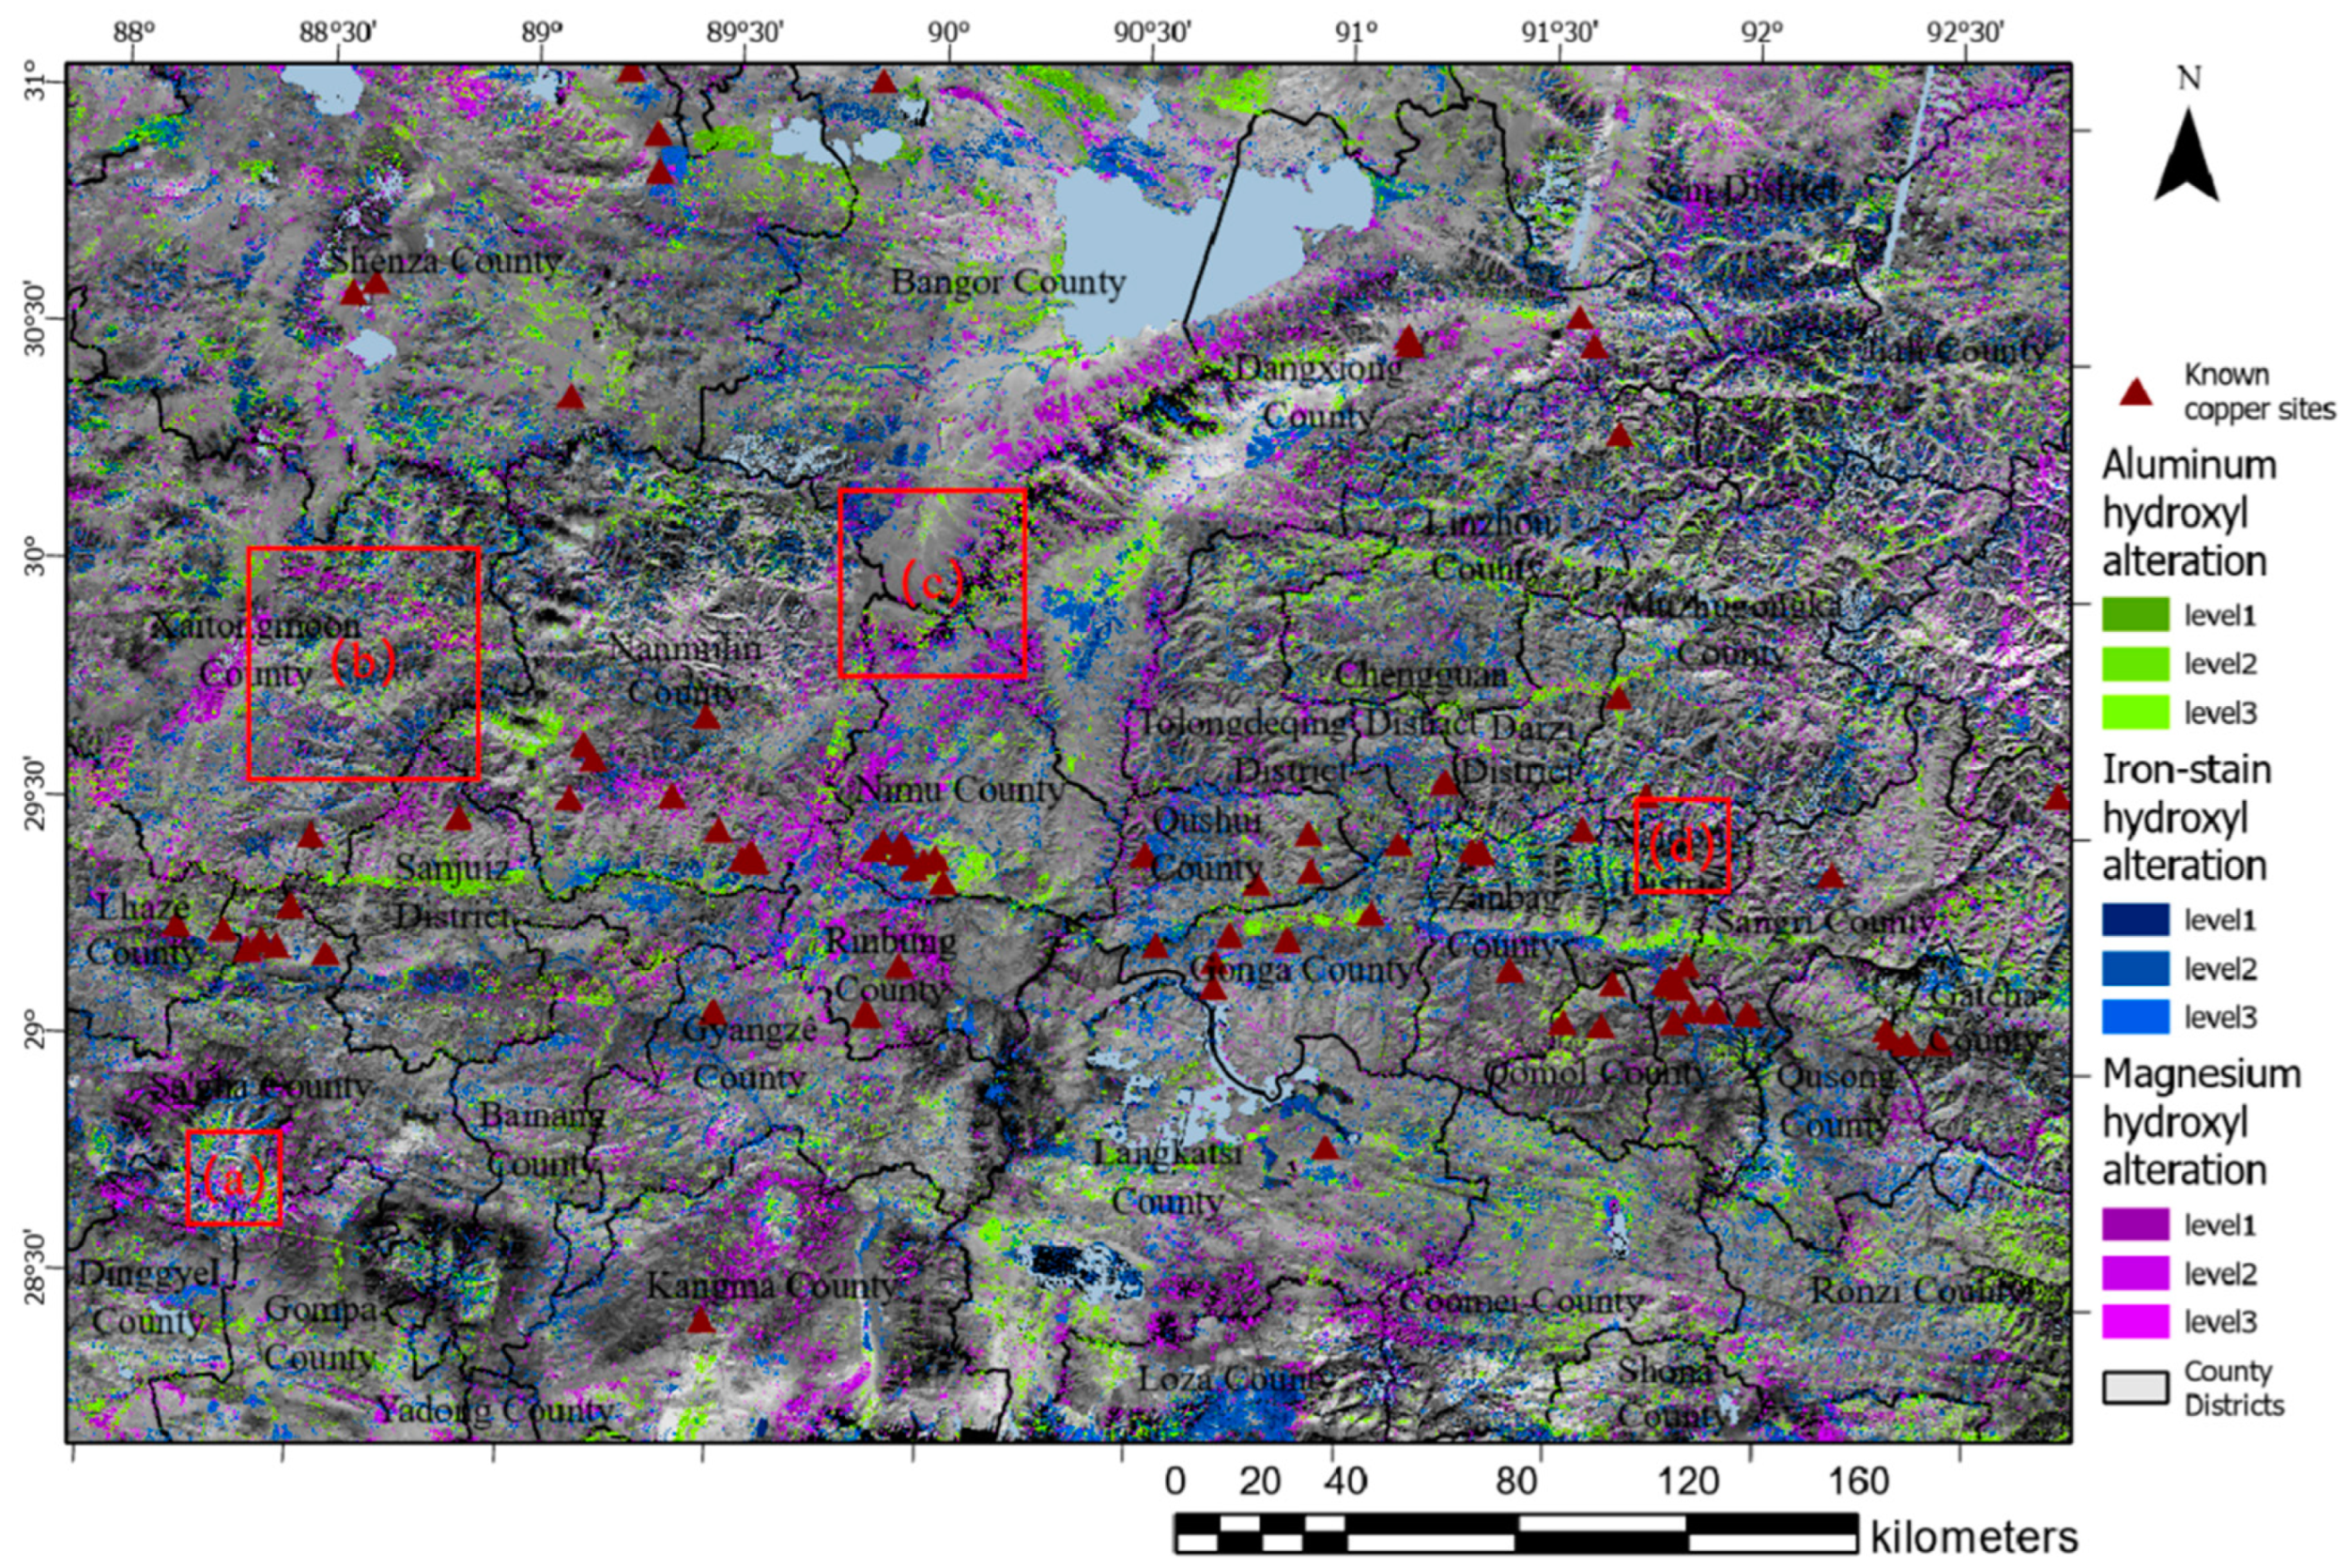
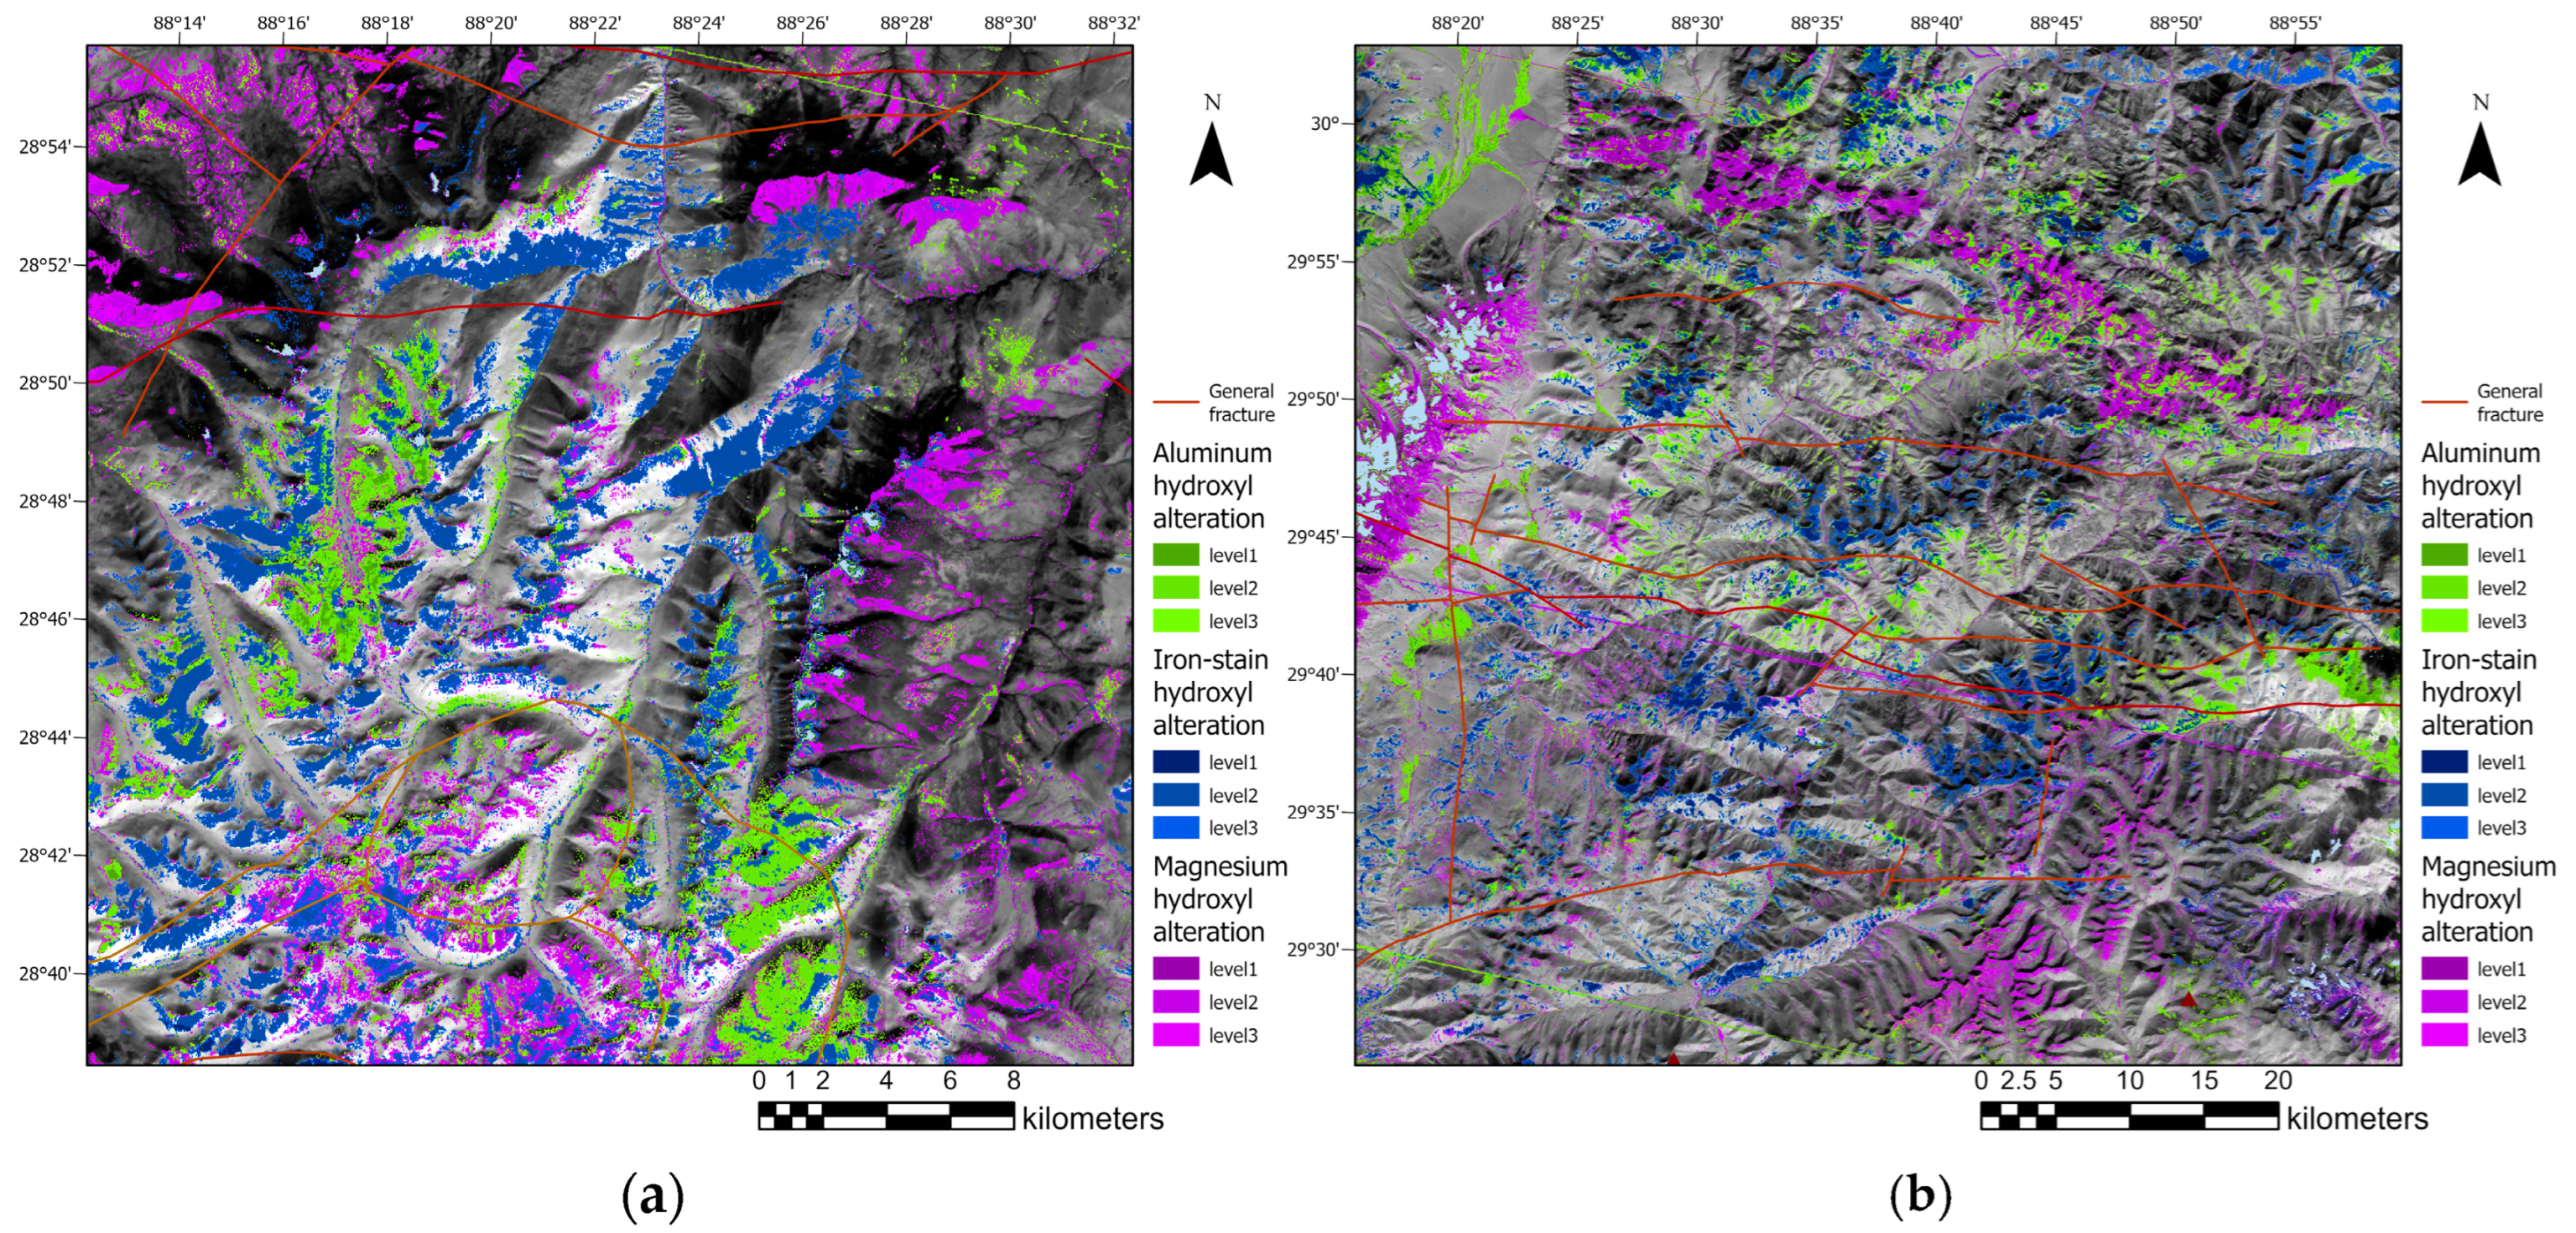
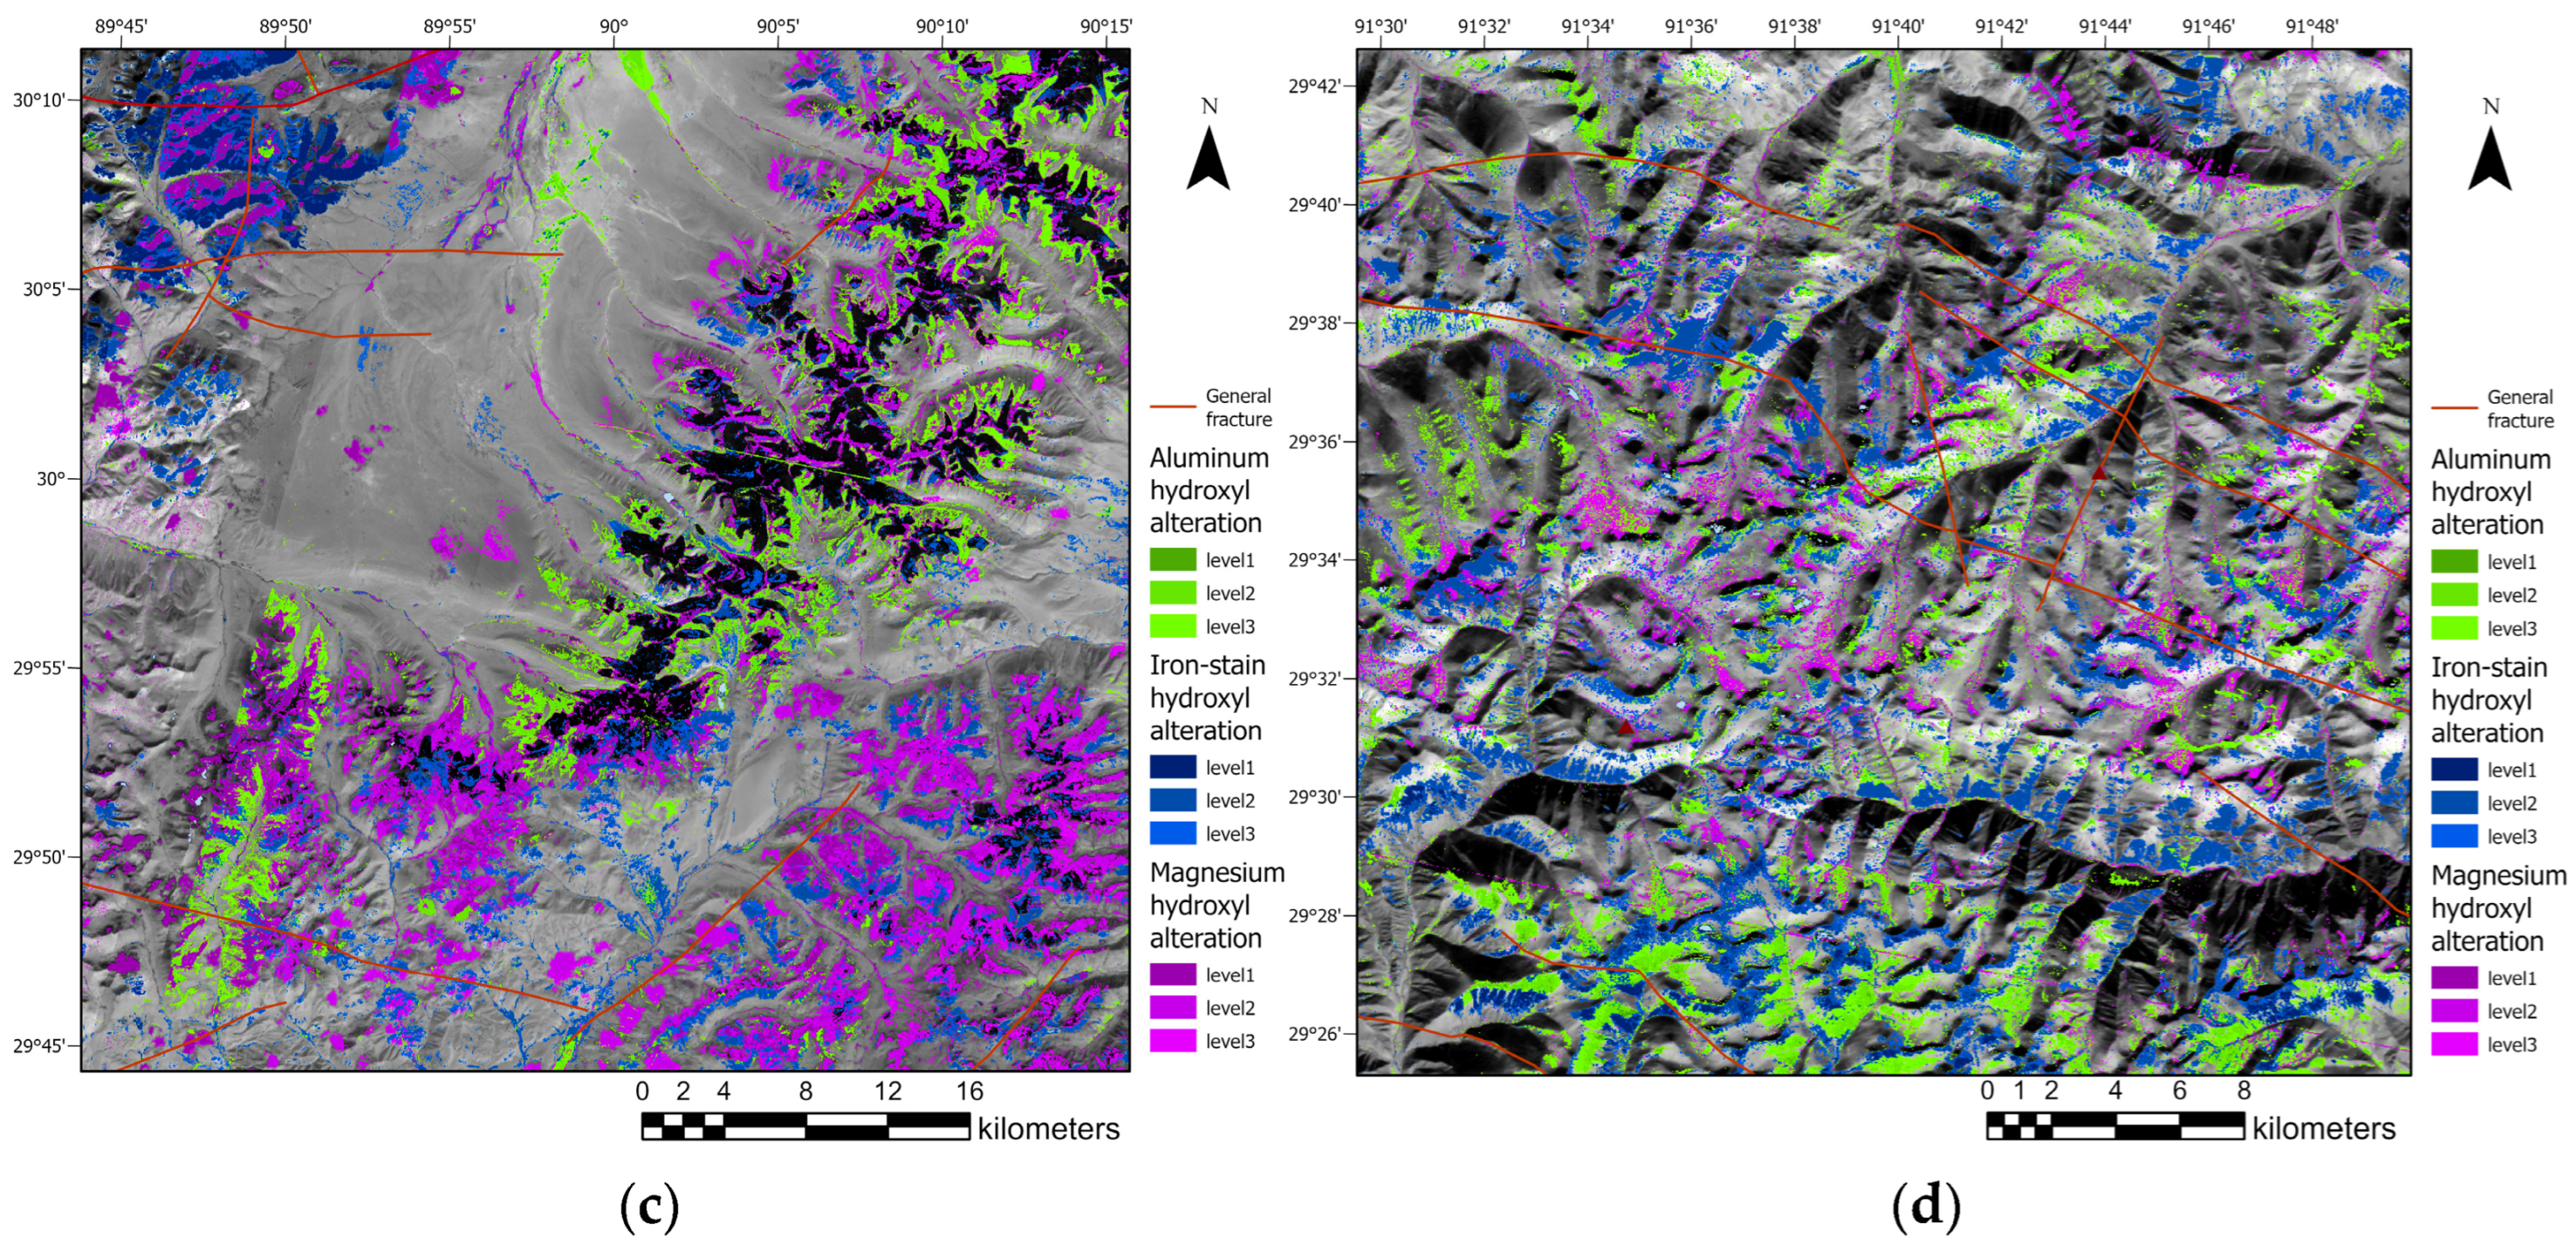
To enhance the spatial aggregation and delineation of metallogenic prospective areas based on the laws mentioned above, we divided the study area into 20 × 30 rectangular blocks using the thermogram concept. We quantified lithology–tectonic alteration multi-source geological information through visual interpretation on a scale of 0–9, totaling ten levels (Figure 19). By combining the thermodynamic map with information on the distribution of erosion in the county zones of the study area, we conducted a comprehensive analysis (Figure 20) and found that the most significant spatial clustering of multi-source geological elements existed in several areas (Figure 21). These areas include the Neoproterozoic porphyry tectonic window in Sakya County, Shigatse City, located in the southwest of the study area (a); the Paleoproterozoic porphyry fracture zone in Xietongmen County, Shigatse City, located in the northwest of the study area (b); the Paleoproterozoic and Paleocene granite porphyry fracture zone in the southern part of the Nyingchi Tanggula Range (c); and the Paleoproterozoic porphyry fracture zone in the eastern part of Lhasa in the central part of the study area (d). These areas can serve as prospective areas for mineralization and provide a theoretical basis for actual exploration and mineralization.
5. Discussion
Located in the southern part of the Tibetan Plateau, the Gondwana region is remote and difficult to access, making traditional mineral exploration challenging. However, due to the region’s favorable deep dynamics, it has abundant mineral resources, and world-class porphyry copper deposits in areas such as Qulong and Jiama have been recently developed. Geologists believe that the region still has significant potential for further exploitation [45]. Therefore, geophysical, chemical, and remote sensing methods have become pioneering technologies for field exploration, allowing for the efficient targeting of areas for further investigation [46,47].
Previous studies on remote sensing alteration information extraction methods have utilized more traditional band ratio and principal component analysis methods [48,49], which have several limitations, as mentioned in the previous section. Therefore, improving the various levels of alteration information extraction, such as extraction area and spatial aggregation, has become a frontier research problem. This paper builds upon previous work by enhancing the spectral features of remote sensing data through band calculation and by improving the traditional Crosta principal component analysis method to propose an EPCA method. Our method demonstrates superior extraction performance compared to conventional methods when validated against geological survey data.
This paper differs from most studies in this field, which often focus on a particular mining area. Instead, we expand the research horizon by starting from a specific sizable metallogenic belt, the Gondwana region [50,51], providing results from a macro perspective. These results can be effectively integrated with multi-source geological elements for in-depth analysis and discussion. Detecting and mining large deposits is often part of national or multinational companies’ investment projects, and results on a large scale are relevant to the overall understanding of regional mineralization potential and expected targets [52]. However, due to the broad scope of the study, access to field data for validation of the results is limited. To improve the results’ reliability, this paper combines the geological guarantee of the results with the geological mineral map of the Gondwana provided by the Geological Survey. While this approach offers theoretical support, it is important for relevant personnel to conduct the field exploration of reliable mineralized prospective areas and obtain field data to carry out more scientific validation [53,54]. Future work could consider combining deep learning methods with the large amount of collected data to achieve better efficiency and accuracy in mineral alteration information extraction.
6. Conclusions
This paper selects the Gondwana mineralized belt in the East Tethys–Himalayan mineralized domain as the study area and proposes a spectral feature-enhanced principal component analysis (EPCA) method based on waveband operation in order to extract the results of alteration information from ASTER remote sensing data for the whole area of the Gondwana mineralized belt and combines them with lithology–tectonic and other multi-source geological details to carry out a comprehensive geoscientific evaluation. The results help the implementation of mineral exploration and mining work in the area at a macro level. The verification with geological data reveals that the Neoproterozoic porphyry tectonic window in Saga County and the Paleoproterozoic porphyry fracture zone in Xietongmen County of Rikaze have apparent spatial aggregation for prospective mineralization zones, which significantly reduces the scope of field survey and provides an excellent theoretical basis for this purpose.
Considering the problem that the traditional Crosta method is easily affected by disturbing factors, such as topography and insensitivity to the weak information of images, an EPCA model was constructed to complete the automatic selection of principal components of each scene image, which avoids the mechanical and complicated extraction of significant elements and contributing sources when extracting large-scale etching information and dramatically improves the extraction efficiency. The results show that the etching information extracted by the EPCA method is significantly better than the traditional Crosta method in terms of etching area and spatial aggregation. Therefore, the procedure can be effectively applied to exploring porphyry copper ore, which is essential for delineating the target area of the mineralization search and revealing and utilizing the mineralization pattern.
However, it was also found in the study that ASTER multispectral images still need improvement in the identification of homogeneous and heterogeneous minerals, and the future work should optimize the degree of mineral classification and improve the reliability of the results by trying to refine the means of mineral identification with hyperspectral images. In addition, future studies should combine regional mineral alteration information with geophysical and chemical information from a geological perspective. This is of great scientific importance for the in-depth analysis of the distribution of mineralizing elements, the formation process of metal deposits in mineralized zones, and the improvement of porphyry mineralization theory.
Author Contributions
Conceptualization, C.L.; data curation, C.L.; formal analysis, C.L.; software, C.L.; writing—original draft, C.L.; funding acquisition, C.Q. and Y.W.; supervision, C.Q.; writing—review and editing, C.Q., L.W., J.F. and S.W.; investigation, L.W.; visualization, L.W.; project administration, J.F.; validation, J.F.; methodology, S.W.; resources, S.W. and Y.W. All authors have read and agreed to the published version of the manuscript.
Funding
This work was supported by the National Key Research and Development Program of China (No. 2021YFB3900902) and Provincial Key R&D Program of Zhejiang (No. 2021C01031).
Data Availability Statement
Not applicable.
Acknowledgments
This paper is supported by the Deep-time Digital Earth (DDE) Big Science Program. Thanks is given to Cui Xin et al., from the College of Chemistry and Chemical Engineering of Xi’an University of Science and Technology, for help with the infrared spectroscopic determination of the minerals in this thesis. Thanks is also given to the Chengdu Institute of Geology and Mineral Resources for providing the geological and mineral map of the Tibetan Gangdis mineralization belt.
Conflicts of Interest
The authors declare no conflict of interest.
References
- Sun, W.; Huang, R.F.; Li, H.; Hu, Y.B.; Zhang, C.C.; Sun, S.J.; Zhang, L.P.; Ding, X.; Li, C.Y.; Zartman, R.E.; et al. Porphyry deposits and oxidized magmas. Ore Geol. Rev. 2015, 65, 97–131. [Google Scholar] [CrossRef]
- Xu, X.W.; Li, H.; Peters, S.G.; Qin, K.; Mao, Q.; Wu, Q.; Hong, T.; Wu, C.; Liang, G.; Zhang, Z.; et al. Cu-rich porphyry magmas produced by fractional crystallization of oxidized fertile basaltic magmas (Sangnan, East Junggar, P.R. China). Ore Geol. Rev. 2017, 91, 296–315. [Google Scholar] [CrossRef]
- Windley, B.F.; Xiao, W. Ridge subduction and slab windows in the Central Asian Orogenic Belt: Tectonic implications for the evolution of an accretionary orogen. Gondwana Res. 2018, 61, 73–87. [Google Scholar] [CrossRef]
- Shebl, A.; Abdellatif, M.; Elkhateeb, S.O.; Csámer, Á. Multisource data analysis for gold potentiality mapping of Atalla area and its environs, Central Eastern Desert, Egypt. Minerals 2021, 11, 641. [Google Scholar] [CrossRef]
- Eldosouky, A.M.; Abdelkareem, M.; Elkhateeb, S.O. Integration of remote sensing and aeromagnetic data for mapping structural features and hydrothermal alteration zones in Wadi Allaqi area, South Eastern Desert of Egypt. J. Afr. Earth Sci. 2017, 130, 28–37. [Google Scholar] [CrossRef]
- Alimohammadi, M.; Alirezaei, S.; Kontak, D.J. Application of ASTER data for Exploration of porphyry copper deposits: A case study of Daraloo–Sarmeshk area, southern part of the Kerman copper belt, Iran. Ore Geol. Rev. 2015, 70, 290–304. [Google Scholar] [CrossRef]
- Alarifi, S.S.; Abdelkareem, M.; Abdalla, F.; Abdelsadek, I.S.; Gahlan, H.; Al-Saleh, A.; Alotaibi, M. Fusion of Multispectral Remote-Sensing Data through GIS-Based Overlay Method for Revealing Potential Areas of Hydrothermal Mineral Resources. Minerals 2022, 12, 1577. [Google Scholar] [CrossRef]
- Traore, M.; Wambo, J.D.T.; Ndepete, C.P.; Tekin, S.; Pour, A.B.; Muslim, A.M. Lithological and alteration mineral mapping for alluvial gold exploration in the south east of Birao area, Central African Republic using Landsat-8 Operational Land Imager (OLI) data. J. Afr. Earth Sci. 2020, 170, 103933. [Google Scholar] [CrossRef]
- Taha, A.M.M.; Xi, Y.; He, Q.; Hu, A.; Wang, S.; Liu, X. Investigating the Capabilities of Various Multispectral Remote Sensors Data to Map Mineral Prospectivity Based on Random Forest Predictive Model: A Case Study for Gold Deposits in Hamissana Area, NE Sudan. Minerals 2022, 13, 49. [Google Scholar] [CrossRef]
- Mbianya, G.N.; Ngnotue, T.; Wambo, J.D.T.; Ganno, S.; Pour, A.B.; Kenne, P.A.; Fossi, D.H.; Wolf, I.D. Remote sensing satellite-based structural/alteration mapping for gold exploration in the Ketté goldfield, Eastern Cameroon. J. Afr. Earth Sci. 2021, 184, 104386. [Google Scholar] [CrossRef]
- Ketchaya, Y.B.; Dong, G.; Fotze, Q.M.A.; Carrino, T.A.; Mandeng, E.P.B.; Lemdjou, Y.B.; Assie, K.R.; Fodoue, Y.; Wadjou, J.W. Integration of Landsat 8, gravity, and field data for exploration of gold mineralization in Gamba District, Northern Cameroon. Geol. J. 2021, 56, 4788–4808. [Google Scholar] [CrossRef]
- Belgrano, T.M.; Diamond, L.W.; Novakovic, N.; Hewson, R.D.; Hecker, C.A.; Wolf, R.C.; Zielinski, L.D.; Kuhn, R.; Gilgen, S.A. Multispectral discrimination of spectrally similar hydrothermal minerals in mafic crust: A 5000 km2 ASTER alteration map of the Oman–UAE ophiolite. Remote Sens. Environ. 2022, 280, 113211. [Google Scholar] [CrossRef]
- Timkin, T.; Abedini, M.; Ziaii, M.; Ghasemi, M.R. Geochemical and Hydrothermal Alteration Patterns of the Abrisham-Rud Porphyry Copper District, Semnan Province, Iran. Minerals 2022, 12, 103. [Google Scholar] [CrossRef]
- Yousefi, M.; Tabatabaei, S.H.; Rikhtehgaran, R.; Pour, A.B.; Pradhan, B. Application of Dirichlet process and support vector machine techniques for mapping alteration zones associated with porphyry copper deposit using ASTER remote sensing imagery. Minerals 2021, 11, 1235. [Google Scholar] [CrossRef]
- El-Wahed, M.A.; Zoheir, B.; Pour, A.B.; Kamh, S. Shear-related gold ores in the Wadi Hodein Shear Belt, South Eastern Desert of Egypt: Analysis of remote sensing, field and structural data. Minerals 2021, 11, 474. [Google Scholar] [CrossRef]
- Karamizadeh, S.; Abdullah, S.M.; Manaf, A.A.; Zamani, M.; Hooman, A. An overview of principal component analysis. J. Signal Inf. Process. 2013, 4, 173. [Google Scholar] [CrossRef] [Green Version]
- Gao, J.; Klemd, R.; Zhu, M.; Wang, X.; Li, J.; Wan, B.; Xiao, W.; Zeng, Q.; Shen, P.; Sun, J.; et al. Large-scale porphyry-type mineralization in the Central Asian metallogenic domain: A review. J. Asian Earth Sci. 2018, 165, 7–36. [Google Scholar] [CrossRef]
- Cooke, D.R.; Hollings, P.; Wilkinson, J.J.; Tosdal, R.M. Geochemistry of Porphyry Deposits. In Treatise on Geochemistry, 2nd ed.; Holland, H.D., Turekian, K.K., Eds.; Elsevier: Oxford, UK, 2014; Volume 13, pp. 357–381. [Google Scholar]
- Richards, J.P. Magmatic to hydrothermal metal fluxes in convergent and collided margins. Ore Geol. Rev. 2011, 40, 1–26. [Google Scholar] [CrossRef]
- Guo, N.; Thomas, C.; Tang, J.X.; Tong, Q.X. Mapping white mica alteration associated with the Jiama porphyry-skarn Cu deposit, central Tibet using field SWIR spectrometry. Ore Geol. Rev. 2019, 108, 147–157. [Google Scholar] [CrossRef]
- Yao, F.; Xu, X.; Yang, J.; Geng, X. A Remote-Sensing-Based Alteration Zonation Model of the Duolong Porphyry Copper Ore District, Tibet. Remote Sens. 2021, 13, 5073. [Google Scholar] [CrossRef]
- Tang, N.; Qin, Z.; Li, Y.; Duo, J.; Ran, F.; Dai, J. Mineralogical Characteristics and Short-wave Infrared Spectra of Chlorite as Indicators of Hydrothermal Centers: A Case Study of the Giant Porphyry Copper-Molybdenum Deposit at Qulong, Tibet. Acta Geol. Sin.-Engl. Ed. 2022, 96, 490–505. [Google Scholar] [CrossRef]
- Ding, F.; Gao, J.G.; Xu, K.Z. Geochemistry, geochronology, and geological significances of the essential dykes in the Rongbu area, southern Tibet. Acta Petrol. Sin. 2020, 36, 18. [Google Scholar]
- Zeng, L.S.; Gao, L.E.; Guo, C.L.; Hou, K.J.; Wang, Q. Early Cretaceous forearc extension of the Gangdese continental arc, southern Tibet. Acta Petrol. Sin. 2017, 33, 18. [Google Scholar]
- Tang, J.; Dorji; Liu, H.; Lang, X.; Zhang, J.; Zheng, W.; Ying, L. Mineralization pattern and mineralization prediction of the eastern section of the Gondwana mineralization belt. J. Geol. 2014, 88, 11. [Google Scholar]
- Cao, H.; Li, G.; Zhang, R.; Zhang, Y.; Zhang, L.; Dai, Z.; Zhang, Z.; Liang, W.; Dong, S.; Xia, X.B. Genesis of the Cuonadong tin polymetallic deposit in the Tethyan Himalaya: Evidence from geology, geochronology, fluid inclusions and multiple isotopes. Gondwana Res. 2021, 92, 72–101. [Google Scholar] [CrossRef]
- Cao, S.; Wang, Z.; Lou, F.; Huang, J.; Xiong, W. Ore formation pattern and prospect analysis of iron-copper ore in central Tibetan Gangdis. J. Geol. 2014, 88, 2108–2118. [Google Scholar]
- Hou, Z.; Qu, X.; Wang, S.; Gao, Y.; Du, A.; Huang, W. Re-Os ages of gabbroic molybdenite in the Gangdis porphyry copper belt, Tibetan Plateau: Application of mineralization time frame and kinetic background. Chin. Sci. Ser. D 2003, 33, 609–618. [Google Scholar]
- Yin, A. Geologic Evolution of the Himalayan-Tibetan Orogen. Annu. Rev. Earth Planet. Sci. 2000, 28, 211–280. [Google Scholar] [CrossRef] [Green Version]
- Lyu, P.; He, L.; He, Z.; Liu, Y.; Deng, H.; Qu, R.; Wang, J.; Zhao, Y.; Wei, Y. Research on remote sensing prospecting technology based on multi-source data fusion in deep-cutting areas. Ore Geol. Rev. 2021, 138, 104359. [Google Scholar] [CrossRef]
- Pour, A.B.; Hashim, M.; Marghany, M. Using spectral mapping techniques on short wave infrared bands of ASTER remote sensing data for alteration mineral mapping in SE Iran. Int. J. Phys. Sci. 2011, 6, 917–929. [Google Scholar]
- Diao, H.; Zhang, D.; Di, Y.; Wang, Z.; Wang, H.; Xiong, G. The Extraction of Alteration Anomalies from ASTER Data Based on Principal Component Analysis and Fractal Model. Remote Sens. Land Resour. 2011, 23, 75–80. [Google Scholar]
- Amer, R.; El Mezayen, A.; Hasanein, M. ASTER spectral analysis for alteration minerals associated with gold mineralization. Ore Geol. Rev. J. Compr. Stud. Ore Genes. Ore Explor. 2016, 75, 239–251. [Google Scholar] [CrossRef]
- Khaleghi, M.; Ranjbar, H.; Abedini, A.; Calagari, A.A. Synergetic use of the Sentinel-2, ASTER, and Landsat-8 data for hydrothermal alteration and iron oxide minerals mapping in a mine scale. Acta Geodyn. Geromater. 2020, 17, 311–329. [Google Scholar] [CrossRef]
- Fakhari, S.; Jafarirad, A.; Afzal, P.; Lotfi, M. Delineation of hydrothermal alteration zones for porphyry systems utilizing ASTER data in Jebal-Barez area, SE Iran. Iran. J. Earth Sci. 2019, 11, 80–92. [Google Scholar]
- Nafigin, I.O.; Ishmukhametova, V.T.; Ustinov, S.A.; Minaev, V.A.; Petrov, V.A. Geological and Mineralogical Mapping Based on Statistical Methods of Remote Sensing Data Processing of Landsat-8: A Case Study in the Southeastern Transbaikalia, Russia. Sustainability 2022, 14, 9242. [Google Scholar] [CrossRef]
- Bertoldi, L.; Massironi, M.; Visonà, D.; Carosi, R.; Montomoli, C.; Gubert, F.; Naletto, G.; Pelizzo, M.G. Mapping the Buraburi granite in the Himalayas of Western Nepal: Remote sensing analysis in a collisional belt with vegetation cover and extreme variation of topography. Remote Sens. Environ. 2011, 115, 1129–1144. [Google Scholar] [CrossRef]
- Ayoobi, I.; Tangestani, M.H. Evaluation of relative atmospheric correction methods on ASTER VNIR–SWIR data in playa environment. Carbonates Evaporites 2017, 32, 539–546. [Google Scholar] [CrossRef]
- Pour, A.B.; Hashim, M.; van Genderen, J. Detection of hydrothermal alteration zones in a tropical region using satellite remote sensing data: Bau goldfield, Sarawak, Malaysia. Ore Geol. Rev. 2013, 54, 181–196. [Google Scholar] [CrossRef]
- Wang, Z.; Zhou, C.; Qin, H. Detection of hydrothermal alteration zones using ASTER data in Nimu porphyry copper deposit, south Tibet, China. Adv. Space Res. 2020, 65, 1818–1830. [Google Scholar] [CrossRef]
- Crosta, A.P.; Moore, J. Enhancement of Landsat Thematic Mapper imagery for residual soil mapping in SW Minais Gerais State, Brazil: A prospecting case history in greenstone belt terrain. In Proceedings of the 7th (ERIM) Thematic Conference: Remote Sensing for Exploration Geology, Calgary, AB, Canada, 2–6 October 1989; pp. 1173–1187. [Google Scholar]
- Adiri, Z.; Lhissou, R.; El Harti, A.; Jellouli, A.; Chakouri, M. Recent advances in the use of public domain satellite imagery for mineral exploration: A review of Landsat-8 and Sentinel-2 applications. Ore Geol. Rev. 2020, 117, 103332. [Google Scholar] [CrossRef]
- Sojdehee, M.; Rasa, I.; Nezafati, N.; Abedini, M.V. Application of spectral analysis to discriminate hydrothermal alteration zones at Daralu copper deposit, SE Iran. Arab. J. Geosci. 2016, 9, 41. [Google Scholar] [CrossRef]
- Fang, C.; Xu, B.; Hu, F.; Chen, X.; Liu, Y. Cu-polymetallic Deposit Prognosis in the Banggonghu-Nujiang Metallogenic Belt Based on ASTER Remote Sensing Alterration Information Extraction. Resour. Environ. Eng. 2016, 68, 65–82. [Google Scholar]
- Zheng, W.; Liu, B.; McKinley, J.M.; Cooper, M.R.; Wang, L. Geology and geochemistry-based metallogenic exploration model for the eastern Tethys Himalayan metallogenic belt, Tibet. J. Geochem. Explor. 2021, 224, 106743. [Google Scholar] [CrossRef]
- Rajabpour, S.; Hassanpour, S.; Radmard, K.; Moghaddasi, S.J. Nature and genesis of the Zaglic Au deposit, NW Iran: Constraints from geochemical studies. J. Geochem. Explor. 2022, 238, 107001. [Google Scholar] [CrossRef]
- Ghelichkhani, M.; Shafaroudi, A.M.; Karimpour, M.H.; Homam, S.M. Zangalou Manto-type deposit in the Sabzevar zone, northeast Iran: Evidence of mineralogy, geochemistry, U–Pb dating, fluid inclusion, and stable isotopes. Geol. J. 2023, 58, 465–496. [Google Scholar] [CrossRef]
- Andongma, W.T.; Gajere, J.N.; Amuda, A.K.; Edmond, R.R.D.; Faisal, M.; Yusuf, Y.D. Mapping of hydrothermal alterations related to gold mineralization within parts of the Malumfashi Schist Belt, North-Western Nigeria. Egypt. J. Remote Sens. Space Sci. 2021, 24, 401–417. [Google Scholar] [CrossRef]
- Atif, Y.; Soulaimani, A.; Lamqadem, A.A.; Pour, A.B.; Pradhan, B.; Nouamane, E.A.; Abdelali, K.; Muslim, A.M.; Hossain, M.S. Identifying hydrothermally altered rocks using ASTER satellite imageries in Eastern Anti-Atlas of Morocco: A case study from Imiter silver mine. Int. J. Image Data Fusion 2021, 13, 337–361. [Google Scholar] [CrossRef]
- Fu, Y.; Cheng, Q.; Jing, L.; Ye, B.; Fu, H. Mineral Prospectivity Mapping of Porphyry Copper Deposits Based on Remote Sensing Imagery and Geochemical Data in the Duolong Ore District, Tibet. Remote Sens. 2023, 15, 439. [Google Scholar] [CrossRef]
- Mansurov, M.I.; Imamverdiyev, N.A.; Karimov, V.M.; Ganbarova, E.F.; Damirov, T.J.; Mursalov, S.S.; Pashayev, N.V. The discovery of structural elements and zones of hydrothermal alterations by using ASTER satellite data in the margins of Gadabay and Murovdag ore districts (Lesser Caucasus, Azerbaijan). J. Geol. Geogr. Geoecol. 2021, 30, 512–527. [Google Scholar] [CrossRef]
- Long, K.R.; Van Gosen, B.S.; Foley, N.K.; Cordier, D. The Principal Rare Earth Elements Deposits of the United States: A Summary of Domestic Deposits and a Global Perspective; Springer: Dordrecht, The Netherlands, 2012. [Google Scholar]
- Xie, Y.; Hou, M.Z.; Li, C. Anisotropic characteristics of acoustic emission and the corresponding multifractal spectrum during progressive failure of shale under cyclic loading. Int. J. Rock Mech. Min. Sci. 2023, 165, 105364. [Google Scholar] [CrossRef]
- Wang, Q.; Wang, Y.; He, M.; Jiang, B.; Li, S.; Jiang, Z.; Wang, Y.; Xu, S. Experimental research and application of automatically formed roadway without advance tunneling. Tunn. Undergr. Space Technol. 2021, 114, 103999. [Google Scholar] [CrossRef]
Figure 1.
A sketch of the geological background of the East Tethys–Himalayan tectonic belt and the location of the Gondwanan orogenic belt [28,29]. (Ts, tertiary sedimentary rocks; THS, Tethys–Himalayan sedimentary sequence; HHM, high Himalayan metamorphic system; LHS, low Himalayan metasedimentary sequence; IYS, Indus–Yarlung Tsangpo suture zone; BNS, Bengong Lake—Nujiang suture zone; JS, Jinsha River suture zone; AKMS, Animachin–Kunlun–Muzetag suture zone; GLS, Ganzi–Litang suture zone; STDS, Southern Tibetan dissociation system; MCT, main central retrograde fault; MBT, main boundary retrograde fault; GCT, Gondes central retrograde).

Figure 2.
Laboratory spectra of alteration minerals in the study area [34]. The lines in the figure indicate the spectral change curve of the mineral or element and the corresponding ASTER image band, with the arrow pointing to highlight the apparent change of that mineral or element.
Figure 2.
Laboratory spectra of alteration minerals in the study area [34]. The lines in the figure indicate the spectral change curve of the mineral or element and the corresponding ASTER image band, with the arrow pointing to highlight the apparent change of that mineral or element.

Figure 3.
ASTER data pre-processing and spectral feature enhancement methodological flow chart.

Figure 4.
Comparison of the results of the traditional Crosta method (left) and the EPCA method (right) for extracting change information in selected areas of the study area.
Figure 4.
Comparison of the results of the traditional Crosta method (left) and the EPCA method (right) for extracting change information in selected areas of the study area.

Figure 5.
Spectral information of the band after iron-staining enhancement.

Figure 6.
Iron-stained alteration information in the enhanced waveband.

Figure 7.
Spectral information in the aluminum hydroxyl-enhanced band.

Figure 8.
Aluminum hydroxyl alteration information in the enhanced band.

Figure 9.
Spectral information in the magnesium hydroxyl-enhanced band.

Figure 10.
Magnesium hydroxyl alteration information in the enhanced band.

Figure 14.
Multisource geological information map of the Gondwana lithology–tectonics alteration.

Figure 15.
Rose map of linear geological formations. (The letters in the diagram indicate the orientation).
Figure 15.
Rose map of linear geological formations. (The letters in the diagram indicate the orientation).

Figure 16.
Chengba copper mine area.

Figure 17.
Banlong copper mine area.

Figure 18.
Sangri copper mine area.

Figure 19.
Heat map of multi-source geological information.

Figure 20.
Distribution of erosion information on the county zoning of the study area. (a) Neoproterozoic porphyry tectonic window in Saga County, Shigatse City, southwest of the study area; (b) Paleoproterozoic porphyry fracture zone in Xaitongmen County, Shigatse City, northwest of the study area; (c) Paleozoic and Paleocene granite porphyry fracture zone in the southern Tanggula Range, Nyingchi; (d) Paleozoic porphyry fracture zone in eastern Lhasa, central of the study area.

Figure 21.
Multi-source geoscience element concentration area. (a) Neoproterozoic porphyry tectonic window in Saga County, Shigatse City, southwest of the study area; (b) Paleoproterozoic porphyry fracture zone in Xaitongmen County, Shigatse City, northwest of the study area; (c) Paleozoic and Paleocene granite porphyry fracture zone in the southern Tanggula Range, Nyingchi; (d) Paleozoic porphyry fracture zone in eastern Lhasa, central of the study area.


Table 1.
ASTER main technical parameters.
| Remote Sensing Data | Channel | Waveband Number | Spectral Range/μm | Spatial Resolution/m |
|---|---|---|---|---|
| ASTER | VNIR | 1 | 0.52–0.60 | 15 |
| 2 | 0.63–0.69 | |||
| 3N | 0.78–0.86 | |||
| 3B | 0.78–0.86 | |||
| SWIR | 4 | 1.600–1.700 | 30 | |
| 5 | 2.145–2.185 | |||
| 6 | 2.185–2.225 | |||
| 7 | 2.235–2.285 | |||
| 8 | 2.295–2.365 | |||
| 9 | 2.360–2.430 |
Disclaimer/Publisher’s Note: The statements, opinions and data contained in all publications are solely those of the individual author(s) and contributor(s) and not of MDPI and/or the editor(s). MDPI and/or the editor(s) disclaim responsibility for any injury to people or property resulting from any ideas, methods, instructions or products referred to in the content. |
© 2023 by the authors. Licensee MDPI, Basel, Switzerland. This article is an open access article distributed under the terms and conditions of the Creative Commons Attribution (CC BY) license (https://creativecommons.org/licenses/by/4.0/).
Share and Cite
MDPI and ACS Style
Liu, C.; Qiu, C.; Wang, L.; Feng, J.; Wu, S.; Wang, Y. Application of ASTER Remote Sensing Data to Porphyry Copper Exploration in the Gondwana Region. Minerals 2023, 13, 501. https://doi.org/10.3390/min13040501
AMA Style
Liu C, Qiu C, Wang L, Feng J, Wu S, Wang Y. Application of ASTER Remote Sensing Data to Porphyry Copper Exploration in the Gondwana Region. Minerals. 2023; 13(4):501. https://doi.org/10.3390/min13040501
Chicago/Turabian StyleLiu, Chunhui, Chunxia Qiu, Luoqi Wang, Jie Feng, Sensen Wu, and Yuanyuan Wang. 2023. "Application of ASTER Remote Sensing Data to Porphyry Copper Exploration in the Gondwana Region" Minerals 13, no. 4: 501. https://doi.org/10.3390/min13040501
Note that from the first issue of 2016, this journal uses article numbers instead of page numbers. See further details here.