Article

Contamination Fingerprints in an Inactive W (Sn) Mine: The Regoufe Mine Study Case (Northern Portugal)

by
Helena Sant’Ovaia
1,2,*,
Cláudia Cruz
1,2,
Alexandra Guedes
1,2,
Helena Ribeiro
1,2,
Patrícia Santos
1,2,
Sónia Pereira
1,2,
Jorge Espinha Marques
1,2,
Maria dos Anjos Ribeiro
1,2,
Catarina Mansilha
3,4,
Helena Cristina Brites Martins
1,2,
Bruno Valentim
1,2,
Joana Torres
2,5,
Ilda Abreu
2,6,
Fernando Noronha
1,2 and
Deolinda Flores
1,2
1
Department of Geosciences, Environment and Spatial Plannings, Faculty of Sciences, University of Porto, Rua do Campo Alegre, 687, 4169-007 Porto, Portugal
2
Institute of Earth Sciences, University of Porto, Rua do Campo Alegre, 687, 4169-007 Porto, Portugal
3
Environmental Health Department, National Institute of Health Doctor Ricardo Jorge, Rua Alexandre Herculano, 321, 4000-055 Porto, Portugal
4
Laboratory for Green Chemistry of the Network of Chemistry and Technology, University of Porto, Praça do Cel. Pacheco, 42, 4050-083 Porto, Portugal
5
Higher School of Education of Fafe, European Institute of Higher Studies, Rua Universitária, 200, 4820-509 Medelo, Portugal
6
Department of Biology, Faculty of Sciences, University of Porto, Rua do Campo Alegre, 687, 4169-007 Porto, Portugal
*
Author to whom correspondence should be addressed.
Minerals 2023, 13(4), 497; https://doi.org/10.3390/min13040497
Submission received: 14 March 2023 / Revised: 26 March 2023 / Accepted: 27 March 2023 / Published: 31 March 2023
(This article belongs to the Special Issue Geochemistry, Environmental Impact and Remediation of Mining Areas)

Abstract

:
The target of this study was the tungsten Regoufe mine, whose exploitation stopped in the 1970s. When the mine closed, an unacceptable legacy constituted of mining waste tailings and the ruins of infrastructure was left behind. This work assessed the soil, plants, and water contamination in the mining area; namely their content in potentially toxic elements (PTEs). The global impact of PTEs in the Regoufe mine surface soil points to a very high to ultrahigh degree of contamination of the area having a serious ecological risk level, mainly related to As and Cd contributions. However, establishing the direct relation between As contamination and the anthropogenic effects caused by the mining process cannot be carried out in a straightforward manner, since the soils were already enriched in metals and metalloids as a result of the geological processes that gave origin to the mineral deposits. The studies performed on the plants revealed that the PTE levels in the plants were lower than in the soil, but site-specific soil concentrations in As and Pb positively influence bioaccumulation in plants. The magnetic studies showed the presence of magnetic technogenic particles concentrated in the magnetic fraction, in the form of magnetic spherules. The magnetic technogenic particles probably result from temperature increases induced by some technological process related to ore processing/mining activity. The PTEs in the surface and groundwater samples were similar and relatively low, being unlikely to pose potential health and environmental risks. Arsenic (As) constituted the exception, with levels above reference for drinking water purposes.

1. Introduction

The North of Portugal is particularly rich in metallic mineral resources, the exploitation of which began at the end of the 19th century. This exploitation took place in the form of several mines, where mainly tin and tungsten were exploited. These mines had their peak of exploitation during World War II, due to the interest in tungsten ores from the war industries. When these mines closed, they left a bad legacy: mining waste tailings, the ruins of infrastructure (of the washing plants, for example) and large corridors of galleries, access shafts and ventilation shafts. In terms of the environmental impact of these old mines, one of the main causes is related to the mining waste tailings that were left without any kind of intervention, representing a source of pollutants that are emitted, released, or leached into the surrounding environment. It is well documented that improper mining waste disposal will result in air, soil, and water contamination. This bad environmental legacy comes from a time when mining legislation was silent or non-existent on this aspect. The contamination caused by the disposal of mining waste is still far from being properly evaluated; namely, regarding the impact on the soils, water and plants of the surrounding areas.
Having these problems in mind, the target of this study was the mining area associated with Regoufe granite where several tungsten-rich deposits occur in and around the granite body [1], and whose exploitation stopped in the 1970s. After the closure of the mine, environmental intervention was practically nonexistent.
The contamination assessment of the soils and plants has been conducted in other mining areas of Europe (e.g., [2,3]). In the Regoufe mining area, significant work has already been carried out to assess contamination, namely through chemical, physical-chemical and mineralogical analyses and the determination of the main potentially toxic elements (e.g., [4] and references therein) and more recently, using geophysical methodologies to assess the subsurface distribution of potentially contaminating fluids (e.g., [5] and references therein).
In the present research, framed in the project named “Soil health surrounding former mining areas: characterization, risk analysis, and intervention” developed at the “Universidade do Porto”, four main objectives were addressed:
  • To assess the geochemical composition of soils/waste mining tails; namely, their content in potentially toxic elements (PTEs), which include metals and metalloids that, in high concentration levels, can lead to social and human health-risk concerns;
  • To trace anthropogenic pollution, by applying environmental magnetism techniques; namely, identifying ferromagnetic minerals in soils and waste mining tails sampled in the surrounding area of the Regoufe mine;
  • To investigate the possible influence of site-specific PTE concentrations in soils and waste mining tails in plant bioaccumulation by accessing their chemical composition;
  • To evaluate the possible impact of mining in the chemical composition of groundwater.

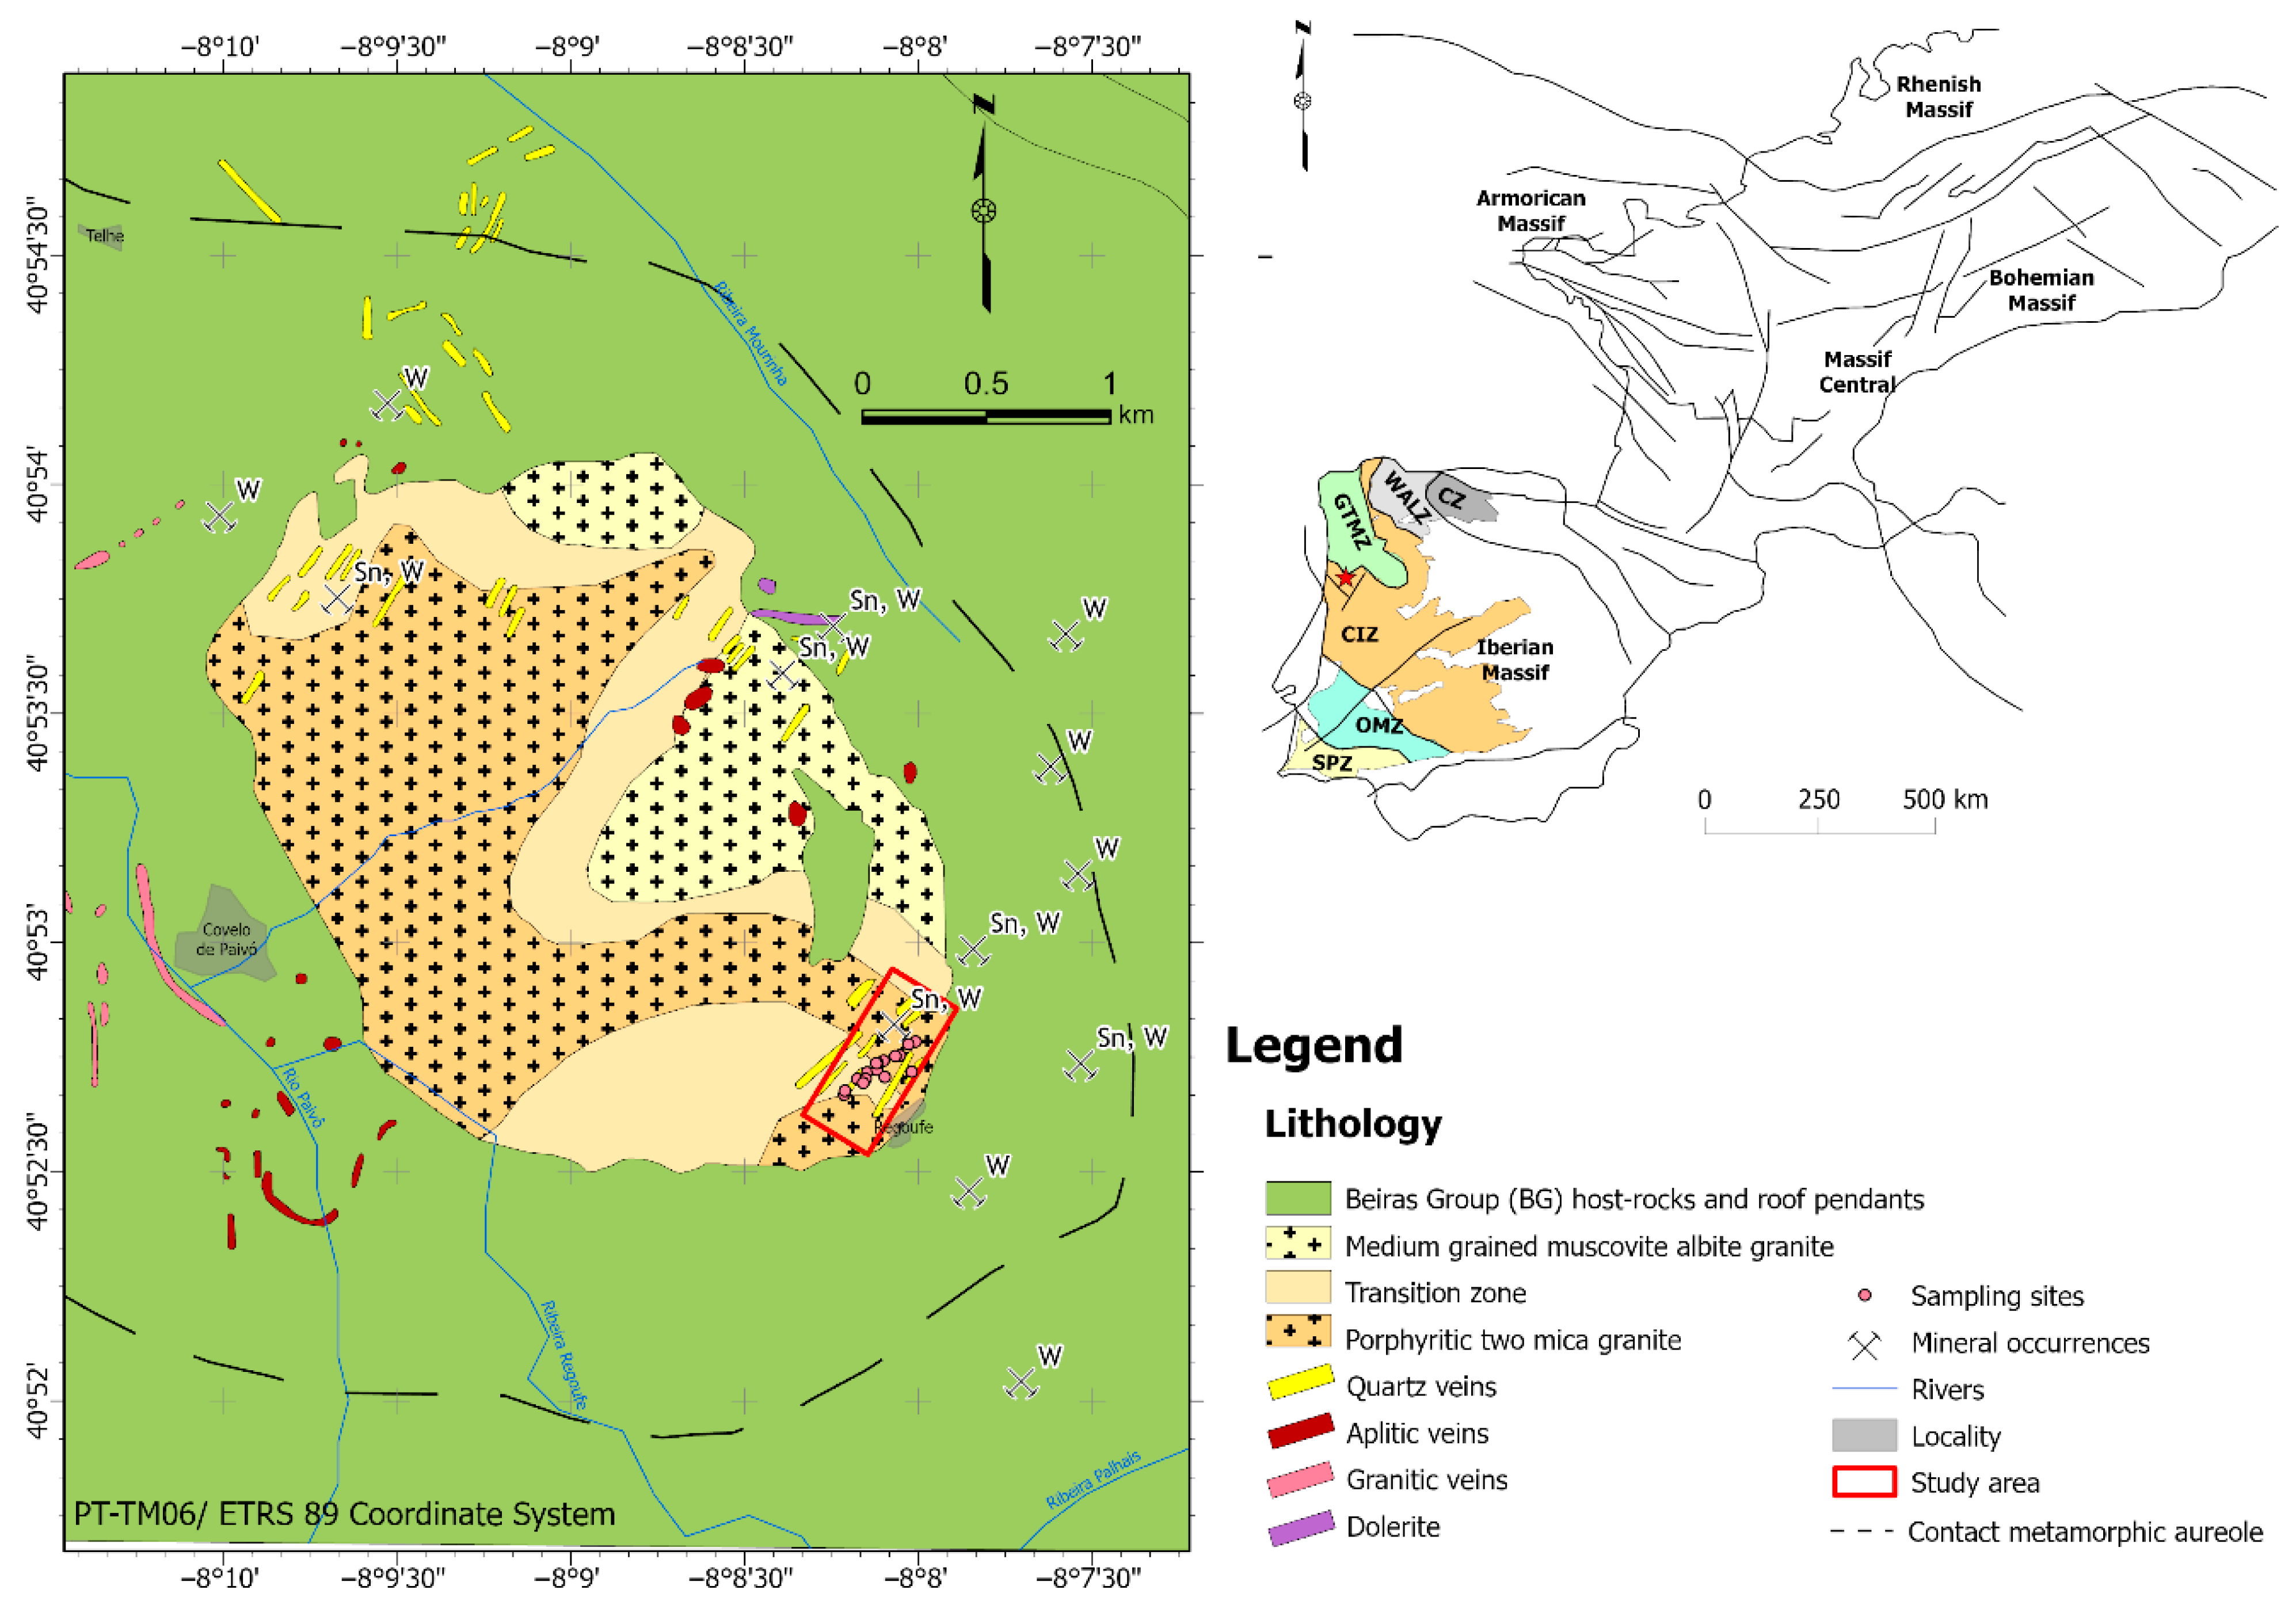
2. Geological Setting

The Iberian massif has traditionally been subdivided into six tectonostratigraphic zones, each reflecting a variable structural, stratigraphic and magmatic–metamorphic evolution: the Cantabrian, the West Asturian-Leonese, the Galicia-Trás-os-Montes, the Central Iberian, the Ossa-Morena and the South Portuguese Zones (Figure 1) [6,7,8]. The studied area is located in the autochthonous terrains of the Central Iberian Zone (CIZ). Variscan orogeny resulted from the oblique collision between the supercontinents Laurussia and Gondwana during the Lower Devonian to Carboniferous times [9,10]. In the Northwest (NW) of the Iberian Massif, three main ductile Variscan deformation phases (D1, D2, and D3) were described with ages of 360–337 Ma, 337–320 Ma, and 320–310 Ma, respectively [11]. However, in the autochthonous terrains, only two phases are considered (D1 and D3) because D2 is associated with thrusts. After D3, the deformation regime is essentially brittle.
Portuguese Variscan granites are synorogenic and based on geological, petrographic, and geochemical studies; they have been divided into two main groups: (a) two-mica granites (muscovite > biotite)—usually leucocratic granites with primary muscovite and biotite, mesocrustal in origin, and (b) biotitic granites (biotite ≫ muscovite)—originating in the lower crust [12]. The two-mica granites are mainly syntectonic regarding the third phase of deformation (syn-D3) and are usually emplaced in the nucleus of regional D3 folds. The biotite granites have their intrusion mainly controlled by shear zones and by late-Variscan tectonic structures, and they can be syn-D3 (321–323 Ma), late-D3 (312–305 Ma), late- to post-D3 (ca. 300 Ma), or post-D3 (<299 Ma) [13,14]. In the CIZ, a large amount of Variscan granites are present. The syn-D3 granites are represented by two-mica peraluminous granites, granodiorites, and biotitic granites. The late-D3 and post-D3 granitoids are represented by biotitic granites, granodiorites, diorites, quartzo-monzodiorites, and gabbros.
Figure 1. Geological sketch of the Iberian Variscan belt simplified. CZ—Cantabrian Zone, WALZ—West Asturian Leonese Zone, GTMZ—Galicia Trás-os-Montes Zone, CIZ—Central Iberian Zone, OMZ—Ossa Morena Zone, SPZ—South Portuguese Zone (based on [7,8]). Geological map of the Regoufe area modified from [15] and location of the study area.
Minerals 13 00497 g001
In the study area, two main geological entities can be described: the Neoproterozoic-Cambrian metasediments belonging to the Beiras Group (BG) and the late-D3 Regoufe granite (Figure 1). The BG is the southern group of a thick and relatively monotonous sequence of phyllites and graywackes, which is commonly known as the “Schist Graywacke Complex” (CXG) [16]. In the area, the BG consists of a monotonous alternation of thin-bedded semi-pelitic rocks (metapelites, metasiltstones and quartzitic sandstones) with subordinate pelitic beds. The pelites were transformed into slates and phyllites during lower greenschist regional metamorphism [17], with a very penetrative foliation (S1) (Figure 2a,b). The predominant semi-pelitic levels in the area show a soft S1 foliation. The S1 foliation is, in both pelitic and semi-pelitic rocks, parallel to the stratification (S0). The S0 is a main primary anisotropy that is well-marked even in the fine alternations. S0 and S1 are vertical, with a general WNW–ESE to NW–SE orientation and present cm scale to micro-folding with a vertical axe and a vertical crenulation cleavage parallel to the axial plane, with NW–SE orientation (Figure 2c,d). The microscopy puts in evidence the control of S0 on the development of the tectonic foliation S1 and that the later crenulation cleavage is restricted to the pelitic beds (Figure 2e,f).
Near the Regoufe granite intrusion, in the thermal metamorphic aureole, a strong presence of cordierite porphyroblasts is restricted to the pelitic host rocks and is much more abundant in the western boundary of the granite. The cordierite is strongly altered to a fine-grained aggregate of white mica and chlorite, but these pseudomorphoses preserve the internal foliation (Si) of the porphyroblasts which allows the cordierite blastesis to be considered as syn-kinematic with crenulation cleavage. The foliation is slightly crenulated and the crenulation is particularly intense and molded around the porphyroblasts (Figure 2).
The Regoufe pluton is represented by an outcrop of approximately 6 km2 with a slightly elongated circular geometry in the NW–SE direction (Figure 1). The Regoufe pluton is described as a muscovite-albite porphyritic granite, with a whole-rock Rb-Sr age of 280 ± 8 Ma [18]. Even so, although muscovite is a major constituent of the granite, three granitic facies can be described: (i) a medium-grained muscovite-albite granite (in the northern and eastern parts of the pluton), that passes to (ii) a tourmaline-bearing porphyritic two-mica granite (particularly in the western sector) through a (iii) non-uniform mineralogical transition zone [15] (Figure 1).
The granite porphyritic texture is due to the presence of scattered potassium feldspar mega crystals (Figure 3a,d,g). Petrographic studies show an identical mineralogical composition of the three facies, mostly constituted by feldspar, quartz and muscovite (Figure 3b,c,e,f,h,i); however, the facies that outcrop in the north and eastern zone of pluton—medium-grained muscovite-albite granite—contain arsenopyrite and are richer in muscovite and albite (Figure 3b) than the other facies. On the other hand, tourmaline is more abundant in the western zone—porphyritic two-mica granite, occurring in more developed and larger crystals (Figure 3f).
The final stages of the granite intrusion were followed by the circulation of hydrothermal fluids that allowed the precipitation of mineralization in quartz veins. These processes also produced the alteration of granite and metasedimentary rocks.
The mineralized quartz veins, from the studied mine, which occur, cutting the Regoufe granite, are ca. 10 to 20 cm thick, and have a mean direction between N 30° and N 45°. These veins have wolframite (Figure 4a,b), cassiterite (Figure 4b), arsenopyrite (Figure 4c,d), and also minor amounts of pyrite, sphalerite, apatite, and beryl.

3. Materials and Methods

3.1. Sampling Procedures

In this work, the environmental impact assessment of the mining activity in Regoufe framed into the proposed objectives was carried out by several methodologies: magnetic characterization and geochemistry of soils, mining waste tails and plants, and hydrogeochemistry. Samples of soils, mining waste, plants, and water were obtained in the mining area (Figure 5).
To characterize the geochemistry and magnetic behavior of the soils and mining wastes tails, a total of 19 points were sampled in the area (Figure 6). These points were in a valley next to the old mining facilities, in a linear transect, along the watercourse, covering an area of ca. 2 km. Soil samples were collected, after cleaning of the cover vegetation, using a plastic shovel and consisted of ca. 1 kg of material that was stored in a plastic bag. The geographic coordinates of each sampling site were obtained using a GPS. Samples were dried, disaggregated, homogenized and sieved below 2 mm.
Plant samples were collected, at all soil sampling points, with roots and flowers, when available, and stored in paper bags. In the palynology laboratory of the Faculty of Sciences of the University of Porto, the plants were taxonomically identified by observing their morphological features to follow the Portuguese Flora dichotomous key. Water was sampled at three locations in February 2022 (Figure 6): groundwater from a mine gallery draining the main mining zone in the western sector of the study area (P1); surface water collected 80 m downstream of the mine drainage gallery (P2); groundwater from an isolated mine gallery situated on the western slope of the study area (P3). No other flowing water points were identified, given that the Regoufe territory was affected by a severe drought, according to the Palmer Drought Severity Index applied by IPMA [19]. The water sampling procedure followed the standard methods established by ISO 5667-3:2018 Water quality—Sampling—Part 3. The water was collected avoiding agitation or disturbance. In the case of some parameters, special preservatives were added with caution to prevent them from flushing out of the sampling bottle. Water samples were stored in polyethylene or glass bottles and entered the laboratory within 5 h after sampling. Water temperature, pH, and electrical conductivity (EC) were measured in situ using a multiparametric meter from Hanna Instruments (Woonsocket, RI, USA), model HI-991300.

3.2. Geochemistry Analysis

The assessment of soil contamination was determined in 17 of the 19 soil samples collected (Table 1). Samples were milled to 125 μm in an agate mortar for further multi-elemental chemical analyses by ICP-MS analysis. This analysis was carried out at ACME Analytical Laboratories (Vancouver, BVC, Canada) using the method of four-acid digestion Ultratrace ICP-MS analysis. A sample weight of 0.25 g was heated to fuming in a tri-acid mixture (HF–HClO4–HNO3) and taken to dryness. Subsequently, the residue was dissolved in HCl. Resulting solutions were then analyzed by ICP-MS. Analytical results of certified reference materials (STD OREAS45H and STD OREAS501D), blanks and random duplicate samples were used for quality control of the analytical procedure.
Potentially toxic elements (PTE), As, Mn, Zn, Cu, Cr, Ni, Pb, Cd, Co, and Se concentrations were determined in order to assess their enrichment and degree of soil contamination. For the assessment, various contamination indices were used: geoaccumulation index (Igeo), contamination factor (CF), modified degree of contamination (mCd), potential ecological risk index (PERI), and potential toxicity response index (RI) (Table S1), with the aim of deriving realistic estimates for the amount of contamination that has impacted the soils in the valley of the Regoufe mine.

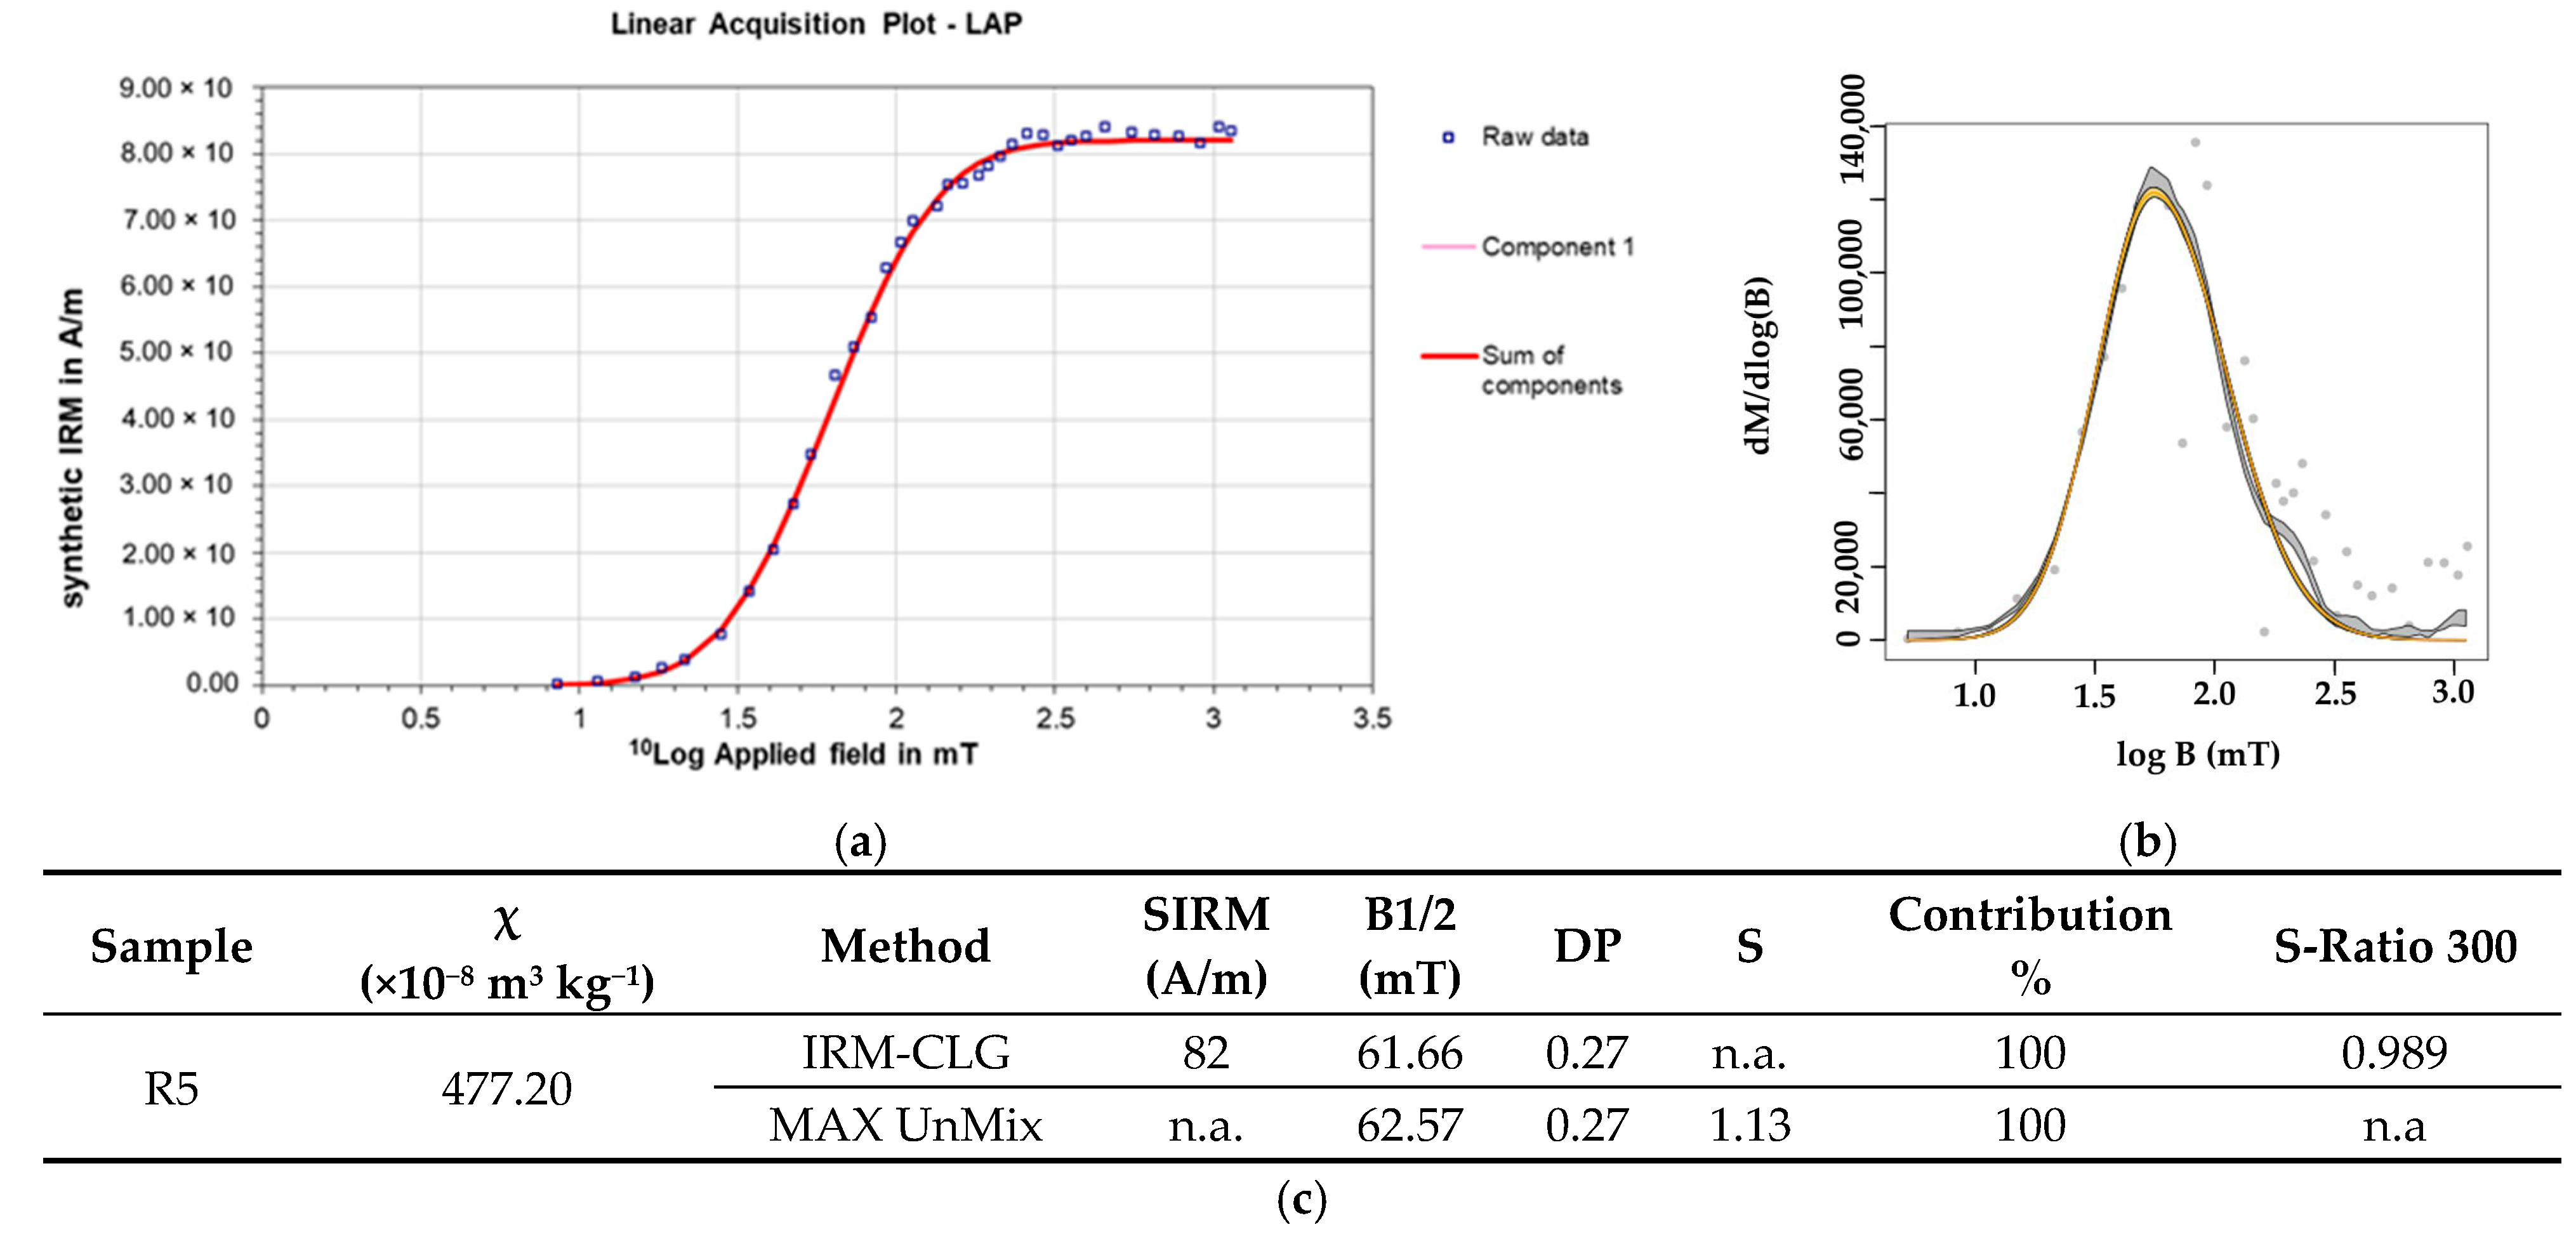
3.3. Magnetic Methodologies

In soils, the magnetic parameters result from contributions of all soil-forming minerals and vary with the concentration and composition of those minerals, depending particularly on their ferromagnetic content, especially magnetite, maghemite, and hematite. The soil magnetic response is also disturbed by airborne particulates that originated during several anthropogenic activities [20] that can have a ferromagnetic signal. In this study, the magnetic methods used to identify the ferromagnetic minerals/particles in the samples were the following: mass magnetic susceptibility (χ), frequency-dependent magnetic susceptibility (χfd%), and acquired isothermal remanent magnetization (IRM) curves, complemented by scanning electron microscope (SEM) images of the soil magnetic fraction.
Magnetic susceptibility measures the soil magnetic response to a low external magnetic field. The specific or mass magnetic susceptibility χ, is defined as the ratio of the material magnetization J (per mass unit) to the low external magnetic field H (Equation (1)):
J = χH (m3/kg)
The samples were exposed to a magnetic field of 300 A/m, on a magnetic susceptibility scale Kappabridge KLY-4S from Advanced Geoscience Instruments Company (AGICO) supported by SUMEAN software (vers. 2.0, AGICO, Brno, Czech Republic). For each sample, three measurements were taken, and the average value was considered.
The frequency-dependent susceptibility (χfd%) is a clear indicator of the presence of ferrimagnetic grains, reflecting the concentration of superparamagnetic (SP) grains and allowing for the identification of SP particles characterized by a dimension of lower than 0.03 μm. Samples in which these particles are present have slightly lower magnetic susceptibility values when measured at high frequency. On the other hand, in samples where these particles are absent, the magnetic susceptibility values are identical at the two frequencies [21]. The frequency-dependent susceptibility (Equation (2)) measurements were obtained with a Bartington MS2 System. Two field frequencies with 0.46 kHz and 46 kHz were applied for the measurements of the low-field magnetic susceptibility, at low frequency, χlf, and at high frequency, χhf.
χfd% = (χlf − χhf)/χlf × 100%
The mass magnetic susceptibility and frequency-dependent magnetic susceptibility measurements took place at the “Instituto de Ciências da Terra—Polo da Universidade do Porto”.
Isothermal remanent magnetization (IRM) refers to the remanence acquired by a sample exposed to a direct magnetic field H at room temperature. The analyses of IRM acquisition curves allows for the estimation of the characteristic coercivity of the ferromagnetic minerals [22]. The IRM at 1 T is defined as saturation isothermal remanent magnetization (SIRM). The IRM acquisition curves can be represented by a cumulative log-Gaussian function (CLG) [22]. By decomposing the IRM curve into different CLG curves, which are a function of SIRM, mean coercivity, and dispersion index, it is possible to identify the ferromagnetic minerals present in the studied rocks and their relative concentrations. The unmixing of the magnetic components was performed by use of two statistical methods that decompose the magnetization curves, namely, cumulative log-Gaussian (CLG) function with the software developed by Kruiver [23] and MAX UnMix statistical unmixing by Maxbauer [24]. While magnetic susceptibility is affected by all the minerals present in the rock, diamagnetic, paramagnetic, and ferromagnetic (s.l.), SIRM is affected by the ferromagnetic (s.l.) minerals and also by their grain size.
For this process, selected samples were chosen and first subjected to demagnetization by the use of an alternating field (AF) demagnetizer coupled to an anhysteretic field magnetizer (Molspin). Thus, the samples were exposed to an alternating field comparable to a sinusoid, whose magnitude decreased over time. Then, the magnetic field (H) was applied to the sample, always in the same direction, using a strong field magnetizer to obtain the acquisition curves of the isothermal remanent magnetization (IRM) (IM-10, ASC Scientific). The resulting remanent was measured at each induction step until saturation was reached, using a Minispin (Molspin) magnetometer. These measurements were performed at the “Faculdade de Ciências e Tecnologia da Universidade de Coimbra”.
Table 1. Potentially toxic elemental concentration—PTE (mg/kg) measured in the soil surface samples collected at Regoufe’s mine main valley. For each element, the highest values are highlighted in bold and the lowest in italic underlined (WRBS—value for world reference background soils [25]).
Potentially Toxic Elements (PTEs) in mg/kg
SamplesAsMnZnCuCrNiPbCdCo
R11088.4811.0193.82.63.03.313.13.10.3
R2967.2772.084.53.08.08.514.11.10.4
R31353.8940.0235.731.110.05.0106.75.84.3
R4745.9856.0155.513.57.05.467.60.61.0
R57784.21072.0504.587.422.019.31977.412.06.4
R62905.4821.0166.117.37.05.141.32.21.4
R73412.6921.0187.620.48.04.978.53.21.3
R87418.8722.0195.638.49.06.4177.05.21.3
R92513.0932.0310.922.313.012.2154.93.52.9
R123194.71045.0209.019.86.03.8101.93.91.4
R13421.4567.0115.26.26.03.645.20.11.5
R142900.7889.0191.67.96.04.1432.33.81.2
R151271.6986.0216.27.35.03.832.92.71.8
R16>10,000.01133.0280.442.514.04.6216.59.31.5
R173224.6794.0253.334.07.05.249.33.81.2
R181600.6716.0297.128.37.04.6122.62.71.8
R192644.0617.0343.332.214.07.9247.710.02.1
STD OREAS45H18.442236.7791.1693465.012.12<0.0293.3
STD OREAS501D12.339486.72642.34422.924.840.249.9
Median2578.5856.0209.020.47.05.0101.93.51.4
Max>10,000.01133.0504.587.422.019.31977.412.06.4
Min421.4567.084.52.63.03.313.10.10.3
WRBS11.457167.828.270.917.828.40.49

3.4. Plant Analysis

Only plants collected at the sampling points where the soil presented the higher and lower PTE concentrations were further analyzed. With this framework, it was possible to considerably restrain the hypothesis that the variable most influencing the bioaccumulation rate would be PTE concentration rather than other soil physical-chemical parameters. The plant species analyzed correspond to a herb, Sedum anglicum Huds, and a grass, Lolium sp. (Figure 7). These are typical annual spontaneous flora in the area, so the possible bioaccumulation, at the stem and flower parts, occurs during its growth every year, while the root system persists in the soil all year long.
In the laboratory, the different plant parts were separated, washed abundantly with distilled water and dried until constant weight at 65 °C. For the inorganic chemical analysis, the plant samples were ground using a mixer mill MM200 (Retsh) in recipients and with beads, both of zirconia, for 5 min. Afterward, the samples were transferred to appropriate boxes and the elemental composition was measured using a X-MET 7000 handheld energy dispersive X-ray fluorescence (EDXRF) (Oxford Instruments, Abingdon, Oxfordshire, UK).

3.5. Water Analysis

Analyses were performed according to accredited analytical procedures under ISO/IEC 17025 standard. Precision and accuracy were calculated for all analytical methods with values < 10%. Uncertainties were also calculated with results varying from 2 to 15%. Total alkalinity and bicarbonate (HCO3) were analyzed by titration. Major inorganic ions (Na+, K+, Mg2+, Ca2+, Cl and SO42−) were analyzed by ion chromatography (Dionex System DX-120/ICS-1000, Dionex Corporation, Sunnyvale, CA, USA). Potentially toxic elements (Mn, Cu, Zn, As and Cd) were analyzed in a Varian AA240 Atomic Absorption Spectrometer (Varian Inc., Palo Alto, CA, USA). Aluminum (Al) and iron (Fe) were analyzed in a continuous segmented flow instrument (San-Plus Skalar, Skalar Analytical, Breda, The Netherlands).

4. Results and Discussion

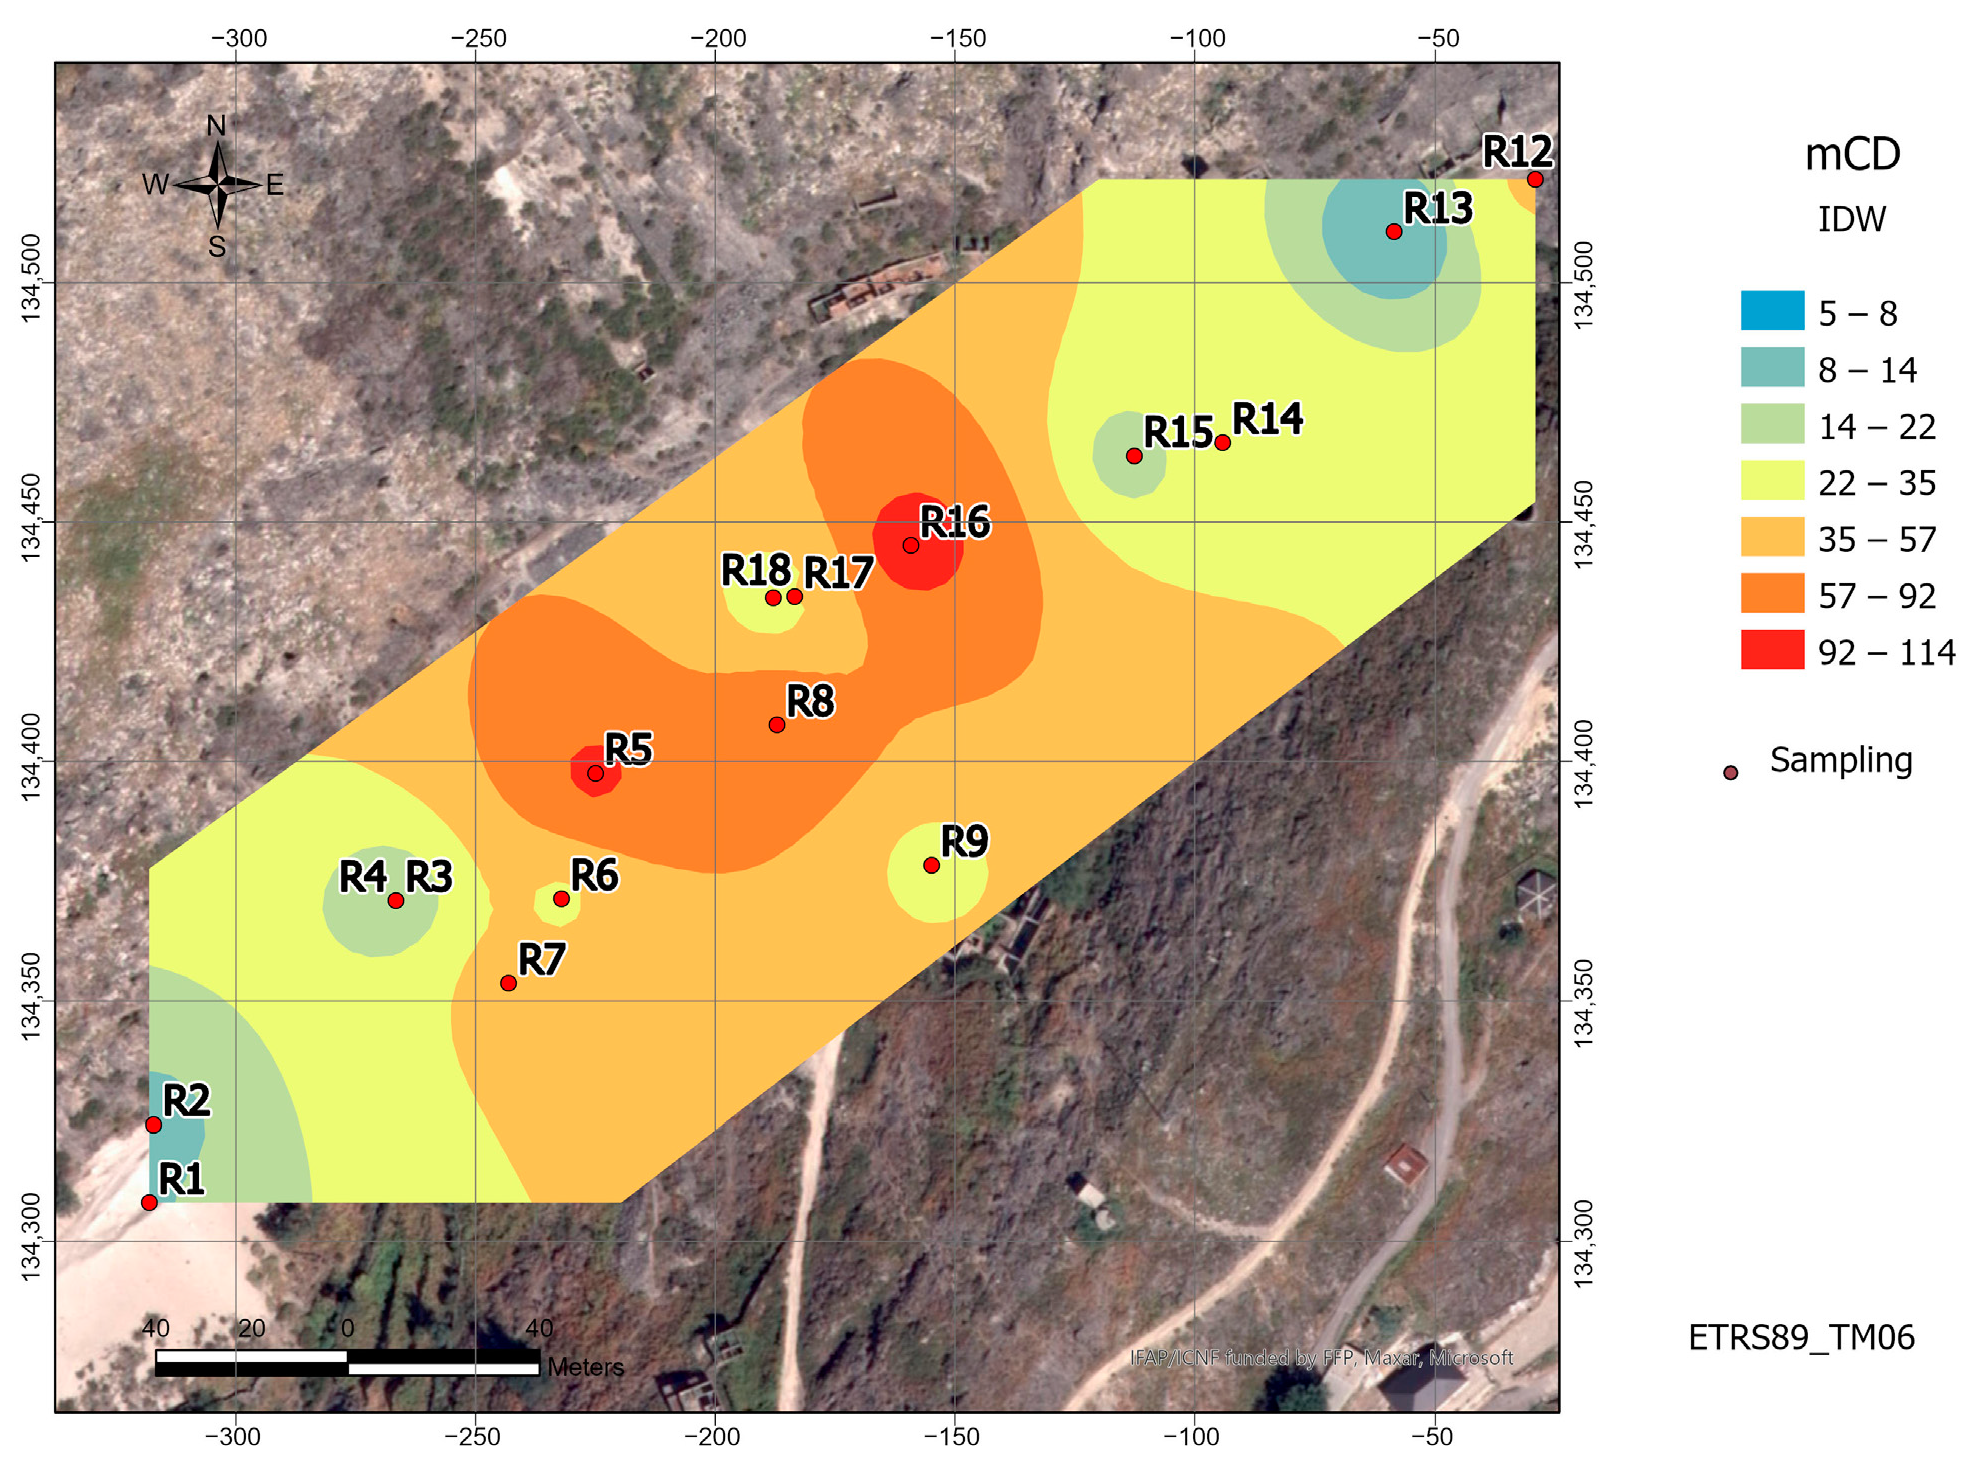
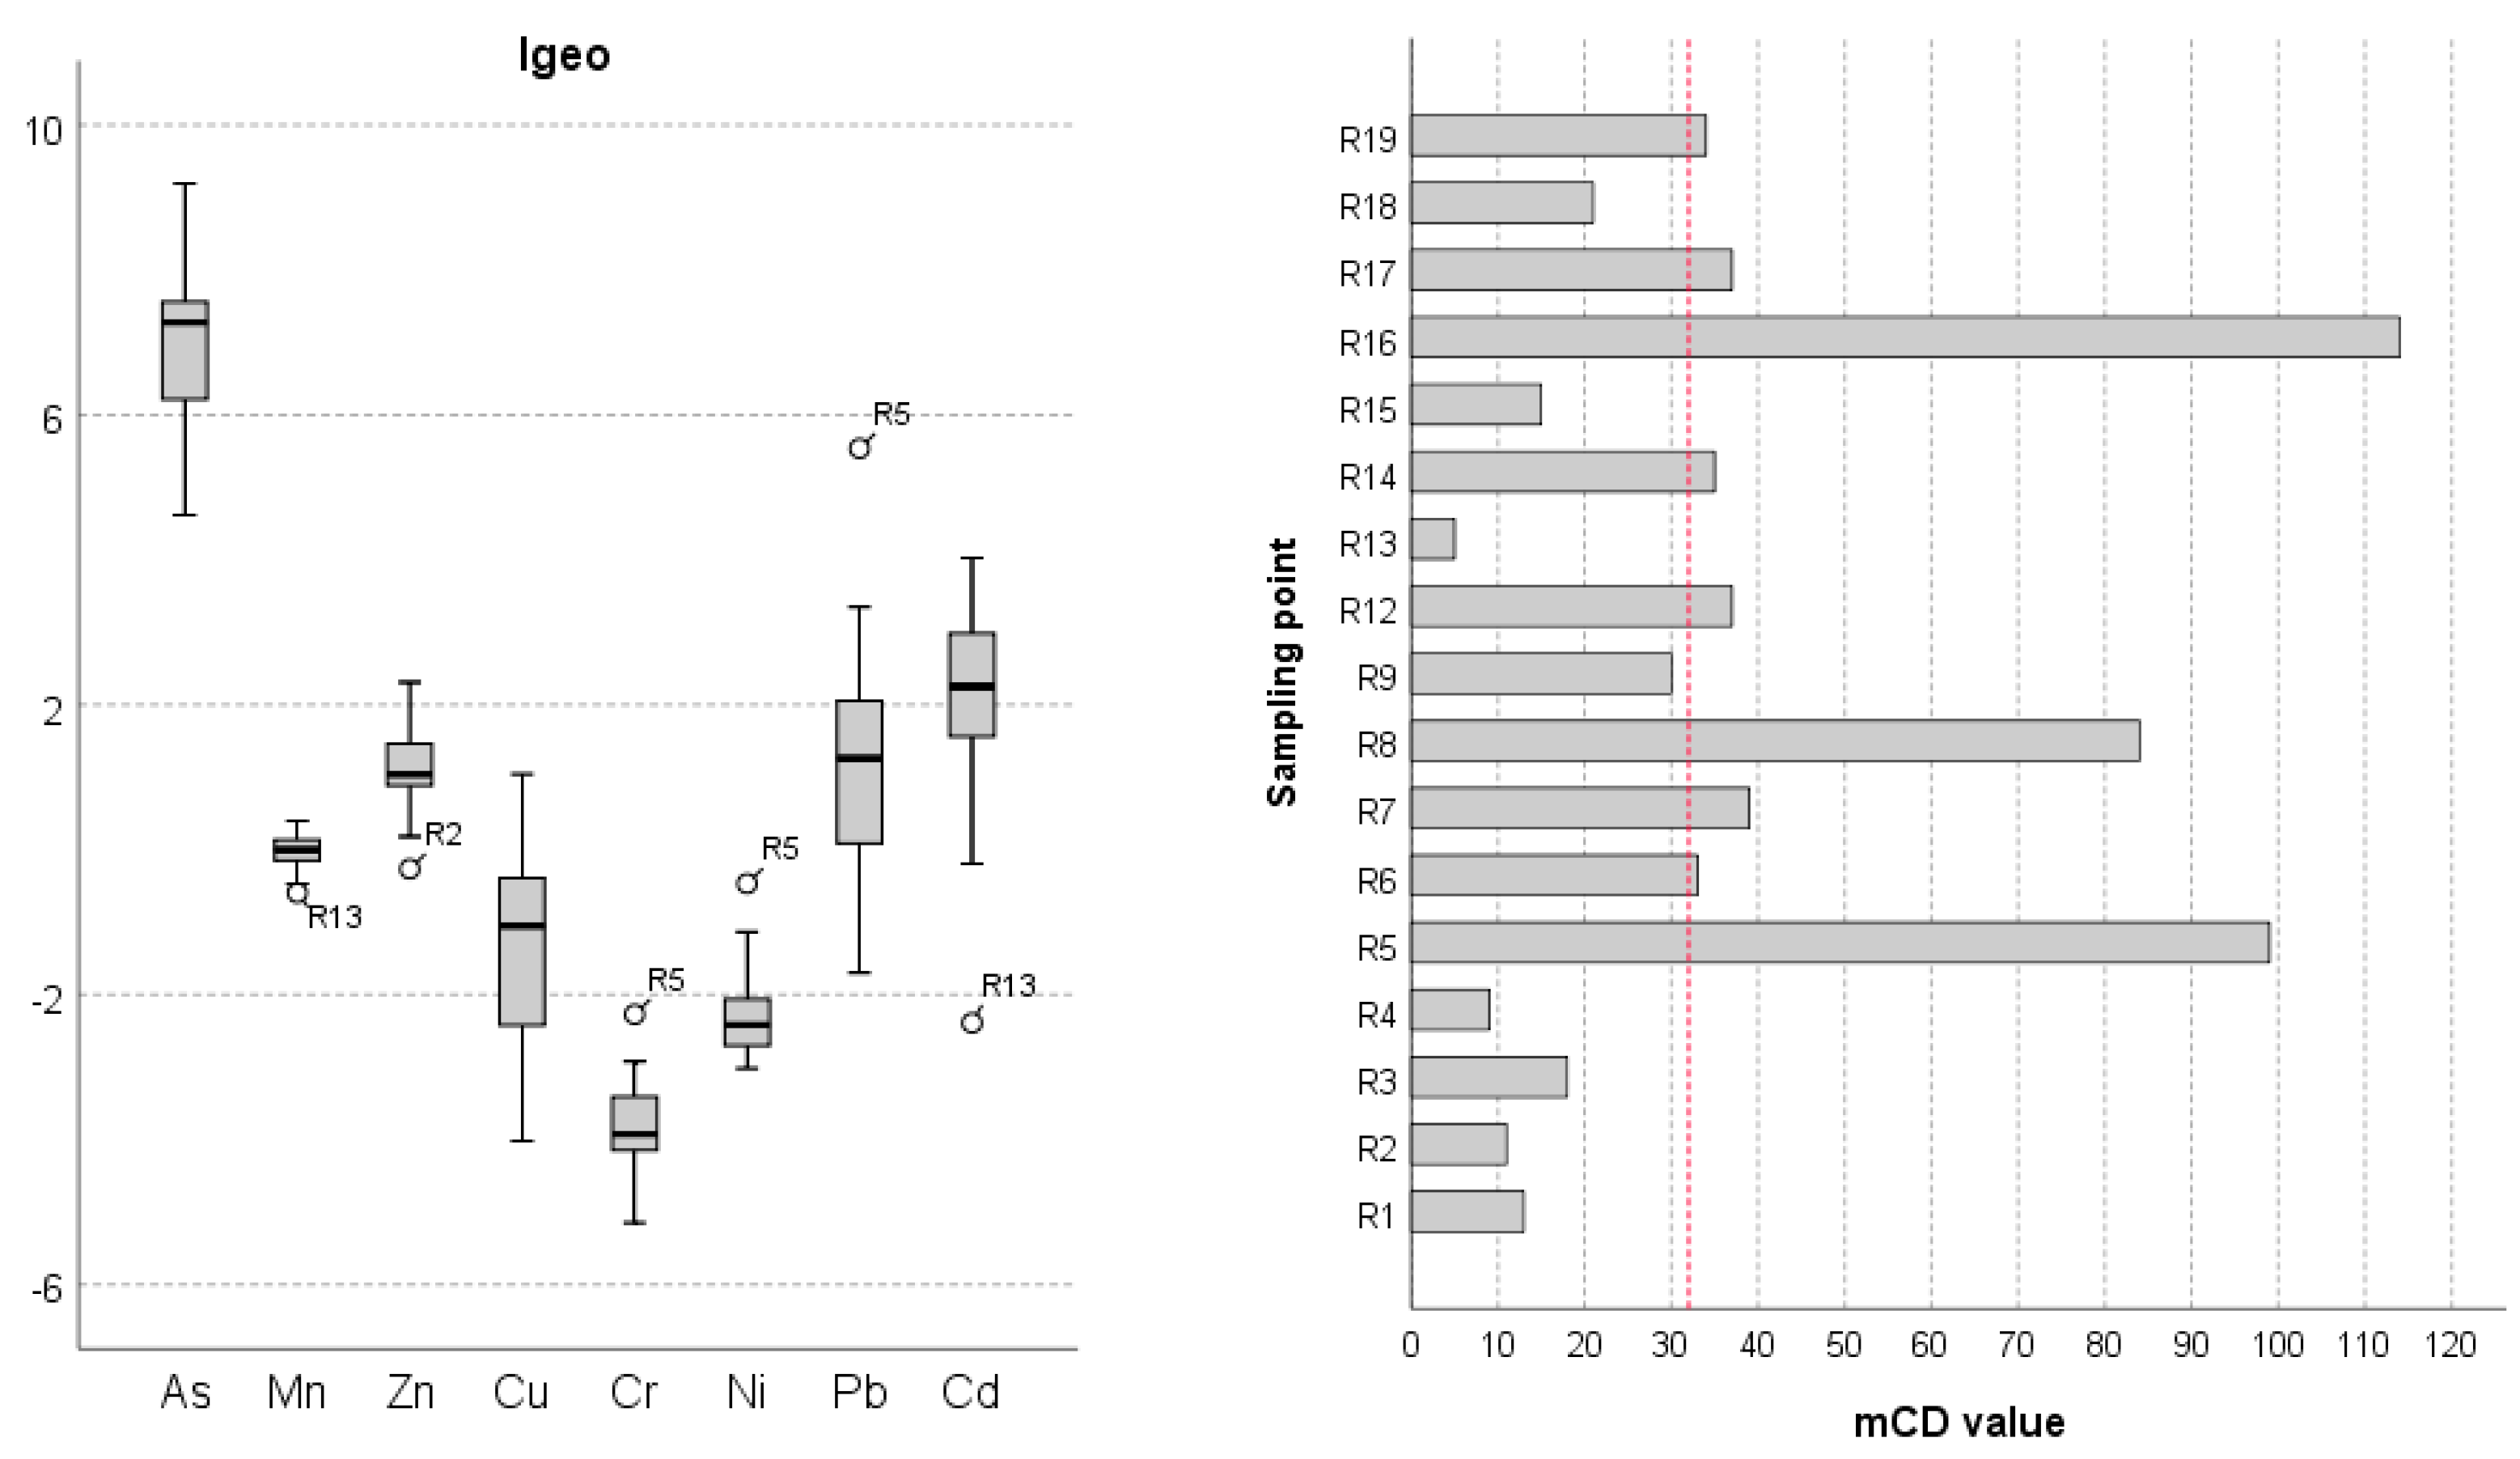
4.1. Soil Geochemistry

The concentrations of the studied PTE (As, Mn, Zn, Cu, Cr, Ni, Pb, Cd and Co) in the collected soils are presented in Table 1.
The concentrations of the PTEs varied widely: As (421–>10000 mg/kg), Mn (567–1133 mg/kg), Zn (84.5–504.5 mg/kg), Cu (2.6–87.4 mg/kg), Cr (3.0–22.0 mg/kg), Ni (3.3–19.3 mg/kg), Pb (13.1–1977.4 mg/kg), Cd (0.1–12.0 mg/kg) and Co (0.3–6.4 mg/kg). The sample R5, corresponding to the washing plant point, presented the overall highest concentration of PTE values; only R16 reported higher As and Mn values. Compared with the past study of Durães et al. [4] performed in the mining area, in this study, higher maximum values were only observed for As and Pb; all other PTEs considered presented lower values.
The sampling points with a higher local mCD index were those close to and within the draining area of the washing plant (>32), with the highest values obtained in soils downhill from the washing plant (sample R5) and close to the mining effluent discharge point (sample R16), while the lower values (5–15) were registered in the waste tailings area and pedestrian trails. Overall, the mCD indexes point to a very high to ultrahigh degree of contamination (Figure 8).
According to the PERI index and based on the CF values, most of the samples presented concentrations of the selected PTEs higher than the average world background soils. Very high levels of As and Cd, high levels of Pb and Zn, and moderately levels of Mn and Cu were observed. The average Igeo index was: As > Cd > Pb > Zn > Mn > Cu > Ni > Cr, those of most concern being As, Cd, Pb and Zn, with most samples classified as moderate to highly contaminated with these elements (Figure 9).
Potentially toxic elements (PTEs), which include metals and metalloids (Cd, Pb, Zn, Cu, Fe, As, among others), are often naturally present in the environment, being constituents of rocks, sediments, and soils. However, in this study case, excess concentrations were observed, compared with the world background soils average values [25]. Overall, the global impact of PTEs in the Regoufe mine surface soils, ascertained by the RI index, was higher than 600 (3076.3), classified as having a serious ecological risk level, mainly related to the As and Cd contributions. Nonetheless, at this stage, the anthropogenic effects caused by the mining process cannot be individualized from the natural effects of the metallogenic concentration in soils due to the pedogenesis of rocks previously enriched in metals and metalloids as result of the geological processes that gave origin to the mineral deposits. Sample R19 is located uphill from the mine, in a position where there is no influence from industrial mining processes, its wastes or any effect of mining drainage; therefore, its geochemical signature should be closer to the local background; however, as can be seen from Table 1, the concentrations of PTEs in this sample do not seem very different when compared to the soil samples collected along the mine valley. The enrichment of PTEs in sample R19 in comparison to world soils is potentially the result of natural metallogenic enrichment, and further detailed studies should be made in order to characterize the regional geochemical background, allowing the isolation of the mining anthropogenic effects from the natural geological geochemical enrichment.

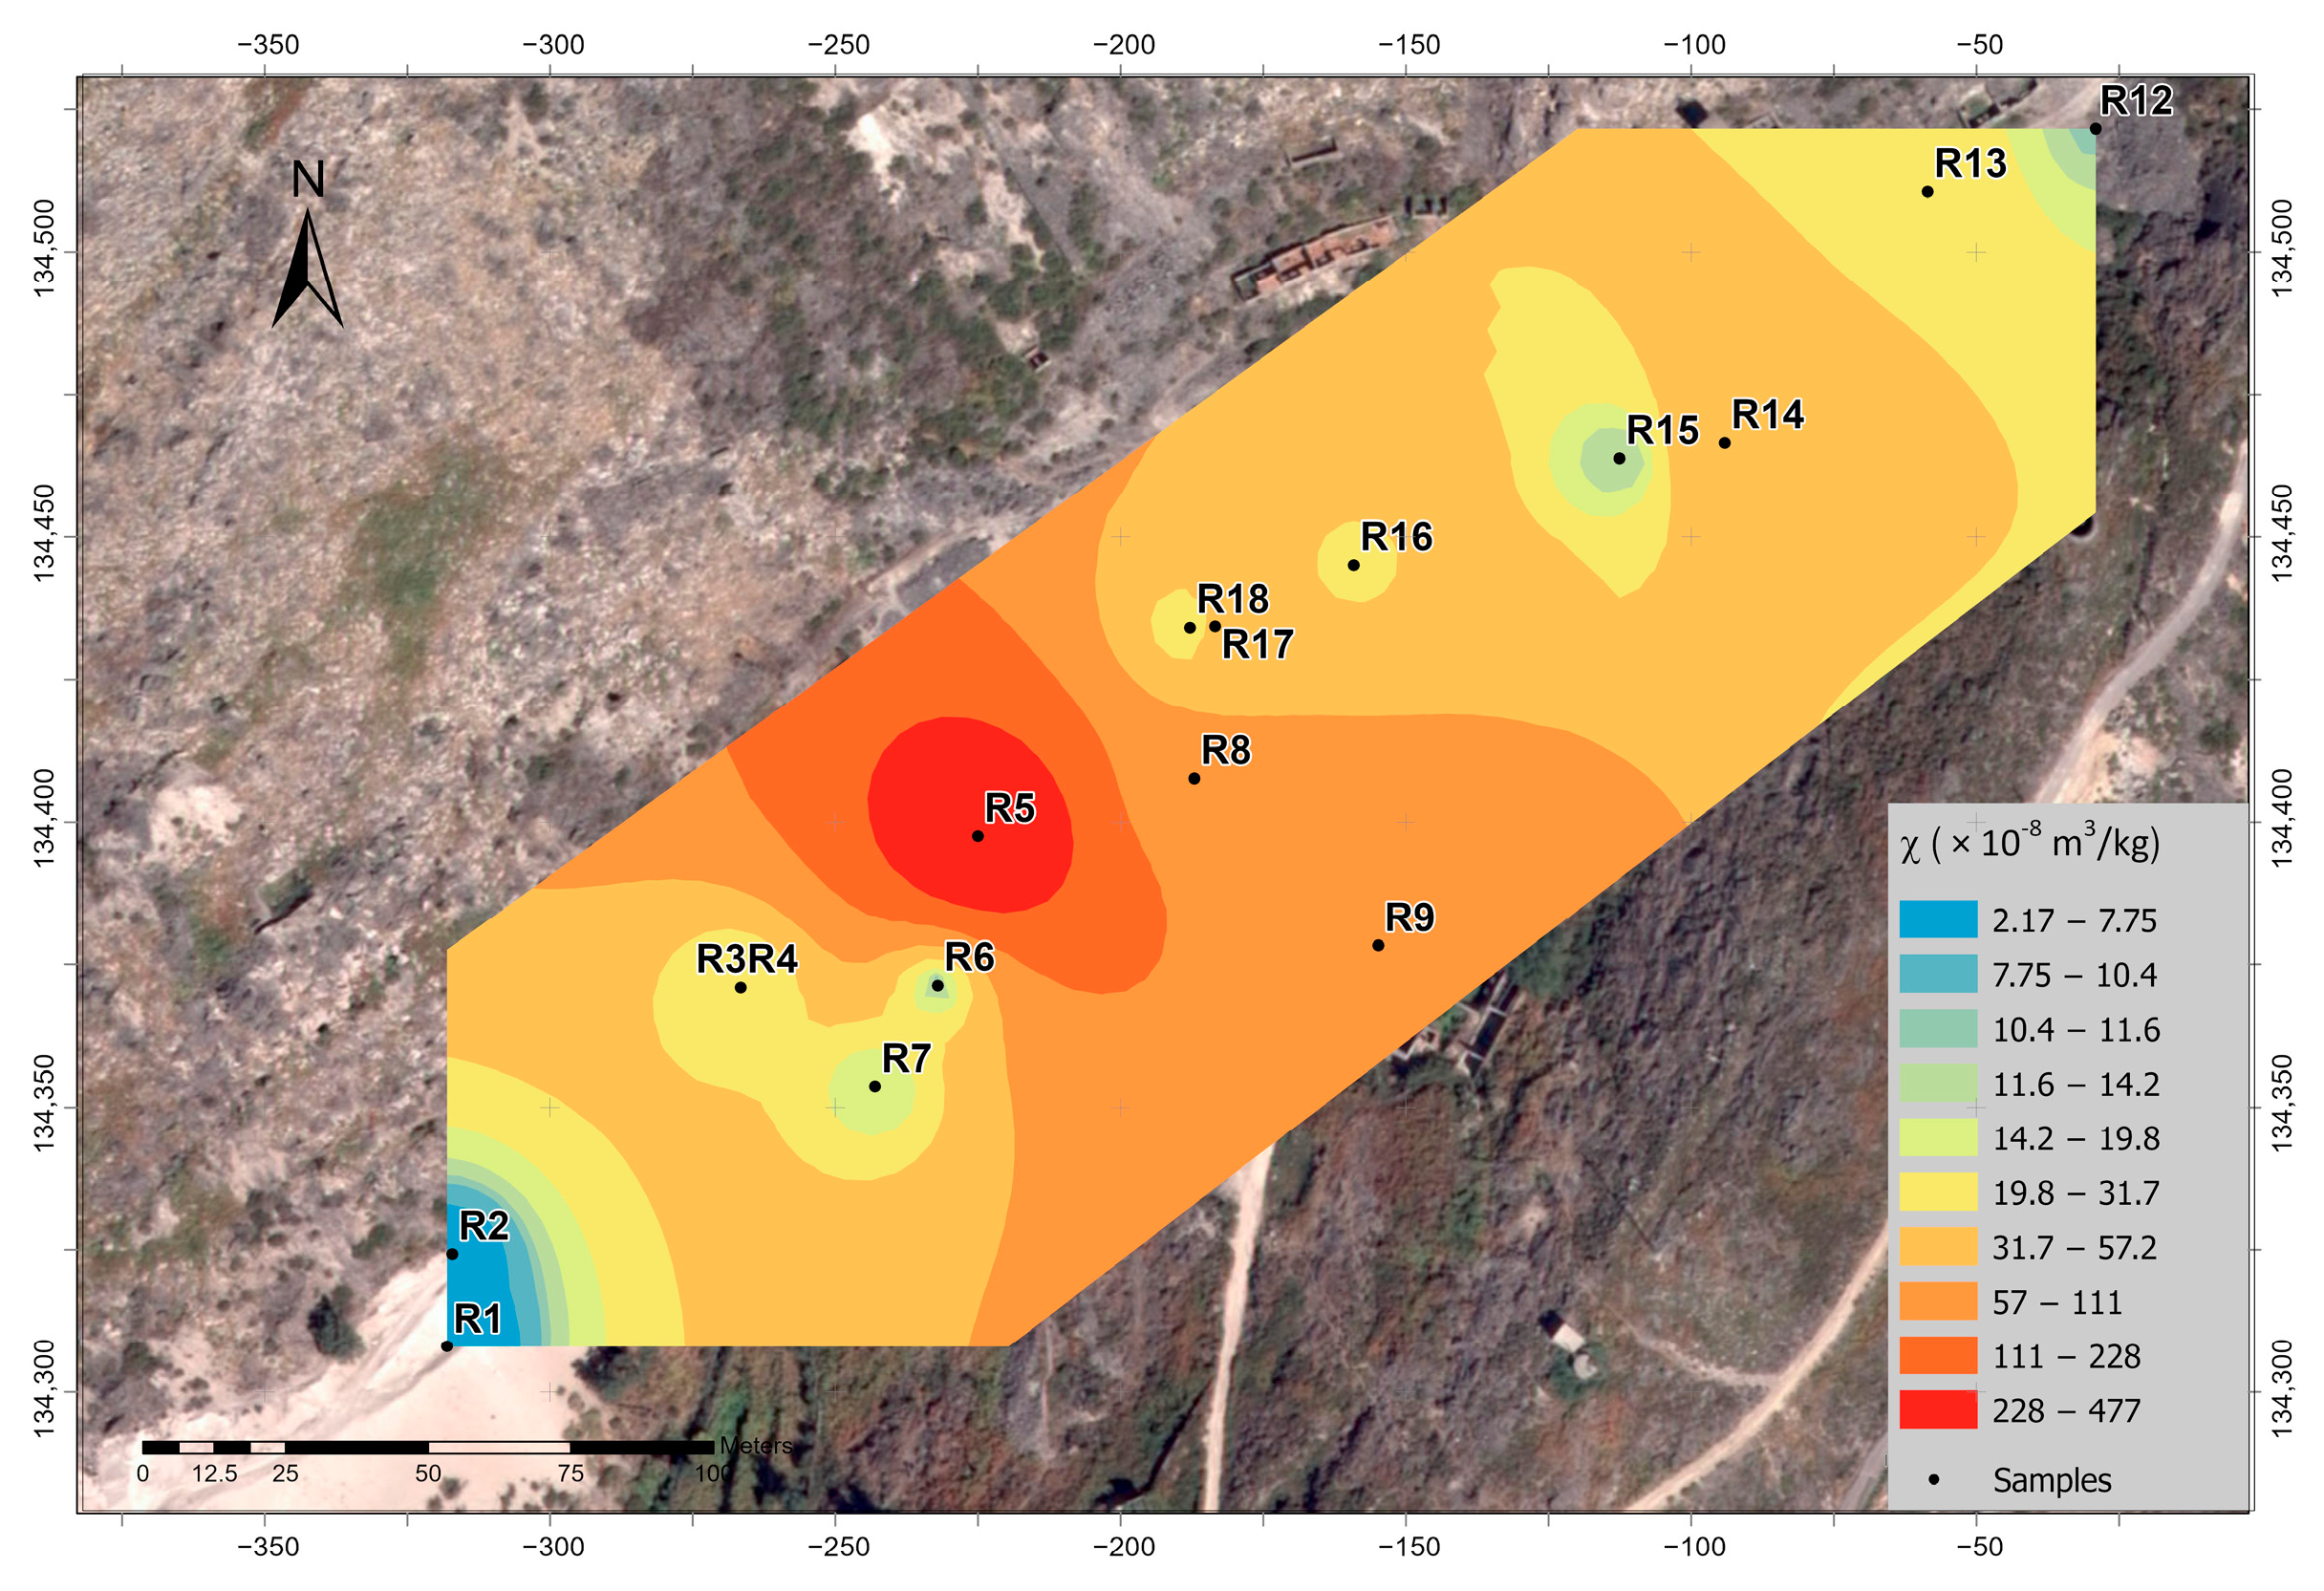
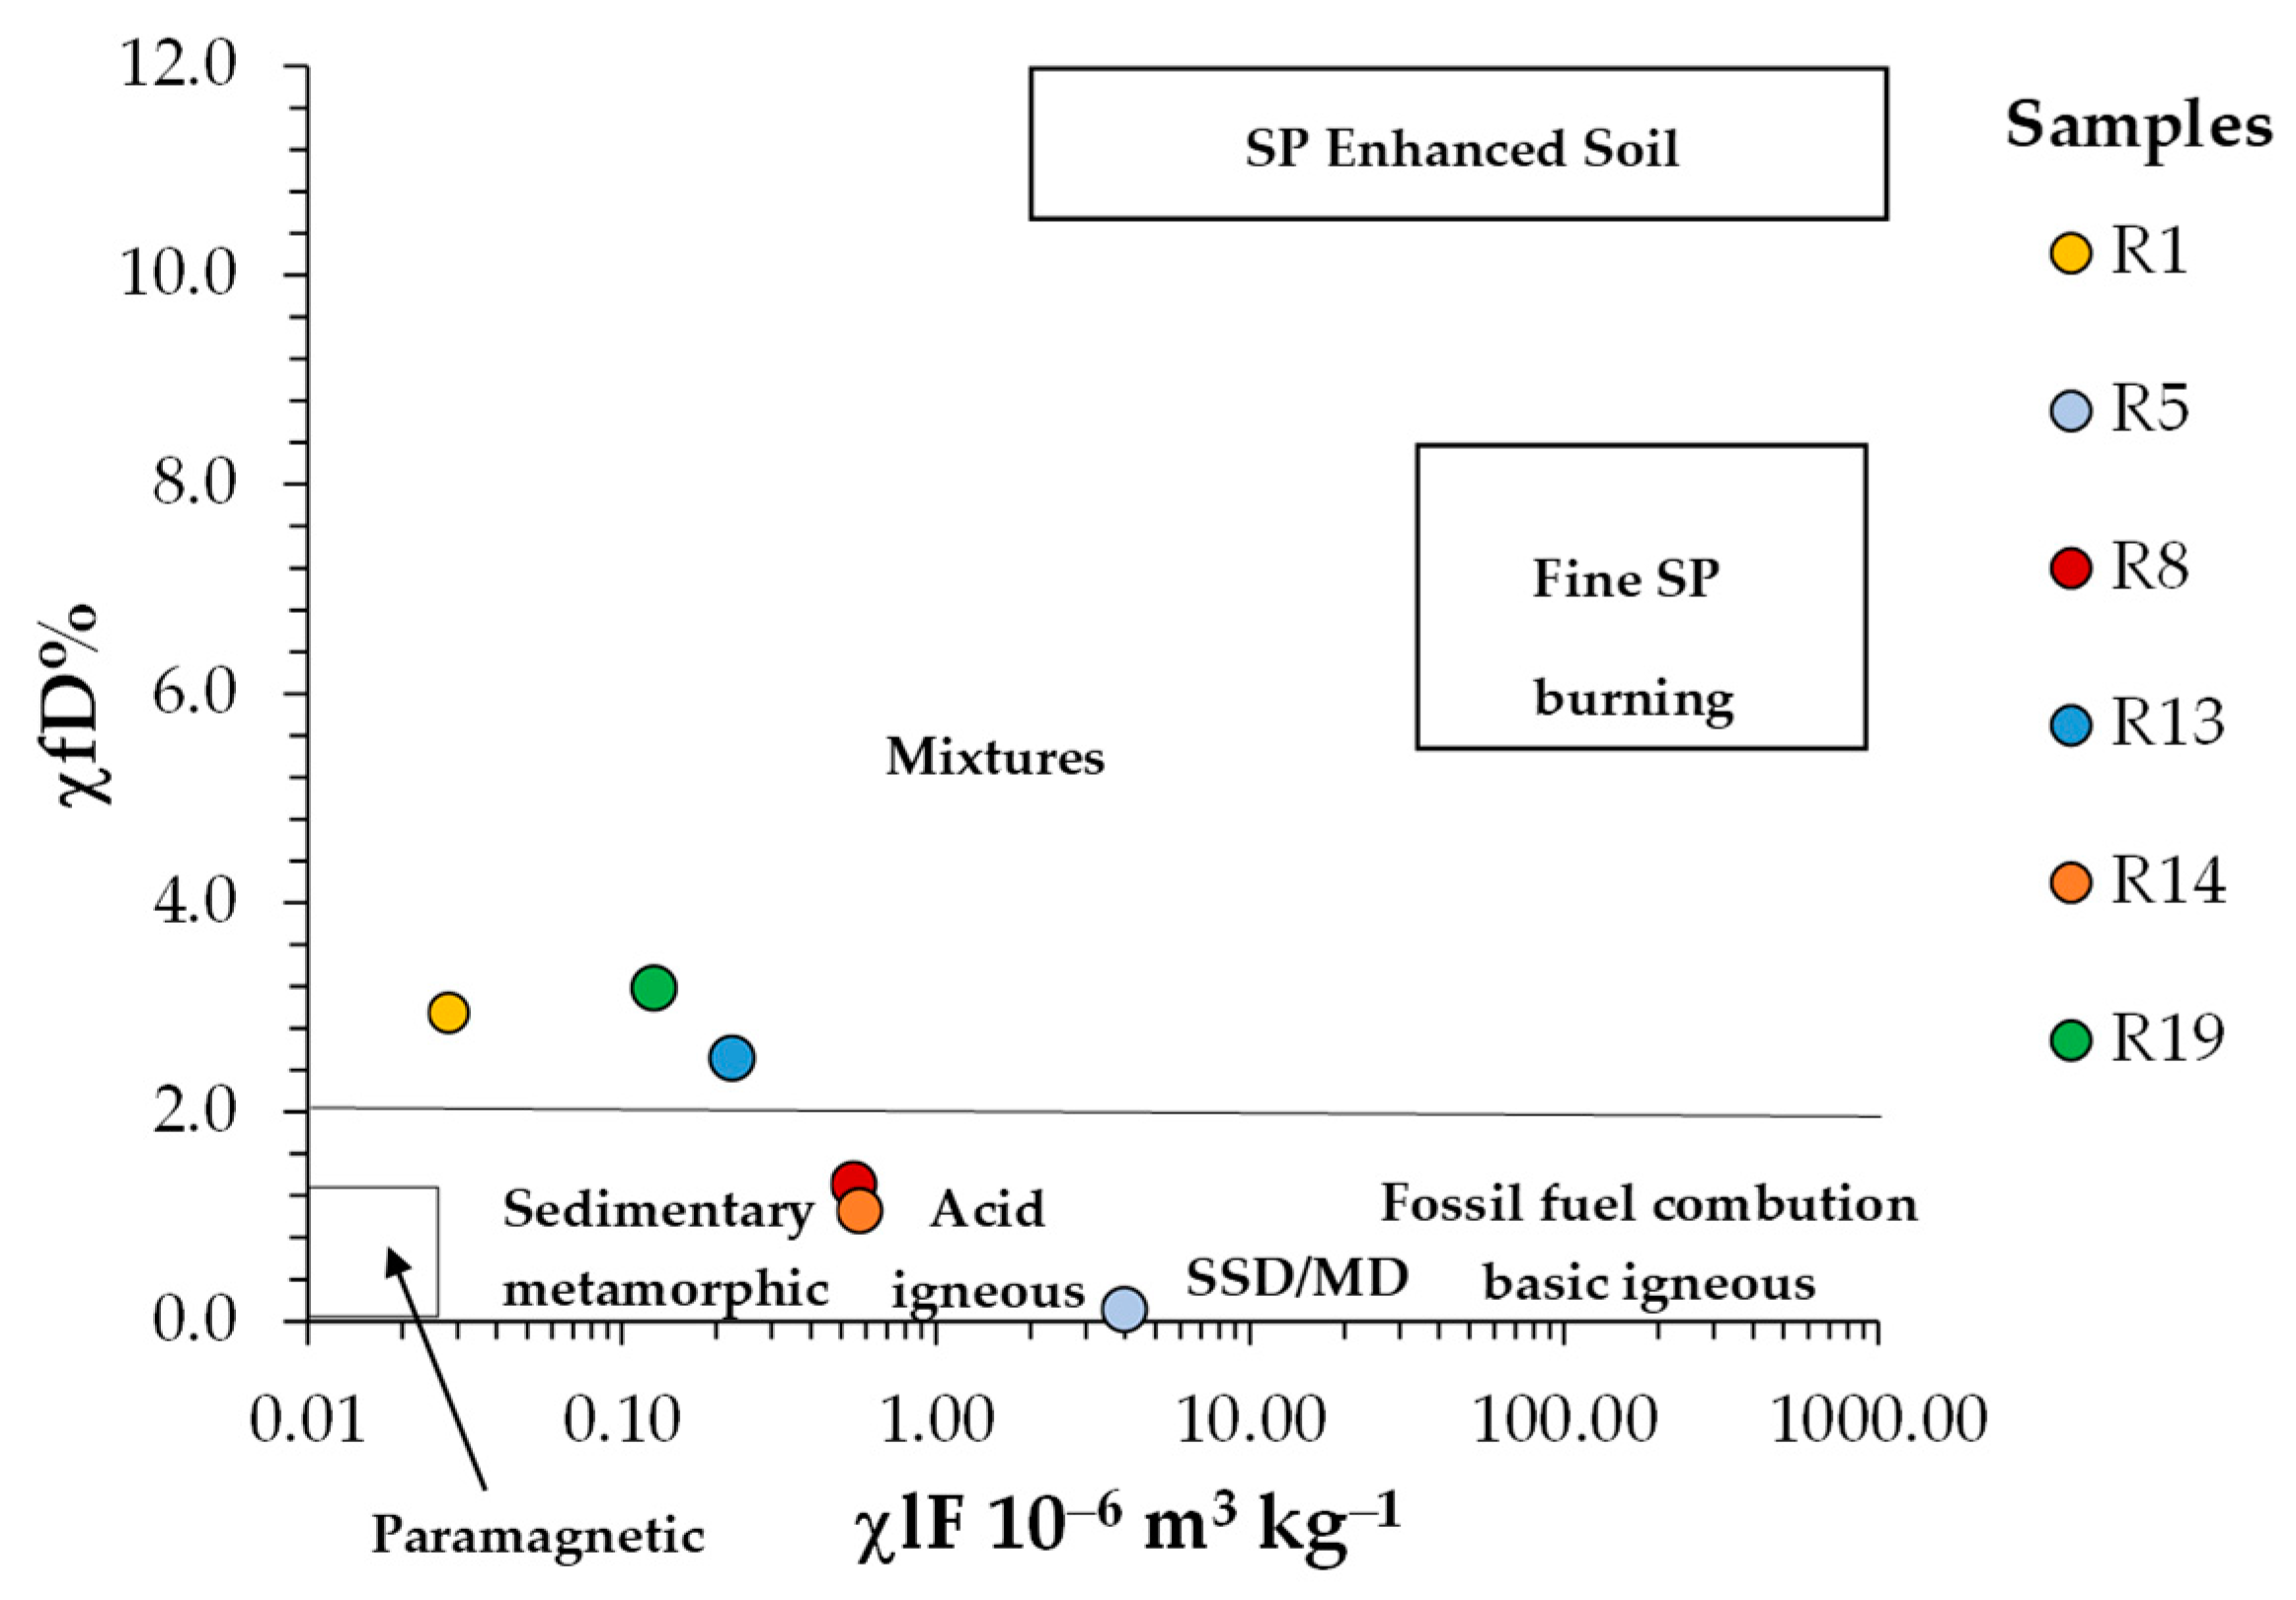
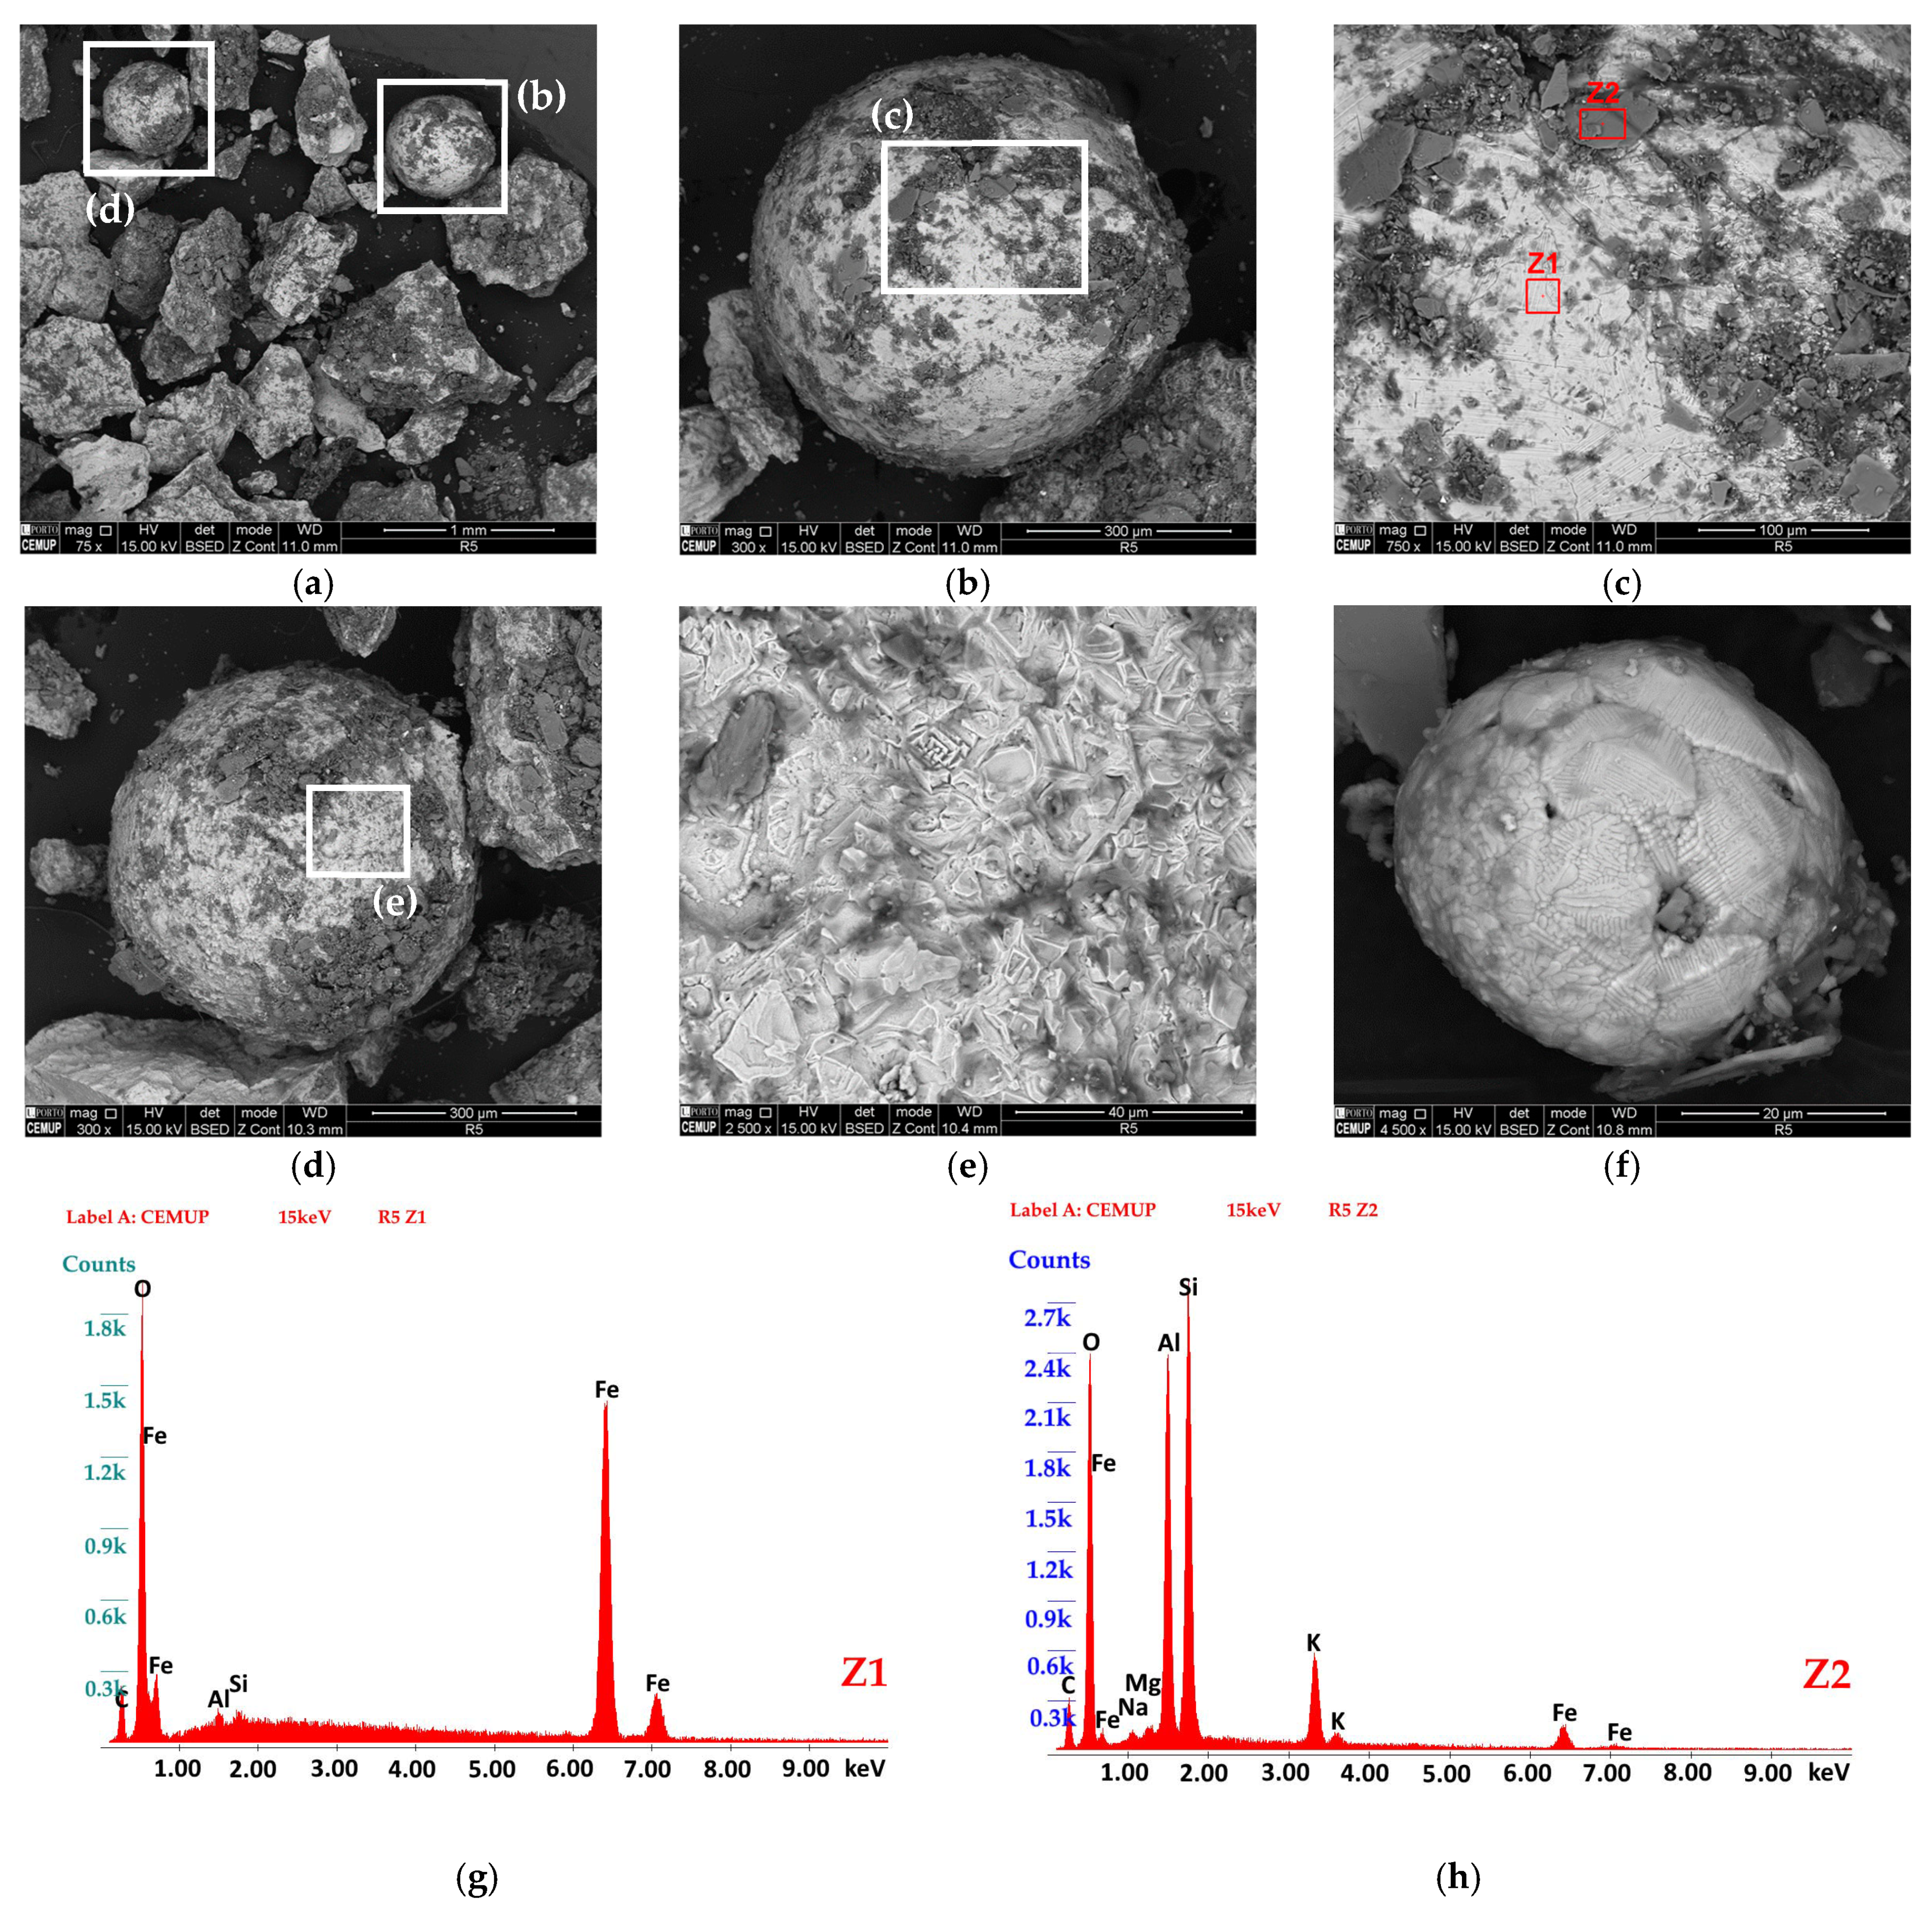
4.2. Magnetic Characterization
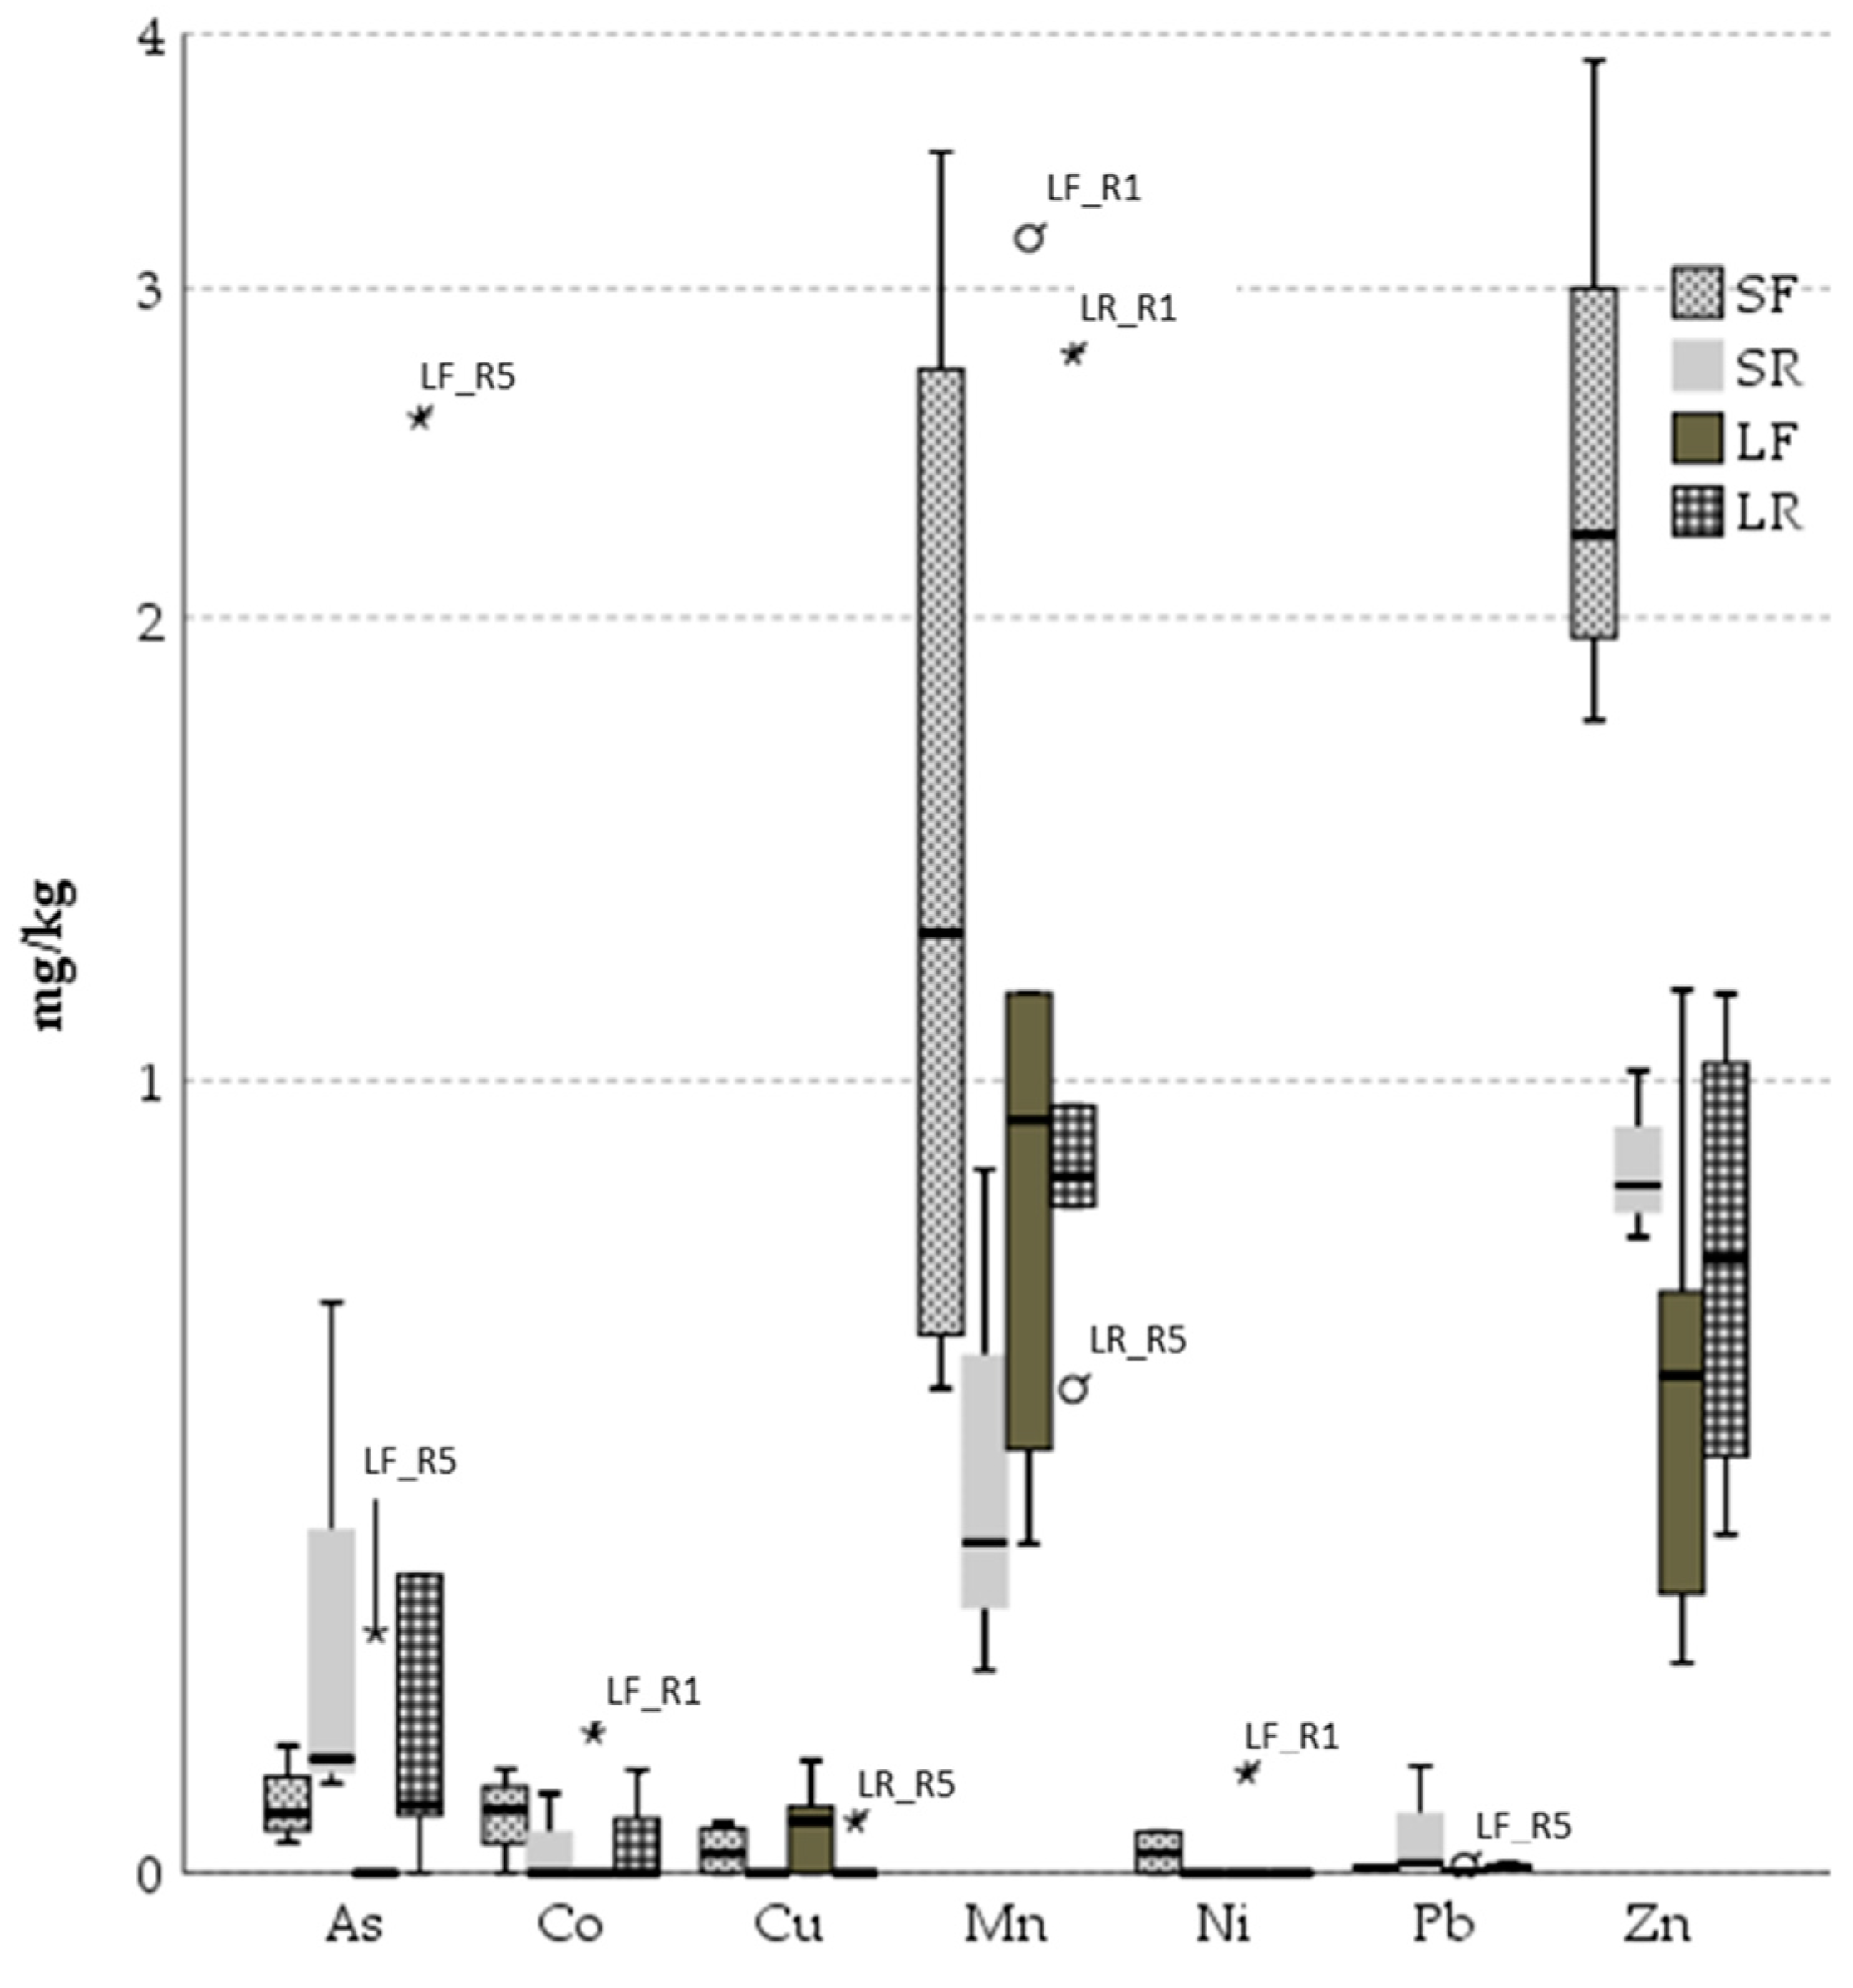
The mass magnetic susceptibility (χ) lies between 2.82 and 477.20 × 10⁻⁸ m3/kg, which indicates that besides diamagnetic and paramagnetic particles, ferromagnetic minerals are present in variable concentrations. The treatment of the data using inverse distance weighting allowed the construction of the map of Figure 10 where an area of very high values of χ (>220 × 10−8 m3/kg) is visible, close to the old washing plant, and the χ values decrease symmetrically towards the NE and SW, where areas where χ is lower than 21 × 10−8 m3/kg are found.
The frequency-dependent susceptibility (χfd%) is relatively low and lies between 1.21 and 2.48%, indicating a very weak contribution of superparamagnetic particles. The schematic χlf versus χfd% scattergram (Figure 11) shows the typical positions of the samples dominated by the various domains and sources: minerals resulting from granite and host-rock weathering and ferromagnetic grains, either multidomain or stable single domain.
The IRM curves of selected samples (sites where χ was >60 × 10−8 m3/kg) were treated by a cumulative log-Gaussian (CLG) and a skewed generalized function (SGG) using the software developed by Kruiver [23] (Figure 12a) and the MAXUnMix software [24] (Figure 12b), respectively. The interpretation of these curves allowed for the estimation of several parameters (Figure 12c), such as (i) the saturation isothermal remanent magnetization value (SIRM); (ii) the S-ratio parameter to 300 mT (IRM300 mT/IRM1000 mT) which, when close to the unity, indicates the presence of a low coercivity magnetic phase; (iii) the coercivity (B1/2); and (iv) the dispersion parameter (DP) of each ferromagnetic mineral present in the rocks. As each ferromagnetic mineral is characterized by different parameters, this technique allows for the identification of several components present in the studied samples.
Using the cumulative log-Gaussian function analysis, IRM curves were fitted by using a single component with mean coercivity (B1/2) of 53.7–61.7 mT and DP of 0.27–0.29, typical of fine-grained magnetite. The SIRM values are between 1.69 and 14.71 × 10⁻² Am2/kg, suggesting that the large variability observed in the values of magnetic susceptibility results from a heterogenous distribution of magnetite among the studied samples. The S-ratio varies between 0.989 and 0.992, indicating that magnetite is the main magnetic carrier of the studied samples (Figure 12c).
The MAXUnMix software [24] produced the same results: all IRM curves were fitted by using a single component with mean coercivity around 60 mT, typical of fine-grained magnetite (Figure 12b,c).
The mean coercivity (B1/2~60 mT) of this magnetite population is significantly higher than the typical mean coercivity of pedogenic or detrital magnetite [26]. The DPs of 0.27–0.28 are also lower than the DP values for pedogenic or detrital magnetite (typically ~0.34–0.36), pointing to the presence of a fine-grained magnetite.
For a more detailed study of the magnetic mineralogy, the magnetic fraction of the sample with the highest value of magnetic susceptibility (sample R5 with χ = 477.2 × 10⁻⁸ m3/kg) was obtained by separation with a Nd magnet and placed on adhesive carbon tape. On this magnetic fraction, scanning electron microscopy with energy dispersive spectroscopy (SEM/EDS) observations were performed.
SEM photomicrographs (Figure 13a–f) revealed that magnetic spherules with several dimensions (between 30 and 300 μm) and different surface morphologies (irregular, dendritic, or smooth surfaces) were present in the magnetic fraction.
Chemical composition spectra (EDS spectra) showed that in the massive magnetic spherules both pure Fe-containing spherules and a complex mixture of aluminosilicates and Fe-bearing compounds were present (Figure 13g,h).
Other components of magnetic fraction were found in the magnetic fraction, such as iron filings, probably due to the deterioration of the metallic parts of the remaining washing plant.

4.3. Plant Analysis

Several elements considered as PTEs in soils are known plant micronutrients, such as Mn2+, Zn2+, Cu2+, Ni2+, connected with the enzymatic components, or beneficial nutrients (Co2+). So, it is expected to find them as part of the composition of several plant tissues. Although measured with different methods, it can be confirmed that the levels of PTEs in the soils had a considerably lower quantitative correspondence in the plants, with median levels ranging from 0.0 to 0.82 mg/kg (Table 2). This might point to either the PTEs’ presence in soil being mostly in a non-soluble fraction and therefore partially immobilized from uptake by plants, or that the bioaccumulation capacity is reduced in relation to the levels present in the soil. By analyzing the As and Pb, which are not elements naturally present in plants, their bioaccumulation was observed, and tended to be higher overall in the most contaminated sites, exception for As in Sedum anglicum Huds.
A clearly different bioaccumulation behavior could be observed between the plant organs, depending on the elements considered, and in some cases plant species (Figure 14). It was observed for the soil PTEs that are considered plant nutrients, there was an overall higher bioaccumulation in the flower parts compared with the roots, which was particularly visible in the S. anglicum Huds. plants. This points to a translocation from the root system to the aerial parts, particularly at the flowering stage where a plethora of biochemical activity and transformations are taking place at a higher rate compared with the root system.
For As and Pb, there was clearly a higher accumulation in the rooting system compared with the aerial part. This points to a lesser translocation capacity within the plant for these elements, bearing in mind that they are present at high concentrations in the soil. Nonetheless, it was observed, particularly for Lolium flowers, high As and Pb concentrations in the flowers growing at the R5 sampling point, one of the most contaminated with As and the most contaminated with Pb.

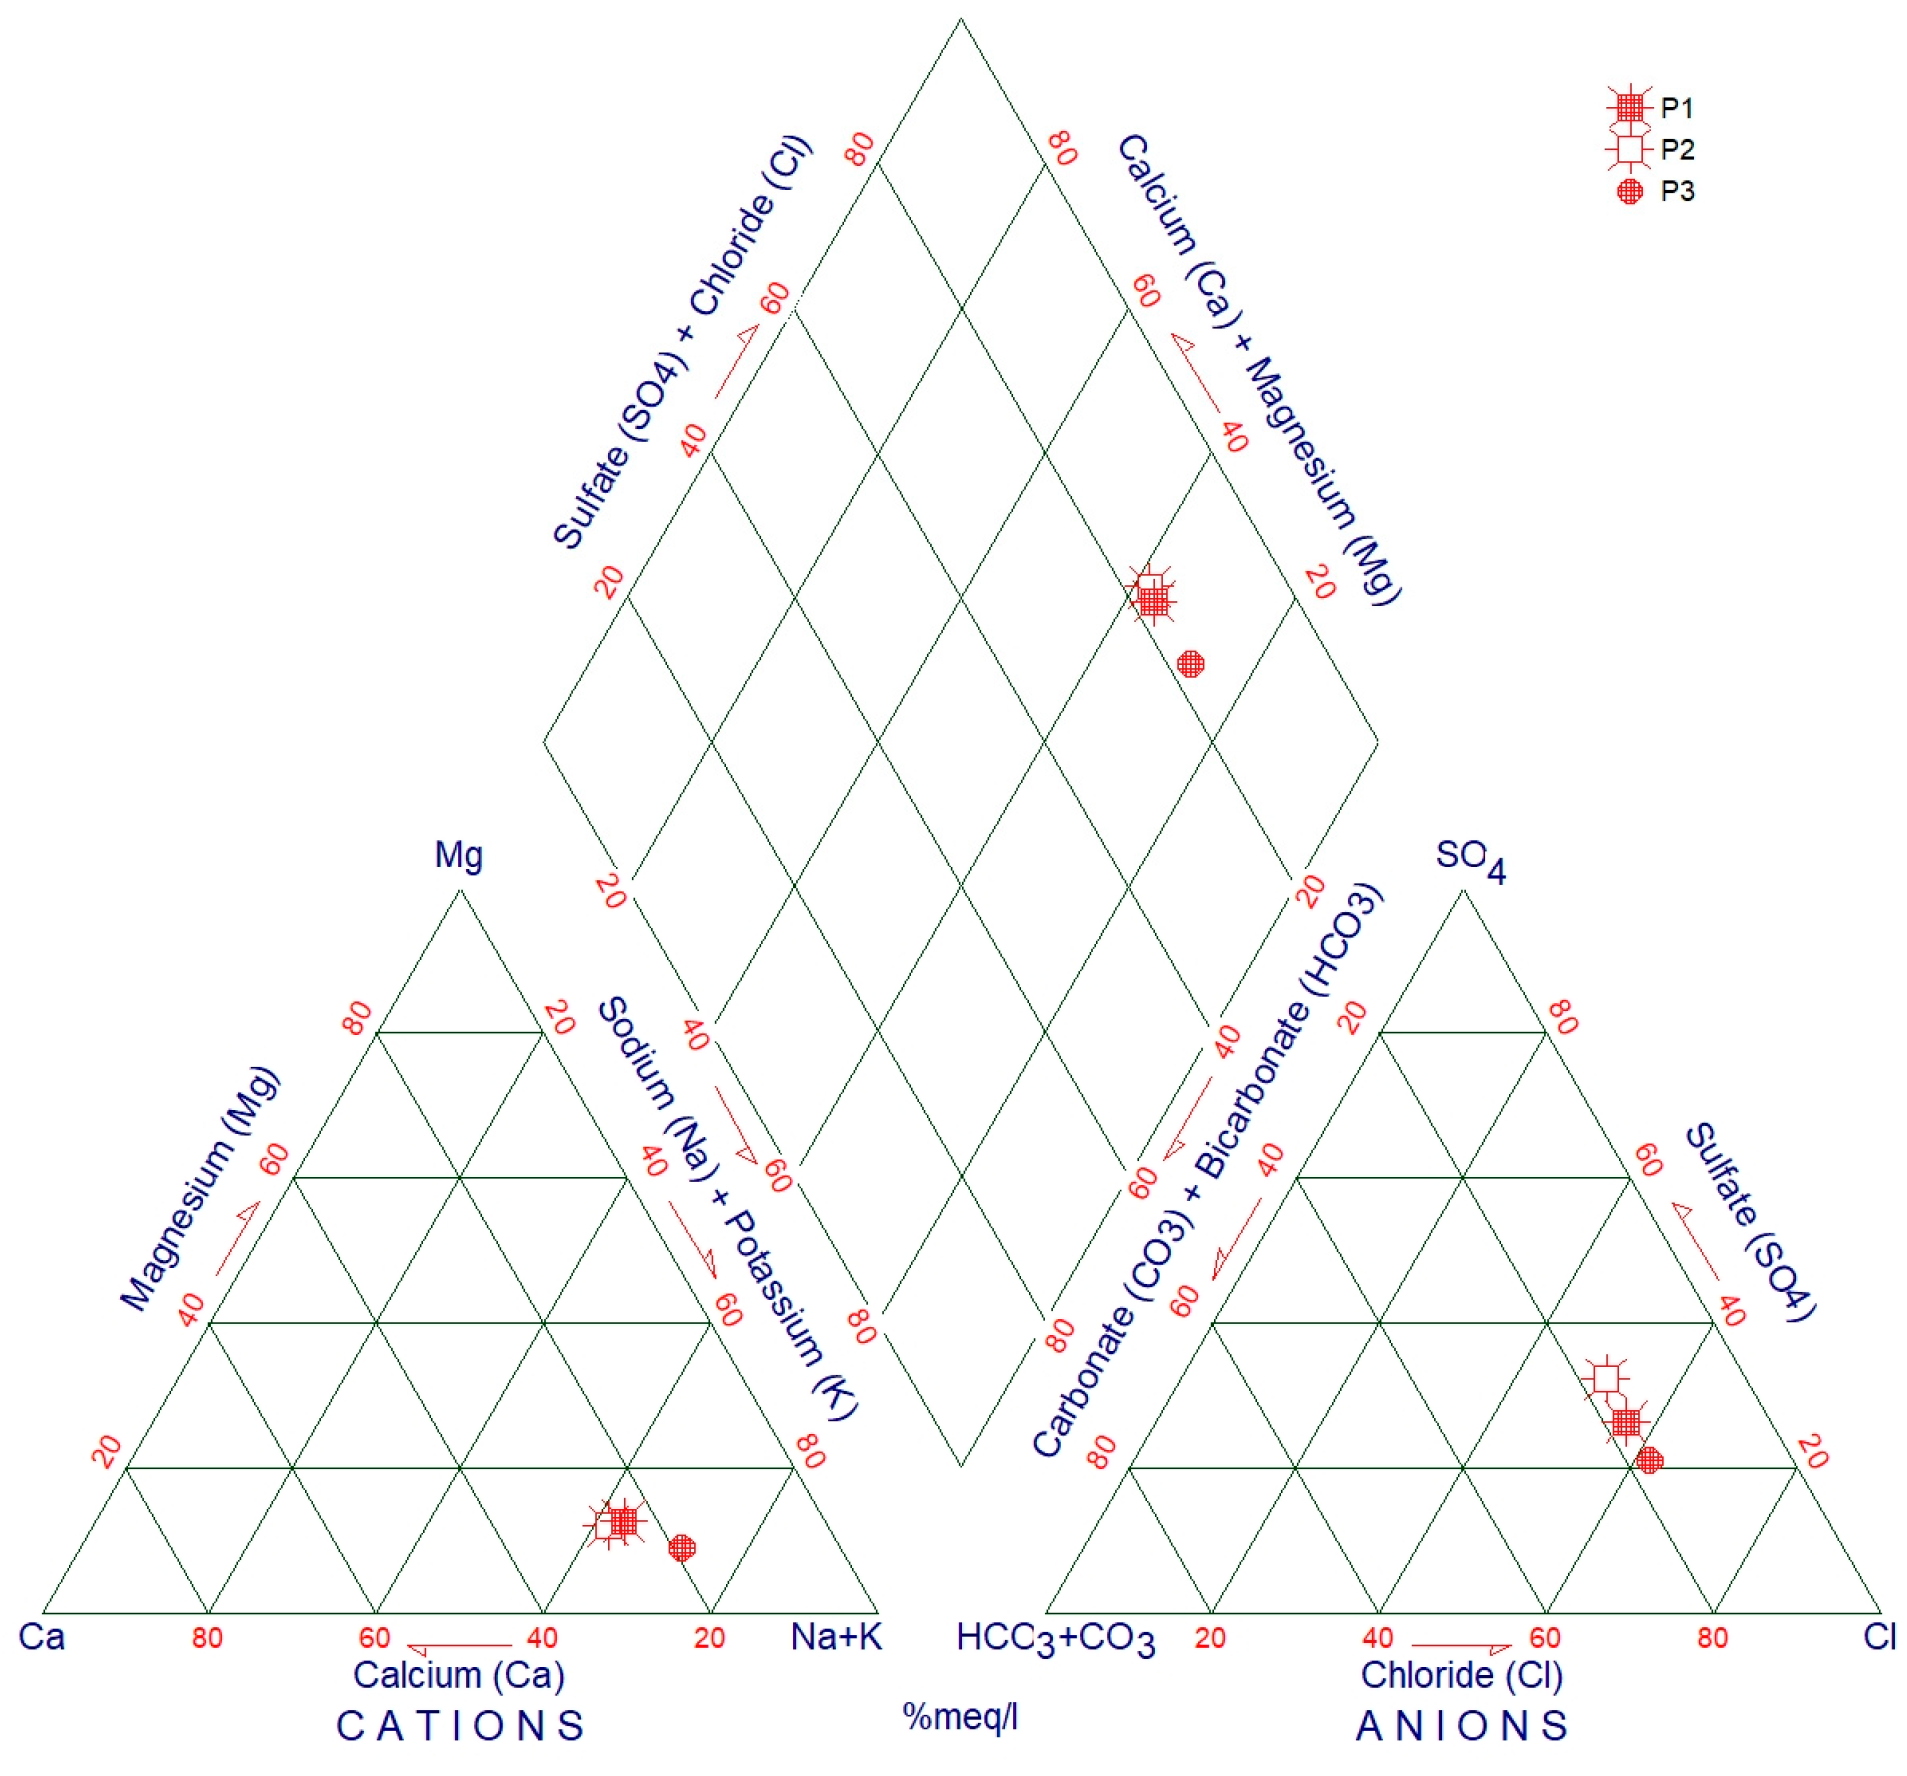
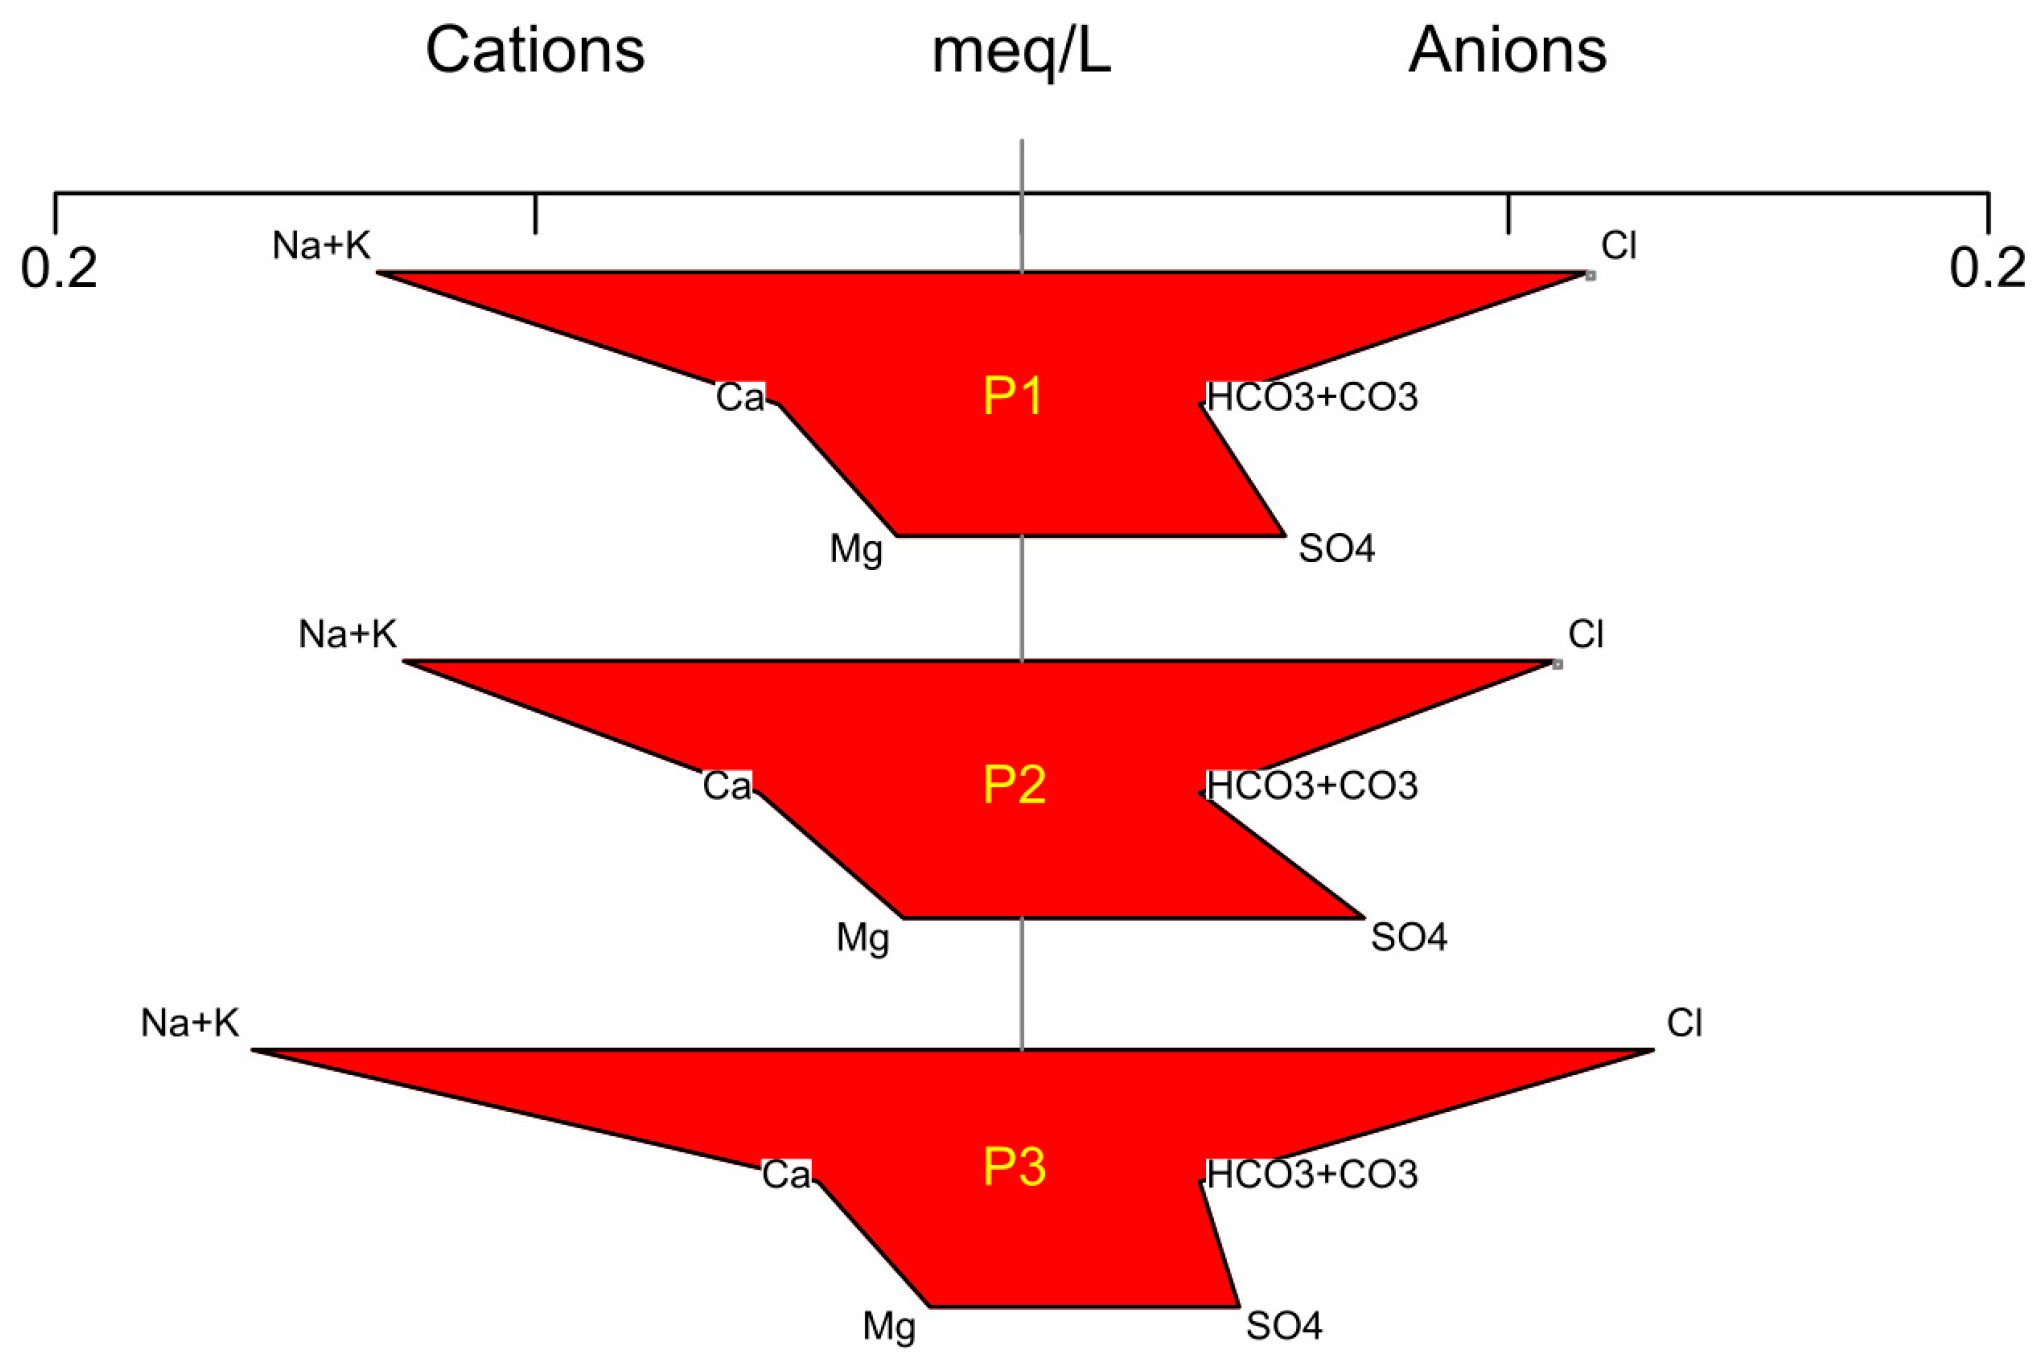
4.4. Hydrogeochemistry

The impact of mining on water bodies, namely, aquifers and streams, involves hydrogeochemical changes concerning major ions and trace elements. In the latter case, those concerning PTEs are of particular concern for the environment and for human health [27,28].
The analytical results of the waters sampled in the Regoufe mine in February 2022 are presented in Table 3 and Table 4. Water pH ranged from 5.7 (P1) to 6.0 (P2 and P3) and the EC values around 25 µS/cm indicated low mineralization, as expressed by the Stiff diagram (Figure 15). The major ion content was similar in all samples, which had Na-Cl facies (which is common in waters circulating in granitic areas), as shown in the hydrogeochemical diagrams (Figure 15 and Figure 16).
The PTE contents in the surface and groundwater samples collected in the area of Regoufe mine were similar and relatively low, being unlikely to pose potential health and environmental risks. Arsenic constitutes the exception, with levels that ranged from 71.8 to 238.5 µg/L, far above the World Health Organization (WHO) guideline value and the European Parametric Value (PV) for drinking water purposes of 10 μg/L [29,30]. Arsenic is also included in Annex VIII of the European Water Framework Directive—Indicative List of the Main Pollutants, that aims to ensure that all surface water and groundwater bodies achieve “good status” [31]. As long-term exposure to As can cause skin lesions, diseases of the nervous and cardio-pulmonary systems, diabetes, cancer and negative impacts on cognitive development, it is also considered one of the WHO’s 10 chemicals of major public health concern [32,33].
Near mining facilities, PTE contamination remediation programs are urgent and constitute an environmental challenge, which need a holistic approach to avoid counterproductive measures and to foster synergies. Particularly in the case of groundwater, there is strong interaction with soil and the need to reduce pollutants in water bodies along with a good soil protection policy. Moreover, tackling the contamination at source would contribute to less polluted water bodies, saving the financial and non-financial resources required for their treatment [34,35].

5. Conclusions

The global impact of PTEs in the Regoufe mine surface soils, confirmed by the different calculated indexes, points to a very high to ultrahigh degree of contamination of the area, having a serious ecological risk level mainly related to As and Cd contributions. However, establishing a direct relation between As contamination and the anthropogenic effects caused by the mining process cannot be carried out in a straightforward manner. Arsenopyrite occurs both disseminated in the Regoufe pluton, namely in the medium-grained muscovite-albite granite, and also in the quartz veins that cut this pluton, which by itself increases the As values in the soils of the study area. So, it should be taken into account the “natural” metallogenic concentration in the soils due to the pedogenesis of rocks that were already enriched in metals and metalloids as a result of the geological processes that gave origin to the mineral deposit.
The studies performed highlighted that the PTE levels in plants are lower than in the soil, but site-specific soil concentrations in As and Pb positively influence bioaccumulation by the plants. A different bioaccumulation behavior was observed between plant organs with As and Pb being in higher concentrations in the roots while the others were in the flowers. This points to a lesser translocation capacity within the plant for these elements, bearing in mind that they are present at high concentrations in the soil.
The samples showed different magnetic behaviors due to natural sources, namely minerals resulting from the weathering of granitic and metasedimentary rocks and pedogenesis processes. However, an anthropogenic source cannot be ruled out, since neither the Regoufe granite (χ = 1.60 × 10⁻⁸ m3/kg), nor the host rocks (χ = 8.28 × 10⁻⁸ m3/kg) have magnetite. In the immediate vicinity of the old washing plant, magnetic spherules, with a typical multidomain and/or stable single-domain magnetite, were found in the ferromagnetic fraction of the sample R5. These spherules probably result from a temperature increase induced by some technological process (for example, a forge) related to ore processing/mining activity and can be considered as technogenic particles [36].
Regarding water quality, the PTE contents in the surface and groundwater samples were similar and relatively low, unlikely to pose potential health and environmental risks. Arsenic from arsenopyrite of the mineralized quartz veins and/or from the granite itself constitutes the exception, with levels far above the World Health Organization (WHO) guideline value and the European Parametric Value (PV) for drinking water purposes. The As water contamination near the mining facilities poses health risks, needing remediation plans in order to provide ecosystem enhancement and population safety.

Supplementary Materials

The following supporting information can be downloaded at: https://www.mdpi.com/article/10.3390/min13040497/s1, Table S1: Contamination indices calculation equation: geoaccumulation index (Igeo), contamination factor (CF), modified degree of contamination (mCd), potential ecological risk index (PERI), and potential toxicity response index (RI). References [37,38,39,40] are cited in the supplementary materials.

Author Contributions

Conceptualization, H.S; methodology, H.S., C.C., H.R., P.S., A.G., J.E.M., C.M., M.d.A.R., H.C.B.M. and F.N.; software, C.C., A.G., P.S. and H.R.; validation, H.S., C.C., H.R., P.S., A.G., J.E.M., C.M., M.d.A.R., H.C.B.M., B.V., F.N., I.A. and D.F.; formal analysis, H.S., C.C., H.R., P.S., A.G., J.E.M., C.M., M.d.A.R., H.C.B.M., B.V., I.A. and D.F.; investigation, H.S., C.C., H.R., P.S., A.G., J.E.M., S.P., J.T. and F.N.; resources, H.S., C.C., H.R., P.S., A.G., J.E.M., C.M. and D.F.; data curation, H.S.; writing—original draft preparation, H.S.; writing—review and editing, H.S., C.C., H.R., P.S., A.G., J.E.M., C.M., M.d.A.R., H.C.B.M. and D.F.; visualization, H.S., C.C., H.R., P.S., A.G., J.E.M., B.V., I.A., F.N. and D.F.; supervision, D.F.; project administration, D.F.; funding acquisition, D.F. All authors have read and agreed to the published version of the manuscript.

Funding

This research was supported by the “SHS: Soil health surrounding former mining areas: characterization, risk analysis, and intervention” Project, financed by NORTE-45-2020-75-SISTEMA DE APOIO À INVESTIGAÇÃO CIENTÍFICA E TECNOLÓGICA-“PROJETOS ESTRUTURADOS DE I&D”-HORIZONTE EUROPA, Ref. NORTE-01-0145-FEDER-000056 and framed within the ICT G3 activities (UIDB/04683/2020 and UIDP/04683/2020). C. Cruz is a contracted researcher under the UIDP/04683/2020 project (Fundação para Ciência e a Tecnologia—Portugal).

Data Availability Statement

Not applicable.

Acknowledgments

The authors thank Eric Font for the helpful guidance in paleomagnetism and explanations during the IRM analysis carried out in the “Faculdade de Ciências e Tecnologia da Universidade de Coimbra” facilities.

Conflicts of Interest

The authors declare no conflict of interest.

References

  1. Sluijk, D. Geology and Tin-Tugsten Deposits of the Regoufe Area, Northern Portugal. Ph.D. Thesis, Universiteit van Amsterdam, Amsterdam, The Netherlands, 1963. [Google Scholar]
  2. Kicińska, A. Risk assessment of children’s exposure topotentially harmful elements (PHE) in selected urban parksof the Silesian agglomeration. In Proceedings of the 1st International Conference on the Sustainable Energy and Environment Development (SEED 2016), Krakow, Poland, 17–19 May 2016. [Google Scholar]
  3. Kicińska, A.; Smreczak, B.; Jadczyszyn, J. SoilBioavailability of Cadmium, Lead, and Zinc in the Areas ofZn-Pb Ore Mining and Processing(Bukowno, Olkusz). J. Ecol. Eng. 2019, 20, 84–92. [Google Scholar] [CrossRef]
  4. Durães, N.; Portela, L.; Sousa, S.; Patinha, C.; Silva, E. Environmental Impact Assessment in the Former Mining Area of Regoufe (Arouca, Portugal): Contributions to Future Remediation Measures. Int. J. Environ. Res. Public Health 2021, 18, 1180. [Google Scholar] [CrossRef] [PubMed]
  5. Almeida, H.D.; Gomes Marques, M.C.; Sant’Ovaia, H.; Moura, R.; Espinha Marques, J. Environmental Impact Assessment of the Subsurface in a Former W-Sn Mine: Integration of Geophysical Methodologies. Minerals 2023, 13, 55. [Google Scholar] [CrossRef]
  6. Lötze, F. Zur Gliederung der Varisciden der Iberishen Meseta. Geotekt. Forschg. 1945, 6, 78–92. [Google Scholar]
  7. Julivert, M.; Fontboté, J.M.; Ribeiro, A.; Conde, L.E. Memória Explicativa del Mapa Tectónico de la Península Ibérica y Baleares; Instituto Geológico y Minero de España: Madrid, Spain, 1974; 113p. [Google Scholar]
  8. Farias, P.; Gallastegui, G.; Lodeiro, F.; Marquinez, J.; Parra, L.; Catalán, J.; Macia, J.; Rodriguez Fernandez, L.R. Aportaciones al Conocimiento de la Litoestratigrafia y Estructura de Galícia Central. IX Reunião de Geologia do Oeste Peninsular, Porto, 1985; Memórias Museu Laboratório Mineralogia Geologia da Faculdade Ciências Universidade Porto: Porto, Portugal, 1987; Volume 1, pp. 411–431. [Google Scholar]
  9. Ribeiro, A.; Pereira, E.; Dias, R. Structure in the Northwest of the Iberian Peninsula. In Pre-Mesozoic Geology of Iberia; Dallmeyer, R.D., Martínez Garcia, E., Eds.; Springer: Berlin/Heidelberg, Germany, 1990; pp. 220–236. [Google Scholar]
  10. Kroner, U.; Romer, R.L. Two plates-Many subduction zones: The Variscan orogeny reconsidered. Gondwana Res. 2013, 24, 298–329. [Google Scholar] [CrossRef]
  11. Noronha, F.; Ramos, J.M.F.; Rebelo, J.A.; Ribeiro, A.; Ribeiro, M.L. Essai de corrélation des phases de déformation hercyniennes dans le nord-ouest Péninsulaire. Leidse Geol. Mededel 1981, 52, 87–91. [Google Scholar]
  12. Ferreira, N.; Iglésias, M.; Noronha, F.; Pereira, E.; Ribeiro, A.; Ribeiro, M.L. Granitóides da Zona Centro Ibérica e Seu Enquadramento Geodinâmico. In Geología de los Granitoides y Rocas Asociadas del Macizo Hesperico: Libro de Homenaje a L.C. García de Figuerola; Bea, F., Carnicero, A., Gonzalo, J., Lopez Plaza, M., Rodriguez Alonso, M., Eds.; Editorial Rueda: Madrid, Spain, 1987; pp. 37–51. [Google Scholar]
  13. Dias, G.; Leterrier, J.; Mendes, A.; Simões, P.P.; Bertrand, J.M. U-Pb zircon and monazite geochronology of postcollisional Hercynian granitoids from the Central Iberian Zone (northern Portugal). Lithos 1998, 45, 349–369. [Google Scholar] [CrossRef] [Green Version]
  14. Noronha, F.; Martins, H.C.B.; Sant’ovaia, H. Field trip 3, Post-tectonic plutonism Vila Pouca de Aguiar region. In Variscan Plutonism in the Central Iberian Zone. Northern Portugal, Eurogranites 2000, Field Meeting; Dias, G., Noronha, F., Ferreira, N., Eds.; Universidade do Minho: Braga, Portugal, 2000; pp. 109–126. [Google Scholar]
  15. Vriend, S.P.; Oosterom, M.G.; Bussink, R.W.; Jansen, J.B.H. Trace element behaviour in the W-Sn granite of Regoufe, Portugal. J. Geochem. Explor. 1985, 23, 13–25. [Google Scholar] [CrossRef]
  16. Sousa, M.B. Litoestratigrafia e Estrutura do “Complexo Xisto-Grauváquico”—Grupo do Douro (Nordeste de Portugal). Ph.D. Thesis, University Coimbra, Coimbra, Portugal, 1982. [Google Scholar]
  17. Valle Aguado, B.; Azevedo, M.R.; Schaltegger, U.; Martínez Catalán, J.R.; Nolan, J. U-Pb zircon and monazite of Variscan magmatism related to syn-convergence extension in central northern Portugal. Lithos 2005, 82, 169–184. [Google Scholar] [CrossRef] [Green Version]
  18. Pinto, M.C.S.; Martín, C.C.; Ibarrola, E.; Castañón, L.G.C.; Portugal-Ferreira, M.R. Síntese geocronológica dos granitóides do Maciço Hespérico. In Geología de los Granitoides y rocas asociadas del Macizo Hespérico Libro Homenaje a L.C. García de Figuerola; Editorial Rueda: Madrid, Spain, 1987. [Google Scholar]
  19. Instituto Português do Mar e da Atmosfera(IPMA). Boletim Climatológico Mensal—Fevereiro 2022; IPMA: Lisboa, Portugal, 2022; 18p. [Google Scholar]
  20. Evans, M.E.; Heller, F. Environmental Magnetism—Principles and Applications of Enviromagnetics; Academic Press: Cambridge, MA, USA, 2003; ISBN 0-12-243851. [Google Scholar]
  21. Dearing, J.A.; Dann, R.J.L.; Hay, K.; Lees, J.A.; Loveland, P.J.; Maher, B.A.; O’Grady, K. Frequency-dependent susceptibility measurements of environmental materials. Geophys. J. Int. 1996, 124, 228–240. [Google Scholar] [CrossRef] [Green Version]
  22. Robertson, D.J.; France, D.E. Discrimination of remanence-carrying minerals in mixtures, using isothermal remanent magnetization acquisition curves. Phys. Earth Planet. Inter. 1994, 84, 297–312. [Google Scholar]
  23. Kruiver, P.; Dekkers, M.J.; Heslop, D. Quantification of magnetic coercivity components by the analysis of acquisition curves of isothermal remanent magnetization. Earth Planet. Sci. Lett. 2001, 189, 269–276. [Google Scholar] [CrossRef]
  24. Maxbauer, D.P.; Feinberg, J.M.; Fox, D.L. MAX UnMix: A web application for unmixing magnetic coercivity Distributions. Comput. Geosci. 2016, 95, 140–145. [Google Scholar] [CrossRef]
  25. Kabata-Pendias, A. Trace Elements in Soils and Plants, 4th ed.; CRC Press: Boca Raton, FL, USA, 2010. [Google Scholar] [CrossRef]
  26. Egli, R. Characterization of individual rock magnetic components by analysis of remanence curves. Fundamental properties of coercivity distributions. Phys. Chem. Earth 2004, 29, 851–867. [Google Scholar] [CrossRef]
  27. Mansilha, C.; Melo, A.; Flores, D.; Ribeiro, J.; Rocha, J.R.; Martins, V.; Santos, P.; Espinha Marques, J. Irrigation with Coal Mining Effluents: Sustainability and Water Quality Considerations (São Pedro da Cova, North Portugal). Water 2021, 13, 2157. [Google Scholar] [CrossRef]
  28. Mourinha, C.; Palma, P.; Alexandre, C.; Cruz, N.; Rodrigues, S.M.; Alvarenga, P. Potentially Toxic Elements’ Contamination of Soils Affected by Mining Activities in the Portuguese Sector of the Iberian Pyrite Belt and Optional Remediation Actions: A Review. Environments 2022, 9, 11. [Google Scholar] [CrossRef]
  29. Directive (EU) 2020/2184 of the European Parliament and of the Council of 16 December 2020 on the Quality of Water Intended for Human Consumption. Available online: http://data.europa.eu/eli/dir/2020/2184/oj (accessed on 23 December 2020).
  30. World Health Organization WHO. Guidelines for Drinking-Water Quality: Fourth Edition Incorporating the first and second Addenda; WHO: Geneva, Switzerland, 2022; ISBN 978-92-4-004506-4. [Google Scholar]
  31. Directive 2000/60/EC of the European Parliament and of the Council of 23 October 2000 Establishing a Framework for Community Action in the field of Water Policy. Available online: http://data.europa.eu/eli/dir/2000/60/oj (accessed on 22 December 2000).
  32. Guy Howard. Drinking-Water and Health Risks Substitution in Arsenic Mitigation: A Discussion Paper; WHO: Geneva, Switzerland, 2003; WHO/SDE/WSH/03.06. [Google Scholar]
  33. World Health Organization WHO. Arsenic. Available online: https://www.who.int/news-room/fact-sheets/detail/arsenic (accessed on 7 December 2020).
  34. Water Europe (WE). The Value of Water: Towards a Future-Proof European Water-Smart Society. Available online: https://watereurope.eu/wp-content/uploads/2020/04/WE-Water-Vision-english_online.pdf (accessed on 1 March 2023).
  35. Water Europe (WE). Addressing Pollutants of Surface and Ground Water. Available online: https://watereurope.eu/wp-content/uploads/WE-Position-Paper-List-of-Pollutants-1.pdf (accessed on 1 March 2023).
  36. Magiera, T.; G.rka-Kostrubiec, B.; Szumiata, T.; Małgorzata, W. Technogenic magnetic particles from steel metallurgy and iron mining in topsoil: Indicative characteristic by magnetic parameters and Mossbauer spectra. Sci. Total Environ. 2021, 775, 145605. [Google Scholar] [CrossRef]
  37. Muller, G. Index of Geoaccumulation in Sediments of the Rhine River. GeoJournal 1969, 2, 108–118. [Google Scholar]
  38. Hakanson, L. An ecological risk index for aquatic pollution control. A sedimentological approach. Water Research 1980, 14, 975–1001. [Google Scholar] [CrossRef]
  39. Abrahim, G.M.S.; Parker, R.J. Assessment of heavy metal enrichment factors and the degree of contamination in marine sediments from Tamaki Estuary, Auckland, New Zealand. Environ. Monit. Assess. 2008, 136, 227–238. [Google Scholar] [CrossRef]
  40. Guo, W.; Liu, X.; Liu, Z.; Li, G. Pollution and Potential Ecological Risk Evaluation of Heavy Metals in the Sediments around Dongjiang Harbor, Tianjin. Procedia Environ. Sci. 2010, 2, 729–736. [Google Scholar] [CrossRef] [Green Version]
Figure 2. Metasediments of CXG in Regoufe area: (a,b) field and macroscopic stratigraphic layering with pelitic and semi-pelitic beds; (c,d) photomicrographs of S0//S1 and the crenulation cleavage restricted to the pelitic beds; (e,f) photomicrographs of strongly altered cordierite porphyroblasts, illustrating its syn-kinematic character with the crenulation cleavage. Photomicrographs (c,e) were taken in plane-polarized light and (d,f) in crossed-polars.
Minerals 13 00497 g002
Figure 3. Macroscopic and photomicrographs of samples of the different facies of Regoufe granite: (a) medium-grained muscovite-albite granite hand sample; (b) K-feldspar, quartz and muscovite; (c) deformed muscovite; (d) tourmaline-bearing porphyritic two-mica granite hand sample; (e) sericitization of plagioclase and tourmaline; (f) large crystal of tourmaline; (g) non-uniform mineralogical transition zone hand sample; (h) sericitization of plagioclase and quartz; and (i) quartz, plagioclase and muscovite. Subfigures (b,c,e,h,i) were taken in crossed-polar and (f) in plane-polarized light. Qz—quartz, Ms—muscovite, Pl—plagioclase, Fsp-K—K-feldspar, Turm—tourmaline.
Minerals 13 00497 g003
Figure 4. Photomicrographs of mineralized samples: (a) wolframite crystal; (b) wolframite and cassiterite crystals; (c) arsenopyrite and sphalerite crystals; (d) arsenopyrite and native bismuth. All photomicrographs were taken in reflected and plane-polarized light. W—wolframite, Sn—cassiterite, Apy—arsenopyrite, Sp—sphalerite, Bi—native bismuth.
Minerals 13 00497 g004
Figure 5. (a) Overview of the old Regoufe mining infrastructure; (b,c) nowadays, mining waste tailings; (d) remaining washing plant.
Minerals 13 00497 g005
Figure 6. Sampling sites in soils and mining waste tails and water sample locations.
Minerals 13 00497 g006
Figure 7. Two plant species collected in each sampling point of the Regoufe mining area. Sedum anglicum Huds. (left) and Lolium sp. (right).
Minerals 13 00497 g007
Figure 8. Spatial distribution of mCD index in the Regoufe mine area, inferred by inverse distance weighting in ArcGIS PRO software (ESRI).
Minerals 13 00497 g008
Figure 9. Geoaccumulation index (Igeo) and modified degree of contamination (mCD) for the different soil surface samples collected at Regoufe mine, main valley. Extreme value labels at Igeo correspond to the location of the sampling point as in Figure 8; red dotted line indicates the mCD value above which is considered an ultra-high degree of contamination.
Minerals 13 00497 g009
Figure 10. Mass magnetic susceptibility map of the mining area (magnetic susceptibility data interpolation made by inverse distance weighting in the ArcGIS PRO software, ESRI).
Minerals 13 00497 g010
Figure 11. Schematic χlf-χfd% scattergram (adapted from [21]). SP—superparamagnetic grains; SSD—stable single-domain grains; MD—multidomain grains.
Minerals 13 00497 g011
Figure 12. Adjustments of the IRM curve of a representative sample (R5) using: (a) Kruiver et al. [23] software, displaying a IRM curve adjustment versus the logarithm of the field applied to a linear scale (LAP); and (b) MAXUnMix software [24], where the solid yellow line represents the coercivity distribution of the sample, and the thickness of the line represents the standard deviation of the estimated error; (c) IRM parameters obtained from the IRM curve interpretation, both by IRM-CLG treatment and MAXUnMix software (χ—magnetic susceptibility; SIRM—saturation of isothermal remanent magnetization; B1/2—coercivity/field at which half of the SIRM was reached; DP—dispersion parameter; S—skewness. S-ratio (IRM300 mT/IRM1000 mT); n.a.—not attributed value).
Minerals 13 00497 g012
Figure 13. (af) SEM images showing the morphological variety of spherical components of the magnetic fraction in sample R5; (g,h) two chemical composition spectra in a massive magnetic spherule from R5 sample (see the location of the spectra Z1 and Z2 in Figure 12c).
Minerals 13 00497 g013
Figure 14. Variation of the PTE concentrations in the plant roots and flowers from the most and least contaminated points (R1, R2, R4, R5, R8 and R16) at the mining areas of Regoufe. SF—S. anglicum Huds. flowers, SR—S. anglicum Huds. roots, LF—Lolium sp. flowers, LR—Lolium sp. roots. Circles and asterisks correspond to outlier concentrations identified as plant species organ_sampling site.
Minerals 13 00497 g014
Figure 15. Piper diagram of the water samples collected in the Regoufe mine (February 2022).
Minerals 13 00497 g015
Figure 16. Stiff diagram of the water samples collected in the Regoufe mine (February 2022).
Minerals 13 00497 g016
Table 2. Concentration (mg/kg) in the studied plants, collected at Regoufe’s mine main valley, of the potentially toxic elements—PTEs (mg/kg) measured in the soil surface samples. For each element, the highest values are highlighted in bold; b.d.l.—below the detection limit.
PlantsLocalElements in mg/kg
Sedum anglicumAsMnZnCuNiPbCo
FlowersR10.05863.50783.8842b.d.l.b.d.l.0.0048b.d.l.
R20.11762.08571.7413b.d.l.b.d.l.0.00460.0523
R80.04880.67842.27940.04490.03590.00530.0952
R160.02710.52782.17110.03460.03670.00460.0621
RootsR10.10500.33520.7441b.d.l.b.d.l.0.0082b.d.l.
R20.64710.85060.8251b.d.l.b.d.l.0.0977b.d.l.
R80.08150.19371.0175b.d.l.b.d.l.0.00890.0721
Lolium sp.
FlowersR1b.d.l.3.18070.66240.10320.09110.00290.1300
R2b.d.l.1.15570.6543b.d.l.b.d.l.0.0022b.d.l.
R4b.d.l.0.73260.2014b.d.l.b.d.l.0.0016b.d.l.
R50.23430.44841.16620.0595b.d.l.0.0057b.d.l.
R8b.d.l.0.33400.27680.0542b.d.l.0.0015b.d.l.
R16b.d.l.1.15940.44350.0391b.d.l.0.0016b.d.l.
RootsR10.29772.77671.0309b.d.l.b.d.l.0.00550.0941
R20.06230.79190.3445b.d.l.b.d.l.0.0042b.d.l.
R4b.d.l.0.83890.4403b.d.l.b.d.l.0.0084b.d.l.
R52.57200.52651.15770.0461b.d.l.0.0060b.d.l.
R160.05190.95660.7133b.d.l.b.d.l.0.00370.0485
Median0.09320.81540.78460.04610.03670.00470.0721
Max2.57203.50783.88420.10320.09110.09770.1300
Min0.02710.19370.20140.03460.03590.00150.0485
Table 3. Physicochemical data of waters from the area of the Regoufe mine.
Water SamplesTemperature (°C)pHElectrical Conductivity (µS/cm)Cations (mg/L)Anions (mg/L)
Na+K+Ca2+Mg2+ClHCO3SO42−
P1226.0242.840.351.010.324.172.212.63
P2215.7262.720.351.080.303.922.213.36
P3226.0263.051.030.840.244.632.212.13
Table 4. Potentially toxic elements and Fe in waters from the area of the Regoufe mine.
Water SamplesFeMnAsCdCuAl
P1131.02.7238.54.115.28.2
P263.210.0190.53.23.138.9
P315.28.271.81.1b.d.l.15.1
(All values in µg/L; b.d.l.—below the detection limit 1 µg/L Cu).
Disclaimer/Publisher’s Note: The statements, opinions and data contained in all publications are solely those of the individual author(s) and contributor(s) and not of MDPI and/or the editor(s). MDPI and/or the editor(s) disclaim responsibility for any injury to people or property resulting from any ideas, methods, instructions or products referred to in the content.

