
Categorization of Mining Materials for Restoration Projects by Means of Pollution Indices and Bioassays
 , , , , ,
  and
and
Abstract
:1. Introduction
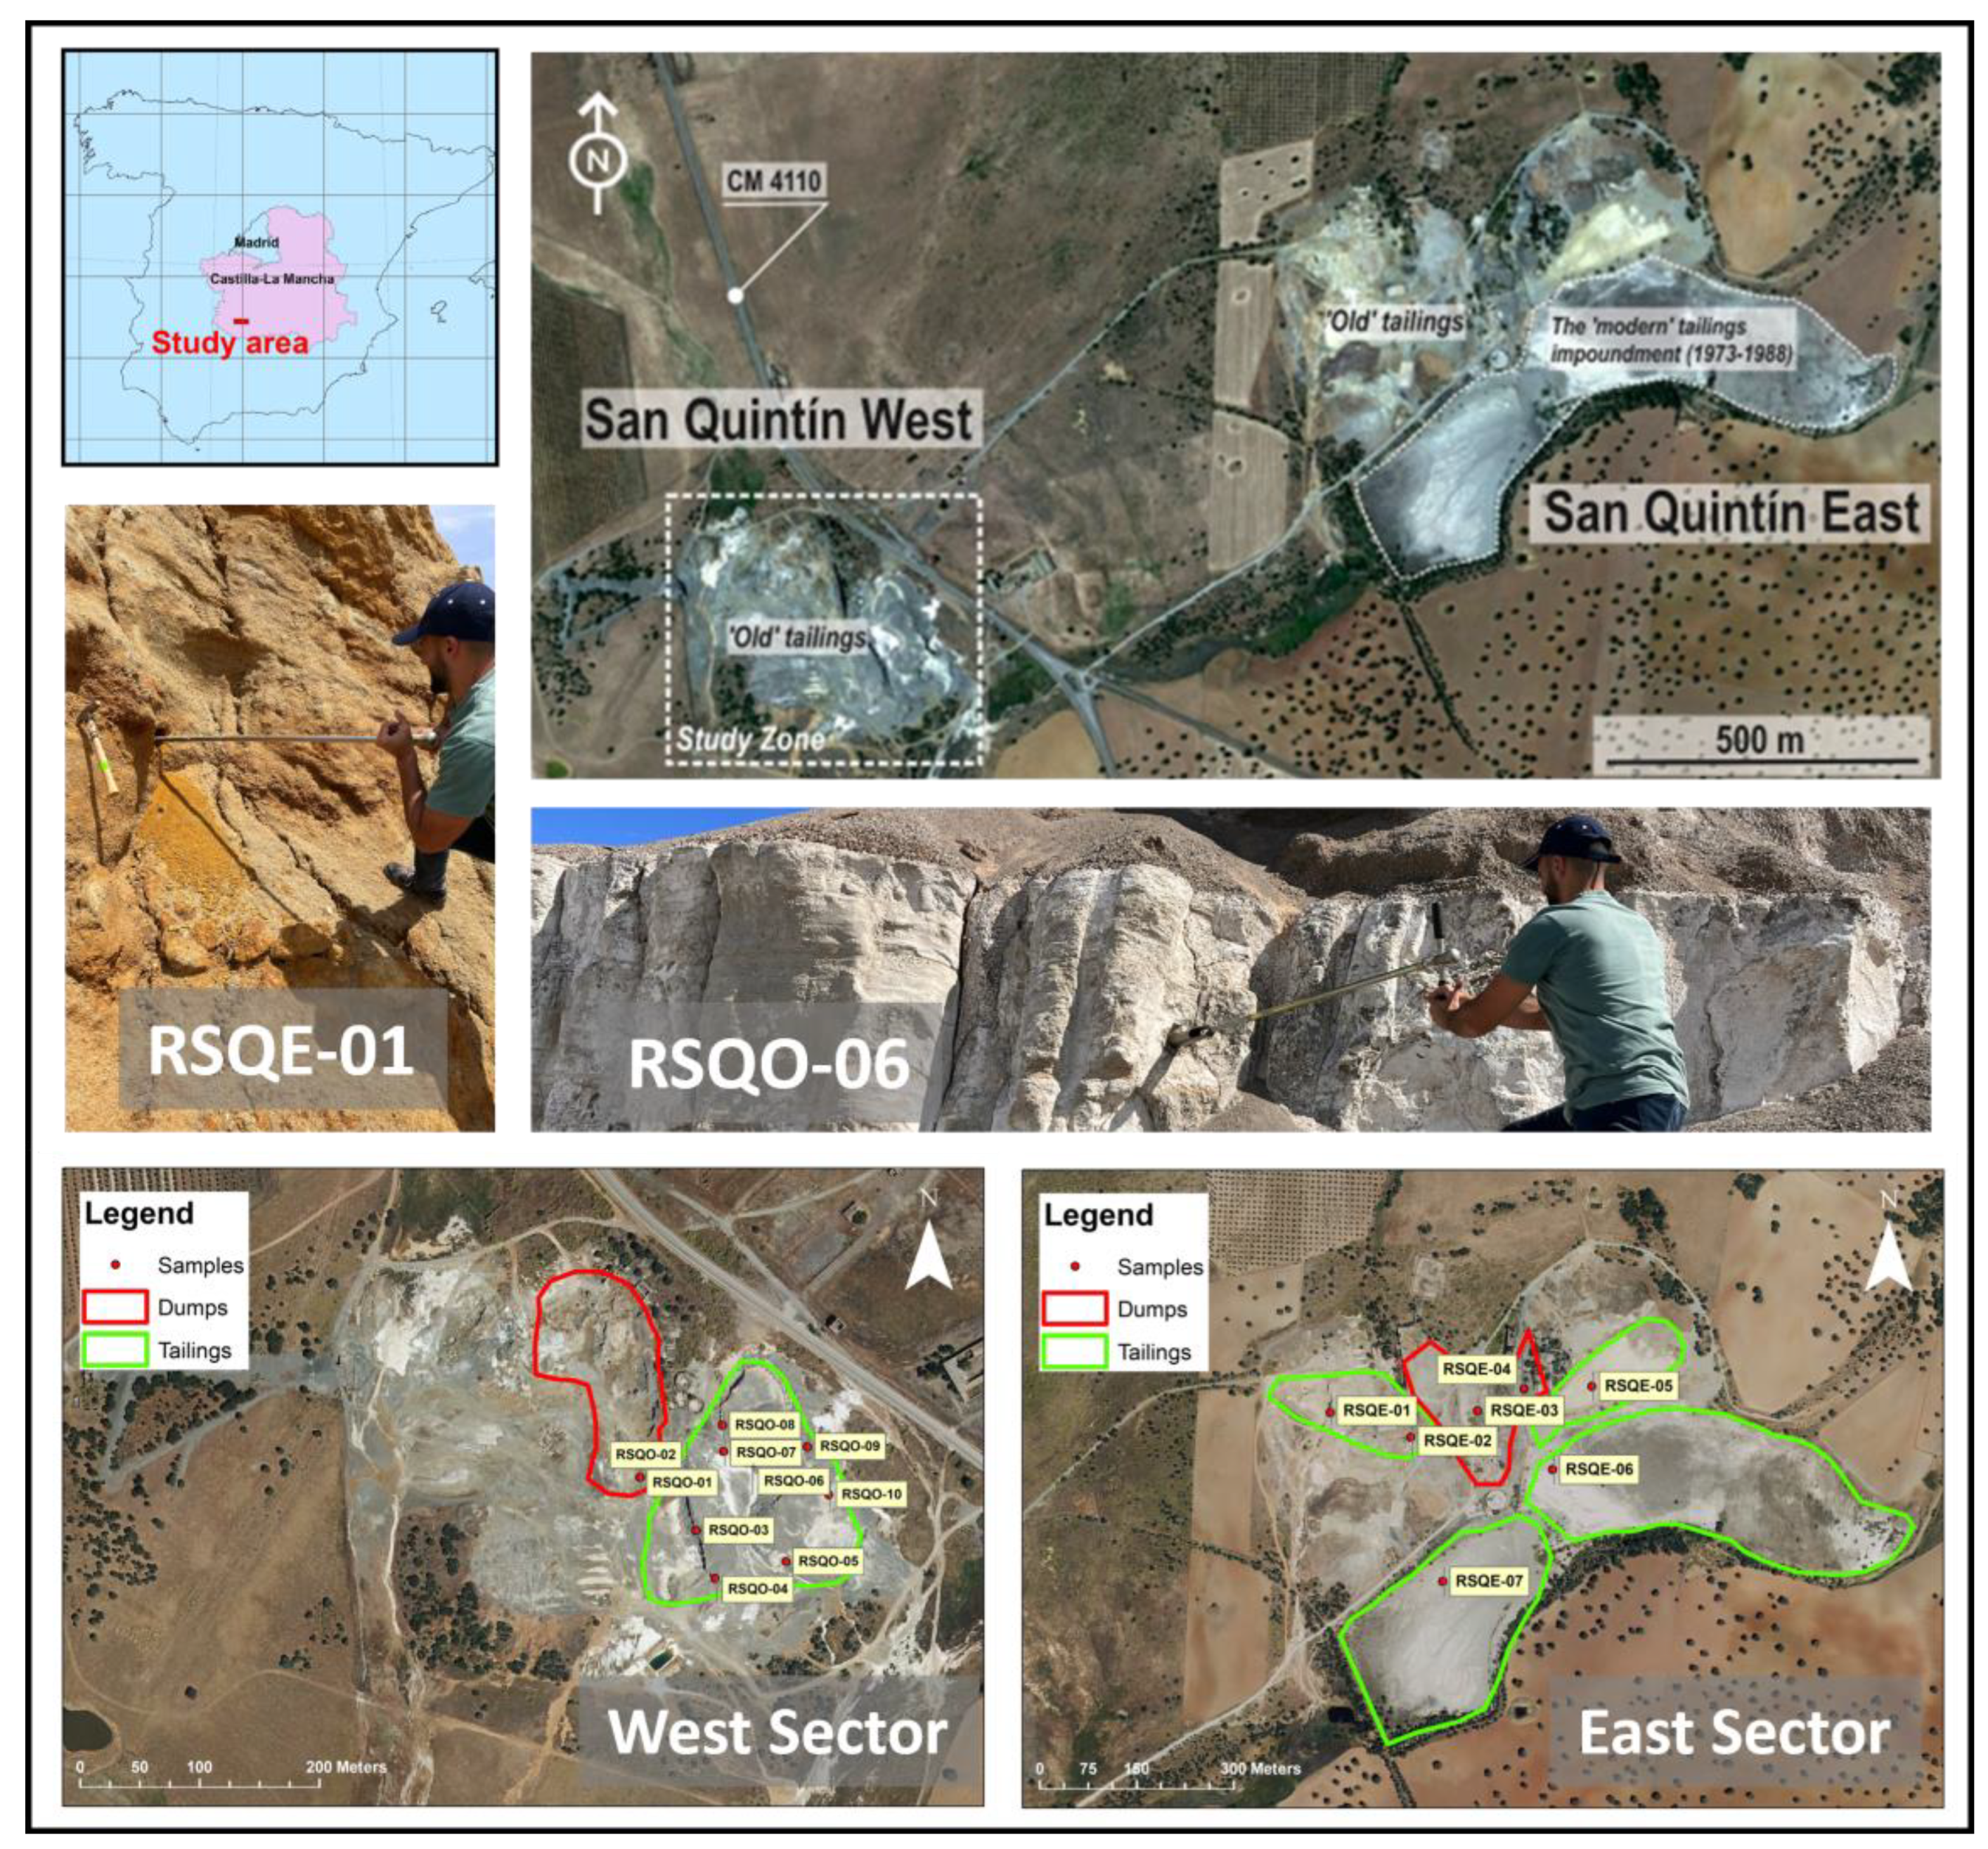
2. Study Area
3. Materials and Methods
3.1. Sampling Design
3.2. Geochemical Analysis of Samples
3.3. Mineralogical Analysis of Samples
3.4. Samples Leaching Procedure and Soluble PTE Content
3.5. Bioassays
3.5.1. Immobilization Test with Daphnia magna
3.5.2. Immobilization Test with Thamnocephalus platyurus
3.5.3. Freshwater Algae—Growth Rate Inhibition Test with Raphidocelis subcapitata
3.6. Assessment of Potential Environmental Risk
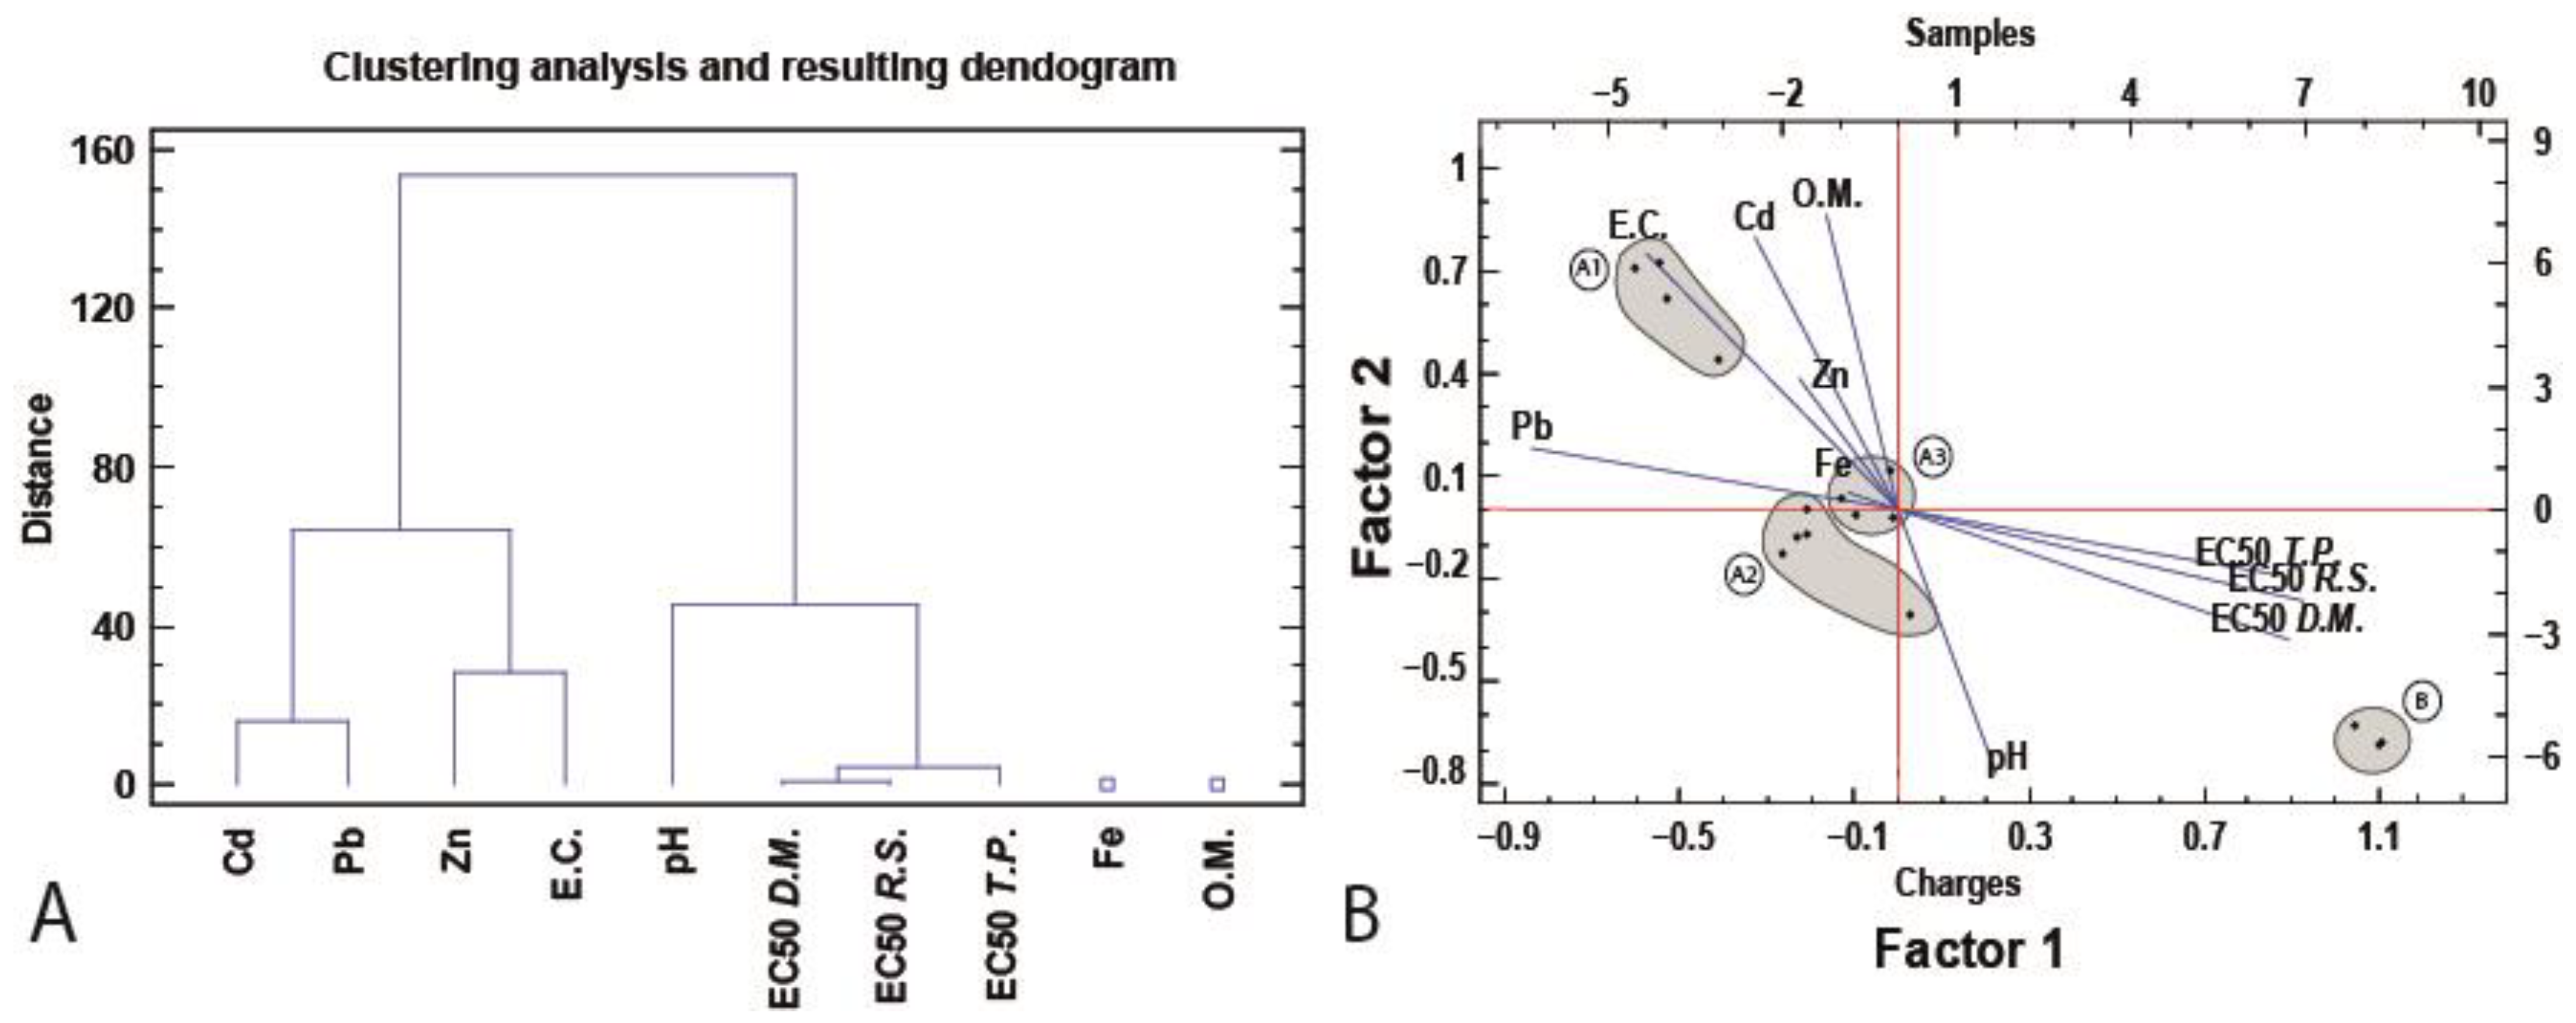
3.7. Statistical Analysis
4. Results
4.1. Geochemistry and Mineralogy of Samples
4.2. Bioassays
4.3. Assessment of Potential Environmental Risk
5. Discussion
6. Conclusions
Supplementary Materials
Author Contributions
Funding
Data Availability Statement
Conflicts of Interest
References
- Pan, L.; Fang, G.; Wang, Y.; Wang, L.; Su, B.; Li, D.; Xiang, B. Potentially Toxic Element Pollution Levels and Risk Assessment of Soils and Sediments in the Upstream River, Miyun Reservoir, China. Int. J. Environ. Res. Public Health 2018, 15, 2364. [Google Scholar] [CrossRef] [PubMed] [Green Version]
- Bird, G. The influence of the scale of mining activity and mine site remediation on the contamination legacy of historical metal mining activity. Environ. Sci. Pollut. Res. 2016, 23, 23456–23466. [Google Scholar] [CrossRef] [PubMed]
- Martín Crespo, T.; Gómez Ortiz, D.; Esbrí, J.M.; Monescillo, C.I.; García-Noguero, E.V. Caracterización geoquímica de la balsa de lodos de la mina de San Quintín, Ciudad Real. Geogaceta 2009, 46, 143–146. [Google Scholar]
- García-Lorenzo, M.L.; Crespo-Feo, E.; Esbrí, J.M.; Higueras, P.; Grau, P.; Crespo, I.; Sánchez-Donoso, R. Assessment of Potentially Toxic Elements in Technosols by Tailings Derived from Pb–Zn–Ag Mining Activities at San Quintín (Ciudad Real, Spain): Some Insights into the Importance of Integral Studies to Evaluate Metal Contamination Pollution Hazards. Minerals 2019, 9, 346. [Google Scholar] [CrossRef] [Green Version]
- Martín-Crespo, T.; Gómez-Ortiz, D.; Martín-Velázquez, S.; Ebrí, J.M.; de Ignacio-San José, C.; Sánchez-García, M.J.; Montoya-Montes, I.; Martín-González, F. Abandoned mine tailings in cultural itineraries: Don Quixote Route (Spain). Eng. Geol. 2015, 197, 82–93. [Google Scholar] [CrossRef]
- Rodríguez, L.; Ruiz, E.; Alonso-Azcárate, J.; Rincón, J. Heavy metal distribution and chemical speciation in tailings and soils around Pb-Zn mine in Spain. J. Environ. Manag. 2009, 90, 1106–1116. [Google Scholar] [CrossRef]
- Hussain, F.; Ashun, E.; Jung, S.P.; Kim, T.; Lee, S.-H.; Kim, D.-J.; Oh, S.-E. A direct contact bioassay using immobilized microalgal balls to evaluate the toxicity of contaminated field soils. J. Environ. Manag. 2022, 321, 115930. [Google Scholar] [CrossRef]
- Ferreira, S.L.C.; da Silva, J.B.; Ferreira dos Santos, I.; de Oliveira, O.M.C.; Cerda, V.; Queiroz, A.F.S. Use of pollution indices and ecological risk in the assessment of contamination from chemical elements in soils and sediments—Practical aspects. Trends Environ. Anal. Chem. 2022, 35, e00169. [Google Scholar] [CrossRef]
- Andreu-Sánchez, O.; García-Lorenzo, M.L.; Esbrí, J.M.; Sánchez-Donoso, R.; Iglesias-Martínez, M.; Arroyo, X.; Crespo Feo, E.; Ruiz Costa, N.; Roca Pérez, L.; Castiñeiras, P. Soil and freshwater bioassays to assess ecotoxicological impact in soils affected by mining activities in the Iberian Pyrite Belt. Toxics 2022, 10, 353. [Google Scholar] [CrossRef]
- Palma, P.; Penha, A.M.; Novais, M.H.; Fialho, S.; Lima, A.; Catarino, A.; Mourinha, C.; Alvarenga, P.; Iakunin, M.; Rodrigues, G.; et al. Integrative toolbox to assess the quality of freshwater sediments contaminated with potentially toxic metals. Environ. Res. 2023, 217, 114798. [Google Scholar] [CrossRef]
- Persoone, G.; Marsalek, B.; Blinova, I.; Törökne, A.; Zarina, D.; Manusadzianas, L.; Nalecz-Jawecki, G.; Tofan, L.; Stepanova, N.; Tothova, L.; et al. A Practical and User-Friendly Toxicity Classification System with Microbiotests for Natural Waters and Wastewaters. Environ. Toxicol. 2003, 18, 395–402. [Google Scholar] [CrossRef] [PubMed]
- Liwarska-Bizukojc, E. Evaluation of Ecotoxicity of Wastewater from the Full-Scale Treatment Plants. Water 2022, 14, 3345. [Google Scholar] [CrossRef]
- Sánchez Donoso, R.; Martín-Duque, J.F.; Crespo, E.; Higueras, P.L. Tailing’s geomorphology of the San Quintin mining site (Spain): Landform catalogue, aeolian erosion and environmental implications. Environ. Earth Sci. 2019, 78, 166. [Google Scholar] [CrossRef]
- ASTM. Section four Construction Volume 04.08 and 04.09, Soil and Rock(I). D 2974, D 4972. In Annual Book of ASTM STANDARDS; ASTM International: Conshohocken, PA, USA, 2004. [Google Scholar]
- US EPA. Clean Water Act. Section 503. U.S.; Environmental Protection Agency: Washington, DC, USA, 1993; Volume 58.
- Chung, F.H. Quantitative interpretation of X-ray diffraction patterns. I. Matrix-flushing method of quantitative multicomponent analysis. J. Appl. Cryst. 1974, 7, 519–525. [Google Scholar] [CrossRef]
- Chung, F.H. Quantitative interpretation of X-ray diffraction patterns. II. Adiabatic principle of X-ray diffraction analysis of mixtures. J. Appl. Cryst. 1974, 7, 526–531. [Google Scholar] [CrossRef]
- Chung, F.H. Quantitative interpretation of X-ray diffraction patterns. III. Simultaneous determination of a set of reference intensities. J. Appl. Cryst. 1975, 8, 17–19. [Google Scholar] [CrossRef]
- Deutsches Institut für Normung (DIN). 38414-S4: Determination of Leachability by Water (S4); DIN: Belin, Germany, 1984. [Google Scholar]
- Organisation for Economic Cooperation and Development (OECD). Test No. 202: Daphnia sp. Acute Immobilisation Test; OECD: Paris, France, 2004. [Google Scholar] [CrossRef] [Green Version]
- DaphtoxkitF™ Standard Operating Procedure. 2000. Available online: https://www.microbiotests.com/wp-content/uploads/2019/07/daphnia-toxicity-test_daphtoxkit-f_standard-operating-procedure.pdf (accessed on 26 December 2022).
- ThamnotoxkitF™. Standard Operating Procedure. Crustacean Toxicity Screening Test for Freshwater, 1995. Available online: https://www.microbiotests.com/wp-content/uploads/2019/05/folder-Thamnotoxkit-F-Thamnocephalus-toxicity-test.pdf (accessed on 26 December 2022).
- Davoren, M.; Fogarty, A.M. A test battery for the ecotoxicological evaluation of the agri-chemical Environ. Ecotoxicol. Environ. Saf. 2004, 59, 116–122. [Google Scholar] [CrossRef]
- ISO 14380:2011; Water Quality-Determination of the Acute Toxicity to Thamnocephalus Platyurus (Crustacea, Anostraca). International Organization for Standardization: Geneva, Switzerland, 2011.
- Organisation for Economic Cooperation and Development (OECD). Test No. 201: Freshwater Alga and Cyanobacteria, Growth Inhibition Test; OECD: Paris, France, 2011. [Google Scholar] [CrossRef] [Green Version]
- Algaltoxkit F™ Standard Operating Procedure. 2015. Available online: https://www.microbiotests.com/wp-content/uploads/2019/07/freshwater-algae-toxicity-test_algaltoxkit-f_standard-operating-procedure.pdf (accessed on 26 December 2022).
- Muller, G. Index of Geoaccumulation in Sediments of the Rhine River. Geojournal 1969, 2, 108–118. [Google Scholar]
- Gallego, S.; Esbrí, J.M.; Campos, J.A.; Peco, J.D.; Martin-Laurent, F.; Higueras, P. Microbial diversity and activity assessment in a 100-year-old lead mine. J. Hazard. Mater. 2021, 15, 410. [Google Scholar] [CrossRef]
- Qing, X.; Yutong, Z.; Shenggao, L. Assessment of heavy metal pollution and human health risk in urban soils of steel industrial city (Anshan), Liaoning, Northeast China. Ecotoxicol. Environ. Saf. 2015, 120, 377–385. [Google Scholar] [CrossRef]
- Jorfi, S.; Maleki, R.; Jaafarzadeh, N.; Ahmadi, M. Pollution load index for heavy metals in Mian-Ab plain soil Khuzestan, Iran. Data Brief 2017, 15, 584–590. [Google Scholar] [CrossRef]
- Statgraphics 19 Software. Available online: https://www.statgraphics.com/ (accessed on 26 December 2022).
- Iwasaki, Y.; Kotani, K.; Kashiwada, S.; Masunaga, S. Does the Choice of NOEC or EC10 Affect the Hazardous Concentration for 5% of the Species? Environ. Sci. Technol. 2015, 49, 9326–9330. [Google Scholar] [CrossRef] [PubMed]
- Finney, D.J. Probit Analysis, 2nd ed.; Cambridge University Press: Cambridge, UK, 1971. [Google Scholar]
- Gómez Ortiz, D.; Martín Crespo, T.; Esbrí, J.M. Geoenvironmental characterization of the San Quintín mine tailings, Ciudad Real (Spain). Dyna 2010, 77, 131–140. [Google Scholar]
- Alveranga, P.; Palma, P.; de Varennes, A.; Cunha-Queda, A.C. A contribution towards the risk assessment of soils from São Domingos Mine (Portugal): Chemical, microbial and ecotoxicity indicators. Environ. Pollut. 2012, 161, 50–56. [Google Scholar] [CrossRef] [PubMed]
- Loureiro, S.; Ferreira, A.; Soares, A.; Nogueira, A. Evaluation of the toxicity of two soils from Jales Mine (Portugal) using aquatic bioassays. Chemosphere 2005, 61, 168–177. [Google Scholar] [CrossRef] [PubMed]
- Rodriguez, L.; González-Corrochano, B.; Medina-Díaz, H.; López-Bellido, F.; Fernández-Morales, F.J.; Alonzo-Azcárate, J. Does environmental risk really change in abandoned mining areas in the medium term when no control measures are taken? Chemosphere 2022, 391, 133129. [Google Scholar] [CrossRef]
- Sharma, S.S.; Schat, H.; Vooijs, R.; van Heerwaadens, L.M. Combination toxicology of copper, zinc, and cadmium I binary mixtures: Concentration dependent antagonistic, nonadditive, and synergistic effects on root growth in Silene vulgris. Environ. Toxicol. Chem. 1999, 18, 348–353. [Google Scholar] [CrossRef]
- Mensah, A.K.; Marschner, B.; Antoniadis, V.; Stemn, E.; Shaheen, S.M.; Rinklebe, J. Human health risk via soil ingestion of potentially toxic elements and remediation potential of native plants near an abandoned mine spoil in Ghana. Sci. Total Environ. 2021, 798, 149272. [Google Scholar] [CrossRef]
- Santos, M.V.S.; da Silva Júnior, J.B.; de Carvalho, C.E.V.; dos Santos Vergílio, C.; Hadlich, G.M.; de Santana, C.O.; de Jesus, T.B. Geochemical evaluation of potentially toxic elements determined in surface sediment collected in an area under the influence of gold mining. Mar. Pollut. Bull. 2020, 158, 111384. [Google Scholar] [CrossRef]
- Ali, A.; Strezov, V.; Davies, P.J.; Wright, I. River sediment quality assessment using sediment quality indices for the Sydney basin, Australia affected by coal and coal seam gas mining. Sci. Total Environ. 2018, 616, 695–702. [Google Scholar] [CrossRef]
- Masto, R.E.; George, J.; Rout, T.K.; Ram, L.C. Multi element exposure risk from soil and dust in a coal industrial area. J. Geochem. Explor. 2017, 176, 100–107. [Google Scholar] [CrossRef]
- Varga, N.; Krcmar, D.; Dalmacija, B.; Gvozdenac, S.; Tricković, J.; Roncevic, S.; Prica, M. Assessment of sediment pollution using chemical and biological trait approach. Carpathian J. Earth Environ. Sci. 2018, 13, 359–368. [Google Scholar] [CrossRef]
- Peco, J.D.; Higueras, P.; Campos, J.A.; Olmedilla, A.; Romero-Puertas, M.C.; Sandalio, L.M. Deciphering lead tolerance mechanisms in a population of the plant species Biscutella auriculata L. from a mining area: Accumulation strategies and antioxidant defenses. Chemosphere 2020, 261, 127721. [Google Scholar] [CrossRef]
- Peco, J.D.; Campos, J.A.; Romero-Puertas, M.C.; Olmedilla, A.; Higueras, P.; Sandalio, L.M. Characterization of mechanisms involved in tolerance and accumulation of Cd in Biscutella auriculata L. Ecotoxicol. Environ. Saf. 2020, 201, 110784. [Google Scholar] [CrossRef] [PubMed]


| Cd | Pb | Zn | Fe | As | References | |
|---|---|---|---|---|---|---|
| Mean SQMD | 130 | 42,900 | 15,100 | 63,600 | 47 | This work |
| Mean value east zone | 58 | 32,400 | 6,700 | 71,300 | 7 | |
| Mean value west zone | 170 | 49,600 | 20,400 | 58,700 | 72 | |
| Minimum | 25 | 1800 | 600 | 36,300 | 0.05 | |
| Maximum | 440 | 144,900 | 47,700 | 202,600 | 549 | |
| Background levels San Quintín mining area | ||||||
| Local Background | 1.5 | 160 | 87 | 28,963 | 8 | [28] |
| Other studies in San Quintín mining area | ||||||
| Mean | 38 | 18,036 | 8825 | 42,597 | 88 | [4] |
| Mean | - | 21,892 | 11,242 | 54,573 | - | [13] |
| Mean | - | 11,260 | 8549 | 42,170 | - | [34] |
| Cd | Pb | Zn | Fe | pH | EC | EC50 D.m. | EC50 T.p. | |
|---|---|---|---|---|---|---|---|---|
| Pb | 0.3 | |||||||
| Zn | 0.3 | 0.1 | ||||||
| Fe | −0.2 | 0.1 | 0.0 | |||||
| pH | −0.4 | −0.3 | −0.7 * | −0.6 * | ||||
| EC | 0.5 | 0.3 | 0.5 * | 0.5 | −0.8 * | |||
| EC50 D.m. | −0.5 * | −0.7 * | −0.4 | −0.2 | 0.5 * | −0.7 * | ||
| EC50 T.p. | −0.5 * | −0.6 * | −0.4 | −0.1 | 0.4 | −0.5 * | 0.8 * | |
| EC50 R.s. | -0.4 | −0.8 * | −0.4 | −0.2 | 0.5 | −0.6 * | 0.9 * | 0.8 * |
| Sample | DM TU | TP TU | RS TU | Igeo Cd | Igeo Pb | PI Zn | Igeo Fe | Igeo As | PLI |
|---|---|---|---|---|---|---|---|---|---|
| RSQE-01 | 100 | 2500 | 430 | 5.9 | 8.9 | 6.9 | 3.1 | −6.1 | 9.0 |
| RSQE-02 | 76 | 68 | 490 | 6.1 | 9.7 | 6.8 | 1.9 | 3.3 | 32 |
| RSQE-03 | <2 | 20 | <2 | 4.6 | 4.1 | 3.4 | 1.1 | −6.0 | 1.8 |
| RSQE-04 | 7 | 145 | <2 | 6.5 | 7.7 | 8.3 | 1.3 | −6.0 | 7.9 |
| RSQE-05 | 320 | <2 | 4760 | 6.3 | 8.4 | 6.4 | 1.9 | −6.0 | 7.0 |
| RSQE-06 | 15 | 1560 | 250 | 5.9 | 7.7 | 7.0 | 1.5 | −6.0 | 6.2 |
| RSQE-07 | <2 | <2 | <2 | 5.0 | 5.0 | 5.1 | 1.2 | −6.0 | 2.8 |
| RSQO-01 | 38 | 10 | 59 | 5.1 | 7.9 | 3.5 | 3.4 | −6.0 | 4.6 |
| RSQO-02 | 180 | <2 | 2080 | 6.8 | 8.5 | 8.6 | 1.6 | −6.0 | 10 |
| RSQO-03 | <2 | <2 | <2 | 6.0 | 6.5 | 7.8 | 0.9 | −6.0 | 5.6 |
| RSQO-04 | 66 | 19 | 90 | 7.3 | 9.0 | 8.3 | 0.9 | −6.0 | 10 |
| RSQO-05 | 270 | 660 | 190 | 8.3 | 10 | 9.2 | 1.5 | 6.8 | 100 |
| RSQO-06A | 460 | 240 | 130 | 7.4 | 10 | 7.9 | 1.4 | −6.0 | 12 |
| RSQO-6B | 38 | 44 | 110 | 8.8 | 10 | 9.7 | 1.2 | 5.5 | 84 |
| RSQO-07 | 90 | 66 | 150 | 6.9 | 7.7 | 8.1 | 0.9 | −6.0 | 7.7 |
| RSQO-08 | 48 | 110 | 28 | 7.4 | 7.7 | 8.2 | 1.2 | −6.0 | 8.8 |
| RSQO-09 | 54 | 50 | 8 | 6.8 | 7.3 | 8.7 | 1.0 | −6.0 | 7.9 |
| RSQO-10 | 26 | 55 | 49 | 7.5 | 7.5 | 8.4 | 1.0 | −6.0 | 8.6 |
Disclaimer/Publisher’s Note: The statements, opinions and data contained in all publications are solely those of the individual author(s) and contributor(s) and not of MDPI and/or the editor(s). MDPI and/or the editor(s) disclaim responsibility for any injury to people or property resulting from any ideas, methods, instructions or products referred to in the content. |
© 2023 by the authors. Licensee MDPI, Basel, Switzerland. This article is an open access article distributed under the terms and conditions of the Creative Commons Attribution (CC BY) license (https://creativecommons.org/licenses/by/4.0/).
Share and Cite
Ferri-Moreno, I.; Barquero-Peralbo, J.I.; Andreu-Sánchez, O.; Higueras, P.; Roca-Pérez, L.; García-Lorenzo, M.L.; Esbrí, J.M. Categorization of Mining Materials for Restoration Projects by Means of Pollution Indices and Bioassays. Minerals 2023, 13, 492. https://doi.org/10.3390/min13040492
Ferri-Moreno I, Barquero-Peralbo JI, Andreu-Sánchez O, Higueras P, Roca-Pérez L, García-Lorenzo ML, Esbrí JM. Categorization of Mining Materials for Restoration Projects by Means of Pollution Indices and Bioassays. Minerals. 2023; 13(4):492. https://doi.org/10.3390/min13040492
Chicago/Turabian StyleFerri-Moreno, Inmaculada, Jose Ignacio Barquero-Peralbo, Oscar Andreu-Sánchez, Pablo Higueras, Luis Roca-Pérez, Mari Luz García-Lorenzo, and Jose María Esbrí. 2023. "Categorization of Mining Materials for Restoration Projects by Means of Pollution Indices and Bioassays" Minerals 13, no. 4: 492. https://doi.org/10.3390/min13040492