4.1. Influence of Fly Ash Milling on Its Physico-Chemical Properties
The chemical composition of the raw fly ash (wt.%) is: 47.82 SiO
2, 14.87 Al
2O
3, 11.9 Fe
2O
3, 16.03 CaO, 3.16 MgO, 1.31 SO
3, 0.72 TiO
2, 0.91 K
2O, 0.24 Na
2O, 0.41 Mn
3O
4, 0.08 P
2O
5, 0.06 BaO, 1.39 LOI. The raw fly ash contains magnetite (Fe
3O
4), mullite (3Al
2O
3·2SiO
2), quartz (SiO
2), hematite (Fe
2O
3), and anorthite (CaO·Al
2O
3·2SiO
2). Based on the content of calcium and other major oxides, the ASTM classification of this fly ash is C-class. The effect of ball milling and attrition milling on the Blaine surface area and granulometric characteristics of the fly ash is shown in
Table 1. Although attrition milling was carried out in continuous mode, it results in the highest Blaine surface area. The fly ash ball-milled for 60 min has a lower Blaine surface area than that milled for 30 min, which remains unchanged. This may be explained by agglomeration in the fly ash ball-milled as a discrete batch in contrast with the continuously milled fly ash.
Granulometric characterization of the fly ashes treated by ball or attrition milling suggests that more prolonged milling did not cause a decrease in the number of fine particles. The greatest reduction occurs in the 25–43 μm range, while the raw fly ash contains the finest particles in the range of 43 and 75 μm. The data also show that milling decreases the particle size to less than 25 μm after 60 min ball milling and attrition milling. This suggests that some agglomeration of the fine particles has occurred, consistent with the results of the Blaine surface area measurements of the sample ball-milled for 60 min, but seems to be contrary to the attrition milling which may have introduced a degree of porosity in the milled fly ash in the 25–38 mm range. The granulometric characterization of the milled fly ashes suggests that milling produces a negligible reduction in particle size, especially in the size range below 25 μm. The greatest degree of particle size reduction occurs in particles larger than 25 μm. The most significant degree of particle size reduction (up to 38 μm) occurs in the attrition-milled fly ash, probably within the glass phase.
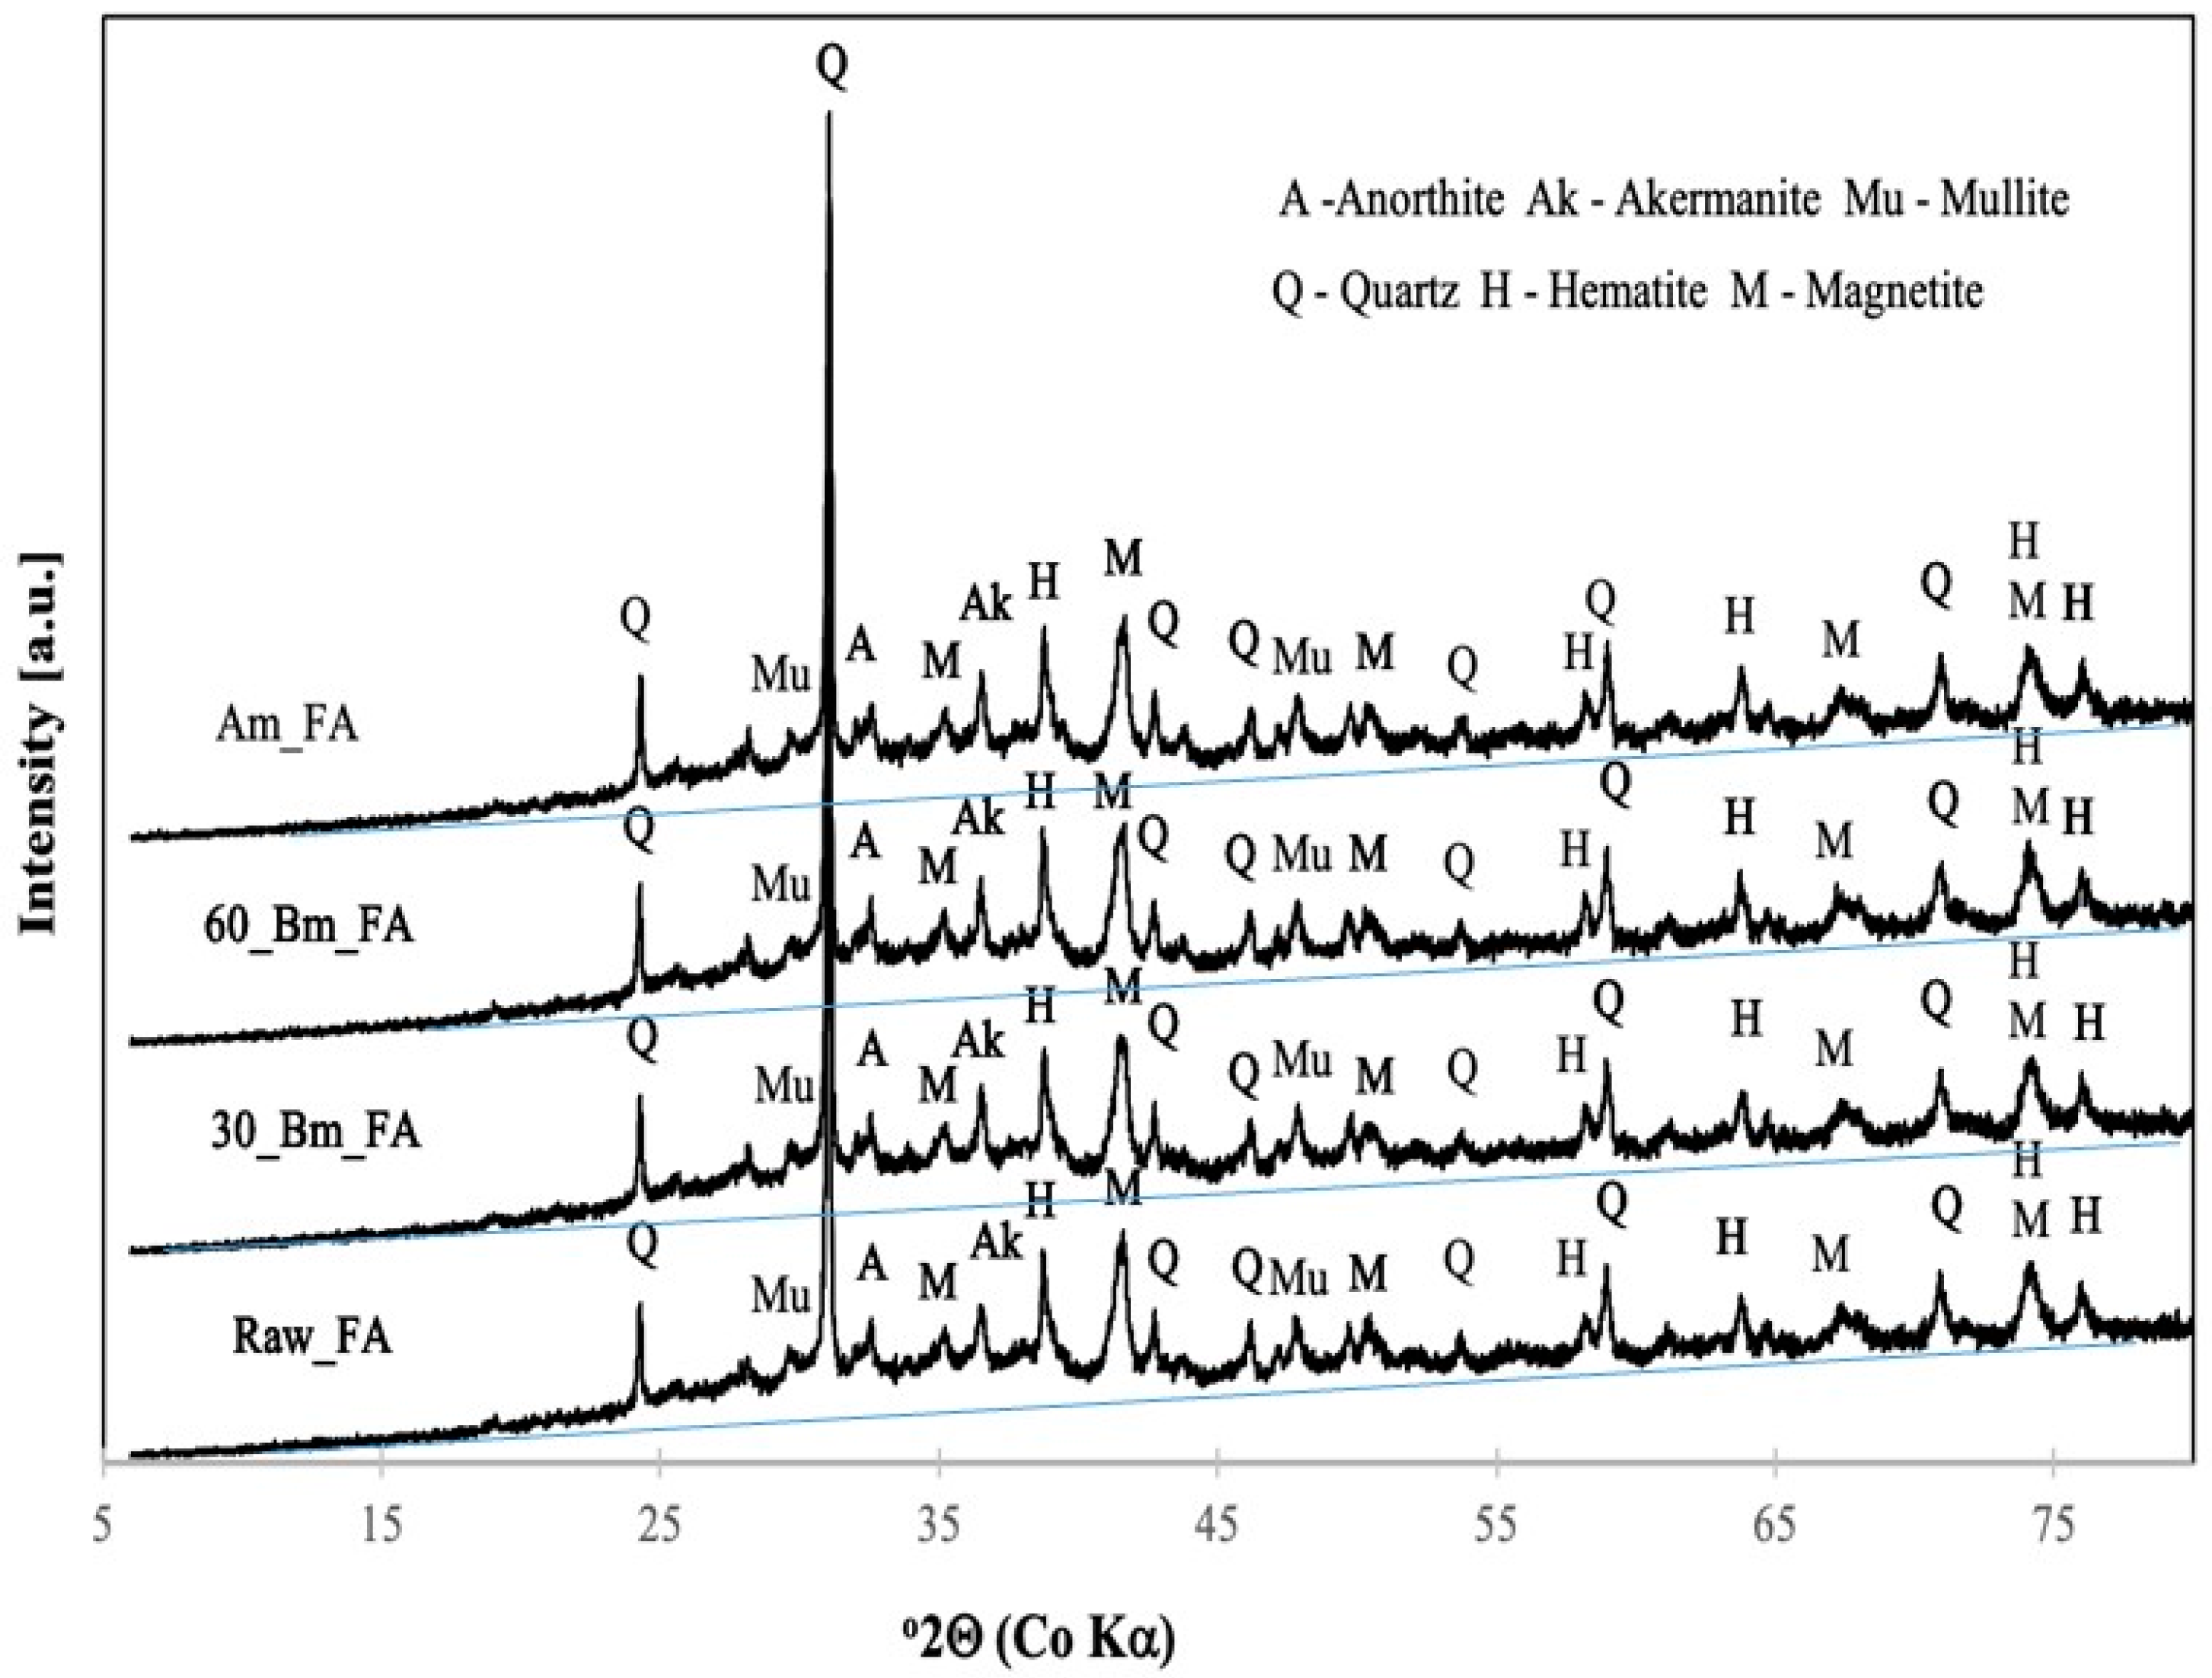
The XRD patterns (
Figure 1) show the presence of quartz, magnetite, hematite, and akermanite phases as the main constituents of the crystalline phases, with minor amounts of mullite and anorthite. In general, there is almost no change in the crystalline phases of the fly ashes after milling. Additionally, no significant change in the relative contents of the crystalline and amorphous contributions of the milled samples and the raw fly ash is apparent by direct superimposition of the diffraction patterns. A relatively large X-ray amorphous contribution between 27 and 45° 2Θ was estimated by integration using a background correction based on data between 5 and 15° 2Θ with a linear extrapolation to 80° 2Θ, showing that this amorphous content remains approximately unchanged. However, this does not rule out the possibility that the main changes introduced by milling occur in the amorphous phases. This would support our view that the increase in surface area of the attrition-milled fly ash is related to the amorphous particles.
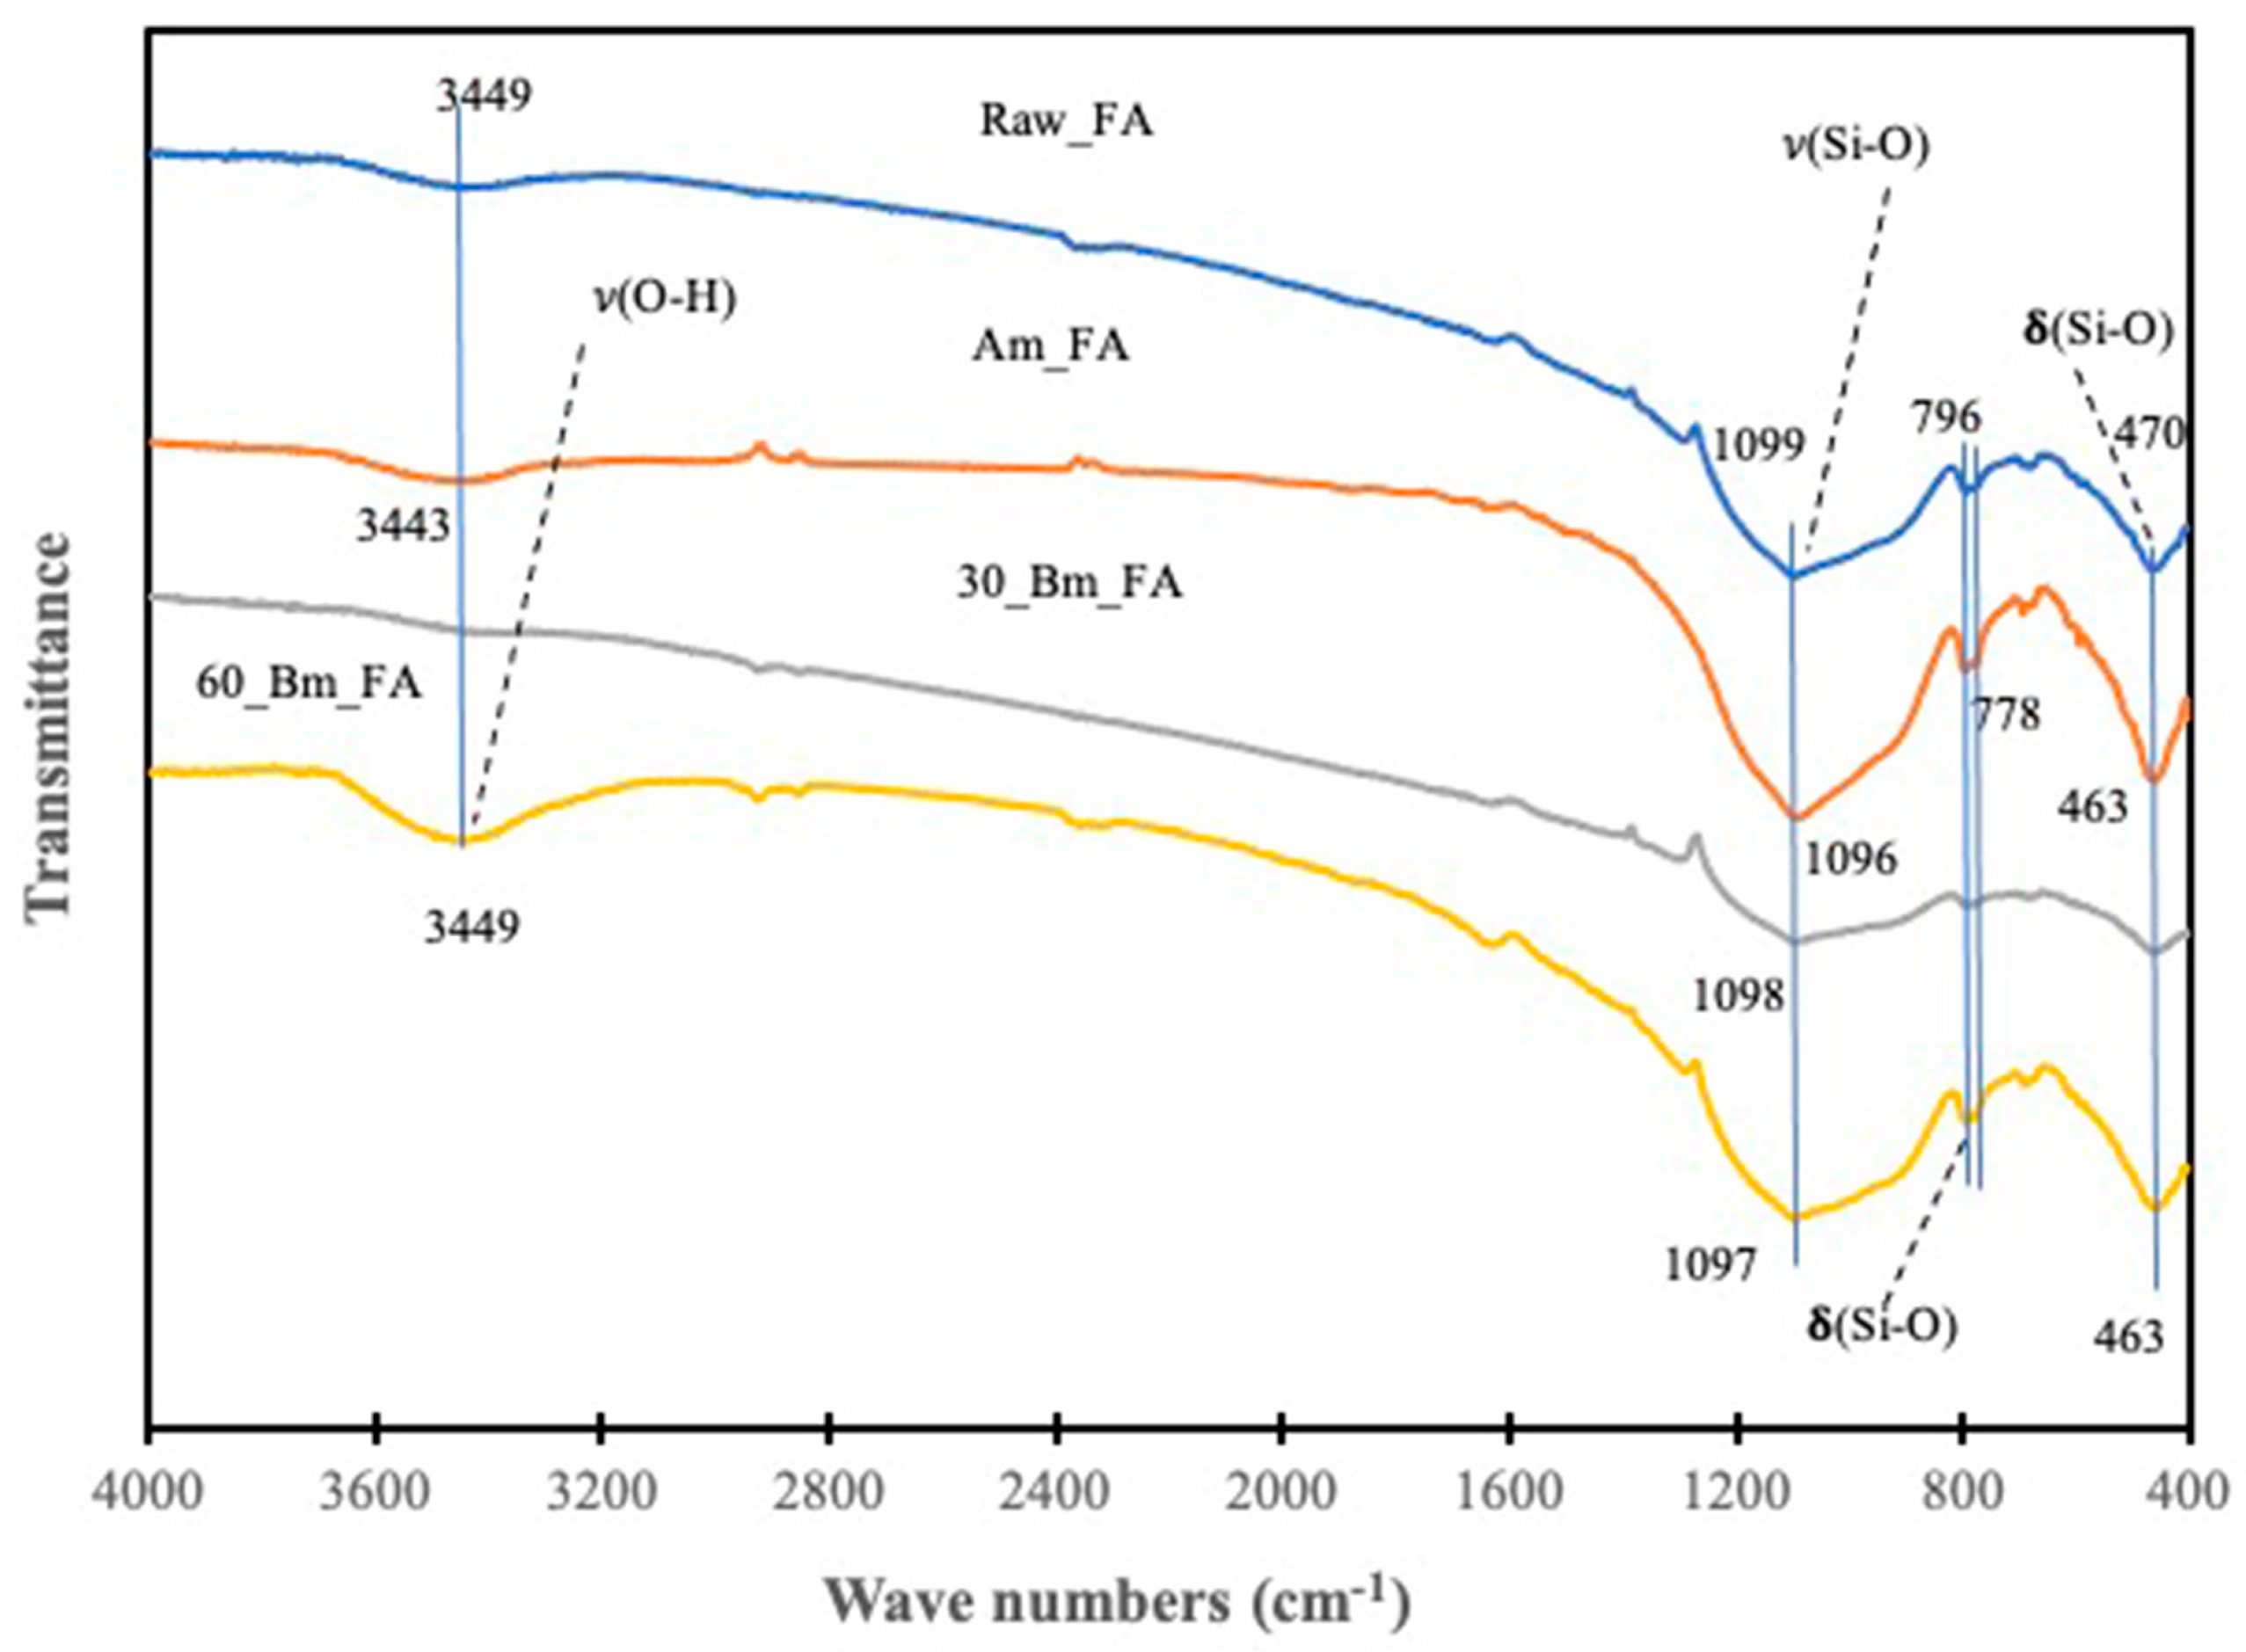
The FTIR spectra (
Figure 2) of the milled samples show absorption bands centered at 463–470, 778–796, 1096–1099, and around 3449 cm
−1; these retain a similar shape and position irrespective of the milling treatment. This suggests that milling does not change the bonding state of the raw fly ash. The spectra of the fly ash sample ball milled for 60 min show an increased intensity in the bands of adsorbed water molecules at 1630 (the bending mode) and 3449 cm
−1 (the OH-stretching modes). The stretching and bending modes of the Si-O bond are shown in
Figure 2.
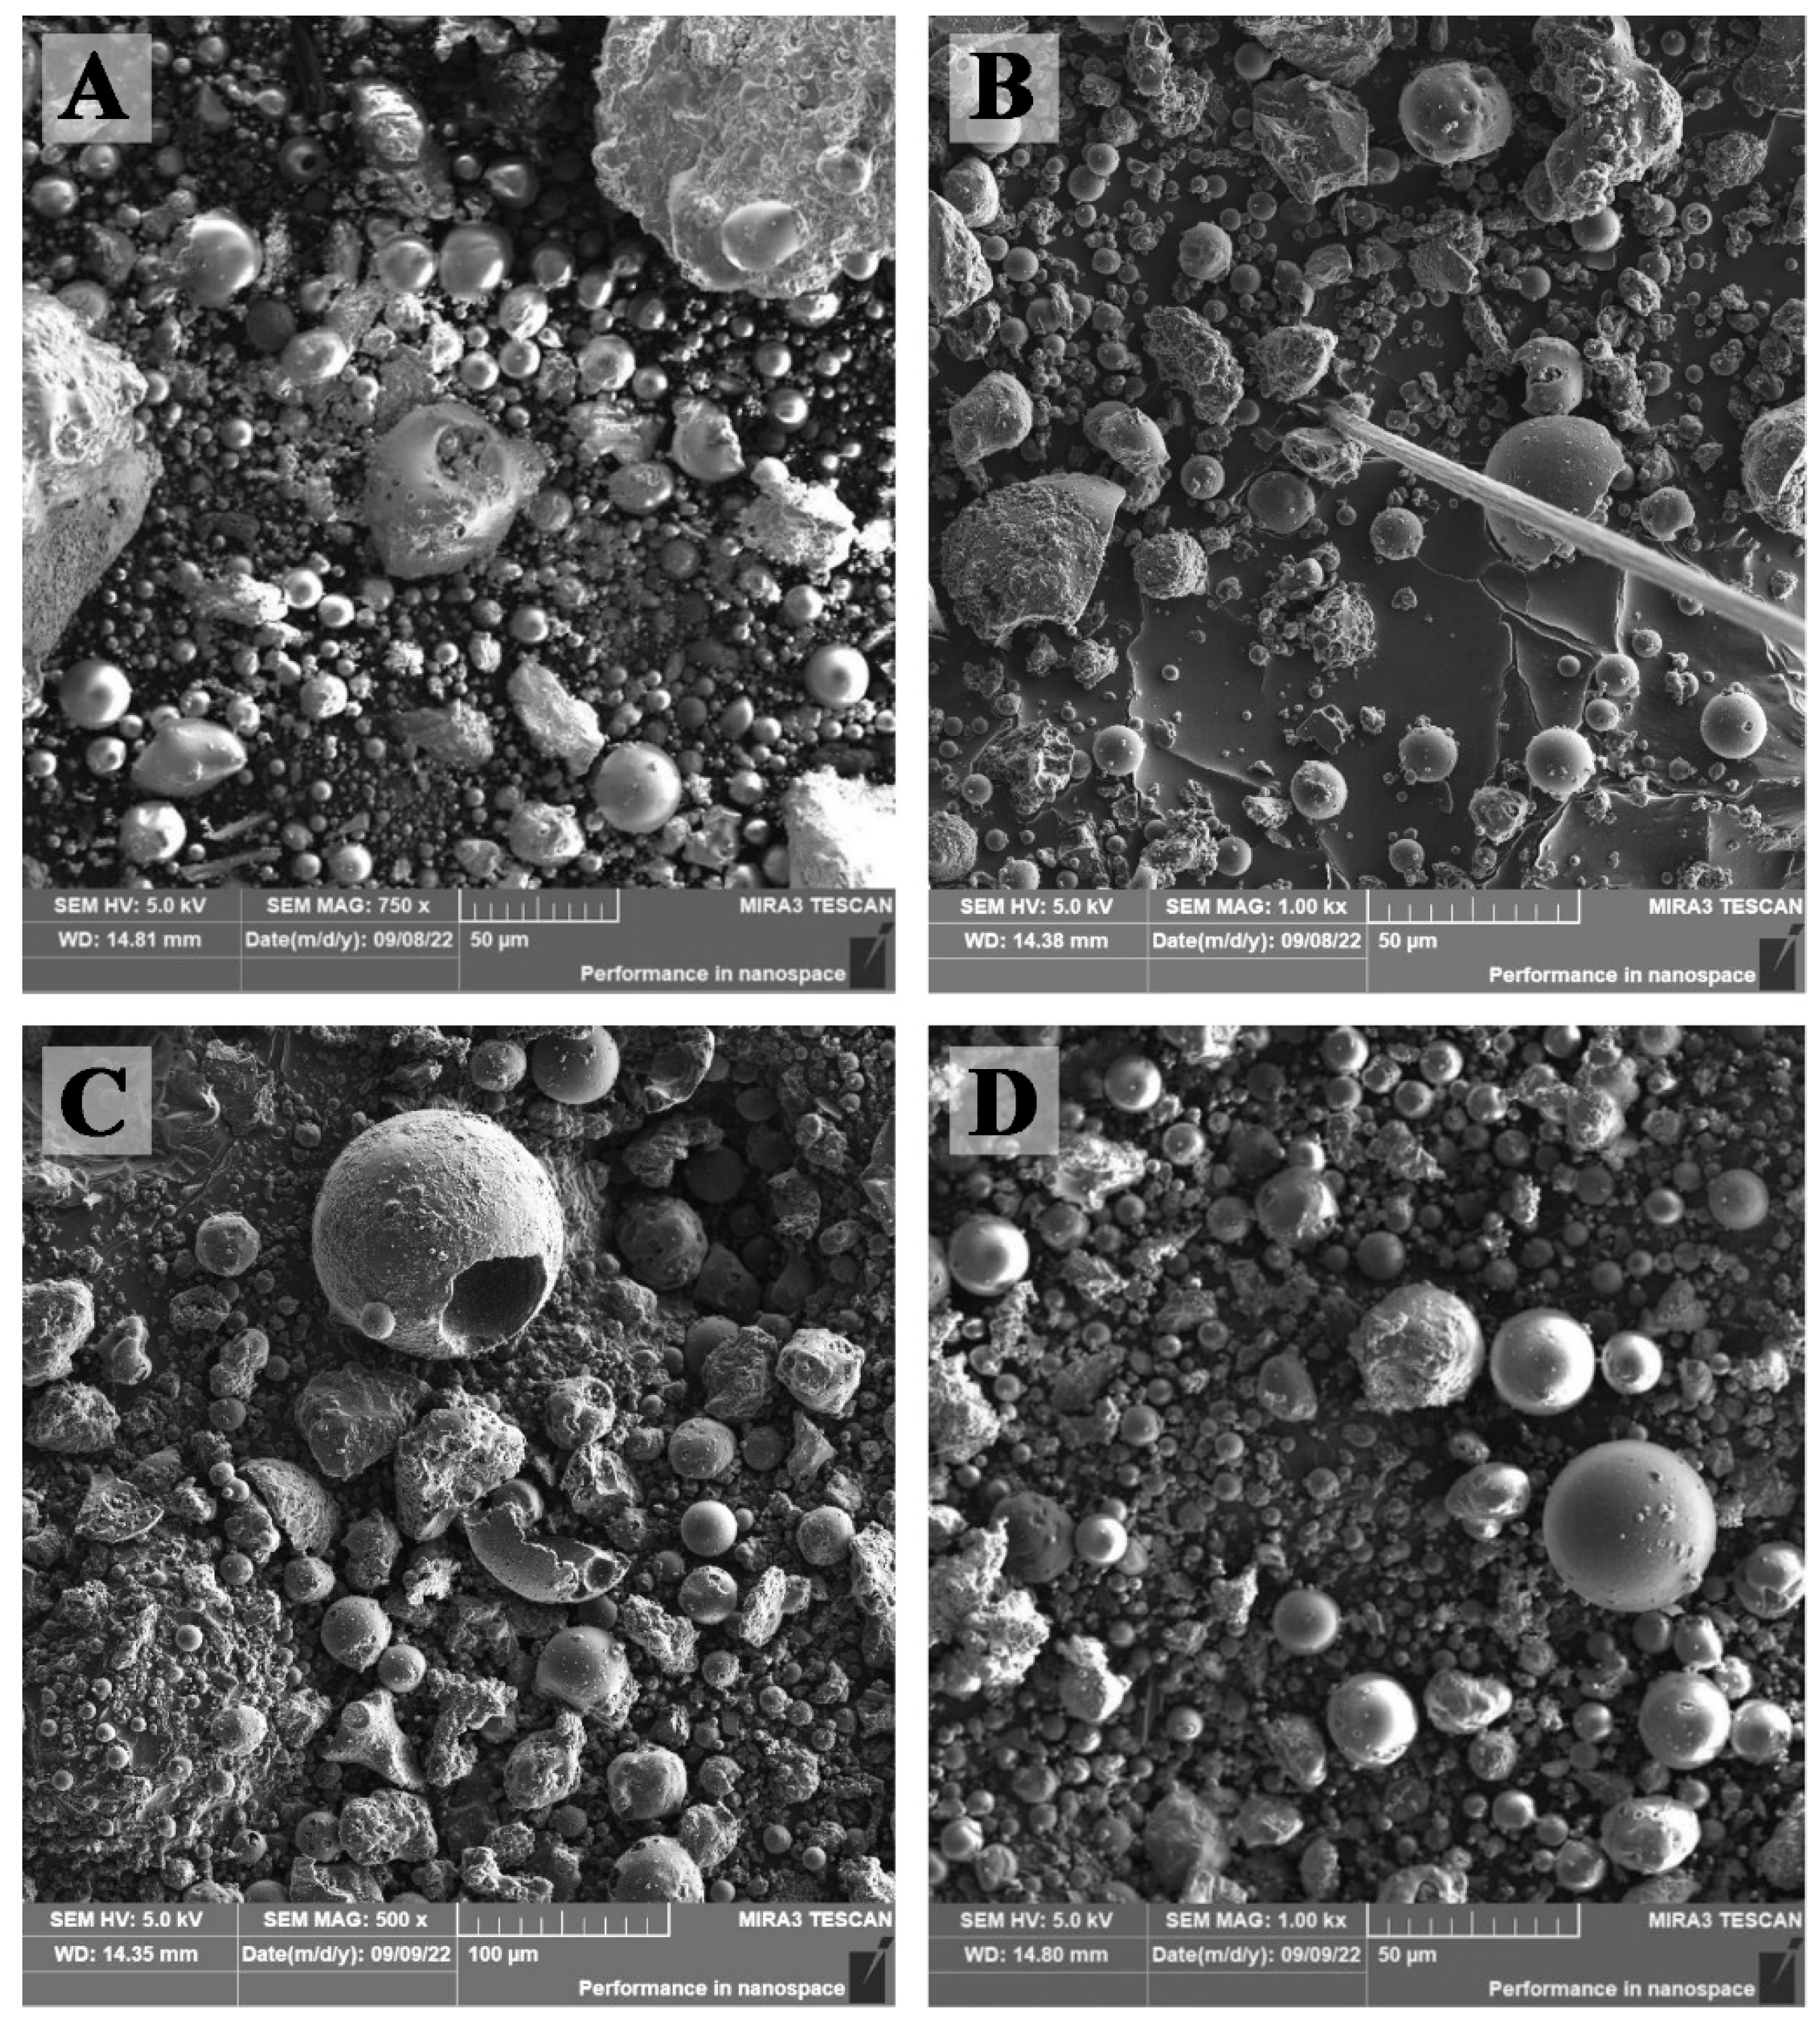
The SEM micrographs of the raw and milled fly ash samples (
Figure 3) indicate that there is little difference in the morphology introduced by milling, with spherical particles observed as reported previously [
18]. The sample ball-milled for 60 min shows an agglomerated microstructure, consistent with the surface area data (
Table 1).
4.2. Influence of Milled Fly Ashes on the Properties of Geopolymers
Visual examination of the samples prepared for the compressive strength measurements revealed a brittle glass-like appearance of the geopolymers prepared from the attrition-milled fly ashes. These geopolymers also showed microcracks, and during compressive strength testing, they ruptured noisily, as usually occurs in ceramic-like brittle materials. This may indicate the increased presence of a glass-like gel phase in the attrition-milled geopolymers.
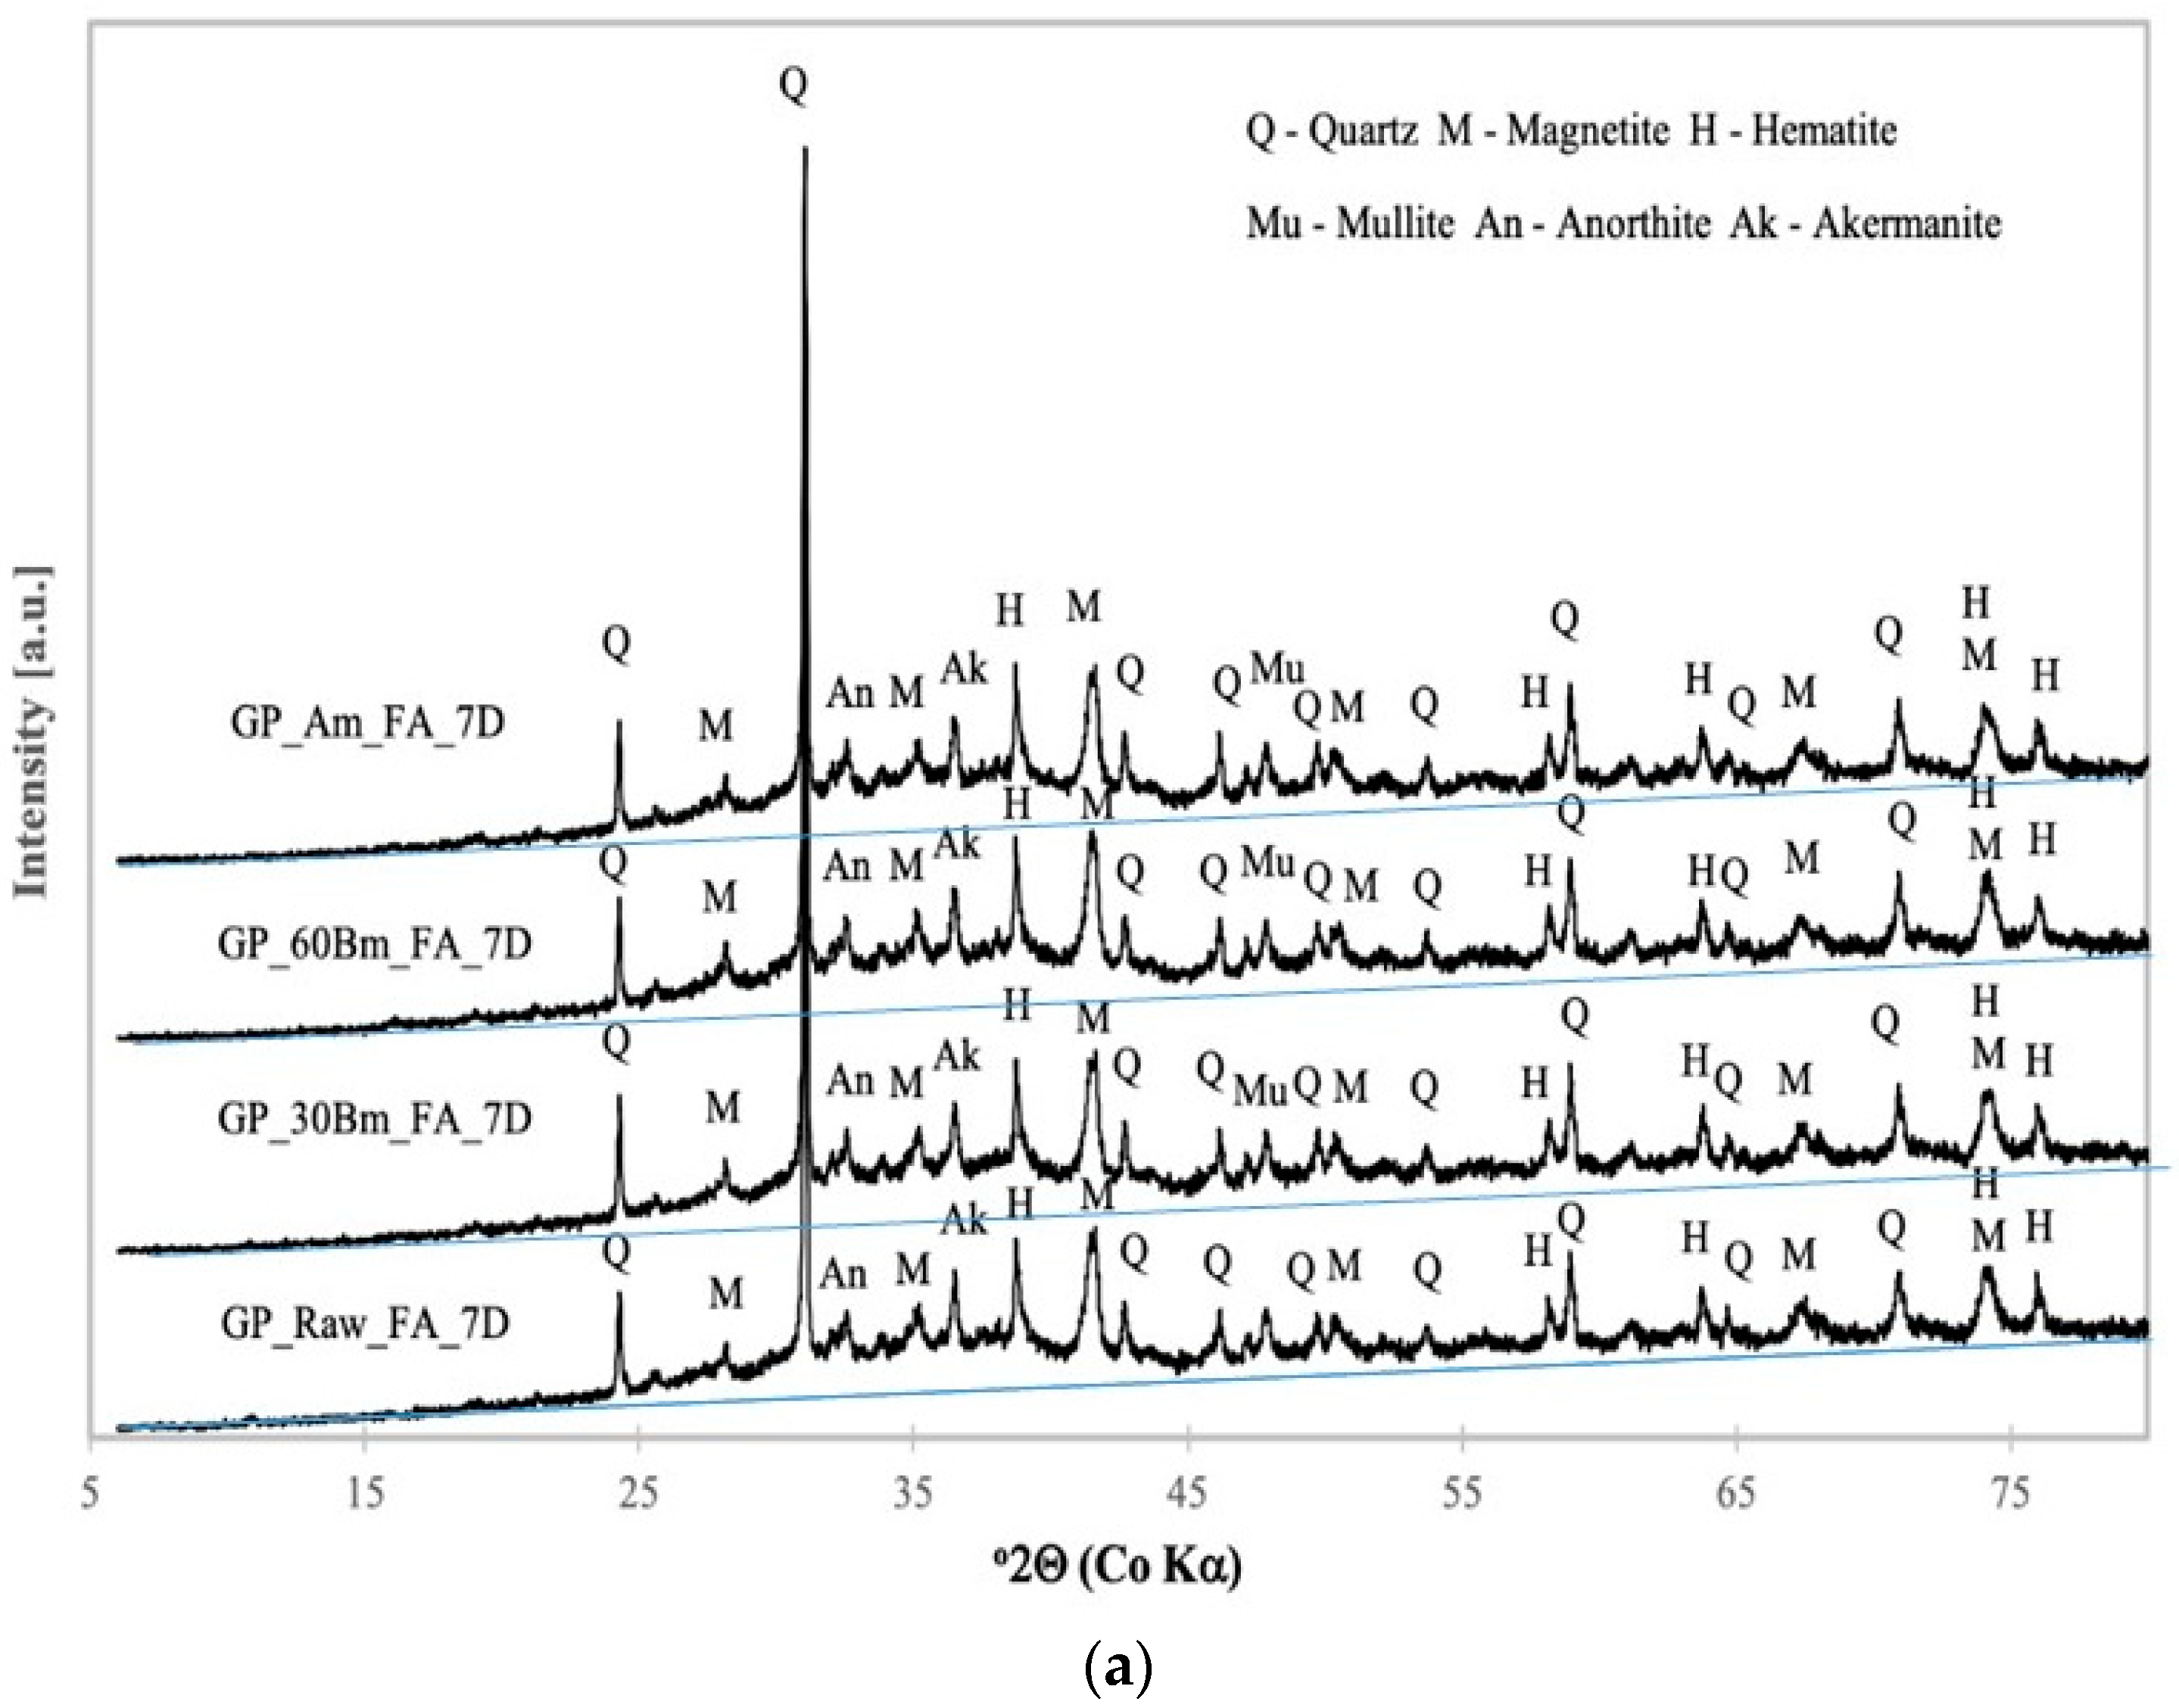
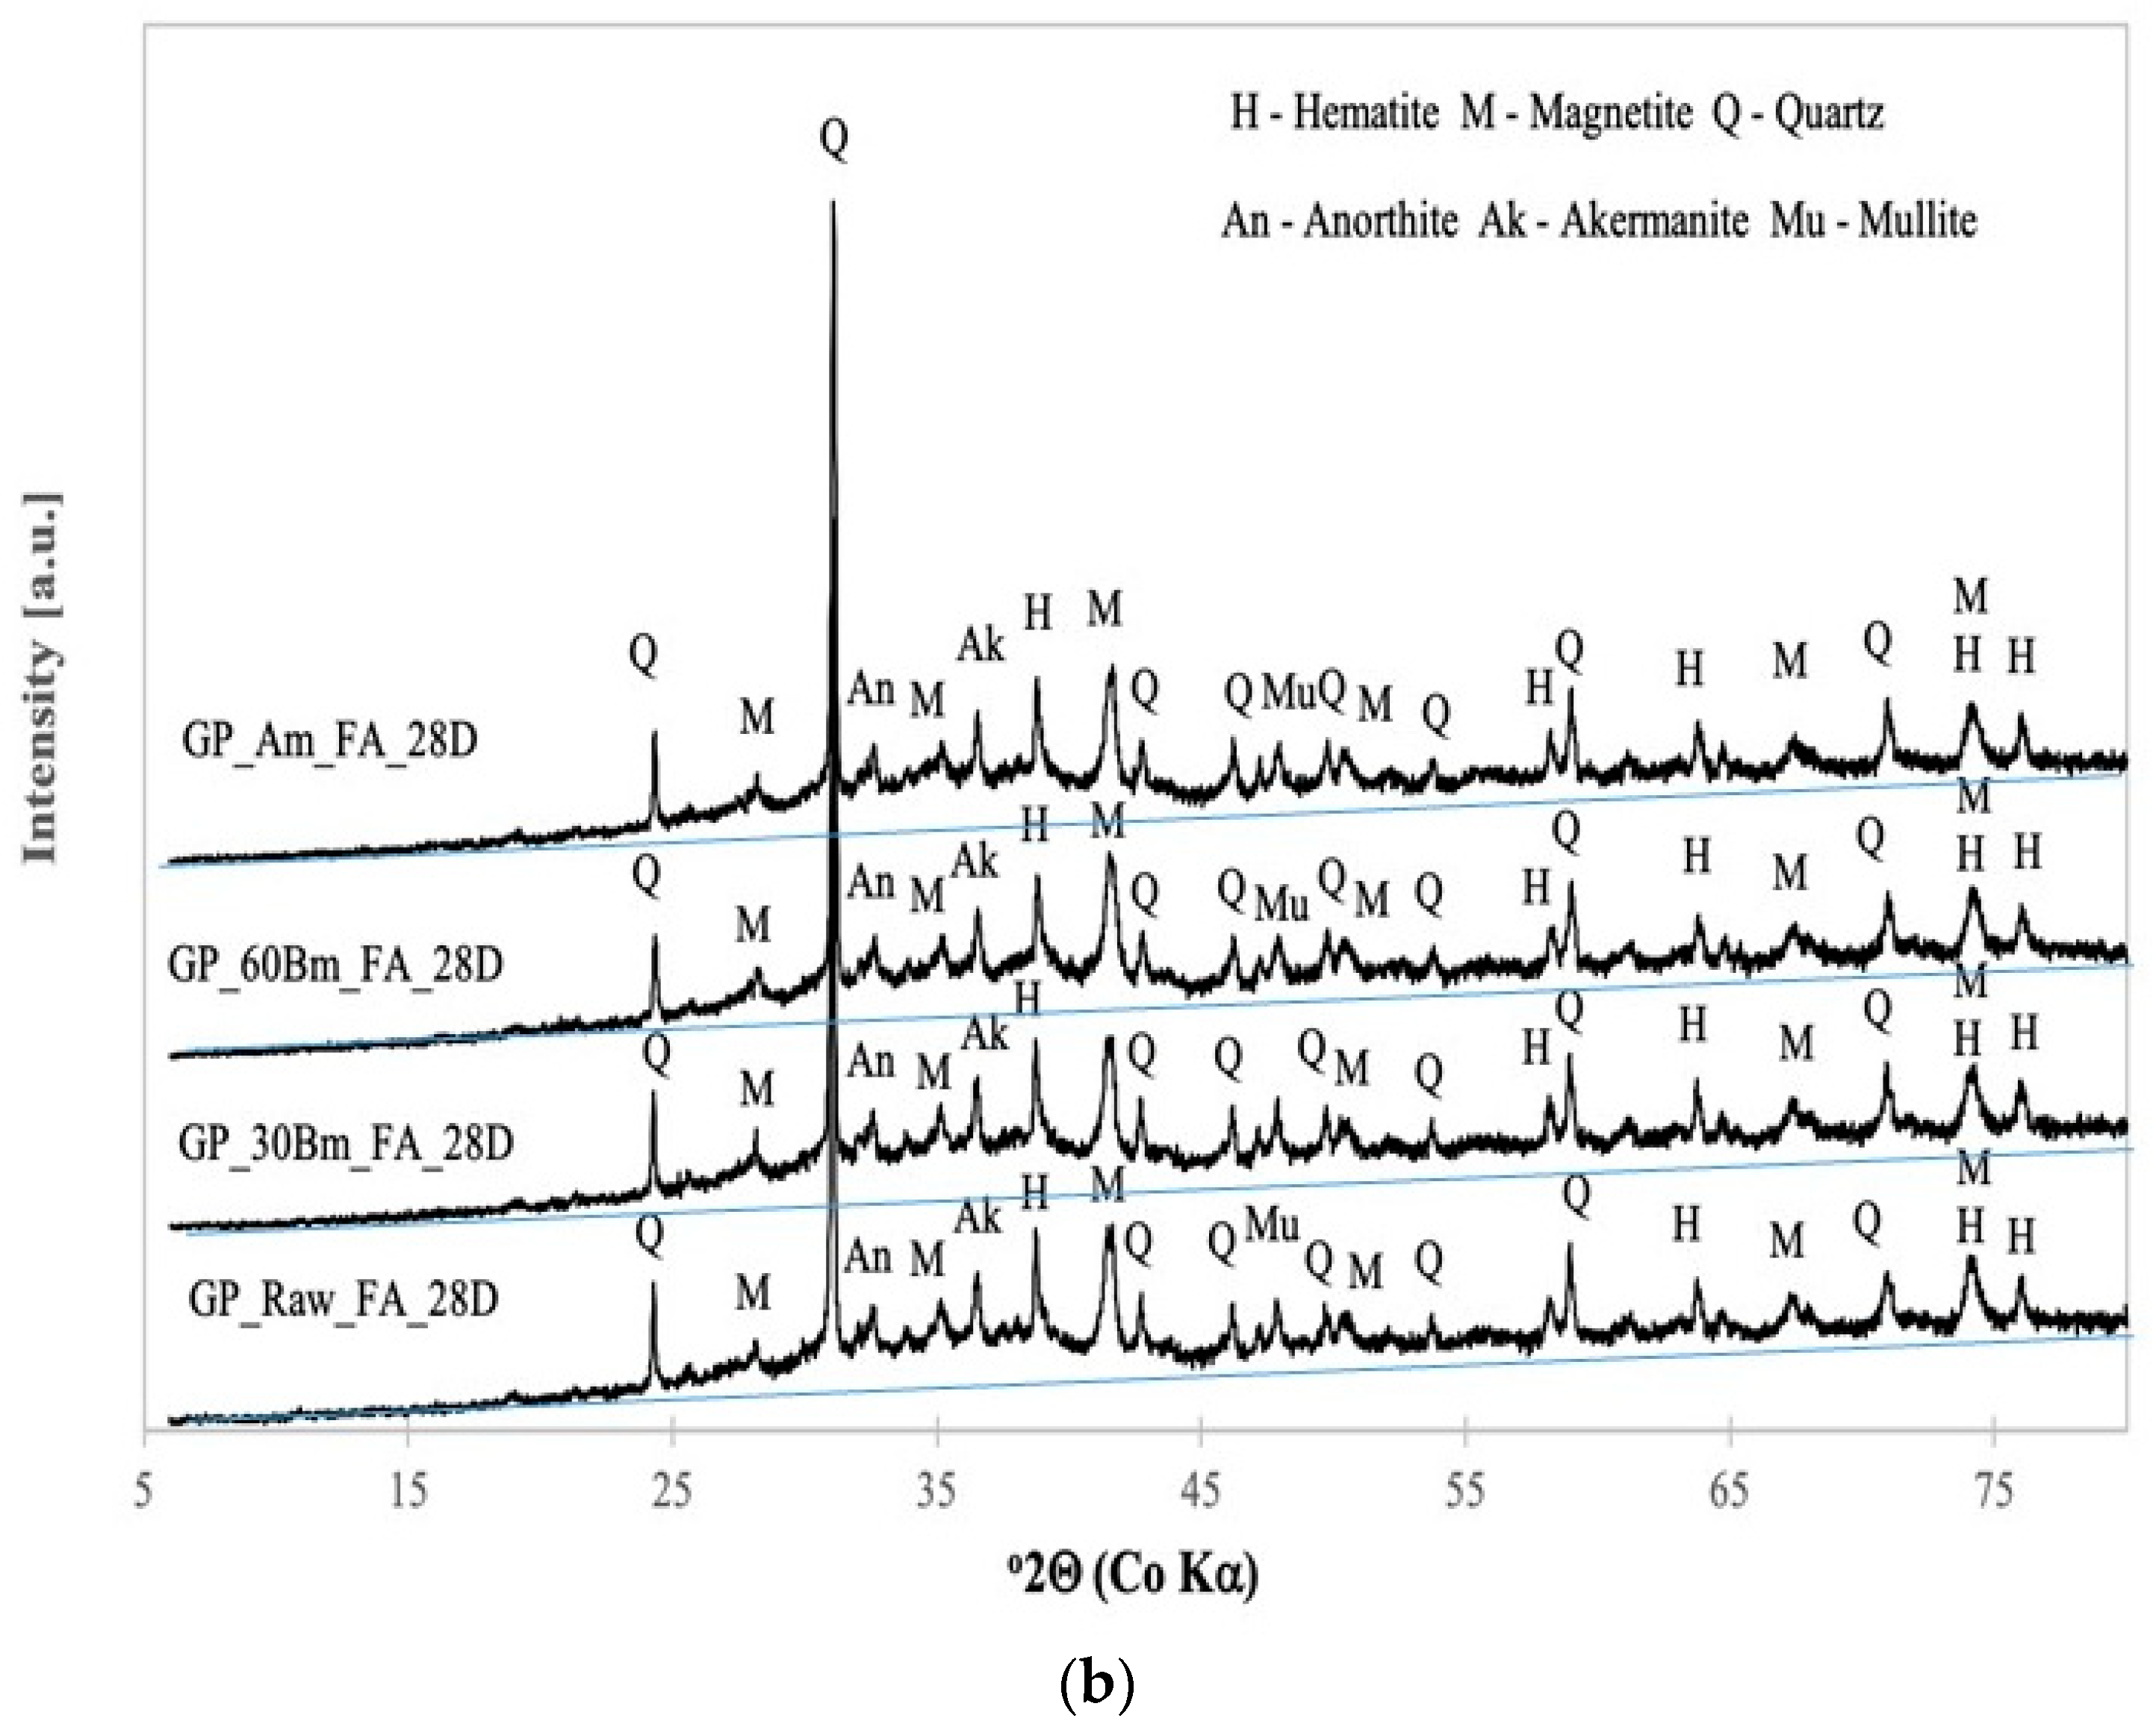
Figure 4a,b show the XRD patterns of the geopolymer pastes cured for 7 and 28 days. The XRD patterns of the cured samples resemble those of the raw and milled fly ash starting materials, with no apparent change in the crystalline components resulting from the alkaline treatment. This suggests that the geopolymer-forming reactions occur principally in the amorphous component of the fly ash, with negligible participation of the crystalline components. In contrast with previous work on geopolymer formation from ash from the fourth thermal power plant of Ulaanbaatar city [
20], zeolite formation was not observed in the cured products. This may be related to the low curing temperature of the present samples (40 °C) where the dissolution rate of the fly ash is low. Using the baselines shown in
Figure 4, the integration of the total intensity with respect to the diffracted peak intensity indicates that between 37 and 45% of the diffraction patterns is related to the amorphous contribution, i.e., this represents a small change in the amorphous content. On the other hand, a small but significant shift in the scattered intensity from lower 2° theta values (say from 20° to 30°) to higher 2° theta values (30° to 40°) is observed when calculating the difference patterns of the raw and milled samples minus those of the related alkali-activated samples. As a cross check, the difference pattern of the milled pattern does not show this effect. A related but more pronounced observation is discussed below in connection with the FTIR absorption spectra (
Figure 5a,b).
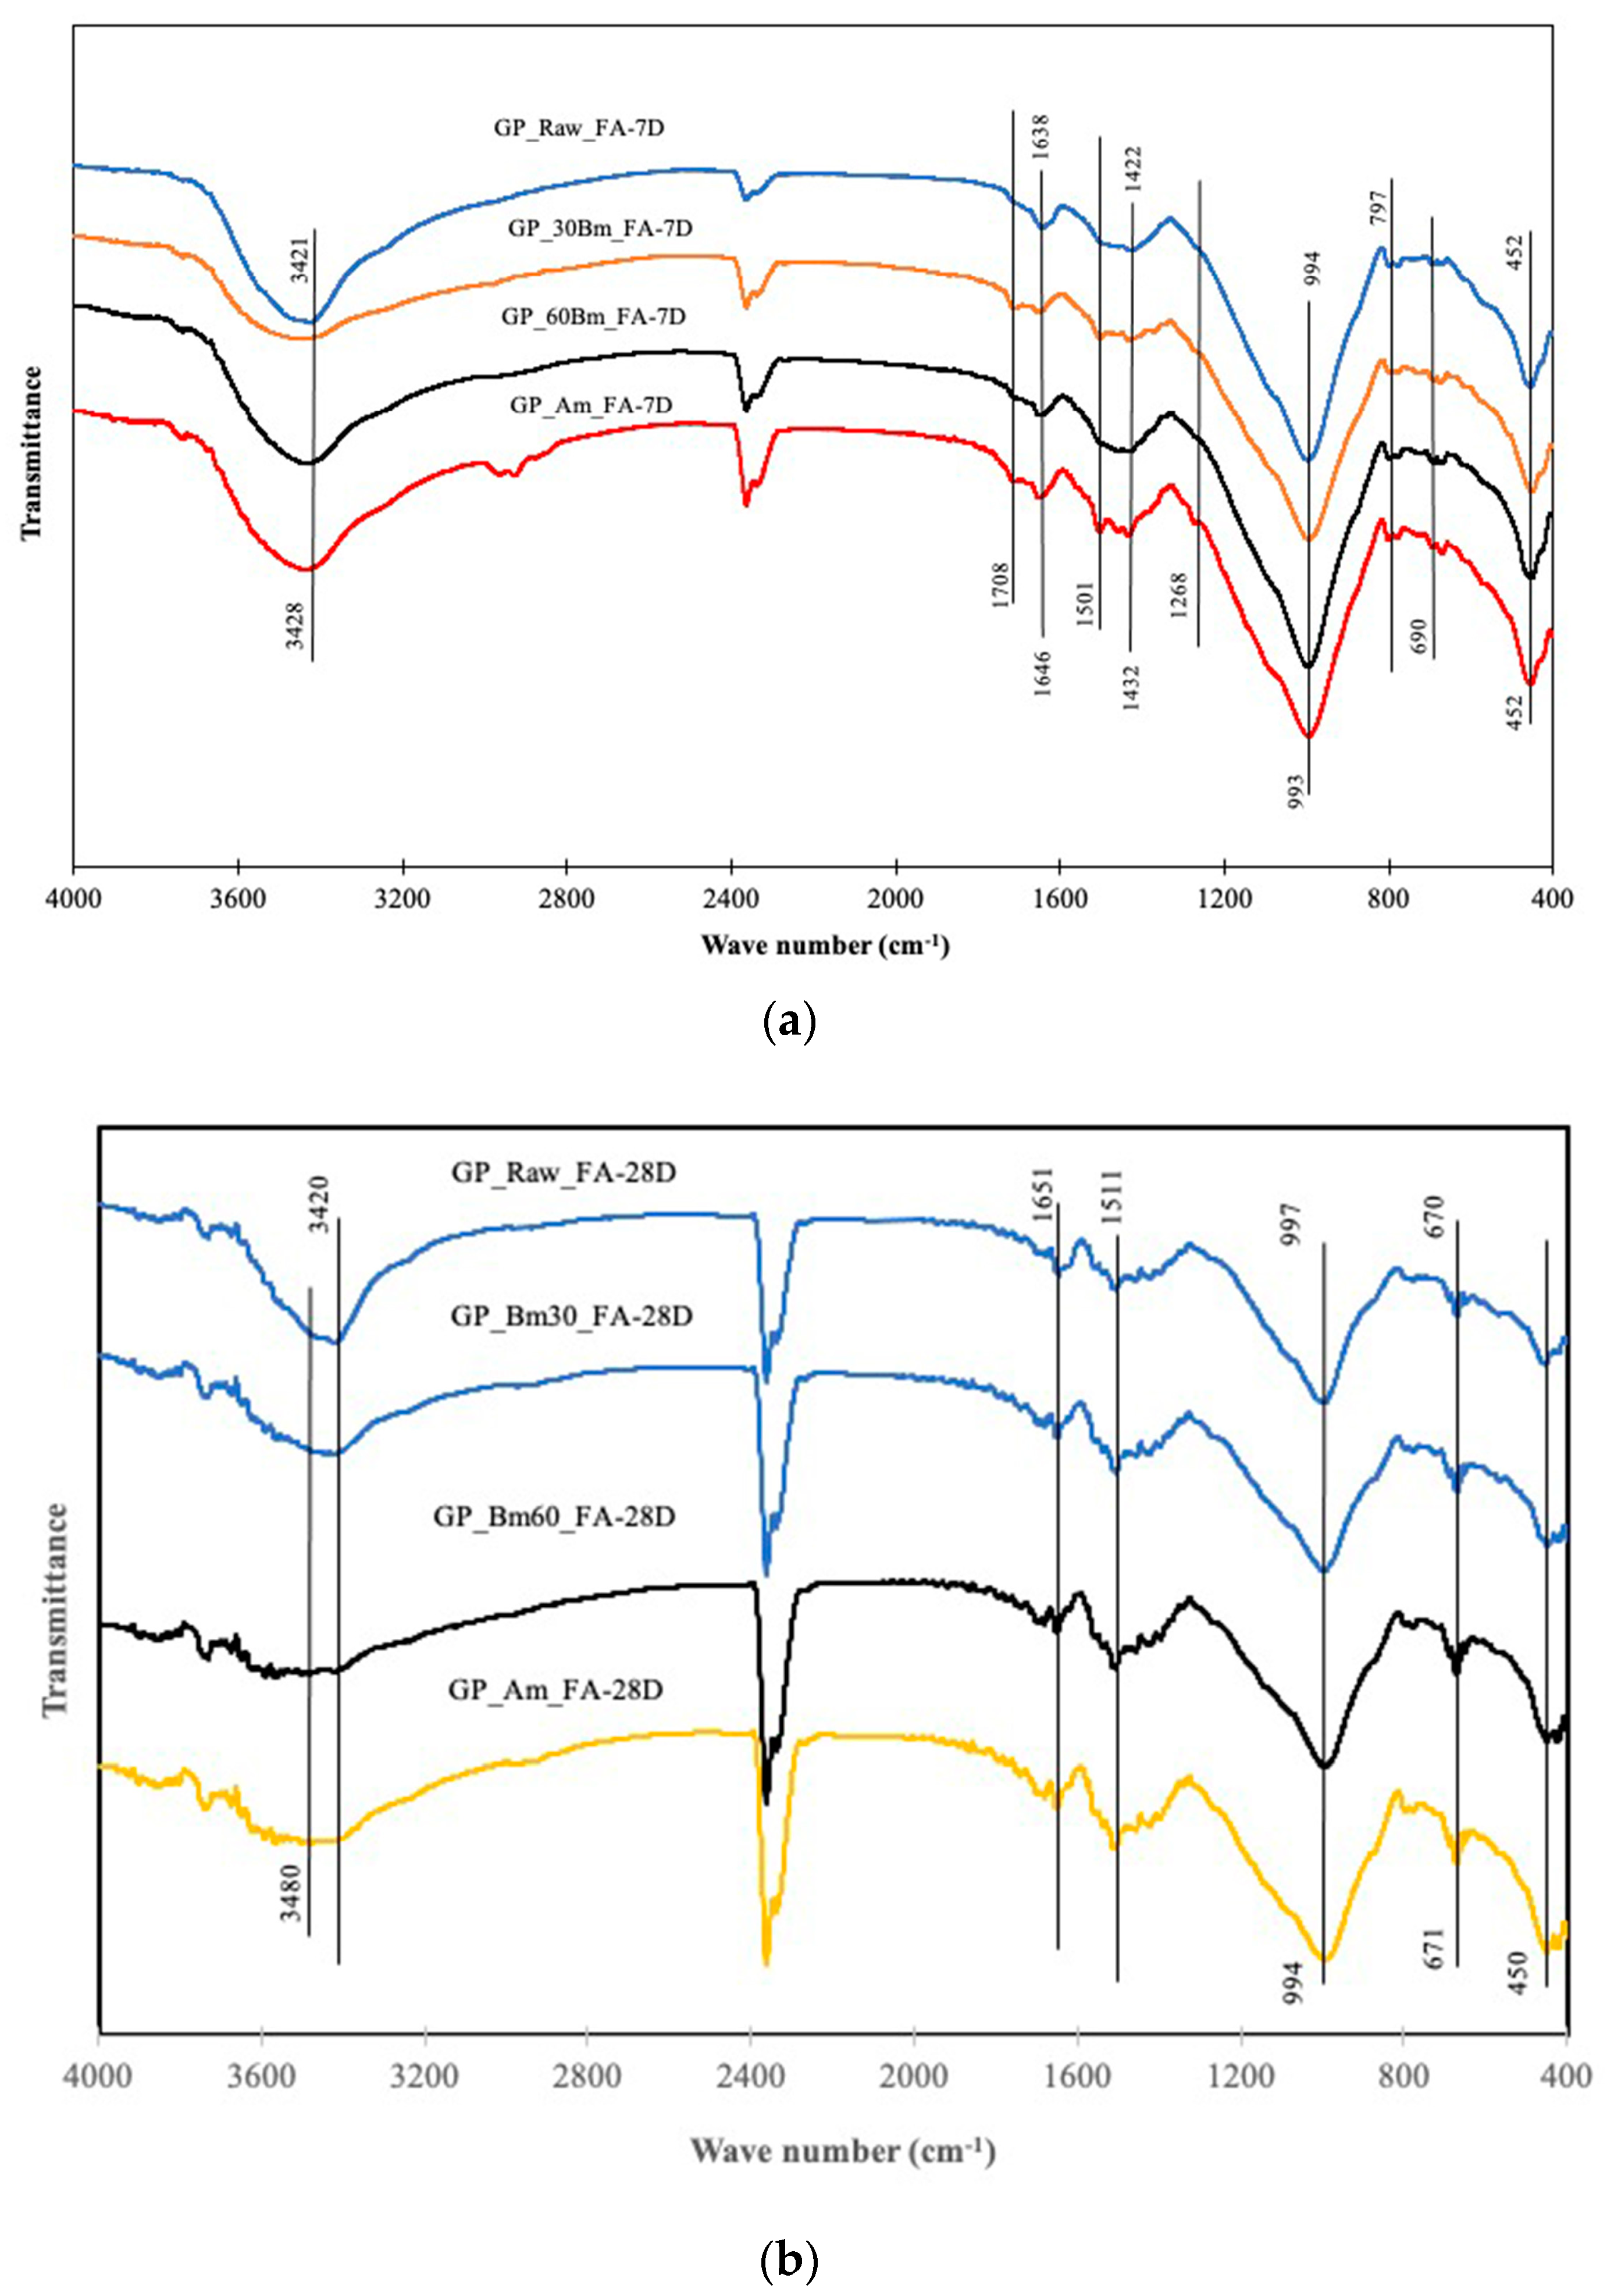
Figure 5a,b show the FTIR spectra of the geopolymer pastes cured for 7 and 28 days. The FTIR spectra contain absorption bands of similar shape and position, which differ significantly from the spectra of the raw and milled fly ash samples (
Figure 2). The peak maxima of the main absorption bands of the geopolymer samples are at about 993–998 cm
−1 and 450–452 cm
−1 and are lower than those of the fly ash samples by about 100 and 15 cm
−1, respectively. There are only slight deviations between the geopolymer samples cured for 7 and 28 days, taking into account the possibility of experimental uncertainties introduced by atmospheric conditions for referencing and sampling (e.g., the effect of the atmospheric CO
2 contribution at 2400 cm
−1). However, it is clear that the absorption peaks in the range of 1400–1520 cm
−1 are due to (CO
3)
2− formed on exposure of the NaOH solution to atmospheric CO
2. Moreover, the absorption bands at about 3420 and 3480 cm
−1 and those at 1650 cm
−1 (in the 28-day sample) and 1638, 1646, and 1708 cm
−1 (in the 7-day sample) are related to the stretching and bending vibrations of the H
2O molecules, respectively. These H
2O molecules are formed by the polycondensation reactions and become enclosed in the geopolymer network. The concentration of these species is much larger in comparison with the surface-adsorbed H
2O species, as seen in the sample ball-milled for 60 min (
Figure 2).
Zhang et al. [
21] classified the vibrational bands in the IR spectra into active and inactive bands and suggested that the effect of the dissolution of the Al and Si atoms that participate in the geopolymerization reaction could be seen more easily in the active bands.
The active bands are defined as those bands enveloped in the density of states of the asymmetric vibrations of the [SiO
4] units. The incorporation of sialate units (Si-O-Al) into siloxo units (Si-O-Si) or cross-linking of the various units in the geopolymerization process is detected in the shift of the density of states peak maximum (DOSPM), which is characterized by the position of the asymmetrical stretching vibration of the maximum of the peak [
22]. As an analogy to the shift in the DOSPM observed in aluminosilicate glasses related to the Si/Al ratio and the effect on the DOSPM of geopolymers with and without the addition of Ca cations, an earlier study [
22] is also appropriate. In the present study, an interesting observation is that activation with the NaOH solution produces a DOSPM at about 994–997 cm
−1 in all cases, compared with the DOSPM at about 1096–1099 cm
−1 in raw fly ash and milled samples (
Figure 2). The DOSPM of about 994–997 closely agrees with the DOSPM of CSH-type phases [
22]. Since, as shown above, the reaction occurs in the amorphous phase, this indicates that the amorphous CSH is also produced by activation of the fly ash by the NaOH solution. Therefore, the FTIR results suggest that the gel formation mechanism in the fly ash is related to the formation of amorphous aluminosilicate (geopolymer) and CSH (cement) types of products. However, the present experimental observations do not allow the geopolymer and CSH-type products within the binder phase to be distinguished.
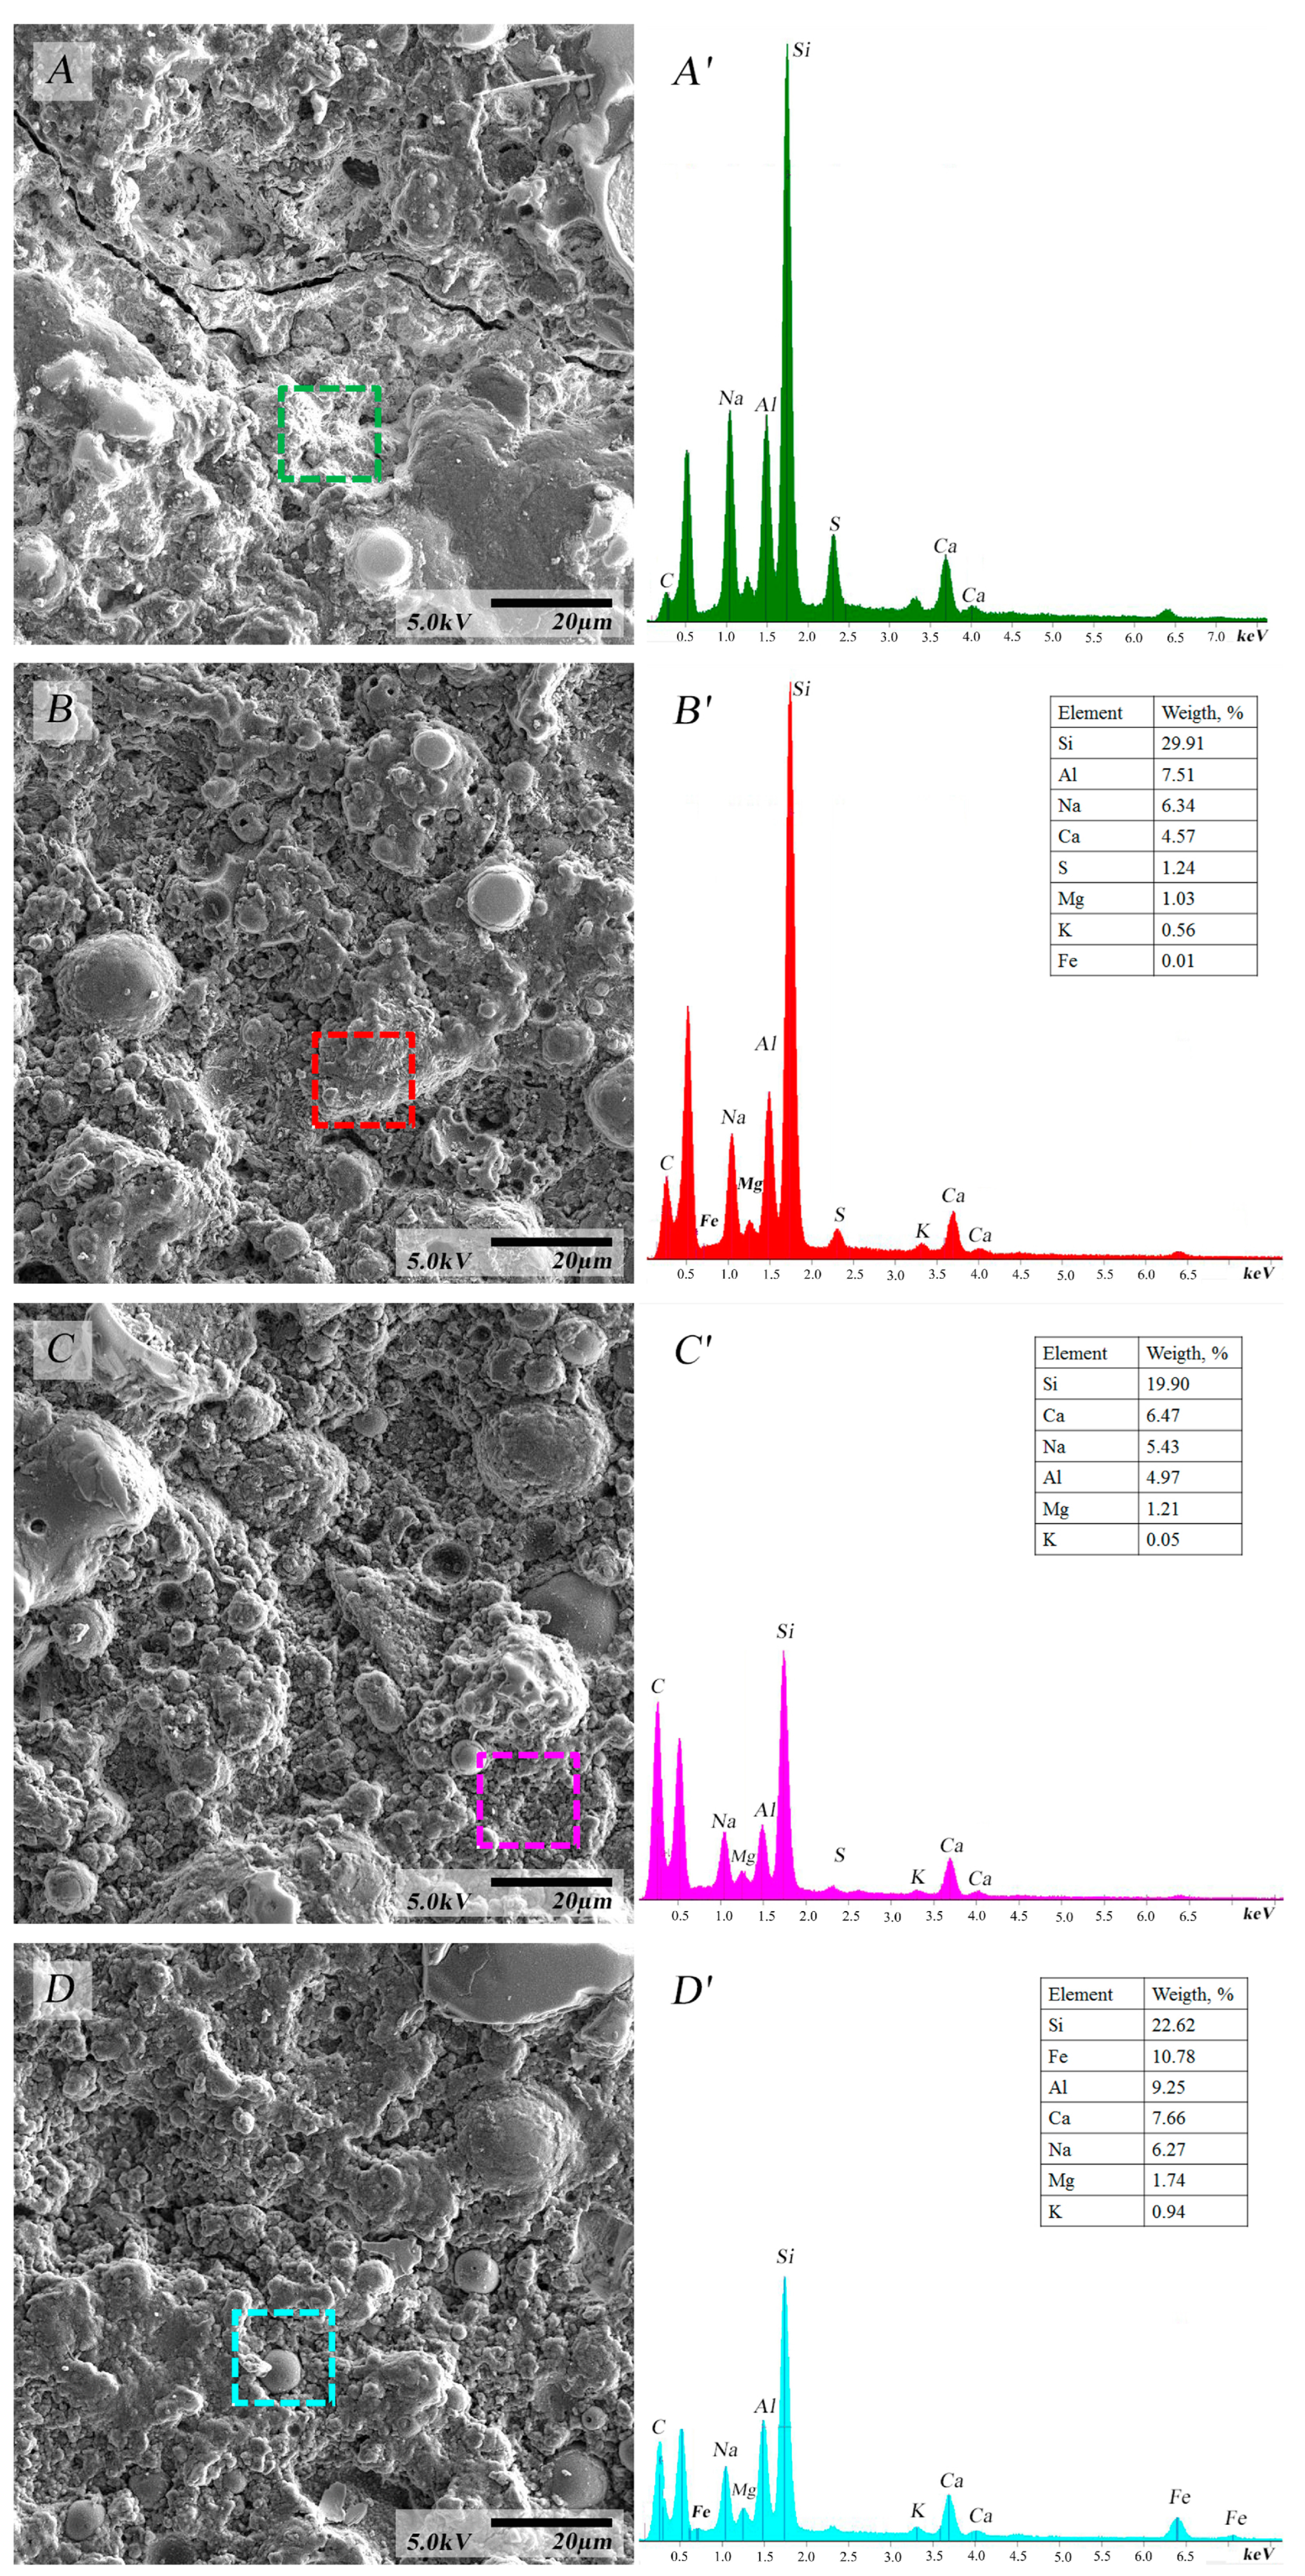
SEM micrographs and EDS spectra of the geopolymers based on the raw and milled fly ash are shown in
Figure 6,
Figure 7 and
Figure 8. The microstructures of the 7- and 28-day specimens kept at ambient temperature are essentially similar. The geopolymer samples consist of partly dissolved and non-dissolved spherical fly ash particles and a newly formed structure which we suggest results from the dissolution of the fly ash constituents. The newly formed structure contains Na, Al, Si, and Ca in a gel-type microstructure that covers the intact fly ash. The 7- and 28-day samples consist of a non-dense, porous microstructure containing some cracks. These results suggest that the dissolution of the fly ash forms a mixture of amorphous or semi-crystalline sodium aluminosilicate (NASH), calcium aluminosilicate (CASH), or calcium silicate hydrate (CSH) type phases. The SEM micrographs (
Figure 8) indicate that few changes occur in the samples after 7- and 28-day curing, and changes in the microstructure at longer curing times are negligible. This suggests that geopolymerization is slow and continuous at the ambient temperature of the present experiments. Although the main microstructure change was expected to be crystallization within the amorphous gel, the formation of whiskers or crystals in the microstructure was not observed, even in the 28-day sample. The microstructure of the cured samples is in general agreement with the XRD patterns (
Figure 4) and FTIR measurements (
Figure 5). Since no crystalline structures were observed by XRD, this suggests that the newly formed structure is amorphous.
Interestingly, although most of the newly formed gel phase contains sulfur, no ettringite-type compounds were observed in the XRD patterns.
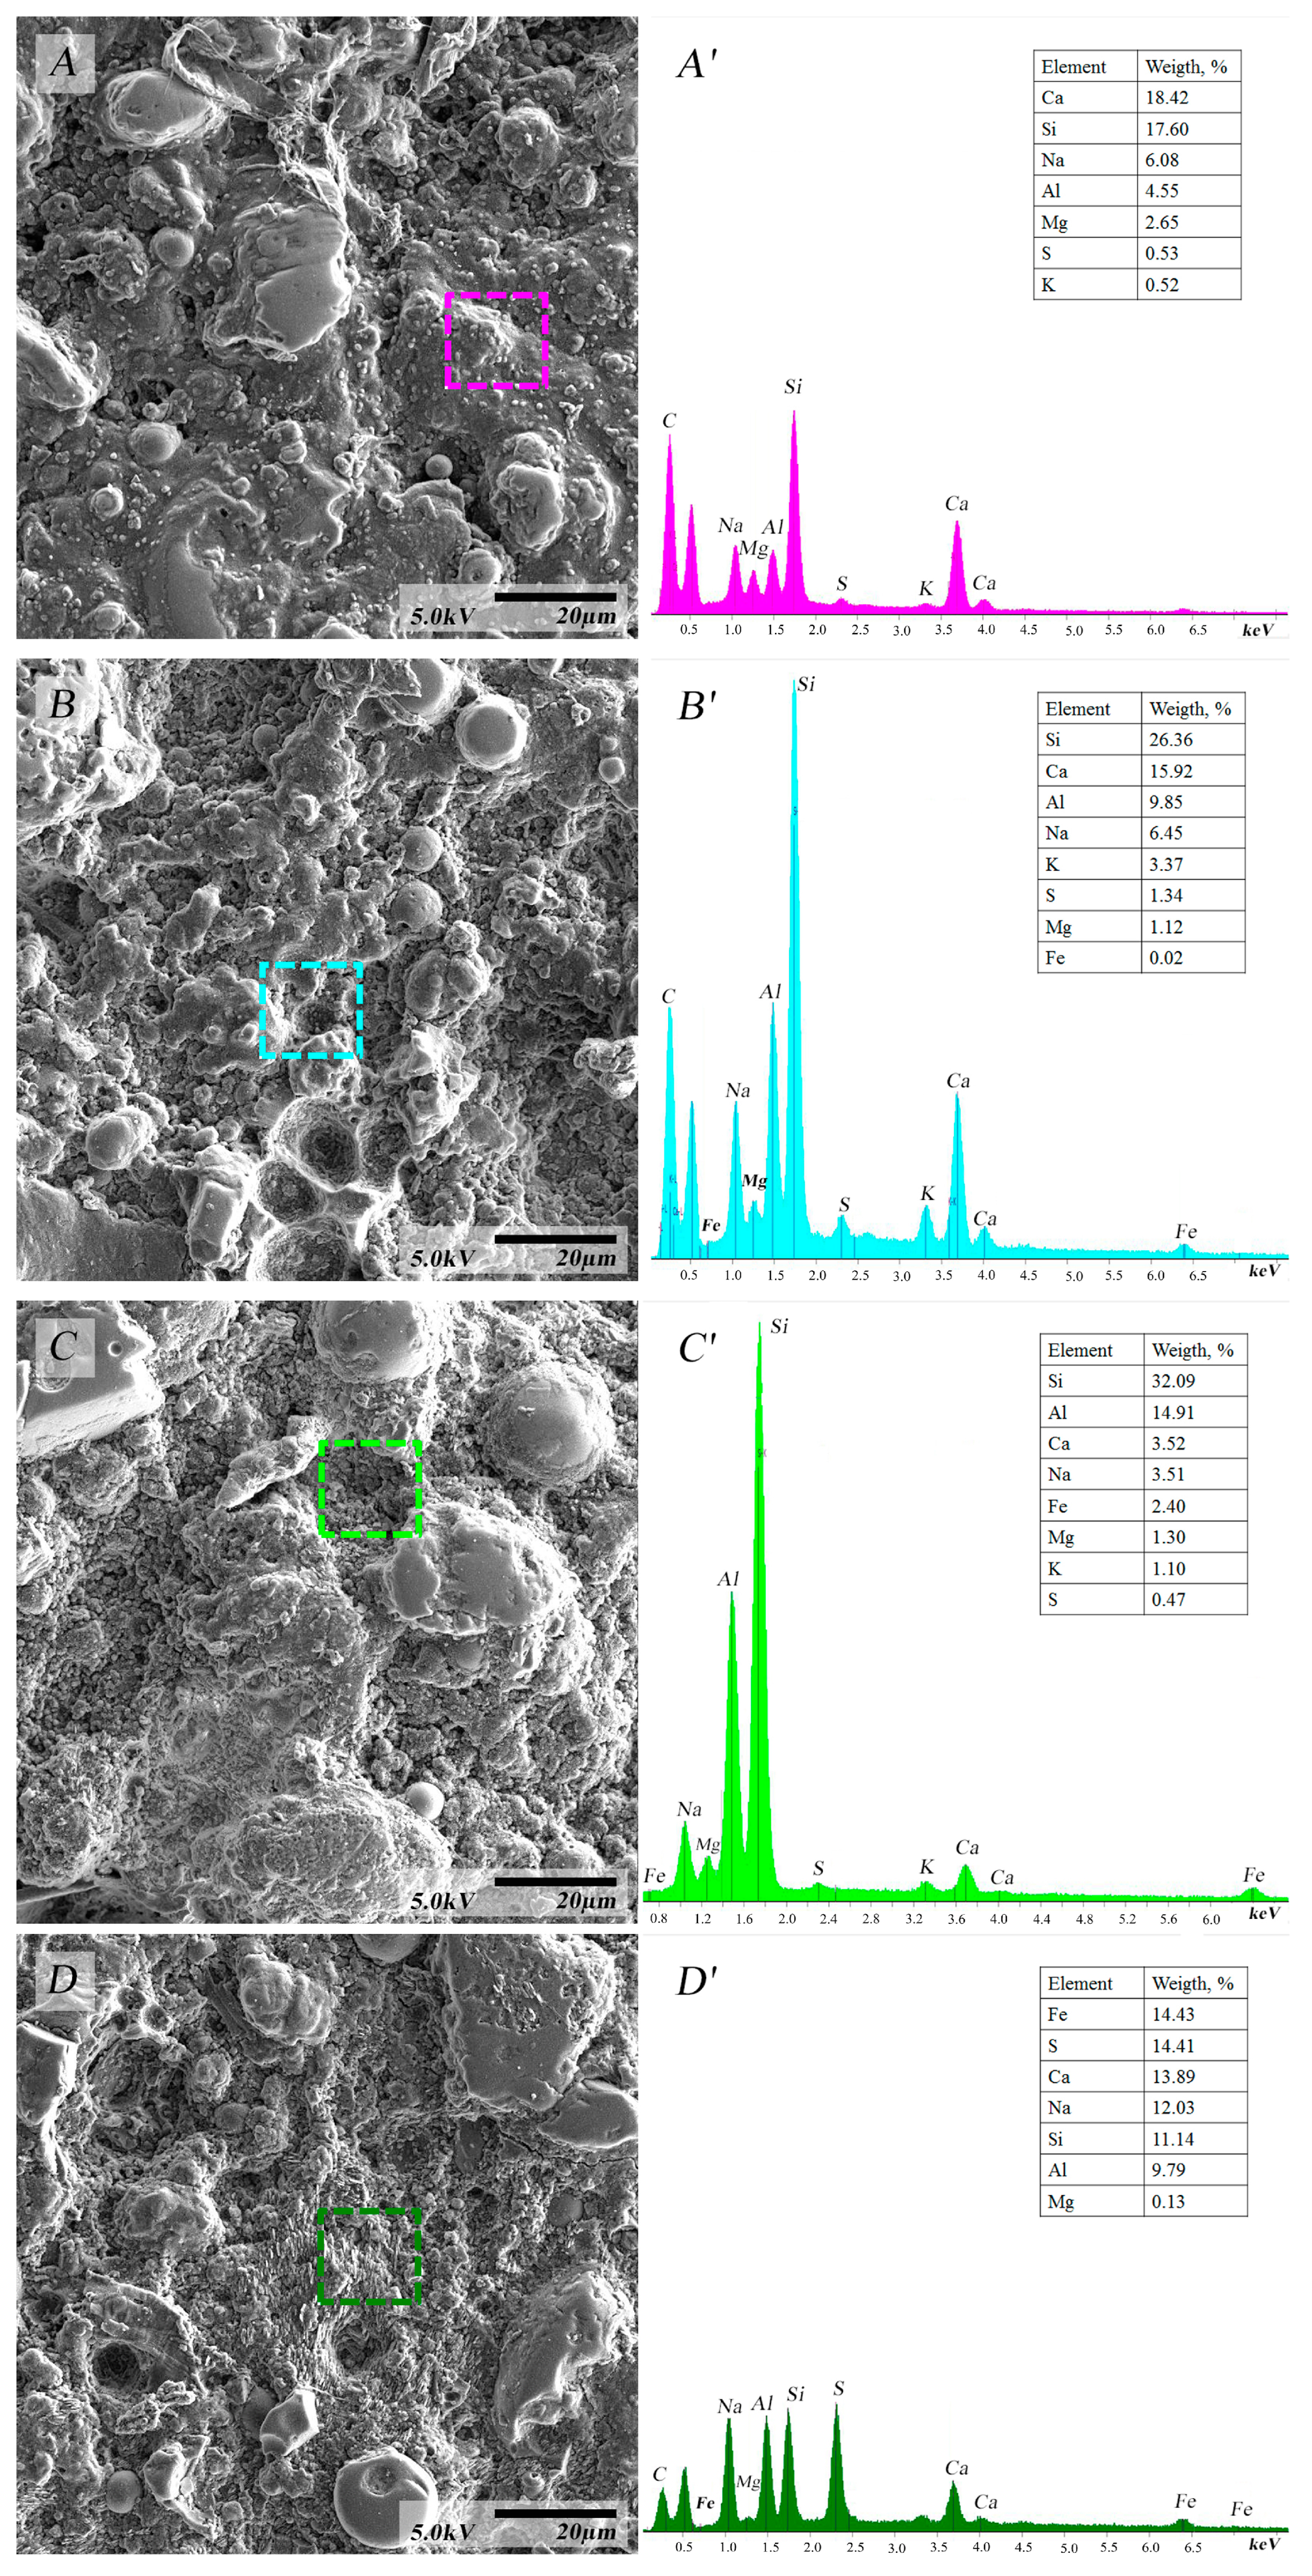
Some regions of the attrition-milled 28-day fly ash geopolymer showed the formation of a multi-component system containing various particles together with the crystalline and amorphous structures (
Figure 8).
In these samples, the fly ash particles are typical aluminosilicates with a partially dissolved surface layer (A3). Unburned carbon was also detected in the EDS spectrum (A1). An interesting feature of the attrition-milled fly ash geopolymer is the appearance of a geopolymeric product with a discrete gel-type structure (
Figure 7D,D’ and
Figure 8(A4)). Although these geopolymer products appear similar, they differ in chemical composition.
Figure 7D represents the typical geopolymer composition containing Al, Si, Ca, Na, and S atoms, whereas
Figure 7D’ contains Ca, Na, Si, and S atoms. The latter may represent a non-geopolymer product containing sodium silicate NS and calcium silicate hydrate CSH. The XRD, FTIR, and SEM-EDS analyses suggest the formation of amorphous geopolymer and calcium silicate phases, regardless of the milling conditions in all the fly-ash-based geopolymer samples, together with sodium silicate and calcium silicate in the attrition-milled fly-ash-based sample.
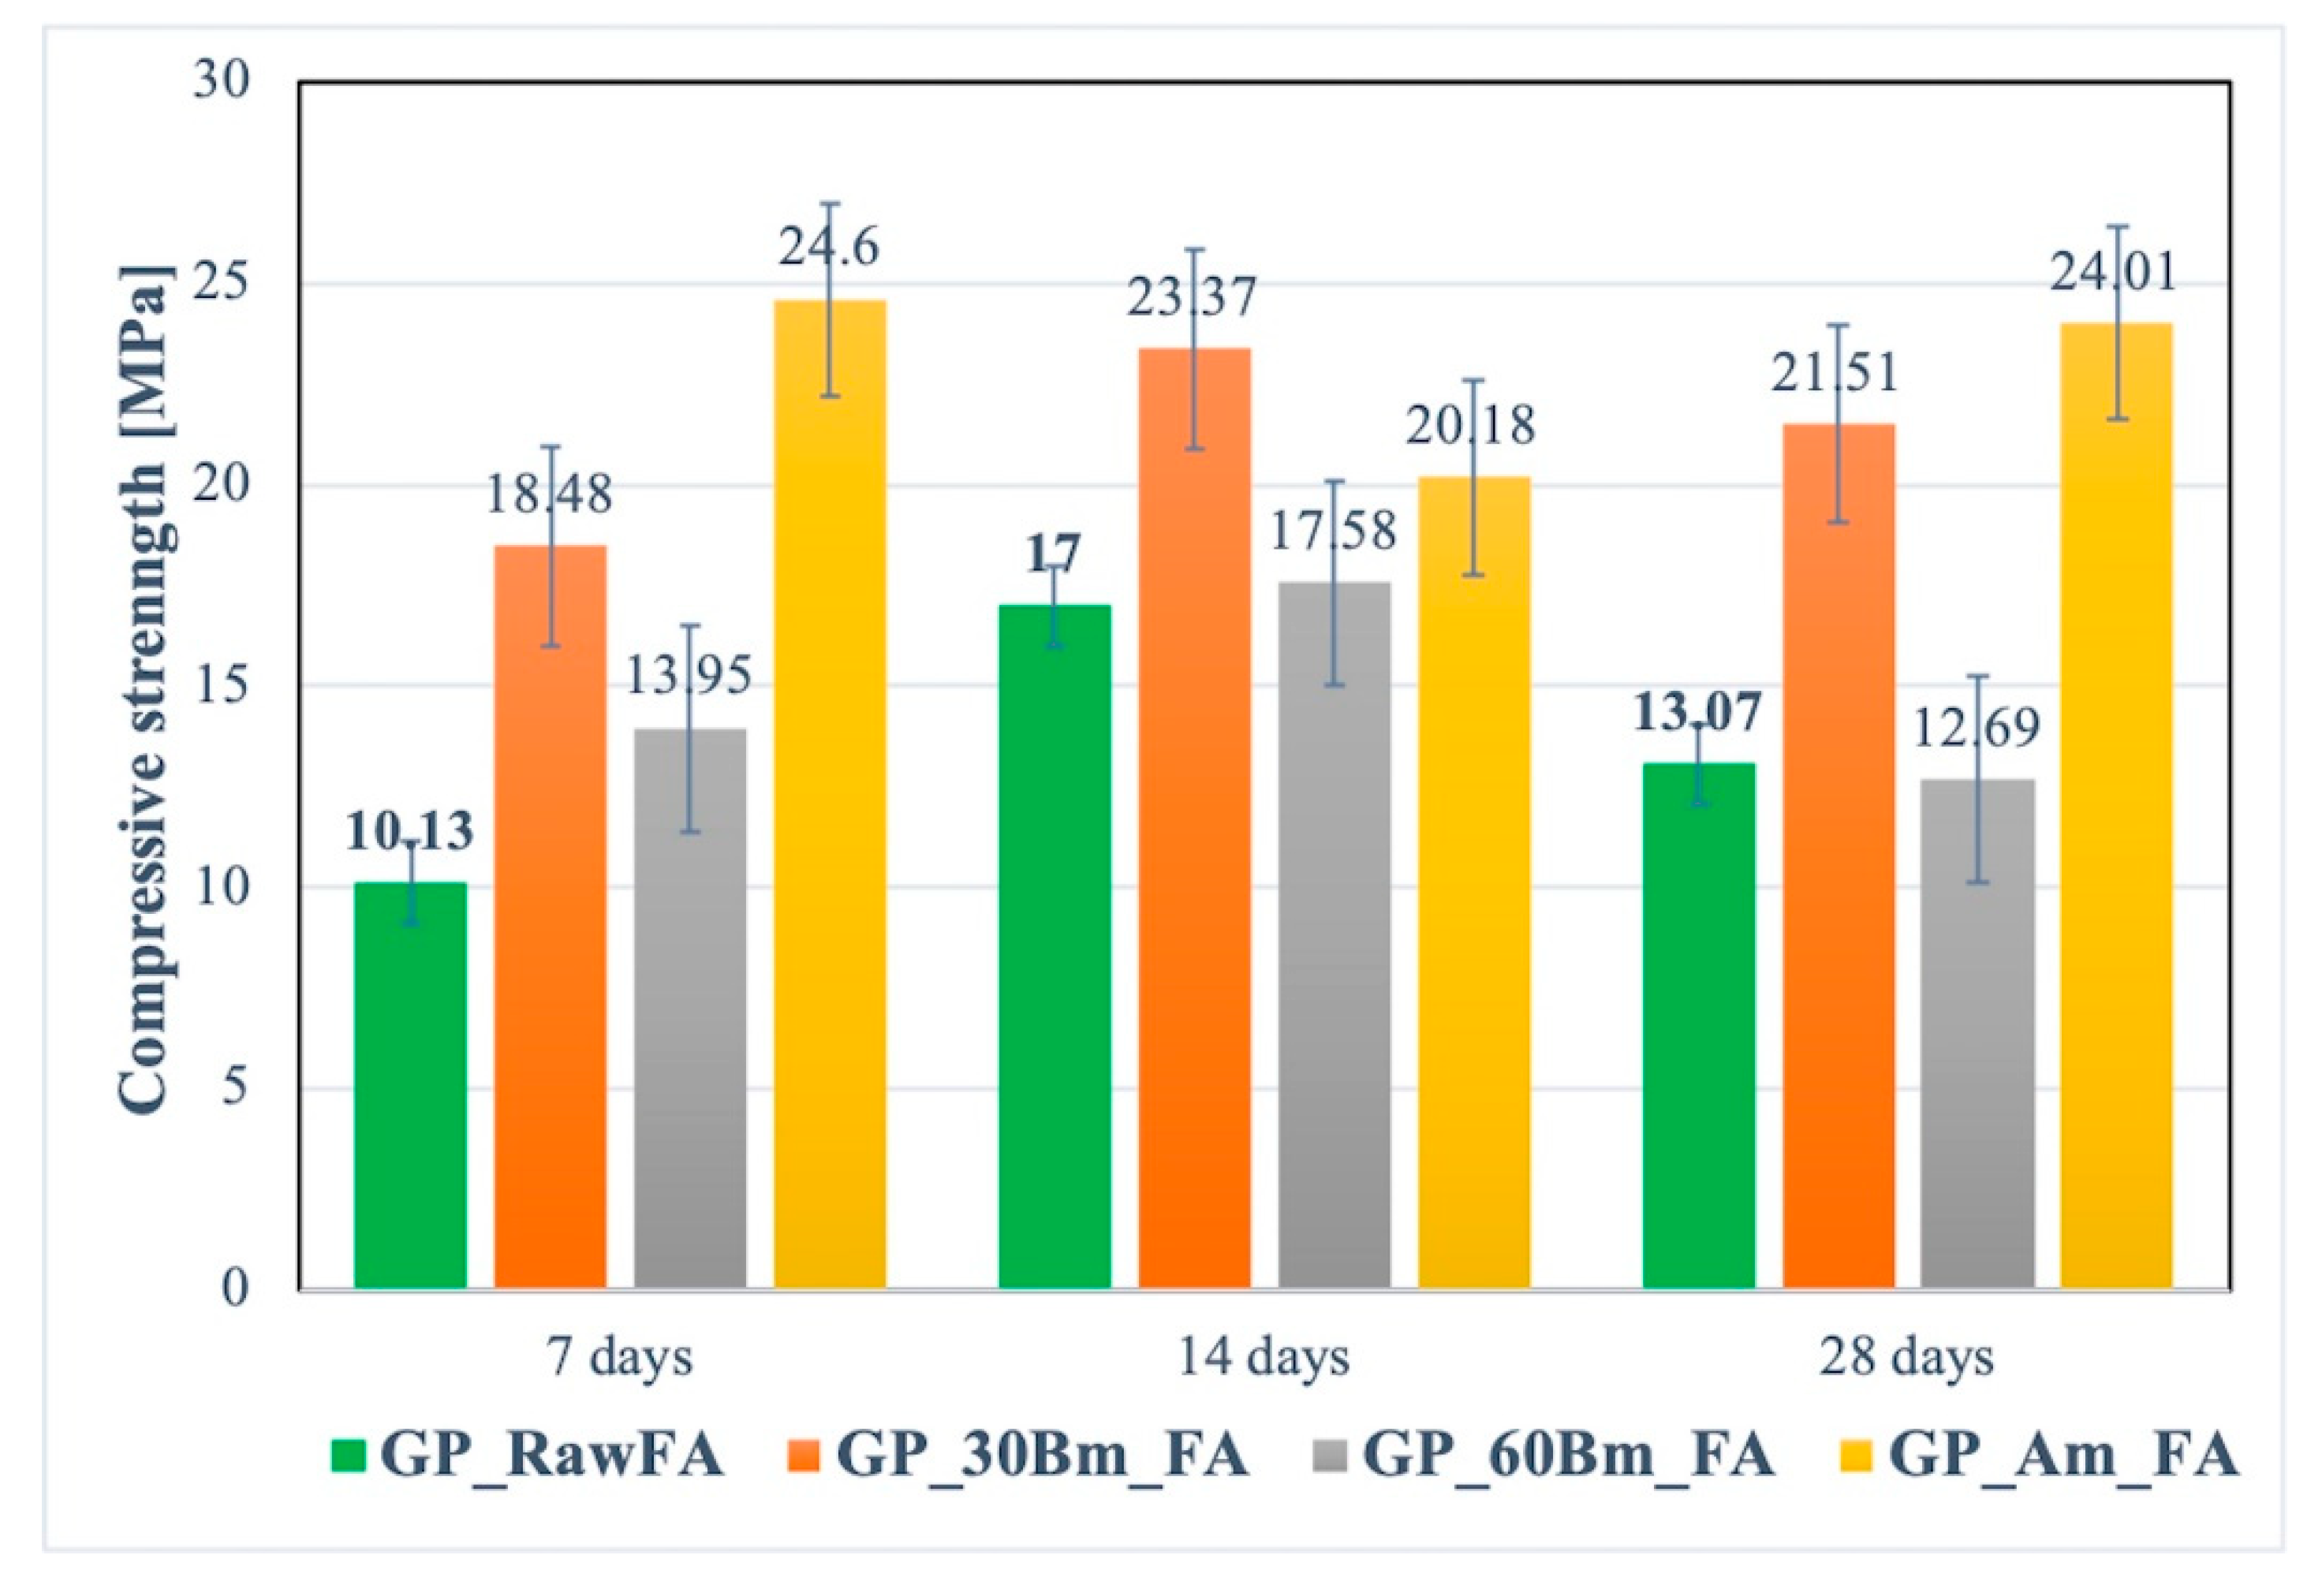
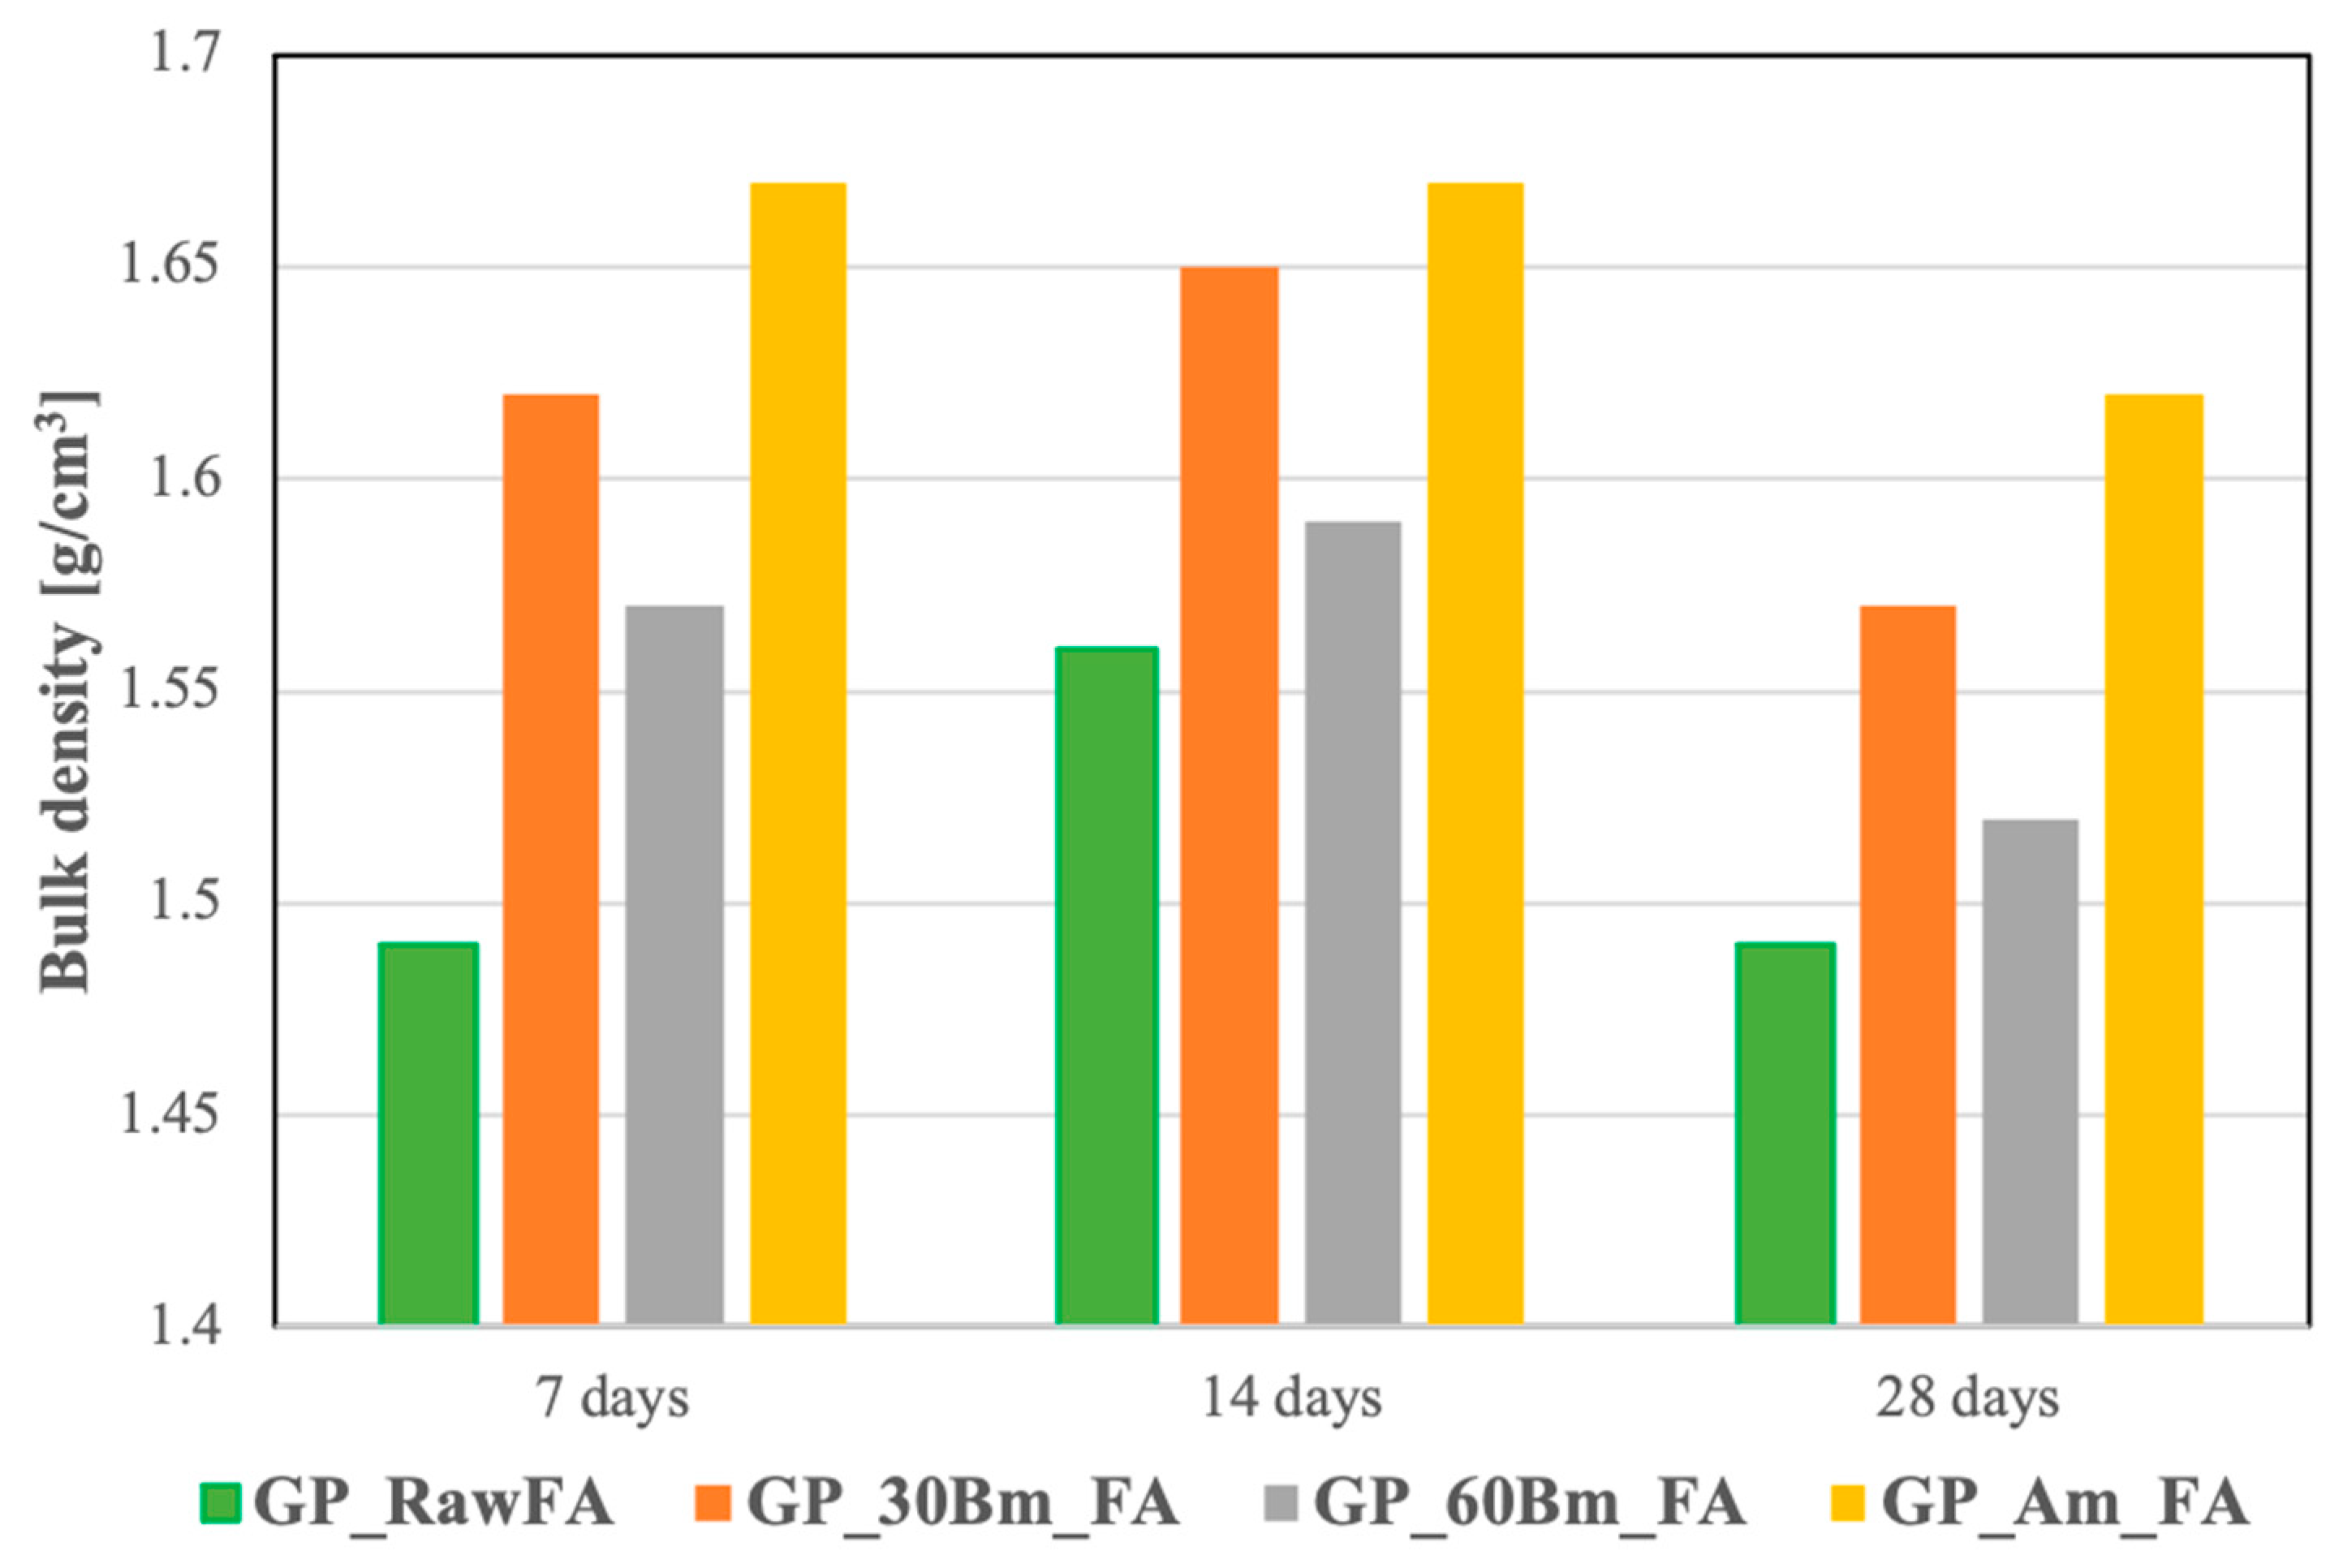
The results of the compressive strength (CS) and bulk density (BD) measurements of the geopolymers are shown as bar diagrams in
Figure 9 and
Figure 10, respectively. The highest CS value (
Figure 9) at all curing times except 14 days is found in the attrition-milled geopolymers, whereas the next highest CS value for the overall samples is found in the geopolymer sample formed from fly ash ball-milled for 30 min, although the values for these samples are in agreement within the limits of error of these measurements (
Figure 9). The attrition-milled samples show the highest values of bulk density at all curing times, followed by the samples ball-milled for 30 min (
Figure 10).
These results suggest that the different milling processes induce differences in the geopolymerization process, resulting in the formation of different networks or differing degrees of inhomogeneity in the network structure, with the greatest improvement in the mechanical properties secured by attrition milling.
Figure 9 and
Figure 10 show that in general the compressive strengths correlate with the bulk densities of the geopolymers. We also suggest that the principal influence on geopolymerization is the granulometry of the milled fly ash rather than the method of mechanical amorphization. Thus, it is likely that the solubility and dissolution reactions in the milled fly ashes depend on their mineralogical composition and granulometry. We also suggest that the milling process promotes the pozzolanic reaction responsible for the formation of the CSH gel phase, as usually occurs in mechanically activated fly-ash-containing binder systems [
23].
The attrition-milled fly ash exhibits a greater degree of dissolution than does the ball-milled fly ash. One possible explanation is related to the aspect of the preparation procedure, namely, curing at the relatively low temperature of 40 °C for 68 h. This low curing temperature was chosen to reduce the processing energy consumption. In our previous research, we used a curing temperature of 70 °C [
18,
20]. The geopolymerization process consists of the following steps: dissolution, monomer formation, polycondensation, and hardening. In this sequence, the dissolution of the amorphous aluminosilicate sources occurs from the surface and moves preferentially along weakened zones into the interior. For this reason, finer particles dissolve preferentially and at a faster rate at higher temperatures. In the present study, the curing temperature of 40 °C was not sufficiently high for complete geopolymerization, as was achieved at 70 °C. We suggest that this is the explanation for the relatively small change in the compressive strength of the samples cured for 7 and 28 days. Geopolymerization was essentially complete within 7 days in the milled fly ash pastes, and further increases in the curing time did not increase the reaction rate at 40 °C. Another possible explanation for the change in the compressive strength of the sample cured for 28 days is related to moisture loss from the samples maintained at ambient temperature after curing at 40 °C. It is possible that the moisture loss from the samples held for longer times at ambient temperatures after curing does not allow the geopolymerization reaction to proceed further.
The higher compressive strength of the attrition-milled fly ash geopolymers is consistent with the smaller particle size resulting from continuous milling. In our previous research [
18], we used batch attrition milling of the same fly ash for geopolymerization and compared it with the vibration-milled fly ashes. The 7-day compressive strengths of the raw, batch-attrition-milled, and vibration-milled fly ashes were 21.3 MPa, 60.56 MPa, and 49.53 MPa, respectively. These compressive strengths of the same raw and batch-milled fly ashes were 2–2.4 times higher than those obtained in the present research. The main reason for this discrepancy is probably related to the lower curing temperature of the present study. Kato et al. have reported similar results in which mechanochemical treatment of their fly ash was correlated with changes in its surface morphology and crystal structure and its behavior upon alkali activation [
24]. These authors suggested that the change in the particle morphology after short-term mechanical activation was the dominant effect upon alkali leaching, whereas amorphization was the dominant effect upon alkali leaching in fly ash milled for a longer time [
24]. The same behavior was also reported for the ball-milled and batch-attrition-milled fly-ash-based geopolymer pastes [
18]. In other words, regardless of the milling regime, attrition milling is more beneficial for fly ash activation than ball milling. Since various other studies have carried out the preparation of geopolymer pastes at different curing temperatures of fly ash activated by continuous dynamic and batch static attrition milling methods, a direct comparison of the properties of continuously milled and batch-milled fly ash geopolymers cannot be made. However, attrition-milled fly ash required higher curing temperatures to accelerate geopolymer formation. Although direct evidence is lacking, the mineralogical composition of the different fly ash fractions appears to exert a substantial influence on geopolymerization. Based on the fly ash fraction content, it may be speculated that the mineralogical composition of the milled fly ash within the <43 μm size range is the determining factor in the formation of the binder phase.

 ,
, 


