Article

Post-Subduction Granite Magmatism and Gold-Sulfide Mineralization in the Abu Zawal (Fatira) Area, Eastern Desert, Egypt

1
School of Earth Science and Resource, Chang’an University, Xi’an 710054, China
2
Department of Geology, Faculty of Science, Al-Azhar University, Assiut Branch, Assiut 71524, Egypt
3
Geology Department, Faculty of Science, Benha University, Benha 13518, Egypt
4
Institute of Geosciences, University of Kiel, Ludewig-Meyn Str. 10, 24118 Kiel, Germany
5
Department of Geological Engineering, Faculty of Mines, Istanbul Technical University, Istanbul 34469, Turkey
*
Authors to whom correspondence should be addressed.
Minerals 2023, 13(4), 489; https://doi.org/10.3390/min13040489
Submission received: 22 February 2023 / Revised: 27 March 2023 / Accepted: 28 March 2023 / Published: 30 March 2023

Abstract

:
Gold-sulfide mineralization in the Abu Zawal (Fatira) mine area, North Eastern Desert of Egypt, is related to porphyritic felsite dikes and elongate silicification zones in granitic rocks. These felsite dikes and the host granitic rocks exhibit major and trace element geochemical features typical of calc-alkaline and metaluminous I-type granites, likely originated in a late-orogenic setting. Their geochemical characteristics along with their fractionated LREE relative to HREE patterns imply either formation in a subduction-related environment or generation from subduction-modified source materials. Partial melting of subduction-metasomatized lower crustal rocks during extension following the lithospheric thickening may account for the production of such fertile, high Sr/Y and La/Yb magmas. In the Abu Zawal (Fatira) area, NE-trending altered felsite dikes, hydrothermal breccias, quartz enclaves, and wall-rock replacements are characterized by disseminations of chalcopyrite, pyrite, and rare gold. Alteration mineralogy, dominated by sericite, drusy quartz, kaolinite, calcite, and specular hematite, combined with the available fluid inclusion data suggests moderate to low temperature and near neutral pH conditions. The geochemical data of the altered wallrocks and mass balance calculations indicate significant mass losses in the altered rocks consistent with fluid/wallrock ratios higher than unity and near neutral pH conditions. Considering that the silica-rich host rocks, hydrothermal alteration, and sulfide-bearing hydrothermal quartz breccia in Fatira mine area were intuitively related to sulfur-saturated, oxidized felsic magmatism and associated hydrothermal systems, they are most likely linked to the post-subduction felsite porphyries (post-Hammamat felsites ~ 607 Ma), or pertaining to the late phases of the subaerial high-K calc-alkaline volcanics (Dokhan Volcanics ≤ 620 Ma).

1. Introduction

Most of the porphyry Cu ± Mo ± Au, as well as some epithermal Au deposits that originated during subduction, are genetically linked to magmatic and hydrothermal processes, where calc-alkaline arc magmatism is predominant [1,2]. Following the cessation of active subduction, the metasomatized Sub Continental Lithospheric Mantle (SCLM) may undergo localized partial melting [3,4]. Small-volume, hydrous, moderately alkaline (shoshonitic, hawaiitic), and sulfur-poor magmas are produced by post-subduction lithospheric thickening and extension and/or mantle lithosphere delamination processes [1]. Because these magmas are generated by remelting the metasomatized roots of pre-existent arc magmatic systems, they inherit their metal endowment and arc geochemical signature. Moreover, during the ascent through the lithosphere, they might assimilate various amounts of crustal materials—which include trace amounts of chalcophile and siderophile element-rich sulfides (as Cu, Ni, Au, and PGE)—differentiate and locally accumulate at a variety of depths [1,5]. When these magmas cool and crystallize at upper crustal levels, these metals are partitioned into magmatic-hydrothermal fluids as bisulfide, chloride, and hydroxyl complexes and subsequently exsolved [6]. As metallic-rich fluids concentrate in specific rock volumes and become supersaturated, hydrothermal minerals precipitate, leading to the formation of magmatic-hydrothermal ore deposits [1,6]. These deposits, generated via post-subduction magmas at the second-stage arc system, resemble arc-related porphyry and epithermal deposits but they are often more concentrated in gold and have lower sulfidation levels than deposits formed at the first-stage arc system [1].
The production and mining activities of gold deposits in the Eastern Desert of Egypt date back to ancient Egyptian times [7] and were mostly confined to gold-bearing quartz vein occurrences in the Precambrian basement complex (Figure 1). Based on the tectonic-magmatic evolution of the Nubian shield, Botros [8] grouped the gold deposits and occurrences in the Eastern Desert into: (1) stratabound deposits hosted in Algoma-type Banded Iron Formation (BIF) (e.g., Abu Marawat and Um Nar areas), tuffaceous sediments, and volcanogenic massive sulfide (VMS) ores (e.g., Um Samuki, Helgit, Maakal, Darhib, Abu Gurdi, Egat and El Atshan areas); (2) non-stratabound vein-type and disseminated mineralization in hydrothermally altered island arc and ophiolitic rocks (e.g., Atud, Dungash, Haimur, Sukkari, Um Garaiart, Um Rus areas); and (3) placer deposits mostly associated with the other two types. The majority of the gold deposits in Egypt are orogenic gold systems, which are structurally controlled [9,10]. Other gold systems include porphyry systems, Fe-oxide-Cu-Au (IOCG) systems, volcanic massive sulfide (VMS), and intrusion-related systems (IRGS) [9,10].
The Abu Zawal (Fatira) gold mine is located in the northern part of the Egyptian Eastern Desert which belongs to the northernmost extension of the Arabian-Nubian Shield (ANS) (Figure 1 and Figure 2). According to Bakhit [11], the Abu Zawal (Fatira) area exhibits four distinct tectonic trends: the oldest is the E-W trend, followed by the NW-SE, the most prevalent is the NE-SW trend, and the youngest is the N-S. The NE-trending highly fractured felsite dikes in the study area served as the host rock for the gold mineralization. According to Dourgham et al. [12] and Abu-Alam et al. [13], metamorphic devolatilization processes buffered by Fe-bearing wall rocks caused remobilization of metals from iron oxides by hydrothermal fluids and then precipitate in pre-existing extensional faults from low-salinity metamorphic fluids mixed with magmatic/meteoric ones at shallow- to medium-crustal levels at a temperature between 250 and 350 °C [13]. Gold mineralization in the Fatira area, according to Abd El Monsef et al. [14], displays characteristics typical of structurally (shear zone) controlled orogenic gold deposits and intrusion-related gold systems. They postulated that the intrusion of granitic masses could release magmatic fluid, which was the initial source of mineralized fluids (intrusion-related type). The released magmatic heat from the batholiths was thought to be the main factor of the activation of the metamorphic process and evolution of the metal-rich metamorphic fluids (orogenic type) through the greenschist-amphibolite system. This activation of hydrothermal metamorphic circuits led to an increase in metal concentration [14].
Gold mineralization in the Abu Zawal (Fatira) mine area is linked to felsite dikes and associated hydrothermally altered wallrocks, as opposed to the majority of gold mineralization in Egypt, which is usually associated with quartz veins. Despite the numerous studies which have been done on the targeted area, the origin of gold mineralization and its relationship to these felsite dikes remain unclear. The present work entails geological, petrographic, geochemical, and ore mineralogy studies, along with the identification of the key characteristics of the host felsite dikes and mineralogical alterations associated with gold mineralization. Aside from assessing the REE characteristics of the various hydrothermally altered rocks, the newly acquired geochemical dataset is also used to assess the characteristics of the post-subduction magmatism (represented by post-subduction volcanoplutonic rocks) and its role in gold deposition in the Abu Zawal (Fatira) area.

2. Regional and Local Geology

2.1. The Geology of the Egyptian Nubian Shield

The Arabian-Nubian Shield (ANS) is one of the largest outcrops of Neoproterozoic juvenile rocks on Earth (950–450 Ma). Two main parts of the ANS are recorded: Nubian Shield in Egypt, Sudan, Eritrea, Ethiopia, and Somalia, and Arabian Shield in Jordan, Saudi Arabia, and Yemen (Figure 2) [15,16,17,18]. The ANS was developed during the collision between East and West Gondwana with the closure of the Mozambique Ocean (Pacific-sized Ocean) at the north part of the East African Orogen (EAO). The Pan-African orogeny occurred between 650 and 620 Ma [19] due to the final collision between West and East Gondwana, which led the supra-subduction zone (SSZ) ophiolitic rocks to be obducted over the West Gondwana continental margin [20,21]. When the subduction was active under the continent, the ophiolitic assemblages underwent overthrust along the thrust planes [22]. The melting and mixing zone developed generally above the recycled subducted oceanic lithosphere, forming some of the rock units in the ANS of the Egyptian Eastern Desert [23]. Large volume of mafic to felsic, K-rich Dokhan volcanics (610–560 Ma) and shallow-seated A-type granites (610–550 Ma) as well as post-Hammamat felsite porphyries (607 ± 2 Ma) [24] were formed during this post-collision stage referring to post-subduction magmatism [25,26,27].
Figure 2. Tectonic map of the ANS showing the locations and extents of terranes, sutures and post-accretionary structures [28,29,30].
Minerals 13 00489 g002

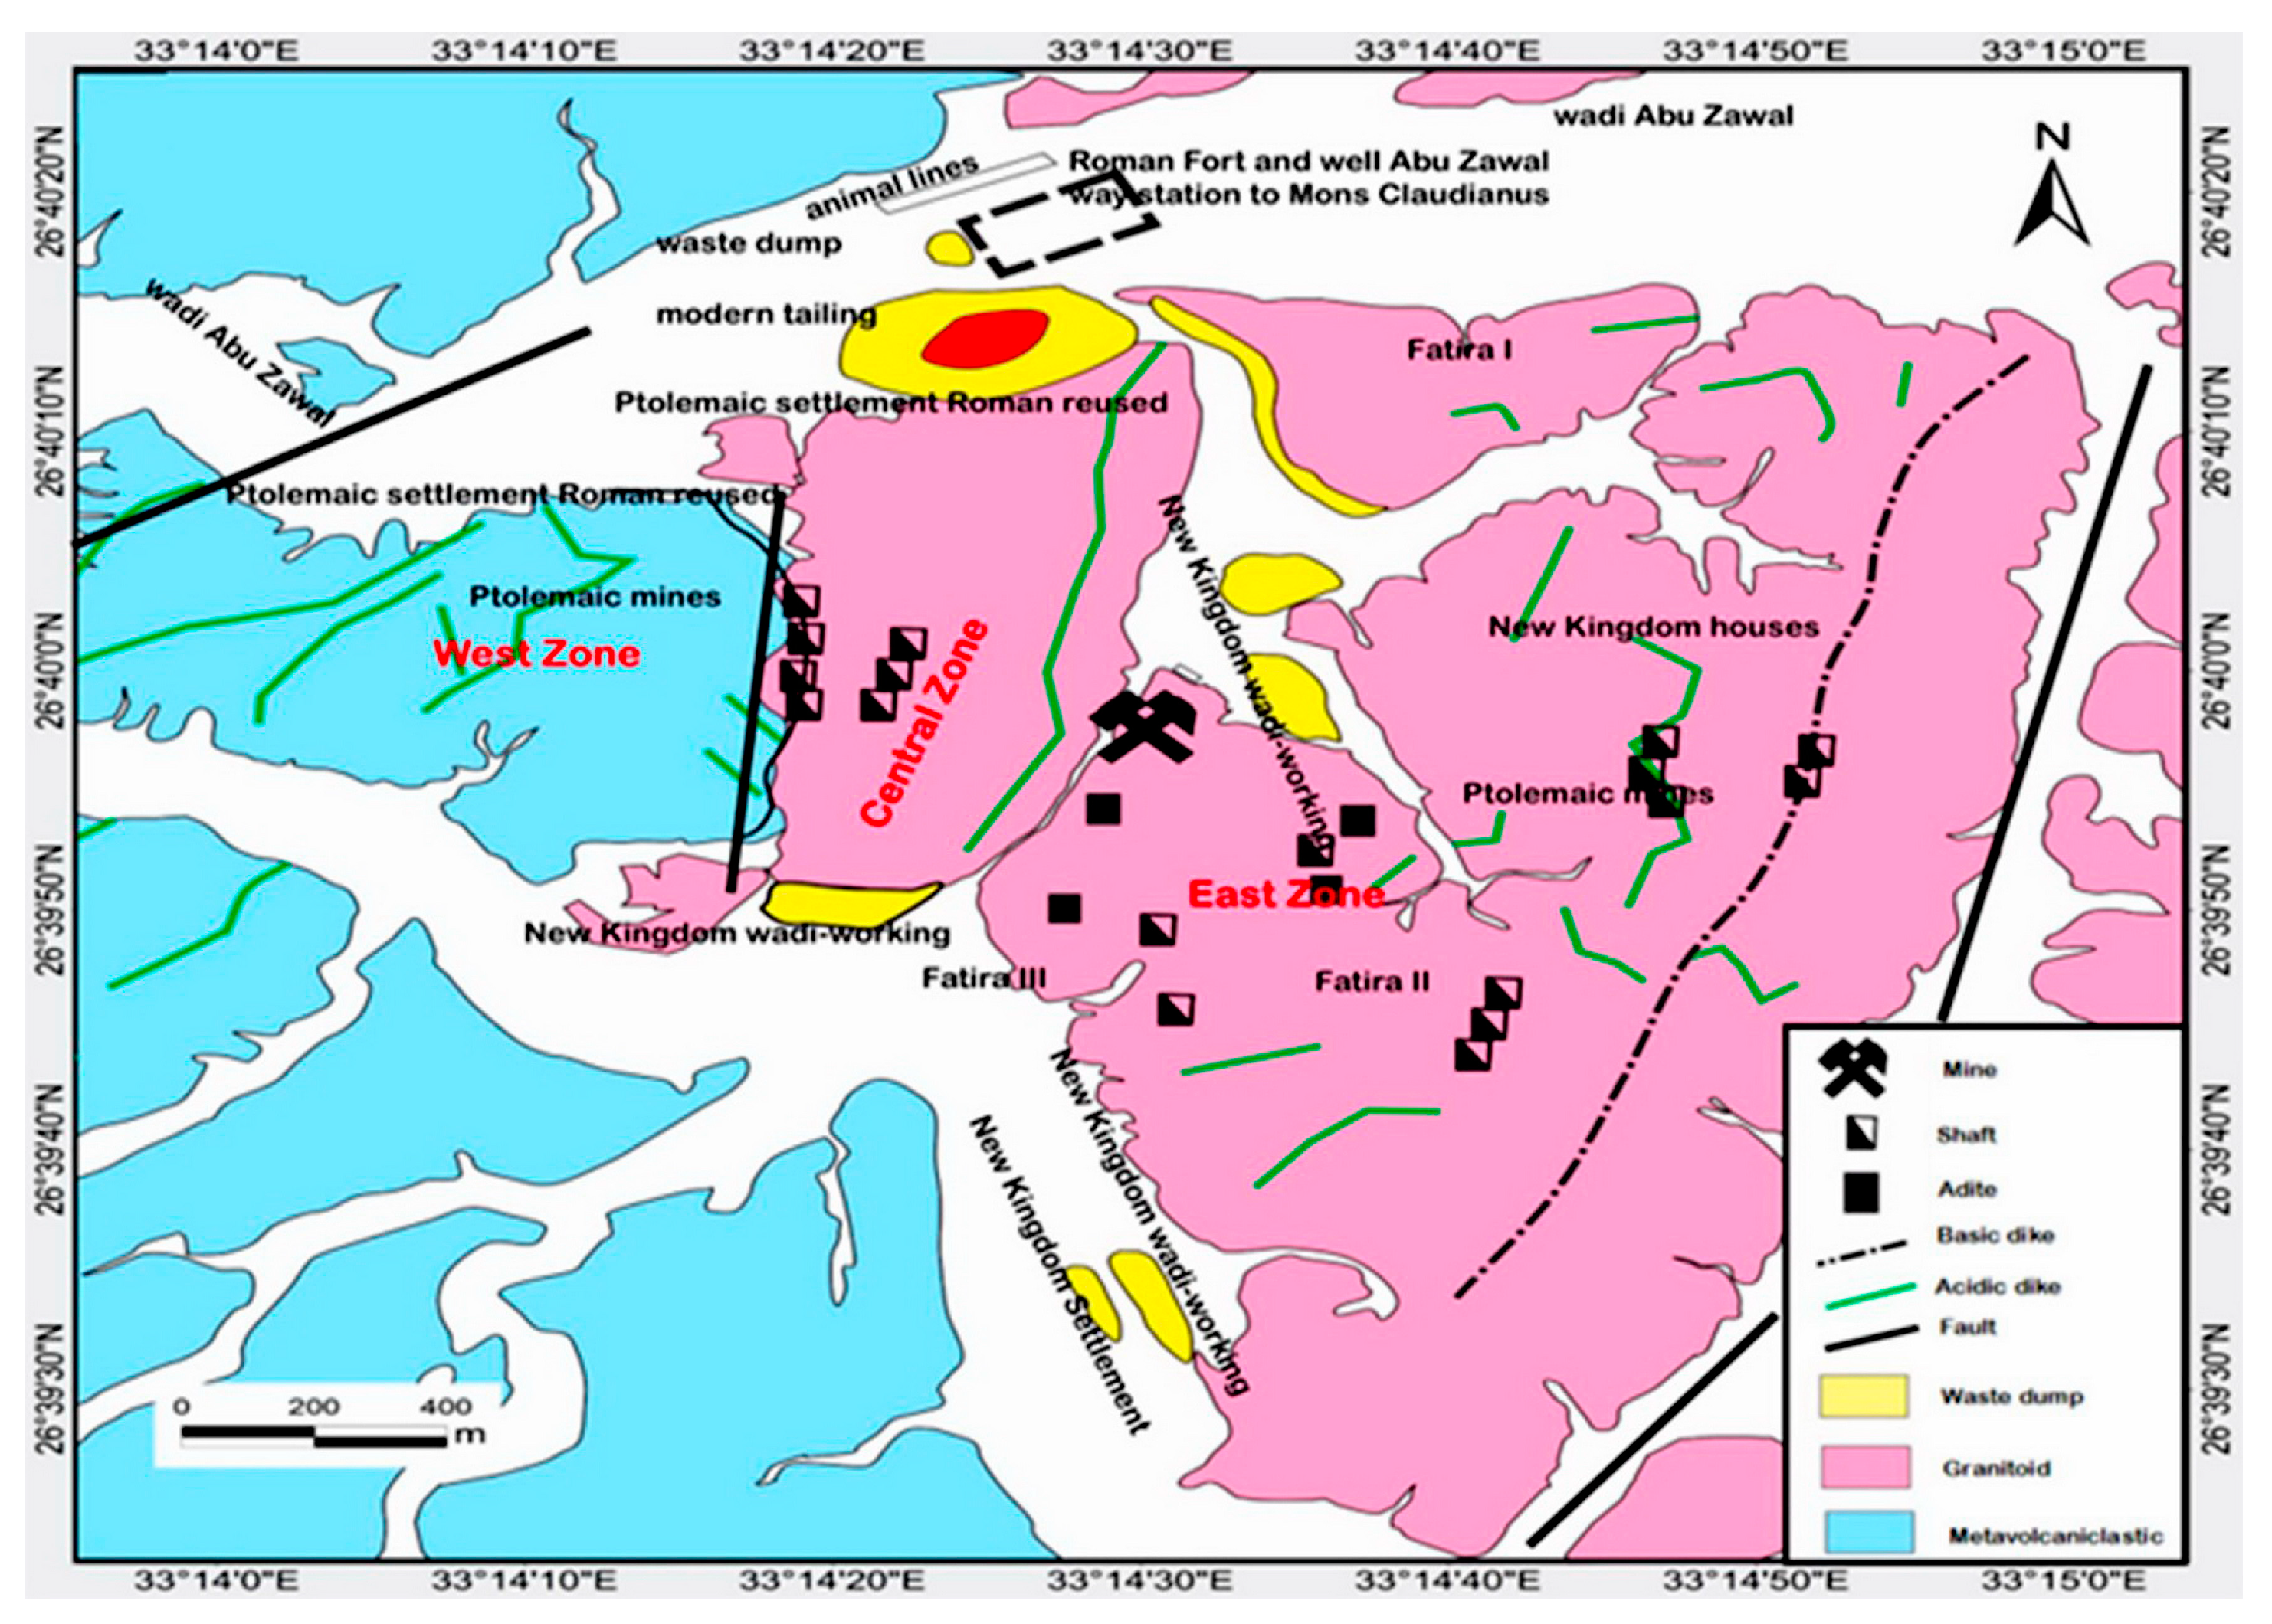
2.2. Local Geologic Setting of the Abu Zawal Area

The Abu Zawal (Fatira) gold mine area is located at the northern part of the Egyptian Eastern Desert at Lat. 26°39′46″ N. Long. 33°14′39″ E (Figure 3a). The local geology consists of island-arc metavolcanic and metavolcaniclastic rocks that were intruded by synorogenic granitoids and Dokhan Volcanics (Figure 3b). These were later intruded by late to post-orogenic granitoids. Acidic (felsite), intermediate, and basic dikes, which are the latest magmatic products in the area cutting across previous lithologies, are controlled by several faults and joints widespread in the study area (Figure 3).
The island-arc metavolcanic and metavolcaniclastic rocks are exposed at Wadi Abu Zawal, Wadi Fatira Elbida, Gabal Hadrabiya, and on the northwestern slope of Gabal Magl Elrashayda (Figure 3b and Figure 4a,b). They are dominated by rocks with acidic and intermediate affinities, such as metarhyolite and meta-andesite. The metarhyolite is composed of quartz and kaolinized microperthite porphyroblasts embedded in a fine-grained groundmass of kaolinized and sericitized feldspar (Figure 4c), while the meta-andesite is a coarse-grained rock composed of sericitized plagioclase and chlorite with a subordinate amount of biotite, quartz, kaolinite, epidote, carbonate, and iron oxides (Figure 4d). On the other hand, the metavolcaniclastic rocks are represented by felsic metatuffs and intermediate metatuffs. They locally enclosed thin layers of metamorphic banded iron formation (BIF) at Gabal Magl Elrashayda (Figure 4b). The felsic metatuffs are fine-grained laminated to massive rocks consisting mainly of quartz, kaolinized microperthite and plagioclase, biotite, and muscovite set in a micro-crystalline tuffaceous matrix of kaolinized feldspar, chlorite, and iron oxides (Figure 4e).
Synorogenic granitoid rock forms a N-S elongated body that is intruded by late- to post-granitoid rocks and dike swarms of various kinds and trends (Figure 3b). It is strongly jointed and fractured, with exfoliation and gneissose structure (Figure 4f), and contains xenoliths of metavolcanic rocks (Figure 4g). Microscopically, it is distinguished into granodiorite and tonalite. The granodiorite is mostly made of quartz (20–35 vol%), plagioclase (35–45 vol%; An14–28, oligoclase in composition), microperthite (10–15 vol%), and biotite (Figure 4h). Tonalite consists essentially of quartz (15–35 vol%) and plagioclase (35–60 vol%) (oligoclase in composition, An1827), with less microperthite (3–5 vol%), biotite, hornblende, and sericite (Figure 4i).
Dokhan Volcanic rocks are located in the northwestern part of the study area, represented by rhyolite porphyry forming NE-elongated bodies with reddish to massive pinkish color (Figure 3b and Figure 4a). The rhyolite porphyry represents the younger phase of Dokhan Volcanics related to anorogenic volcanic rocks [32,33,34]. It is composed of phenocrysts of kaolinized microperthite and quartz in a microcrystalline groundmass of quartz, plagioclase, biotite, kaolinized and sericitized feldspar, and iron oxides (Figure 4j).
Late- to post-orogenic granitoid rocks produce lenticular and elongated bodies in the Wadi Abu Zawal area, with exfoliation and cutting by joint and shearing (Figure 3b and Figure 4k). They are largely made up of monzogranite and syenogranite. Monzogranite is composed of quartz (20–35 vol%), microperthite (16–30 vol%), and kaolinized plagioclase (albite in composition An8–10, 25–35 vol%), as well as biotite, muscovite, titanite, and Fe-oxide (Figure 4l). Syenogranite is mostly quartz (25–30 vol%) and kaolinized microperthite (30–40 vol%), with a lower amount of altered plagioclase (albite in composition, 10–15 vol%), biotite, and sericite (Figure 4m). The study area is cut by different types of parallel and subparallel dike swarms of acidic, intermediate, and basic affinities (Figure 3b and Figure 4n–o). The acidic dikes are represented mainly by NE-trending felsite dikes, which are extensively present in the Abu Zawal gold mineralization, suggesting a significant role in the genesis of gold mineralization [13]. The felsite dike is a fine-grained porphyritic rock made mostly of quartz, orthoclase, microperthite, and albite, with subordinate muscovite and biotite in a groundmass of sericitized and kaolinized feldspar and iron oxides (Figure 4p). Faults and joints are oriented NE-SW, E-W, and NNE-SSW, with a small NW-SE and N-S (Figure 3b).

3. Gold Mineralization at Abu Zawal (Fatira) Area

The Abu Zawal (Fatira) gold mineralization is hosted by granodiorite cut by porphyritic dikes. The main ore body is a felsite porphyritic dike of 1–2 m in thickness cut by several fractures and joints. The gold mineralization is associated with limonite and copper hydroxides having at least 15–50 g/t [31]. Abu Zawal mine area includes three main old mining zones, eastern, central, and western, representing the high potential ore zones along the granodiorite and metavocaniclastics as well as their contacts, respectively (Figure 5) [31,35,36]. The eastern ore zone is subdivided by Murr [36] into Fatira I, Fatira II, and Fatira III (Figure 5). The ancient gold mining activities in the Abu Zawal area (Fatira mine) began in the period of the Pharaohs (new Kingdom, Ptolemaic, and Roman Periods) and have continued till the modern era [31] (Figure 5). Some ruins of settlements, wadi workings, grinding mills and stones, Roman forts and walls enclosing a well, small mines, multiple mine adits, and shafts are evidence of these old mining activities (Figure 5). The Egyptian Mining and Prospecting Company surveyed the area in 1957 and estimated that the Abu Zawal area’s high prospective ore reserves (approximately 70,000 tons) might produce 600–1200 kg of gold [31]. According to Abd El Nabi, et al. [37], the old working at Abu Zawal (Fatira) mine contains between 25,000 and 30,000 tons of ore from felsite dikes, as well as approximately 8000 tons of tailing.
The Abu Zawal gold mineralization is confined to the gently dipping shear joints, fractures, and fissures within the highly fractured, and mylonitized felsite dikes which have undergone hydrothermal alteration (Figure 6a). Moreover, some discontinuous quartz enclaves are locally encountered along the felsite dikes (Figure 6b). The highly fractured felsite dikes have been intensively affected by irregular hydrothermal alterations that extend beyond unit borders, overlapping several crosscutting lithologies of felsite dikes and granodiorite, indicating a secondary overprint, and are occasionally rich in malachite (Figure 6c). These altered dikes are commonly distinguished by pale gray, yellowish, dark red, or black to red-dish tint overprinting and stained by higher iron oxides and hydroxides (Figure 6a,b). Four major fracture trends were identified in the Abu Zawal area: E-W, N-S, NW-SE, and NE-SW, which cut through different rock units. The main ore fractures are primarily oriented NNE-SSW, dipping 50–70° SE, and intermittently NE-SW, dipping 40–70° NW and sometimes 10–20° W. They are 300 m long and 0.15 to 1.2 m wide at the central mine area.

4. Materials and Methods

110 representative surface samples of least altered host rocks and mineralized and non-mineralized altered rocks including 13 profiles were collected from the Abu Zawal gold area. Petrographic studies were performed on 54 thin and 35 polished sections. Twenty-one representative samples of the altered rocks were also analyzed for mineral composition using a D8 ADVANCE BRUKER X-ray diffractometer (XRD) (Östliche Rheinbrückenstraße 49, 76187 Karlsruhe, Germany) in the Geochemistry Research Laboratories of Istanbul Technical University (ITU/JAL, Turkey), having a theta: theta geometry with a copper-sealed tube X-ray source producing Cu Kα radiation at a wavelength of 1.5406 Å from a generator operating at 40 kV and 40 mA. The diffractometer has an X-ray energy operating range of 3–30 KeV and a detection limit of 1% by volume. XRD data were taken from 5 to 90° 2θ, and the obtained diffraction patterns were recognized and indexed using the X’Pert HighScore Plus v. 3.0 program for mineral identification and semi-quantitative estimation of mineral composition. Major, trace, and rare earth element (REE) of 42 samples of the whole-rocks and alteration were analyzed by a BRUKER S8 TIGER model X-ray fluorescence spectrometer (with a wavelength range from 0.01–12 nm) (Östliche Rheinbrückenstraße 49, 76187 Karlsruhe, Germany) and Inductively Coupled Plasma-Mass Spectrometry using an ELAN DRC-e Perkin Elmer model, trace in the ITU/JAL laboratories. The relative standard deviation (RSD%) in the analyses does not exceed 2%. A Tungsten Carbide milling device was used for grinding samples. The 50 mg of powdered sample was dissolved in two steps, first by adding 6 mL of 37% HCl, 2 mL of 65% HNO3, and 1 mL of 38–40% HF in a Teflon beaker using a Bergh off Microwave at 135 °C under controlled pressure and temperature, then by adding 6 mL of 5% boric acid solution. The geochemical results were processed by Igpet version 2.3 [38]. Moreover, GEOISO-Windows [39] was used to calculate the mass balance and determine the mobility of the absolute elements by using Gresens [40]’equations to obtain the isocon diagram according to Grant [41].
The chemistry of sulfide minerals was examined in a subset of mineralized samples (five polished sections) by wavelength-dispersive X-ray spectrometry at the Technical University of Clausthal in Germany, utalizing a Cameca SX100 four spectrometer and a fully automated electron microprobe. These sulfide minerals were examined using a 2 μm beam diameter with an accelerating voltage of 20 keV, a beam current of 40 nA, and counting times ranging from 10 s to 60 s. For calibration and quality control, sulfides, both natural and artificial, were utilized as certified reference materials. Using a Phi-Rho-Z (CITZAF; Armstrong [42]) scheme that was provided with the Cameca SX100 electron microprobe, the results were corrected for electron beam/matrix effects, experimental drift, and dead time. The relative accuracy of the analyses is within 1–2% for concentrations >1 wt.% and 5–10% for concentrations <1 wt.%, based on the comparison between measured and published compositions of standard reference materials.

5. Results

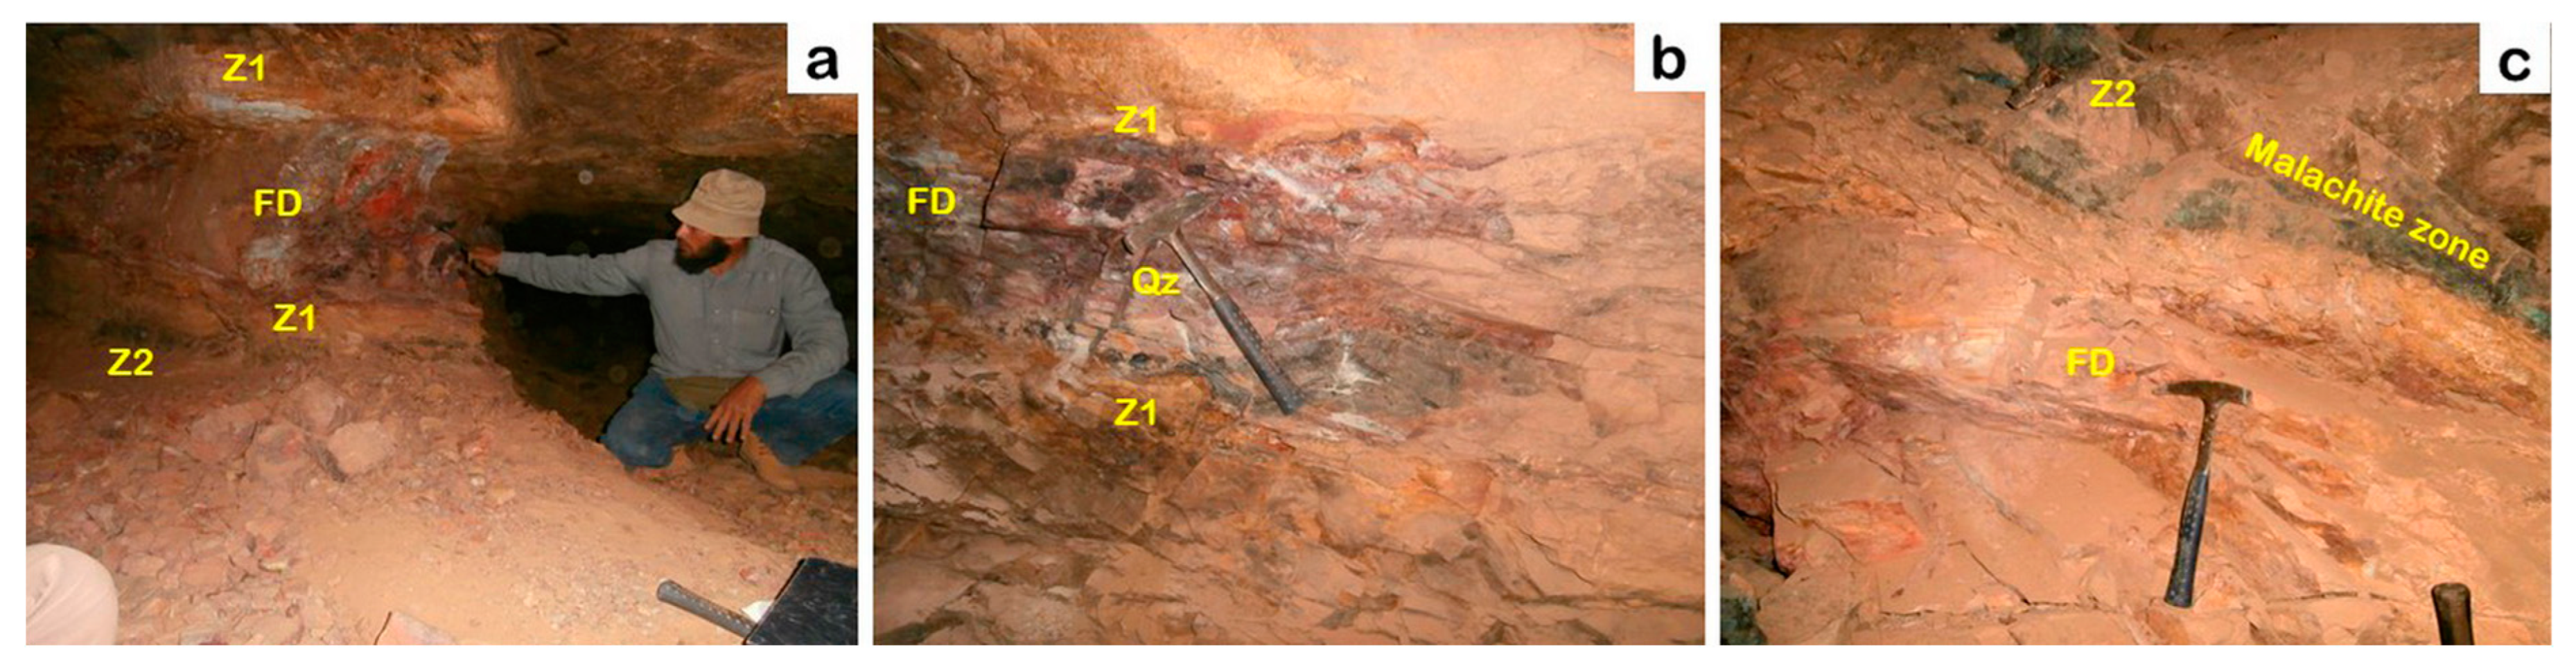
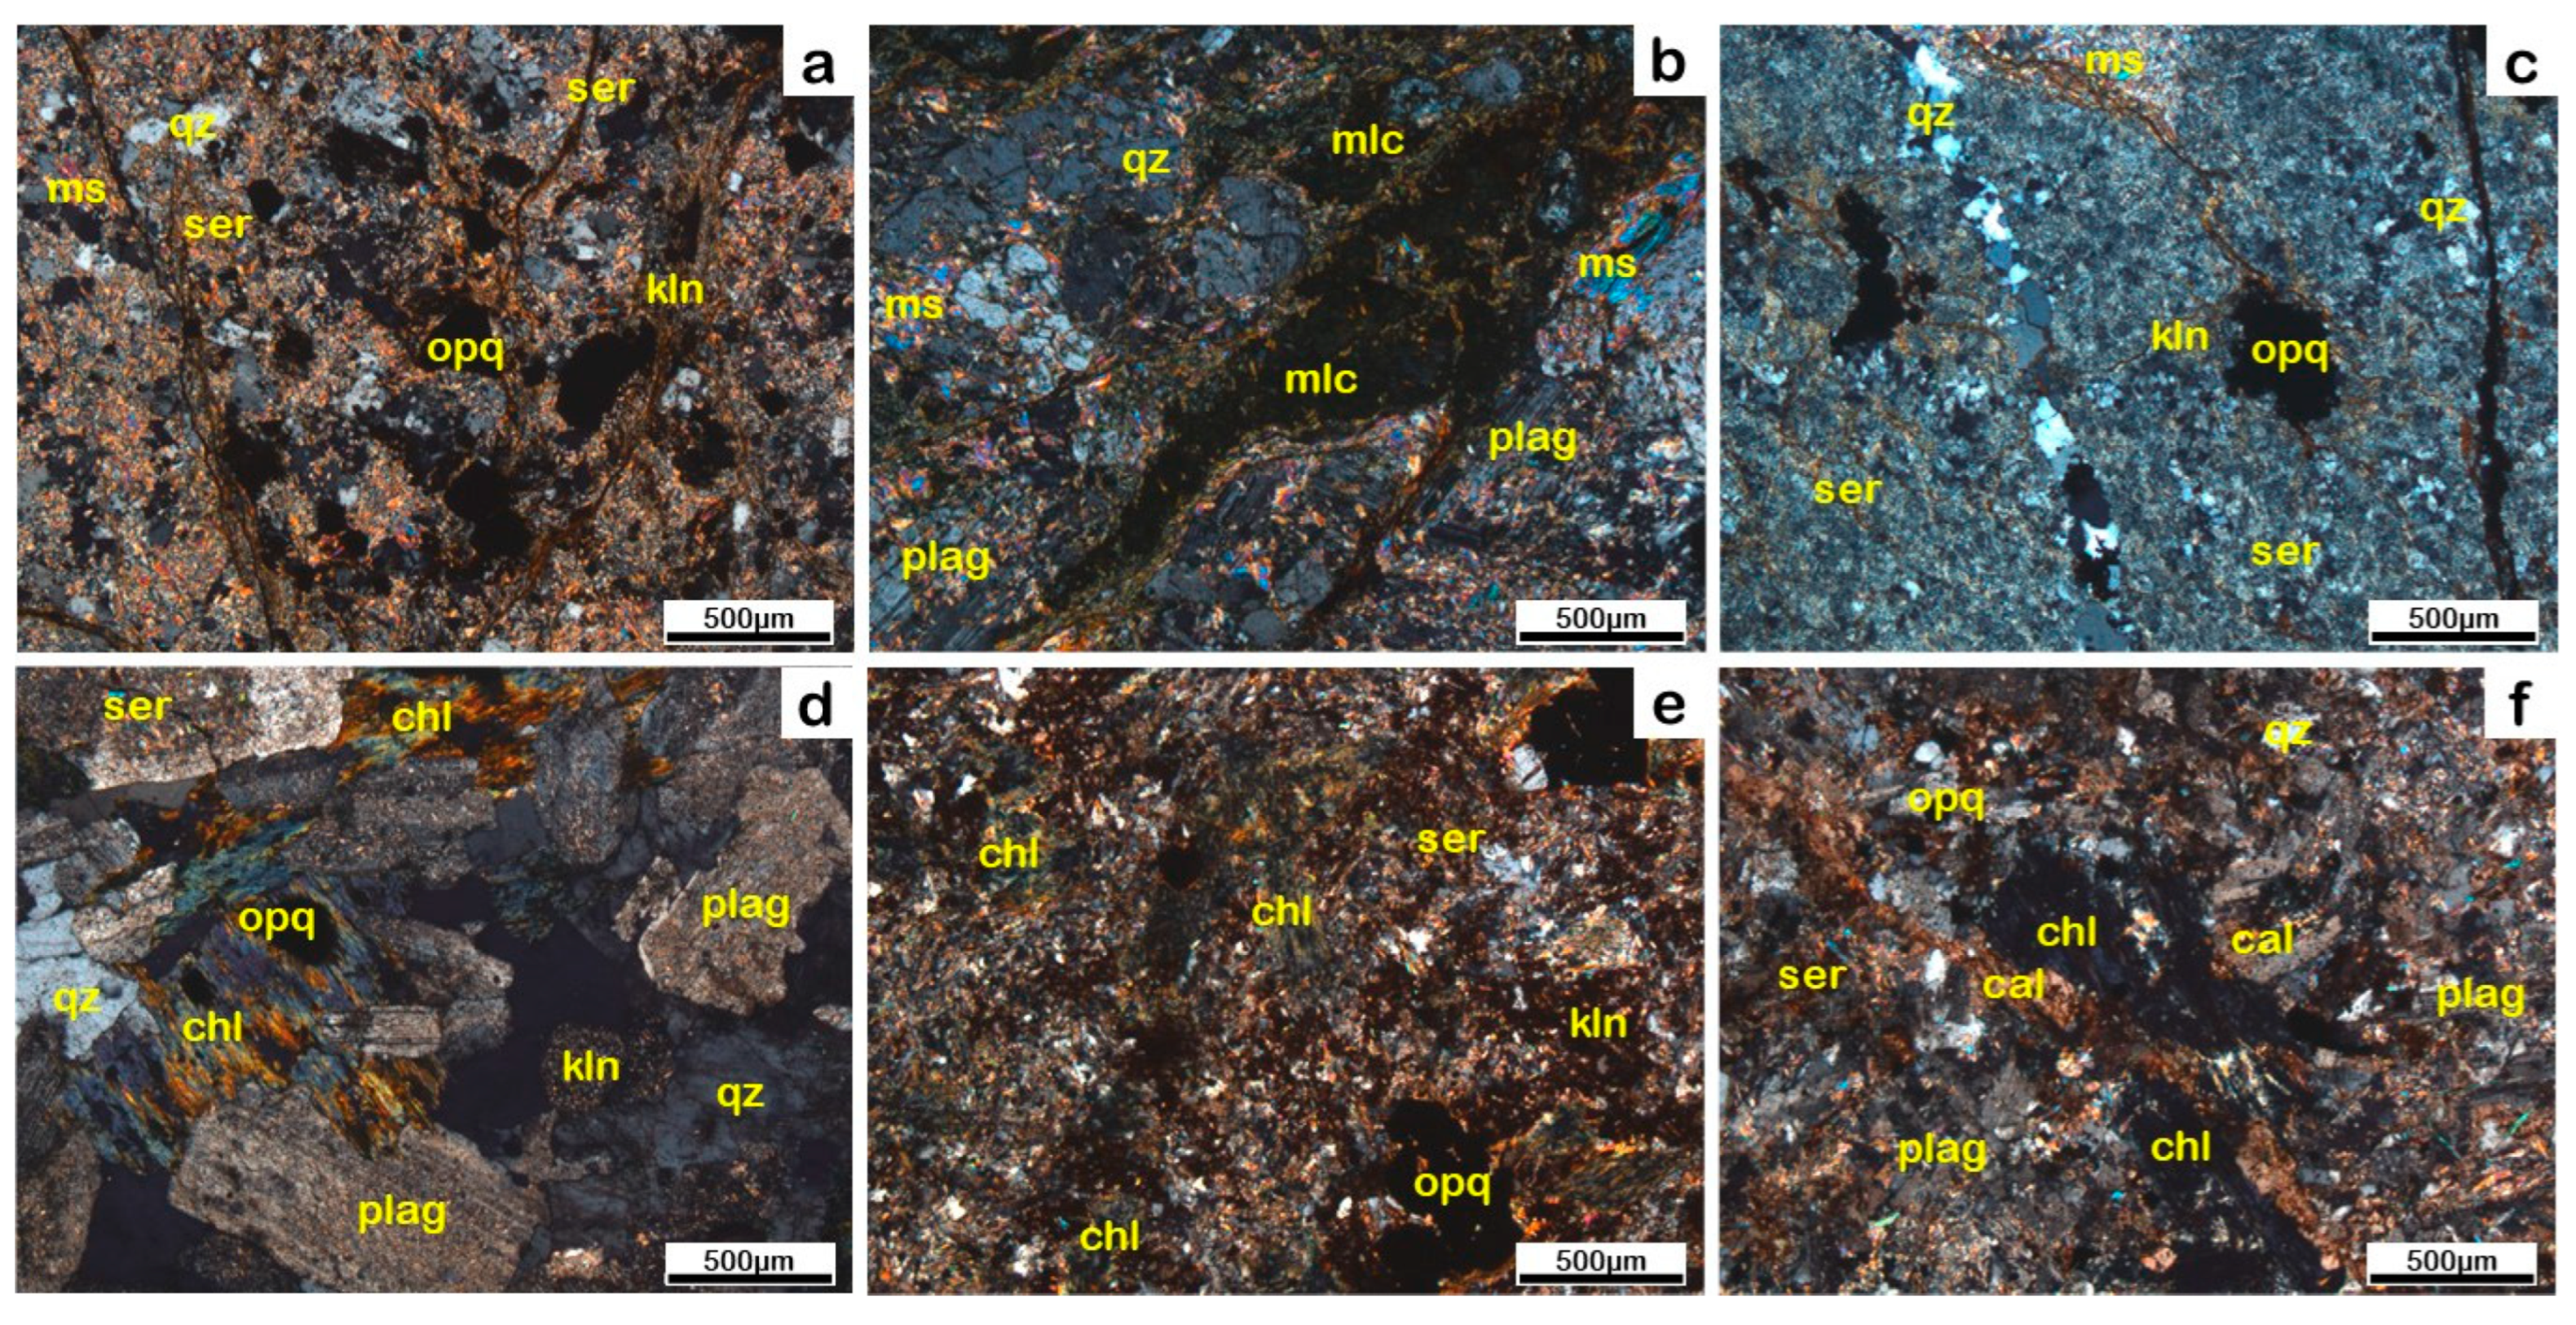
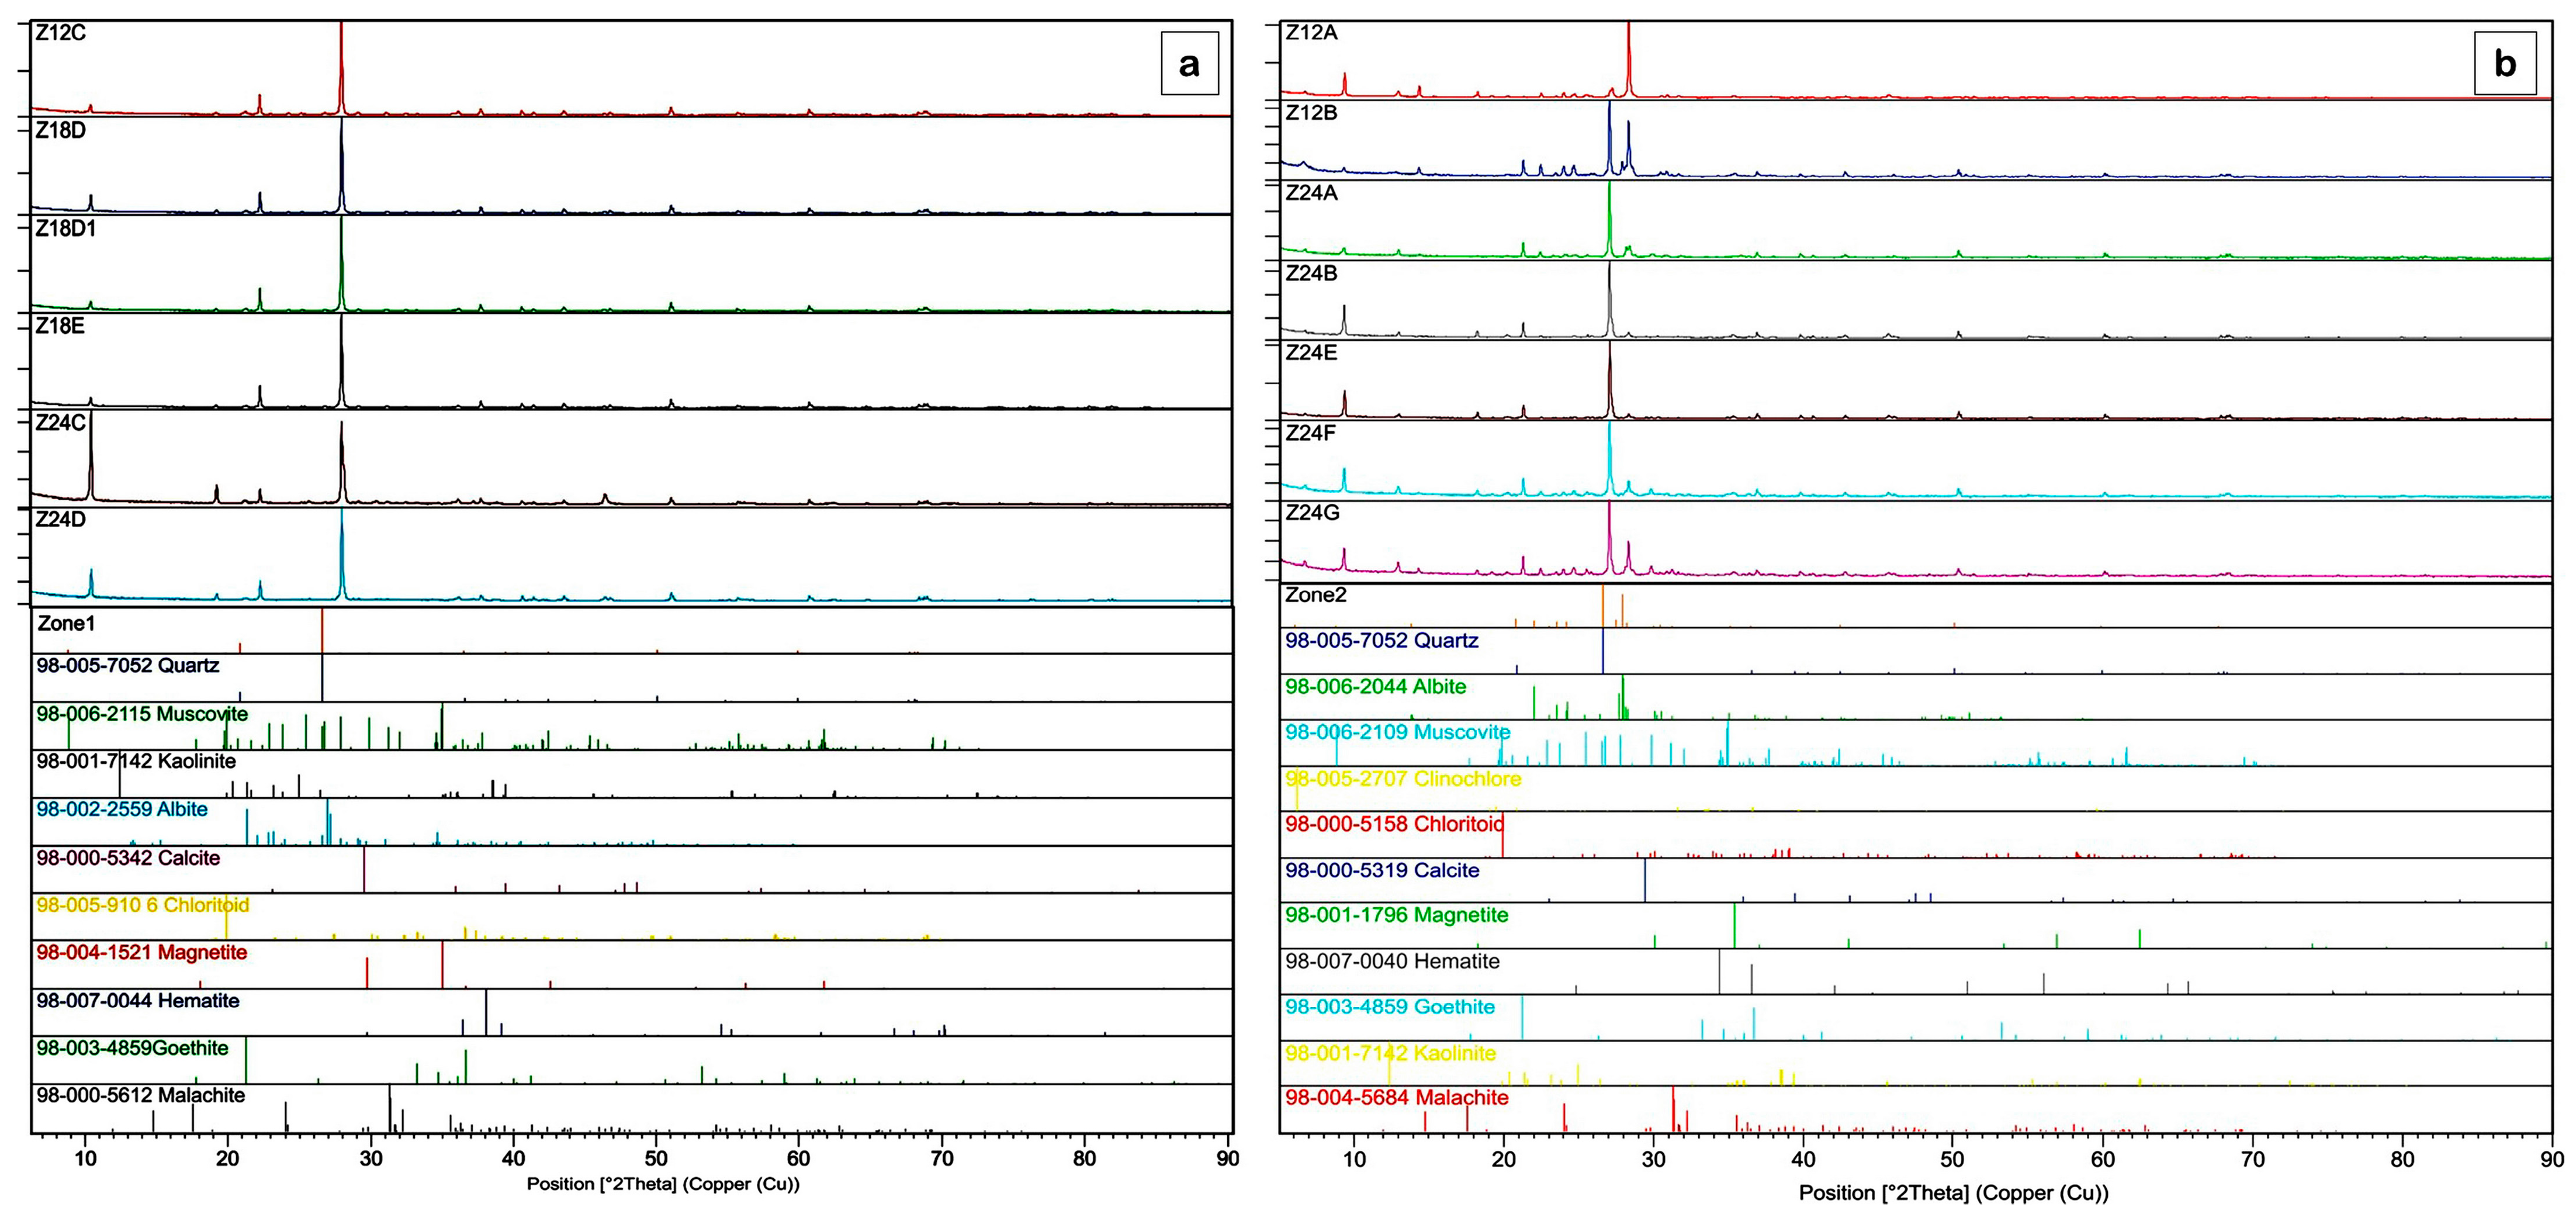
5.1. Petrography and XRD of Hydrothermal Alteration

According to the field studies, petrographic investigations, and XRD analysis, the alteration assemblages are mainly represented by muscovite (+sericite) (Figure 7a–c), kaolinite (Figure 7a–c), silicification (Figure 7c), chlorite (Figure 7d–f), and carbonate alterations (Figure 7f). Two main alteration zones are distinguished: sericite-kaolinite-quartz-pyrite ± albite alteration zone-1 and chlorite + calcite + dolomite ± albite ± sericite alteration zone-2.
The sericite-kaolinite-quartz-pyrite ± albite alteration zone-1 represents the main alteration type that occurs closely around the ore zone and has high potassic and silica mineral assemblages. It comprises mainly a high amount of sericite (+muscovite) and kaolinite with subordinate quartz and pyrite (Figure 7a–c). Its XRD pattern shows that it has quartz, sericite, kaolinite, albite, clinochlore, and epidote with subordinate amounts of pyrite and chalcopyrite (Figure 8a).
On the other hand, the chlorite–calcite–dolomite ± albite ± sericite alteration zone-2 has higher magnesium and carbonate mineral assemblage. It represents the peripheral zone having higher amount of chlorite and calcite with a minor amount of albite, sericite, and kaolinite pseudomorphs after biotite, hornblende, and plagioclase feldspar (Figure 7d–f). The sulfide minerals rarely formed across this zone. The XRD analysis shows that this alteration zone consists mainly of chlorite, clinochlore, calcite, dolomite, malachite, biotite, microcline, muscovite (sericite), with a lower amount of orthoclase, quartz, and albite (Figure 8b).

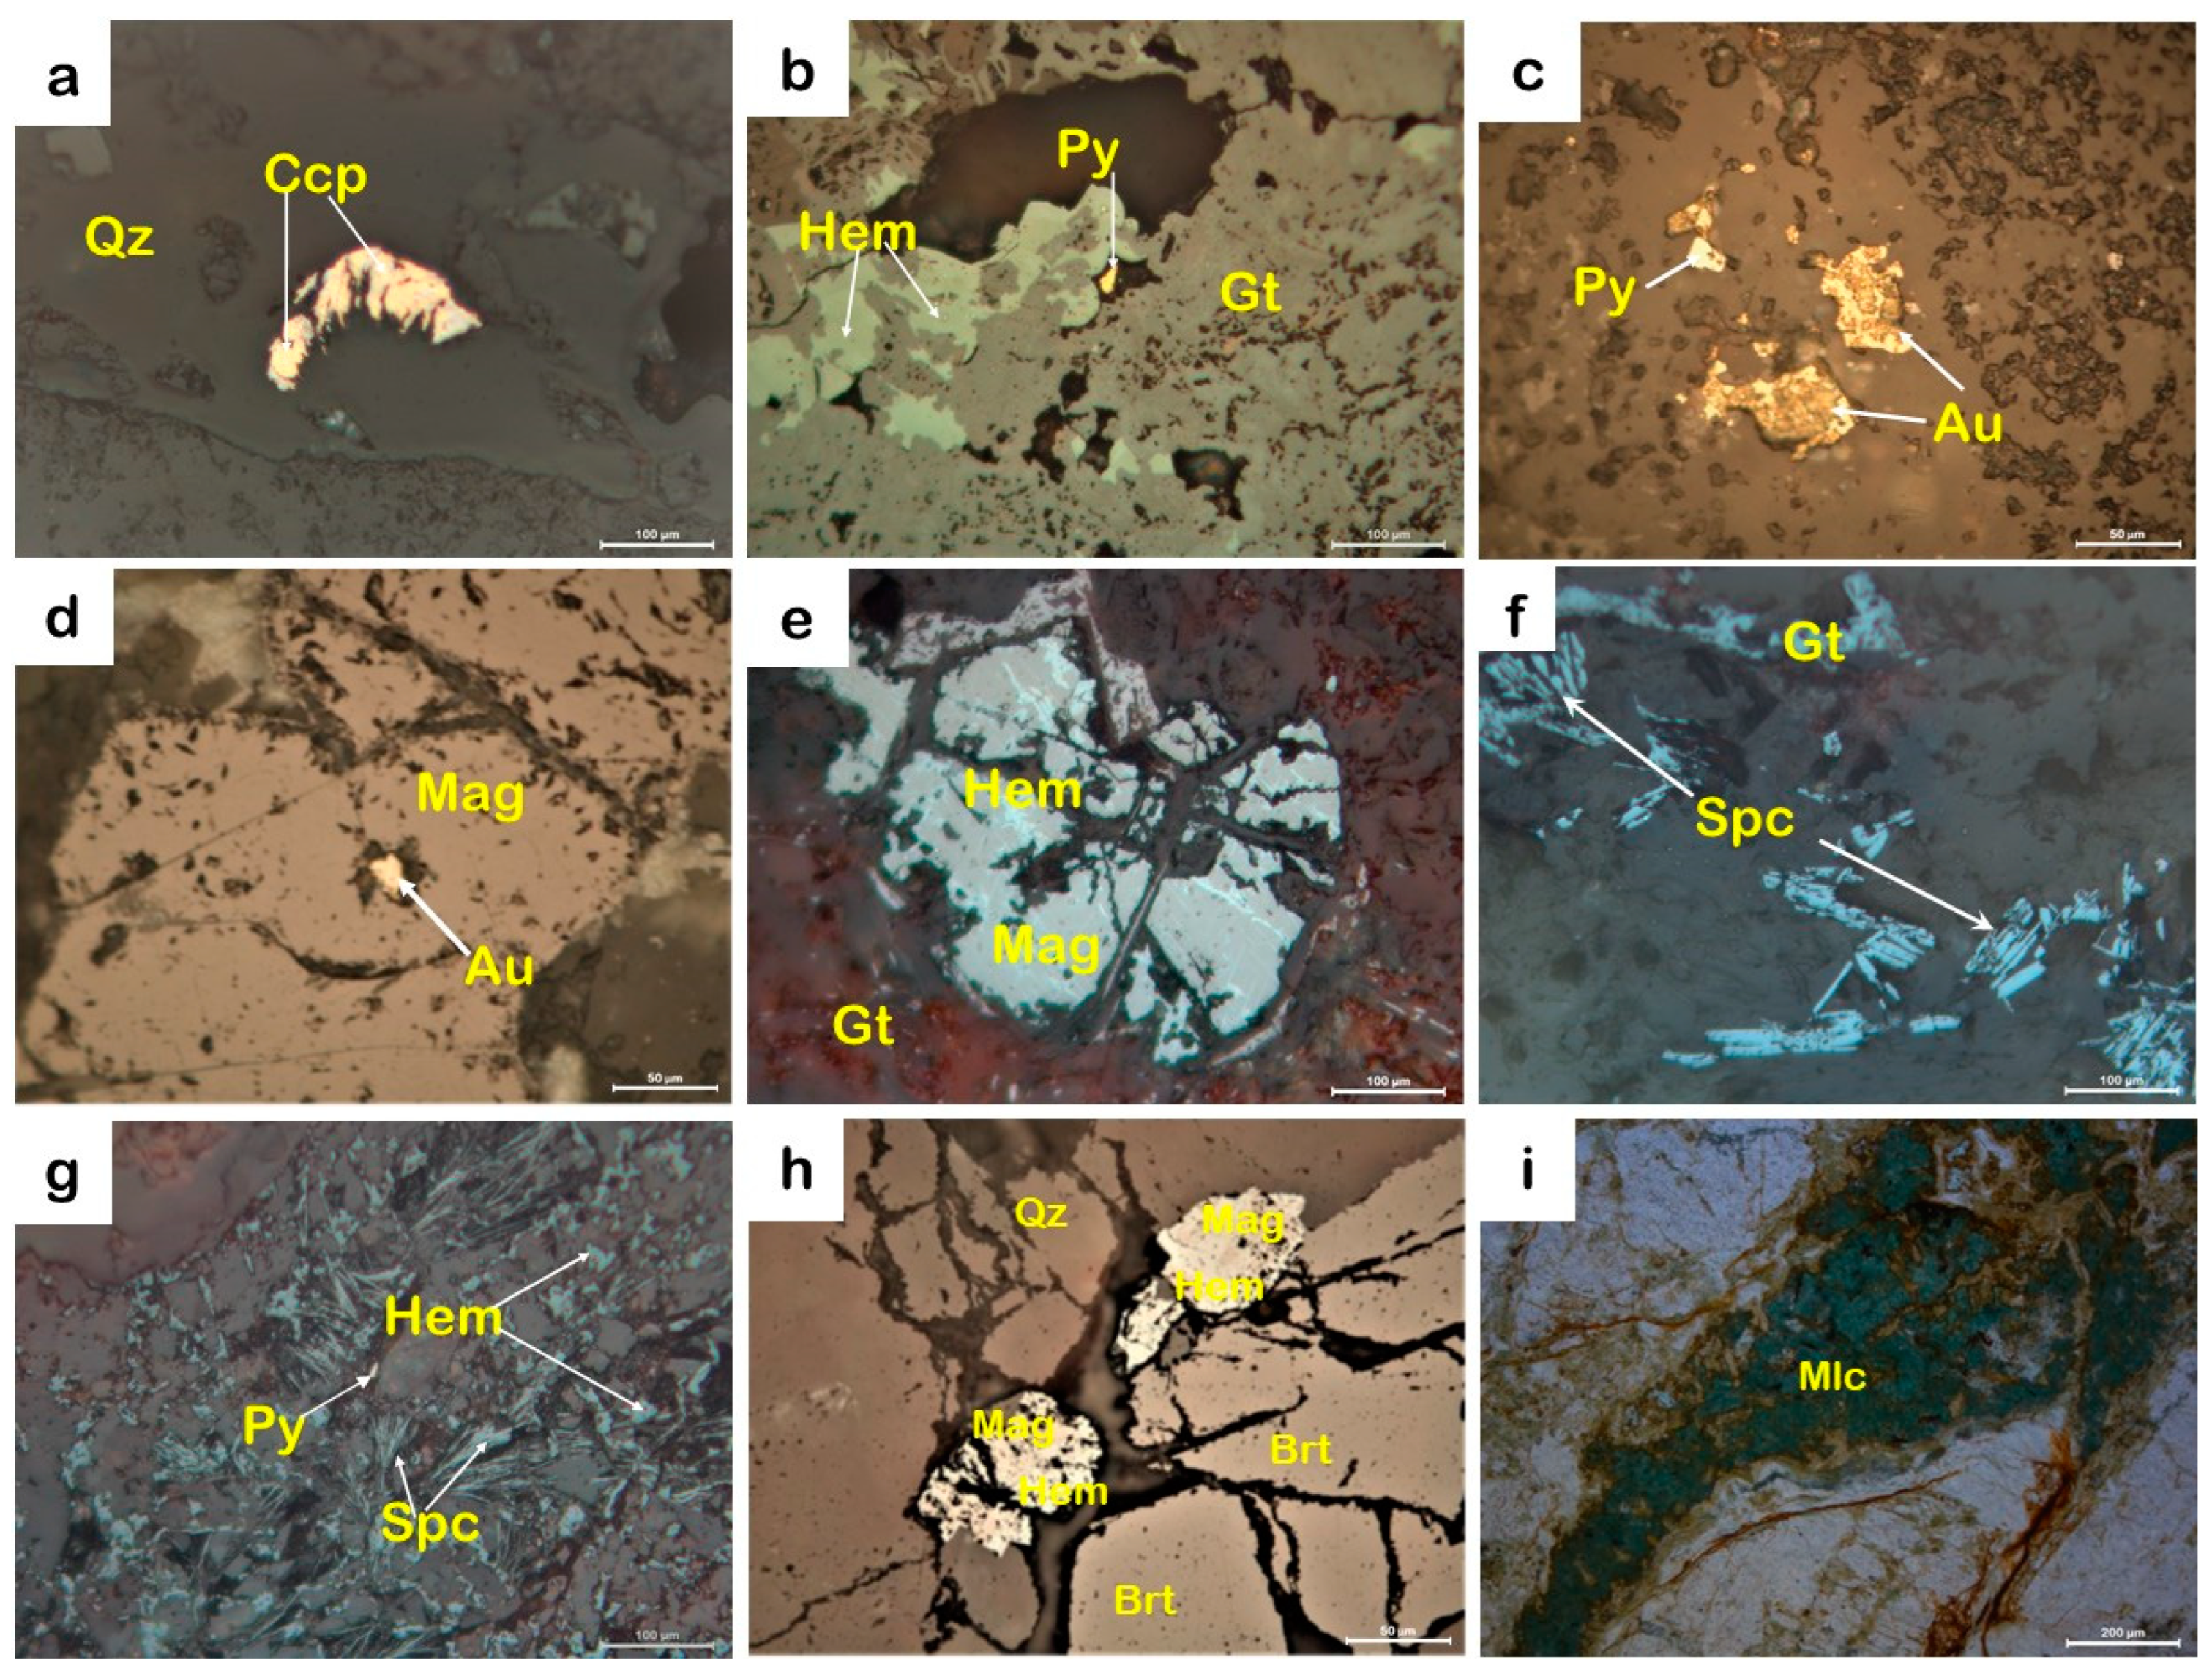
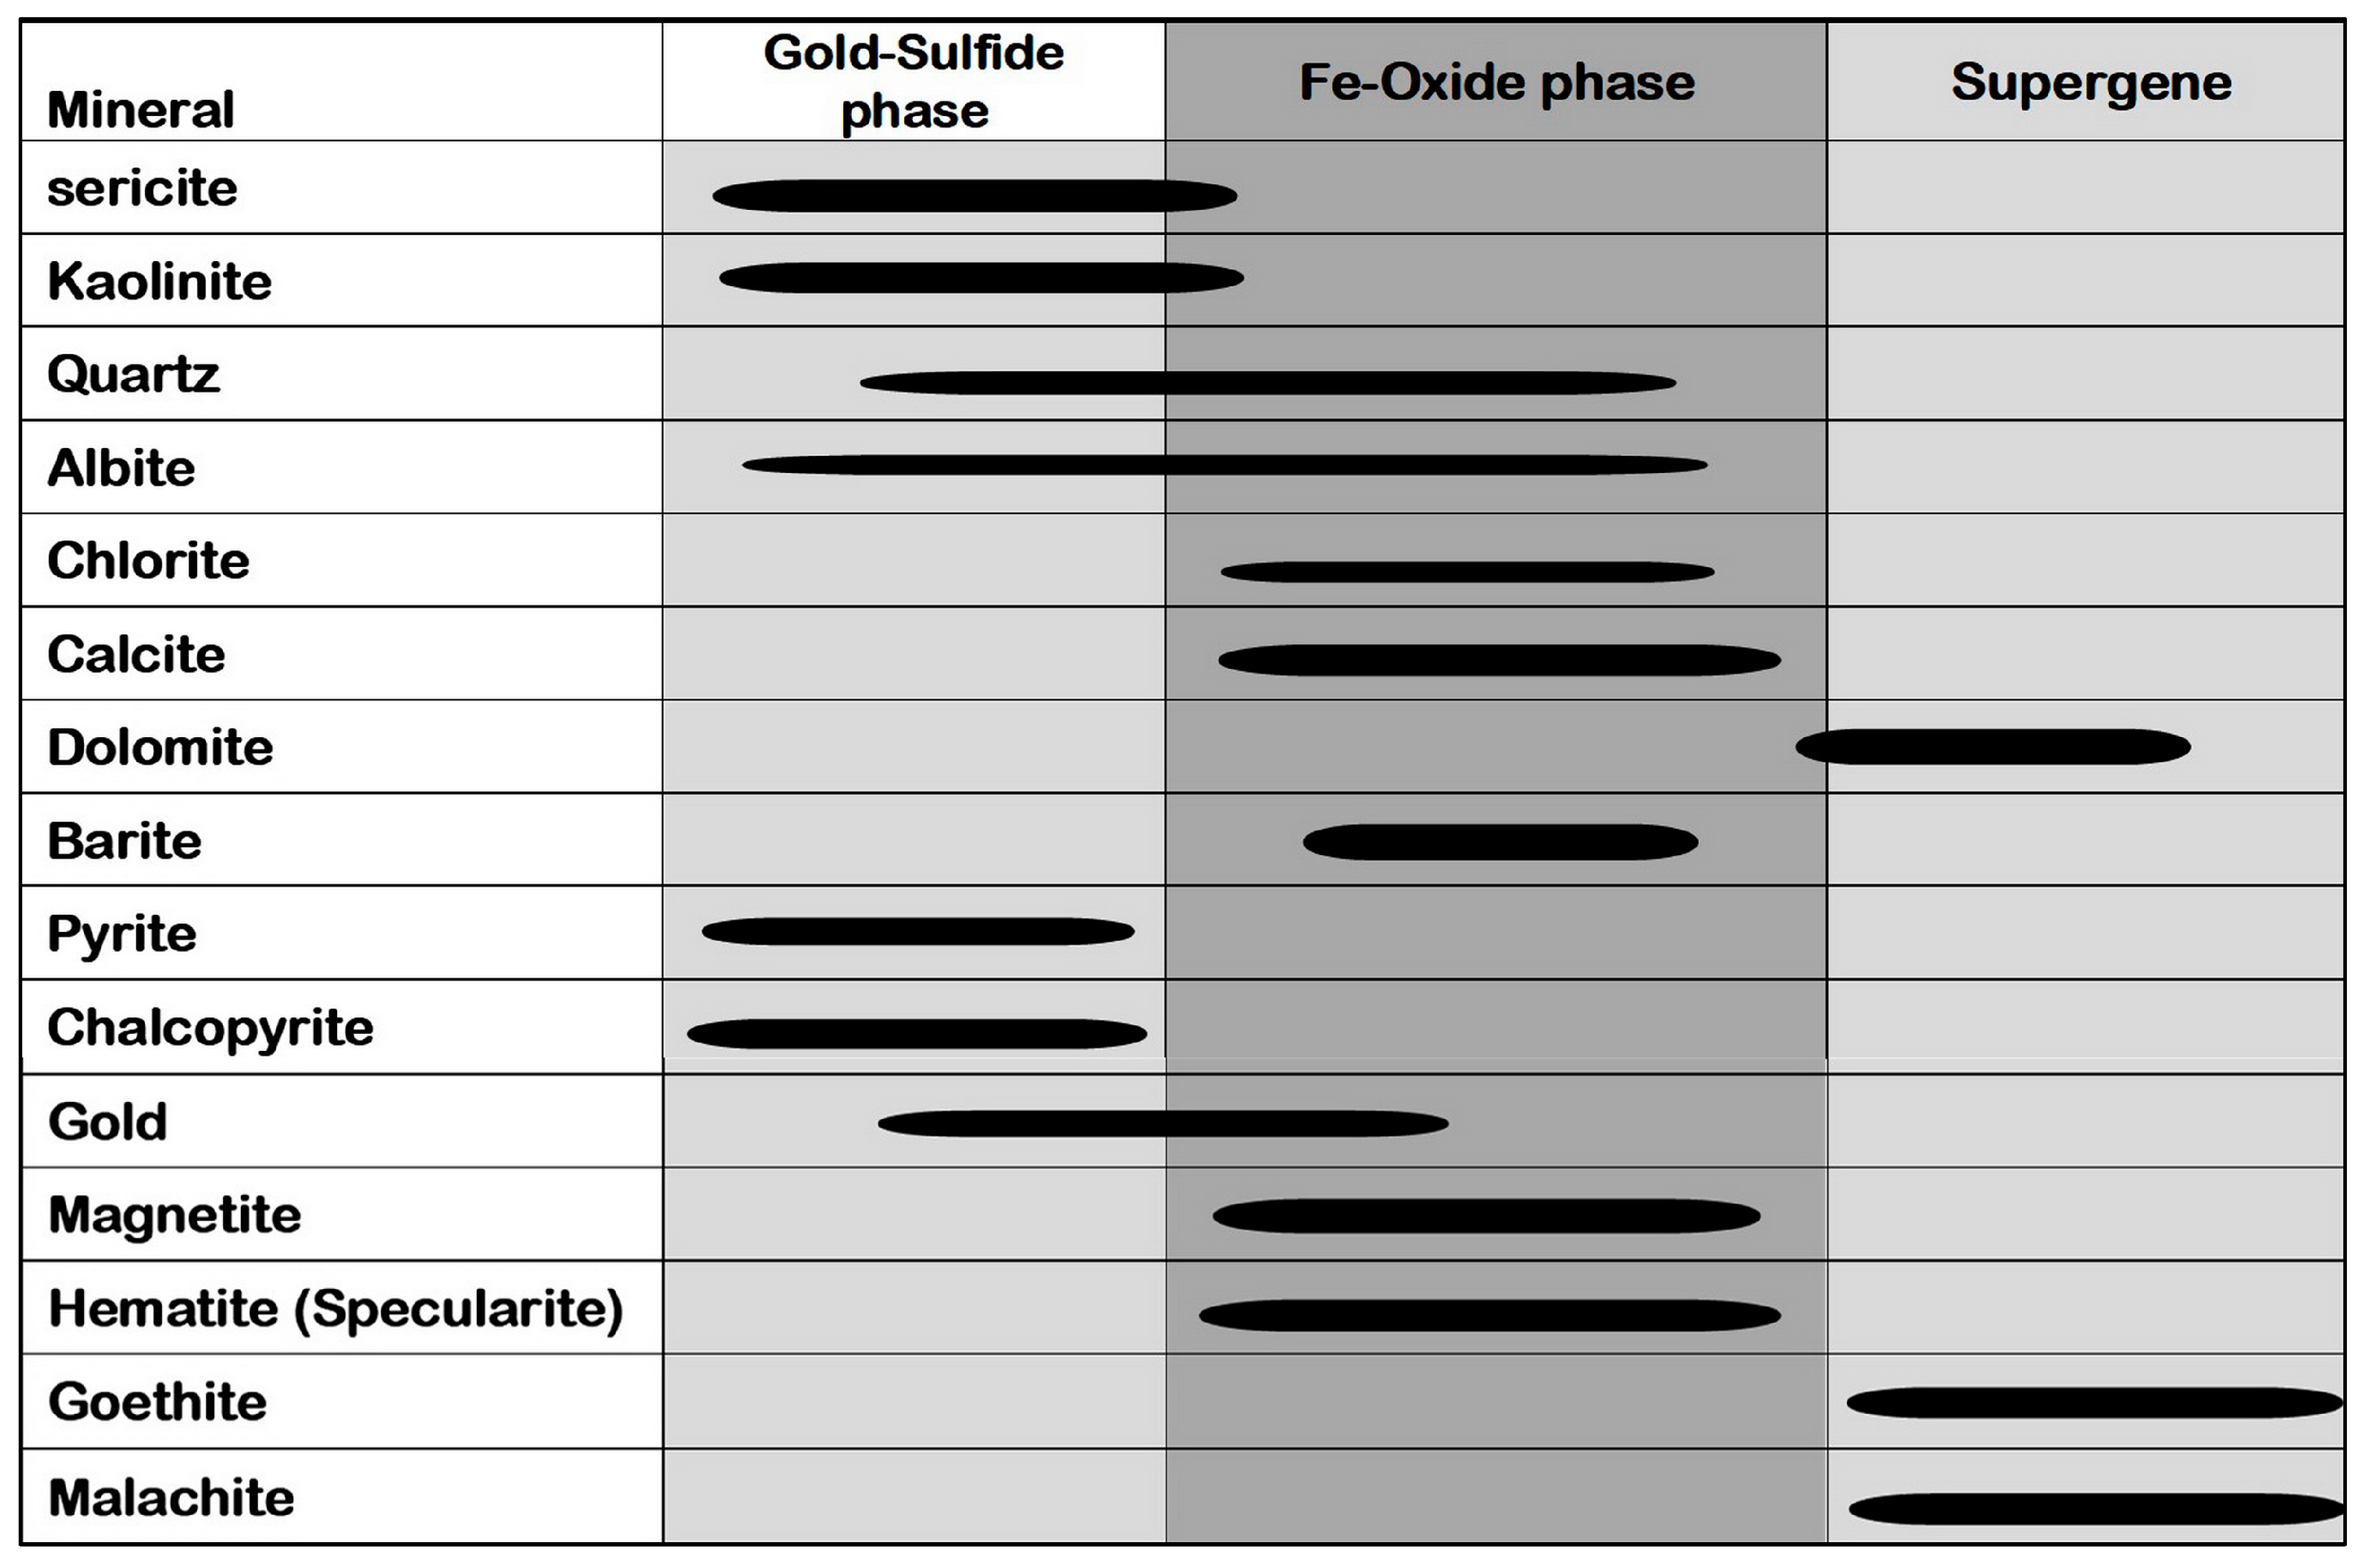
5.2. Ore Mineralogy and Paragenesis

The ore minerals include chalcopyrite, pyrite, and gold that formed within the alteration zone-1 (sericite-kaolinite-quartz-pyrite ± albite). They also include magnetite and specular hematite as well as barite that are associated with the alteration zone-2 (chlorite + calcite + dolomite ± albite ± sericite). Malachite and goethite represent the supergene products formed with some carbonate minerals.
Chalcopyrite is the most abundant sulfide mineral, having a brazen yellow color commonly with weak bireflectance and anisotropy (Figure 9a). Pyrite is detected as whitish-yellow euhedral to subhedral fine-to-medium crystals highly altered to goethite along the outer peripheries and the microfractures (Figure 9b). Gold occurs as a bright or golden yellow color with high reflectivity as free globules and specks associated with pyrite within alteration zone-1 (Figure 9c) along the felsite dike. Some samples have gold locally associated with magnetite (Figure 9d).
Magnetite occurs as a medium to coarse grained subhedral crystal, partially pseudomorphic, transformed into hematite (martitization) along its outer boundaries and/or along its cleavage planes (Figure 9e,h). Hematite has a grey-white color with a bluish tint and occurs as needle-like crystals (specularite) partially altered to goethite (Figure 9f,g). Barite occurs as tabular or prismatic dark euhedral to subhedral gray crystals formed at the late stage of mineralization, associated with magnetite and hematite within alteration zone-2 (Figure 9h).
Malachite represents a supergene mineral found as stains around vugs or at the contact between the altered rocks and surrounding the felsite dike. It is characterized by green color and formed in the oxidizing zones due to the carbonatization of chalcopyrite (Figure 9i). Goethite displays colloform texture formed because of the weathering products pseudomorph after pyrite and magnetite (Figure 9b).
Three phases of mineralization are observed at Abu Zawal (Fatira) gold deposits based on the paragenetic relationships between ore and gangue minerals; gold-sulfide, Fe-oxide, and supergene phases (Figure 10). The first mineralization phase which represents the gold-sulfide phase has chalcopyrite and pyrite as well as gold and occurs within alteration zone-1, which has sericite, kaolinite, and quartz. The second phase has Fe-oxide phases including magnetite, and hematite with barite, and occurs within alteration zone-2, which has chlorite, calcite, dolomite, and albite. Some free gold occurs within this Fe-oxide assemblage. The third phase consists of a supergene overprint with formation of malachite and goethite mineral pseudomorphs after chalcopyrite and pyrite and/or magnetite and hematite (Figure 10).

5.3. Mineral Chemistry of Sulfide Minerals

Sulfide minerals in the Abu Zawal area are represented by chalcopyrite and pyrite (Figure 9a–c). Gold is mainly associated with pyrite formed during the gold-sulfide phase (Figure 9c). Cu contents in chalcopyrite vary from 30.44 to 33.55 wt.% with an average of 32.71 wt.%, while Fe contents range from 32.05 to 36.07 wt.%, and S contents range from 32.11 to 34.72 wt.% (Table 1), with subordinate amounts of Te, Au, As, Ag, Sb, and Zn having averages of 0.01, 0.02, 0.03, 0.03, 0.05, and 0.02 wt.%, respectively. The chalcopyrite formula is near stoichiometric composition Cu0.96Fe1.1S1.94 (Table 1).
For pyrite, Fe varies from 46.22 to 47.46 wt.% with an average value of 47.04 wt.%, S content range from 49.95 to 52.84 wt.% with an average value of 51.87 wt.%, with minor amounts of As, Cu, Te, Au, Ni, Ag, Sb, and Zn having values up to 3.58, 0.16, 0.05, 0.05, 0.01, 0.05, 0.06, and 0.02 wt.%, respectively (Table 1). Its calculated formula (Fe1.02As0.01S1.97), which is near stoichiometric composition, reveals that the pyrite is As-bearing pyrite (Table 1).

5.4. Geochemistry

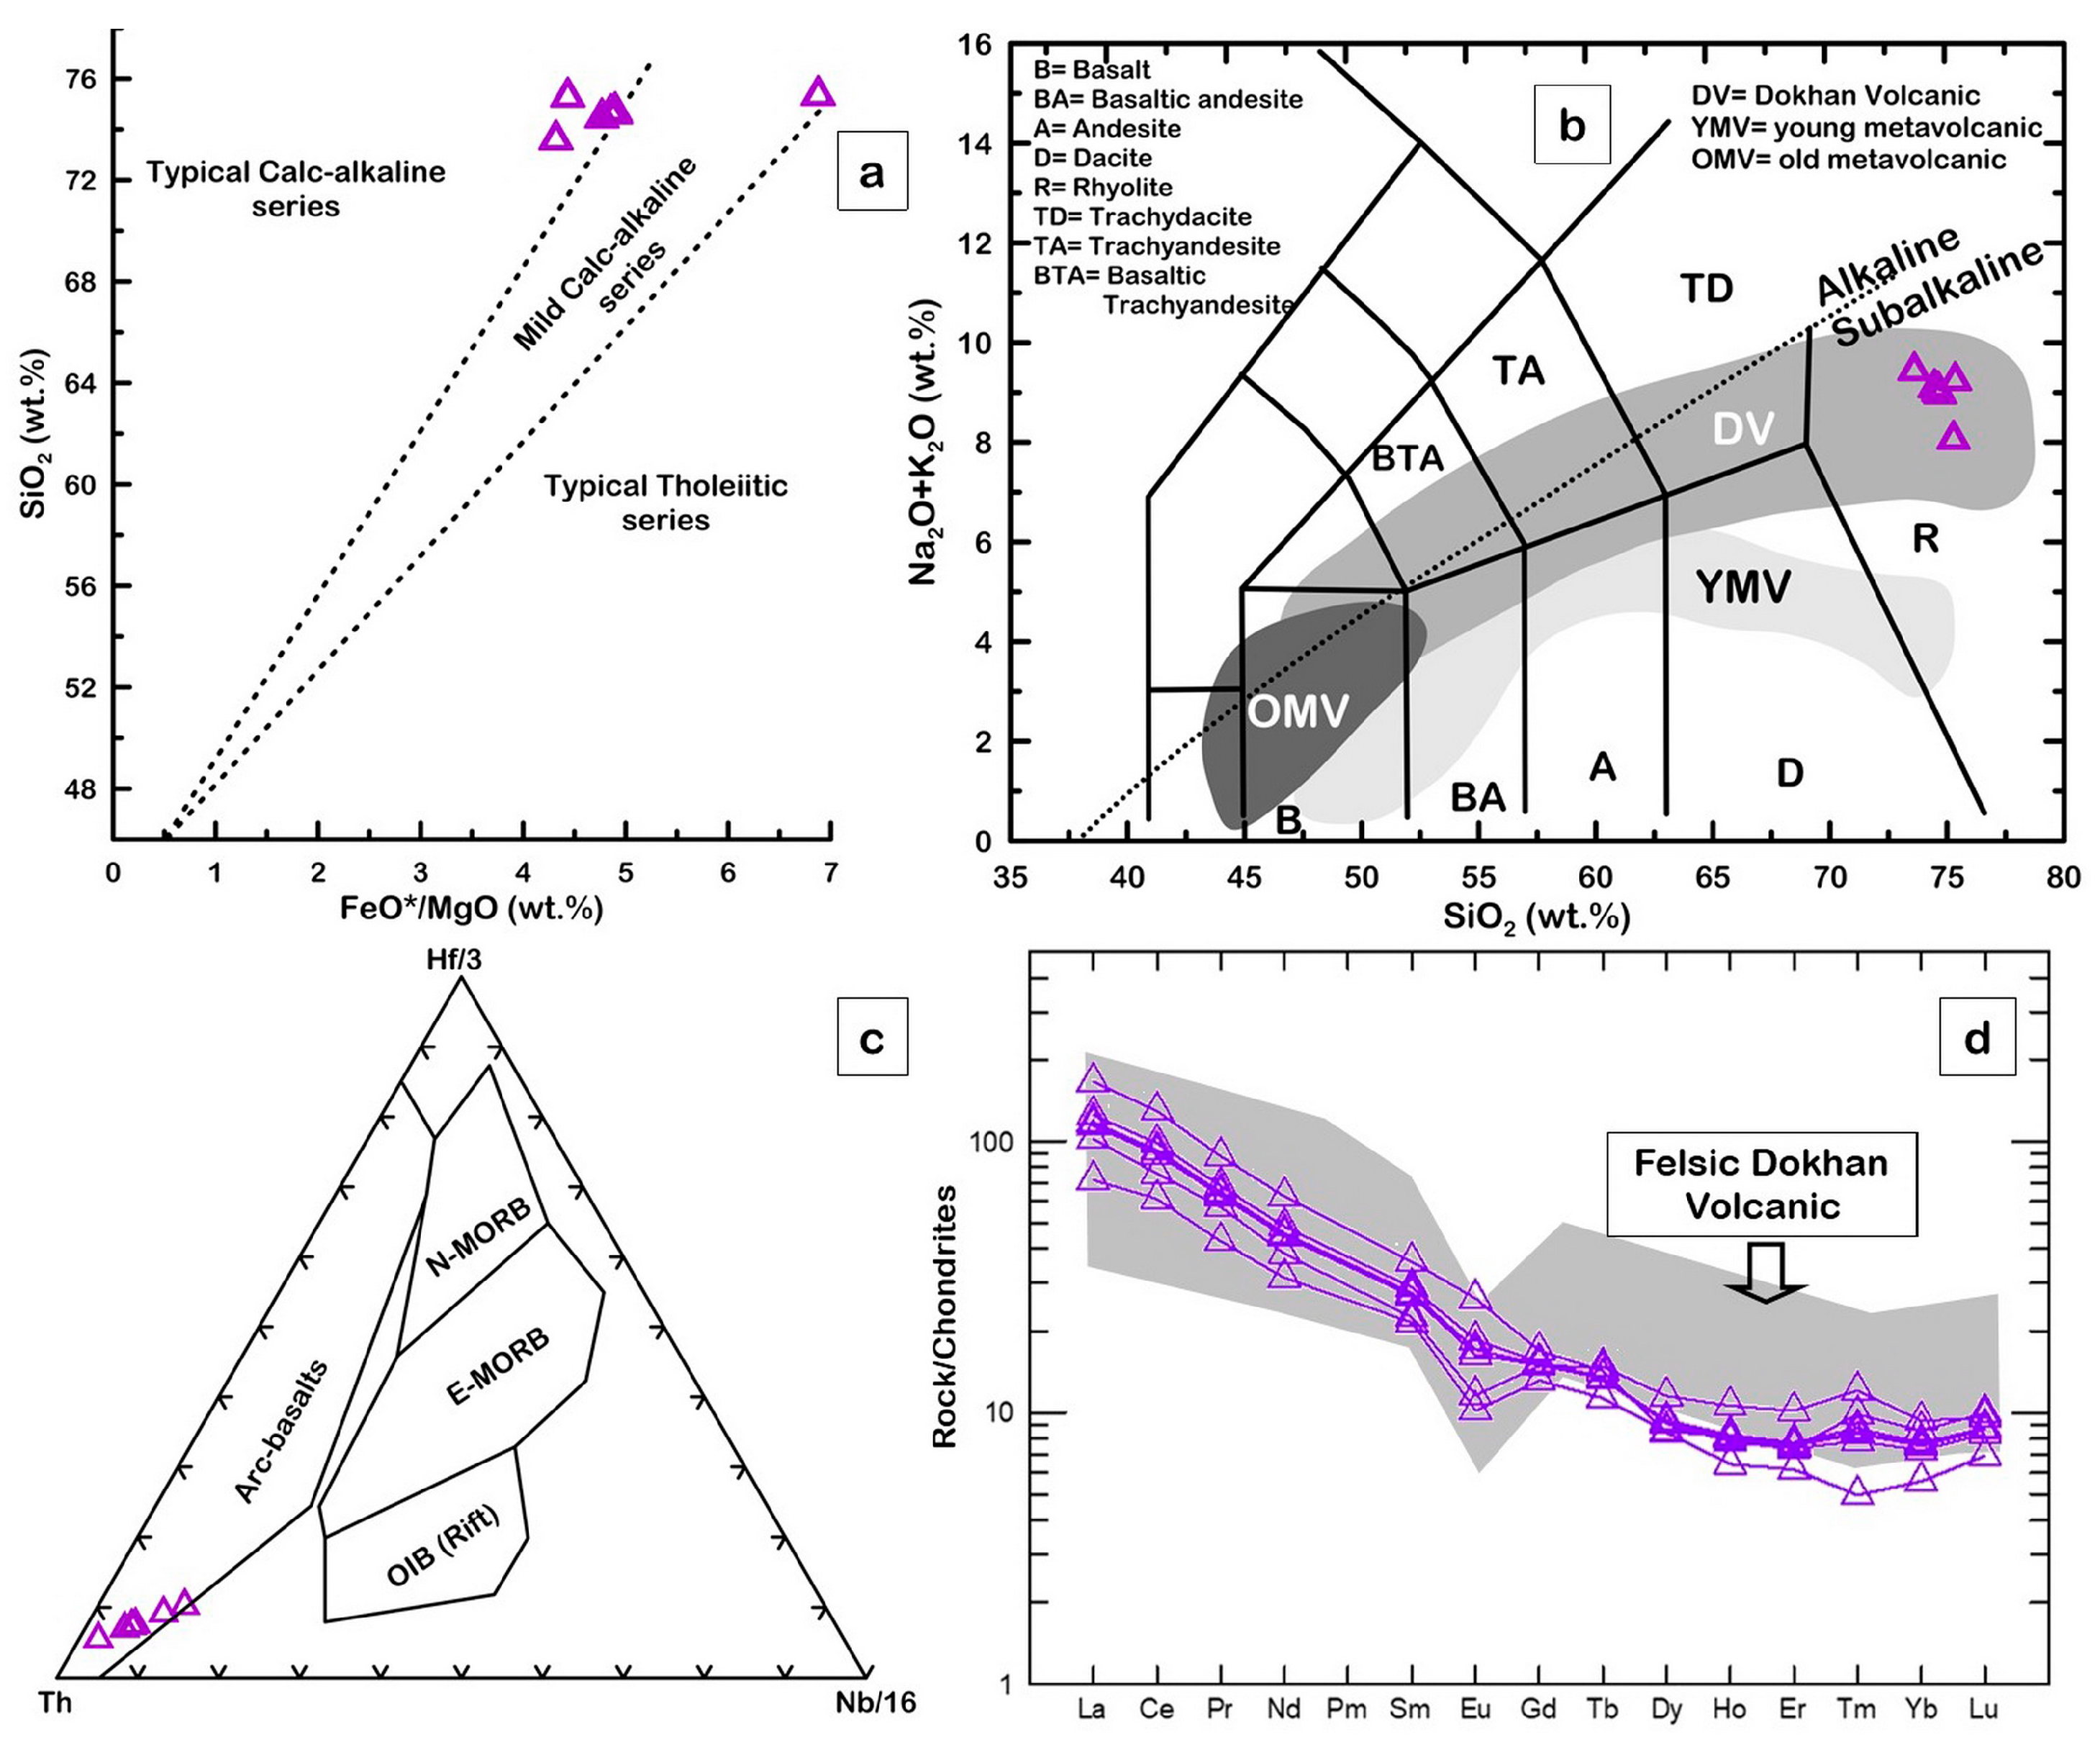
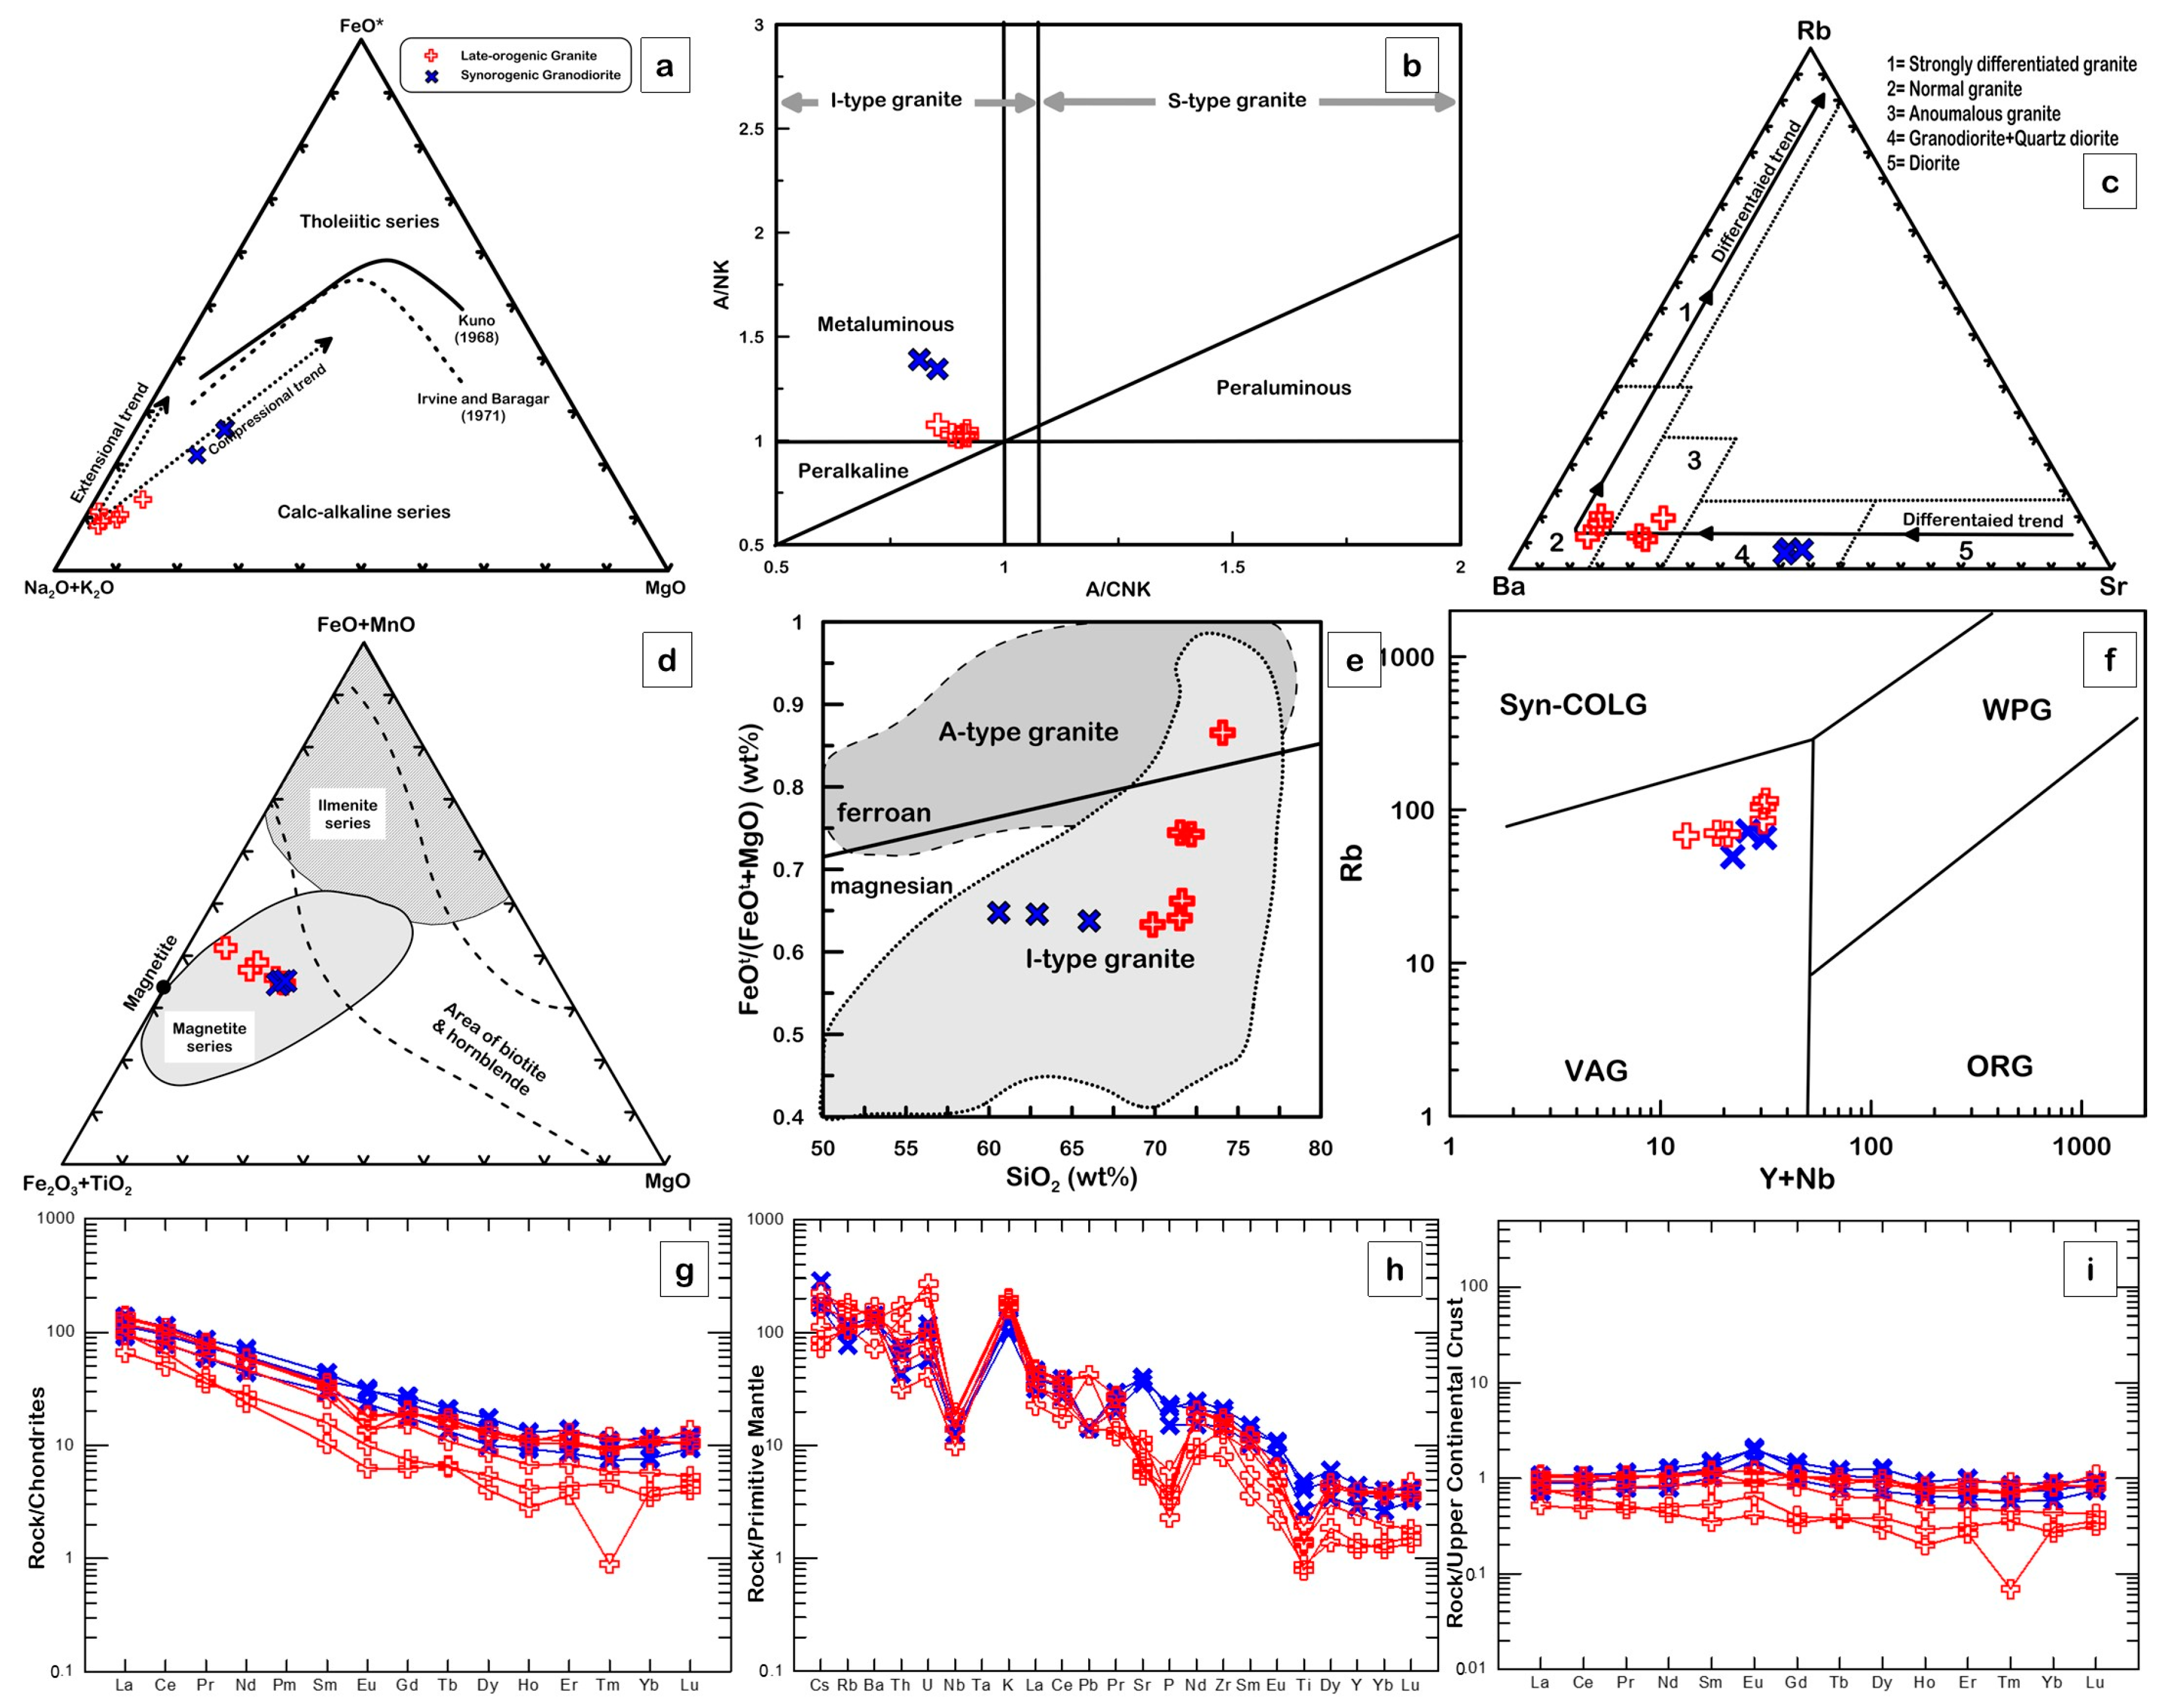
5.4.1. Geochemistry of Host Rocks

The felsite dike samples have mostly calc-alkaline affinities ranging from typical calc-alkaline to mild calc-alkaline series (Figure 11a). The geochemical classification using the total alkali versus silica (TAS) diagram suggested by Le Maitre, et al. [43] shows that the felsite dike is subalkaline rhyolite, similar to Dokhan Volcanics of Moghazi [44] and Eliwa, et al. [23] (Figure 11b). The samples of the studied felsite dike plot mostly in the field of volcanic rocks of island arcs [45] (Figure 11c). The felsite dike samples are characterized by enrichment in light rare earth elements (LREE) (an average of 115.9 ppm) relative to heavy (H)REE (an average 9.4 ppm) (Table 2). The chondrite-normalized REE patterns of these rock units also show the LREE enrichments relative to the HREE [46] (Figure 11d) with an average of (La/Yb)N = 14.9, (La/Sm)N = 4.0, (Gd/Yb)N = 2.0, and (Tb/Yb)N = 1.9 (Table 2). The Eu-negative anomalies (Eu/Eu* = 0.8) of the felsite dike revealed that it evolved through differentiation and is akin to the felsic Dokhan Volcanics of Moghazi [44] and Eliwa et al. [23] (Figure 11d).
Nine samples from the Abu Zawal granitoid rocks (three synorogenic granitoids and six late-orogenic granitoids) were selected for geochemical studies. The major oxides and trace elements including the REE compositions are presented in Table 3. The synorogenic granitoid samples have rather constant SiO2 (60.59–66.04 wt.%), Al2O3 (15.64–16.73 wt.%), K2O (3.01–3.92 wt.%) and Na2O (4.27–5.14 wt.%), CaO (3.71–4.69 wt.%) contents. The MgO (1.53–2.14 wt.%) and TiO2 (0.57–1.03 wt.%) contents are relatively variable. In comparison with the synorogenic granitoids, the late-orogenic granitoid samples have higher SiO2 (69.86–74.08 wt.%) and K2O (4.97–5.98 wt.%) contents, and lower Al2O3 (13.05–14.46 wt.%), Na2O (3.89–5.19 wt.%), CaO (0.81–1.85 wt.%), MgO (0.19–0.97 wt.%), and TiO2 (0.17–0.42 wt.%) contents.
The investigated granitoid rocks have calc-alkaline affinities because of the enrichments of the total alkalis (Na2O + K2O) [48,50] (Figure 12a). They mostly follow the trends of compressional suites (e.g., subduction related granites) (Figure 12a) having intermediate unimodal frequency distributions of differentiation index and normative plagioclase [51]. Based on the alumina saturation index (ASI) value (molar Al2O3/CaO + Na2O + K2O) of Shand [52], all the granitoids have A/CNK less than 1.1 clustered into metaluminous group and classified as I-type granitic suites [53] (Figure 12b). Moreover, the Rb, Ba, and Sr ternary diagram by El Bouseily and El Sokkary [54] reveals that the late-orogenic granitoid rocks are highly differentiated than the synorogenic granitoid rocks which plot in the field of granodiorite and quartz diorite (Figure 12c). Late orogenic granitoid rock samples plot in the fields of normal and anomalous granite (Figure 12c). The granitoids are recognized obviously as magnetite series granitoids by the Fe2O3 + TiO2-FeO + MnO-MgO diagram [55] (Figure 12d), as well as classified mostly into magnesian I-type granite (Figure 12e) and volcanic-arc granite (VAG) [56] (Figure 12f).
The studied granitoid rocks are characterized by high enrichment in LREE (an average of 127.1 ppm and 109.5 ppm for synorogenic and late orogenic granitoid rocks, respectively) relative to HREE (an average of 13.4 ppm and 9.3 ppm for synorogenic and late orogenic granitoid rocks, respectively) (Table 3). The chondrite-normalized REE patterns of these rock units also show enriched LREE relative to the HREE (Figure 12g), with an average of (La/Yb)N = 10.9 and 14.8, (La/Sm)N = 2.9 and 4.5, (Gd/Yb)N = 2.3 and 1.9, and (Tb/Yb)N = 1.8 and 1.7 for synorogenic and late orogenic granitoid rocks, respectively (Table 3). The Eu-anomalies are relatively positive for metavolcanics (Eu/Eu* = 0.9 to 1.1) (Figure 12g). The Eu-negative anomalies of the late orogenic granitoid samples with an average of Eu/Eu* = 0.72 reveal that they have evolved by means of differentiation [46] (Figure 12g). The primitive mantle-normalized immobile elements profiles of the studied granitoid rocks [46] (Figure 12h) show depletion in Nb, Sr, P, Zr, Eu, and Ti relative to Th-U, K, and La-Ce, compatible with a subduction-associated petrogenesis [47]. The Upper Continental Crust (UCC)-normalized REE pattern of these rocks shows flat behavior [57] (Figure 12i), mostly lower than 1, suggesting that these rocks are mostly consistent with the UCC compositions.
Figure 12. Geochemical diagrams of the synorogenic and late orogenic granitoid rocks: (a) AFM diagram [48,50], the trends of compressional and extensional environments after Petro et al. [51]. (b) Alumina saturation index (ASI) in the studied granitoid rocks. ASI  =  1 from Shand [52], ASI  =  1.1 from Chappell and White [53]. (c) Ba-Rb-Sr ternary diagram after El Bouseily and El Sokkary [54]. (d) Fe2O3 + TiO2-FeO + MnO-MgO diagram after Ishihara [55]. (e) SiO2 vs. FeOt/(FeOt + MgO) diagram after Frost et al. [58]. (f) Rb vs. (Y + Nb) tectonic discrimination diagram, after Pearce et al. [56]. (g) Chondrite-normalized REE patterns [46]. (h) Primitive mantle-normalized trace element patterns [46]. (i) Upper continental crust (UCC)–normalized REEs [57].
Minerals 13 00489 g012

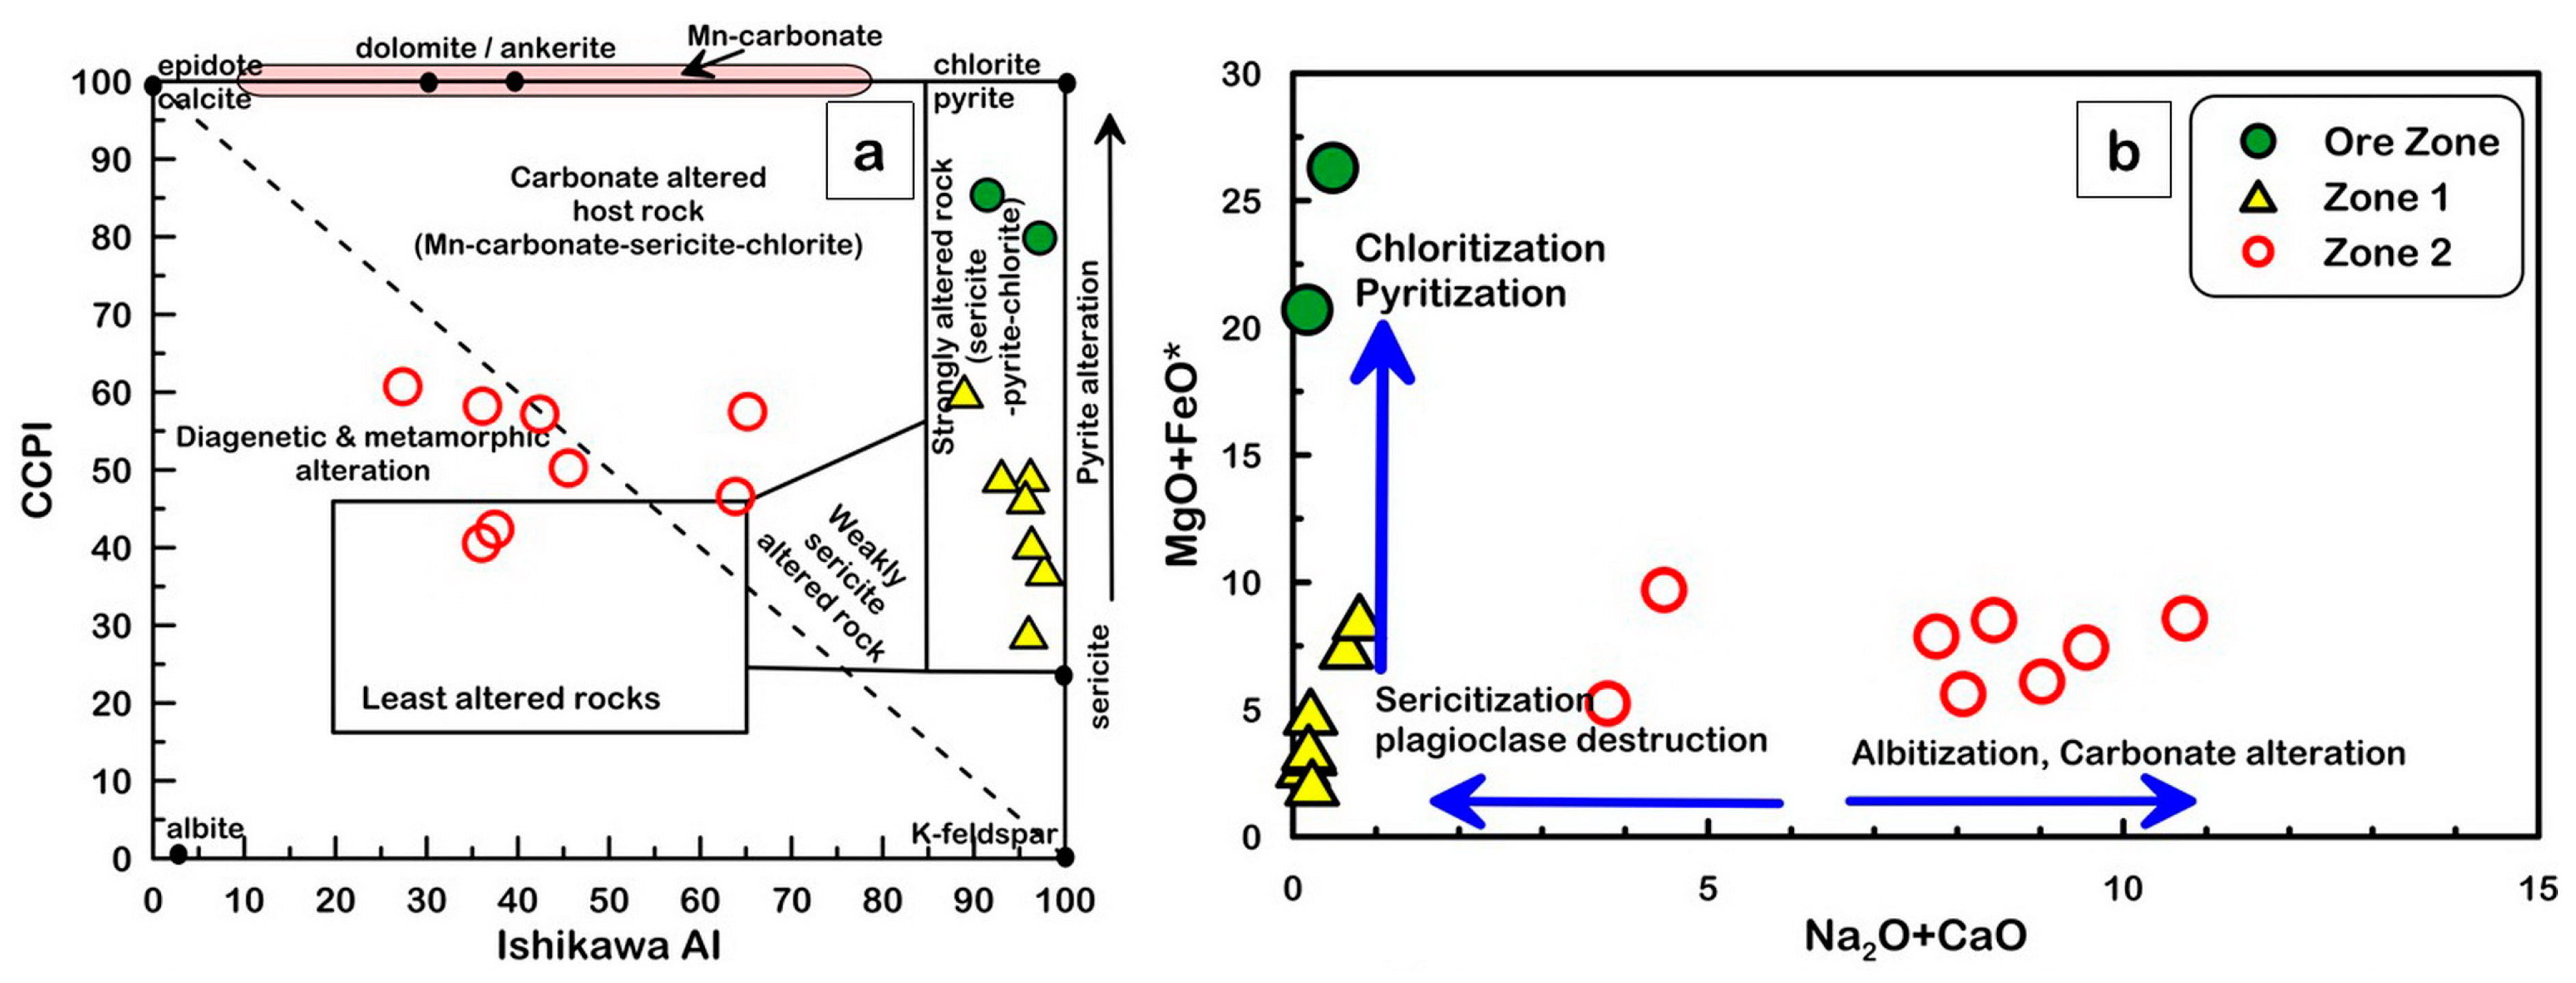
5.4.2. Alteration Geochemistry

Table 4 shows the major, trace, and REE elements of the different alteration and ore zones. Pyritization, chloritization, and sericitization are demonstrated by mineralogical evidence. The alteration box plot of the chlorite-carbonate-pyrite index (CCPI) of Large et al. [59] vs. the alteration index of Ishikawa, et al. [60] (Figure 13a), as well as the Na2O + CaO vs. MgO + FeOt binary diagram (Figure 13b), are consistent with this evidence. Figure 13a shows that the samples of the ore zone and zone-1 plot in the field of strongly altered rocks have sericite-pyrite-chlorite alteration types. On the other hand, the samples of zone-2 fall in the fields of weakly sericite altered rocks and carbonate altered host rock which have Mn-carbonate-sericite-chlorite alteration types (Figure 13a). While Figure 13b reveals that the ore zone is highly affected by pyritization and chloritization, zone-1 is highly affected by sericitization which is formed by plagioclase destruction, and zone-2 is affected by high albitization, high carbonate alteration, and weak sericite alteration [61] (Figure 13b).

6. Discussion

6.1. Mass Balance Calculations

Throughout the alteration process, the mass of each alteration zone changes in comparison to the unaffected rocks [40]. By comparing the composition and volume of the altered and untreated rocks, these alterations correspond to elemental gains and/or losses in the altered rocks [40,41,62]. Grant [41] improved the Gresens’ equation of Gresens [40] which assumed that immobile elements (e.g., Al, Ti, and Zr) do not undergo mass transfer throughout the process of alteration plotted along the isocon line. Coelho [39] developed a software program called GEOISO-Windows™ that calculates the mass/volume changes of the different mobile elements by assuming the immobile elements show few or no changes during the different hydrothermal alteration processes [63]. This software indicates that the samples from ore zone and alteration zone-1 are enriched in Fe2O3, FeO, K2O, and LOI with As, Au, Cu, Mo, Ni, S, and Sb (Table 5). Enrichments of Fe2O3, FeO, and K2O with high sulfur reflect mainly pyrite and sericite alteration associated with gold enriched in the ore zone. On the other hand, the enrichments of Fe2O3, FeO, MgO, CaO, lower K2O, and TiO2 with higher Cu in zone-2 suggested chlorite and carbonate with low sericite alteration associated with enriched Cu (Table 5).

6.2. Behavior of Large Ion Lithophile Elements (LILE) and High Field Strength Elements (HFSE)

Considering the range of silica and other geochemical parameters, as well as textural evidence, feldspar minerals have an important role in the magmatic evolution of granitoid rocks [64]. Rb, Ba, and Sr are useful in estimating the extent of fractionation of the minerals, whereas magma evolution was controlled dominantly by fractional crystallization, partial melting, or more complex processes [64]. The granitoid rocks exhibit depletion of incompatible HFS elements and enrichment in LIL elements (see Figure 12g–i). According to Arculus [65], these characteristics might be the product of a subduction event or crustal contamination during the ascent of the magma to the surface. Multi-element diagrams (Figure 12h) that show negative anomalies in Nb and Ti might be explained by the preservation of these elements in minerals like rutile and titanite in subduction zones [66,67], with this feature representing the most typical aspect of arc magmatism [68,69,70]. Nevertheless, spider diagrams (see Figure 12h) may reveal unpredictable Pb anomaly behavior that exhibits both positive and negative anomalies in the granitoid samples. This behavior can be explained by the preservation of Pb inside the source at varying levels of partial melting of the mantle source and by interactions between slab-melts produced at various mantle depths [71]. Additionally, the modest negative anomaly in the Eu element might be caused by the preservation of feldspar mineral at the source during the partial melting process or by the dominating fractionation of the feldspar mineral during the formation of these rocks [71].
The felsite dike samples are depleted in HFSE (e.g., Nb, Th, Zr) and enriched in LILE (e.g., K, Rb, Sr, Ba) (Figure 14). This feature indicates partial melting from an enriched lithospheric mantle source that was significantly contaminated with crustal components (having trace amounts of Cu, Ni, Au, and PGE-rich sulfides). Furthermore, fluids, particularly those released from the subducted slab, caused metasomatism of the subducted lithosphere during the active subduction [4]. Small-volume, hydrous, and sulfur-poor magmas are generated by remelting the metasomatized subducted lithosphere, forming the post-subduction volcanic rocks (e.g., Dokhan volcanic and felsite dike), and their metals are subsequently partitioned and exsolved in hydrothermal fluids.

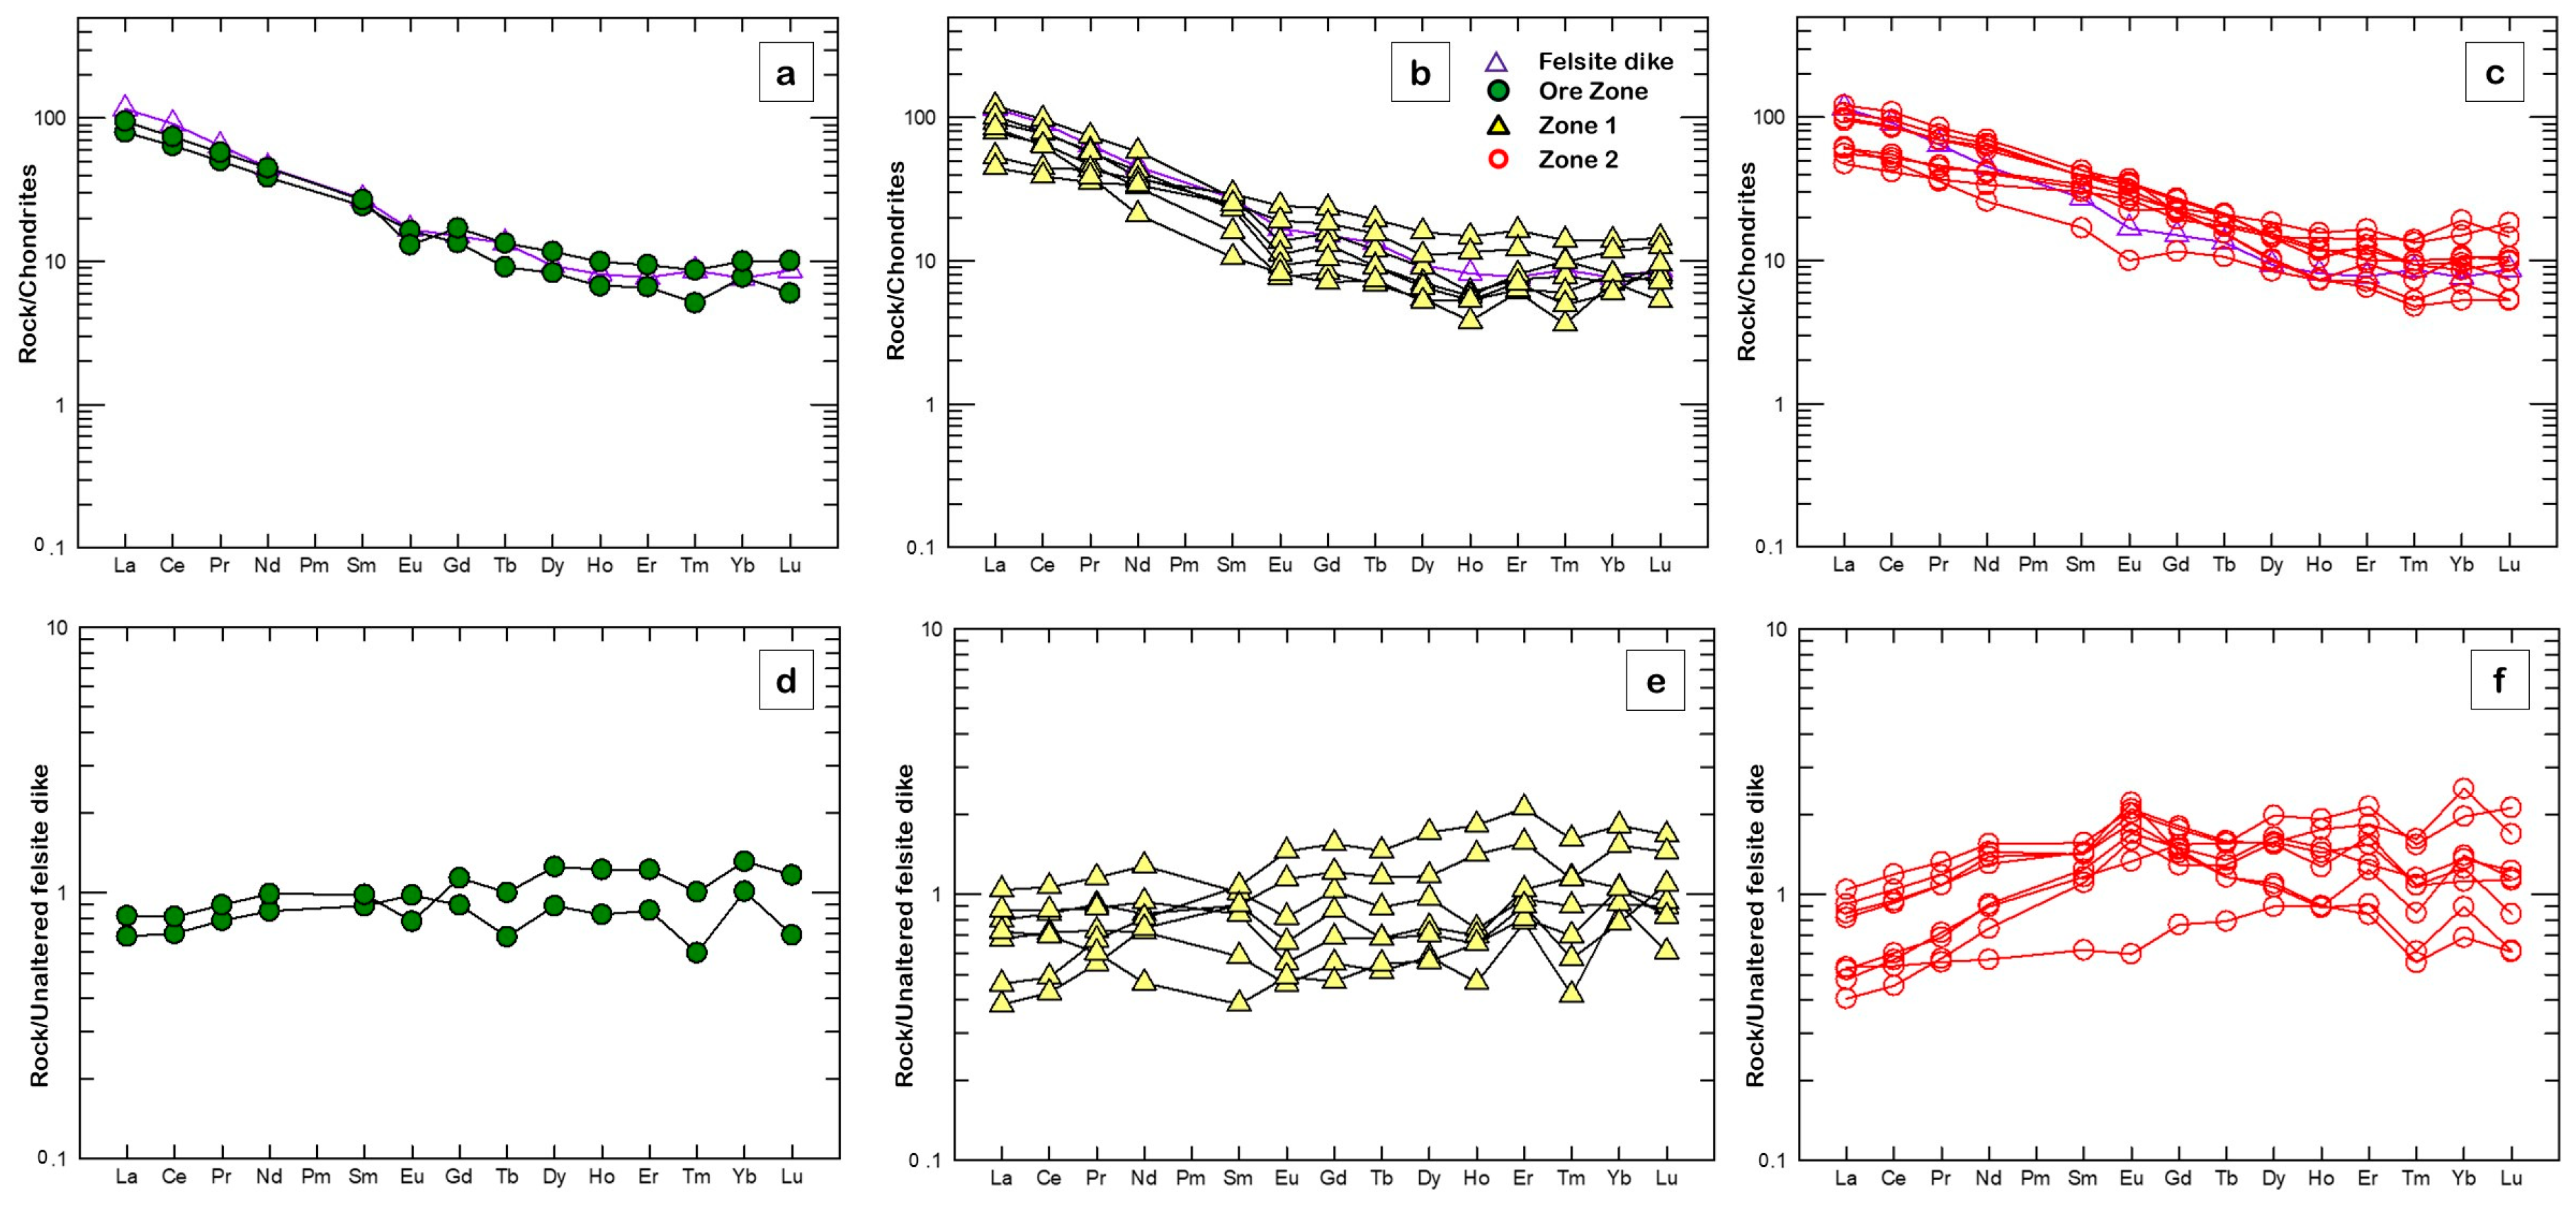
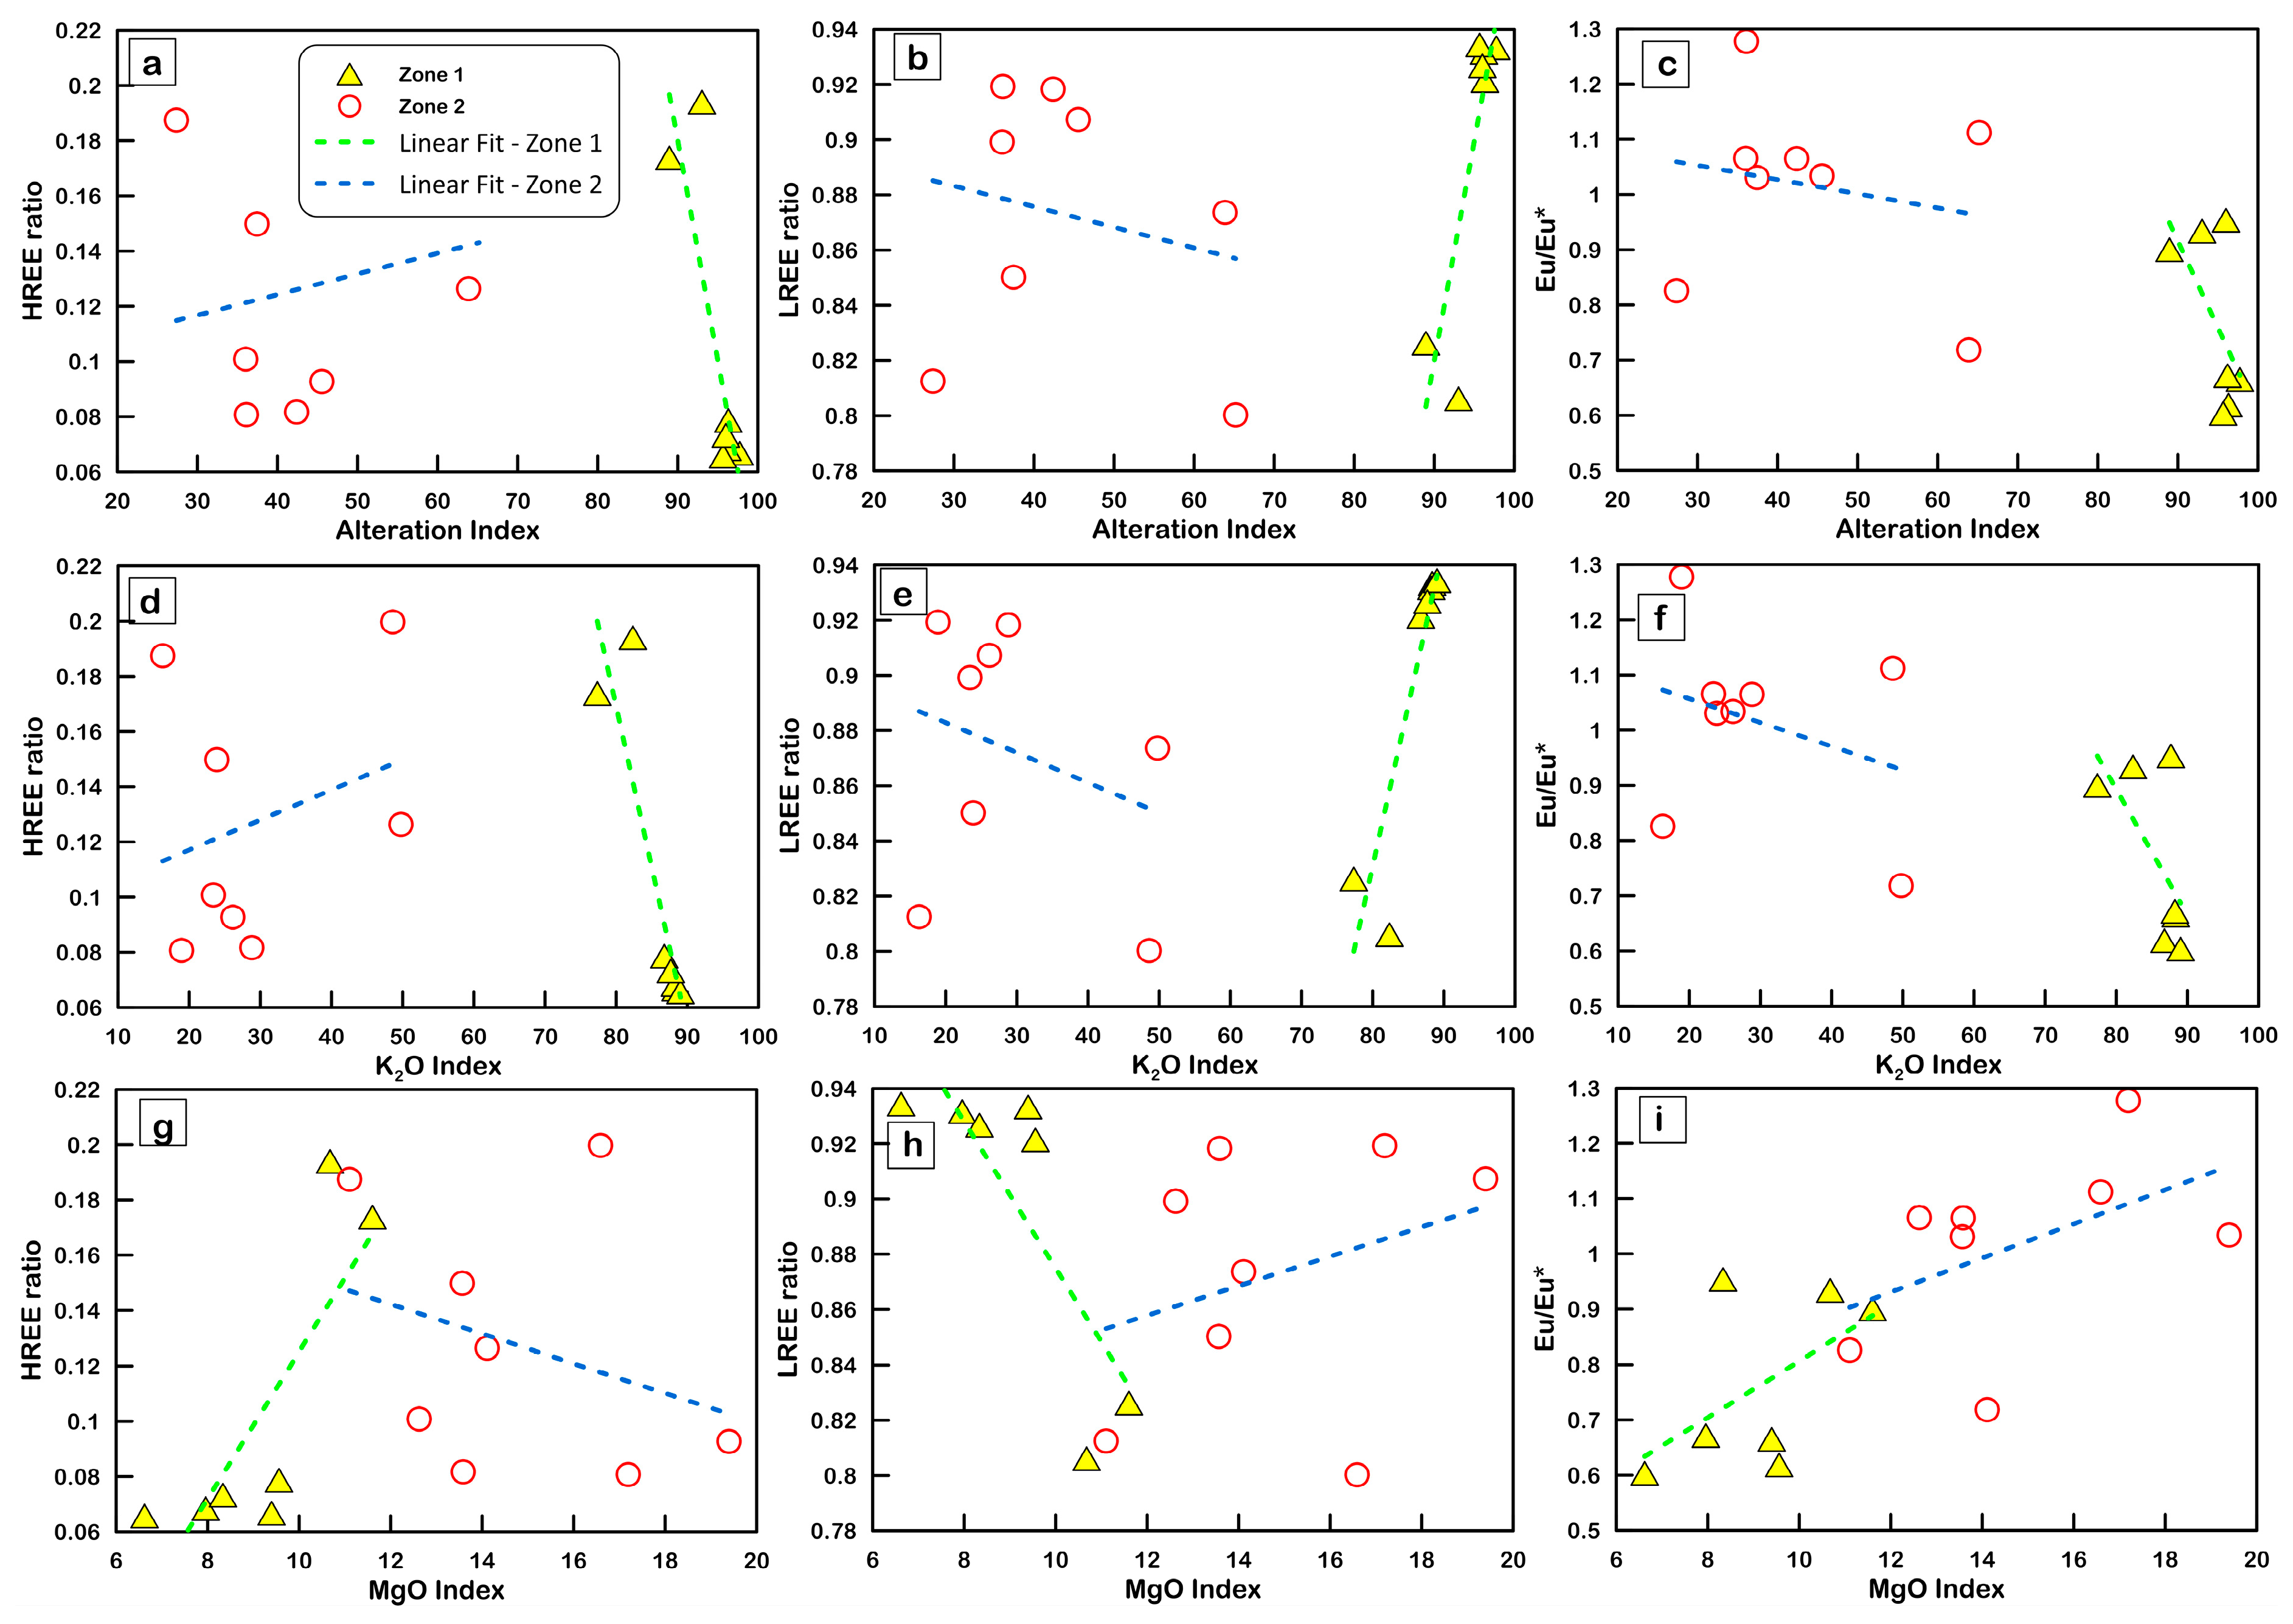
6.3. REE Behavior during the Alteration Process and Gold Deposition

In general, the REE amount in hydrothermal fluids is usually low, although it tends to rise when the pH decreases [72]. In the aqueous solutions, REEs are transported as complexes, where the ionic complexing plays a significant role in transporting and precipitating the REEs and HFSE in magmatic-hydrothermal systems [2,73,74]. Moreover, the REE patterns of a rock provide geochemical evidence on the origin, petrogenetic history, degree of fractionation, efficient index (relating to the fluid source), and understanding of the evolution of hydrothermal alteration [75,76,77,78,79]. The REE data analysis of the ore zone (highly altered felsite dikes) and the different alteration zones are shown in Table 2 and Table 3. The patterns of REE normalized to chondrite of ore zone and the different alteration zones both illustrate the behavior of the REE in the hydrothermal system. Enrichment of LREE relative to HREE, and slight depletion of erratic Eu, especially in Zone-2 relative to chondrite, have been reported (Figure 15a–c). The reason is that the LREEs are more susceptible to mobility throughout the strong alteration than HREE [80]. Nevertheless, when normalized to the unaltered felsite dike samples, both LREE and HREE patterns exhibit flat normal anomalies, except for a few altered samples in alteration zone-1 that show Eu depletion due to plagioclase fractionation and alteration to sericite and carbonate (Figure 15d–f). The distribution of Eu is particularly important because of its availability in two oxidation states, divalent (Eu2+) and trivalent (Eu3+) depending on oxygen fugacity, therefore the Eu anomaly decreases with increasing oxygen fugacity and temperature. Eu3+ remains stable in the solution under oxidizing conditions, while it can be reduced to Eu2+ under a reducing environment, so observed Eu-anomalies may then reflect a reducing environment [81]. The negative Eu anomaly is mainly organized by replacing Ca in the early commitment of the divalent state within the alteration of plagioclase to sericite, while the enrichment of the LREEs is due to the alteration [82]. Consistent with the results of LREE and HREE in ore body (altered felsite dikes), alteration zone-1 and zone-2 reflected the role of slab-derived fluid in the mantle wedge; furthermore, the alteration fluid was released from the subduction slap [83,84].
One of the most beneficial methods to help understand the REEs behavior in the different alteration zones is to compare the REE parameters [LREE ratio (∑LREE/∑REE), HREE ratio (∑HREE/∑REE), and Eu-anomaly (Eu/Eu*)] of the altered rocks with the different geochemical exploration indices. The alteration index (A.I.), MgO index (M.I.), and K2O index (K.I.) are calculated by the following equations according to Shikazono, et al. [85]:
A.I. = (MgO + K2O)/(Na2O + K2O + CaO + MgO) × 100
M.I. = MgO/(Na2O + K2O + CaO + MgO) × 100
K.I. = K2O/(Na2O + K2O + CaO + MgO) × 100
The A.I. and K.I. of most samples in alteration zone-1 show a negative correlation with the HREE ratio and Eu/Eu*. However, they show a positive correlation with the LREE ratio (Figure 16a–f). The M.I. shows negative correlation with LREE ratio and positive correlation with both HREE ratio and Eu/Eu* (Figure 16g–i). This attribute is due to the mobility of LREEs in the hydrothermal alteration while the Fe-alteration relatively controls the mobility of the HREEs [86]. Moreover, the presence of sericite, kaolinite, and quartz in alteration zone-1s suggests LREE enrichments [87]. The alteration zone-2 samples are randomly distributed and often exhibit a negative correlation of A.I. and K.I. with the LREE ratio and Eu/Eu* and a positive correlation with the HREE ratio (Figure 16a–f). The M.I shows a negative correlation with the HREE ratio and displays a positive correlation with both the LREE ratio and Eu/Eu*, indicating that the LREEs (+Eu) have been incorporated in the Mg-bearing minerals (e.g., chlorite) [88,89] (Figure 16g–i). Furthermore, the increasing M.I. with the loss of HREE within alteration zone-2 suggests a low solubility of HREE in alkaline hydrothermal solutions during chlorite and carbonate alterations [90,91,92].

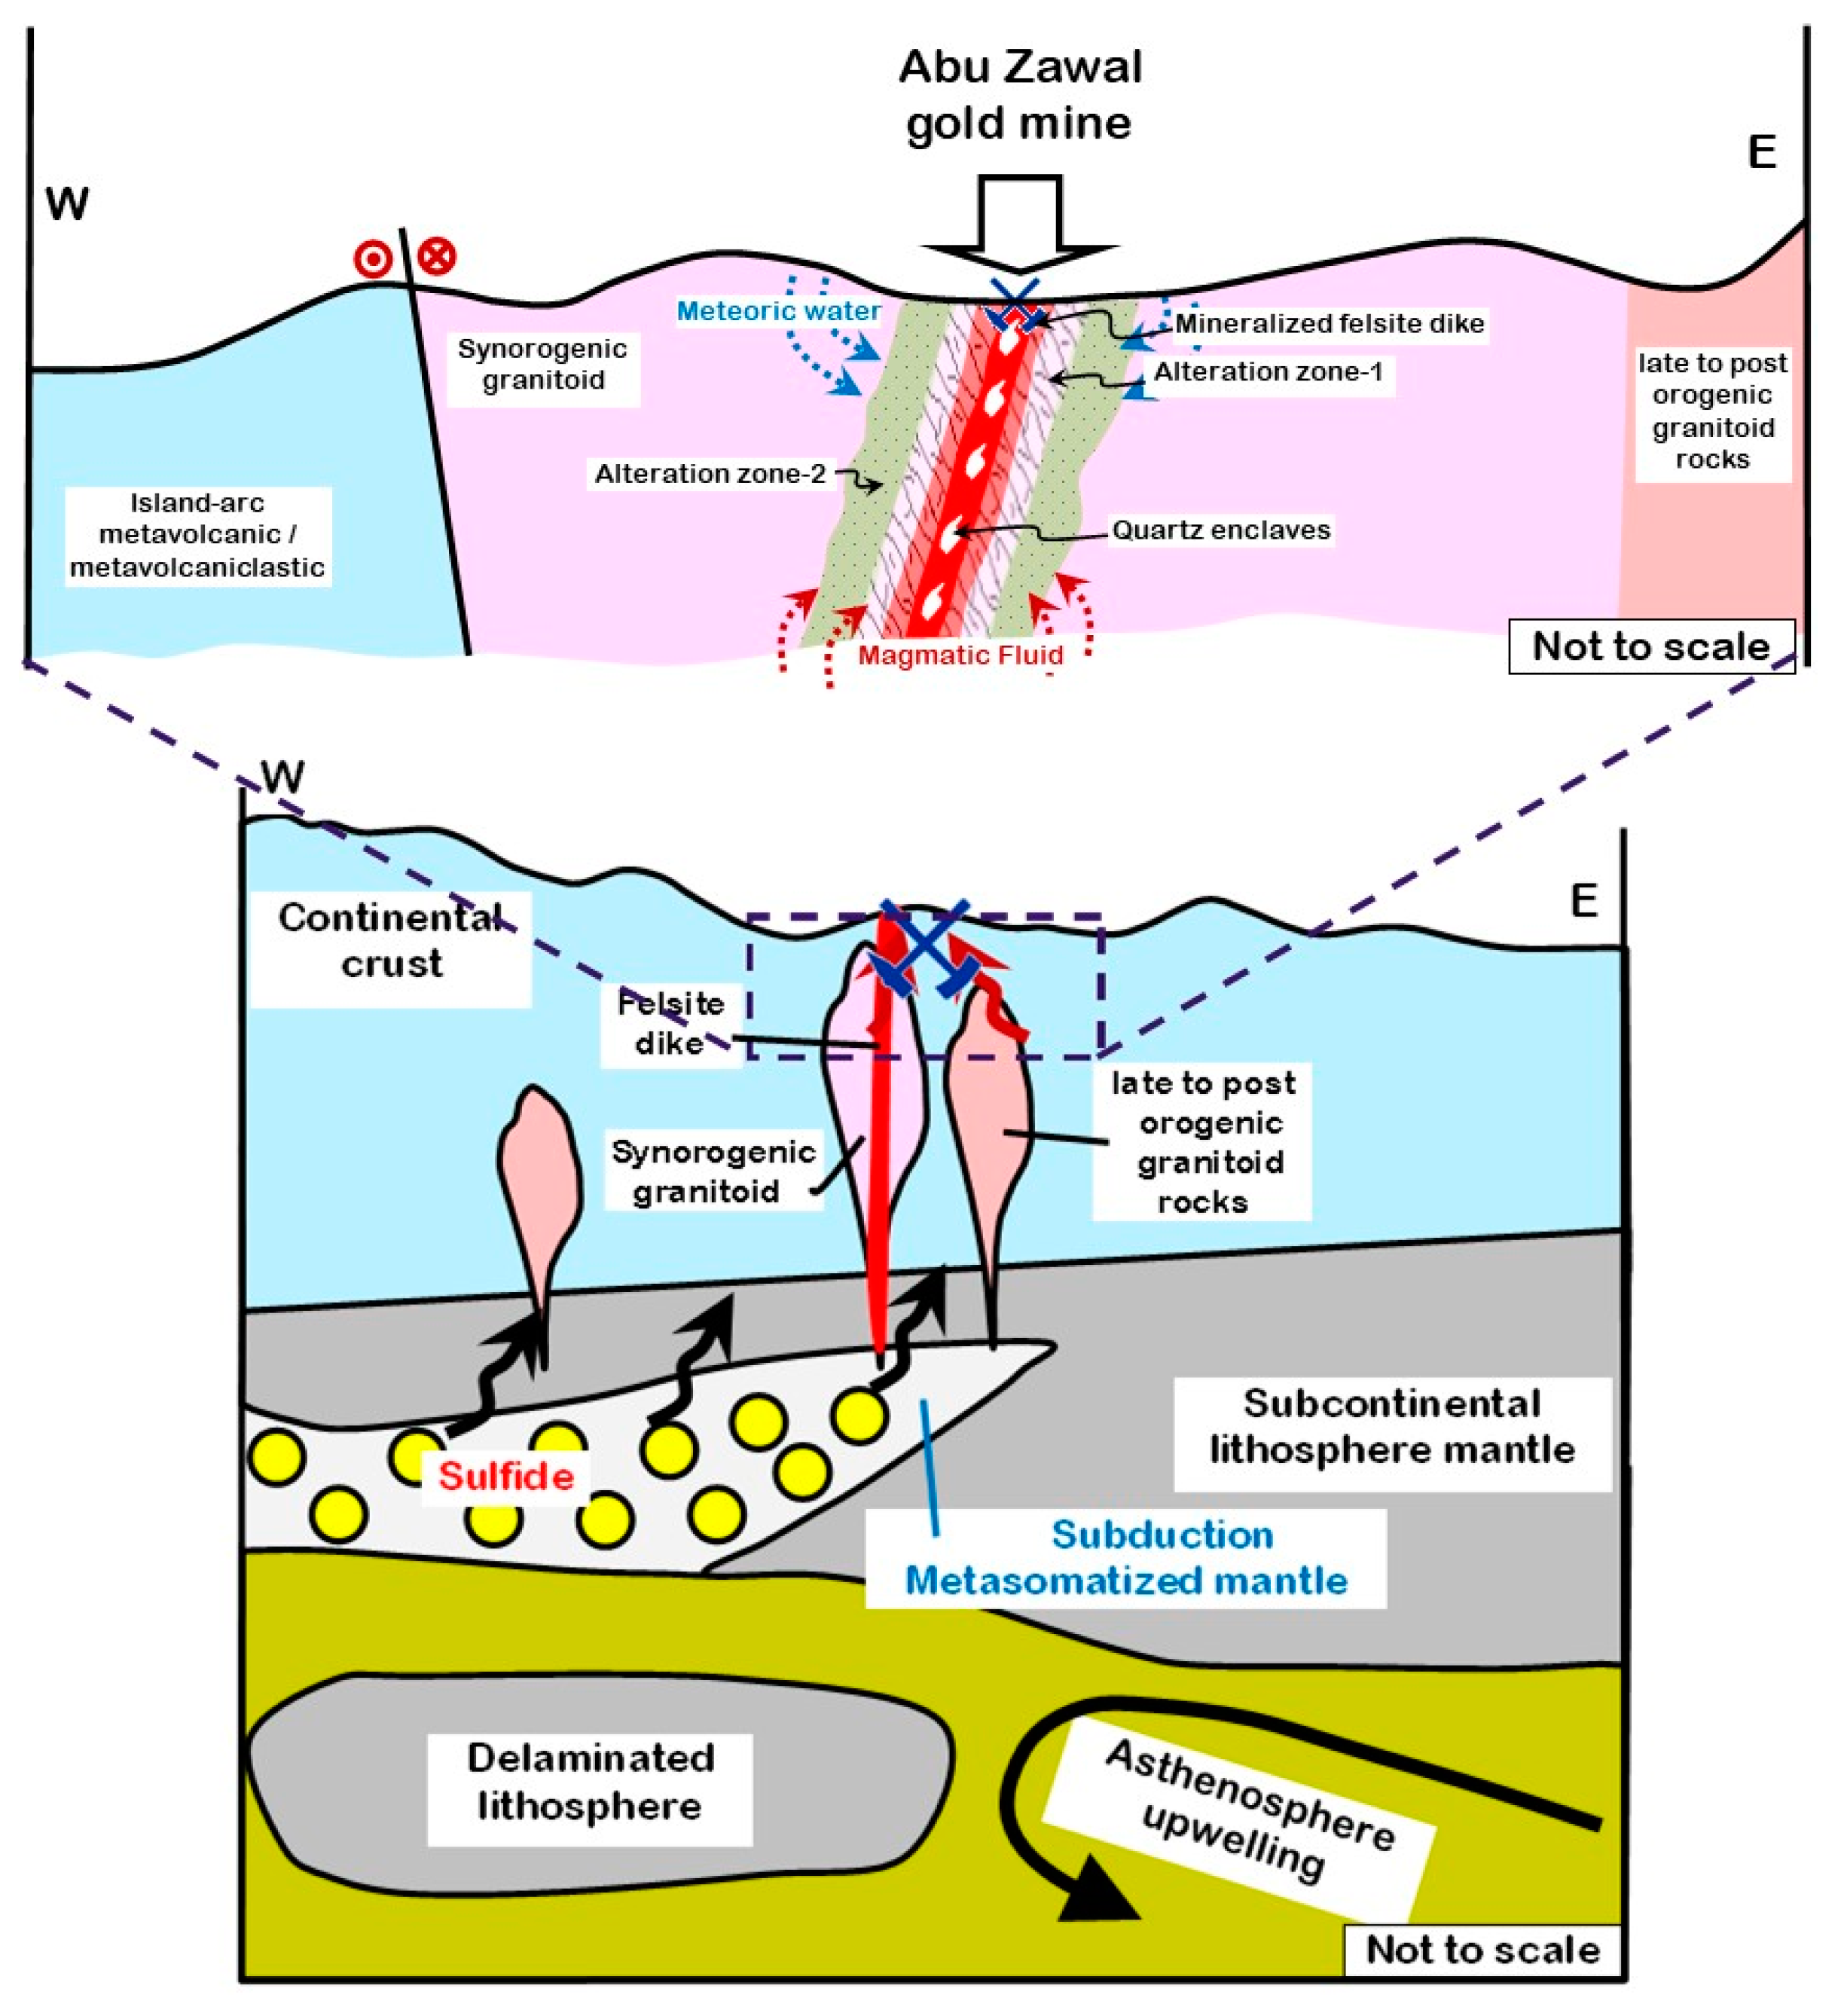
6.4. Tectono-Magmatic Controls of Post-Subduction Gold Mineralization at Abu Zawal Area

The occurrences of post-subduction gold mineralization in orogenic environments suggests that post-subduction magmatism may be crucial in broadening the variety of ore-forming conditions [1,93,94]. Post-subduction (or non-arc) deposits suggest that ore-formation conditions for orogenic, IRGS, porphyry, skarn, and epithermal vein deposit types may overlap. However, several transient geodynamic scenarios can be depicted to identify various mineralizing systems. For instance, pulses of excessive heat, magmatism, and hydrothermal activity are caused by fluctuating plate-boundary kinematics throughout post-subduction slab break-off and sub-continental lithospheric mantle delamination (Figure 17) [95]. These processes might be especially important to enable the necessary mass and energy flux for gold mineralization in the weak collisional settings when crustal thickening is insufficient to generate regional metamorphism to the greenschist-amphibolite facies [1,96].
The Abu Zawal region is made up of a variety of Late Precambrian igneous and metamorphic rocks. The metamorphic rocks are represented by island-arc metavolcanic and metavolcaniclastic that have been intruded by syn- to late orogenic subduction-related granitoids and then have been cut by post-subduction magmatism and volcanism, which are either represented by a variety of dike swarms and Dokhan volcanics (rhyolite porphyry). These dike swarms are mostly rhyolitic, rhyodacitic and andesitic in composition (Figure 17). It is likely that the felsic dikes and granitoid rocks, which have major and trace element geochemical characteristics typical of calc-alkaline rhyolite and metaluminous I-type granites, respectively, formed in a late-orogenic environment. Their fractionated LREE relative to HREE patterns indicate either generation from subduction-modified source material or formation in a subduction-related environment. Moreover, their high Sr/Y and La/Yb magmas were produced by partial melting of subduction-metasomatized lower crustal rocks during the lithospheric expansion after the lithospheric thickening throughout arc magmatism.
Botros [97] hypothesized volcanic activity as a source of sulfur for gold mineralization in some gold deposits in Egyptian Eastern Desert, such as the Semna mine area [98]. This is supported by the presence of several sulfide-bearing acidic to intermediate dikes, which may impose further constraints on a volcanic sulfur source [97]. The gold-sulfide formation in Abu Zawal (Fatira) area along with extensional tectonics is associated with fracture-controlled subvolcanic dikes represented by NE-trending altered felsite and rhyolite dikes. Chalcopyrite, pyrite, and rare gold are disseminated throughout the altered felsite dikes, hydrothermal breccias, some quartz enclaves, and wall-rock replacements. Two major alteration zones, sericite-kaolinite-quartz-pyrite-albite alteration zone-1 and outer chlorite + calcite + dolomite-albite sericite alteration zone-2, are related to this gold mineralization (Figure 17). These alteration assemblages. slightly resemble the phyllic alteration associated with carbonate alteration, implying that they formed in acidic (4.5–7 pH) [99] and moderate temperature conditions (~250–350 °C measured from the fluid inclusion studies of Abu-Alam et al. [13], Abd El Monsef, et al. [14], Murr [36]). According to the geochemical properties of the different alteration types, LREEs are more prone to mobility than HREEs during the main stage of alteration, which manifests the contribution of slab-derived fluid to the mantle wedge, on which fluid was released from the subduction slab. Furthermore, the transition of the alteration system from sericite to outer chlorite and the replacement of the magnetite by martite provide further evidence of the slow cooling and neutralization of the collapsing hot acid fluids [100]. In other words, a large mass loss in the altered rocks which is indicated by mass balance calculations, is compatible with fluid/wallrock ratios greater than unity and pH conditions that are close to neutral. Given the strong association between gold and sulfide minerals (pyrite) and the relatively low salinity mineralizing fluid [14,36], it is reasonable to assume that gold was transported in the fluid as a gold-sulfide complex. The gold-sulfide complex was precipitated from the fluid on one hand by a reaction of sulfide with Fe from the wallrock and decomposed on the other by ex-solution of the CO2-H2O phase, leading to pyrite formation and concurrent gold deposition. Consequently, the gold is thought to have migrated to the altered felsite dike with silica released throughout the numerous events of alterations indicated by sericite-kaolinite-quartz-pyrite-albite alteration types in alteration zone-1. Finally, the hydrothermal alteration and gold-sulfide mineralization at the Abu Zawal (Fatira) mine can be systematically related to post-subduction oxidized granitic and subvolcanic magmatism and associated hydrothermal systems, most likely linked to the felsite dikes that are similar to the post-Hammamat felsite porphyries in the Eastern Desert of Egypt, which have U-Pb zircon dating of 607 ± 2 Ma by Zoheir, et al. [24], and are assumed to have originated shortly after and/or concurrently with the high-K calc–alkaline felsic member Dokhan Volcanics, 618 ± 4 Ma [101].

7. Conclusions

In the Abu Zawal area, felsite and intermediate dikes and quartz veins are substantially controlled by fault and joint systems striking in different directions. The granitic rocks are mainly calc-alkaline, metaluminous I-type granites. These rocks, along with the felsite dikes, exhibit variable enrichments in LREE relative to HREE, suggestive of a subduction-related setting. The absence of remarkable association with shear zone(s) and the close specific association with sulfide-rich felsic dikes and hematitic hydrothermal quartz breccias suggest a genetic link between the host felsic magmatic rocks and the gold-sulfide mineralization. Hydrothermal alteration, as manifested by sericite-kaolinite-quartz-pyrite-albite and chlorite + calcite + dolomite-albite-sericite assemblages, is associated with the gold mineralized veins and sulfide-bearing felsic dikes. Chalcopyrite, pyrite, and gold disseminations occur within the sericite-kaolinite-quartz-pyrite-albite assemblage. Barite, magnetite, and specular hematite occur in alteration zone-2. Supergene malachite and goethite are associated with disseminated carbonate minerals.
The LREEs in the felsite dikes and granitic host rocks were noticeably more susceptible to mobility during the gold-sulfide hydrothermal system compared to the HREEs. Generally, the LREEs are markedly depleted (mobilized) in the sericite-pyrite alteration zones and silicified wallrocks, reflecting high fluid:wallrock ratios and relatively high temperatures alteration conditions. The available fluid inclusion data suggest a high geothermal gradient associated with the gold-sulfide mineralization in the study area, coupled with sericitization and pyritization of the host rocks, may imply that gold-sulfide mineralization at the Abu Zawal (Fatira) mine was related to oxidized granitic and sub-volcanic magmatism, which was widespread at the inferred time period based on available U-Pb ages of the widespread felsic porphyries and dikes (post-Hammamat felsite) in the NED (607 ± 2 Ma) [24], post-dating the onset of the Dokhan Volcanics extrusion (618 ± 4 Ma) [101].

Author Contributions

Conceptualization, R.M.E.-W., J.J., B.Z. and A.A.; methodology, R.M.E.-W., M.K. (Mustafa Kumral), M.K. (Mustafa Kaya) and A.A.; software, R.M.E.-W. and A.A.; validation, R.M.E.-W. and A.A.; formal analysis, R.M.E.-W., M.K. (Mustafa Kumral), M.K. (Mustafa Kaya) and A.A.; investigation, R.M.E.-W. and A.A.; resources, R.M.E.-W. and A.A.; data curation, R.M.E.-W. and A.A.; writing—original draft preparation, R.M.E.-W. and A.A.; writing—review and editing, R.M.E.-W., J.J., B.Z. and A.A.; visualization, R.M.E.-W. and A.A.; supervision, J.J., B.Z. and A.A.; R.M.E.-W. and A.A. took part in the fieldwork. All authors have read and agreed to the published version of the manuscript.

Funding

This research received no external funding.

Data Availability Statement

Data is available in Table 1, Table 2, Table 3, Table 4 and Table 5.

Acknowledgments

The authors would like to thank the National Science Foundation of China (NSFC: 92162213). They express their gratitude to the group of Geochemistry Research Laboratories, Istanbul Technical University, Turkey (ITU-JAL labs) for providing technical supports during laboratory work. Refaey M. El-Wardany is very grateful to the Geology Department Faculty of Science at Al-Azhar University (Assiut Branch), the China Scholarship Council, and Chang’an University for their support during this research. Amr Abdelnasser would like to thank the Ministry of Higher Education of Egypt as well as the Scientific and Technological Research Council of Turkey (2221-TUBITAK Fellowship Program) for supporting his research stay at Istanbul Technical University (Turkey) as a postdoctoral fellow. The handling editor and three anonymous reviewers are acknowledged for their insightful comments and suggestions that improved the presentation and interpretations of our work. Peter Johnson is thanked for his valued remarks on the early version of this paper.

Conflicts of Interest

The authors declare no conflict of interest.

References

  1. Richards, J.P. Postsubduction porphyry Cu-Au and epithermal Au deposits: Products of remelting of subduction-modified lithosphere. Geology 2009, 37, 247–250. [Google Scholar] [CrossRef]
  2. Richards, J.P. Magmatic to hydrothermal metal fluxes in convergent and collided margins. Ore Geol. Rev. 2011, 40, 1–26. [Google Scholar] [CrossRef]
  3. Locmelis, M.; Fiorentini, M.L.; Rushmer, T.; Arevalo, R., Jr.; Adam, J.; Denyszyn, S.W. Sulfur and metal fertilization of the lower continental crust. Lithos 2016, 244, 74–93. [Google Scholar] [CrossRef] [Green Version]
  4. Fiorentini, M.L.; LaFlamme, C.; Denyszyn, S.; Mole, D.; Maas, R.; Locmelis, M.; Caruso, S.; Bui, T.-H. Post-collisional alkaline magmatism as gateway for metal and sulfur enrichment of the continental lower crust. Geochim. Cosmochim. Acta 2018, 223, 175–197. [Google Scholar] [CrossRef]
  5. Tomkins, A.G.; Rebryna, K.C.; Weinberg, R.F.; Schaefer, B.F. Magmatic sulfide formation by reduction of oxidized arc basalt. J. Petrol. 2012, 53, 1537–1567. [Google Scholar] [CrossRef] [Green Version]
  6. Hedenquist, J.W.; Lowenstern, J.B. The role of magmas in the formation of hydrothermal ore deposits. Nature 1994, 370, 519–527. [Google Scholar] [CrossRef]
  7. Johnson, P. The Civilization of Ancient Egypt; Harper Collins: New York, NY, USA, 1999. [Google Scholar]
  8. Botros, N.S. A new classification of the gold deposits of Egypt. Ore Geol. Rev. 2004, 25, 1–37. [Google Scholar] [CrossRef]
  9. Zoheir, B.A.; Johnson, P.R.; Goldfarb, R.J.; Klemm, D.D. Orogenic gold in the Egyptian Eastern Desert: Widespread gold mineralization in the late stages of Neoproterozoic orogeny. Gondwana Res. 2019, 75, 184–217. [Google Scholar] [CrossRef]
  10. El Aref, M.; Abd El-Rahman, Y.; Zoheir, B.; Surour, A.; Helmy, H.M.; Abdelnasser, A.; Ahmed, A.H.; El-Ahmadi Ibrahim, M. Mineral Resources in Egypt (I): Metallic Ores. In The Geology of Egypt; Hamimi, Z., El-Barkooky, A., Martínez Frías, J., Fritz, H., Abd El-Rahman, Y., Eds.; Springer International Publishing: Cham, Germany, 2020; pp. 521–587. [Google Scholar]
  11. Bakhit, F.S. Statistical analysis of structural data of Fatira Area, Central Eastern Desert, Egypt. Ann. Geol. Surv. Egypt 1986, 16, 315–319. [Google Scholar]
  12. Dourgham, A.; El Zalaky, M.; Neigm, S. Gold-sulfides hosted in fractured felsite dykes, Fatiri deposit, North Eastern Desert, Egypt. Ann. Geol. Surv. Egypt 2009, V.XXXI, 247–266. [Google Scholar]
  13. Abu-Alam, T.; Abd El Monsef, M.; Grosch, E. Shear-zone hosted gold mineralization of the Arabian–Nubian Shield: Devolatilization processes across the greenschist–amphibolite-facies transition. Geol. Soc. Lond. Spec. Publ. 2019, 478, 287–313. [Google Scholar] [CrossRef]
  14. Abd El Monsef, M.; Slobodník, M.; Salem, I.A. Characteristics and nature of gold-bearing fluids in Fatira area, North Eastern Desert of Egypt: Possible transition from intrusion-related to orogenic deposits. Arab. J. Geosci. 2020, 13, 1034. [Google Scholar] [CrossRef]
  15. Stoeser, D.B.; Camp, V.E. Pan-African microplate accretion of the Arabian Shield. Geol. Soc. Am. Bull. 1985, 96, 817–826. [Google Scholar] [CrossRef]
  16. Abdelsalam, M.G.; Stern, R.J. Sutures and shear zones in the Arabian-Nubian Shield. J. Afr. Earth Sci. 1996, 23, 289–310. [Google Scholar] [CrossRef]
  17. Abdelsalam, M.G.; Abdeen, M.M.; Dowaidar, H.M.; Stern, R.J.; Abdelghaffar, A.A. Structural evolution of the Neoproterozoic western Allaqi–Heiani suture, southeastern Egypt. Precambrian Res. 2003, 124, 87–104. [Google Scholar] [CrossRef]
  18. Johnson, P.; Andresen, A.; Collins, A.; Fowler, A.; Fritz, H.; Ghebreab, W.; Kusky, T.; Stern, R. Late Cryogenian–Ediacaran history of the Arabian–Nubian Shield: A review of depositional, plutonic, structural, and tectonic events in the closing stages of the northern East African Orogen. J. Afr. Earth Sci. 2011, 61, 167–232. [Google Scholar] [CrossRef]
  19. Kröner, A.; Grieling, R.; Reischmann, T.; Hussein, I.; Stern, R.; Dürr, S.; Krüger, J.; Zimmer, M. Pan-African crustal evolution in the Nubian segment of northeast Africa. Proterozic Lithospheric Evol. 1987, 17, 235–257. [Google Scholar]
  20. Abd El-Rahman, Y.; Polat, A.; Dilek, Y.; Fryer, B.J.; El-Sharkawy, M.; Sakran, S. Geochemistry and tectonic evolution of the Neoproterozoic incipient arc–forearc crust in the Fawakhir area, Central Eastern Desert of Egypt. Precambrian Res. 2009, 175, 116–134. [Google Scholar] [CrossRef]
  21. Akaad, M.K.; Abu El Ela, A. Geology of the Basement Rocks in the Eastern Half of the Belt between Latitudes 25°30′ and 26°30′ N, Central Eastern Desert, Egypt: Covering Parts of Sheets NG 36 K2, K3, L1 and NG 36 G5, G6, H4; Arab Republic of Egypt, Ministry of Industry and Technology, the Geological Survey of Egypt: Cairo, Egypt, 2002. [Google Scholar]
  22. Stern, R.J. Arc-assembly and continental collision in the Neoproterozoic African orogen: Implications for the consolidation of Gondwanaland. Annu. Rev. Earth Planet. Sci. 1994, 22, 319–351. [Google Scholar] [CrossRef]
  23. Eliwa, H.; Kimura, J.-I.; Itaya, T. Late Neoproterozoic Dokhan Volcanics, North Eastern Desert, Egypt: Geochemistry and petrogenesis. Precambrian Res. 2006, 151, 31–52. [Google Scholar] [CrossRef]
  24. Zoheir, B.; Zeh, A.; El-Bialy, M.; Ragab, A.; Deshesh, F.; Steele-MacInnis, M. Hybrid granite magmatism during orogenic collapse in the Eastern Desert of Egypt: Inferences from whole-rock geochemistry and zircon U–Pb–Hf isotopes. Precambrian Res. 2021, 354, 106044. [Google Scholar] [CrossRef]
  25. Stern, R.J.; Hedge, C.E. Geochronologic and isotopic constraints on late Precambrian crustal evolution in the Eastern Desert of Egypt. Am. J. Sci. 1985, 285, 97–127. [Google Scholar] [CrossRef]
  26. El-Gaby, S.; List, F.; Tehrani, R. Geology, evolution and metallogenesis of the Pan-African Belt in Egypt. In The Pan-African Belt of Northeast Africa and Adjacent Areas: Tectonic Evolution and Economic Aspects of a Late Proterozoic Orogen; El-Gaby, S., Greiling, R., Eds.; Friedr. Vieweg & Sohn Verlagskatalog: Braunschweig/Wiesbaden, Germany, 1988; pp. 17–68. [Google Scholar]
  27. El-Gaby, S.; List, F.; Tehrani, R. The basement complex of the Eastern Desert and Sinai. In Geology of Egypt; Said, R., Ed.; Routledge: London, UK, 1990; pp. 175–184. [Google Scholar]
  28. Abd El-Wahed, M.; Hamimi, Z. The Egyptian Nubian Shield Within the Frame of the Arabian–Nubian Shield. In The Geology of the Egyptian Nubian Shield; Hamimi, Z., Arai, S., Fowler, A.-R., El-Bialy, M.Z., Eds.; Springer International Publishing: Cham, Switzerland, 2021; pp. 15–51. [Google Scholar]
  29. Johnson, P.R.; Woldehaimanot, B. Development of the Arabian-Nubian Shield: Perspectives on accretion and deformation in the northern East African Orogen and the assembly of Gondwana. Geol. Soc. Lond. Spec. Publ. 2003, 206, 289–325. [Google Scholar] [CrossRef]
  30. Hargrove, U.; Stern, R.; Kimura, J.-I.; Manton, W.; Johnson, P. How juvenile is the Arabian–Nubian Shield? Evidence from Nd isotopes and pre-Neoproterozoic inherited zircon in the Bi’r Umq suture zone, Saudi Arabia. Earth Planet. Sci. Lett. 2006, 252, 308–326. [Google Scholar] [CrossRef]
  31. Klemm, R.; Klemm, D. Gold and Gold Mining in Ancient Egypt and Nubia: Geoarchaeology of the Ancient Gold Mining Sites in the Egyptian and Sudanese Eastern Deserts; Springer Science & Business Media: Berlin/Heidelberg, Germany, 2012. [Google Scholar]
  32. Abu El-Leil, I.; Sweifi, B.; El Gammal, A. Petrography and geochemistry of some metavolcanics, Dokhan volcanics and younger volcanics along wadi Fatira El Zarqa, Central Eastern Desert, Egypt. Al-AZhar Bull. Sci. 1991, 2, 167–192. [Google Scholar]
  33. Khalaf, E.E.D.A.H. Stratigraphy, facies architecture, and palaeoenvironment of Neoproterozoic volcanics and volcaniclastic deposits in Fatira area, Central Eastern Desert, Egypt. J. Afr. Earth Sci. 2010, 58, 405–426. [Google Scholar] [CrossRef]
  34. Abu El-Leil, I.; Bekhit, M.H.; Tolba, A.S.; Moharem, A.F.; Shahin, T.M. Geological, Structural and Petrotectonical Aspectable Features of Neoproterozoic Rocks, Gabal El Dob Area, Northeastern Desert, Egypt. Int. J. Sci. Eng. Appl. Sci. 2015, 1, 332–350. [Google Scholar]
  35. Marten, B. Reconnaissance of the gold deposits of the Eastern Desert of Egypt; Parts I and II; Geological Survey of Egypt: Cairo, Egypt, 1986; pp. 1–44. [Google Scholar]
  36. Murr, A. Genesis of gold mineralization of Fatria, Gidami, Atalla and Hangaliya, Eastern Desert of Egypt. Münchner Geol. Hefte A 1999, 27, 202. [Google Scholar]
  37. Abd El Nabi, A.; Prokhorov, D.; Yakoop, F. Results of prospecting for nonferrous metals and gold in the area of Wadis, El Atrsh, El Ghozah and Fatira El Beida, North Eastern Desert of Egypt. In Internal Report; No. 511978; The geological Survey of Egypt: Cairo, Egypt, 1978; 145p. [Google Scholar]
  38. Carr, M. Igpet 2007 for Windows XP or Vista; Terra Softa Inc.: Somerset, NJ, USA, 2007. [Google Scholar]
  39. Coelho, J. GEOISO—A Windows™ program to calculate and plot mass balances and volume changes occurring in a wide variety of geologic processes. Comput. Geosci. 2006, 32, 1523–1528. [Google Scholar] [CrossRef]
  40. Gresens, R.L. Composition-volume relationships of metasomatism. Chem. Geol. 1967, 2, 47–65. [Google Scholar] [CrossRef]
  41. Grant, J.A. Isocon analysis: A brief review of the method and applications. Phys. Chem. Earth Parts A/B/C 2005, 30, 997–1004. [Google Scholar] [CrossRef]
  42. Armstrong, J.T. Citzaf-a package of correction programs for the quantitative Electron Microbeam X-Ray-Analysis of thick polished materials, thin-films, and particles. Microbeam Anal. 1995, 4, 177–200. [Google Scholar]
  43. Le Maitre, R.W.B.; Dudek, P.; Keller, A.; Lameyre, J.; Le Bas, J.; Sabine, M.; Schmid, P.; Sorensen, R.; Streckeisen, H.; Woolley, A. A classification of igneous rocks and glossary of terms: Recommendations of the International Union of Geological Sciences, Subcommission on the Systematics of Igneous Rocks; International Union of Geological Sciences, Blackwell: Hoboken, NJ, USA, 1989. [Google Scholar]
  44. Moghazi, A. Geochemistry and petrogenesis of a high-K calc-alkaline Dokhan Volcanic suite, South Safaga area, Egypt: The role of late Neoproterozoic crustal extension. Precambrian Res. 2003, 125, 161–178. [Google Scholar] [CrossRef]
  45. Wood, D.A. The application of a Th-Hf-Ta diagram to problems of tectonomagmatic classification and to establishing the nature of crustal contamination of basaltic lavas of the British Tertiary Volcanic Province. Earth Planet. Sci. Lett. 1980, 50, 11–30. [Google Scholar] [CrossRef]
  46. Sun, S.-S.; McDonough, W. Chemical and isotopic systematics of oceanic basalts: Implications for mantle composition and processes. Geol. Soc. Lond. Spec. Publ. 1989, 42, 313–345. [Google Scholar] [CrossRef]
  47. Miyashiro, A.; Shido, F. Tholeiitic and calc-alkalic series in relation to the behaviors of titanium, vanadium, chromium, and nickel. Am. J. Sci. 1975, 275, 265–277. [Google Scholar] [CrossRef]
  48. Irvine, T.; Baragar, W. A guide to the chemical classification of the common volcanic rocks. Can. J. Earth Sci. 1971, 8, 523–548. [Google Scholar] [CrossRef]
  49. Stern, R.J. Petrogenesis and tectonic setting of Late Precambrian ensimatic volcanic rocks, Central Eastern Desert of Egypt. Precambrian Res. 1981, 16, 195–230. [Google Scholar] [CrossRef]
  50. Kuno, H. Differentiation of basalt magmas. In Basalts: The Poldervaart treatise on rocks of basaltic composition; Interscience Publishers: New York, NY, USA, 1968; Volume 2, pp. 623–688. [Google Scholar]
  51. Petro, W.L.; Vogel, T.A.; Wilband, J.T. Major-element chemistry of plutonic rock suites from compressional and extensional plate boundaries. Chem. Geol. 1979, 26, 217–235. [Google Scholar] [CrossRef]
  52. Shand, S. On the relations between silica, alumina, and the bases in eruptive rocks, considered as a means of classification. Geol. Mag. 1927, 64, 446–449. [Google Scholar] [CrossRef]
  53. Chappell, B.W.; White, A. I-and S-type granites in the Lachlan Fold Belt. Earth Environ. Sci. Trans. R. Soc. Edinb. 1992, 83, 1–26. [Google Scholar]
  54. El Bouseily, A.; El Sokkary, A. The relation between Rb, Ba and Sr in granitic rocks. Chem. Geol. 1975, 16, 207–219. [Google Scholar] [CrossRef]
  55. Ishihara, S. The magnetite-series and ilmenite-series granitic rocks. Min. Geol. 1977, 27, 293–305. [Google Scholar]
  56. Pearce, J.A.; Harris, N.B.; Tindle, A.G. Trace element discrimination diagrams for the tectonic interpretation of granitic rocks. J. Petrol. 1984, 25, 956–983. [Google Scholar] [CrossRef] [Green Version]
  57. Taylor, S.R.; McLennan, S.M. The Continental Crust: Its Composition and Evolution; Blackwell: Oxford, UK, 1985; p. 349. [Google Scholar]
  58. Frost, B.R.; Barnes, C.G.; Collins, W.J.; Arculus, R.J.; Ellis, D.J.; Frost, C.D. A geochemical classification for granitic rocks. J. Petrol. 2001, 42, 2033–2048. [Google Scholar] [CrossRef] [Green Version]
  59. Large, R.R.; Gemmell, J.B.; Paulick, H.; Huston, D.L. The alteration box plot: A simple approach to understanding the relationship between alteration mineralogy and lithogeochemistry associated with volcanic-hosted massive sulfide deposits. Econ. Geol. 2001, 96, 957–971. [Google Scholar] [CrossRef]
  60. Ishikawa, Y.; Sawaguchi, T.; Iwaya, S.; Horiuchi, M. Delineation of prospecting targets for Kuroko deposits based on modes of volcanism of underlying dacite and alteration halos. Min. Geol. 1976, 26, 105–117. [Google Scholar]
  61. Paulick, H.; Herrmann, W.; Gemmell, J.B. Alteration of felsic volcanics hosting the Thalanga massive sulfide deposit (Northern Queensland, Australia) and geochemical proximity indicators to ore. Econ. Geol. 2001, 96, 1175–1200. [Google Scholar] [CrossRef]
  62. Grant, J.A. The isocon diagram; a simple solution to Gresens’ equation for metasomatic alteration. Econ. Geol. 1986, 81, 1976–1982. [Google Scholar] [CrossRef]
  63. Barton, M.D.; Staude, J.-M.; Snow, E.A.; Johnson, D.A. Aureole systematics. Rev. Mineral. Geochem. 1991, 26, 723–847. [Google Scholar]
  64. Hanson, G.N. The application of trace elements to the petrogenesis of igneous rocks of granitic composition. Earth Planet. Sci. Lett. 1978, 38, 26–43. [Google Scholar] [CrossRef]
  65. Arculus, R.J. Aspects of magma genesis in arcs. Lithos 1994, 33, 189–208. [Google Scholar] [CrossRef]
  66. Ringwood, A.E. Slab-mantle interactions: 3. Petrogenesis of intraplate magmas and structure of the upper mantle. Chem. Geol. 1990, 82, 187–207. [Google Scholar] [CrossRef]
  67. McCulloch, M.T.; Gamble, J.A. Geochemical and geodynamical constraints on subduction zone magmatism. Earth Planet. Sci. Lett. 1991, 102, 358–374. [Google Scholar] [CrossRef]
  68. Fitton, J.; James, D.; Kempton, P.; Ormerod, D.; Leeman, W. The role of lithospheric mantle in the generation of late Cenozoic basic magmas in the western United States. J. Petrol. 1988, 331–349. [Google Scholar] [CrossRef]
  69. Pearce, J.A.; Bender, J.F.; De Long, S.E.; Kidd, W.S.F.; Low, P.J.; Güner, Y.; Saroglu, F.; Yilmaz, Y.; Moorbath, S.; Mitchell, J.G. Genesis of collision volcanism in Eastern Anatolia, Turkey. J. Volcanol. Geotherm. Res. 1990, 44, 189–229. [Google Scholar] [CrossRef]
  70. Kempton, P.; Fitton, J.; Hawkesworth, C.; Ormerod, D. Isotopic and trace element constraints on the composition and evolution of the lithosphere beneath the southwestern United States. J. Geophys. Res. Solid Earth 1991, 96, 13713–13735. [Google Scholar] [CrossRef]
  71. Varol, E.; Temel, A.; Yürür, T.; Gourgaud, A.; Bellon, H. Petrogenesis of the Neogene bimodal magmatism of the Galatean Volcanic Province, Central Anatolia, Turkey. J. Volcanol. Geotherm. Res. 2014, 280, 14–29. [Google Scholar] [CrossRef]
  72. Michard, A. Rare earth element systematics in hydrothermal fluids. Geochim. Cosmochim. Acta 1989, 53, 745–750. [Google Scholar] [CrossRef]
  73. Williams-Jones, A.E.; Migdisov, A.A.; Samson, I.M. Hydrothermal mobilisation of the rare earth elements–a tale of “ceria” and “yttria”. Elements 2012, 8, 355–360. [Google Scholar] [CrossRef]
  74. Paoli, G.; Dini, A.; Rocchi, S. Footprints of element mobility during metasomatism linked to a late Miocene peraluminous granite intruding a carbonate host (Campiglia Marittima, Tuscany). Int. J. Earth Sci. 2019, 108, 1617–1641. [Google Scholar] [CrossRef]
  75. Lottermoser, B. Rare earth elements and hydrothermal ore formation processes. Ore Geol. Rev. 1992, 7, 25–41. [Google Scholar] [CrossRef]
  76. Zou, H.; Zindler, A. Constraints on the degree of dynamic partial melting and source composition using concentration ratios in magmas. Geochim. Cosmochim. Acta 1996, 60, 711–717. [Google Scholar] [CrossRef]
  77. Zou, H. Trace element fractionation during modal and nonmodal dynamic melting and open-system melting: A mathematical treatment. Geochim. Cosmochim. Acta 1998, 62, 1937–1945. [Google Scholar] [CrossRef]
  78. Zou, H. Modeling of trace element fractionation during non-modal dynamic melting with linear variations in mineral/melt distribution coefficients. Geochim. Cosmochim. Acta 2000, 64, 1095–1102. [Google Scholar] [CrossRef]
  79. Takahashi, Y.; Yoshida, H.; Sato, N.; Hama, K.; Yusa, Y.; Shimizu, H. W-and M-type tetrad effects in REE patterns for water–rock systems in the Tono uranium deposit, central Japan. Chem. Geol. 2002, 184, 311–335. [Google Scholar] [CrossRef]
  80. Humphris, S.E. The mobility of the rare earth elements in the crust. In Developments in Geochemistry; Elsevier: Amsterdam, The Netherlands, 1984; Volume 2, pp. 317–342. [Google Scholar]
  81. Jie, Z.; Da-Long, T.; Tun-Wen-Meng, Y.-Z.-Q.; Yang, L. Typomorphic Characteristics of Arsenopyrite in the Bake Gold Deposit, Eastern Guizhou Province. Geoscience 2011, 25, 750. [Google Scholar]
  82. Rice, S.; Langmuir, C.; Bender, J.; Hanson, G.; Bence, A.; Taylor, S. Basalts from Deep Sea Drilling Project holes 417A and 417D, fractionated melts of a light rare-earth depleted source. Initial Rep. Deep Sea Drill. Proj 1980, 51, 52–53. [Google Scholar]
  83. Pearce, J.A.; Peate, D.W. Tectonic implications of the composition of volcanic arc magmas. Annu. Rev. Earth Planet. Sci. 1995, 23, 251–285. [Google Scholar] [CrossRef]
  84. Wilson, M. Igneous Petrogenesis: A Global Tectonic Approach: London; Unwin Hyman: London, UK, 1989; 466p. [Google Scholar] [CrossRef]
  85. Shikazono, N.; Ogawa, Y.; Utada, M.; Ishiyama, D.; Mizuta, T.; Ishikawa, N.; Kubota, Y. Geochemical behavior of rare earth elements in hydrothermally altered rocks of the Kuroko mining area, Japan. J. Geochem. Explor. 2008, 98, 65–79. [Google Scholar] [CrossRef]
  86. Oreskes, N.; Einaudi, M.T. Origin of rare earth element-enriched hematite breccias at the Olympic Dam Cu-U-Au-Ag deposit, Roxby Downs, South Australia. Econ. Geol. 1990, 85, 1–28. [Google Scholar] [CrossRef]
  87. Parsapoor, A.; Khalili, M.; Mackizadeh, M. The behaviour of trace and rare earth elements (REE) during hydrothermal alteration in the Rangan area (Central Iran). J. Asian Earth Sci. 2009, 34, 123–134. [Google Scholar] [CrossRef]
  88. Abdelnasser, A. Genesis of the Gold Mineralization at Atud Area, Central Eastern Desert of Egypt: Geological, Ore Mineralogical and Geochemical Approaches. Ph.D. Thesis, Istanbul Technical University, Istanbul, Turkey, 2016. [Google Scholar]
  89. Abdelnasser, A.; Kumral, M.; Zoheir, B.; Karaman, M.; Weihed, P. REE geochemical characteristics and satellite-based mapping of hydrothermal alteration in Atud gold deposit, Egypt. J. Afr. Earth Sci. 2018, 145, 317–330. [Google Scholar] [CrossRef]
  90. Parr, J.M. Rare-earth element distribution in exhalites associated with Broken Hill-type mineralisation at the Pinnacles deposit, New South Wales, Australia. Chem. Geol. 1992, 100, 73–91. [Google Scholar] [CrossRef]
  91. Torres-Alvarado, I.S. Chemical equilibrium in hydrothermal systems: The case of Los Azufres geothermal field, Mexico. Int. Geol. Rev. 2002, 44, 639–652. [Google Scholar] [CrossRef]
  92. Jiang, N.; Sun, S.; Chu, X.; Mizuta, T.; Ishiyama, D. Mobilization and enrichment of high-field strength elements during late-and post-magmatic processes in the Shuiquangou syenitic complex, Northern China. Chem. Geol. 2003, 200, 117–128. [Google Scholar] [CrossRef]
  93. Hou, Z.; Yang, Z.; Lu, Y.; Kemp, A.; Zheng, Y.; Li, Q.; Tang, J.; Yang, Z.; Duan, L. A genetic linkage between subduction-and collision-related porphyry Cu deposits in continental collision zones. Geology 2015, 43, 247–250. [Google Scholar] [CrossRef] [Green Version]
  94. Hou, Z.; Zhou, Y.; Wang, R.; Zheng, Y.; He, W.; Zhao, M.; Evans, N.J.; Weinberg, R.F. Recycling of metal-fertilized lower continental crust: Origin of non-arc Au-rich porphyry deposits at cratonic edges. Geology 2017, 45, 563–566. [Google Scholar] [CrossRef] [Green Version]
  95. Rice, S.; Cuthbert, S.J.; Hursthouse, A. Tectono-magmatic controls of post-subduction gold mineralisation during late Caledonian soft continental collision in the Southern Uplands-Down-Longford Terrane, Britain and Ireland: A review. Ore Geol. Rev. 2018, 101, 74–104. [Google Scholar] [CrossRef] [Green Version]
  96. McCuaig, T.C.; Hronsky, J.M. The mineral system concept: The key to exploration targeting. Appl. Earth Sci. 2017, 126, 77–78. [Google Scholar] [CrossRef]
  97. Botros, N.S. Alteration zones: Are they a good target for gold deposits in Egypt. Arab Gulf J. Sci. Res. 2002, 20, 209–218. [Google Scholar]
  98. Zoheir, B.; Akawy, A.; Hassan, I. Role of fluid mixing and wallrock sulfidation in gold mineralization at the Semna mine area, central Eastern Desert of Egypt: Evidence from hydrothermal alteration, fluid inclusions and stable isotope data. Ore Geol. Rev. 2008, 34, 580–596. [Google Scholar] [CrossRef]
  99. Reyes, A.G. Petrology of Philippine geothermal systems and the application of alteration mineralogy to their assessment. J. Volcanol. Geotherm. Res. 1990, 43, 279–309. [Google Scholar] [CrossRef]
  100. Sillitoe, R. The influence of magmatic-hydrothermal models on exploration strategies for volcano-plutonic areas. Magmas Fluids Ore Depos. 1995, 266–272. [Google Scholar]
  101. Eliwa, H.; Breitkreuz, C.; Murata, M.; Khalaf, I.; Bühler, B.; Itaya, T.; Takahashi, T.; Hirahara, Y.; Miyazaki, T.; Kimura, J. SIMS zircon U–Pb and mica K–Ar geochronology, and Sr–Nd isotope geochemistry of Neoproterozoic granitoids and their bearing on the evolution of the north Eastern Desert, Egypt. Gondwana Res. 2014, 25, 1570–1598. [Google Scholar] [CrossRef]
Figure 1. Gold occurrences in the main structural blocks in the Eastern Desert of Egypt [9].
Minerals 13 00489 g001
Figure 3. (a) Location map of the Abu Zawal area. (b) Geologic map of the late Precambrian rock units at Abu Zawal area [31].
Minerals 13 00489 g003
Figure 4. (a) Bedding and layering pattern of the metavolcaniclastics rocks (MVC) that intruded by Dokhan volcanics (DV) at Wadi Fatira Elbida (looking NW). (b) Metavolcaniclastics rocks include banded Iron Formation (BIF) at the northwestern slope of Gabal Magl Elrashayda. (Looking NW). (c) Kaolinized microperthite and quartz, biotite, and chlorite in metarhyolite. (d) Sericitized plagioclase, chlorite, and biotite in meta-andesite. (e) Altered plagioclase, quartz, biotite, chlorite, and opaques in the felsic metatuffs. (f) Exfoliation in synorogenic granitoid rocks (looking S). (g) Synorogenic granitoid rocks contain metavolcanic xenoliths (looking SW). (h) Quartz, plagioclase, microperthite, biotite, chlorite, sericite, kaolinite, and iron oxides in the granodiorite. (i) Tonalite has quartz and plagioclase, biotite, hornblende, and sericite. (j) Phenocrysts of altered plagioclase, kaolinized microperthite, chlorite, and quartz in a groundmass of quartz, plagioclase, chloritized biotite, kaolinized and sericitized feldspar, and iron oxides in rhyolite of Dokhan Volcanics. (k) Late to post-orogenic granitoid rock affected by joints (looking E). (l) Quartz and altered microperthite with plagioclase, and titanite in micrographic texture in the monzogranite. (m) Quartz, plagioclase, microperthite, muscovite, and iron oxides in monzogranite. (n,o) Felsite dike (F.dk) cut the metavolcanic rocks (MV) at Wadi Abu Zawal (looking NE). (p) Phenocrysts of kaolinized microperthite, chlorite, and quartz in a groundmass of quartz, plagioclase, chloritized biotite, kaolinized and sericitized feldspar, and iron oxides in felsite dike. Abbreviations: biotite (Bt); chlorite (Chl); K-feldspar (Kfs); hornblende (Hbl); kaolinite (Kln); microperthite (Prt); muscovite (Ms); opaque minerals (Opq); plagioclase (Pl); pyroxene (Py); quartz (Qtz and Qz); sericite (Ser); titanite (Ttn); tonalite-granodiorite (TO-GR); and xenolith (XEN).
Minerals 13 00489 g004
Figure 5. Geological and Archaeological map showing the different mining periods of Fatira area. Modified after Murr [36] and Klemm and Klemm [31].
Minerals 13 00489 g005
Figure 6. (a) Felsite dike cut through granodiorite rocks with different alteration zones stained with iron oxides. (b) Discontinuous quartz enclaves are encountered along the felsite dikes stained with iron oxides. (c) Malachite rich band in zone-2. Abbreviations: felsite dike (FD); alteration zone-1 (Z1); alteration zone-2 (Z2); and quartz veinlets (Qz).
Minerals 13 00489 g006
Figure 7. (a) Muscovite (sericite), kaolinite, and opaque minerals in alteration zone-1. (b) Muscovite (sericite), kaolinite, and malachite in alteration zone-1. (c) Kaolinite and sericite with quartz veinlets in alteration zone-1. (d,e) Chlorite with subordinate amount of sericite and kaolinite in alteration zone-2. (f) Calcite and chlorite minerals in alteration zone-2. Abbreviations: calcite (cal); chlorite (chl); kaolinite (kln); malachite (mlc); muscovite (ms); opaque minerals (opq); plagioclase (plag); quartz (qz); and sericite (ser).
Minerals 13 00489 g007
Figure 8. XRD patterns of some selected altered samples collected from the different alteration types: (a) Sericite-kaolinite-quartz-pyrite ± albite alteration zone-1. (b) Chlorite–calcite–dolomite ± albite ± sericite alteration zone-2.
Minerals 13 00489 g008
Figure 9. Photomicrographs of the different ore minerals: (a) Chalcopyrite (ccp) occurred at quartz vein. (b) Pyrite (py) is highly altered to goethite (gt) associated with hematite (hem). (c) Free gold (Au) grains with pyrite (py) disseminated along the alteration zone-1. (d) Gold (Au) is associated with magnetite (mag). (e) Magnetite (mag) crystal is partially pseudomorphic and transformed into hematite (hem) (martitization). (f,g) Specularite (spc) associated with hematite (hem) and goethite (gt). (h) Barite (brt) is associated with magnetite (mag) and hematite (hem). (i) Malachite (mlc) pseudomorph after chalcopyrite.
Minerals 13 00489 g009
Figure 10. Paragenetic sequence of alteration, sulfide, Fe-oxide, and supergene minerals, as defined by mineral assemblages.
Minerals 13 00489 g010
Figure 11. (a) FeO*/MgO vs. SiO2 diagram for the studied metavolcanics and felsite dike [47]. (b) Total alkalis vs. silica (TAS) diagram for the geochemical classification of the studied felsite dike [43]. The boundary between alkaline and subalkaline fields after Irvine and Baragar [48]. For comparison, a field for Dokhan volcanics (DV) from Moghazi [44] and Eliwa et al. [23], and fields for older and younger metavolcanics (OMV and YMV) from Stern [49]. (c) Hf/3-Th-Nb/16 tectonomagmatic discrimination diagram for the metavolcanic and felsite dike samples [45]. (d) Chondrite-normalized REE patterns [46]. For comparison, a field of the felsic Dokhan Volcanics from Moghazi [44] and Eliwa et al. [23].
Minerals 13 00489 g011
Figure 13. (a) AI [60] vs. CCPI [59] of the studied alteration samples of Abu Zawal area. (b) Na2O + CaO vs. MgO + FeO* (FeO total) after Paulick et al. [61].
Minerals 13 00489 g013
Figure 14. Primitive mantle-normalized trace element patterns of the felsite dike [46].
Minerals 13 00489 g014
Figure 15. (a) REE-Chondrite normalized of ore zone [46]. (b) REE-Chondrite normalized of alteration zones-1 [46]. (c) REE-Chondrite normalized of alteration zones-2 [46]. (d) Chondrite-normalized REE patterns of the ore zone (e) Chondrite-normalized REE patterns of the alteration zones-1. (f) Chondrite-normalized REE patterns of the alteration zones-2.
Minerals 13 00489 g015
Figure 16. (a) The alteration index (A.I.) vs. HREE ratio. (b) The alteration index (A.I.) vs. LREE ratio. (c) The alteration index (A.I.) vs. Eu-anomaly (Eu/Eu*). (d) K2O index (K.I.) vs. HREE ratio. (e) K2O index (K.I.) vs. LREE ratio. (f) K2O index (K.I.) vs. Eu-anomaly (Eu/Eu*). (g) MgO index (M.I.) vs. HREE ratio. (h) MgO index (M.I.) vs. LREE ratio. (i) MgO index (M.I.) vs. Eu-anomaly (Eu/Eu*).
Minerals 13 00489 g016
Figure 17. Simplified sketch cross section showing the magmatic-metasomatic processes at the Abu Zawal (Fatira) gold mine.
Minerals 13 00489 g017
Table 1. Representative electron microprobe data of chalcopyrite and pyrite from Abu Zawal (Fatira) area.
Chalcopyrite (n = 10)Pyrite (n = 11)
Dataset/PointMinMaxAv.MinMaxAv.
S32.1134.7233.5649.9552.8451.87
Fe32.0536.0732.9946.2247.4647.04
Te0.010.020.010.010.050.02
Cu30.4433.5532.710.010.160.05
Au0.020.040.030.010.050.03
As0.030.140.060.033.580.80
Ni0.010.030.020.010.010.01
Ag0.010.080.030.020.050.03
Sb0.510.510.510.060.060.06
Zn0.010.040.020.010.020.02
Total98.69100.3299.4299.05100.1399.52
atom %
S47.2049.5748.5963.9866.3665.55
Fe26.7329.7527.4333.6034.5634.13
Te0.010.010.010.020.020.02
Cu22.0624.5523.910.010.100.03
Au0.010.010.010.010.010.01
As0.020.090.040.021.960.43
Ni0.010.020.020.010.010.01
Ag0.010.030.010.010.020.01
Sb0.200.200.200.020.020.02
Zn0.010.030.020.010.010.01
Sum100100100100100100
FormulaCu0.96Fe1.1S1.94Fe1.02As0.01S1.97
S1.891.981.941.921.991.97
Fe1.071.191.101.011.041.02
Cu0.880.980.96
As 0.010.060.02
Sum4.004.004.003.003.003.00
Table 2. Major oxides, trace, and REE of the felsite dikes of Abu Zawal (Fatira) area.
Z-2Z-106Z-107Z-107aZ-107bZ-107cZ-107d
SiO275.2875.3573.6074.7174.6274.4674.63
Al2O313.6312.7713.2813.2013.1713.2013.20
Fe2O31.381.071.441.291.291.321.30
MgO0.280.140.300.240.240.250.24
CaO0.270.541.070.650.700.750.68
Na2O4.663.834.104.174.134.144.16
K2O3.405.415.344.804.924.964.86
TiO20.230.140.220.190.190.200.20
P2O50.010.010.010.010.010.010.01
MnO0.020.020.020.020.020.020.02
Cr2O30.010.010.010.010.010.010.01
LOI0.700.550.390.540.520.500.52
Sum99.8799.8499.7899.8399.8299.8299.83
Trace and rare earth elements (REE)
As28.010.010.015.214.113.714.7
Ba818.0985.2985.2936.9947.2950.5941.6
Cd8.50.00.82.72.32.22.5
Co1.01.01.01.01.01.01.0
Cs1.11.41.51.31.41.41.4
Cu16.03.04.07.16.46.26.8
Ga19.017.019.018.318.318.418.3
Hf3.23.23.53.33.43.43.4
Mo3.02.01.01.91.81.71.9
Nb16.018.08.013.913.512.613.4
Ni3.02.03.02.62.62.72.7
Pb24.012.01.011.610.29.010.7
Pd0.00.00.00.00.00.00.0
Pt0.00.00.00.00.00.00.0
Rb63.697.4179.4116.8123.2131.4121.7
Rh0.00.00.00.00.00.00.0
Ru0.00.00.00.00.00.00.0
S80.1120.1320.4179.8192.8211.8190.3
Sb0.40.60.70.60.60.60.6
Sn0.60.10.10.20.20.20.2
Sr124.086.0222.0145.3150.2161.8150.7
Te0.00.00.00.00.00.00.0
Tl0.40.60.80.60.60.70.6
U5.65.48.36.46.66.86.6
V7.04.08.06.36.36.66.4
Zn18.024.027.023.323.924.323.6
Zr99.096.0124.0106.8108.1110.6108.1
Sc1.03.01.01.71.71.61.7
Y17.213.411.113.713.313.013.5
La24.217.039.327.027.729.627.9
Ce46.537.579.154.956.660.256.6
Pr5.44.18.46.06.16.56.1
Nd18.014.729.220.821.422.621.4
Sm3.43.35.54.14.24.44.2
Eu0.70.61.50.91.01.11.0
Gd3.12.73.53.13.13.23.1
Tb0.60.40.50.50.50.50.5
Dy2.92.22.12.42.32.32.4
Ho0.60.50.40.50.50.40.5
Er1.71.21.01.31.21.21.3
Tm0.30.30.10.20.20.20.2
Yb1.61.50.91.31.31.21.3
Lu0.20.30.20.20.20.20.2
Th9.68.319.512.713.214.213.2
Parameters
FeO* (FeO total)1.240.961.301.161.161.191.17
FeO*/MgO4.446.884.324.904.904.774.85
Na2O + K2O8.069.249.448.979.059.099.01
ΣREE109.286.1171.8123.3126.4133.7126.7
ΣLREE98.277.2163.0113.8117.0124.4117.3
ΣHREE10.98.98.89.59.39.39.4
(La/Yb)N10.27.827.613.714.516.114.4
(La/Sm)N4.33.24.44.04.04.14.1
(Gd/Yb)N1.51.52.91.91.92.01.9
(Tb/Yb)N1.631.352.631.781.821.921.82
Eu/Eu*0.60.61.10.80.80.90.8
Note: FeO*: FeO total; Eu*: Eu total.
Table 3. Major oxides, trace and REE data of the synorogenic and late orogenic granitoids of the Abu Zawal (Fatira) area.
Synorogenic Granitoid RocksLate Orogenic Granitoid Rocks
Z-10Z-44Z-103Z-33Z-38Z-46Z-98Z-43Z-104
SiO260.5962.966.0469.8674.0871.5271.6371.4972.2
Al2O316.7315.6415.7513.8613.0514.4613.9314.1314.3
Fe2O34.374.072.991.861.361.231.391.311.09
MgO2.142.011.530.970.190.380.640.660.34
CaO4.694.383.711.850.811.061.20.961.01
Na2O4.84.275.143.894.124.584.974.435.19
K2O3.813.923.015.985.55.814.975.985.09
TiO20.891.030.570.420.190.30.310.290.17
P2O50.50.470.330.090.050.070.130.080.07
MnO0.070.080.070.050.010.030.050.030.03
Cr2O30.010.010.010.010.010.010.010.010.01
Cl0.030.050.040.030.010.020.020.020.01
LOI1.120.910.570.720.460.360.60.450.35
Sum99.7599.7499.7699.5999.8499.8399.8599.8499.86
Trace and rare earth elements (REE)
As91010737669
Ba985.2895.7895.7985.25021164.4825895.7895.7
Cd30.501.61.10.203.70.4
Co764111111
Cs1.42.31.31.80.61.30.91.40.7
Cu12107165135
Ga232119171917191820
Hf0.91.522.23.22.41.32.80.8
Mo314131211
Nb911913131310147
Ni131111213432
Pb111311133
Rb72.865.949.4104.870.58569.3114.167.7
S4080.180.11001.1360.440120.180.140
Sb0.20.10.10.10.20.10.10.10.1
Sn0.10.50.10.70.10.30.10.80.1
Sr845.6845.6748130149137201114237
Tl0.30.40.30.50.40.40.20.40.3
U1.22.52.12.25.61.81.54.30.9
V4145289671189
Zn686544361217362233
Zr21423716619489178142183155
Sc783312411
Y1720.21317.75.517.710.917.66.3
La273221.931.32327.822.332.715.6
Ce57.969.148.165.940.26148.267.130.6
Pr78.15.67.63.77.35.77.63.4
Nd28.633.220.827.211.127.521.926.813
Sm5.76.74.65.11.65.445.32.4
Eu1.81.71.30.80.410.81.10.6
Gd4.85.63.74.11.33.93.141.5
Tb0.70.80.50.60.30.60.40.60.2
Dy3.64.42.63.413.12.23.41.4
Ho0.60.70.50.70.20.60.40.60.2
Er1.72.31.41.80.61.71.12.10.7
Tm0.20.30.20.200.20.10.30.1
Yb1.721.31.90.71.811.80.6
Lu0.30.30.20.30.10.30.10.30.1
Th3.75.66.48.111.76.24.614.52.7
Parameters
FeO* (FeO total)3.933.662.691.671.221.111.251.180.98
Na2O + K2O8.618.198.159.879.6210.399.9410.4110.28
Fe2O3 + TiO25.265.13.562.281.551.531.71.61.26
FeO* + MnO43.742.761.721.231.141.31.211.01
FeO*/(FeO* + MgO)0.650.650.640.630.870.740.660.640.74
Y + Nb26.0431.1622.0130.7218.5130.6620.9231.613.27
Note: FeO*: FeO total.
Table 4. Major oxides, trace, and REE of the ore zone and different alteration zones of Abu the Zawal (Fatira) area.
Ore ZoneAlteration Zone 1Alteration Zone 2
Z12DZ15Z12CZ18DZ18D1Z18EZ24CZ24DZ25DZ12AZ12BZ18AZ24AZ24BZ24EZ24FZ24G
SiO237.6246.3574.7175.2570.8677.1055.8062.9673.6550.0061.6761.8659.3657.4265.3953.4750.84
Al2O318.7817.4814.2513.5514.8911.9322.0316.5315.8617.8916.3815.2615.2215.6616.0516.3215.81
Fe2O328.2722.132.613.124.983.577.268.661.855.684.294.806.648.414.177.246.32
MgO0.840.790.500.520.440.290.980.840.482.761.751.781.462.131.481.992.89
CaO0.270.050.020.060.040.060.450.670.063.673.513.386.883.543.016.297.76
Na2O0.210.120.100.140.170.130.190.130.174.084.565.642.670.930.782.152.98
K2O4.305.114.704.724.883.907.565.605.053.723.083.302.146.245.224.223.18
TiO21.421.520.120.110.120.120.850.620.090.930.840.880.670.820.361.301.25
P2O50.300.290.020.020.030.020.290.200.010.310.110.370.240.260.110.490.49
MnO0.010.010.010.010.020.010.260.210.140.380.030.080.140.350.160.130.10
Cr2O30.010.010.010.010.420.290.380.010.320.010.010.010.010.250.010.310.02
Cl0.010.010.010.010.010.020.010.010.020.020.020.030.010.010.010.010.01
LOI6.865.552.782.272.562.343.723.312.145.023.262.074.343.733.145.887.91
Sum98.999.4299.8499.7999.4299.7899.7899.7599.8494.4799.5199.4699.7899.7599.8999.899.56
Trace and rare earth elements (REE)
As24.056.023.020.037.031.0306.0472.025.026.020.017.017.0182.075.0121.019.0
Au0.01.30.50.40.02.60.00.70.00.00.00.00.00.00.00.00.0
Ba628.0960.1561.0419.0389.0351.0898.3912.7241.0878.6859.81067.6897.41008.5398.0424.01569.2
Cd0.00.00.00.40.00.01.40.62.86.40.80.00.02.30.80.00.0
Co23.041.020.024.033.049.027.067.044.087.034.048.032.036.023.041.028.0
Cs2.31.31.00.90.80.714.06.32.53.81.20.81.24.63.43.93.0
Cu1156.7442.055.012.020.027.022.013.063.039,068.51791.816.013.099.0111.015.026.0
Ga33.028.021.018.020.019.021.016.018.027.020.01.015.019.016.021.019.0
Hf3.43.52.82.52.01.40.90.31.41.00.00.01.40.32.32.02.9
Mo11.019.03.04.025.04.02.02.01.02.02.02.02.02.01.01.02.0
Nb13.011.018.016.016.017.05.05.020.010.010.09.06.05.012.08.09.0
Ni82.050.06.07.06.05.016.024.07.025.014.010.017.016.08.063.072.0
Pb1.01.01.01.025.01.073.068.042.01.01.01.05.01.019.01.01.0
Rb103.8111.5109.6101.780.686.7266.0168.2125.0108.153.463.051.4165.2127.1110.377.0
S3067.91383.1294.0599.12017.9589.1113.4221.7219.3161.7260.21293.4233.5146.140.0284.4596.7
Sb1.31.40.40.70.40.33.43.00.81.00.60.11.23.31.61.42.2
Sn0.10.30.60.10.10.10.10.10.10.10.10.10.10.10.10.10.1
Sr470.0335.063.032.047.029.035.039.017.0180.0658.0580.0321.080.038.0214.0422.0
Tl0.50.60.50.40.40.41.81.00.70.70.30.30.40.90.70.60.5
U4.53.74.64.23.94.30.80.73.65.42.51.20.80.81.60.80.6
V195.0120.012.011.09.09.0113.087.04.075.054.058.069.0111.042.091.085.0
Zn51.029.015.014.013.012.0152.063.0481.03473.788.076.090.0204.0182.0102.0122.0
Zr174.0172.0107.099.098.0101.0124.0123.093.0242.0199.0234.0160.0100.0120.0187.0178.0
Sc10.012.01.03.01.01.022.015.01.011.07.05.016.021.09.09.08.0
Y12.214.111.911.08.09.423.319.59.719.821.318.924.124.012.411.310.2
La18.922.628.622.018.724.112.710.620.028.714.425.413.211.214.723.522.5
Ce39.345.459.647.340.248.727.323.939.066.733.758.431.825.430.153.152.0
Pr4.85.57.05.64.55.44.13.33.78.14.27.24.43.53.46.66.6
Nd18.121.027.117.915.319.817.215.89.832.819.530.619.015.812.129.427.6
Sm3.74.14.23.82.43.54.53.81.66.55.25.94.94.62.65.96.0
Eu1.00.80.80.60.40.51.41.10.52.01.62.01.31.60.61.82.1
Gd2.83.53.22.71.72.14.83.71.55.64.65.44.84.02.44.64.4
Tb0.30.50.40.30.30.30.70.60.30.80.70.80.80.60.40.60.6
Dy2.13.02.31.81.41.74.02.81.33.73.93.74.73.72.12.52.6
Ho0.40.60.30.30.20.30.80.60.30.60.70.70.90.80.40.40.4
Er1.11.61.21.31.01.02.72.01.22.11.72.02.72.31.61.21.1
Tm0.10.20.20.30.10.20.40.30.10.20.30.20.30.40.20.10.1
Yb1.31.71.21.41.21.42.42.01.01.61.81.52.63.21.81.20.9
Lu0.20.30.20.20.10.20.40.30.20.20.30.20.50.40.30.10.1
Th2.62.68.07.77.67.01.61.411.44.43.43.32.21.26.41.71.7
Parameters
FeO* (FeO total)25.4419.922.352.814.483.216.537.791.675.113.864.325.987.573.756.525.69
CCPI85.3579.8437.2540.6449.3646.5049.2360.1129.1250.2342.3440.5660.7257.5046.5957.1858.20
Ishikawa AI91.4697.2097.7496.3296.2095.6693.0388.9596.0145.5437.4436.0327.3865.1963.8742.3936.11
Na2O + CaO0.480.170.120.200.210.190.640.800.237.758.079.029.554.473.798.4410.74
MgO + FeO*26.2820.712.853.334.923.507.518.632.157.875.616.107.449.705.238.518.58
ΣREE94.03110.61136.39105.5787.48109.2583.3370.8580.52159.6292.39143.9991.8077.5372.60130.98127.14
ΣLREE85.7299.31127.3097.2781.50102.0867.1758.5474.62144.8278.55129.4774.5962.0463.43120.28116.88
ΣHREE8.3111.299.098.305.987.1716.1612.315.9014.8013.8414.5117.2115.489.1710.7010.26
ΣHREE/ΣREE0.090.100.070.080.070.070.190.170.070.090.150.100.190.200.130.080.08
ΣLREE/ΣREE0.910.900.930.920.930.930.810.830.930.910.850.900.810.800.870.920.92
Eu/Eu*0.910.610.660.620.670.600.930.900.951.031.031.070.831.110.721.061.28
K2O Index (K.I.)76.5184.1888.3586.7688.2589.0482.3577.3587.6726.1423.8823.4016.2748.6049.7628.8118.92
MgO Index (M.I.)14.9513.019.409.567.966.6210.6811.608.3319.4013.5712.6211.1016.5914.1113.5817.19
Note: FeO*: FeO total; Eu*: Eu total.
Table 5. Elements/oxides mass changes in relation to original whole rock mass ((Mfi − Moi)/Mo) and in relation to original elements/oxides mass in original rock ((Mfi − Moi)/Moi) (data from GEOISO-A Windows™ program).
Ore ZoneZone-1Zone-2
(Mfi − Moi)/Mo(Mfi − Moi)/Moi(Mfi − Moi)/Mo(Mfi − Moi)/Moi(Mfi − Moi)/Mo(Mfi − Moi)/Moi
SiO2−26.03−0.418.940.14−5.79−0.09
Al2O30.000.000.000.000.000.00
Fe2O30.934.870.050.250.110.58
FeO15.804.850.770.241.810.56
MgO−1.17−0.62−1.29−0.680.140.07
CaO−4.12−0.97−4.06−0.950.490.12
Na2O−4.59−0.97−4.59−0.97−1.78−0.38
K2O0.590.161.770.500.300.09
TiO20.470.57−0.53−0.640.050.06
P2O5−0.17−0.38−0.35−0.81−0.13−0.30
MnO−0.06−0.870.020.320.101.42
Cr2O30.00−0.120.2120.620.076.99
LOI4.625.321.942.233.544.07
As25.722.66124.7612.9049.855.16
Au0.5829.080.6130.40
Ba−222.98−0.24−370.74−0.40−39.27−0.04
Cd−1.16−1.00−0.38−0.330.130.11
Co22.643.9933.155.8535.386.24
Cu697.5572.1421.512.235123.28529.81
Ga5.980.29−1.44−0.07−3.78−0.18
Hf1.611.090.180.12−0.24−0.16
Mo10.603.973.361.26−0.92−0.35
Nb0.950.104.600.48−1.06−0.11
Ni46.724.00−1.23−0.1116.411.41
Pb−0.12−0.1230.0330.032.742.74
Rb32.530.5275.251.2031.550.50
S1902.2228.50529.557.94309.564.64
Sb1.067.081.187.851.278.45
Sn−0.02−0.12−0.07−0.35−0.14−0.74
Sr−456.96−0.56−774.53−0.95−502.01−0.62
U1.640.841.290.66−0.24−0.13
V101.342.67−1.97−0.0534.990.92
Zn−23.61−0.4051.300.87482.208.17
Zr−52.61−0.26−96.10−0.47−28.50−0.14
Mass ChangeMC = −11.528MC = 2.953MC = −0.187
Volume ChangeVC = −26.318VC = 0.746VC = −1.623
Disclaimer/Publisher’s Note: The statements, opinions and data contained in all publications are solely those of the individual author(s) and contributor(s) and not of MDPI and/or the editor(s). MDPI and/or the editor(s) disclaim responsibility for any injury to people or property resulting from any ideas, methods, instructions or products referred to in the content.

