Article

Effect of Sedimentary Facies Characteristics on Deep Shale Gas Desserts: A Case from the Longmaxi Formation, South Sichuan Basin, China

1
Key Laboratory of Shale Gas Exploration, Ministry of Natural Resources, Chongqing Institute of Geology and Mineral Resources, Chongqing 401120, China
2
Shale Gas Evaluation and Exploitation Key Laboratory of Sichuan Province, Chengdu 610051, China
3
School of Chemistry and Chemical Engineering, Chongqing University of Science & Technology, Chongqing 401331, China
4
State Key Laboratory of Oil and Gas Reservoir Geology and Exploitation, Southwest Petroleum University, Chengdu 610500, China
5
Research Institute of Petroleum Exploration and Development, PetroChina Southwest Oil & Gas Field Company, Chengdu 610051, China
6
Sichuan Changning Natural Gas Development Co., Ltd., Chengdu 610051, China
*
Authors to whom correspondence should be addressed.
Minerals 2023, 13(4), 476; https://doi.org/10.3390/min13040476
Submission received: 31 January 2023 / Revised: 23 March 2023 / Accepted: 25 March 2023 / Published: 28 March 2023

Abstract

:
Shale gas is one of the hot spots of energy development. Due to the strong heterogeneity and low physical properties of shale gas reservoirs, and the complex influencing factors of pore development, it is necessary to conduct a comprehensive analysis of the control factors of high-quality reservoirs. The sedimentary characteristics, mineral composition, pore structure and controlling factors of high quality reservoir development are studied on the basis of thin section, scanning electron microscopy (SEM) and QEMSCAN analysis, X-ray diffraction (XRD), total organic carbon (TOC), Nano-CT scanning and Low-pressure N2 adsorption (N2GA) analysis on shale samples from the Longmaxi Formation in South Sichuan Basin. The results show the following: (1) According to lithology, sedimentary structure, organic carbon content and mineral composition, six sedimentary microfacies can be divided. (2) Organic matter pores are developed in organic-rich siliceous shale and organic-rich silty shale at the bottom of the first member of the Longmaxi formation, with average porosity of more than 5% and permeability of more than 2 × 10⁻³ μm2, which is conducive to the formation of high-quality shale gas reservoirs. (3) The contents of siliceous and TOC are positively correlated with porosity and specific surface area, while the contents of carbonate and clay minerals are negatively correlated with reservoir quality. (4) In the first member of the Longmaxi formation, the sedimentary water depth becomes shallower from bottom to top, and the sedimentary environment changes from a reduction to an oxidation environment. The contents of siliceous and organic matter decrease, while the contents of clay minerals and carbonate minerals show the opposite trend. The difference in sedimentary microfacies affects the distribution of mineral and organic matter and controls the heterogeneity of the shale reservoir.

1. Introduction

In response to the gradual shortage of conventional oil and gas resources, shale gas resources have attracted worldwide attention in the past decade [1,2,3]. Unlike conventional oil and gas reservoirs, shale gas is a closed natural gas system in which shale as source, reservoir and caprock [4,5,6], characteristic with extremely fine sediment size and low reservoir physical properties. In recent years, in the process of shale gas development in China, marine shale gas exploration in Changning, Weiyuan and other areas in the south of Sichuan Basin has shown huge shale gas resource potential. Shale of the Longmaxi formation is a high-yield shale gas reservoir in Sichuan basin with high organic matter content, high maturity, large sedimentary thickness and wide distribution [7].
The heterogeneity of shale is very strong [8,9,10,11,12], which is reflected in macro to micro scale, mineral composition and pore structure [4,13,14]. In particular, the difference of pore structure leads to great differences in the reservoir capacity and seepage capacity of shale gas reservoirs [3,15,16,17,18]. Therefore, although the Longmaxi formation is vertically continuously deposited with thick shale, not all layers can form effective reservoirs, and the gas bearing properties of different intervals are quite different, and the gas production of each well on the plane is not the same. The formation of these heterogeneity is not clear.
It is the basis of accurate prediction, exploration and development of shale gas to make clear the distribution of high-quality reservoirs in controlling factors, The research on shale reservoir mainly focuses on pore structure heterogeneity [19,20,21,22], mineral composition and petrography [7,23,24,25], which have gained rich understanding.
Pore structure is the focus of shale gas research, which can contribute to understand the occurrence state, enrichment and seepage law and reservoir capacity of shale gas in detail. The pore morphology and structure of shale are described by SEM and low pressure gas isothermal adsorption experiment, or the heterogeneity of pore structure is characterized by fractal dimension [18,19,20,26]. pore volume, special surface area, porosity, permeability, and pore size diameter, are the main indexes in pore structure characterization [15,16,17,27,28].
Some scholars take the material composition of shale as the research object, Research shows that pore evolution and heterogeneity structure of shale is closely related to composition and fabric, organic matter type and abundance, and thermal maturation [29,30,31,32,33,34,35]. Especially, thermal maturation and organic matter types controls the development of organic pores [31,32].
Some research results show that organic matter pore is the main pore type in Longmaxi shale, and TOC content has a great influence on the porosity of Longmaxi shale [36,37,38,39]. In addition, the mineral composition of shale is similar, but the pore structure and gas content are also different due to different distribution areas.
The above research focuses on the study of micro characteristics, while, many scholars focus on lithofacies classification and correlation of shale, Lithofacies can directly reflect geological, geochemical and petrophysical characteristics, this concept was first proposed by Eberzin (1940) [40]. Lithofacies effectively realizes the combination of macroscopic and microscopic analysis of shale pore types and pore structure of different diagenesis. Chen et al. Found that under the condition of constant organic matter content, the silica-rich shale has the strongest methane adsorption capacity [41,42], while the siliceous shale has the highest gas storage capacity, Han et al. proposed that low calcareous mixed mudstone was the most favorable lithofacies type, characteristic with high porosity, high macropore volume, and high free gas content [43].
A large number of studies show that the enrichment of shale gas is affected by effective shale distribution, sedimentary thickness, organic carbon content, mineral composition and pore development characteristics, and these parameters are controlled by sedimentary environment and sedimentary facies [16,17,30,34,44,45]. However, there are few comprehensive studies on the controlling effect of sedimentary facies belt on reservoir in the study area.
This paper takes the shale section of the Lower Silurian Longmaxi Formation in the South Sichuan Basin as the research target, according to its lithology, lithofacies, sedimentary structure, organic matter content, mineral composition and other factors, the sedimentary subfacies are classified, and the development facies belt of high-quality reservoir is defined. The organic matter abundance, mineral composition and pore development of shale in the sedimentary microfacies of high-quality reservoir are compared, and the control effect of sedimentation on shale reservoir development is studied.

2. Geological Background

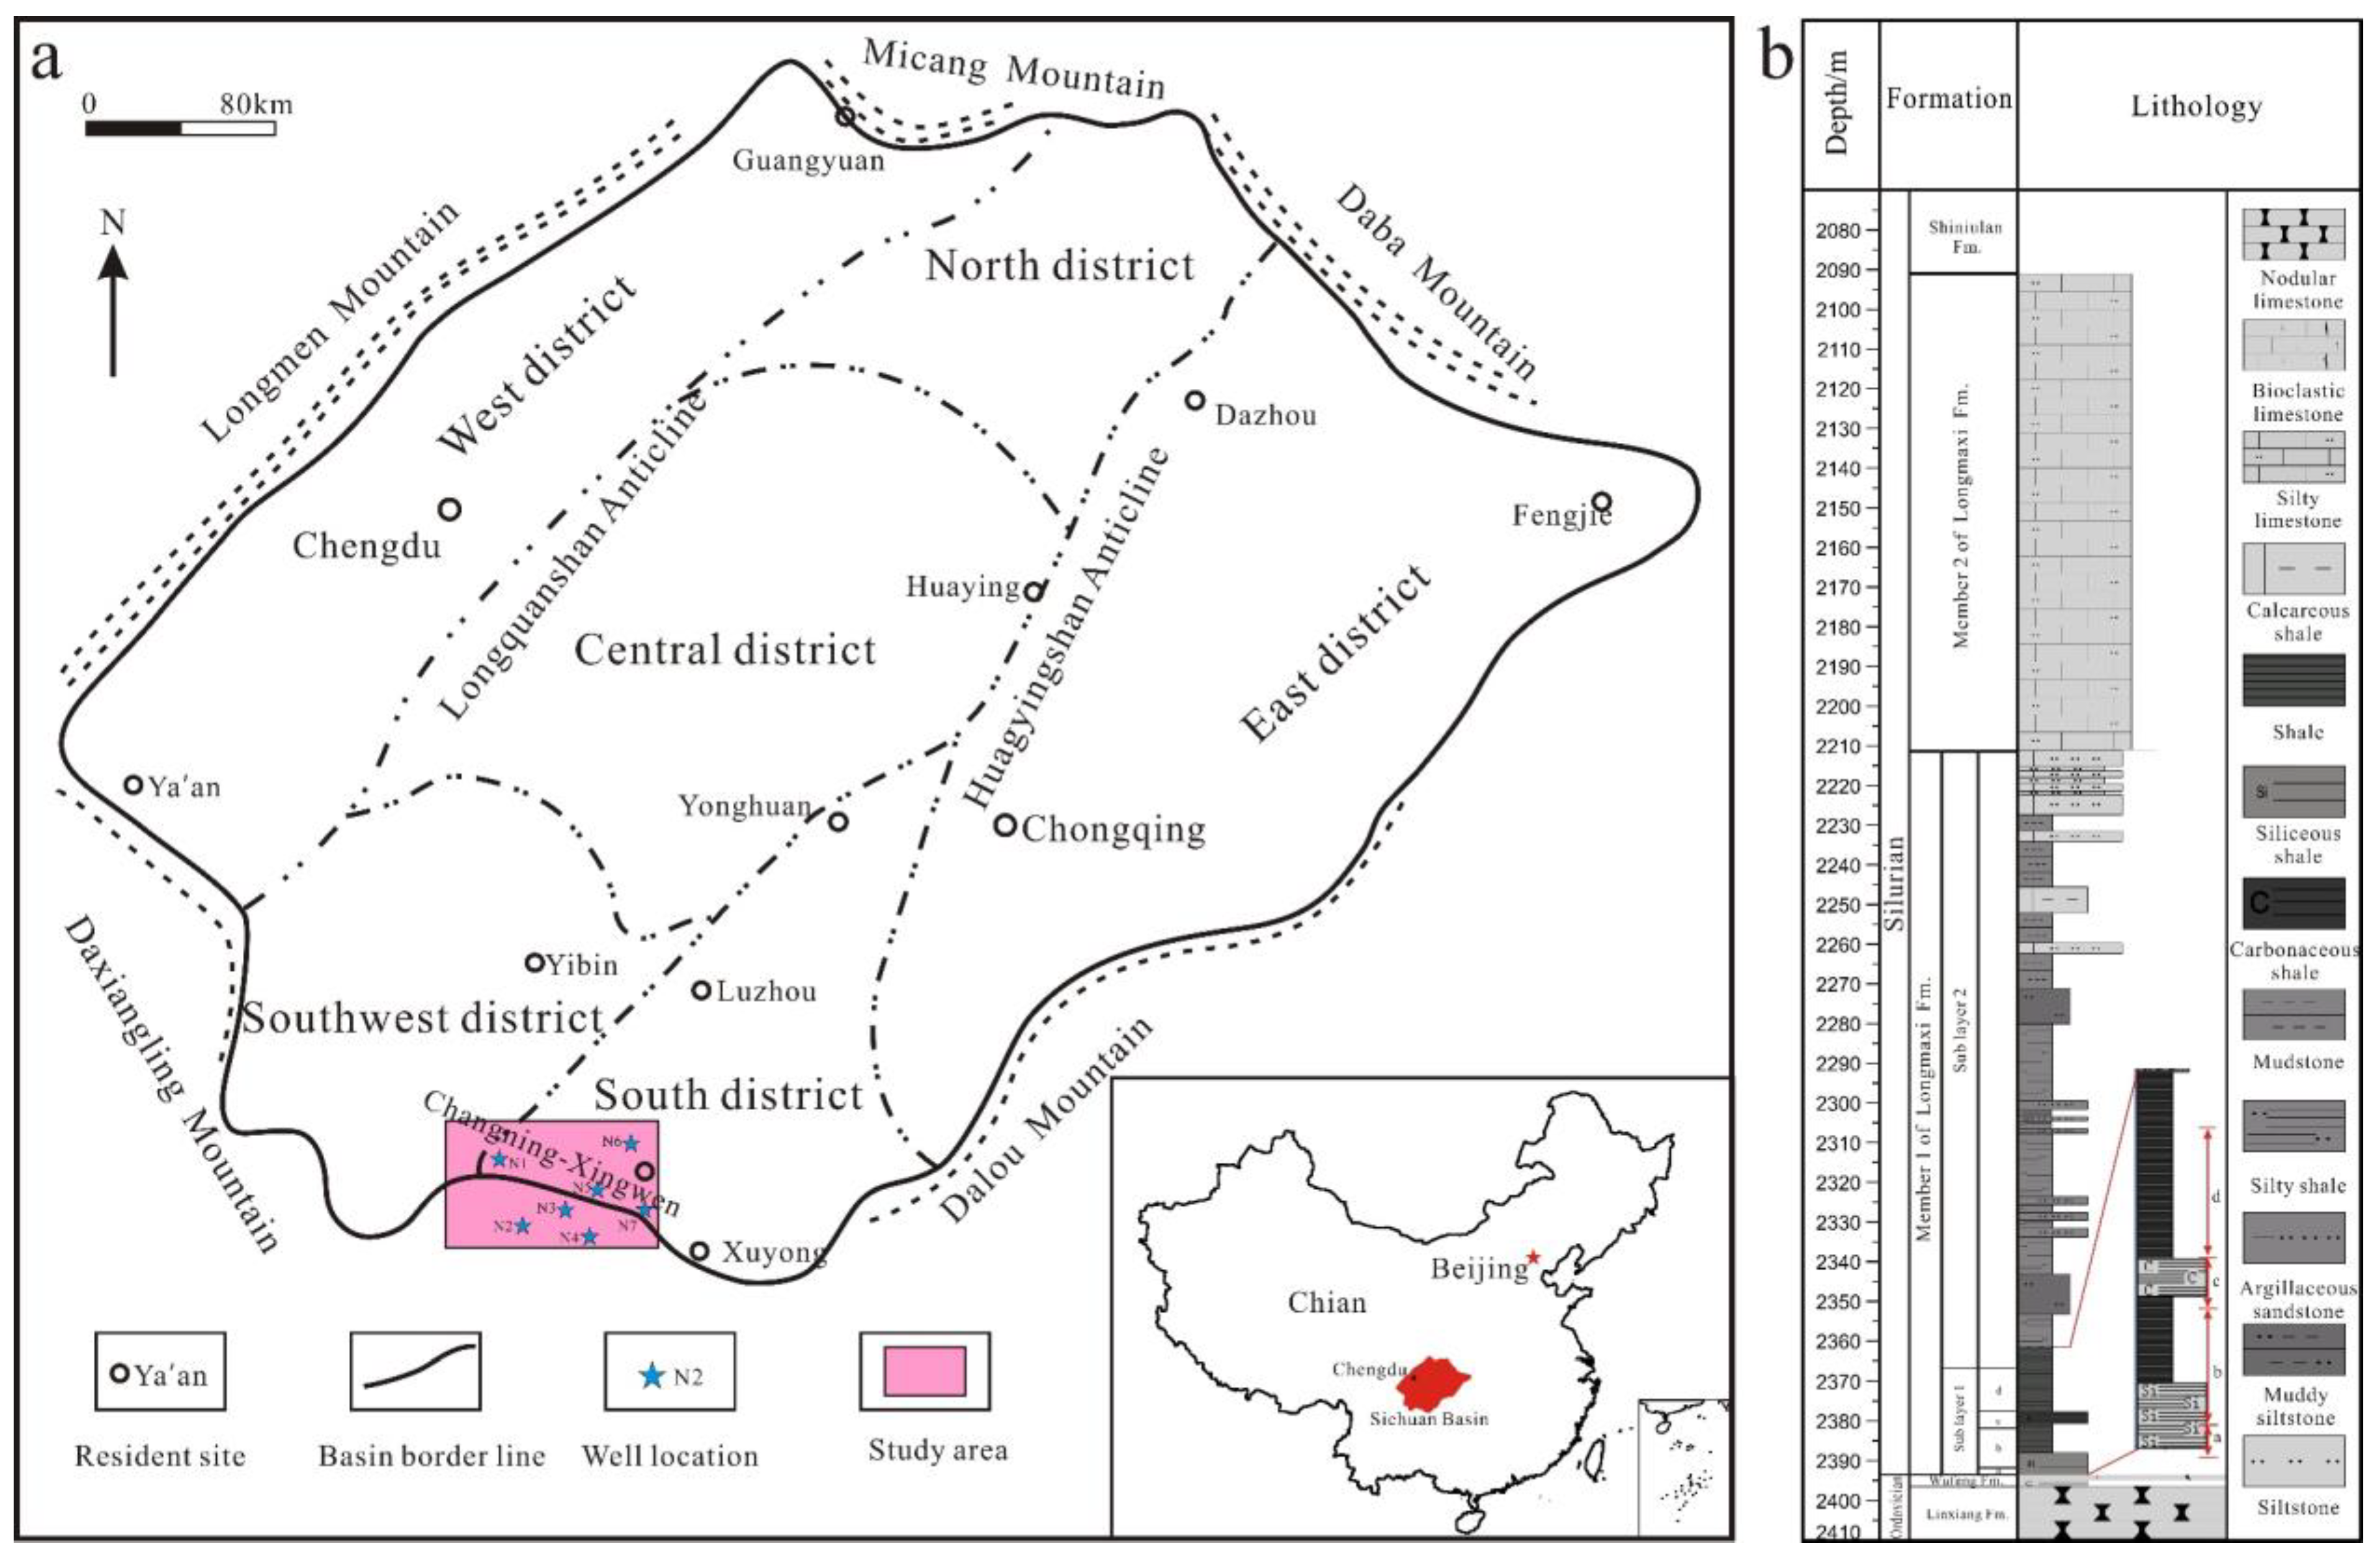
2.1. Regional Tectonic Characteristics

Sichuan Basin is an important part of the upper Yangtze plate and is also the most favorable oil and gas exploration area in southern China. Structurally, Sichuan basin includes a low and gentle fault fold belt in Western Sichuan, a low and gentle fault fold belt in North Sichuan, a flat fault fold belt in Central Sichuan, a low and gentle fault fold belt in Southwest Sichuan, a low steep fault fold belt in South Sichuan and a high steep fault fold belt in East Sichuan (Figure 1a). The Changning main anticline structure is located at the junction of the Sichuan Basin and the Yunnan Guizhou Plateau, between the low and steep structural area of ancient depression middle uplift in South Sichuan and the Loushan fold belt, affected by the West extension of the East Sichuan fold and thrust belt in the north and controlled by the evolution of the Loushan fold belt in the South. Its structural characteristics are a structural complex of the two [46,47,48].
Silurian strata in Sichuan Basin are mainly exposed in Southeast Sichuan, Daba Mountain, Micang mountain, Longmen Mountain and the east side of Kangdian ancient land. Cambrian and Silurian strata are exposed in the core of the Changning anticline, with Permian Triassic strata on both wings. The Longmaxi formation of Silurian strata is the main target interval for shale gas exploration in the study area. The black shale of the Longmaxi formation is in integrated contact with the black siliceous and calcareous shale of the Upper Ordovician Wufeng Formation containing hirnantia dalmanitina fauna. The thickness of the Longmaxi formation is 0 m to 373 m, which can be further subdivided into two lithologic sections, i.e., the first member of the Longmaxi formation (S1l1) and the second member of the Longmaxi formation (S1l2) [7,9].
The rhythmic boundary is between the gray black shale at the bottom of the second member of the S1l2 formation and the black shale gray silty shale in the overlying S1l1 member. According to the secondary cycles and lithologic characteristics, it can be divided into two sub segments from the top to the bottom (S1l1−1 and S1l1−2). The dark gray shale at the bottom of the S1l2 member and the gray black shale of the underlying S1l1 member are the lithologic interface.
The S1l1−1 sub member is a set of black carbonaceous shale rich in organic matter. A large number of graptolite groups with different shapes are developed, belonging to the calcareous outer shelf facies. It can also be subdivided into four sub layers (S1l1−1a, S1l1−1b, S1l1−1c, S1l1−1d) (Figure 1b).

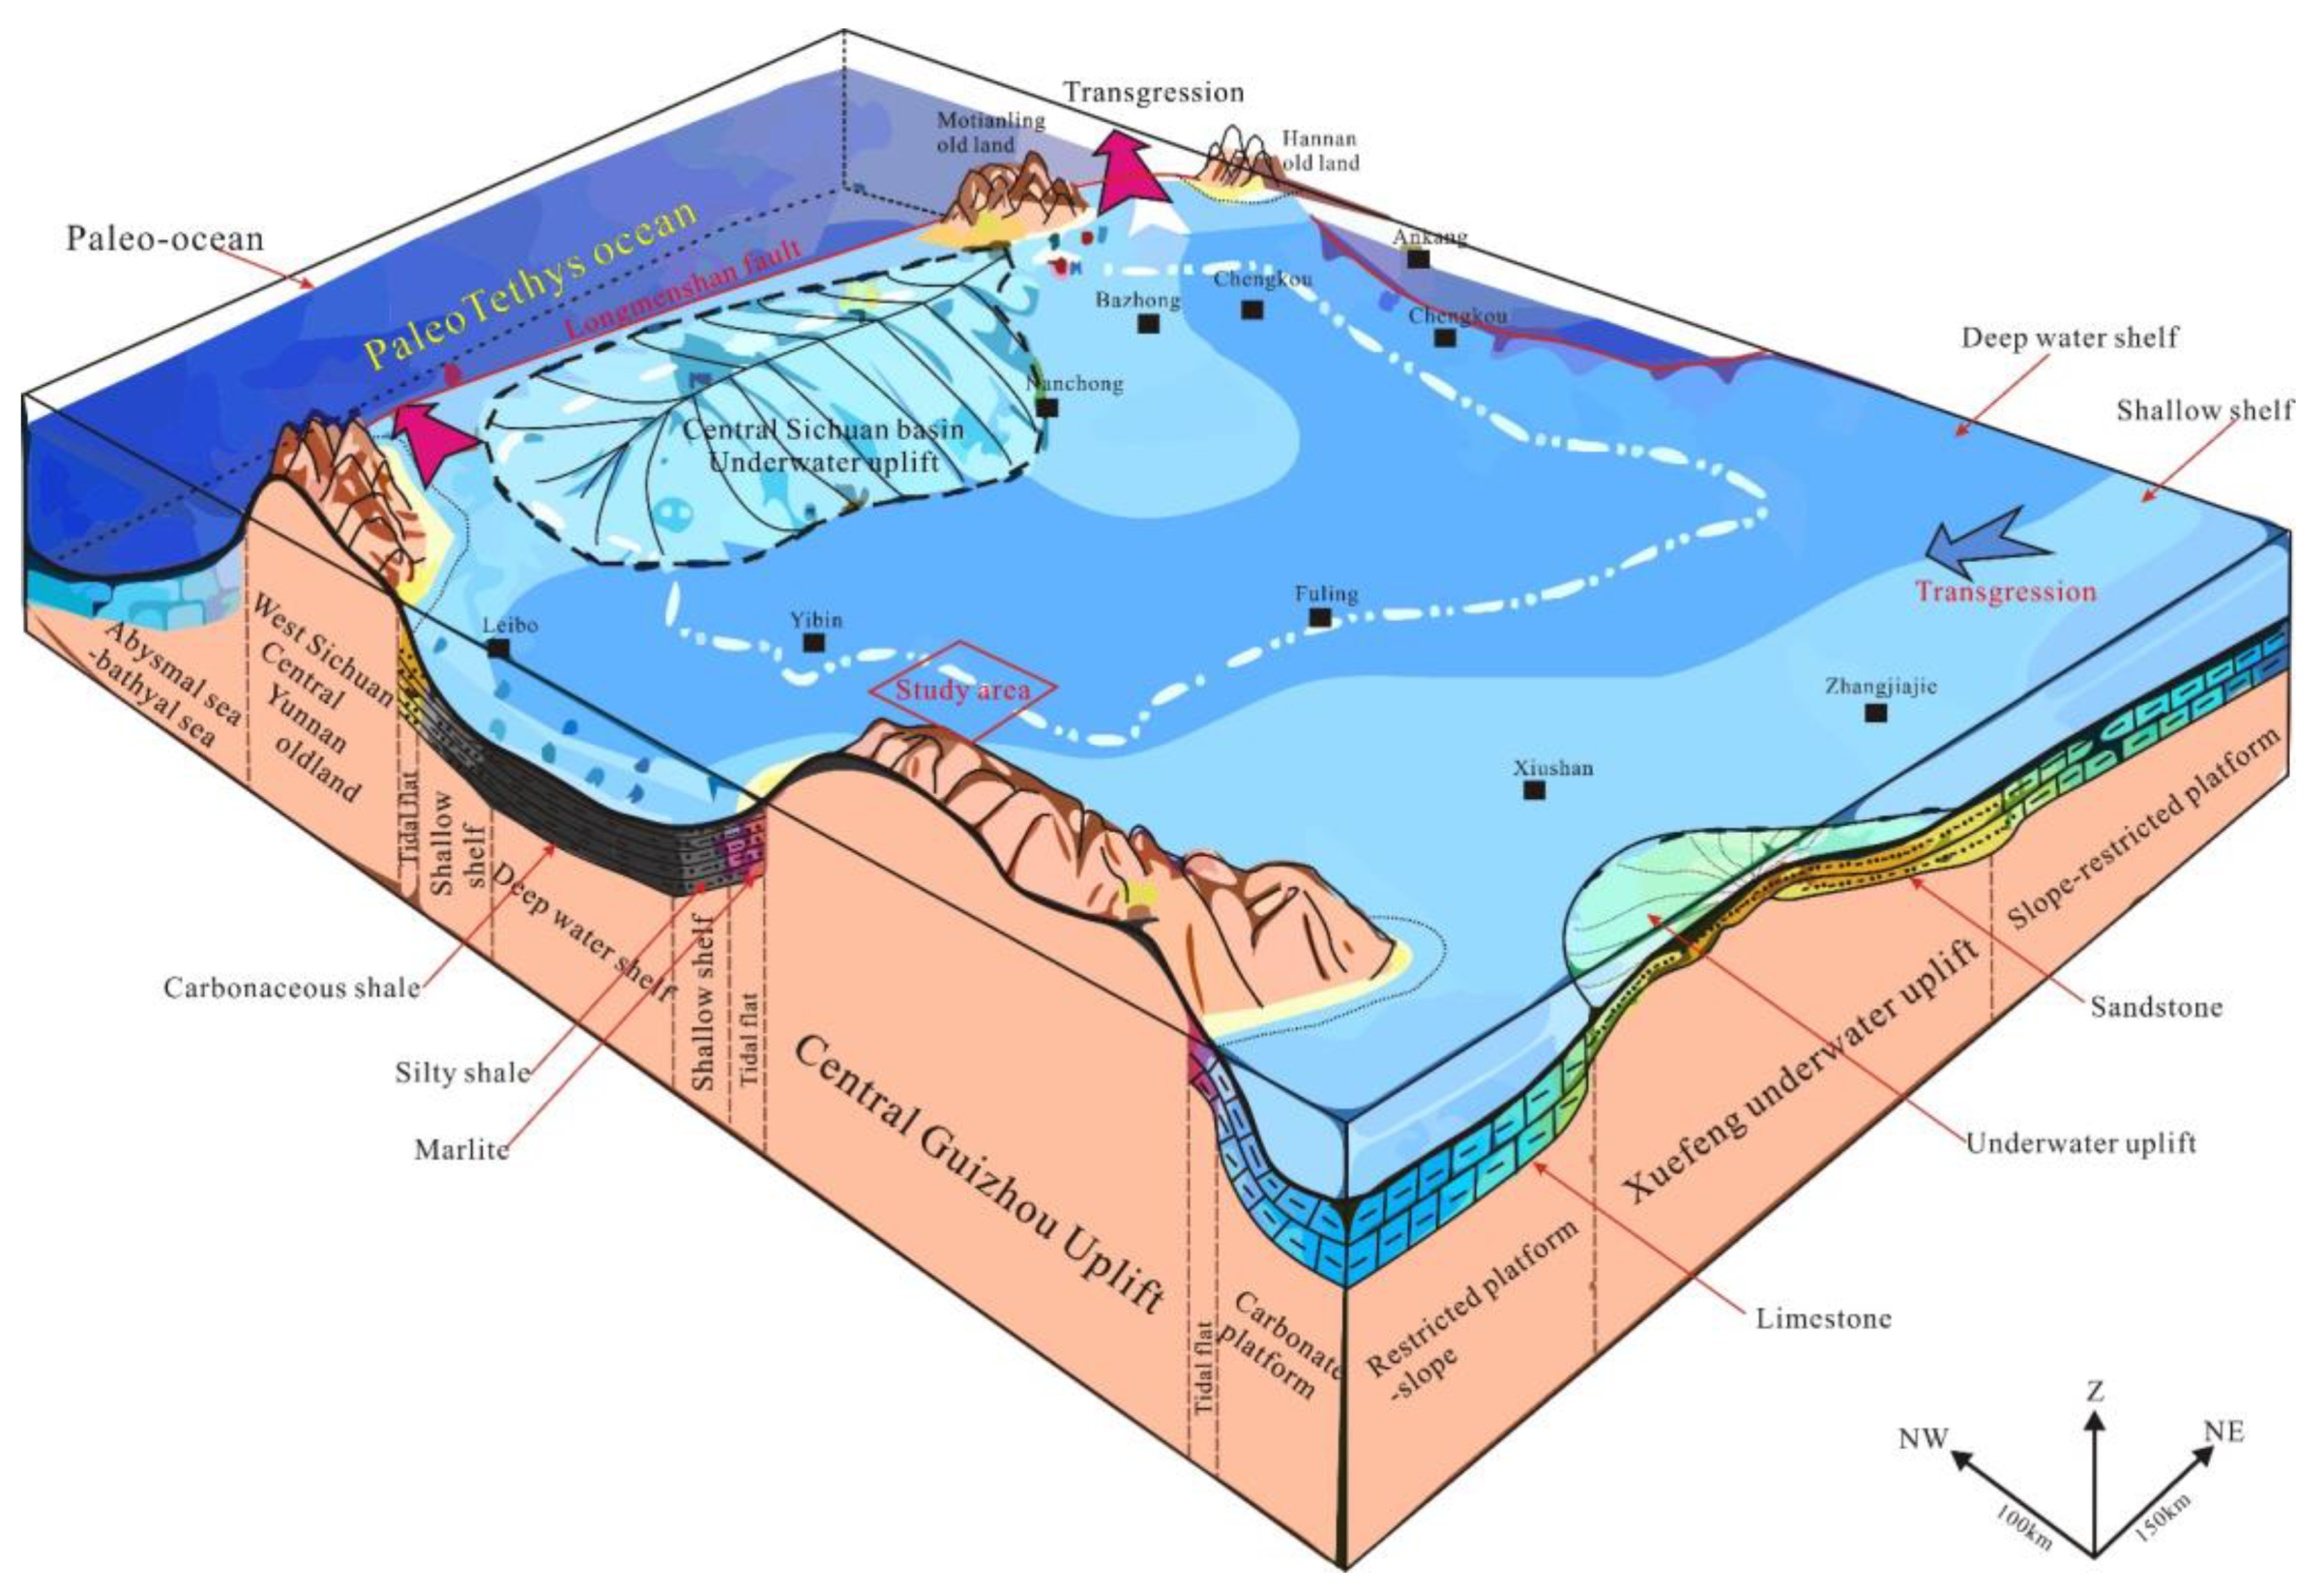
2.2. Sedimentary Facies Model

The late Ordovician to Early Silurian is a transitional period of sedimentary tectonic evolution in the Yangtze. The study area shows the effects of sea-level rise and became a stagnant basin, which not only submerged the carbonate platform, but also provided conditions for the deposition of the black shale of the Wufeng Formation of the Upper Ordovician and the black shale of the Longmaxi formation at the bottom of the Lower Silurian. Therefore, with the expansion of Kangdian ancient land in the west and the Leshan-Longnusi paleo uplift and the central Guizhou uplift in the south, the epicontinental sea in the east of Sichuan in the Early Silurian Longmaxi period became a semi-closed stagnant basin, and the main body of this basin was in a non-compensatory sedimentary environment [24,49]. During this period, the sedimentary environment of Sichuan Basin was peaceful, and a set of dark graptolite-bearing shale was deposited in the lower strata, which was stable with the uplift of the ancient land whereby the regional lithologic differentiation is obvious.
In the Longmaxi period, the sea level of the Changning shale gas field rose relatively, and the water body became deeper. Based on the cycle change of the third sea level, there were many periodic changes of secondary sea level. The Early Silurian Longmaxi period experienced two sea-level changes, and each sea-level change started with rapid transgression to an end of slow regression. The Longmaxi stage of Early Silurian mainly deposited a set of terrigenous clastic sedimentary system strata, which was the distribution area of inner continental shelf facies, and the provenance mainly came from the surrounding ancient land [50,51].
The first member of the Longmaxi formation: The first secondary relative sea-level change cycle, seawater intrusion from the east of Sichuan, the water gradually deepened in southern Sichuan, deposited a set of deep-water carbonaceous siliceous shale with a thickness of about 50 m. Nodular and infectious pyrite are relatively developed, the content of graptolite is rich, the biological fragments such as sponge spicules, ostracods and spines are found. The second member of the Longmaxi formation: Changning shale gas field in the regression period, the sea level dropped and the water body became shallower, mainly composed of gray block (sheet) gray argillaceous siltstone and gray massive limestone, with relatively less graptolite fossil content.

3. Materials and Methods

A total of 325 samples of the Longmaxi Formation were collected from seven wells in the Changning area. A series of measurements were conducted, i.e., Thin section, SEM and Qemscan analysis, XRD analysis, TOC tests, Nano-CT scanning and Low-pressure N2 adsorption. Among the samples, 100 were subjected to SEM and XRD analysis, 115 to TOC, 20 to QEMSCAN, 10 to Nano-CT scanning and 26 to Low-pressure N2 adsorption.
Thin sections were analyzed using a LV100PO polarized optical microscope with a DS-Ri1 CCD and NIS ELEMENTS imaging software made by Nikon ( Tokyo, Japan). Pore characteristics of 100 samples were observed by SEM using a Quanta 450 ESEM (FEI, Hillsboro, USA). A detailed description of this technical procedure is given in the Chinese Oil and Gas Industry Standard (SY/T5162-1997).
QEMSCAN analysis can be used to classify and describe the pore morphology of minerals and organic matter in different shale facies under a scanning electron microscope. After being treated with argon ion polishing technology, shale samples were observed with a ZEISS Gemini SEM500 scanning electron microscope. The polished shale samples were analyzed with an AMICS automatic mineral parameter quantitative analysis system after carbon spraying treatment. The voltage was 20 kV and the working distance was 10 mm [34,35].
The Nano-CT experiment was carried out with an UltraXRM-L200 CT scanner(Xradia, California, USA), and the smallest pixel resolution was 65 nm. For parameter settings, the test temperature was 20 °C, the exposure time of a single picture was 120 s and the total number of pictures collected was 1019. Then, the three-dimensional (3D) digital cores were constructed using PerGeos from the FEI company (Hillsboro, USA) using the Nano-CT scanning images [52].
XRD analysis was performed with X’Pert PRO made by PANalytical B.V. Particle sizes of the shale powder were measured at less than 200 mesh. A range of 3°–30° was used to measure clay minerals, while a range of 5°–70° was used to measure whole rock minerals. Multiple treatments were carried out before the analysis, including de-oiling, desiccation (60 °C), crushing, and grinding to less than 40 μm [37,53].
TOC is an important index for evaluating the hydrocarbon-generating potential of organic matter in shales. The TOC content was measured by a LECO CS230 carbon/sulfur analyzer according to the national standard GB/T 19145-2003 after the samples were crushed into small particles in size of less than 0.2 mm and were treated by hydrochloric acid to remove the carbonates at a temperature of 60–80 °C.
Low-pressure N2 adsorption analyses were conducted using an ASAP 2460 Automatic Surface Area and Porosity Analyzer (Micromeritics Instrument Corp., USA) to study the pore structure (specific surface area, pore volume and pore size distribution) of shales [6,54]. The shale samples were crushed into 180–250 μm (60–80 mesh) samples in advance and then dried for 10 h at 120 °C in a high-vacuum drying oven, the surface area of the shale samples was analyzed using the BET theory and pore volumes were obtained following the BJH method [54,55,56].

4. Result

4.1. Sedimentary Facies Characteristics

4.1.1. Sedimentary Model

In the south of Sichuan Province, shore shelf sedimentary units developed successively from land to sea. In the early stage of the Longmaxi formation, the study area was located in the sedimentary facies belt of an offshore shelf static water anoxic and reduction environment [50,51].
The shelf environment consisted of the inner shelf close to the shore and the outer shelf far away from the shore. The upper limit was located near the normal wave base, and the lower water depth was generally about 200 m. On the plane, the land direction was close to the shore facies zone, and the sediments were mostly characterized by dark mud grade clastic materials. According to the hydrodynamic conditions, rock types and their associated relations formed including rock color, sedimentary structure, sedimentary environment, paleontological assemblage and facies minerals. The shelf facies of the first member of the Longmaxi formation in the Changning shale gas field is further divided into two subfacies: shallow shelf and deep-water shelf (Figure 2).
The shallow shelf was located in the relatively shallow water area between the normal wave base level and the storm wave base surface outside the shore near shore subfacies. The water body of the inland shelf was relatively shallow, and the water depth was generally 20 m~40 m. It belonged to the static water low energy environment, often affected by severe storm waves. It was a weak reduction environment, and there was dark carbon bearing silt shale, carbon bearing silt shale and silt bearing mudstone facies. It was mainly composed of terrigenous and silty sediments.
The deep-water shelf was located on the side of the shelf close to the continental slope and in the deep-water area below the base level of storm waves. The water depth was generally 40 m~200 m, occasionally affected by extraordinary storm waves. It was a reduction environment of still water, anoxic and conducive to the formation of organic matter. Its lithology is mainly composed of gray black mudstone, shale and silty shale. Among them, dark shale often has a millimeter scale laminar or a flaky foliation structure, pyrite is often scattered granular, lenticular, banded or lamellar, and horizontal lamina developed. There are abundant fossils and monotonous categories. Among them, abundant graptolites are dominant, and a large number of siliceous radiolarians and a few siliceous sponge spicules are found. The organic carbon content of this subfacies is high, which is a favorable facies belt for the development of high-quality shale.
The first member of the Longmaxi formation in the Changning shale gas field is distributed in both deep-water shelf and shallow shelf subfacies, and the deep-water subfacies is more developed.
Figure 2. Depositional facies pattern of O3w-S1l, Shangluo block (after [57]).
Minerals 13 00476 g002

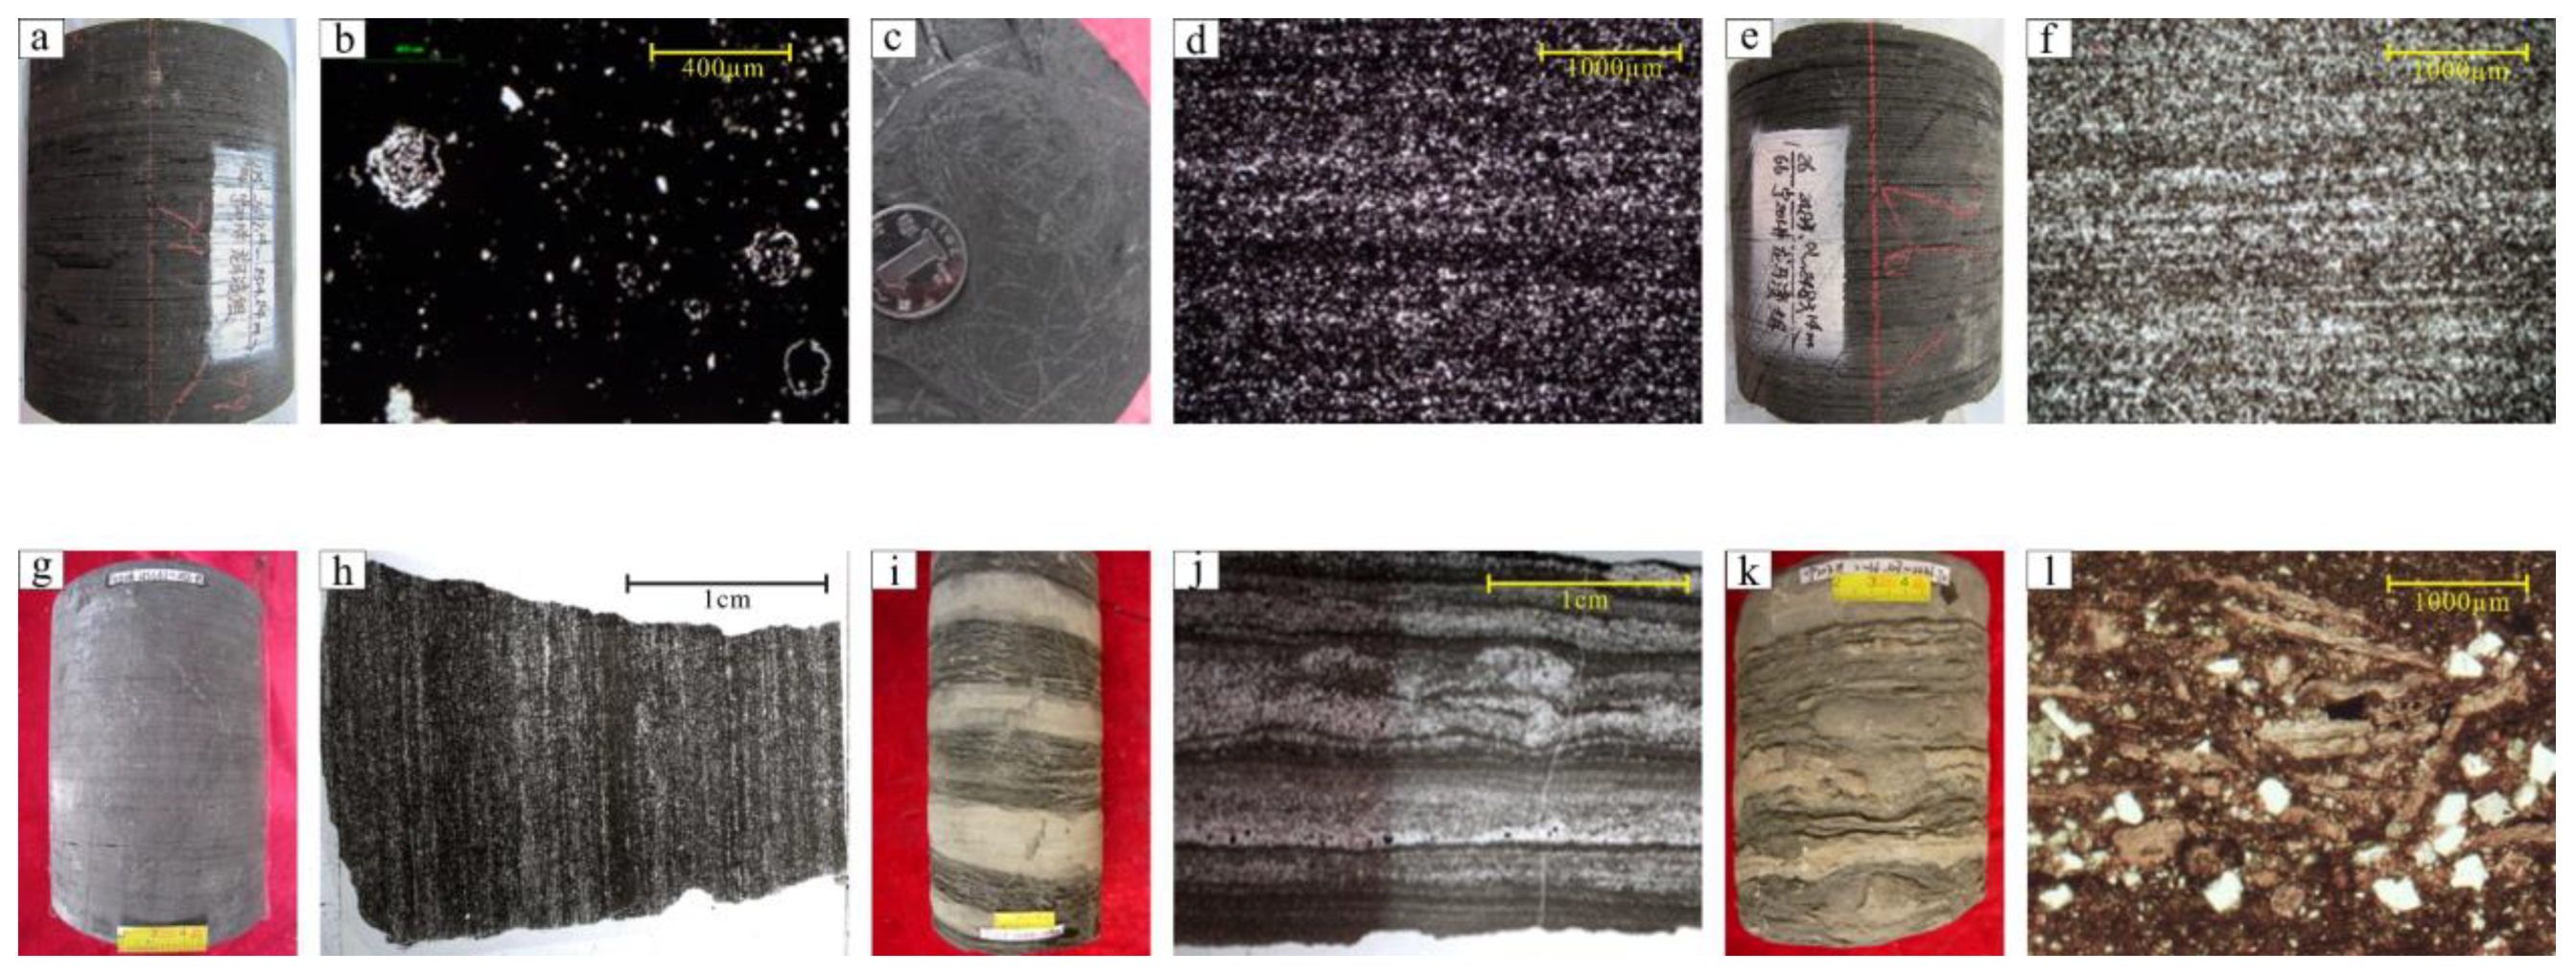
4.1.2. Types and Characteristics of Sedimentary Microfacies

Through thin section identification, core observation and paleontological characteristics, six sedimentary microfacies were identified in the first member of the Longmaxi formation in the Changning shale gas field. There are six microfacies types in the first member of the Longmaxi formation, including: A. organic rich siliceous mud shed microfacies, B. organic rich silty mud shed microfacies, C. deep water silty mud shed microfacies, D. shallow water silty mud shed microfacies, E. lime argillaceous silt shed microfacies, and F. calcareous silty mud shed microfacies. Among them, A and B are the most favorable sedimentary facies types for shale gas reservoirs.
(1) The organic rich siliceous mud shed microfacies are located in the sea area with the lowest water energy in the outer shelf, and the hydrodynamic conditions are the weakest. The sedimentary products are mainly black carbonaceous shale with dark block silty mudstone locally. The sedimentary structure is mainly composed of horizontal and massive bedding. Nodular and infectious pyrite are well developed (Figure 3a,b). Graptolite fossils are abundant. Siliceous sponge spicules and radiolarians are common. Benthic fossils are few and silicified to varying degrees. This shows that the sedimentary environment was very inactive, indicating the deep-water sedimentary characteristics of low energy, reduction and low speed under compensation, which was suitable for the accumulation and preservation of rich organic matter and the transformation to oil and gas under suitable conditions. The black carbonaceous shale is extremely rich in organic matter, with high organic carbon content, average TOC > 4%, and great hydrocarbon generation potential. Terrigenous quartz and feldspar are very few, less than 10%, and siliceous content is higher, generally more than 40%. The microfacies are the most favorable source and are the reservoir facies.
(2) Compared with the deep-water silty mud shed microfacies, the organic matter-rich silty mud shed microfacies were deposited in the sea area with lower water energy, the hydrodynamic conditions were weak; they were basically unaffected by the ocean current and storm current and they had stronger reducibility (Figure 3c,d). The sedimentary products of the microfacies are mainly black, black gray, flaky or massive silty mudstones. The sedimentary structures are mainly developed by horizontal bedding and rhythmic bedding. Nodular and infectious pyrite are developed. A large number of graptolite fossils are found in the core section, and a small amount of biological debris, such as siliceous spicules and ostracods, are seen in the core section, which reflects the low energy of the sedimentary environment, the characteristics of deep water include low-speed under compensation. Compared with the deep-water silty mud shed, the organic matter content of the microfacies is significantly increased, the environmental reducibility is stronger, and the graptolite fossil content is significantly increased. The average TOC is between 1.6% and 2.9%, with strong hydrocarbon generation potential; the average content of terrigenous quartz and feldspar is 46.33%, with high brittleness index; the microfacies are favorable for oil generation and reservoir facies.
(3) Compared with the shallow water silty mud shed microfacies, the water body of deep-water silty mud shed microfacies was relatively deeper. The sea area with lower water energy had weaker hydrodynamic conditions and stronger reducibility. The content of terrigenous quartz and feldspar in the microfacies is higher, and the calcium content in the top is increased (Figure 3e,f). The sedimentary products are mainly dark gray silty mudstone, but the sedimentary water body of this microfacies is shallower and the reducibility is weaker. The sedimentary structures are mainly composed of massive bedding, rhythmic bedding, and horizontal bedding, with nodular pyrite and few erosion surfaces. A certain amount of graptolite fossils, less benthic fossils, and a small amount of bioclasts are found on the cross section of the core, which all reflect the deep-water sedimentary environment of low energy, poor oxygen and low velocity and under compensation. The average TOC is between 1% and 1.5%, and the hydrocarbon generation potential is enhanced.
(4) The shallow water silty mud shed microfacies are generally located at the bottom of the inner shelf, and the sedimentary water body is relatively deeper, and the mud content is higher. The sediments are light in color, mainly composed of grayish green and yellowish green (containing) silty mudstone and mudstone, with a thin layer of siltstone locally; the organic matter content is low, generally less than 1%, indicating weak hydrocarbon generation potential; massive bedding, horizontal bedding and rhythmic bedding are developed, with scouring surface, small-sized sand grain bedding and a small amount of nodular pyrite, and occasionally bioturbation structure (Figure 3g,h). A small number of graptolite fossils and siliceous spicules indicate that the hydrodynamic conditions were relatively weak, and the water depth was relatively shallow, showing a weak reduction oxidation environment. It may be a shale gas cap rock.
(5) The muddy silt shed microfacies are located in the shallow water oxidation zone near the shore side, and the water body is deeper than that of the argillaceous silt shed (Figure 3i,j). The main reason is that the frequent rise and fall of the sea level has caused the corresponding changes of the sedimentary environment. Therefore, the carbonate deposition occurred during the “clear water” period, and the fine-grained terrigenous clastic material deposition occurred during the muddy water period. The calcareous silt shed is relatively developed in the late stage of sea-level decline, that is, it often appears in the upper part of the first sedimentary cycle.
With the frequent rise and fall of the sea level, the formed sedimentary products are light in color, with dark gray massive argillaceous siltstone, silty mudstone intercalated with a thin layer of gray calcium-bearing argillaceous siltstone and gray-white micritic limestone lens or mass, occasionally with tempestite. The sedimentary structures are mainly massive bedding and rhythmic bedding. In the Changning structure, there are biological burrows, bioturbation structures and erosion surfaces. These depositional phenomena indicate that the argillaceous silt shed was a relatively shallow water oxidation environment dominated by terrigenous clastic materials. Organic carbon content is low (TOC < 1%), and hydrocarbon generation potential is poor. This kind of sedimentary microfacies is not conducive to oil and gas generation and can be used as a good tight gas reservoir).
(6) The calcareous silty mud shed microfacies are located in the oxidation-reduction zone of shallow water near the shore side. The water body was relatively deep and the energy was relatively low, so it was easily affected by storm currents. The sedimentary products are light in color, mainly composed of gray, dark gray or gray white tempestite and massive marl, intercalated with thin-layer dark-gray laminar calcareous mudstone (Figure 3k,l). The sedimentary structures are mainly spherical, massive bedding and erosion surface structures, with horizontal bedding and rhythmic bedding locally. There are few biological fossils, and only a small amount of Ostracoda, Acanthus and brachiopod biological fragments. These depositional phenomena reflect how the lithofacies changes in calcareous silty mud shed microfacies were not only affected by frequent changes in the depth of sedimentary water bodies, but were also affected by sedimentation events such as storm currents. The terrigenous clastic materials of littoral facies were transported to the calcareous sediments, resulting in the mutual doping of composition and structure. The content of organic carbon is very low, and the average TOC is less than 0.5%. Therefore, this facies belt can be used as a caprock.

4.2. Physical Properties and Pore Structure Characteristics

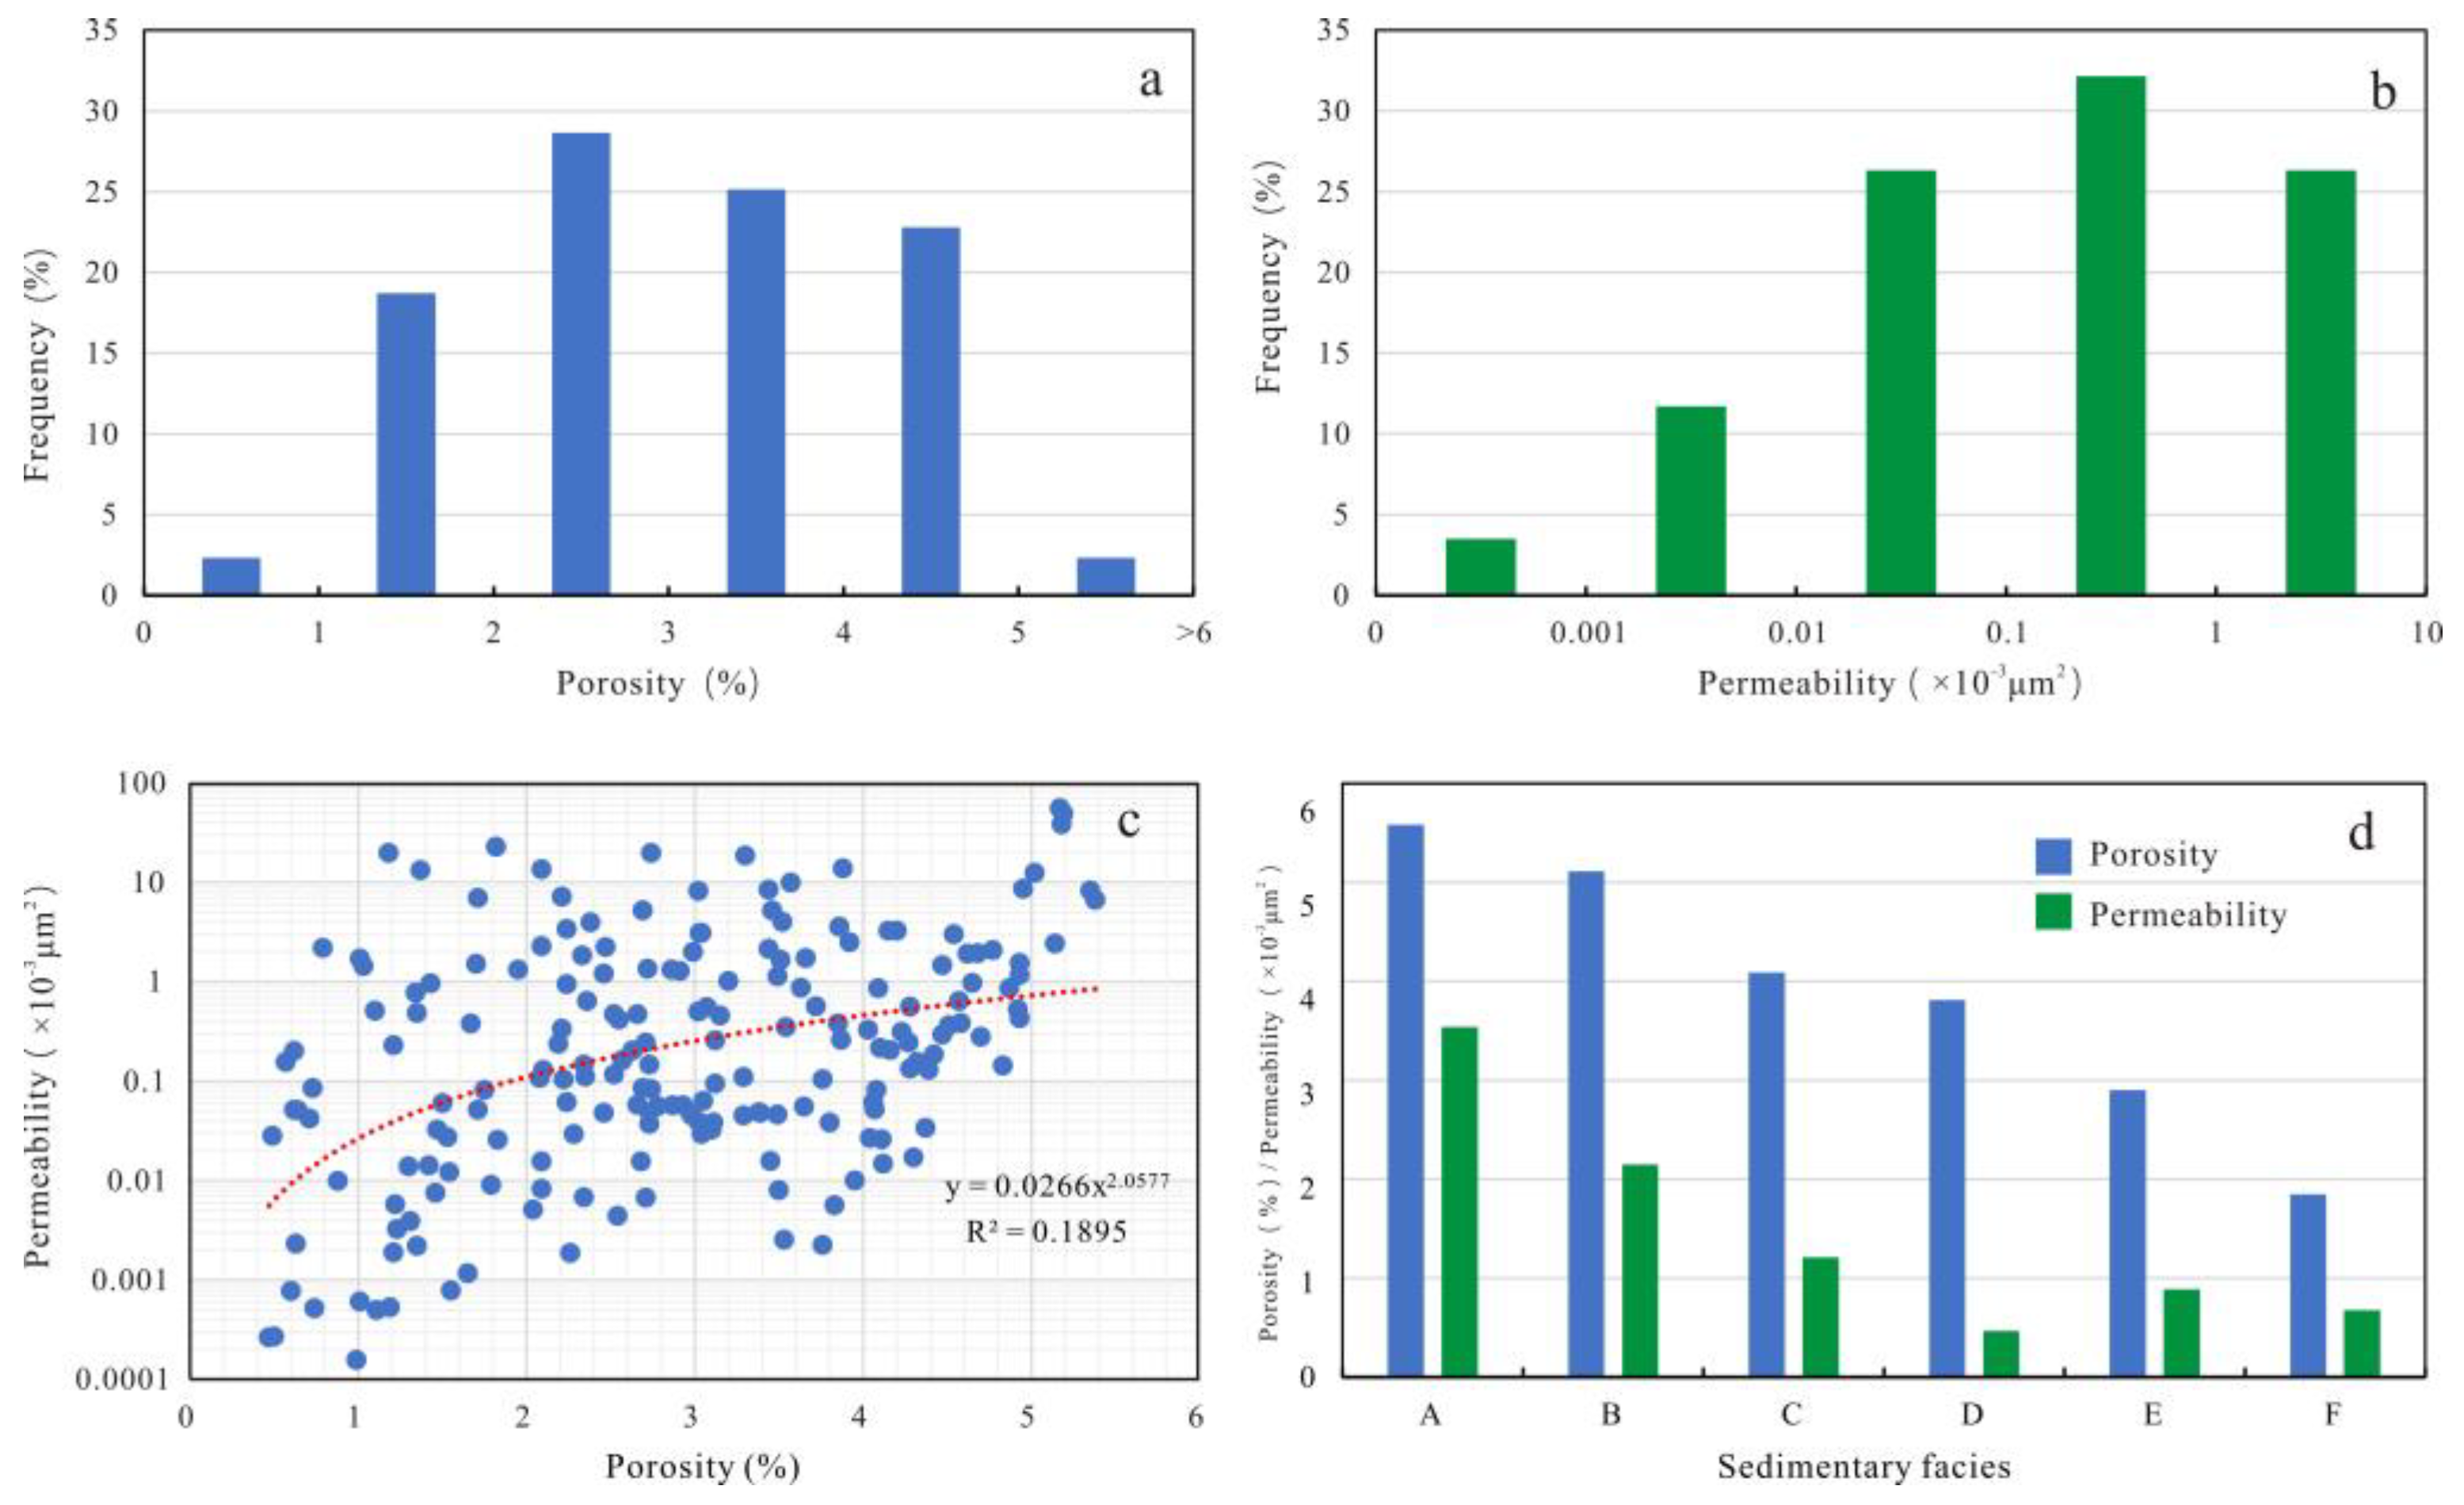
4.2.1. Physical Characteristics

Shale gas reservoirs are characterized by low porosity and ultra-low permeability. Shale gas reservoirs should have certain physical properties. The porosity of shale gas reservoirs in the United States is generally in the range of 3%~5%, and the high porosity can reach 10%~15%. Porosity can be used to measure the development degree of pores in rocks. Porosity has a positive correlation with TOC content and increases with the increase in shale maturity (organic matter micropores are developed in shale, the higher TOC, the higher the maturity, the more developed the organic micropores), and decrease with the increase of diagenetic compaction and confining pressure.
Permeability is an important parameter to judge whether a shale gas reservoir has economic development value. Shale permeability is composed of matrix permeability and fracture permeability. Effective microfractures play an important role in permeability. The porosity of shale in the Changning shale gas field is mainly distributed in the range of 0.71%~10.3%, with an average of 5%. The porosity of about 95.32% of the samples is in the range of 1%~5% (Figure 4a). The permeability measured using a conventional steady-state method ranges from 0.00016 × 10⁻³ μm2 to 9.9 × 10⁻³ μm2, with an average of 2.21 × 10⁻³ μm2, mainly concentrated in 0.01 × 10⁻³ μm2~10 × 10−3 μm2 (Figure 4b). The experimental data show that it is easy to produce fractures during sample preparation when the shale permeability is measured using a conventional steady-state method (Figure 4c).
Combined with sedimentary microfacies, the porosity of outer shelf microfacies is higher than that of inner shelf sedimentary microfacies. The average porosity of organic-rich siliceous mud shed is 5.7%, that of organic-rich silty mud shed is 5.1%, that of deep water silty mud shed is 4%, that of shallow water silty mud shed is 3.7%, that of lime mud silt shed is 2.8%, that of calcareous silt shed is 1.8% and that of argillaceous silt shed is 1.7% The permeability of similar sedimentary microfacies is generally low, the average value of (A) facies is greater than 3 × 10⁻³ μm2, that of (B) facies is greater than 2 × 10⁻³ μm2 and that of other facies is less than 1.5 × 10⁻³ μm2 (Figure 4d).

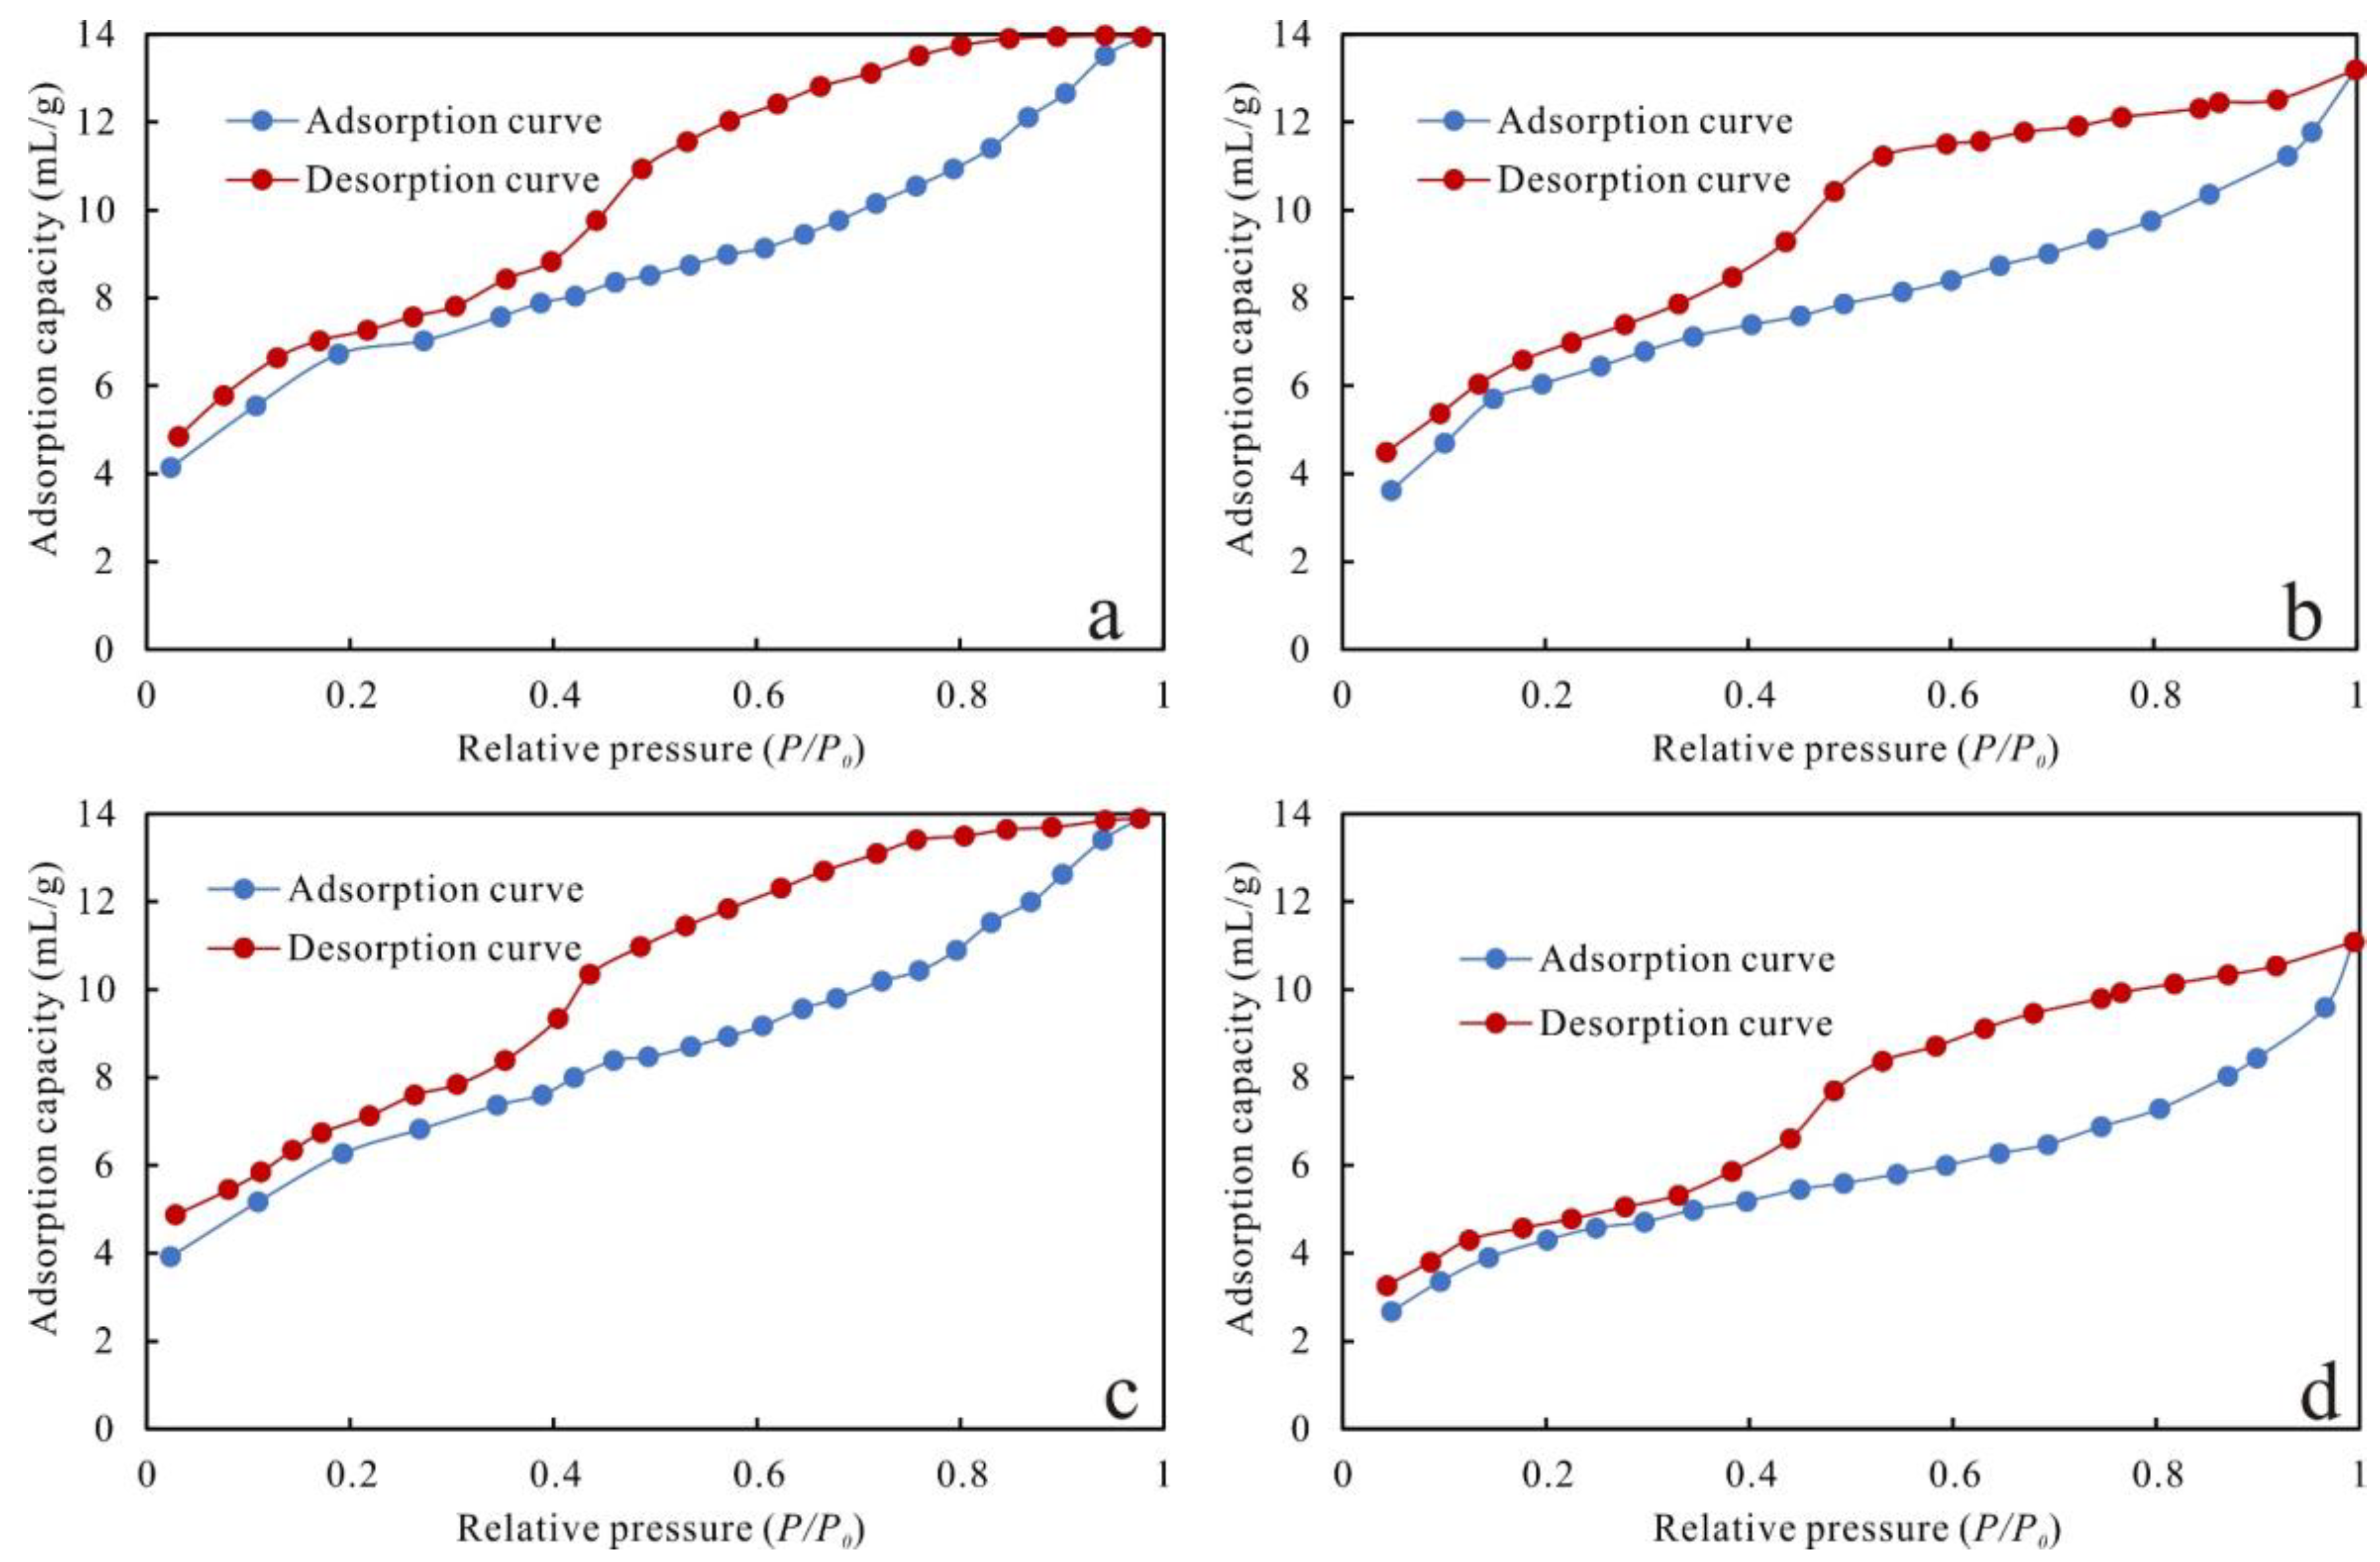
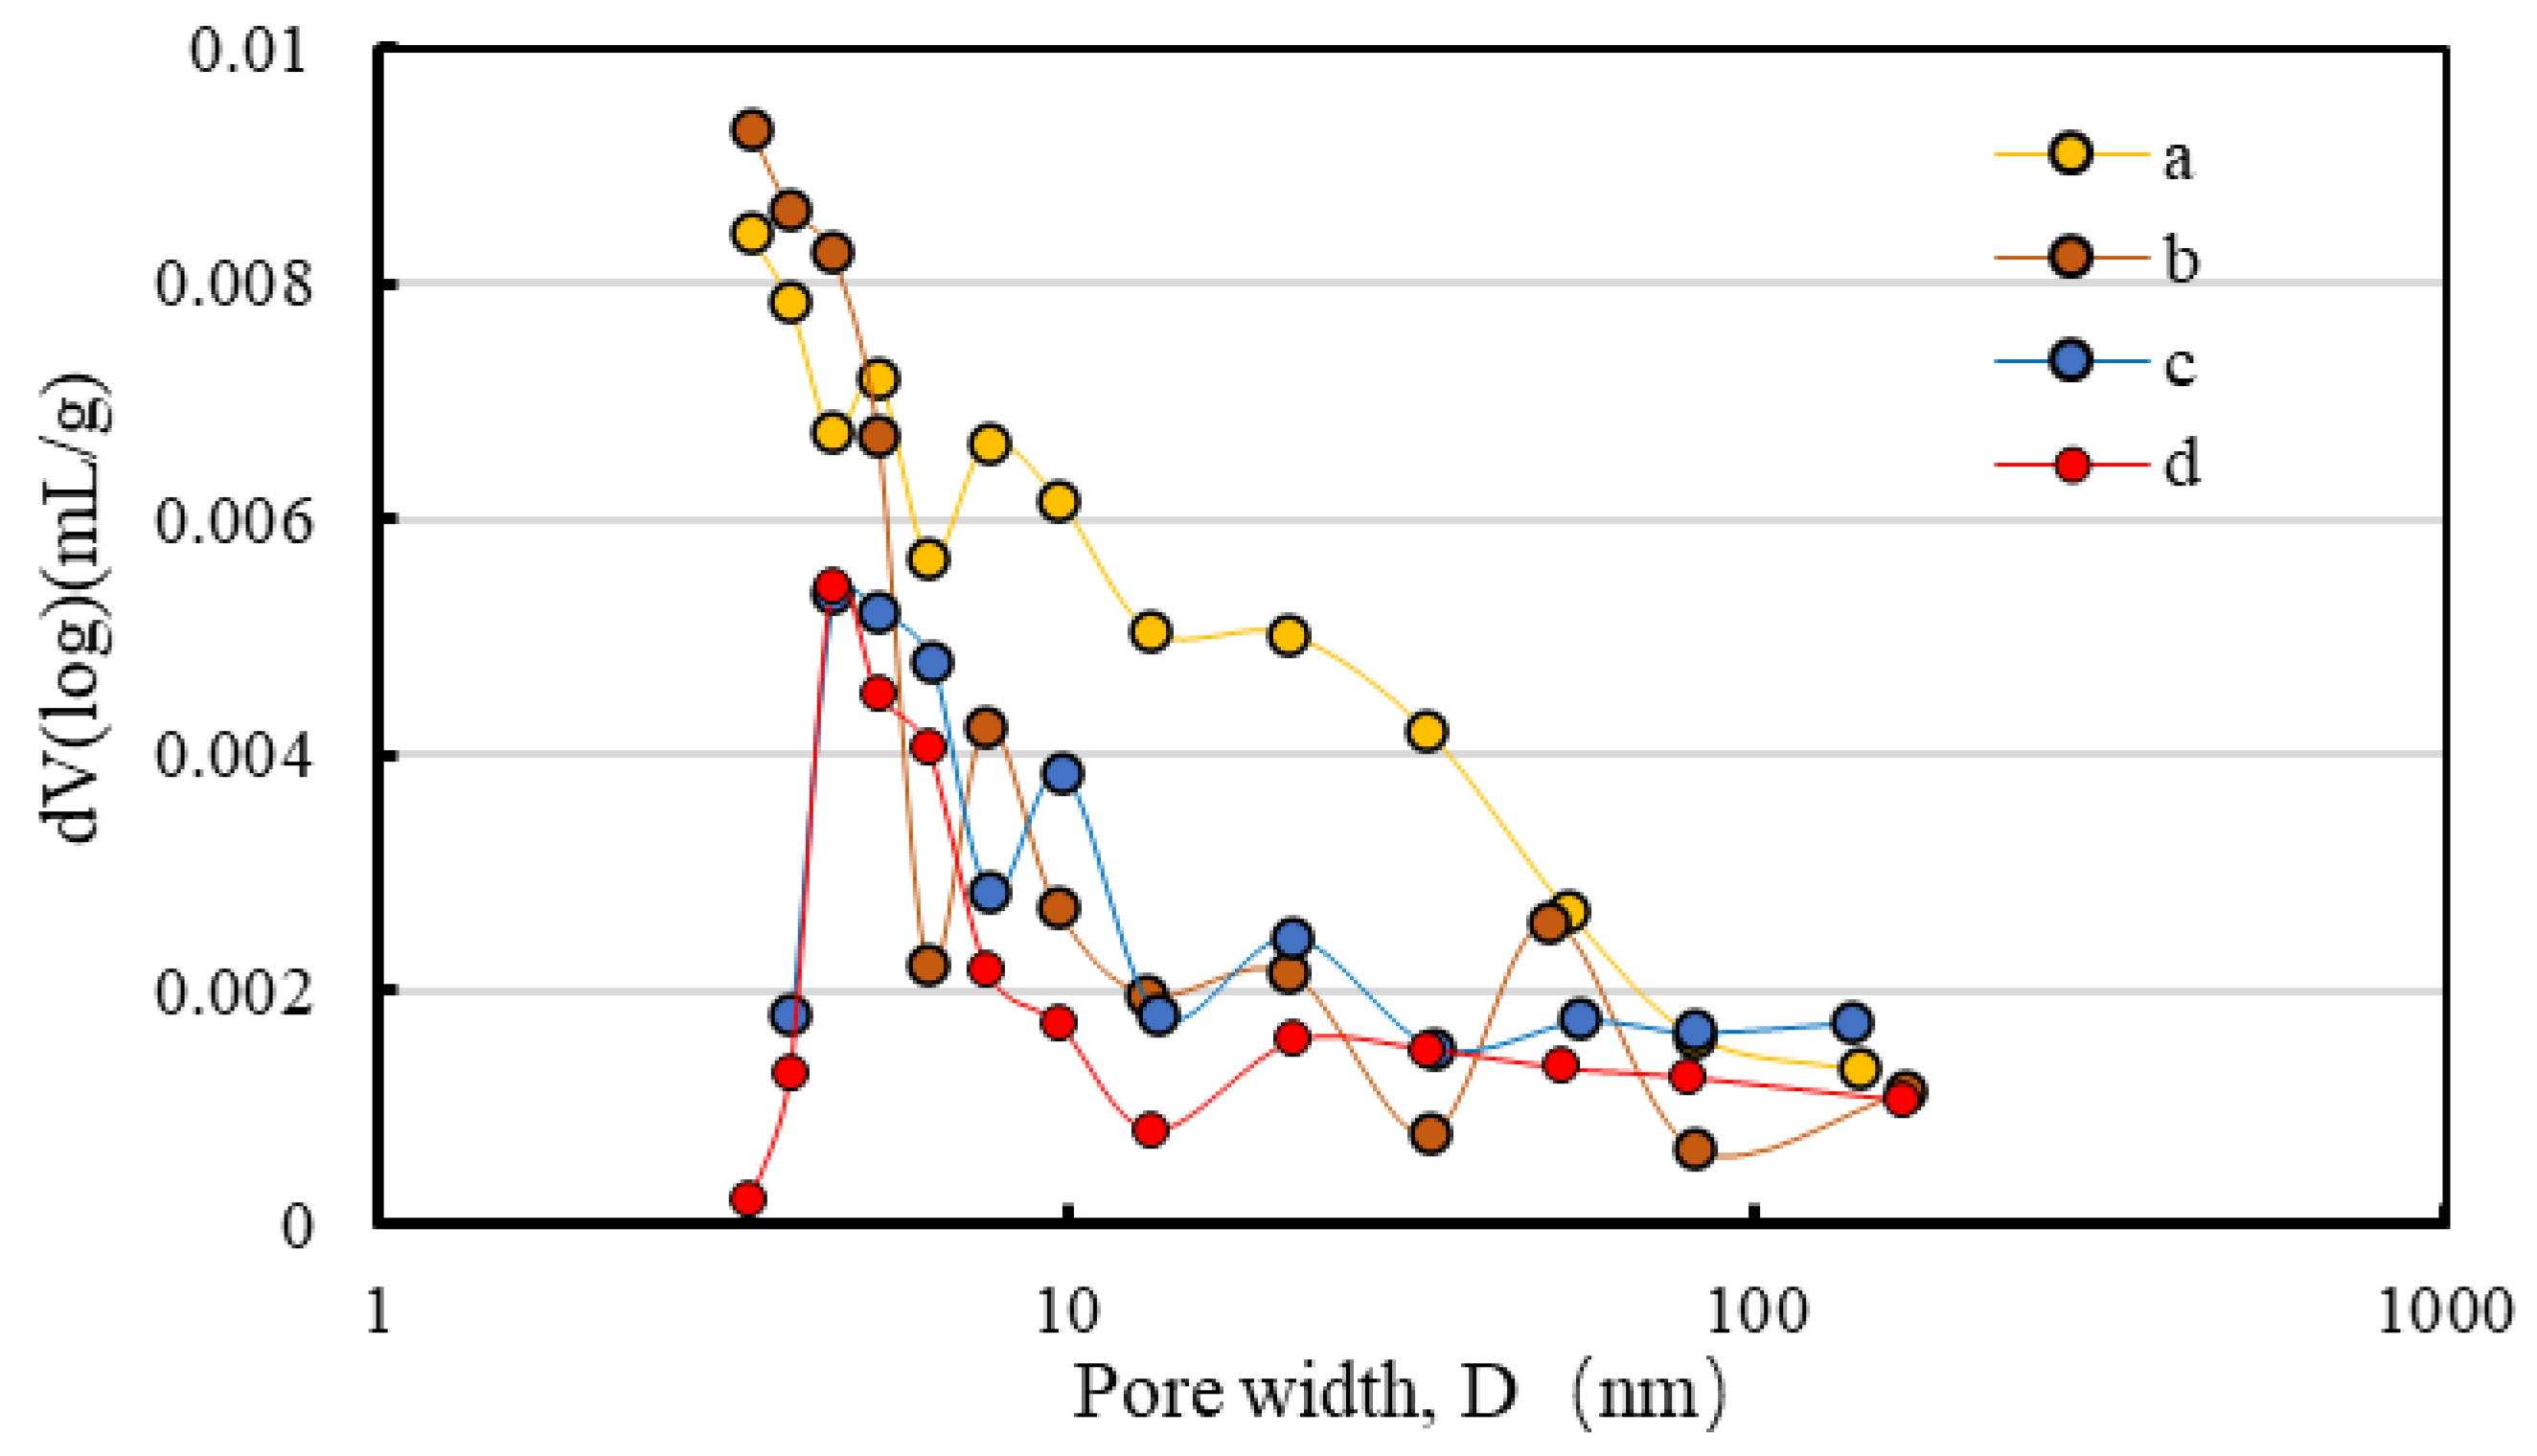
4.2.2. Pore Structure

The pore space in shale is an important reservoir space of shale gas. Research shows that about 50% of a shale gas reservoir is in shale matrix pores [58]). Therefore, the development degree of matrix pore is directly related to the resource evaluation and exploration and development value of shale gas [53,59,60,61]. The pore types of shale can be divided into organic pore and inorganic pore [19]. The shale of the Longmaxi formation in the Changning shale gas field is dominated by organic pore. Organic pores include organic matter pores and biological pores; inorganic pores include micro nano pores, intergranular pores, intragranular dissolved pores, intergranular pores and biological pores.
1. Intergranular pores are micropores and lamellar pores between clay mineral crystals, or pores between quartz, feldspar, calcite and other accumulations. The pore size ranges from tens of nanometers to a few microns (Figure 5a). Intergranular pore is due to the compaction of diagenesis and the transformation of water loss during burial, which causes the rearrangement, deformation, or fracture of clay points. The geochemical environment of medium changes from acidic medium to alkaline medium. At this time, the clay mineral kaolinite transforms into montmorilloniteand illite, and dehydration occurs between layers to form interlaminar schistose or micropores.
2. The dissolution pores in grains are mainly formed by the dissolution of unstable minerals such as feldspar and carbonate rocks. The formation of such dissolution pores is mainly due to the dissolution of a large number of organic acids or CO2 in water during hydrocarbon generation of organic matter, and the formation of secondary dissolution pores by interaction with unstable minerals. The pore size of the dissolution pore is relatively small and connected with the dissolution fracture, mainly distributed between 0.02 μm and 2.5 μm (Figure 5b).
3. Intracrystalline dissolved pores are pores formed by selective dissolution of crystals or grains, which are located in quartz, dolomite, calcite, feldspar and other mineral crystals, mostly along the joint direction. The pore size is mainly distributed from 0.2 μm to 5 μm (Figure 5c).
4. The intergranular pores of shale mainly refer to the intergranular micropores of raspberry pyrite. The interior of raspberry pyrite is composed of many single particles of pyrite. The diameter of berry-like aggregate is about 2 μm to 10 μm, and the interior is composed of smaller pyrite particles. Through the study of outcrop samples and downhole samples, it is found that a large number of strawberry-like pyrite intragranular pores, with different shapes and sizes, are abundant, and the pore sizes are mainly distributed in the range of 100 nm to 500 nm (Figure 5d)
5. Organic pores are mainly formed in the process of thermal evolution of organic matter, generally formed in the high to over mature stage of thermal evolution of organic matter, and the micro pores and micro cracks produced by thermal degradation of kerogen after oil and gas generation. It is generally considered that organic matter pores are important reservoir sites of shale gas. Under the electron microscope, the organic matter pores are honeycomb in structure (Figure 5e), belonging to the internal pores of kerogen, with pore sizes ranging from 5 nm to 200 nm, and the main body is about 150 nm; they also appear with a regular pit shape, a dense network, or a round oval shape occurring at the boundary between organic matter and mineral particles. This type of pore is widely developed in shale reservoirs, in which micropore and mesopore account for a large proportion, which contributes greatly to the specific surface area and pore volume of shale, and is the main reservoir space for adsorbed gas. The organic matter in the Longmaxi formation shale is mainly distributed in dispersed form, and the honeycomb-like micropores are generally developed in the shale, with pore size of 0.002 μm to 1 μm.
6. The biological cavity pore mainly refers to the space in the biological cavity, such as brachiopods, sponges and ostracods. It belongs to the space formed after the body decay in the biological cavity, but it is often filled with cement or asphalt. Moreover, these fossil fragments are porous and have a certain reservoir property, but the permeability is poor, so they make little contribution to the storage and permeability. In this area, there are mainly fossil foramen of sponge spicules and Ostracoda (Figure 5f), with pore sizes ranging from 10 μm to 50 μm.
Loucks et al. proposed that shale pores include organic matter pores and inorganic pores, and there are many pore forms. Matrix pores can be divided into intergranular pores, intragranular pores and organic pores according to their types [45]. The organic matter pore makes obvious contributions to the storage and permeability space, while the intragranular pore, especially the berry-shaped pyrite pore, has little significance for shale gas reservoirs and seepage due to its poor connectivity [33,37,38,41,62,63].
The shale of the Longmaxi formation in the study area is dominated by organic matter pores, followed by intergranular pores and the least intragranular pores. Organic pores have irregular, bubble and elliptical shapes, and their length is usually 5 nm~750nm (Figure 6a–e). Generally, they are isolated from each other in two-dimensional space, but they show good connectivity in three-dimensional space (Figure 6f–h) [64]. The higher the content of organic matter, the greater the maturity (<2.0%) and the more developed the organic pores [7,9,23]. From bottom to top, with the change of burial depth, the sedimentary environment of the Longmaxi formation gradually transits from deep water to shallow water. With the decrease of organic matter content, organic matter pores decrease.

5. Discussion

5.1. Influence of Sedimentation on Reservoir Distribution

The shale of the Longmaxi formation was mainly formed in shelf sediments in a reducing environment, and the distribution of effective shale is obviously controlled by sedimentary facies. Generally speaking, effective shale refers to the shale gas reservoir with TOC > 2% and gas content > 2.0 m3/t.
Due to the influence of the sedimentary environment, TOC content is not uniform in the region, and the closer to the sedimentary center, the higher the TOC content. Therefore, the decline of relative sea level determines the deposition and preservation of organic matter. The deeper the water body is, the quieter the sedimentary environment is, and the more favorable it is for the deposition and preservation of organic matter [20,30]. The black shale and black calcareous shale at the bottom of the Longmaxi formation have a high abundance of organic matter with TOC content ranging from 2.0% to 7.12%.
Vertically, the sedimentary microfacies of the Longmaxi formation are organic rich siliceous mud shed microfacies and calcareous silty mud shed microfacies (Figure 7). The evolution of the facies sequence is accompanied by a gradual decrease in porosity.
Among them, the rich organic siliceous mud shed microfacies (A) and the rich organic silty mud shed microfacies (B) in the deep-water shelf facies have the best physical properties, which are the main producing layers of shale gas. The development of these two sedimentary facies was the basic condition for the formation of large-scale organic-rich black shale high-quality reservoir development. First of all, the long-term under compensated anoxic environment was conducive to the enrichment and preservation of organic matter, which provided a basis for the development of organic pores and was conducive to the formation of a shale gas reservoir space. Secondly, the deep-water shelf subfacies shale has a high content of brittle minerals. The better the brittleness of the rock, the better the fracture formed and the physical properties of the reservoir will be improved [7,20].
Organic rich siliceous shale shed facies and organic rich silty mud shed facies are high-quality shale reservoir development facies, mainly distributed in the S111−1 member, and the sedimentary characteristics of the four small layers in S111−1 member also have obvious differences.
S111−1a: Carbonaceous mud shed deposits are developed. The lithology is dominated by black carbonaceous graptolite shale, containing a large number of pyrite laminations and calcite bands. Graptolites are very rich, various and large in size.
S111−1b: Carbonaceous mud shed deposits are developed, and the lithology is black carbonaceous shale, which is a progradational reverse cycle in which the water body of high system tract rises rapidly and then decreases slowly; it contains calcareous nodules, rich in graptolite, pyrite bedding distribution, graptolite types, and individual preservation is complete.
S111−1c: The limestone mud shed deposition occurring with a slowly receding waterbody is mainly composed of gray-black calcareous shale, containing calcareous and pyrite nodules; graptolite is very rich in various types and sizes.
S111−1d: The inner part is a reverse cycle in which the water body slowly recedes, which is composed of calcareous and silty mud shed deposits, containing a small amount of mud and pyrite nodules; graptolite types are small, and most of them are small harrow graptolite and single graptolite, and a small amount of relatively large individual graptolite, petal graptolite, palisade graptolite, etc.
S111−2: The sedimentary cycle is a process of gradual regression of high system tracts, with large sections of sand shale interbedding or an interbedding lithologic combination, which is silty mud shed facies deposition. The sedimentary structures include tempestite, calcareous nodule, parallel bedding, etc. The number of graptolites is small, the number of graptolites at the bottom is the most, and the shape is coarse and complete.
The results of a physical property analysis of 200 shale samples from the first member of the Longmaxi formation in the Changning area shows that the density of shale rock ranges from 2.43 g/cm3 to 2.74 g/cm3, with an average of 2.64 g/cm3. The porosity ranges from 1.84% to 9.10%, and 46.3% of the samples are mainly distributed in the range of 2%–6%. About 45.6% of the samples have a porosity greater than 4%. The average porosity of the four sections is greater than 4.5%, and the highest porosity is in S111−1c, with an average porosity of 6.53%. The permeability ranges from 1.75 nd to 1250 nd, with an average of 90.83 nd, mainly distributed between 1 nd and 50 nd, accounting for 79.4% of the total samples, and 13.2% of the total samples with permeability greater than 100 nd (Figure 8).
The pore structure of each shale is mainly composed of organic pores, inorganic pores and inorganic fractures, and the proportion of pore composition is different. The proportion of organic pores in S111−1a is as high as 62%, and up to the S1l1−1d section, the proportion of organic pores is only 22.6% (Figure 8).
The specific surface area test and the common total organic carbon content (TOC) test showed a high value in the S111−1a and S111−1c sections and a low value in the S111−1b and S111−1d section, overall showing a downward trend from bottom to top (Figure 8).
The content of brittle minerals and gas saturation decrease from bottom to top, especially the average gas saturation of the S111−1a section which is 83.24%, while that of the S111−1d section is only 63.86%. The higher the content of brittle minerals, the better the brittleness of the rocks, and the better the later artificial transformation of shale gas reservoirs. The brittleness of rocks is related to the mineral composition. At present, it is mainly believed that quartz forms from biological silicate and that calcite forms from carbonate rock [4]). The content of quartz transformed and replaced by biological opal during diagenetic evolution is high (Figure 8).
A comprehensive comparison shows that the porosity, permeability and gas saturation of the shale in the S111−1 member of the Longmaxi formation decrease upward as a whole. S111−1a and S111−1c are the most favorable for the formation of high-quality shale gas reservoirs.

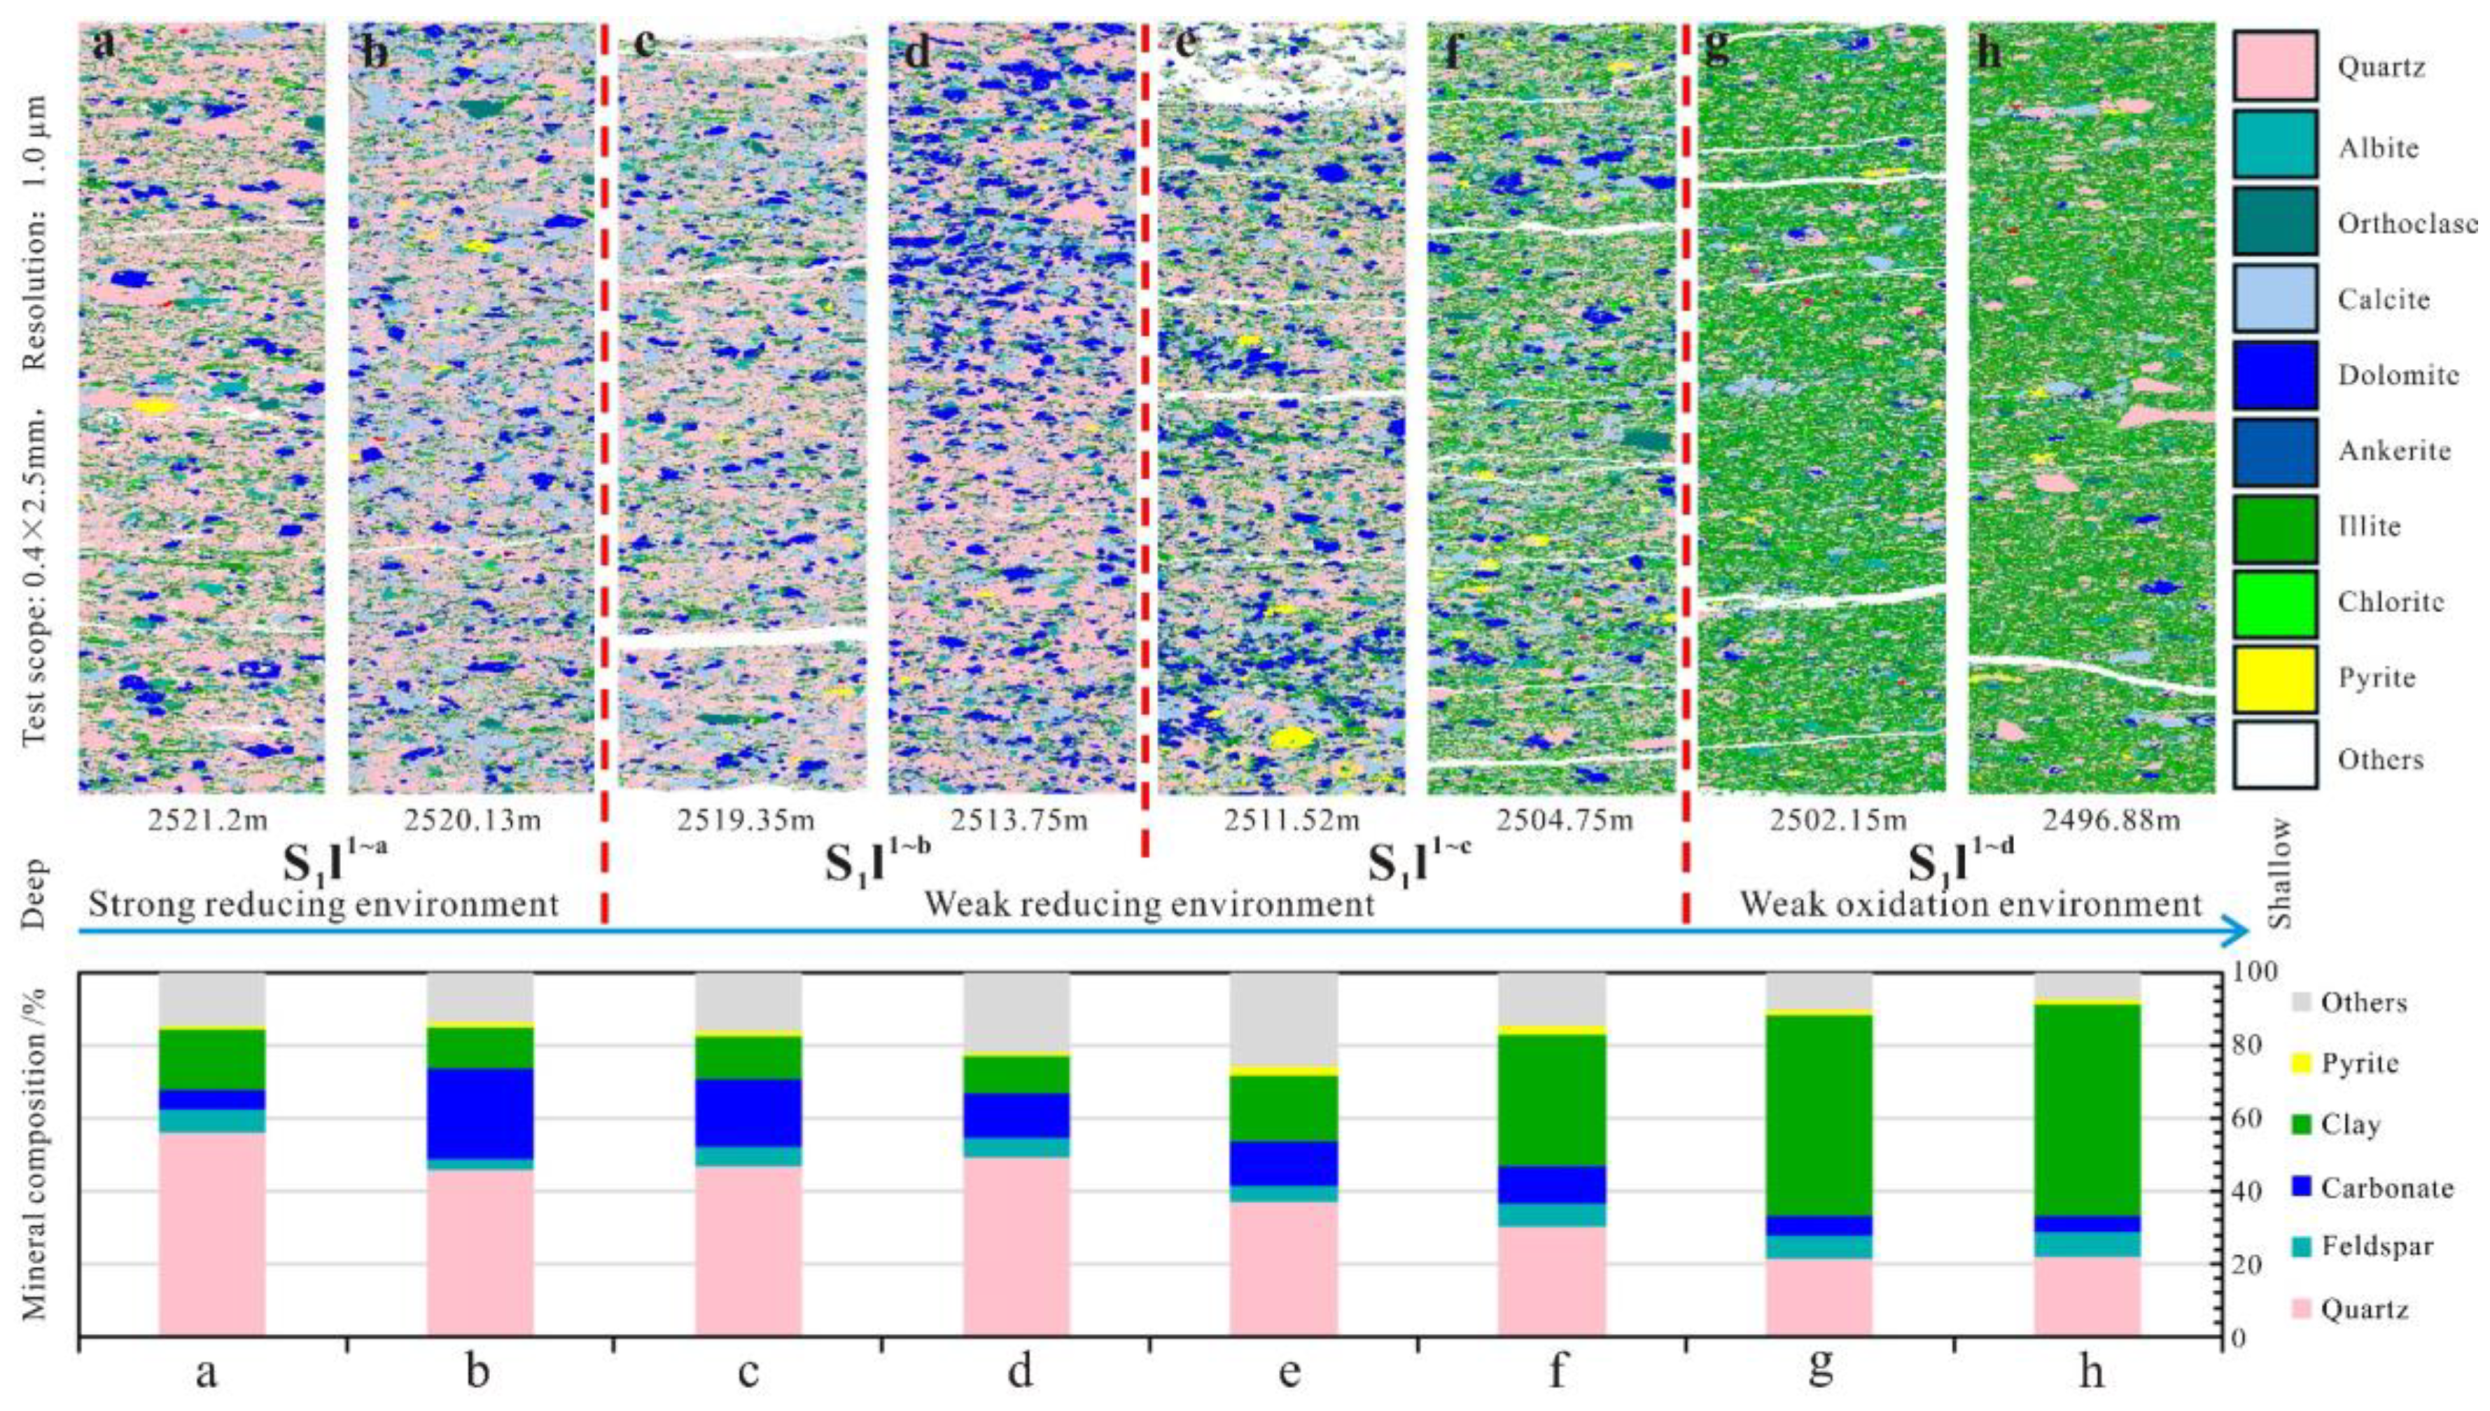
5.2. Influence of Sedimentary Microfacies on Mineral Composition of Reservoir

The differences of sedimentary facies type essentially reflects the different sedimentary provenance, which also determines the difference of mineral composition [48,51]. The results of quantitative analysis of mineral composition show that the main mineral composition of high-quality reservoir developed shale includes quartz, carbonate mineral, feldspar and clay mineral, clay mineral is mainly illite, illite mixed layer (I/S) and chlorite (Table 1). The formation, transformation and disappearance of minerals and the different influences of paleoenvironment, diagenesis and provenance of parent materials are observed.
QEMSCAN tests the mineral composition characteristics of shale in each section. The horizon of the energy spectrum analysis is 0.4 mm × 2.5 mm, and the content of each mineral component is generally stable. The mineral component and organic matter content of shale measured in the horizon can represent the mineral component and organic matter content of the whole shale sample. The area proportion of minerals and organic matter in shale samples can be obtained by QEMSCAN analysis, which can be used to further calculate the proportion of minerals and organic matter (Figure 9).
S1l1−1a~c section is the organic-rich siliceous mud shed microfacies of a deep-water shelf facies in a reduction environment, and the S1l1−1~d layer is the organic rich clay mud shed microfacies in the deepwater shelf. The content of siliceous mineral components in a reduction environment is high at generally more than 30%, the proportion of siliceous minerals in the S1l1−1a and S1l1−1b sections is higher than 45%, and there is a big difference within the S1l1−1c section since at the bottom of the formation the proportion is 37% while the proportion decrease to 30.46% at the top. Due to the oxidation environment of the S1l1−1d section, the siliceous content is less than 22%. In general, with the water depth moving from deep to shallow, the sedimentary environment changes from reduction to oxidation, and the silicon content decreases from bottom to top. The content of clay minerals in the S1l1−1a, S1l1−1b and lower part of S1l1−1c is less than 20%, while that in the upper part of S1l1−1c is 35.95%, and that in S1l1−1d is more than 50%. In addition, the content of carbonate minerals also decreases from bottom to top, with the highest content of 25.19% at the top of S1l1−1a and the lowest content of 4.5% at the top of S1l1-1d (Figure 10, Table 2).
Clay minerals also play an important role in the evolution and preservation of pores. Generally, the change of relative contents of illite and chlorite is opposite to that of pore evolution. The content of illite and chlorite in the bottom of the S1l1 member is significantly reduced, and the shale has high porosity, which provides a good place for shale gas storage.
The siliceous content in shale has an important influence on its pore development. The micro thin section shows that the water body increases from shallow to deep, the U/Th value increases, the clay mineral content decreases, the siliceous content increases gradually, and the mineral particle size becomes smaller (Figure 11a–e). The siliceous content in the deep-water sediments from the far source is higher (Figure 11f). This is consistent with the QEMSCAN test results. At the same time, the quartz in the siliceous shale is mostly biogenetic, mostly from the dissolution and precipitation of radiolarian, siliceous sponge and other siliceous organisms in the diagenetic process. Some pores can be reserved between the microcrystalline authigenic quartz grains, providing storage space for migrating organic matter (Figure 11g). The TOC content of siliceous shale is more than 3.5%, and the porosity of organic matter pore is 32.35%. The bubbles and spongy pores in migrated organic matter can provide a lot of micropores and mesopores for reservoirs.
In general, the evolution of the phase sequence in the first member of the Longmaxi formation is accompanied by the gradual decrease of siliceous content and the gradual increase of clay content. The carbonate mineral content presents two increase/decrease cycles, and the organic matter content and porosity decrease gradually.

5.3. Influence of Sedimentary Microfacies on Pore Structure of High-Quality Reservoir

Based on the density difference of the nano-CT image, the different components of the sample are distinguished by gray scale. Among them, high-density components are bright white (pyrite), medium density components are light gray (quartz, carbonate minerals, clay minerals), low-density components are dark gray (organic matter), and pores (fractures) are black [52]. In the imaging of the nano CT, the intensity range is assigned by interactive thresholding, and the pores, organic matter, matrix minerals and high-density minerals can be defined in turn. After defining the original image, extract the organic matter (blue) (Figure 12b,e,h,k), and calculate the content. The organic matter is lumpy and interconnected, and some are isolated or dotted. The volume of organic matter is about 2.44~7.32%. The organic pores (green) (Figure 12b,e,h,k) in the organic matter were further extracted (Figure 12c,f,i,l). The porosity ratio of organic matter was 7.6%–33.8%. The organic pores (including some fractures) were mainly aggregated and isolated, and their development positions were closely related to organic matter, for shale with high content of organic matter, organic pores are also developed and pore connectivity is good (Figure 12l,f).
From bottom to top, with the change of burial depth, the sedimentary environment of the Longmaxi formation gradually transits from deep water to shallow water. With the decrease of organic matter content, organic matter pores decrease.
The nitrogen adsorption method is the most widely used method to characterize pore structure, which can obtain the statistical information and overall characteristics of pore microstructure [10,17,20,39,56,65]. The adsorption desorption isotherm data can be obtained by experiments. The BET model can be used to obtain the specific surface area, and the BJH model can be used to obtain the pore volume and the pore size and other related parameters [54,62,64,66]. The optimum pore diameter of the low-pressure nitrogen adsorption method is 1–50 nm; it can hardly characterize macropores.
The adsorption curves of typical shale samples from four small layers in the first member of the Longmaxi formation are slightly different in morphology, but the overall adsorption curve is anti-s type. The adsorption and desorption curves of the adsorption isotherm do not coincide with each other at higher pressure, forming an adsorption loop. The adsorption curve shows that the shale of the Longmaxi formation is mainly composed of nano pores, irregular pores, slit-like pores with parallel walls and other pores with multiple forms. The opening degree of the pores is related to the rising rate of the adsorption line. The faster the increase, the greater the opening degree of the pores. From S1l1−1a to S1l1−1d, the degree of pore opening decreases gradually with the depth (Figure 13).
According to the BET model, the specific surface area of the shale reservoir samples in the Longmaxi formation is 9.68 m2/g~25.12 m2/g. According to the BJH model, the specific pore volume of the shale reservoir is 0.017 mL/g~0.027 mL/g, and the pore volume is 0.0651 mL/g~0.1026 mL/g, with an average of 0.011 cm3/g. The calculated pore size of the shale samples is 3.5 nm~7.82 nm, with an average of 5.25 nm (Figure 14). Combined with the distribution of samples and shale specific surface area, specific pore volume, pore volume and pore size characteristics, the specific surface area, pore volume, pore size and maximum adsorption capacity gradually decrease from bottom to top in the Longmaxi formation. At the same time, the pores in the samples are mainly mesopores.
The organic pore is an important pore type for shale gas occurrence and a key index of shale gas reservoir effectiveness. The formation of the organic pore is formed by organic matter volume reduction and gas volume expansion in the process of oil and gas generation, increases with the increase of ground temperature and thermal maturity and is controlled by the development degree of organic matter.
The effect of organic matter on shale formation is mainly manifested in two aspects: one is the material basis of shale gas formation, the higher the content of organic matter in shale, the greater the hydrocarbon generation potential; the other is that part of natural gas in shale that exists in an adsorbed state on the surface of organic matter particles, and the higher the content of organic matter, the higher the content of adsorbed gas [62]. The pore structure parameters are related to TOC content and mineral content (Table 3). The correlation coefficient R2 between pore specific surface area and TOC is 0.6541 (Figure 15a), and the correlation coefficient R2 between porosity and TOC is 0.4479 (Figure 15b), and the correlation coefficient R2 between porosity and pore specific surface area is 0.5113 (Figure 15c).
The correlation coefficient R2 between porosity quartz and specific surface area is 0.394 (Figure 15d). Carbonate minerals and clay are negatively correlated with specific surface area, with correlation coefficients of R2 of 0.3374 and 0.4552, respectively (Figure 15e,f).
Therefore, it can be inferred that the pore specific surface area, pore volume and maximum adsorption capacity of the Longmaxi formation shale in the study area decrease gradually with the decreasing of TOC from bottom to top.
The enrichment of organic matter is usually related to the paleoenvironment [67]. In deep water sediments, the content of organic matter is high and the proportion of organic matter pores is also large. The occurrence probability of organic matter pores in semi-deep water sedimentary shale is low, and the pore type is mainly clay mineral interlayer pore. The organic matter content in shallow water sediments is very little, and the pores are rarely developed.
Shale lithofacies analysis is usually conducted using a mineral component content analysis, but due to limited sampling data and longitudinal discontinuity, in order to better compare the characteristics of shale components in the longitudinal direction, the U/Th value of the logging data is used to compare the TOC vertical heterogeneity of the shale. The value of the S1l1−1a section is between 1.45 and 4.95, with an average of 3.41, which indicates that the whole section was basically in an anaerobic environment with the strongest reducibility, and organic matter was conducive to preservation and enrichment, so TOC content is the highest. The water body of the S1l1−1b section became shallower, and the U/Th value is between 0.55 and 1.40, with an average of 0.75, which indicates that it was basically in a normal oxygen to poor oxygen environment. The reduction condition is obviously weaker than that of long-1a section, and the preservation condition of organic matter is obviously worse than that of S1l1−1a section, so the TOC content is reduced. The U/Th value of the S1l1−1c section ranged from 0.71 to 1.35, with an average of 0.92, reflecting that it was in a poor oxygen anaerobic environment, and its reducibility was slightly enhanced compared with that of the S1l1−1b section, so the TOC content in the section was increased. The U/Th value of the S1l1−1d section is between 0.33 and 0.85, with an average of 0.67, reflecting that it was in the normal oxygen to poor oxygen environment, with the weakest reduction, so the TOC content is the lowest. The changes of paleoenvironment controlled the heterogeneity of TOC content and porosity.

6. Conclusions

In this work, 325 shale samples from the Longmaxi Formation in the South Sichuan Basin were investigated by thin section, scanning electron microscopy (SEM) and Qemscan analysis, X-ray diffraction (XRD), total organic carbon (TOC), Nano-CT scanning and Low-pressure N2 adsorption (N2GA) analysis. On the basis of these analyses the sedimentary characteristics, mineral composition, pore structure and controlling factors of high-quality reservoir development were studied. The following conclusions can be made:
(1)
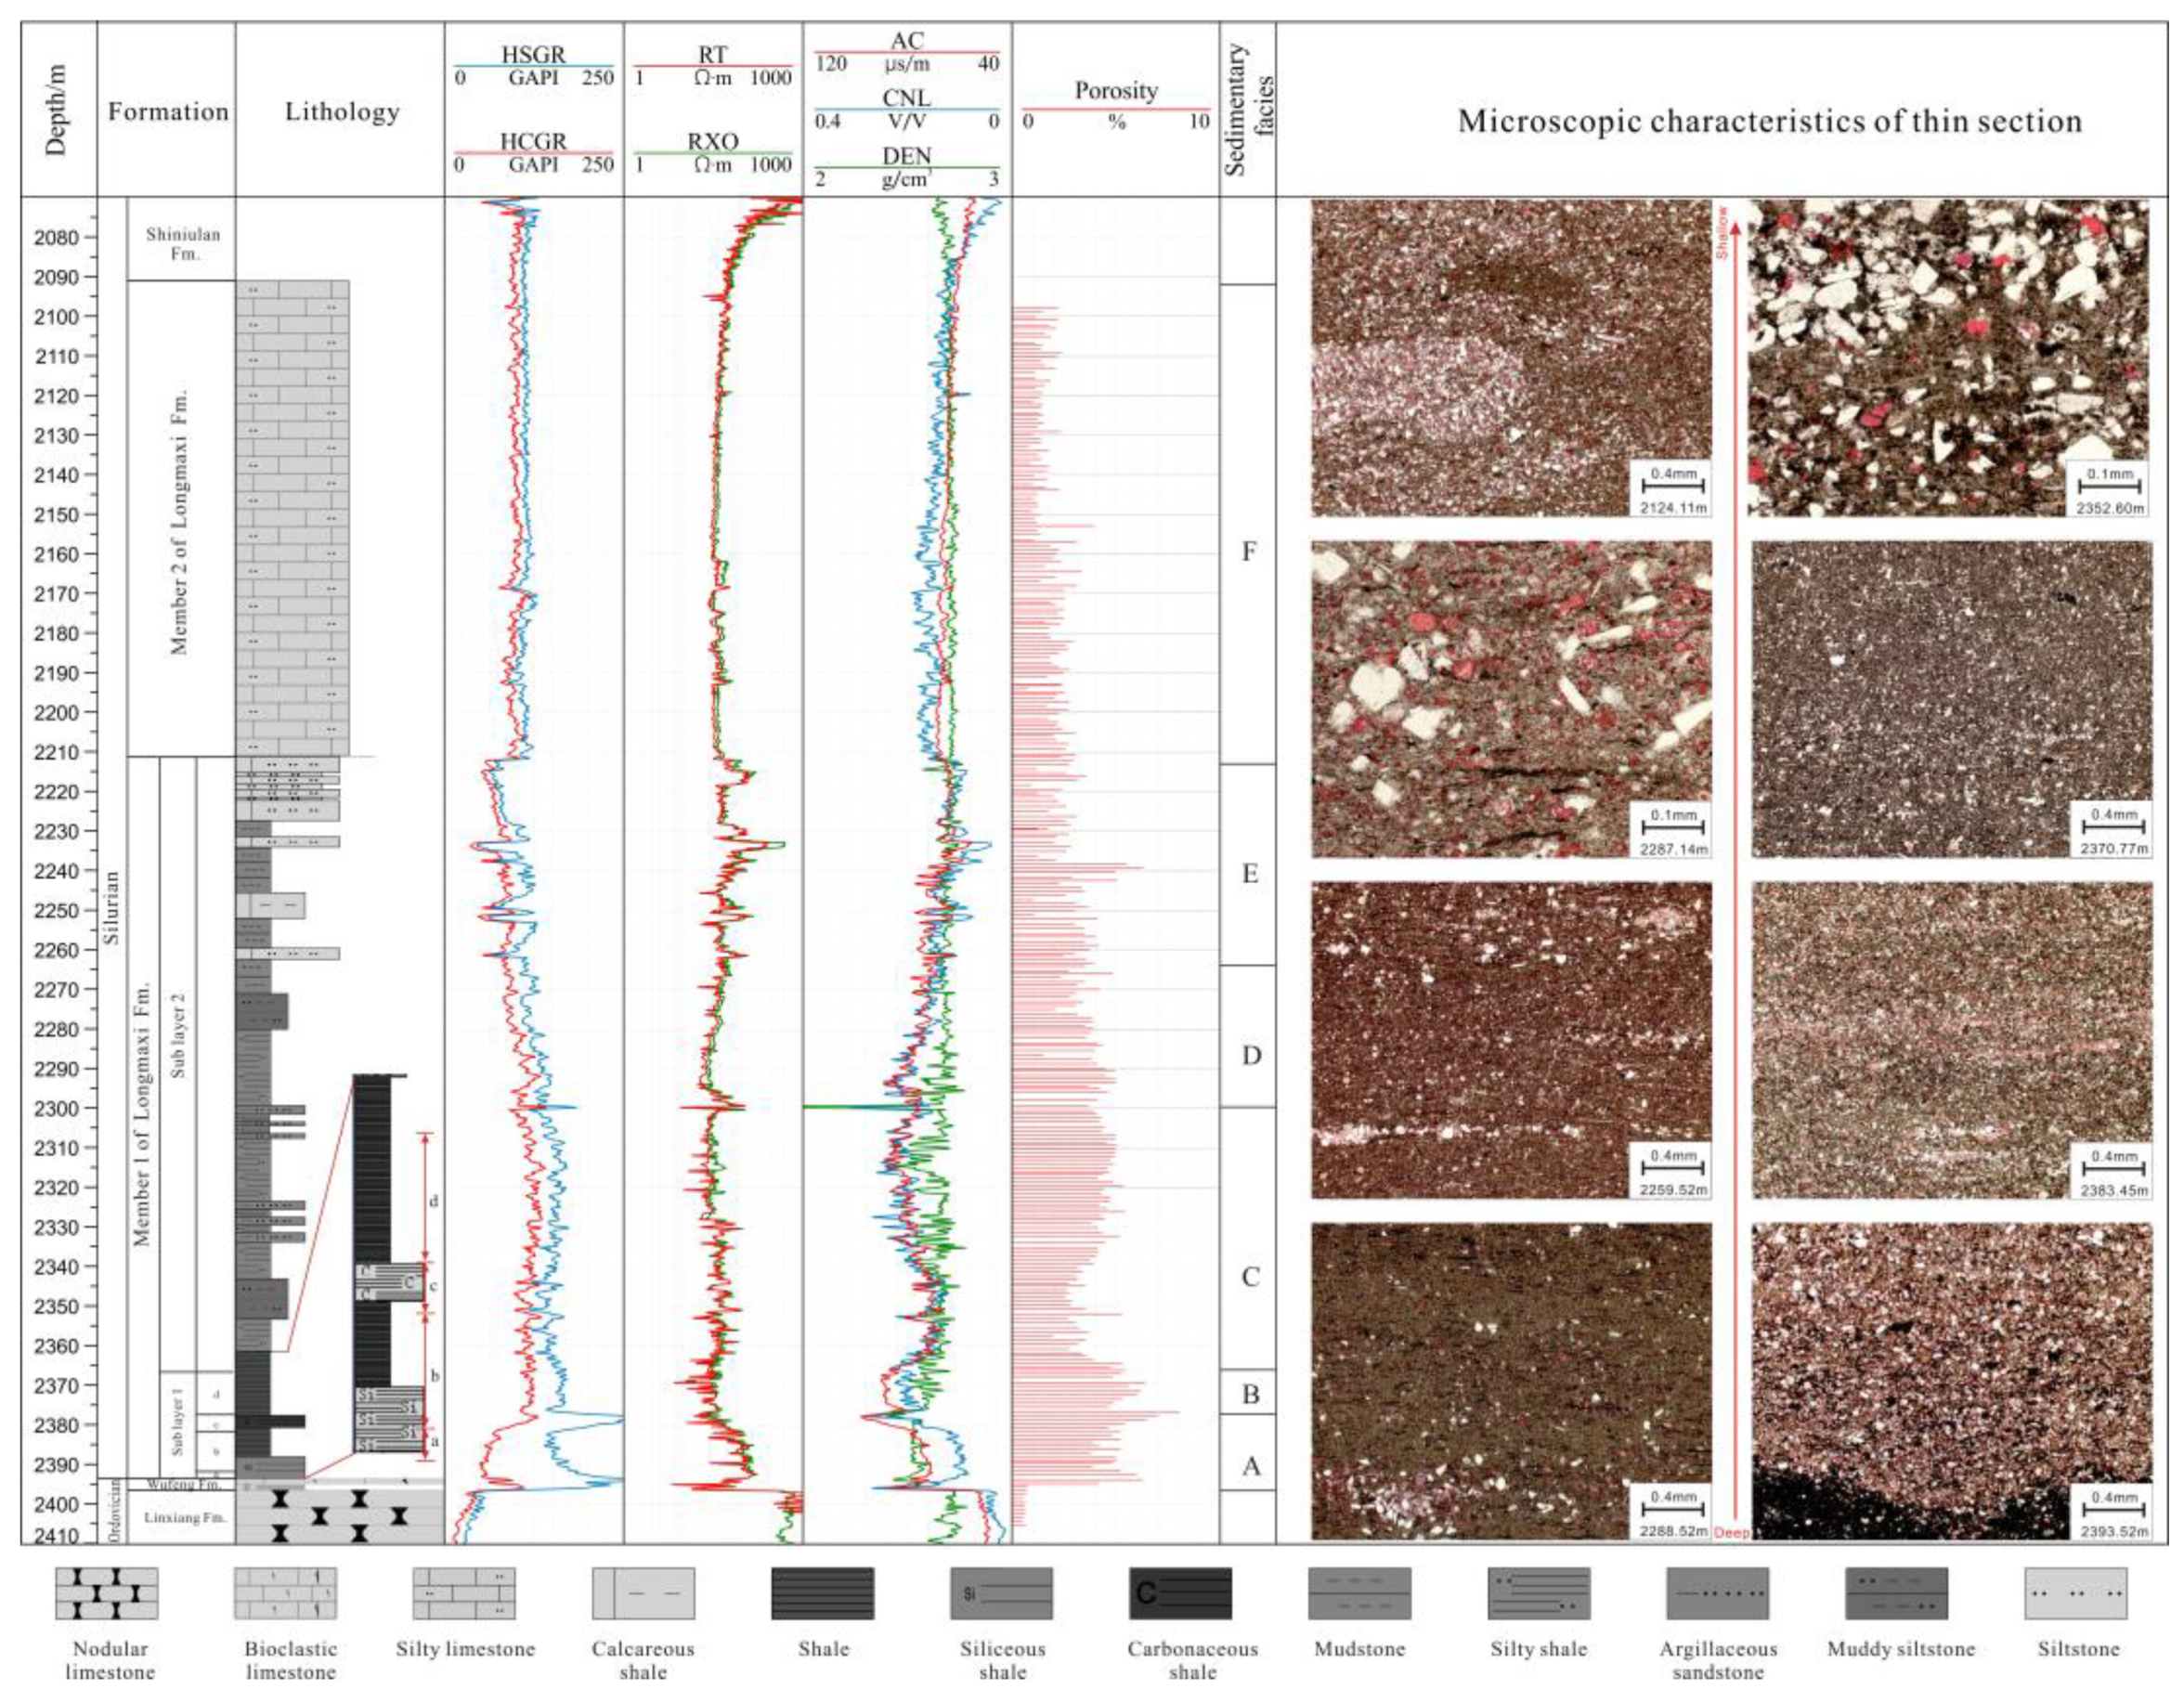
In the south of the Sichuan Basin, shore shelf sedimentary units developed successively from land to sea. In the early stage of the Longmaxi formation, it was located in the sedimentary facies zone of the offshore shelf with still water featuring an anoxic and reductive environment According to lithology, sedimentary structure, organic carbon content and mineral composition, six sedimentary microfacies can be divided, which are organic-rich siliceous mud shed microfacies, organic rich silty mud shed microfacies, deep water silty mud shed microfacies, shallow water silty mud shed microfacies, lime muddy silt shed microfacies and calcareous silty mud shed microfacies.
(2)
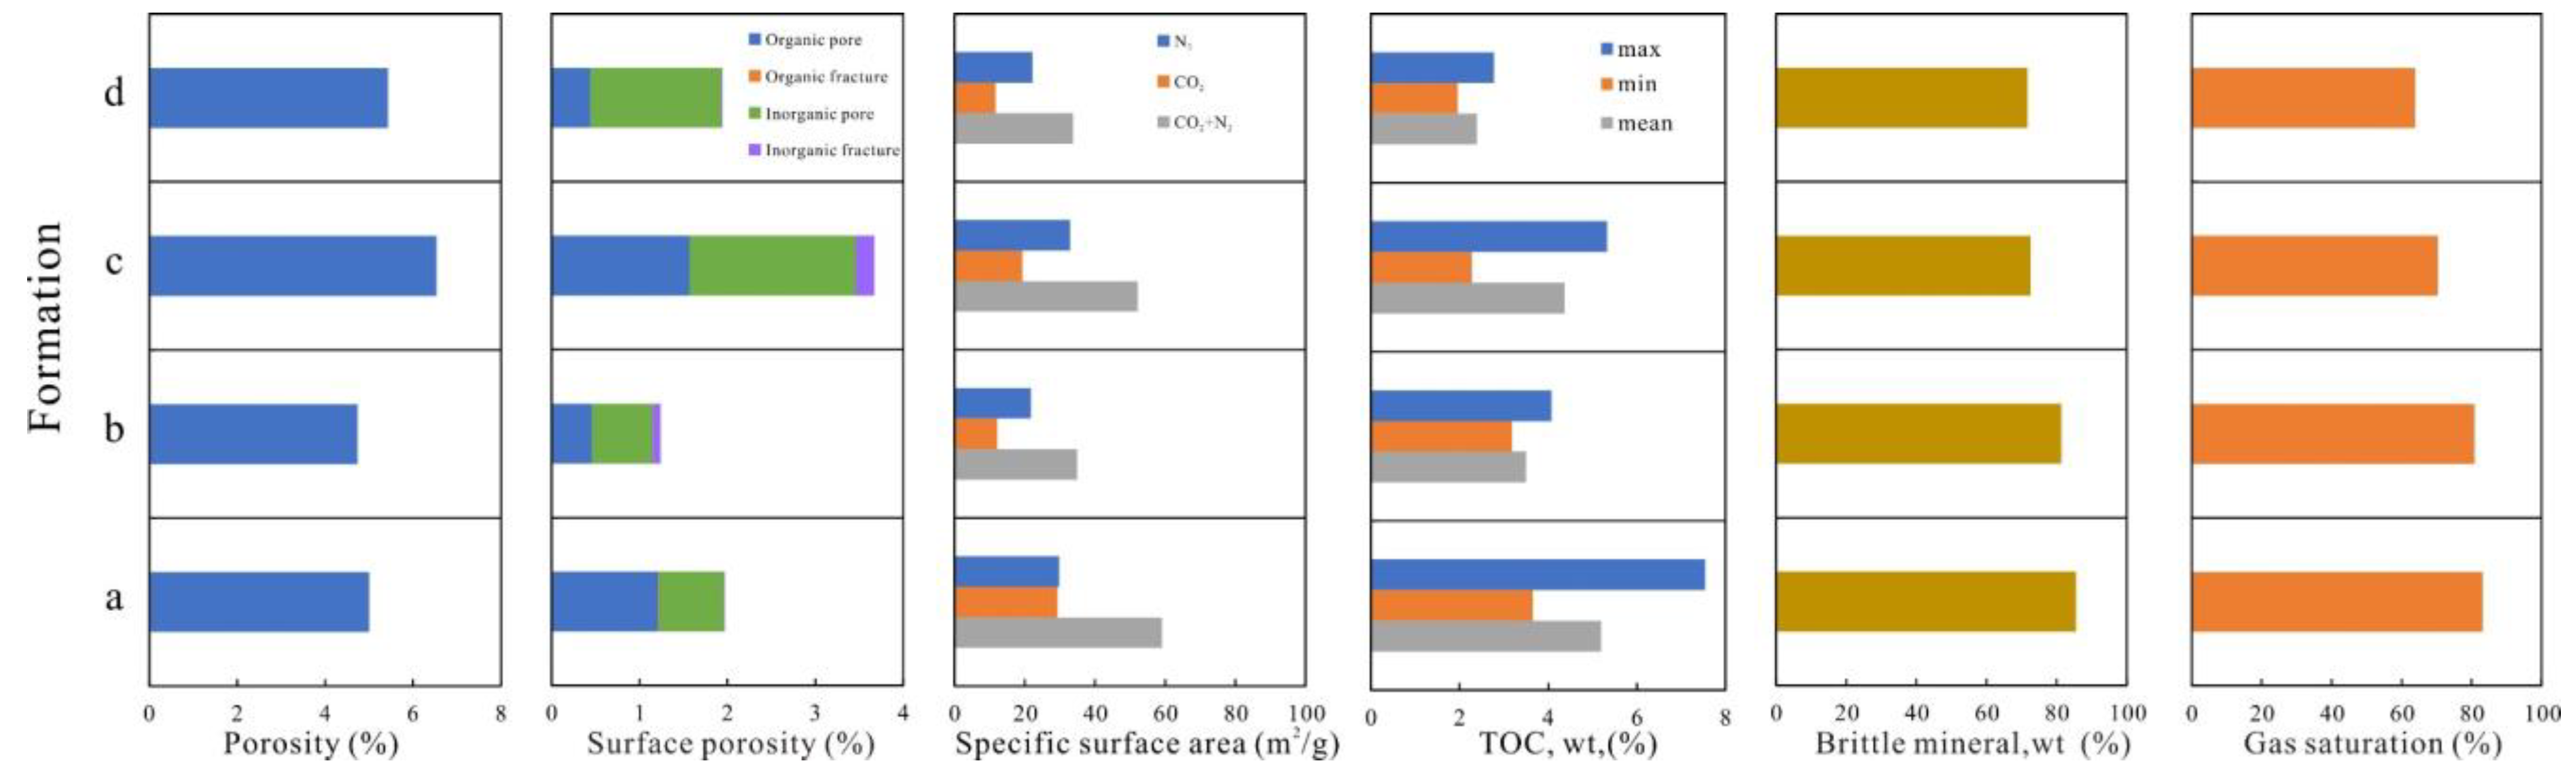
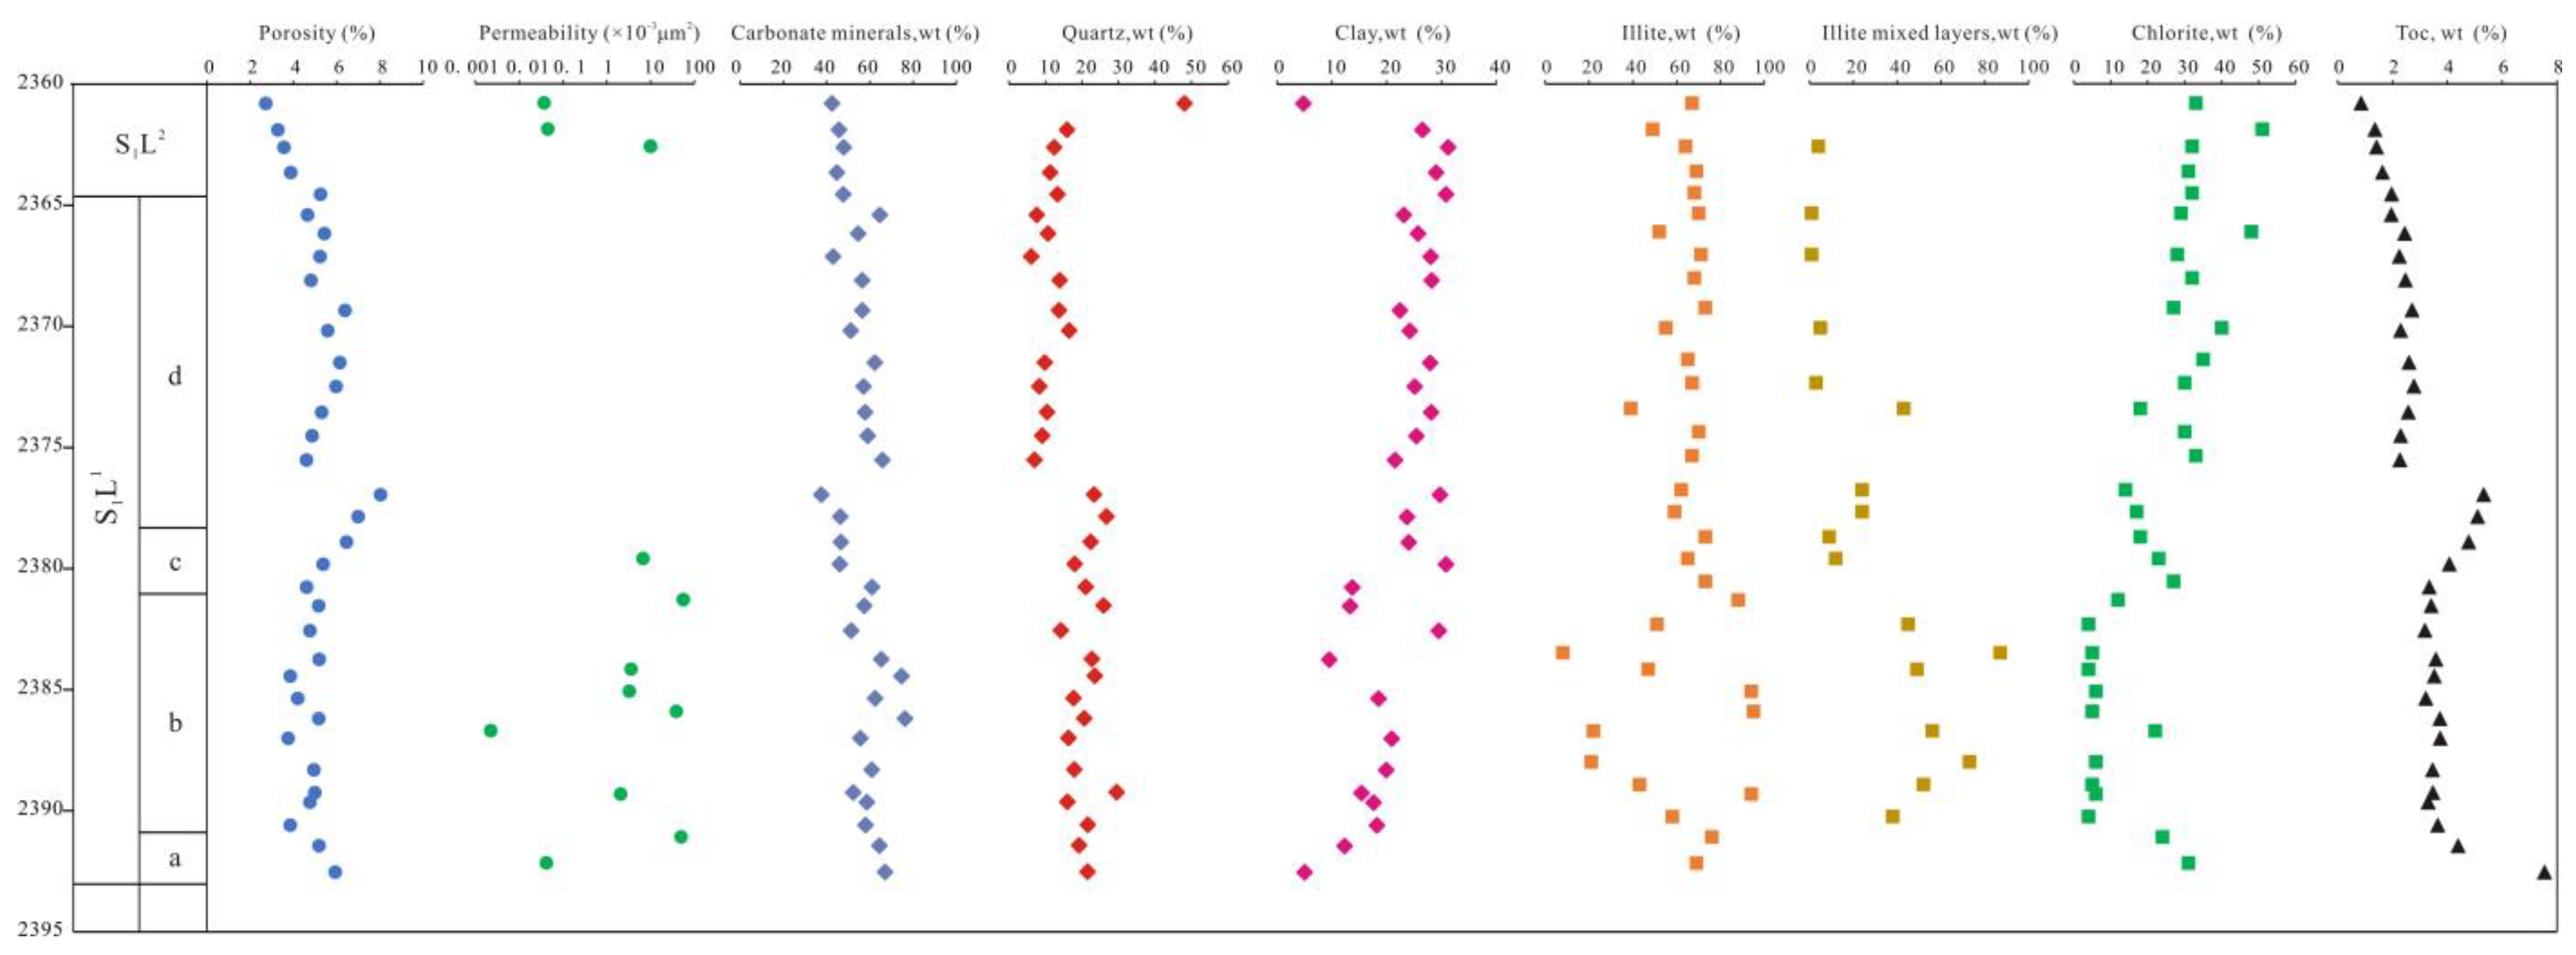
The shale porosity in the Changning area is mainly distributed in the range of 0.71–10.3%, with an average of 5%. The permeability ranges from 0.00016 × 10⁻³ μm2 to 9.9 × 10⁻³ μm2, with an average of 2.21 × 10⁻³ μm2. The organic matter content of the organic-rich siliceous shale and the organic rich silty shale is high, which provides the basis for organic pore development. The average porosity is more than 5%, and the permeability is more than 2 × 10⁻³ μm2; these two facies are the most favorable sedimentary facies for the formation of a high-quality shale gas reservoir.
(3)
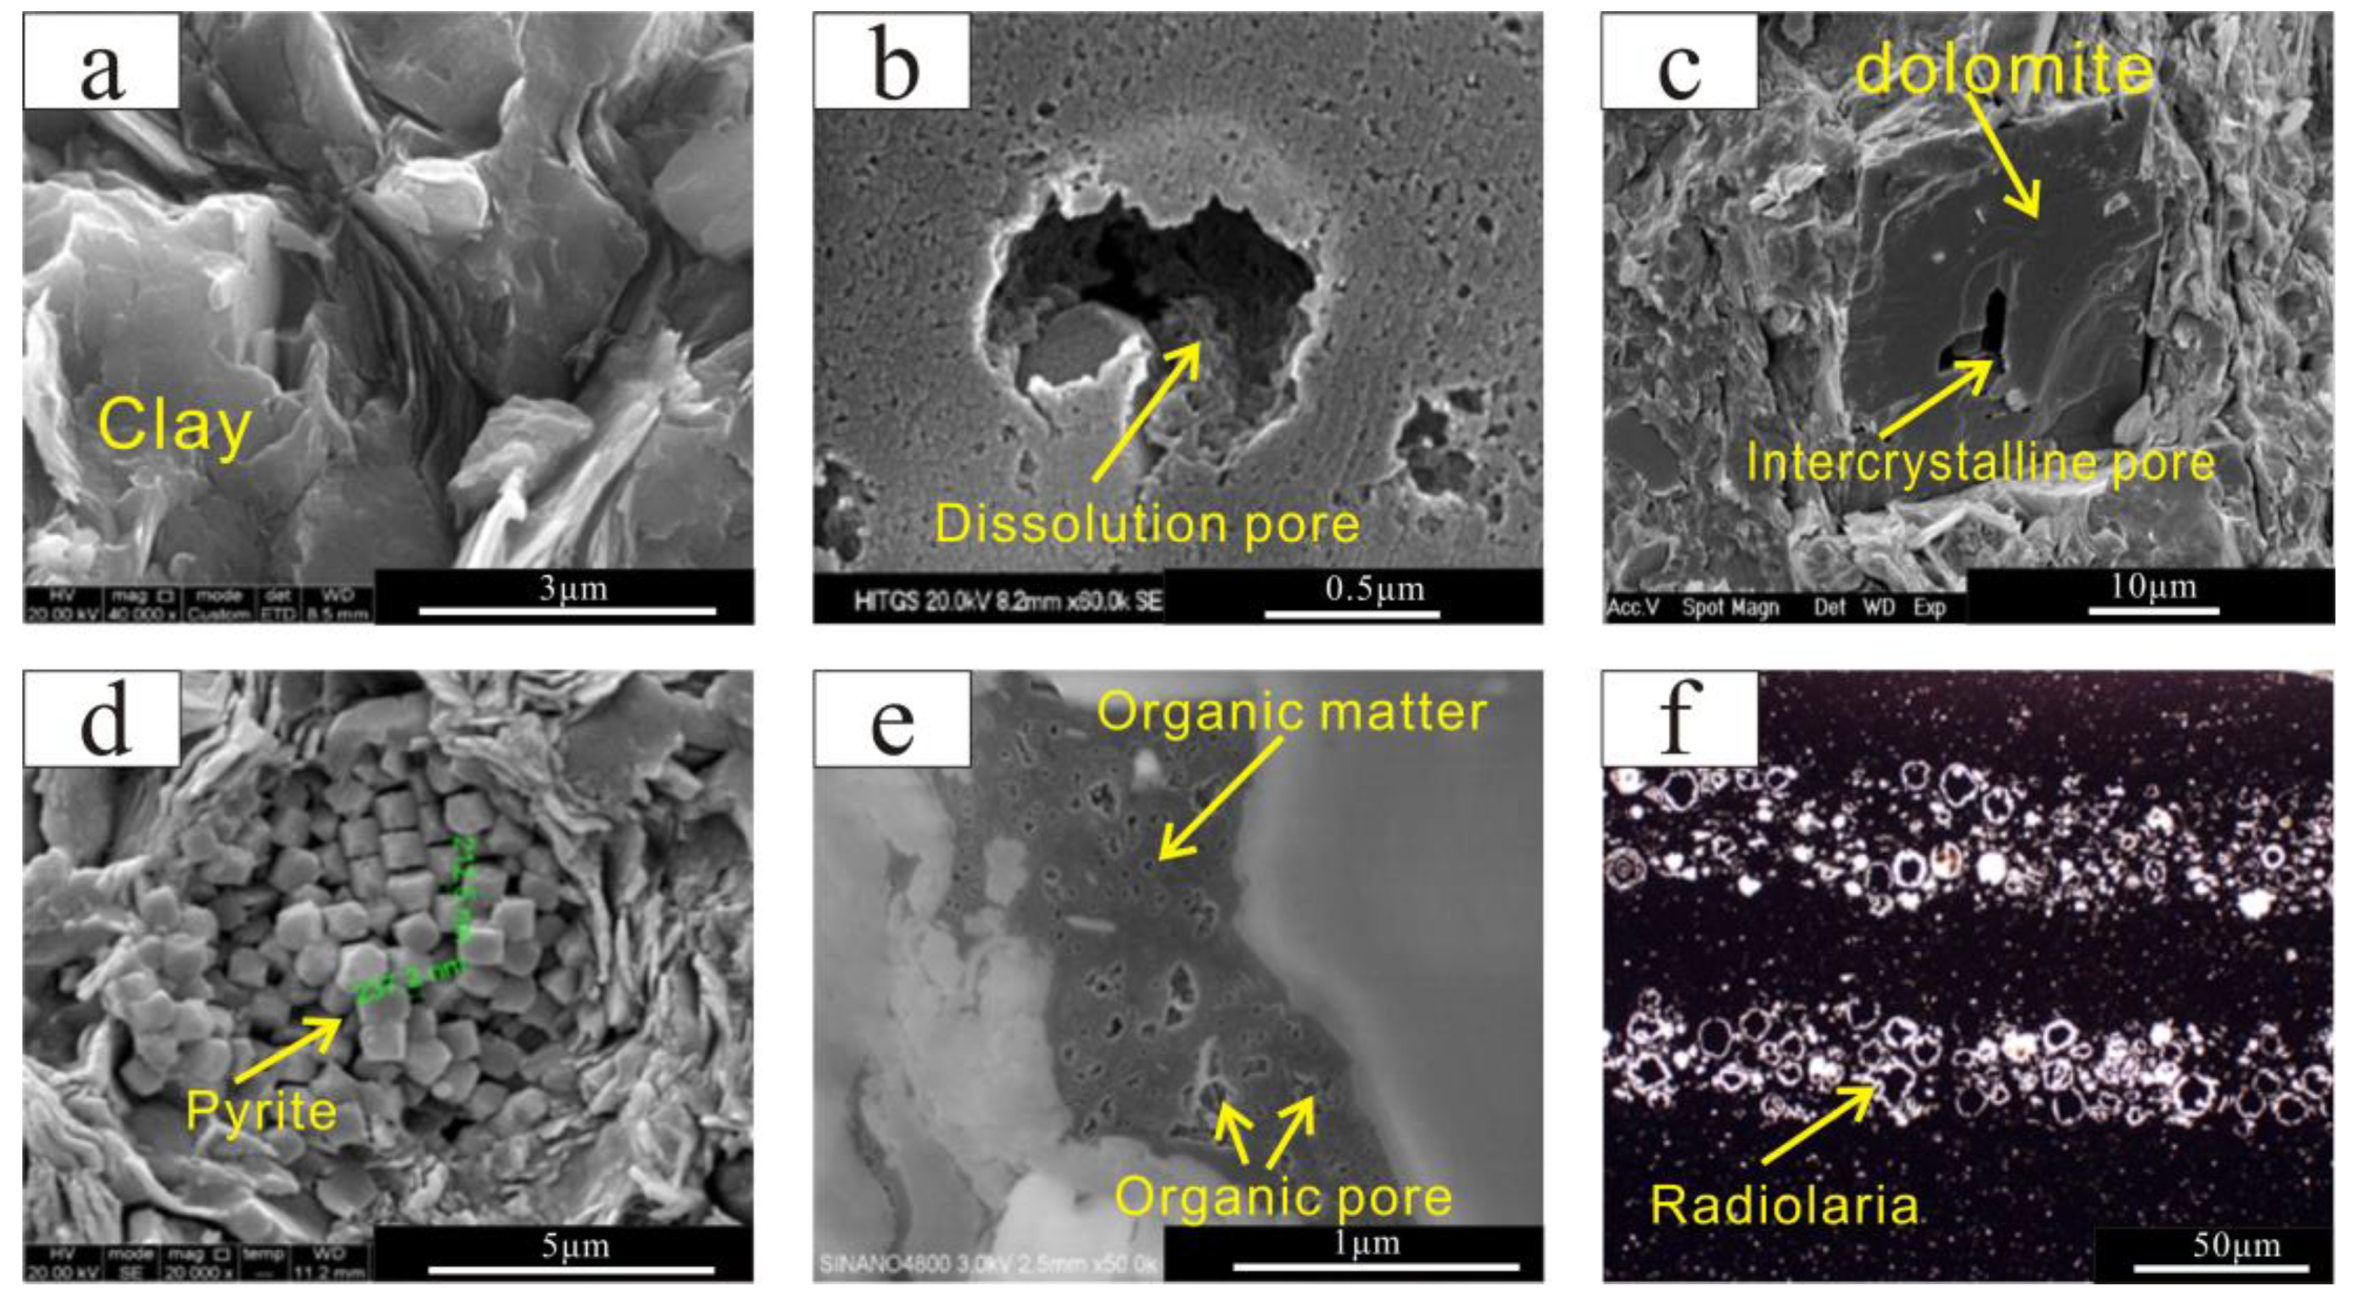
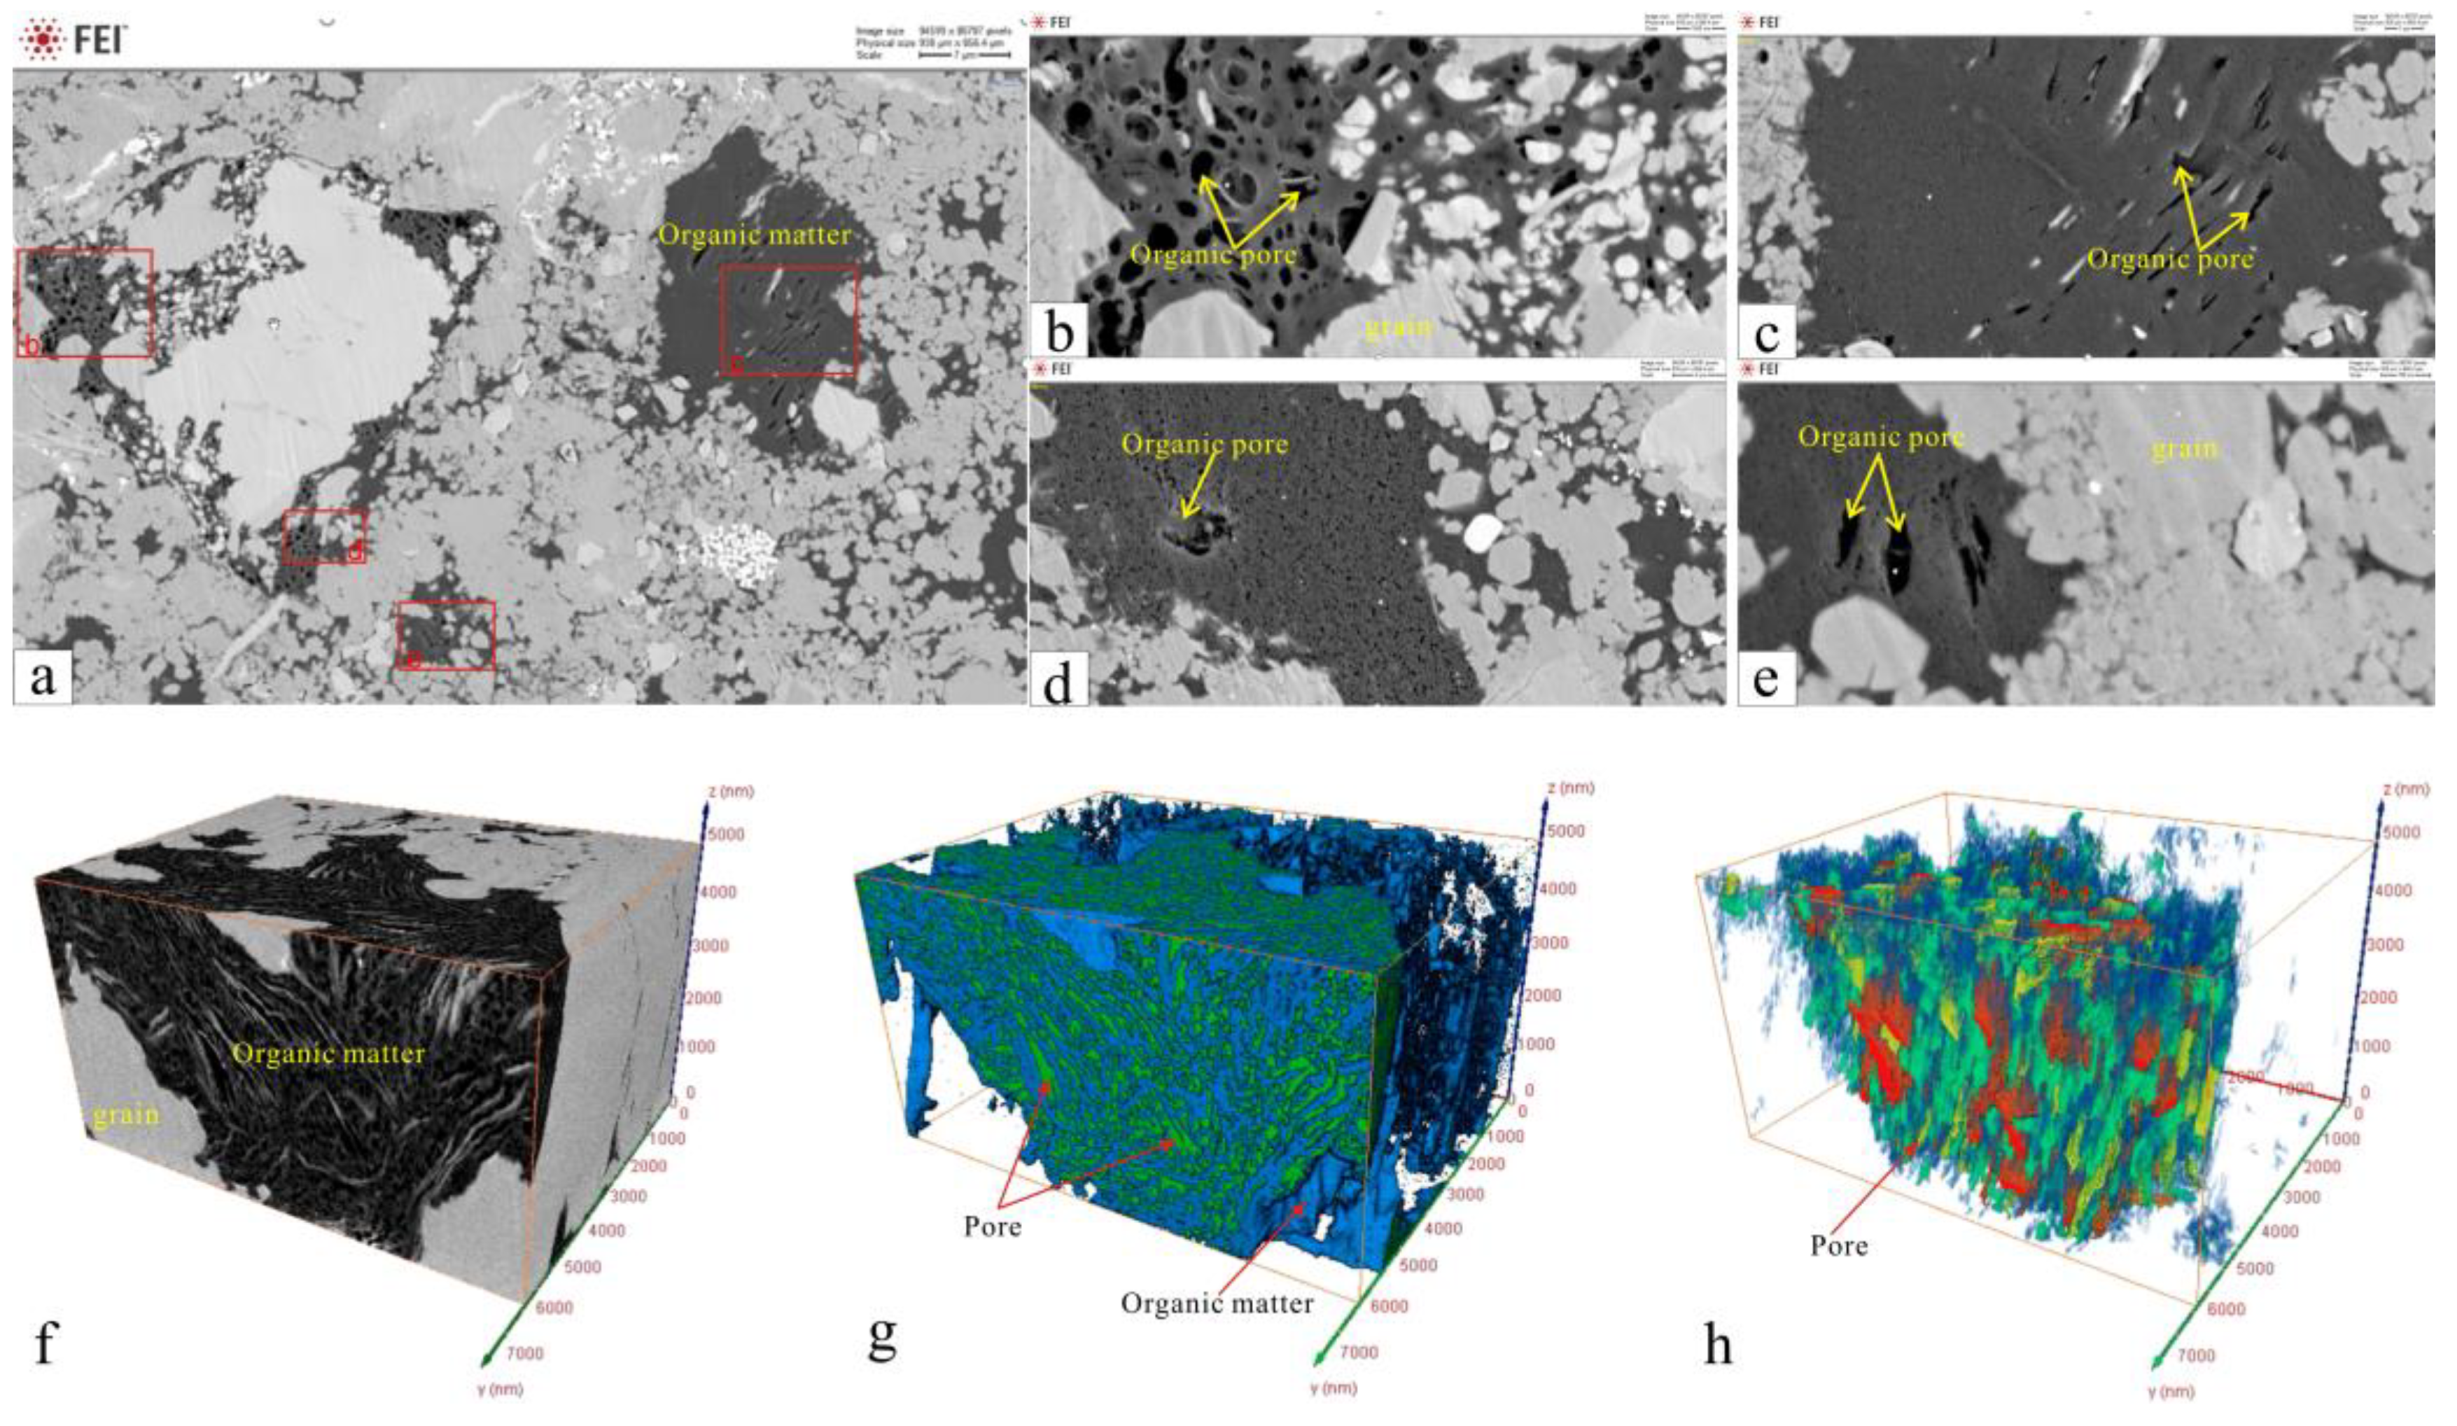
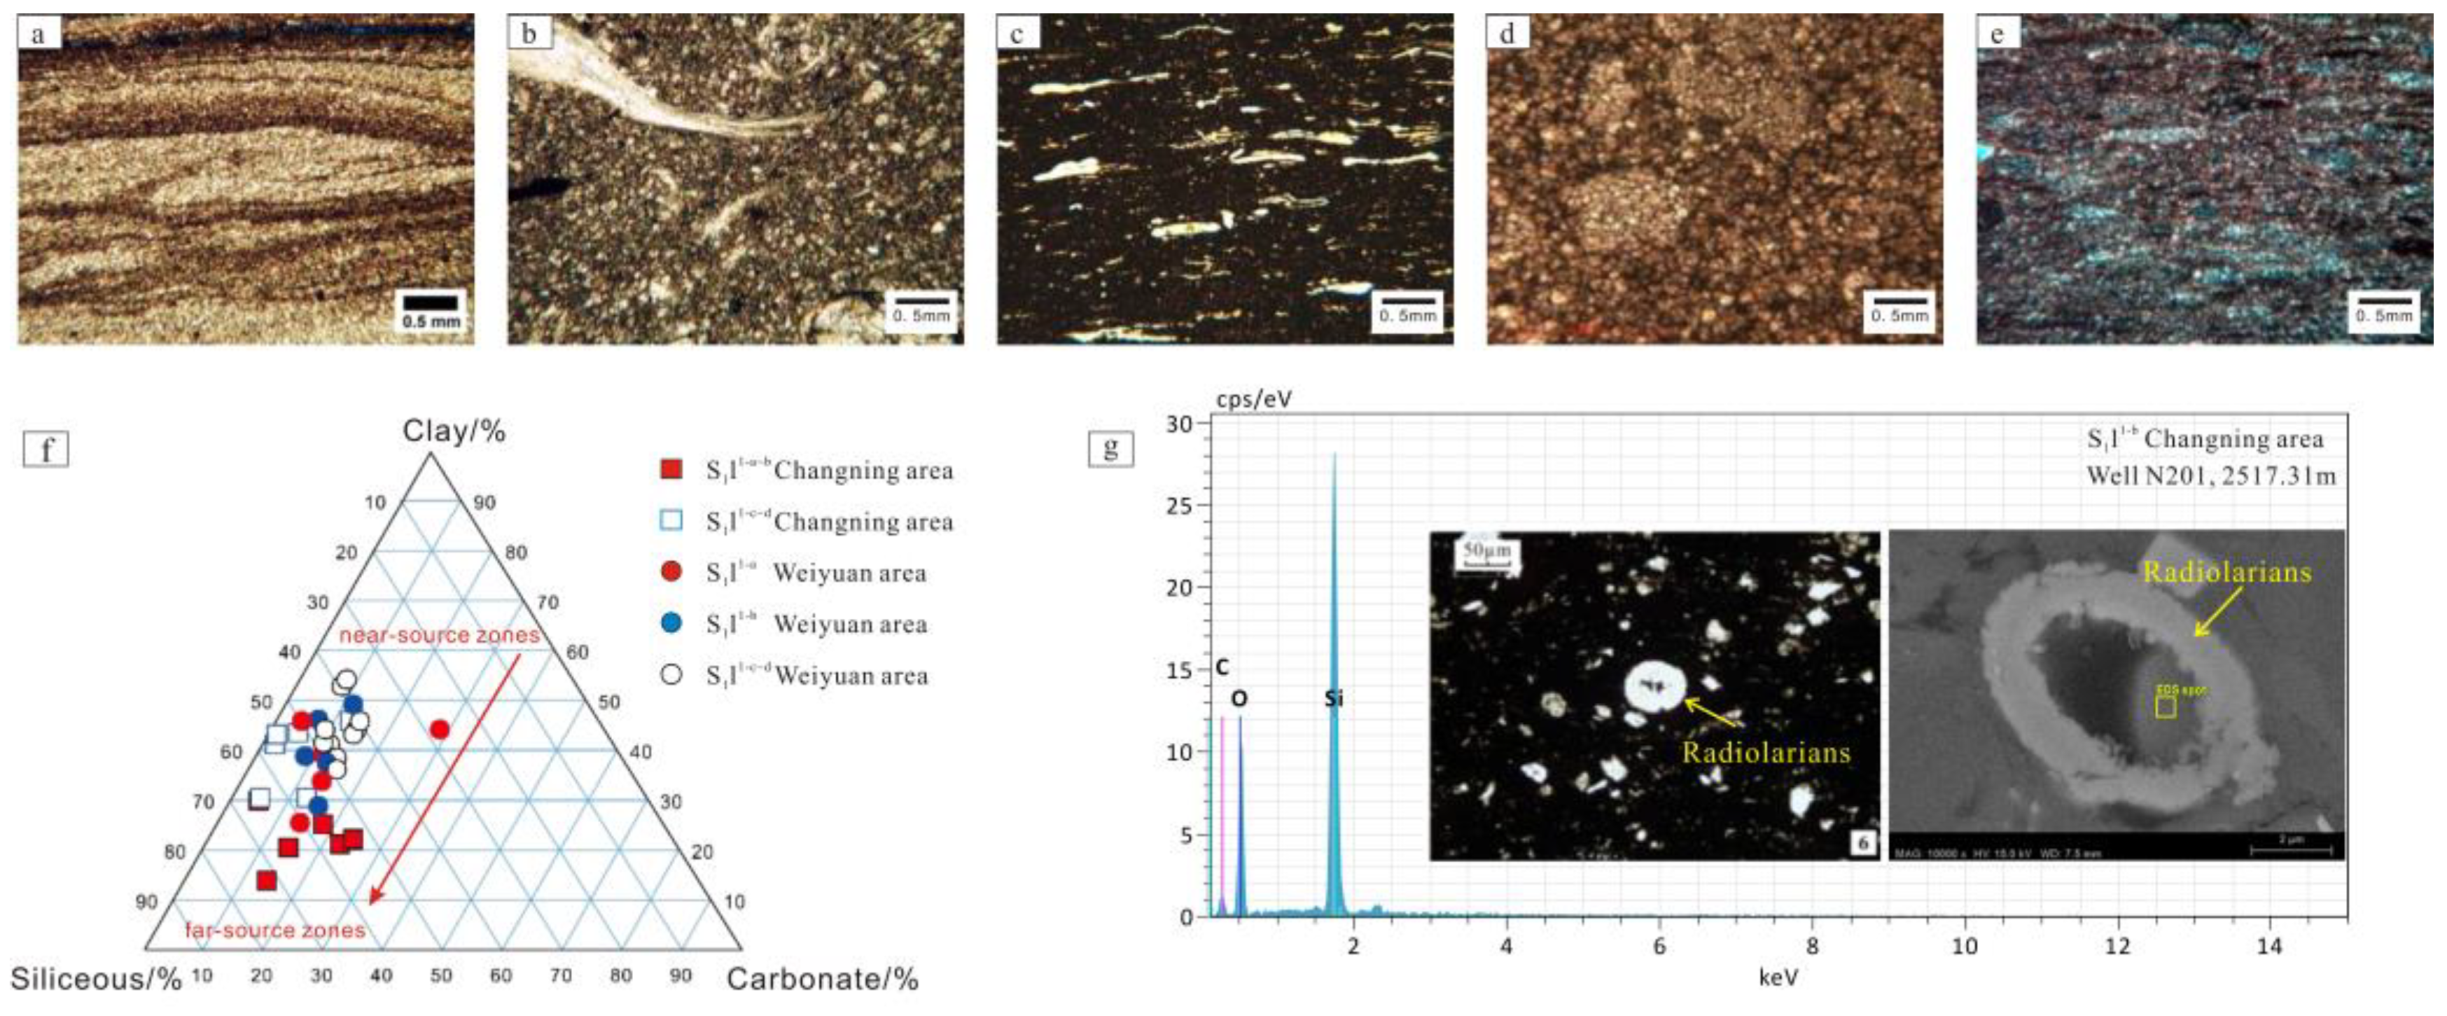
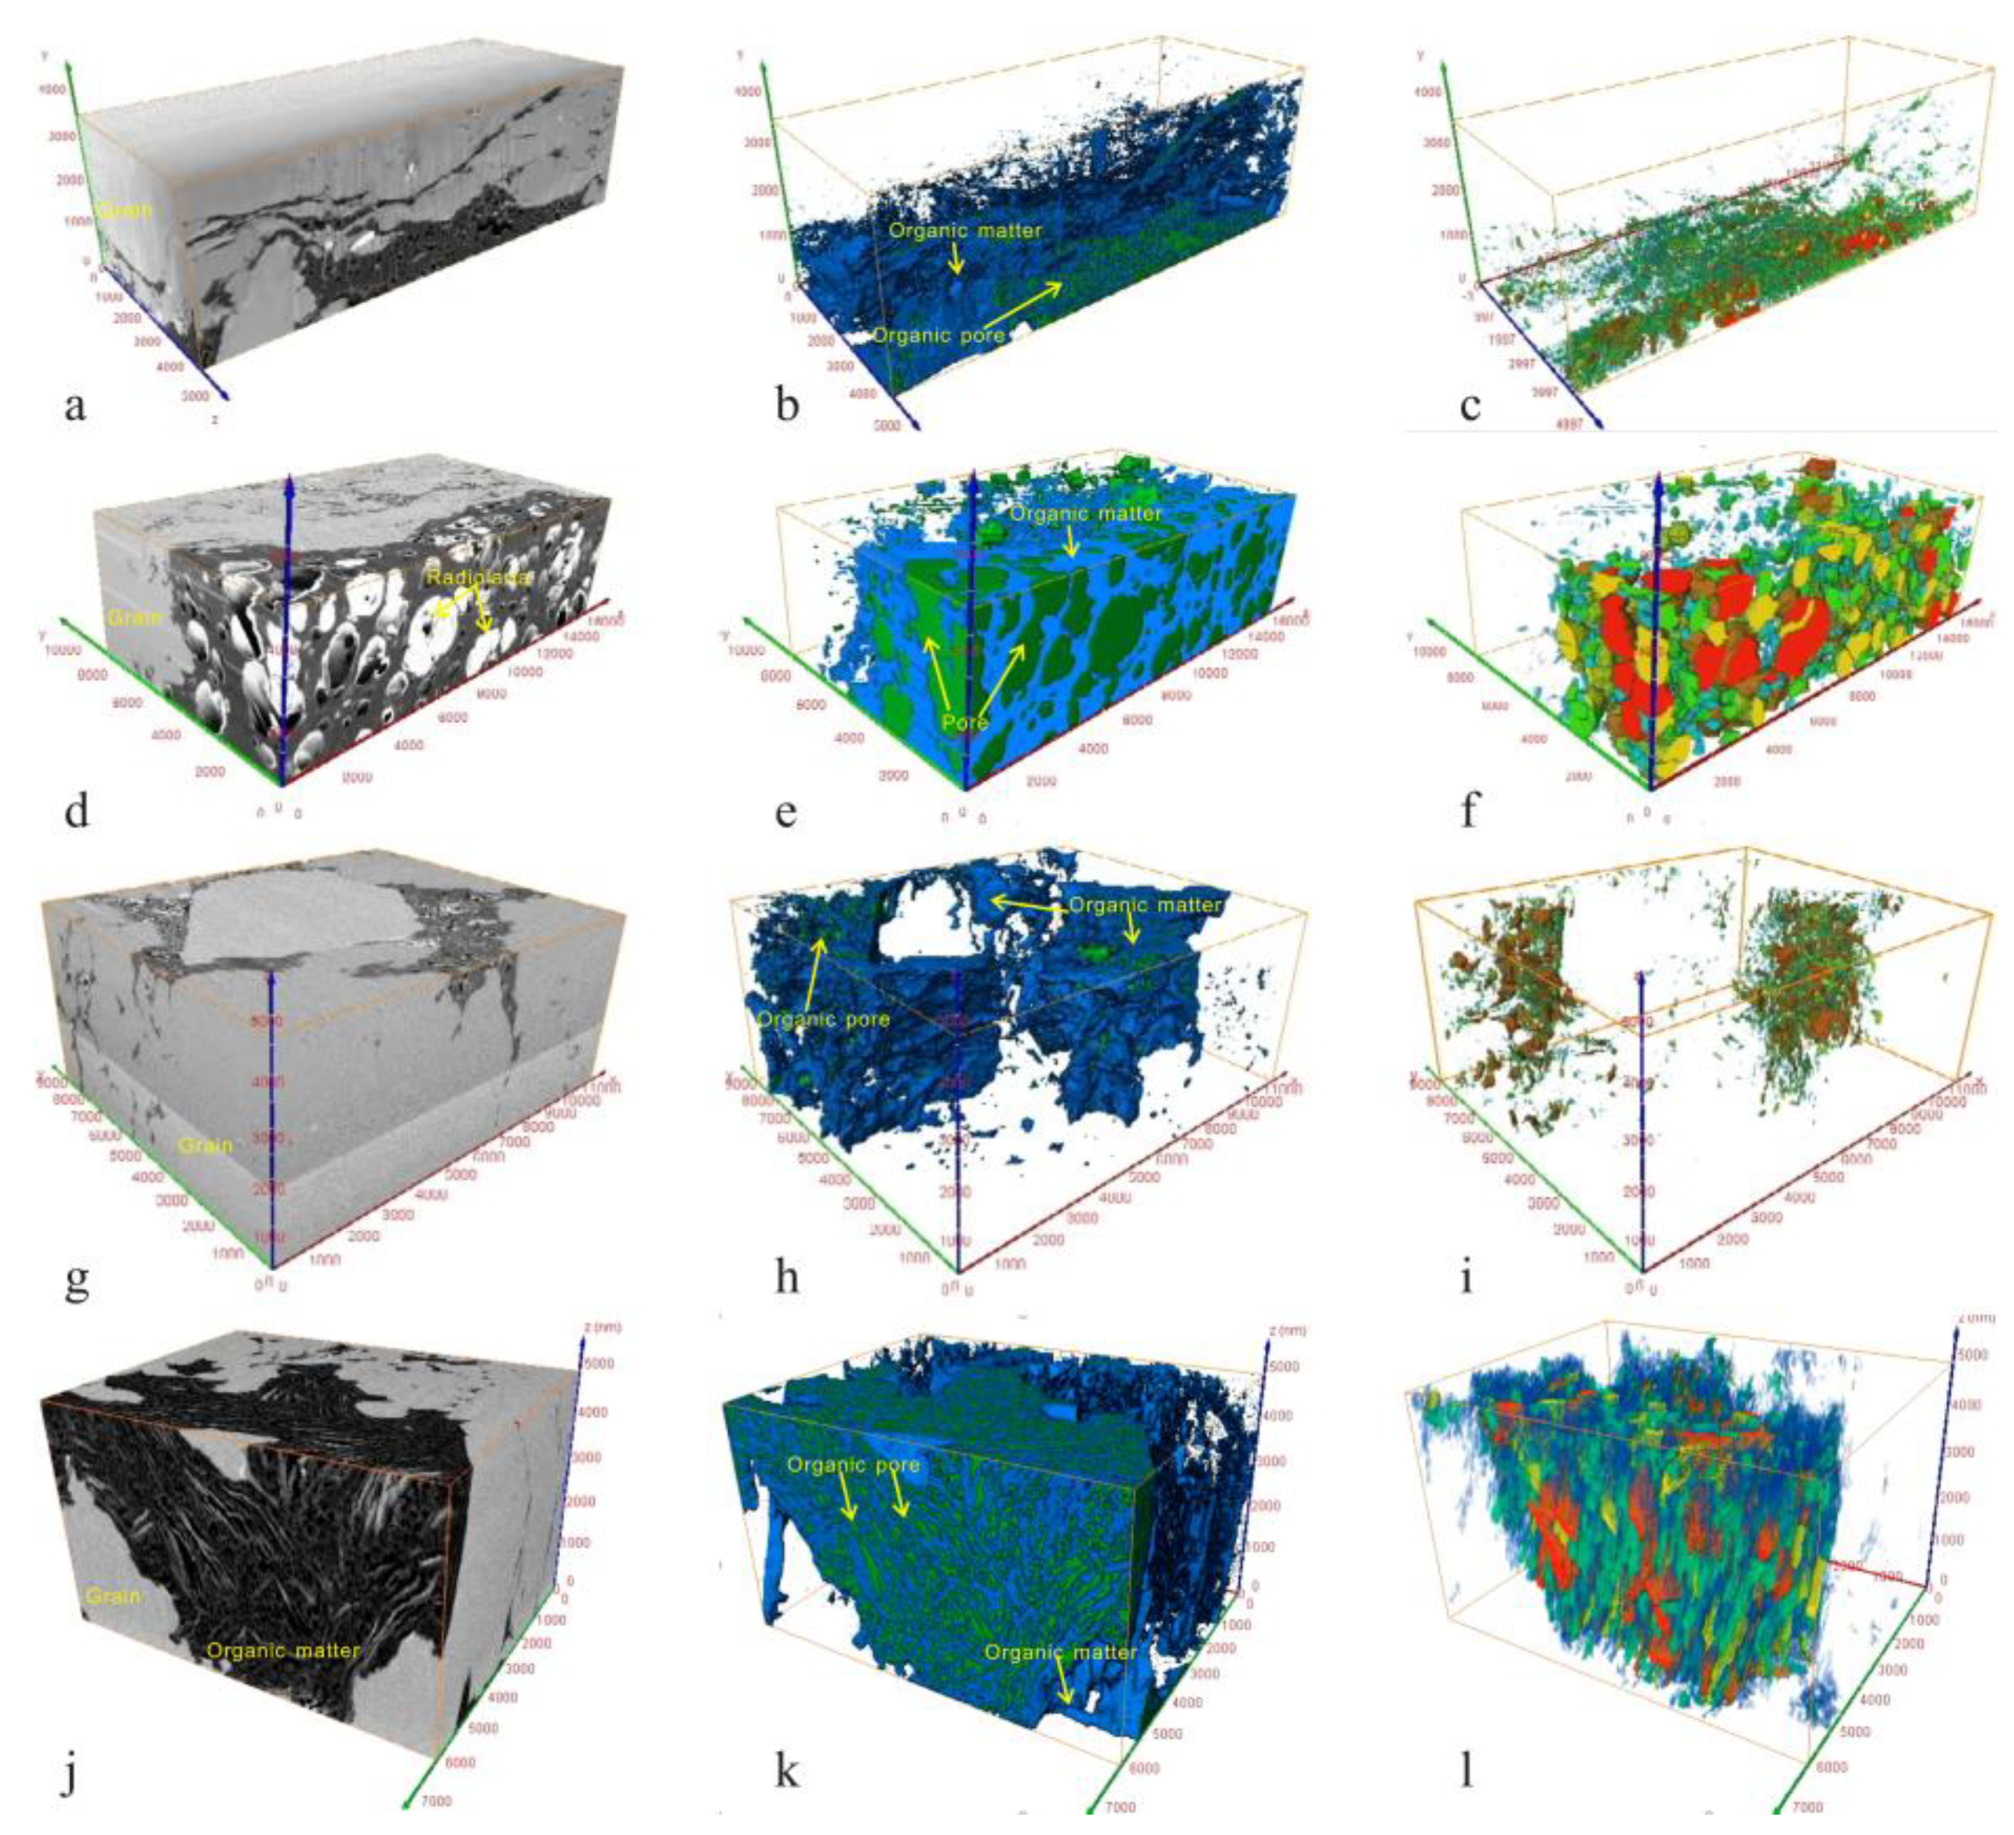
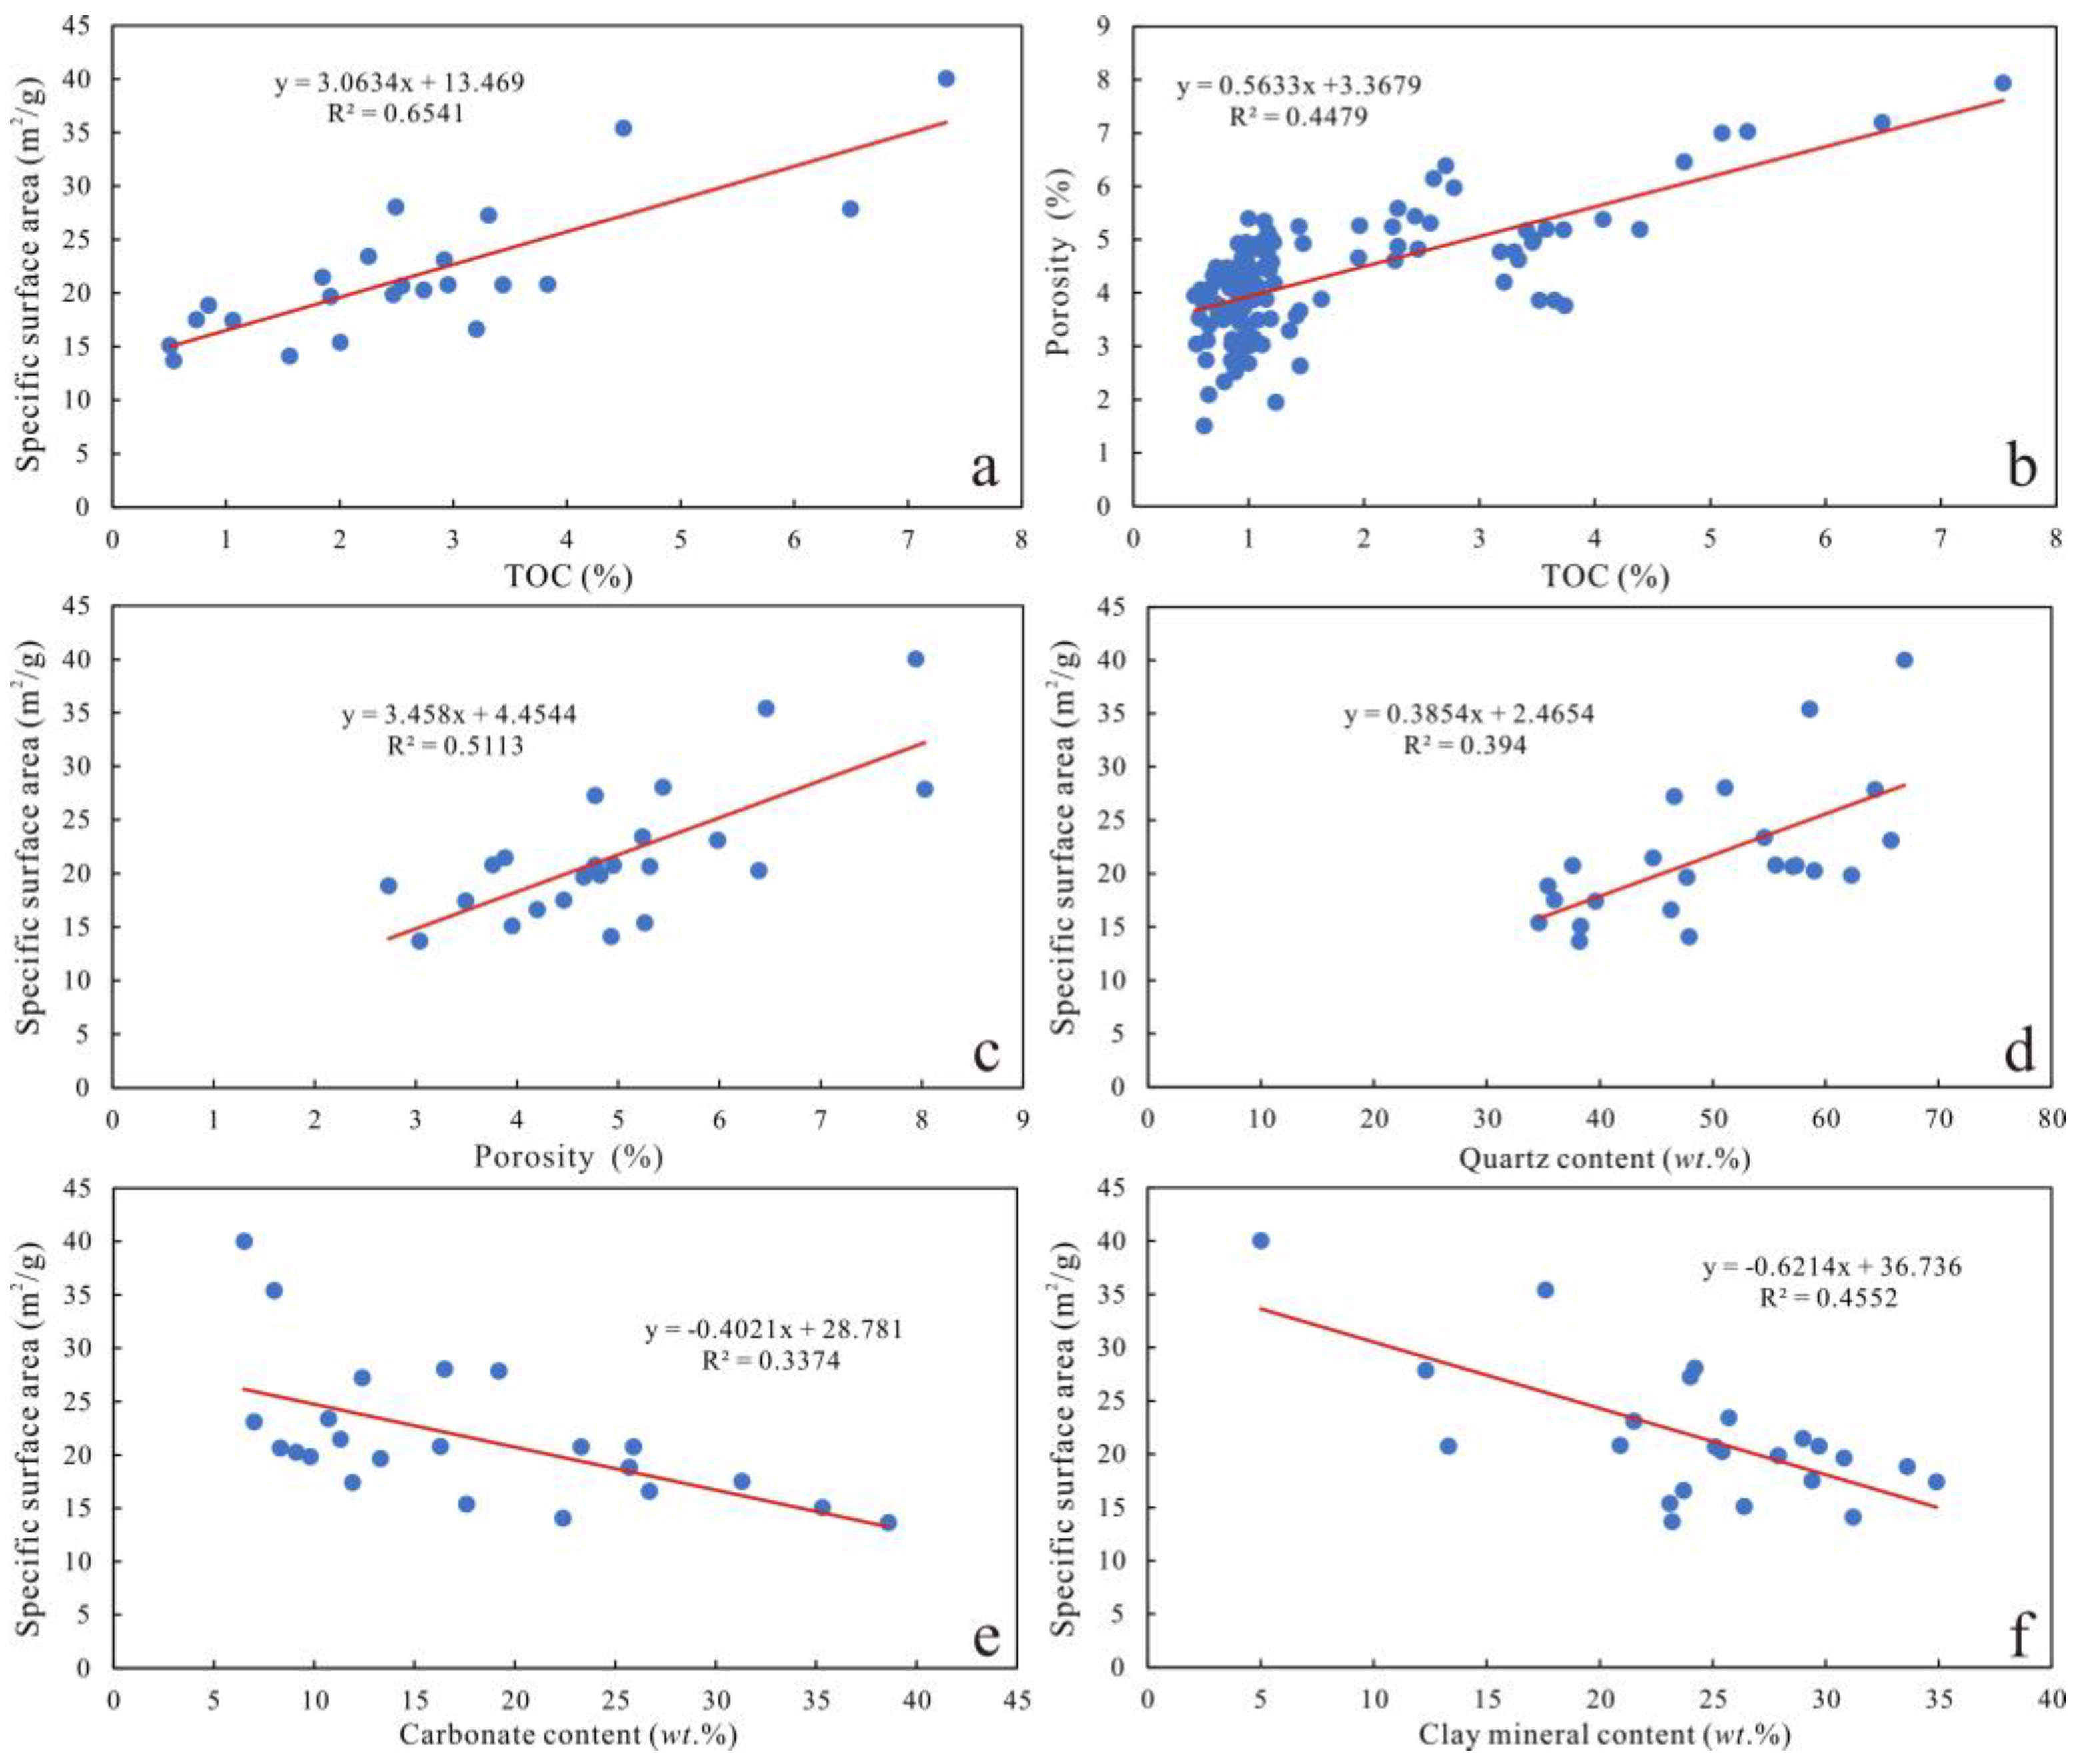
Most of the silicalite in the shale is biogenetic and pores can be preserved between microcrystalline authigenic quartz grains, which provides storage space for organic matter migration. Organic matter is the material basis of shale gas formation, the higher the content of organic matter, the greater the hydrocarbon generation potential, and the higher the degree of pore development of organic matter. Silica and TOC content are positively correlated with porosity and specific surface area, while carbonate and clay mineral contents are negatively correlated with reservoir quality.
(4)
In the first member of the Longmaxi formation, the sedimentary water depth became shallower from bottom to top, and the sedimentary environment changed from a reduction to an oxidation environment. The contents of siliceous and organic matter decrease, while the contents of clay minerals and carbonate minerals show the opposite trend. The difference of sedimentary facies type essentially reflects different sedimentary provenance, which also determines the difference of mineral composition and the distribution of organic matter, and then controls the heterogeneity of the shale reservoir and the distribution of effective shale.

Author Contributions

M.W. and J.H. contributed as the major authors of the manuscript. S.L., C.Z. (Chunlin Zeng), S.W. and W.W. conceived the project. S.J. collected the samples. Z.N. and C.Z. (Chun Zhang) analyzed the samples. All authors have read and agreed to the published version of the manuscript.

Funding

This study was financially supported by the Opening Foundation of Key Laboratory of Shale Gas Exploration, Ministry of Natural Resources (KLSGE-202102), Open fund of Shale Gas Evaluation and Exploitation Key Laboratory of Sichuan Province (No. YSK2022012), the General Project of Chongqing Natural Science Foundation (No. cstc2021jcyjmsxmX0897, No. cstc2021jcyj-msxmX0624) and the Science and Technology Cooperation Project of the CNPC-SWPU Innovation Alliance (2020CX020000).

Data Availability Statement

The data presented in this study are available on request from the corresponding author.

Acknowledgments

We would like to thank the PetroChina Southwest Oil and gas field company for providing shale samples and data. We thank all editors and reviewers for their helpful comments and suggestions.

Conflicts of Interest

The authors declare no conflict of interest.

References

  1. Selley, R.C. UK shale gas: The story so far. Mar. Pet. Geol. 2012, 31, 100–109. [Google Scholar]
  2. Johnson, C.; Boersma, T. Energy security in Poland the case of shale gas. Energ Policy 2013, 53, 389–399. [Google Scholar]
  3. Gao, Z.; Fan, Y.; Xuan, Q.; Zheng, G. A review of shale pore structure evolution characteristics with increasing thermal maturities. Adv. Geo-Energy Res. 2020, 4, 247–259. [Google Scholar]
  4. Curtis, M.E.; Sondergeld, C.H.; Ambrose, R.J.; Rai, C.S. Microstructural investigation of gas shales in two and three dimensions using nanometer-scale resolution imaging. AAPG Bull. 2012, 96, 665–677. [Google Scholar]
  5. Javadpour, F. Nanopores and apparent permeability of gas flow in mudrocks (shales and siltstone). J. Can. Petrol. Technol. 2009, 48, 16–21. [Google Scholar]
  6. Hu, Q.; Ewing, R.P.; Rowe, H.D. Low nanopore connectivity limits gas production in Barnett formation. J. Geophys. Res. Solid Earth 2015, 120, 8073–8087. [Google Scholar] [CrossRef]
  7. Zhao, J.H.; Jin, Z.J.; Hu, Q.H.; Liu, K.Y.; Jin, Z.K.; Hu, Z.Q.; Nie, H.K.; Du, W.; Yan, C.N.; Wang, R.Y. Mineral composition and seal condition implicated in pore structure development of organic-rich longmaxi shales, Sichuan Basin, China. Mar. Pet. Geol. 2018, 98, 507–522. [Google Scholar]
  8. Klaver, J.; Hemes, S.; Houben, M.; Desbois, G.; Radi, Z.; Urai, J.L. The connectivity of pore space in mudstones: Insights from high-pressure Wood’s metal injection, BIB–SEM imaging, and mercury intrusion porosimetry. Geofluids 2015, 15, 577–591. [Google Scholar]
  9. Zhang, L.C.; Lu, S.F.; Jiang, S.; Xiao, D.S.; Chen, L.; Liu, Y.; Zhang, Y.; Li, B.; Gong, C. Effect of shale lithofacies on pore structure of the Wufeng-Longmaxi shale in southeast Chongqing, China. Energy Fuels 2018, 32, 6603–6618. [Google Scholar] [CrossRef]
  10. Li, H.; Tang, H.; Qin, Q.; Zhou, J.; Qin, Z.; Fan, C.; Su, P.; Wang, Q.; Zhong, C. Characteristics, formation periods and genetic mechanisms of tectonic fractures in the tight gas sandstones reservoir: A case study of Xujiahe Formation in YB area, Sichuan Basin, China. J. Pet. Sci. Eng. 2019, 178, 723–735. [Google Scholar] [CrossRef]
  11. Li, H.; Qin, Q.; Zhang, B.; Ge, X.; Hu, X.; Fan, C.; Tang, H. Tectonic Fracture Formation and Distribution in Ultradeep Marine Carbonate Gas Reservoirs: A Case Study of the Maokou Formation in the Jiulongshan Gas Field, Sichuan Basin, Southwest China. Energy Fuels 2020, 34, 14132–14146. [Google Scholar] [CrossRef]
  12. Li, H.; Wang, Q.; Qin, Q.; Ge, X. Characteristics of Natural Fractures in an Ultradeep Marine Carbonate Gas Reservoir and Their Impact on the Reservoir: A Case Study of the Maokou Formation of the JLS Structure in the Sichuan Basin, China. Energy Fuels 2021, 35, 13098–13108. [Google Scholar] [CrossRef]
  13. McGlade, C.; Speirs, J.; Sorrell, S. Unconventional gas-a review of regional and global resource estimates. Energy 2013, 55, 571–584. [Google Scholar]
  14. Zou, C.N.; Dong, D.Z.; Wang, Y.M.; Li, X.J.; Huang, J.L.; Wang, S.F. Shale gas in China: Characteristics, challenges and prospects (I). Pet. Explor. Dev. 2015, 42, 753–767. [Google Scholar]
  15. Chalmers, G.R.L.; Ross, D.J.K.; Bustin, R.M. Geological controls on matrix permeability of Devonian Gas Shales in the Horn River and Liard basins, northeastern British Columbia, Canada. Int. J. Coal Geol. 2012, 103, 120–131. [Google Scholar]
  16. Ross, D.J.K.; Bustin, R.M. The importance of shale composition and pore structure upon gas storage potential of shale gas reservoirs. Mar. Pet. Geol. 2009, 26, 916–927. [Google Scholar]
  17. Mastalerz, M.; He, L.; Melnichenko, Y.B.; Rupp, J.A. Porosity of Coal and Shale: Insights from Gas Adsorption and SANS/USANS Techniques. Energy Fuels 2012, 26, 5109–5120. [Google Scholar] [CrossRef]
  18. Zhang, J.Z.; Li, X.Q.; Wei, Q.; Sun, K.X.; Zhang, G.W.; Wang, F.Y. Characterization of Full-Sized Pore Structure and Fractal Characteristics of Marine–Continental Transitional Longtan Formation Shale of Sichuan Basin, South China. Energy Fuels 2017, 31, 10490–10504. [Google Scholar] [CrossRef]
  19. Slatt, R.M.; O’Brien, N.R. Pore types in the Barnett and Woodford gas shales: Contribution to understanding gas storage and migration pathways in fine-grained rocks. AAPG Bull. 2011, 95, 2017–2030. [Google Scholar]
  20. Yang, R.; He, S.; Yi, J.; Hu, Q. Nano-scale pore structure and fractal dimension of organic-rich WufengLongmaxi shale from Jiaoshiba area, Sichuan Basin: Investigations using FE-SEM, gas adsorption and helium pycnometry. Mar. Pet. Geol. 2016, 70, 27–45. [Google Scholar]
  21. Liu, W.; Liu, J.; Cai, M.; Luo, C.; Shi, X.; Zhang, J. Pore evolution characteristic of shale in the Longmaxi Formation, Sichuan Basin. Pet. Res. 2017, 2, 291–300. [Google Scholar] [CrossRef]
  22. Li, K.; Chen, G.; Li, W.; Wu, X.; Tan, J.; Qu, J. Characterization of marine-terrigenous transitional Taiyuan formation shale reservoirs in Hedong coal field, China. Adv. Geo-Energy Res. 2018, 2, 72–85. [Google Scholar]
  23. Peng, N.J.; He, S.; Hu, Q.H.; Zhang, B.Q.; He, X.P.; Zhai, G.Y.; He, C.C.; Yang, R. The effects of mineral composition, Organic nanopore structure and fractal characteristics of Wufeng and lower member of Longmaxi shales in southeastern Sichuan, China. Mar. Pet. Geol. 2019, 103, 456–472. [Google Scholar]
  24. Wang, C.; Zhang, B.; Lu, Y.; Shu, Z.; Lu, Y.; Bao, H. Lithofacies distribution characteristics and its controlling factors of shale in wufeng formation-member 1 of Longmaxi formation in the Jiaoshiba area. Pet. Res. 2018, 3, 306–319. [Google Scholar]
  25. Wang, R.; Hu, Z.; Sun, C.; Liu, Z.; Zhang, C.; Gao, B.; Tang, W. Comparative analysis of shale reservoir characteristics in the Wufeng-Longmaxi (O3w-S1l) and Niutitang (Є1n) Formations: A case study of the Wells JY1 and TX1 in southeastern Sichuan Basin and its periphery, SW China. Interpretation 2018, 6, SN31–SN45. [Google Scholar]
  26. Li, J.; Yu, T.; Liang, X.; Zhang, P.; Chen, C.; Zhang, J. Insights on the gas permeability change in porous shale. Adv. Geo-Energ. Res. 2017, 1, 69–73. [Google Scholar]
  27. Chalmers, G.R.L.; Bustin, R.M. The organic matter distribution and methane capacity of the Lower Cretaceous strata of Northeastern British Columbia, Canada—ScienceDirect. Int. J. Coal Geol. 2007, 70, 223–239. [Google Scholar]
  28. Liu, K.; Ostadhassan, M. The impact of pore size distribution data presentation format on pore structure interpretation of shales. Adv. Geo-Energy Res. 2019, 3, 187–197. [Google Scholar] [CrossRef]
  29. Bernard, S.; Horsfield, B.; Schulz, H.-M.; Wirth, R.; Schreiber, A.; Sherwood, N. Geochemical evolution of organic-rich shales with increasing maturity: A STXM and TEM study of the Posidonia Shale (Lower Toarcian, northern Germany). Mar. Petrol Geol. 2012, 31, 70–89. [Google Scholar]
  30. Milliken, K.L.; Rudnicki, M.; Awwiller, D.N.; Zhang, T. Organic matter-hosted pore system, Marcellus formation (Devonian), Pennsylvania. AAPG Bull. 2013, 97, 177–200. [Google Scholar]
  31. Pommer, M.; Milliken, K. Pore types and pore-size distributions across thermal maturity, Eagle Ford Formation, southern Texas. AAPG Bull. 2015, 99, 1713–1744. [Google Scholar] [CrossRef]
  32. Zargari, S.; Canter, K.L.; Prasad, M. Porosity evolution in oil-prone source rocks. Fuel 2015, 153, 110–117. [Google Scholar]
  33. Ko, L.T.; Loucks, R.G.; Zhang, T.; Ruppel, S.C.; Shao, D. Pore and pore network evolution of Upper Cretaceous Boquillas (Eagle Ford–equivalent) mudrocks: Results from gold tube pyrolysis experiments. AAPG Bull. 2016, 100, 1693–1722. [Google Scholar] [CrossRef]
  34. Wang, R.; Ding, W.; Zhang, Y.; Wang, Z.; Wang, X.; He, J.; Dai, P. Analysis of developmental characteristics and dominant factors of fractures in Lower Cambrian marine shale reservoirs: A case study of Niutitang formation in Cen’gong block, southern China. J. Pet. Sci. Eng. 2016, 138, 31–49. [Google Scholar]
  35. Wang, R.; Gu, Y.; Ding, W.; Gong, D.; Yin, S.; Wang, X.; Cui, Z. Characteristics and dominant controlling factors of organic-rich marine shales with high thermal maturity: A case study of the Lower Cambrian Niutitang Formation in the Cen’gong block, southern China. J. Nat. Gas Sci. Eng. 2016, 33, 81–96. [Google Scholar]
  36. Chen, S.; Zhu, Y.; Wang, H.; Liu, H.; Wei, W.; Fang, J. Shale gas reservoir characterisation: A typical case in the southern Sichuan Basin of China. Energy 2011, 36, 6609–6616. [Google Scholar]
  37. Cao, T.; Song, Z.; Wang, S.; Cao, X.; Li, Y.; Xia, J. Characterizing the pore structure in the Silurian andpermian shales of the Sichuan Basin, China. Mar. Petrol. Geol. 2015, 61, 140–150. [Google Scholar] [CrossRef]
  38. Tang, X.; Jiang, Z.; Li, Z.; Gao, Z.; Bai, Y.; Zhao, S.; Feng, J. The effect of the variation in material composition on the heterogeneous pore structure of high-maturity shale of the Silurian Longmaxi formation in the southeastern Sichuan Basin, China. J. Nat. Gas Sci. Eng. 2015, 23, 464–473. [Google Scholar]
  39. Tian, H.; Li, T.; Zhang, T.; Xiao, X. Characterization of methane adsorption on overmature Lower Silurian– Upper Ordovician shales in Sichuan Basin, southwest China: Experimental results and geological implications. Int. J. Coal Geol. 2016, 156, 36–49. [Google Scholar]
  40. Eberzin, A.G. The Middle and Upper Pliocene of the Black Sea Region. Stratigr. USSR. 1940, 12, 477–566. [Google Scholar]
  41. Chen, L.; Jiang, Z.; Liu, K.; Wang, P.; Ji, W.; Gao, F.; Li, P.; Hu, T.; Zhang, B.; Huang, H. Effect of lithofacies on gas storage capacity of marine and continental shales in the Sichuan Basin, China. J. Nat. Gas Sci. Eng. 2016, 36, 773–785. [Google Scholar]
  42. Chen, L.; Jiang, Z.; Liu, K.; Gao, F. Quantitative characterization of micropore structure for organic-rich Lower Silurian shale in the Upper Yangtze Platform, South China: Implications for shale gas adsorption capacity. Adv. Geo-Energy Res. 2017, 1, 112–123. [Google Scholar] [CrossRef] [Green Version]
  43. Han, C.; Jiang, Z.; Han, M.; Wu, M.; Lin, W. The lithofacies and reservoir characteristics of the Upper Ordovician and Lower Silurian black shale in the Southern Sichuan Basin and its periphery. Mar. Pet. Geol. 2016, 75, 181–191. [Google Scholar]
  44. Dong, T.; Harris, N.B.; Ayranci, K.; Yang, S. The impact of rock composition on geomechanical properties of a shale formation: Middle and upper Devonian Horn River Group shale, northeast british Columbia, Canada. AAPG Bull. 2017, 101, 177–204. [Google Scholar]
  45. Loucks, R.G.; Reed, R.M.; Ruppel, S.C.; Hammes, U. Spectrum of pore types and networks in mudrocks and a descriptive classification for matrix-related mudrock pores. AAPG Bull. 2012, 96, 1071–1098. [Google Scholar] [CrossRef] [Green Version]
  46. Chen, S.B.; Zhu, Y.M.; Qin, Y.; Wang, H.Y.; Liu, H.L.; Fang, J.H. Reservoir evaluation of the lower Silurian longmaxi Formation Shale gas in the southern Sichuan Basin of China. Mar. Petrol. Geol. 2014, 57, 619–630. [Google Scholar]
  47. Guo, Z.W.; Deng, K.L.; Han, Y.H. Sichuan Basin Formation and Development; Geological Press: Beijing, China, 1996; pp. 89–138. (In Chinese) [Google Scholar]
  48. Huang, H.; He, D.; Li, Y.; Li, J.; Zhang, L. Silurian tectonic-sedimentary setting and basin evolution in the Sichuan area, southwest China: Implications for palaeogeographic reconstructions. Mar. Petrol. Geol. 2018, 92, 403–423. [Google Scholar]
  49. Yang, S.C.; Hu, W.X.; Wang, X.L.; Jiang, B.Y.; Yao, S.P.; Sun, F.N.; Huang, Z.C.; Zhu, F. Duration, evolution, and implications of volcanic activity across the Ordovician-Silurian transition in the Lower Yangtze region, South China. Earth Planet. Sci. Lett. 2019, 518, 13–25. [Google Scholar]
  50. Wu, L.Y.; Lu, Y.C.; Jiang, S.; Liu, X.F.; He, G.S. Effects of volcanic activities in Ordovician Wufeng Silurian Longmaxi period on organic-rich shale in the Upper Yangtze area, South China. Pet. Explor. Dev. 2018, 45, 862–872. [Google Scholar] [CrossRef]
  51. Su, W.B.; Huff, W.D.; Ettensohn, F.R.; Liu, X.M.; Zhang, J.E.; Li, Z.M. K-bentonite, black-shale and flysch successions at the Ordovician-Silurian transition, South China: Possible sedimentary responses to the accretion of Cathaysia to the Yangtze Block and its implications for the evolution of Gondwana. Gondwana Res. 2009, 15, 111–130. [Google Scholar]
  52. Guo, X.J.; HE, S.L.; Chen, S. Research on micro structure of shale pores and distribution features based on nano-CT scanning and digital core analysis. Coal Geol. China 2016, 28, 28–34. [Google Scholar]
  53. Li, H.; Zhou, J.; Mou, X.; Guo, H.; Wang, X.; An, H.; Mo, Q.; Long, H.; Dang, C.; Wu, J.; et al. Pore structure and fractal characteristics of the marine shale of the Longmaxi Formation in the Changning Area, Southern Sichuan Basin, China. Front. Earth Sci. 2022, 10, 1018274. [Google Scholar] [CrossRef]
  54. Scherdel, C.; Reichenauer, G.; Wiener, M. Relationship between pore volumes and surface areas derived from the evaluation of N2-sorption data by DR-, BET- and t-plot. Microporous Mesoporous Mater. 2010, 132, 572–575. [Google Scholar] [CrossRef]
  55. Gregg, S.J.; Sing, K.S.W. Adsorption, Surface Area and Porosity, 2nd ed.; Academic Press: London, UK, 1982; Volume 2, pp. 1–50. [Google Scholar]
  56. Ji, W.; Song, Y.; Jiang, Z.; Wang, X.; Bai, Y.; Xing, J. Geological controls and estimation algorithms of lacustrine shale gas adsorption capacity: A case study of the Triassic strata in the southeastern Ordos Basin, China. Int. J. Coal Geol. 2014, 134–135, 61–73. [Google Scholar]
  57. Zhao, S.X.; Yang, Y.M.; Zhang, J.; Wang, L.S.; Wang, X.Z.; Luo, C.; Tian, C. Micro-layers division and fine reservoirs contrast of Lower Silurian Longmaxi Formation shale, Sichuan Basin, SW China. Nat. Gas. Geosci. 2016, 27, 470–487. [Google Scholar]
  58. Zou, C.; Dong, D.; Wang, S.; Li, J.; Li, X.; Wang, Y.; Li, D.; Cheng, K. Geological characteristics and resource potential of shale gas in China. Pet. Explor. Dev. 2010, 37, 641–653. [Google Scholar] [CrossRef]
  59. Cai, J.; Yu, B.; Zou, M.; Luo, L. Fractal characterization of spontaneous co-current imbibition in porous media. Energy Fuels 2010, 24, 1860–1867. [Google Scholar] [CrossRef]
  60. Cai, J.; Lin, D.; Singh, H.; Zhou, S.; Meng, Q.; Zhang, Q. A simple permeability model for shale gas and key insights on relative importance of various transport mechanisms. Fuel 2019, 252, 210–219. [Google Scholar] [CrossRef]
  61. Li, H. Research progress on evaluation methods and factors influencing shale brittleness: A review. Energy Rep. 2022, 8, 4344–4358. [Google Scholar] [CrossRef]
  62. Sun, Y.; Guo, S. Characterization of whole-aperture pore structure and its effect on methane adsorption capacity for transitional shales. Energy Fuels 2018, 32, 3176–3188. [Google Scholar]
  63. Cai, J.; Zhang, Z.; Wei, W.; Guo, D.; Li, S.; Zhao, P. The critical factors for permeability-formation factor relation in reservoir rocks: Pore-throat ratio, tortuosity and connectivity. Energy. 2019, 188, 116051. [Google Scholar]
  64. Zhang, J.; Li, X.; Zou, X.; Zhao, G.; Zhou, B.; Li, J. Characterization of full-sized pore structure of coal bearing shales and its effect on shale gas content. Energy Fuels. 2019, 33, 1969–1982. [Google Scholar]
  65. Bai, J.; Kang, Y.; Chen, M.; Chen, Z.; Tao, L.; Zhang, N.; Shi, W.; Zhu, Q. Dual effects of retained fracturing fluid on methane diffusion in shale containing adsorbed methane. Gas Sci. Eng. 2023, 110, 204872. [Google Scholar] [CrossRef]
  66. Guo, T.L.; Zeng, P. Geological Characteristics, Resource Potential, and Key Factors for Shale Gas in the Tectonically Complex Region; Science Press: Beijing, China, 2017; Chapter 3; pp. 230–231. [Google Scholar]
  67. Li, J.; Li, H.; Yang, C.; Wu, Y.; Gao, Z.; Jiang, S. Geological Characteristics and Controlling Factors of Deep Shale Gas Enrichment of the Wufeng-Longmaxi Formation in the Southern Sichuan Basin, China. Lithosphere 2022, 2022, 4737801. [Google Scholar] [CrossRef]
Figure 1. (a) Location of the study area in the Sichuan Basin (Modified from [46]); (b) Stratigraphic of the Longmaxi Formation in well N3.
Minerals 13 00476 g001
Figure 3. Macroscopic and microscopic features of shale of S1l1 from well N3 in the Changning shale gas field. (a). mudstone with local pyrite bands, 2514.24 m, N1; (b). Siliceous radiolarian development, 2505.77 m, N1; (c). Black shale with developed graptolite fossils, 3160.18 m, N9; (d). Horizontal lamina development, siliceous development, 2547.0 m, N1; (e). Shale horizontal bedding development, 2483.14 m, N1; (f). Silty shale with developed laminae, 3132.84 m, N9; (g). Black shale with horizontal bedding development, 2153.67 m, N10; (h). Silty shale with rhythmic bedding development, 2330.25 m, N3; (i). Thin layered grayish black calcareous silty mudstone and dark gray calcareous argillaceous siltstone are interbedded with different thicknesses, with rhythmic bedding, 2214.10 m, N3; (j). Biological peristalsis, 2232 m, N3; (k). Grayish black silty mudstone mixed with grayish white calcareous siltstone, forming an eyeball-like structure, abrupt change in contact surface, and biological disturbance structure, 2236.47 m, N3; (l). Clastic accumulation of brachial fauna, 2235.11 m, N3.
Minerals 13 00476 g003
Figure 4. (a). Histogram of porosity, S1l; (b). Histogram of permeability, S1l; (c). Relations between porosity and permeability, porosity has a weak positive correlation with permeability (red dotted line), correlation coefficient R2 is 0.1895. S1l; (d). Distribution histogram of porosity and permeability of various sedimentary facies.
Minerals 13 00476 g004
Figure 5. Typical observations of multiple types of pores in shale samples. (a). Intermineral pores of flaky clay, N3, 2241.34 m; (b). Dissolved pores in mineral particles, 2245.31 m, N4; (c). Intracrystalline dissolved pores in carbonate rocks, N3, 2370.77 m; (d). Intercrystalline pore of pyrite, N3, 2352.60 m; (e). Organic micropores, N3, 2370.77 m; (f). Radiolarian coelom, N2, 2243.83 m.
Minerals 13 00476 g005
Figure 6. Comprehensive observation of organic pore characteristics. (ae). SEM observation of organic pores. (fh), 3D reconstructed image of nanometric scale shale core (f). core image, (g). organic matter and organic pores image, (h). distribution of organic pores.
Minerals 13 00476 g006
Figure 7. Comprehensive section of sedimentary facies and microscopic characteristics of the Longmaxi Formation in well N3.
Minerals 13 00476 g007
Figure 8. Pore structure, mineral composition and gas bearing characteristics of S111−1 section.
Minerals 13 00476 g008
Figure 9. Comparison of profile distribution of physical properties and mineral components of S1l1−1 section.
Minerals 13 00476 g009
Figure 10. Characteristics of mineral composition and distribution of shale in different sections analysis by QEMSCAN.
Minerals 13 00476 g010
Figure 11. Characteristics of shale siliceous components. (a). Silty shale; (b). Plant detrital mudstone; (c). Clay shale; (d). Dolomitic shale; (e). Siliceous shale; (f). Ternary diagram of the mineralogy of shale; (g). Characteristics of siliceous components in shale.
Minerals 13 00476 g011
Figure 12. 3D reconstructed image of nanometric scale shale (core image, organic matter and organic pores image, distribution of organic pores). (ac). 2374.55 m, S1l1~1d, well N3; (df). 2380.15 m, S1l1~1c, well N3; (gi). 2387.32 m, S1l1~1b, well N3; (jl). 2392.15 m, S1l1~1a, well N3.
Minerals 13 00476 g012
Figure 13. N2 adsorption/desorption isotherms of shale of S1l1−1 member. (a). 2393.55 m, N3, S1l1−1a; (b). 2385.15 m, N3, S1l1−1b; (c). 2380.11 m, N3, S1l1−1c; (d). 2371.35 m, N3, S1l1−1d.
Minerals 13 00476 g013
Figure 14. The typical nonmicrocrope size distributions (PSDs) of shales for these 4 members of S1l1−1. a. 2393.55 m, N3, S1l1−1a; b. 2385.15 m, N3, S1l1−1b; c. 2380.11 m, N3, S1l1−1c; d. 2371.35 m, N3, S1l1−1d.
Minerals 13 00476 g014
Figure 15. Relationships of contents of TOC: (a,b) porosity, (c) quartz content, (d) carbonate content (e), and clay mineral content (f), with the specific surface area of shales.
Minerals 13 00476 g015
Table 1. Physical property, mineralogical compositions and TOC content of shale of S1l1−1 section.
FormationDepth/mPorosity
(%)
Permeability
(mD)
Mineral Contensts (%)Clay Mineral Contensts (%)TOC
(%)
QuartzFeldsparCalciteDolomitePyriteClay
mineral
LliteI/SChloriteMixed-Layer Ratio
S1l1~1d2356.58 3.66 1.7342.5 4.6 13.3 34.8 4.865332101.44
S1l1~1d2345.97 2.63 0.20445.7 11.9 13.1 2.8 26.555 45 1.45
S1l1~1d2307.75 4.93 1.5447.9 8.5 10.1 2.3 31.271 29 1.47
S1l1~1d2363.65 3.88 044.7 12.4 8.0 3.3 2.6 29.069 31 1.63
S1l1~1d2365.40 4.66 047.7 7.5 9.1 4.2 0.7 30.870129101.95
S1l1~1d2364.55 5.26 064.6 7.6 4.7 23.168 32 1.96
S1l1~1d2367.12 5.24 054.6 9.0 7.7 3.0 25.771128102.25
S1l1~1d2375.52 4.61 043.0 21.6 6.1 1.3 28.067 33 2.27
S1l1~1d2374.52 4.87 056.5 6.4 7.5 1.4 28.270 30 2.29
S1l1~1d2370.18 5.59 056.5 6.6 13.7 0.8 22.455540102.29
S1l1~1d2366.17 5.44 051.1 4.6 9.6 6.9 3.6 24.252 48 2.44
S1l1~1d2368.10 4.82 062.3 9.8 27.968 32 2.47
S1l1~1d2373.55 5.31 057.1 5.3 8.3 4.2 25.139 43 18 102.57
S1l1~1c2371.50 6.15 057.8 10.4 3.7 28.165 35 2.60
S1l1~1c2369.34 6.39 059.0 4.8 9.1 1.7 25.473 27 2.71
S1l1~1c2372.48 5.98 065.8 4.8 7.0 0.9 21.567 3 30 102.78
S1l1~1c2382.56 4.77 037.6 5.5 13.0 10.3 3.9 29.751454103.18
S1l1~1b2385.36 4.20 3.2646.3 18.0 8.7 3.3 23.794 6 3.21
S1l1~1b2389.65 4.77 2.0746.6 3.9 13.2 9.2 3.1 24.094 6 3.30
S1l1~1b2380.77 4.62 046.1 10.3 7.7 5.1 30.873 27 3.34
S1l1~1b2381.54 5.17 55.561.0 13.8 7.2 4.3 13.788 12 3.41
S1l1~1b2388.31 4.95 057.4 12.3 13.6 3.4 13.321736103.46
S1l1~1b2389.25 5.00 051.3 2.5 7.8 6.4 2.5 29.543525103.47
S1l1~1b2384.44 3.86 3.5865.3 13.2 9.5 2.5 9.547494103.52
S1l1~1b2383.75 5.20 074.6 12.6 10.9 1.9 8875103.58
S1l1~1b2390.59 3.86 062.4 9.8 7.9 1.4 18.558384103.65
S1l1~1b2386.20 5.18 38.376.2 13.6 7.0 3.2 95 5 3.73
S1l1~1b2387.01 3.76 0.0022555.6 4.3 10.2 6.1 2.9 20.9225622103.74
S1l1~1b2379.82 5.38 6.6860.9 10.6 7.3 1.3 19.9651223104.07
S1l1~1b2391.44 5.19 49.152.3 19.5 10.0 2.8 15.476 24 4.39
S1l1~1b2378.91 6.46 058.6 4.0 10.6 5.4 3.8 17.673918104.77
S1l1~1a2377.86 7.00 058.0 15.8 5.8 2.2 18.2592417105.10
S1l1~1a2376.95 8.03 064.4 13.5 5.7 4.1 12.3622414105.33
S1l1~1a2392.53 5.94 0.041867.0 4.8 16.3 5.2 1.7 5.069 31 7.54
Table 2. Contents of minerals of S1l1 member shale from the QEMSCAN result.
FormationDepth/mMinerals Contents (%)
QuartzAlbiteOrthoclaseCalciteDolomiteAnkeriteIlliteChloriteApatiteRutilePyriteSphaleriteMonaziteElse
S1l1~1a2521.256.145.071.065.726.5615.850.650.050.100.97007.81
2520.1346.052.561.4325.195.892.510.510.370.360.041.4500.013.63
S1l1~1b2519.3547.053.681.5418.56.40.9211.530.280.020.051.0500.018.98
2513.75 49.264.50.8512.314.792.549.690.430.060.041.020.0104.5
S1l1~1c2511.52 37.253.30.9112.2410.124.1717.30.670.060.042.190.040.0111.7
2504.7530.464.21.7910.435.612.4534.191.760.10.062.48006.47
S1l1~1d2502.1521.485.170.985.690.524.9752.392.520.110.151.3700.014.62
2496.8821.815.61.314.50.950.3454.9830.050.171.500.015.78
Table 3. Pore structure parameters of shale of the S1l1−1 member.
FormationDepth (m)Pore Structure Parameters Based on Nano-CT ImagesPore Size Distribution of Nitrogen Adsorption
Porosity
(%)
TOC,
wt
(%)
OM,
wt
(%)
φipo
(%)
Specific Surface Area (m2/g)Specific Pore Volume
(mL/g)
Average Aperture (nm)Pore Volume (mL/g)Micropore Proption (%)Mesopore Proption
(%)
S1l1~a2392.535.947.328.1133.825.120.0273.820.102611.5588.45
S1l1~b2385.364.22.935.327.616.750.0113.50.083610.2389.77
S1l1~c2369.346.394.485.5627.723.460.0213.550.94515.3284.68
S1l1~d2363.653.882.442.6725.79.680.0073.610.06518.5691.44
Disclaimer/Publisher’s Note: The statements, opinions and data contained in all publications are solely those of the individual author(s) and contributor(s) and not of MDPI and/or the editor(s). MDPI and/or the editor(s) disclaim responsibility for any injury to people or property resulting from any ideas, methods, instructions or products referred to in the content.

