Article

Elemental Geochemistry and Biomarker Measurements of the Silurian Shale of Qusaiba Formation, Tayma Area, Northwestern Saudi Arabia: Implication for Organic Matter Input and Paleoenvironmental Conditions

by
Aref Lashin
1,2,*,
Mohamed Hail Hakimi
3,4,*,
Faisal AlGhamdi
5,6,
Abiodun Matthew Amao
1,
Abdulrahman AlQuraishi
7,
Khalid Abdel Fattah
1 and
Abdulaziz Bin Laboun
5
1
Petroleum and Natural Gas Engineering Department, College of Engineering, King Saud University, Riyadh 11421, Saudi Arabia
2
Geology Department, Faculty of Science, Benha University, Benha P.O. Box 13518, Egypt
3
Geology Department, Faculty of Applied Science, Taiz University, Taiz 6803, Yemen
4
Department of Petroleum Engineering, Kazan Federal University, 420008 Kazan, Russia
5
Department of Geology and Geophysics, College of Science, King Saud University, Riyadh 11451, Saudi Arabia
6
Center for Integrative Petroleum Research, College of Petroleum Engineering and Geosciences, King Fahad University of Petroleum and Minerals, Dhahran 34463, Saudi Arabia
7
National Center for Petroleum and Mining Technology, King Abdulaziz City for Science and Technology, Riyadh 12354, Saudi Arabia
*
Authors to whom correspondence should be addressed.
Minerals 2023, 13(4), 468; https://doi.org/10.3390/min13040468
Submission received: 6 February 2023 / Revised: 18 March 2023 / Accepted: 21 March 2023 / Published: 26 March 2023
(This article belongs to the Special Issue Reservoir and Geochemistry Characteristics of Black Shale)

Abstract

:
This study systematically analyzes the dark shale samples of the Silurian Qusaiba Formation from the Tayma Quadrangle outcrop section in the northwest of Saudi Arabia, and assesses the source and nature of its organic matter and the main sedimentary environmental conditions during accumulation of organic matter. The Qusaiba shale samples are characterized by total organic carbon (TOC) and sulfur contents with total values in the range of 0.87–1.76 wt. % and 0.59–4.64 wt. %, respectively, indicating a marine setting ranging from dysoxic to anoxic environmental conditions. The biomarkers are characterized by a relatively low Pr/Ph ratio between 0.50 and 1.24. The abundance of tricyclic terpanes and high C27 and C29 regular steranes equated to C28 regular sterane, providing evidence that the organic matter derived primarily from marine organisms, including algal and other aquatic organic matter and some terrigenous land plants, and was deposited under dysoxic to anoxic environmental conditions. The significant low oxygen environmental conditions may contribute to preservation of organic matter during deposition. The inorganic geochemical indications suggest that the Qusaiba shales were accumulated in a warm–humid climate and with low salinity stratification conditions of the water columns.

1. Introduction

The study area constitutes a part of the Tabuk Basin, which is located in the northwest of Saudi Arabia, between the latitudes of 27°45 and 28°00 N and longitudes of 38°15 and 38°45 E (Figure 1). The Tayma area includes different exposed Paleozoic units including Ordovician Sarah, Silurian Qusaiba, Devonian Jauf, and Permian Unayzah formations. These Paleozoic main units have been targeted for conventional and unconventional natural gas [1,2].
The key focus of the present study is the Qusaiba Formation, which is considered to be the main oil- and gas-prone source rock in the Arabian Peninsula [3,4,5,6,7].
Both surface and subsurface sections of the Qusaiba Formation have received unprecedented attention from numerous researchers [3,5,8,9,10,11,12,13,14,15]. These previous studies focused on the mineralogical, petrophysical, and geochemical characteristics of the Qusaiba shale facies, and predicted favorable zones of oil and gas. Accordingly, the lowermost mudstone unit in the lower Qusaiba Formation comprises organic-rich shales with a thickness of 3 to 75 m, generally referred to as “basal Qusaiba hot shale”. It is the major source rock of the Central Arabia Qusaiba-Paleozoic petroleum system [5,9,11,13,14,15]. The Qusaiba hot shales have a total organic carbon (TOC) content of up to 5 wt. % [4,10], indicating an anoxic depositional environment that contributed to the preservation of a rich amount of organic matter [10,13,16]. These hot shales, enriched with marine organic matter, are deposited under reducing environmental conditions, suggesting mainly hydrogen-rich Type II as the original organic matter input during deposition [3,5,17,18]. Such high HI values, with mainly Type II kerogen, indicate that the Qusaiba hot shales are likely to be promising source rocks for mainly oil generation potential [4,10].
Although many previous studies have focused on the organic geochemical characteristics of the hot shale facies within the Qusaiba Formation and their implication for conventional and unconventional oil and gas resources [3,4,5,6,7], little is known about the source of the organic matter, depositional environments, and the mechanism of the organic carbon accumulation in the dark shale rocks within the Qusaiba Formation, which is the primary objective of this study. In this regard, the objectives of the current study were to enhance the understanding of the source of organic matter and depositional environment factors (reducing and warm climatic conditions) that influenced high bioproductivity and organic carbon accumulation in the dark shale facies within the Qusaiba Formation from the Tayma Quadrangle outcrop section in the northwest of Saudi Arabia (Figure 1). Multiple techniques, including bulk geochemical methods of the total organic carbon (TOC) and sulfur contents, biomarker measurements of the saturated and aromatic fractions, as well as X-ray fluorescence (XRF) analysis for determining the trace elements, were used.
The organic carbon (TOC) and sulfur (TS) contents were used to assess the reducing environmental conditions for organic matter preservation and their influence on organic carbon accumulation. Moreover, X-ray fluorescence (XRF) analysis combined with biomarker measurements was used to evaluate the source and origin of organic matter (OM), as well as the main sedimentary factors influencing the OM accumulation.
Figure 1. Location map of study area at Tayma quadrangle, northwestern Saudi Arabia. It shows different exposed geological rock units ranging in age from Paleozoic to Recent (Modified after [19]).
Minerals 13 00468 g001

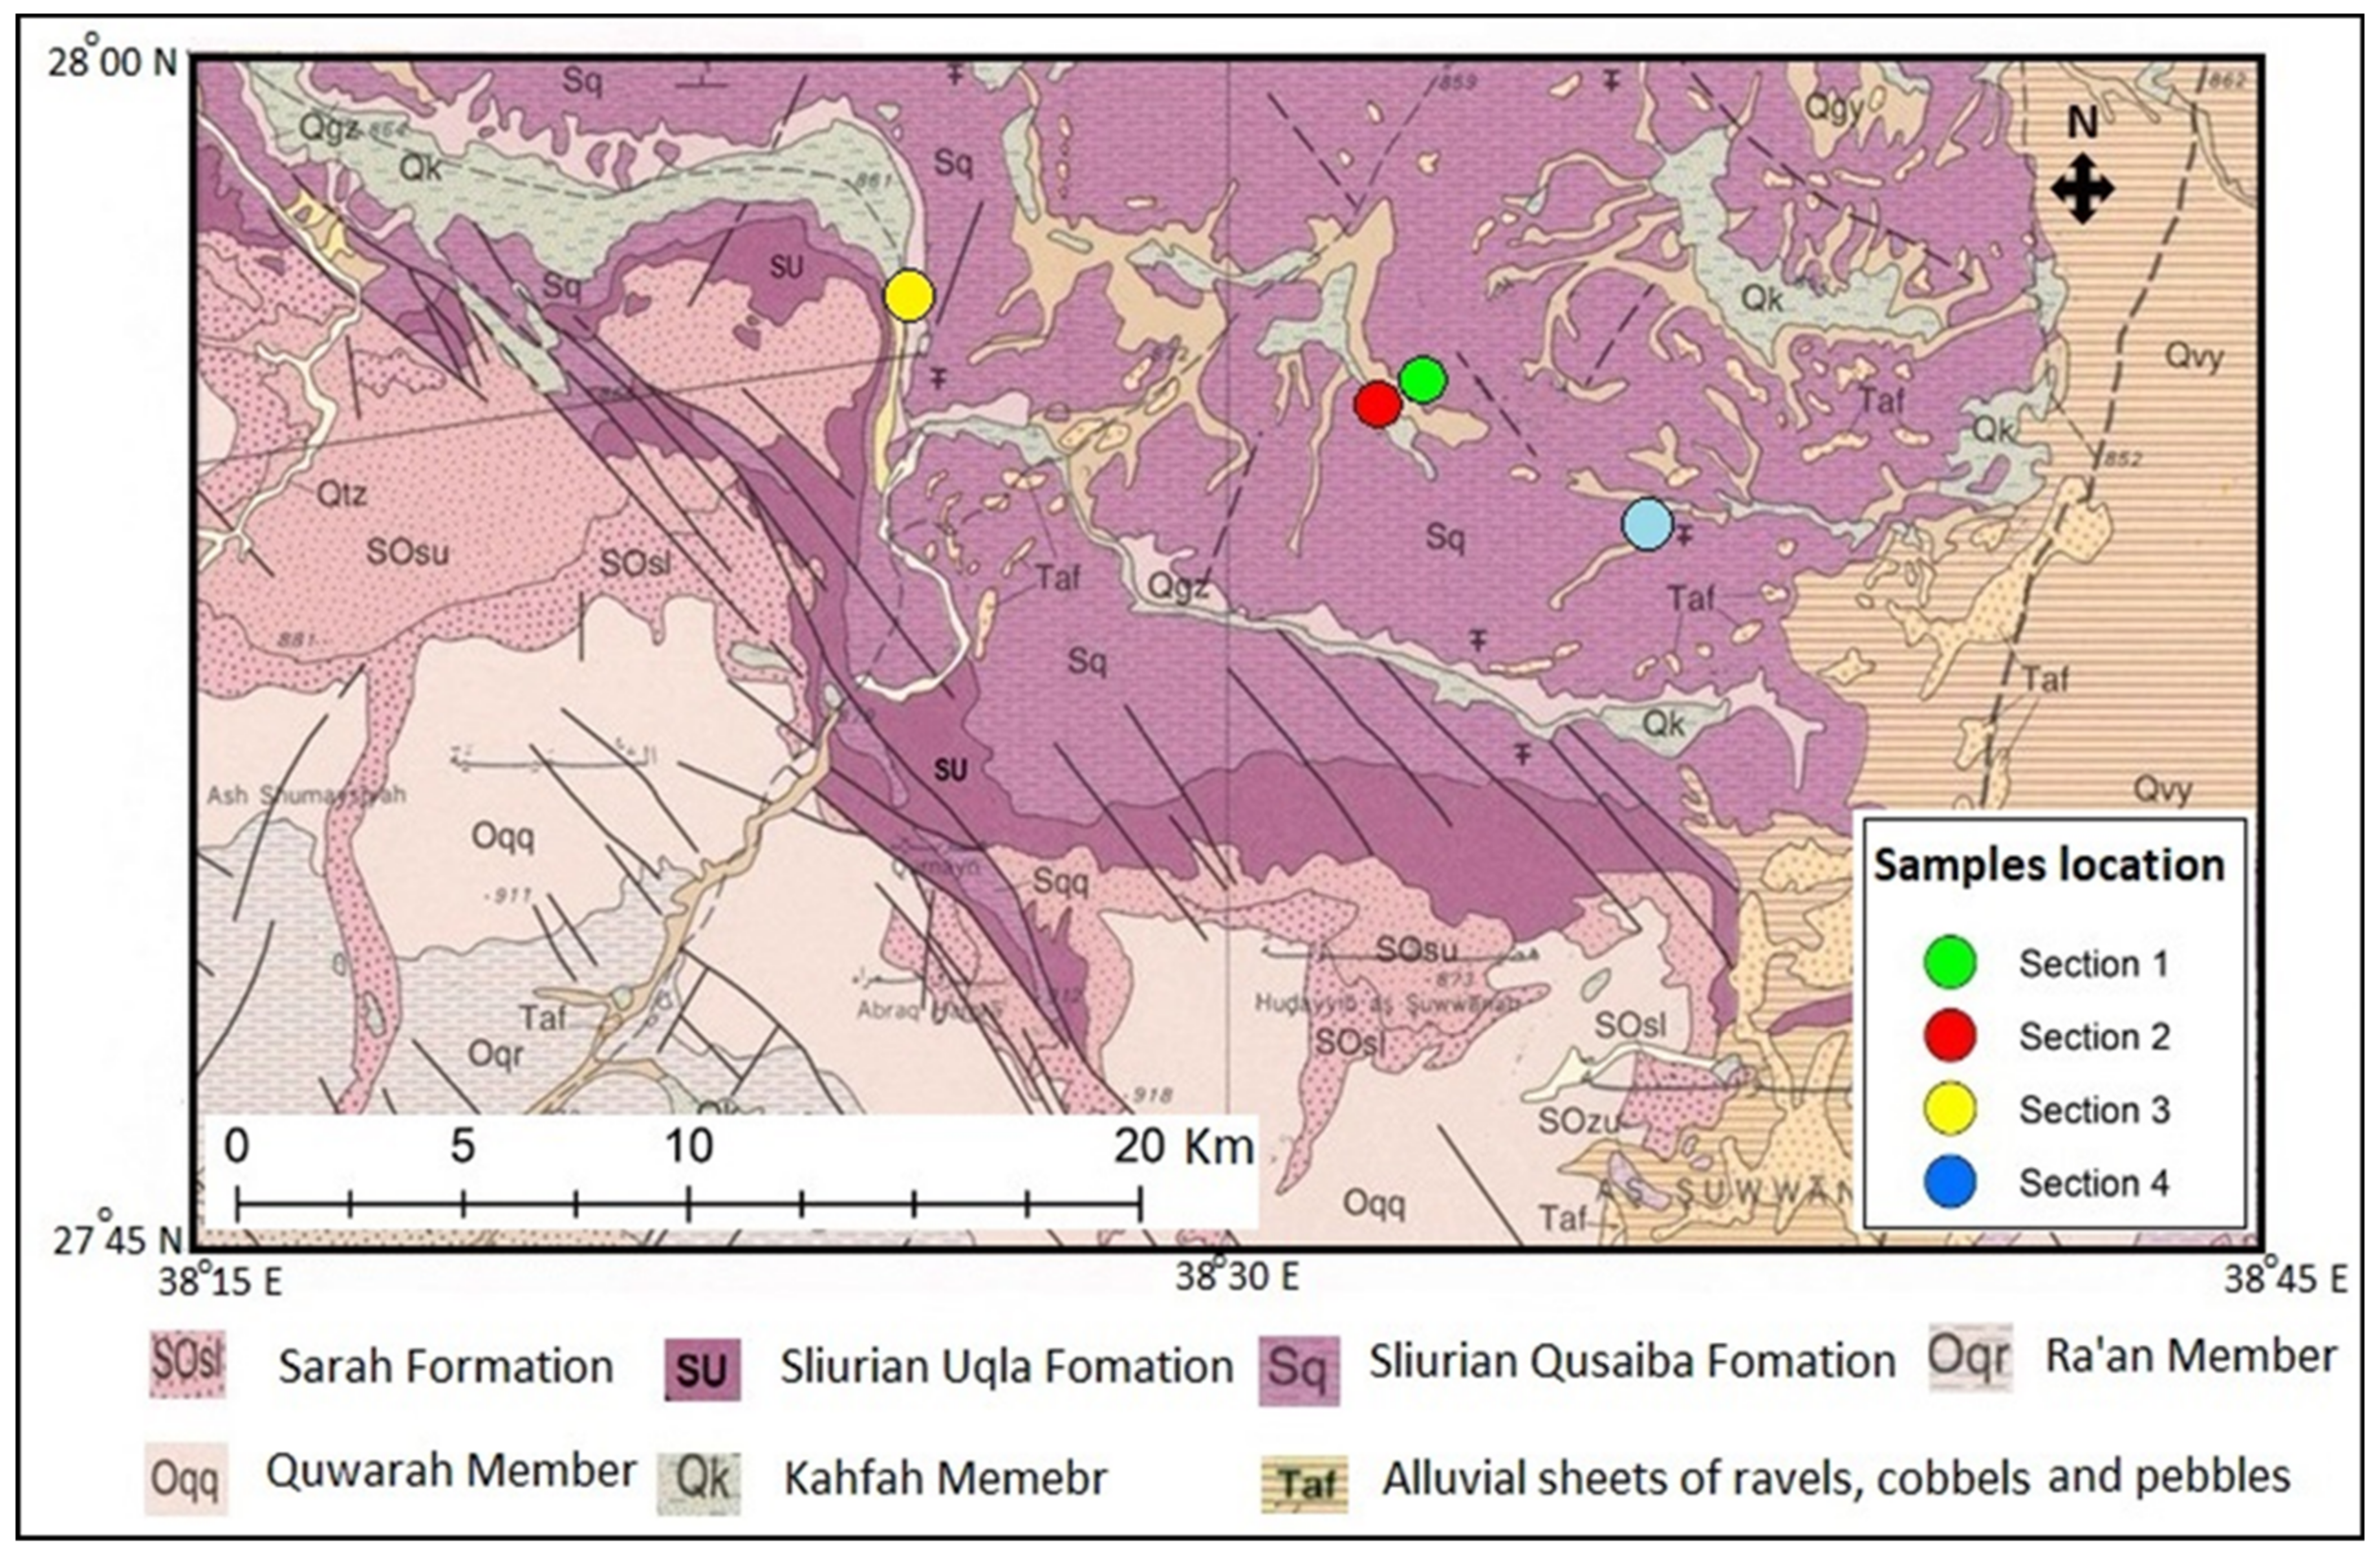
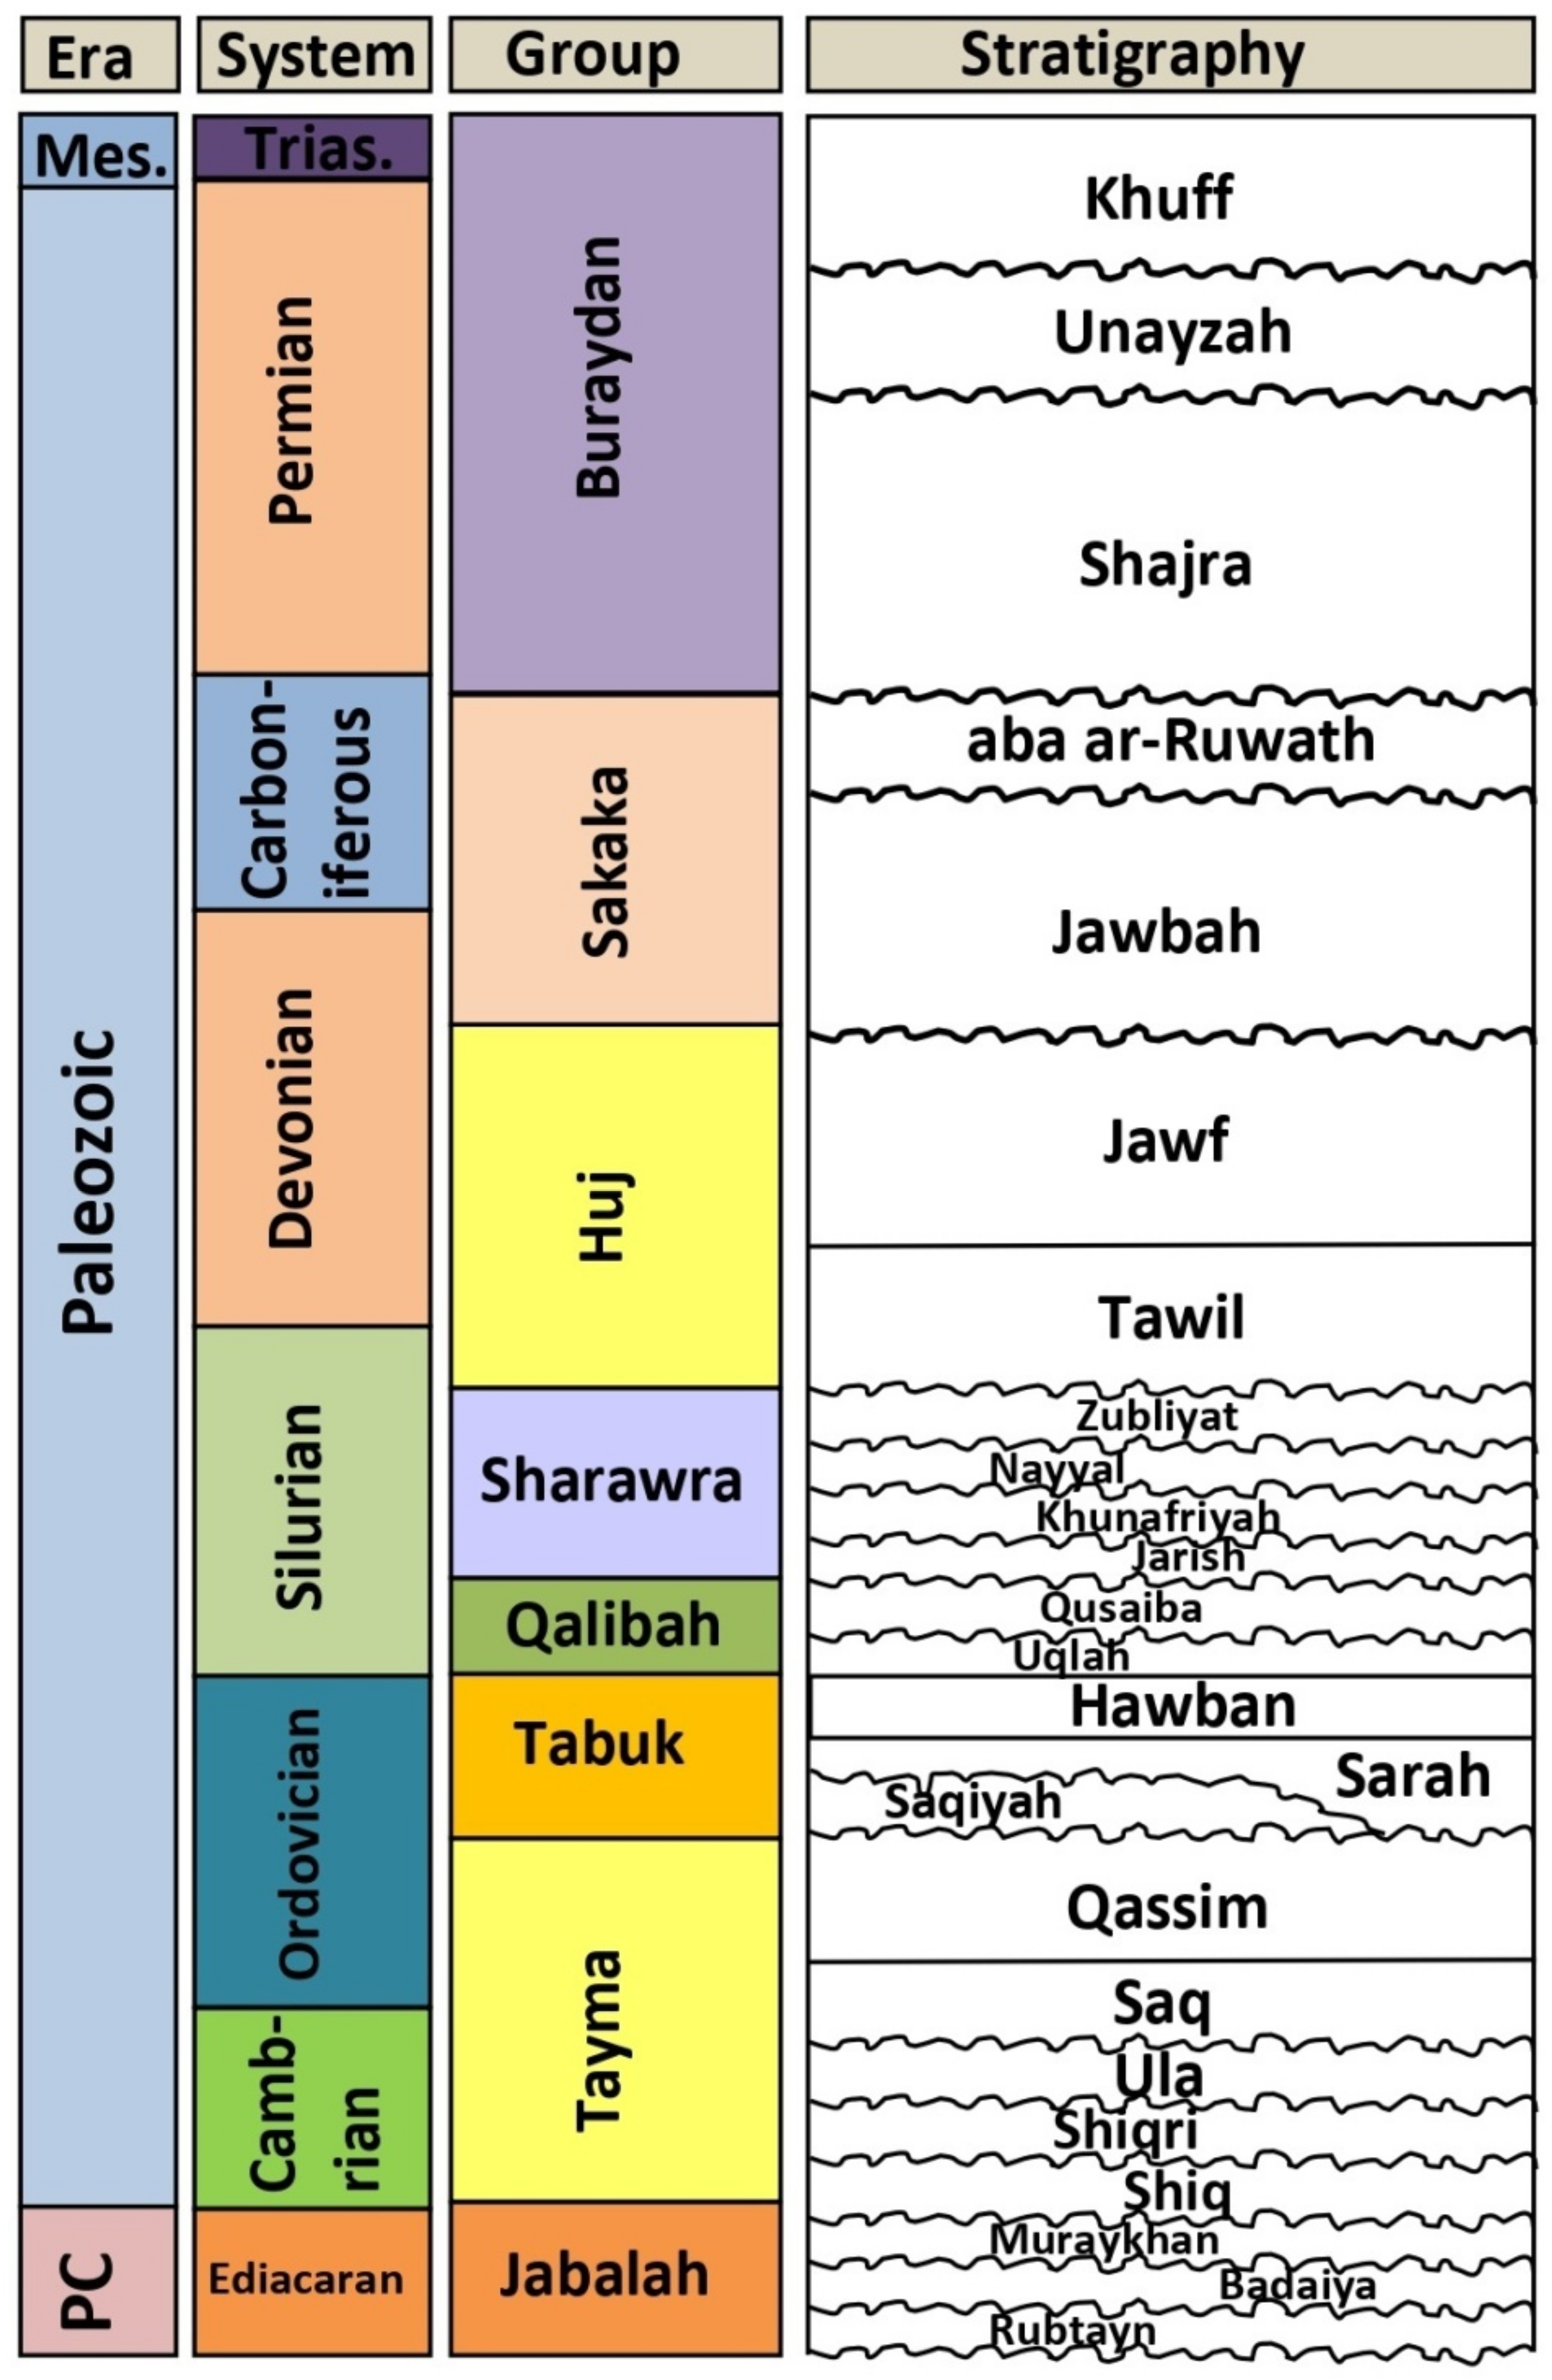
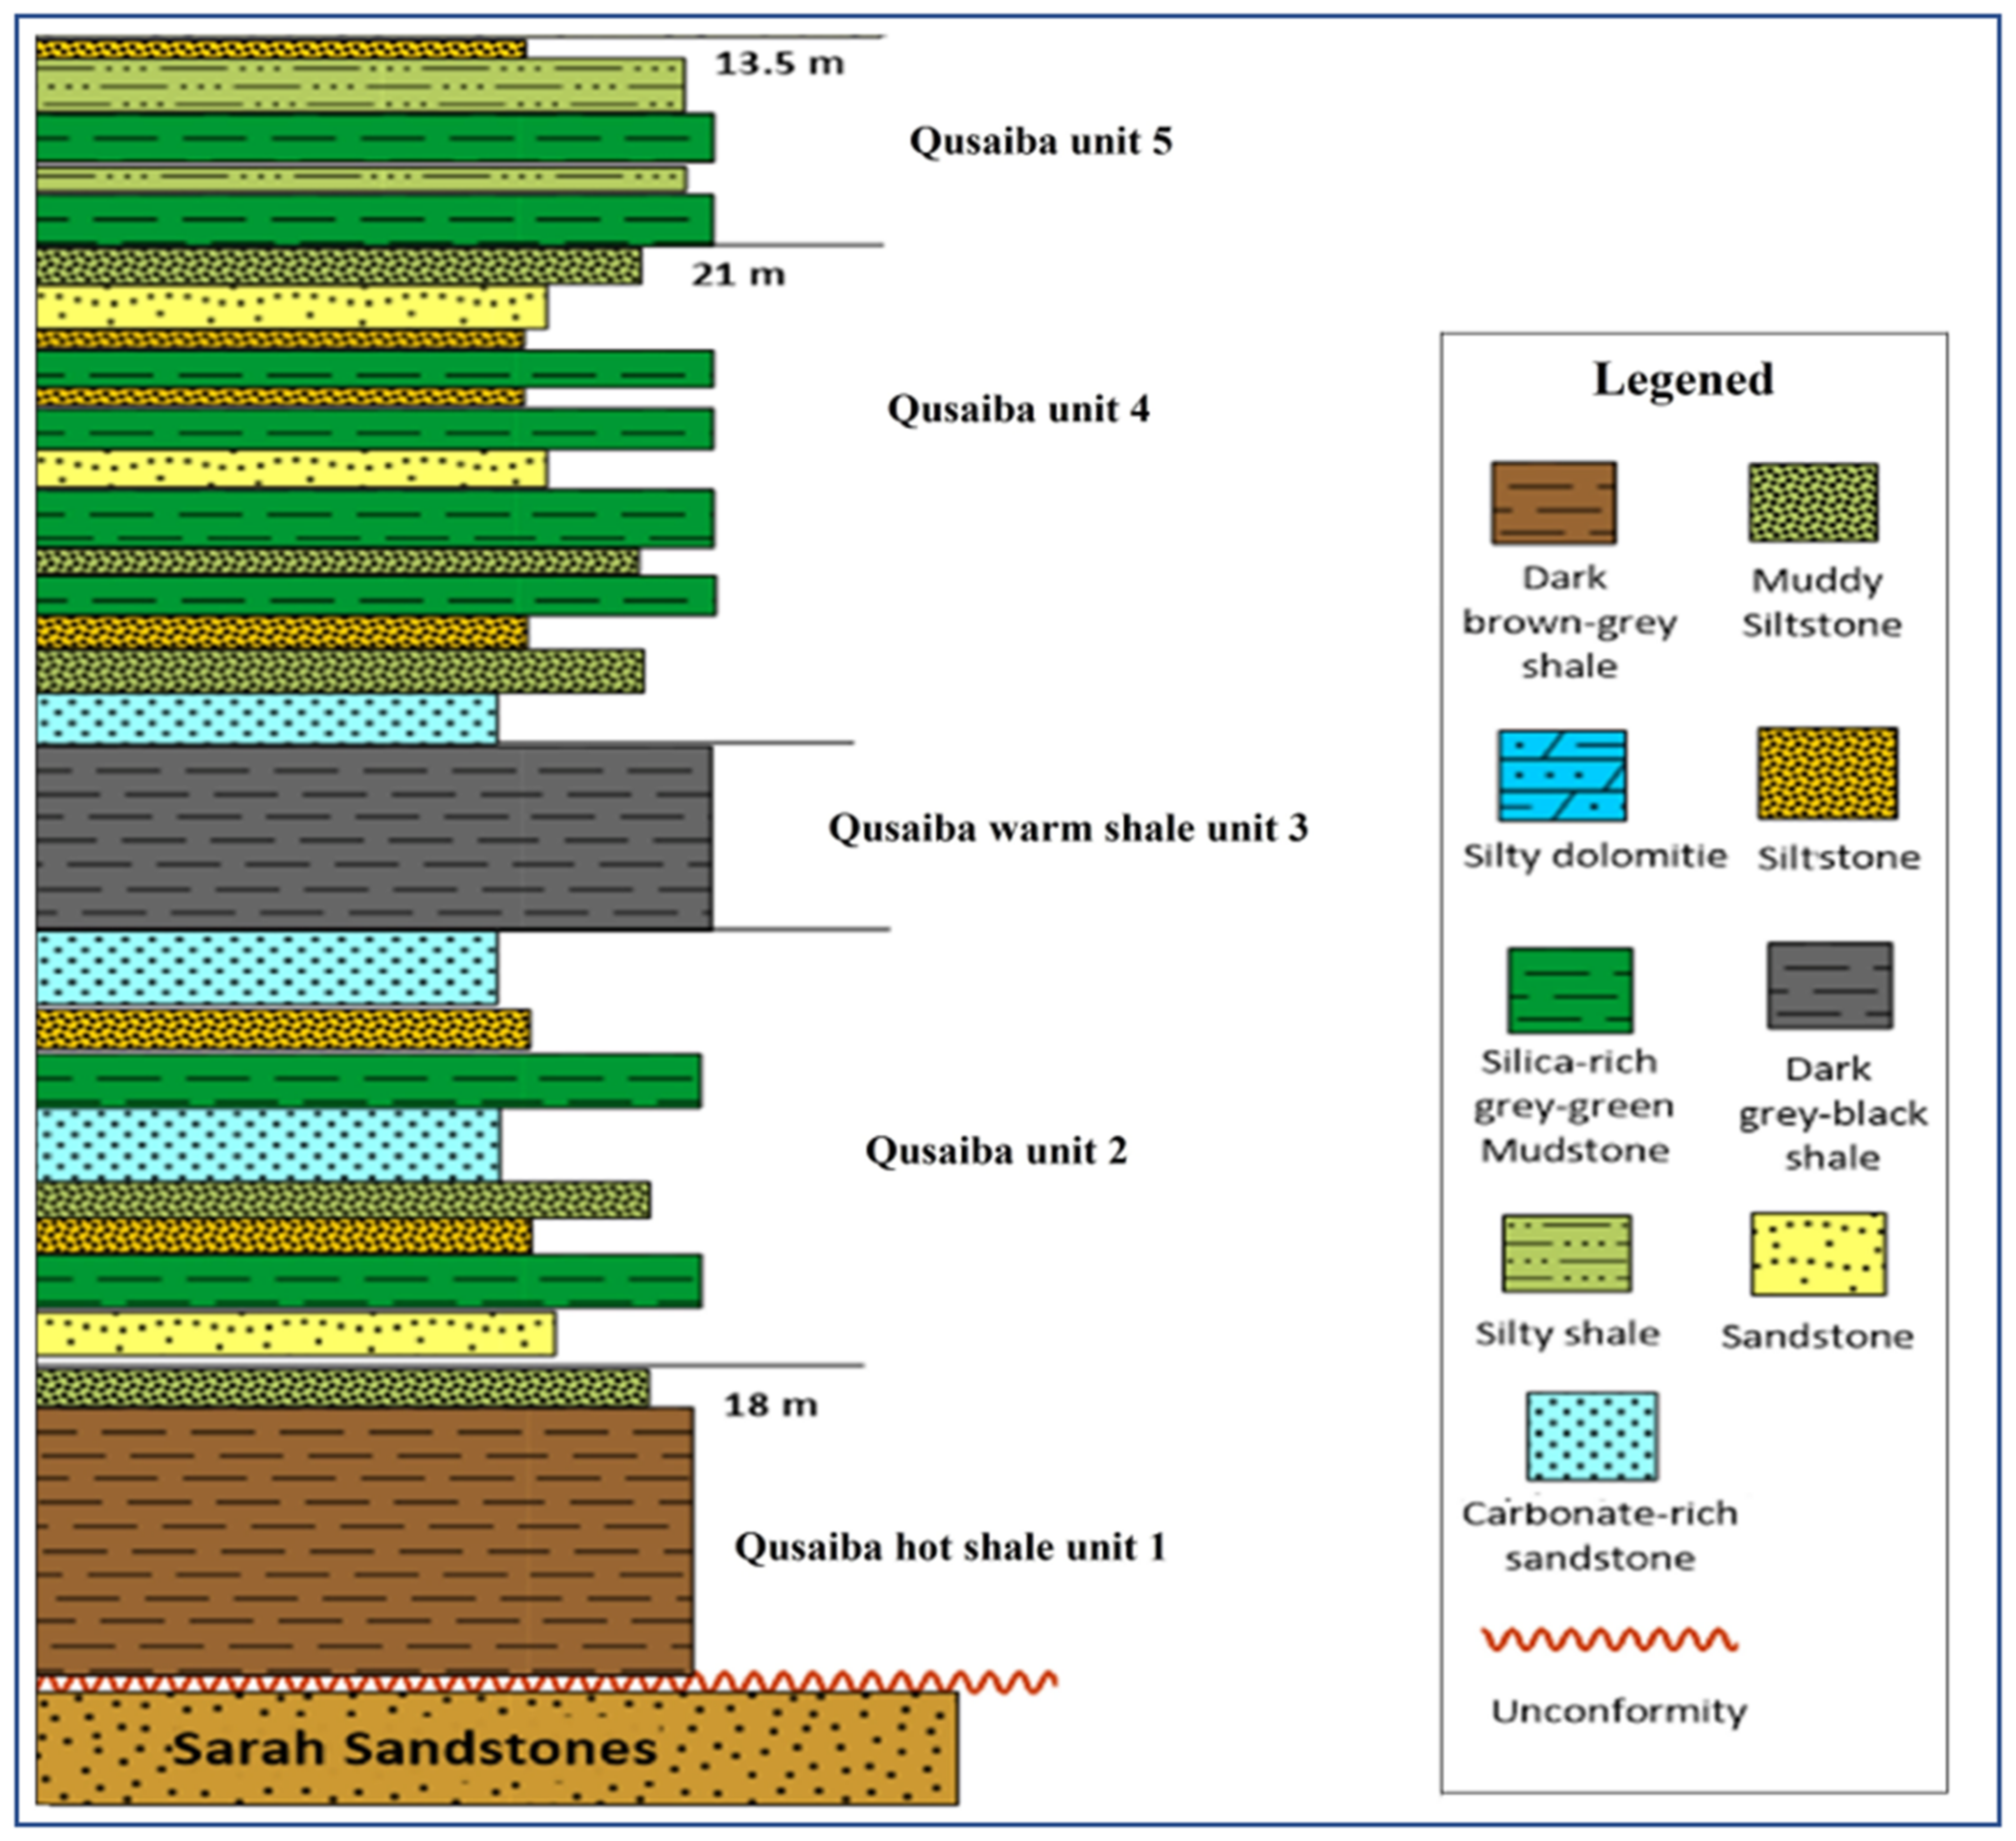
2. Geological Setting

The Tayma area received clastic and carbonate sediments ranging from the Precambrian to Mesozoic time, with the Paleozoic sedimentary succession having the greatest thickness (Figure 2). The Paleozoic sequence comprises Cambrian to Permian formations, including the Qusaiba Formation. The Qusaiba Formation is composed mostly of shale (mudstone) and thin interbeds of siltstone and sandstone and is divided informally into upper and lower parts.
The Qusaiba Formation was deposited in a marine environment and has a widespread subsurface extension from the edge of the Arabian Shield to the Zagros in the east, and from the Rub’ al Khali basin in the south to the extreme northwest of the Arabian Peninsula [20,21]. However, the Qusaiba Shale Formation has attained different thicknesses from the surface to the subsurface locations; ranging from 482 m at the outcrop section of the Tabuk basin [6] to over 1000 m in the subsurface of the basin [22]. Thickness reduction of the Qusaiba Formation in outcrops and on paleo-highs is attributed to erosion by subsequent tectonic activities such as the Early Acadian, Acadian, and Hercynian movements [6].
On a regional basis, the lower Qusaiba is characteristically an upward-coarsening sequence, whereas the upper part of the Qusaiba is a fining-upward sequence [10]. It consists of five units, of which the most important are units 1 and 3, commonly referred as “hot shale” and “warm shale”, respectively. The hot shale belongs to the lowermost mudstone unit in the Qusaiba Formation and comprises organic-rich shales with a thickness between 3 and 75 m, while the warm shale is located at unit 3 and has good organic content, although less than that of the hot shale. The Qusaiba “hot shale” is more bioturbated than the overlying shale sequences [3,4,10,23]. The richest organic beds are composed of micro-laminated shale and occur immediately above the basal sandstone of the underlying formation. Sandstones are rare within the most organic-rich source beds [10] and the inter bedding sandstones are 1.5 to 3 m thick, described as ripple laminated, moderate to well sorted, fine- to very fine-grained beds with erosional bases and gradational tops [24].
The Qusaiba Formation has been subdivided into five lithofacies listed from bottom to top as laminated organic-rich shale, graptolitic concretion lithofacies, massive organic-rich shale, organic-lean shale, interbedded siltstone–shale and cross-stratified siltstone–sandstone (Figure 3), as demonstrated by an integrated study of the sedimentology, petrography and mineralogical composition of Qusaiba shale at the Tayma Quadrangle outcrop section [13,15]. The entire dark shales were obtained from the parting present within the shale deposits of the Qusaiba succession (Figure 3).
Figure 4 shows an example of outcrop and core samples of the dark shale obtained from the study area. These dark shales were studied to expand our knowledge on the characteristics of organic matter, the origin and source of organic matter, as well as paleo-environmental conditions for organic matter accumulation during deposition time.

3. Material and Experimental Methods

In the current study, 11 dark shale samples were collected from the warm and hot shale units of the Qusaiba Formation in the Tayma Quadrangle outcrop sections of the Tabuk Basin in the northwest of Saudi Arabia as shown in Figure 1. These samples were subjected to multiple organic and inorganic geochemical methods as highlighted in the next subsections. All the geochemical analyses were done through the facilities of StratoChem services company, Cairo, Egypt.

3.1. Total Organic Carbon (TOC) and Sulfur (TS) Analysis

The total 11 shale samples were finely milled (60 μm) for measurement of TOC and S contents. To evaluate the TOC and TS contents, the initial crushed samples were treated with 10% diluted hydrochloric acid to remove carbonate minerals, and 100 mg of treated samples were then examined using a LECO C-230 carbon analyzer instrument (LECO Empowering Results, St. Joseph, MI, USA). The TOC and TS were measured as weight percentage (wt. %) and used to represent the richness of OM and total sulfur contents.

3.2. Bitumen Extraction and Gas Chromatography (GC)

The ten crushed shale samples were subsequently subjected to bitumen extraction. The soluble bitumen (expressed in ppm of the total rock sample) in these shales was extracted through the blended solvents of dichloromethane (DCM) for at least 24 h. Once the extraction was complete, the solvent was evaporated and the flask was reweighed to get the extract weight. The extracted soluble bitumen was separated into NSO compounds and saturated and aromatic hydrocarbons using Medium Pressure Liquid Chromatography (MPLC) with a Smart Line system. The analysis was based on the analytical column chromatographic technique using a pre-column containing thermally deactivated silica, and a main column of activated silica as the stationary phase with n-hexane as the mobile phase. The saturate, aromatic, and NSO fractions were eluted using n-hexane, dichloromethane, and methanol solvents, respectively.
The saturated HC fraction was then reserved for further gas chromatography (GC) analysis. Gas chromatography (GC) analysis was carried out on the aliphatic fractions of the ten samples using a Hewlett Packard 6890N (American Laboratory Trading, East Lyme, CT, USA) column with a capillary column of 60 m length, 0.25 μm inner diameter, and 0.25 μm film thickness. The temperature of the FID was gradually increased from 30 °C for 5 min, and then was held for 23.3 min at 320 °C. The compounds were identified through analyses of a known standard, the Norwegian Oil Standard NGR NSO-1.

3.3. Gas Chromatography–Mass Spectroscopy (GC–MS)

As outlined by several works, GC–MS was utilized to decipher the saturated HC fraction in the studied samples using Agilent Technologies 7890B (Agilent Technologies, Inc. Headquarters, Santa Clara, CA, USA) with a flame ionization detector. Within the GC–MS furnace, the capillary column has a 60 m length, 0.25 μm inner diameter, and 0.10 μm film thickness. The samples were warmed from 100 to 170 °C (at 1.5 °C/min rate), and passed through the GC line operating at 320 °C for 20 min. The mass spectrometer (ion source T = 230 °C, electron ionizations at 70 eV, quadrupole analysis: T = 150 °C) was operated in the Selected Ion Monitoring (SIM) mode. Data were processed with an Agilent Chemstation data system. Identification of individual compounds was based on retention time in total ion current (TIC) chromatograms and comparison of mass spectra of a known standard, the Norwegian Oil Standard NGR NSO-1. As a result, the lipid compounds in the saturated HC fraction such as normal alkanes, isoprenoids, hopanoids, terpanes, and steranes were produced and examined based on the peak heights in the m/z 85, 191 and 217 mass fragmentograms, respectively.

3.4. X-ray Fluorescence (XRF) Analysis

The 11 bulk shale samples were crushed to less than 200 meshes and examined with an X-ray fluorescence (XRF) spectrometer. In order to facilitate accurate major and trace element measurement, XRF analysis was performed on the powdered sample using a Niton XL3t GOLDD XRF. This analysis was used to determine the Si, Al, Ca, K, Fe, Mg, and Ti major elements and several trace elements such as V, Ni, Cu, Zn, Ba, and Sr.

4. Results and Interpretation

4.1. Organic Carbon and Sulfur Contents

The organic carbon content is termed TOC and reported as a function of weight%. These values most commonly infer the presence of OM richness and ability of petroleum generation during maturation [25,26,27]. The measured TOC of all Qusaiba shale samples is summarized in Table 1 and is in the range of 0.87–1.46 wt%. The majority of the measurements indicate TOC > 1 wt% (1.09–1.46 wt. %), while other samples have relatively low TOC value between 0.87 wt. % and 0.92 wt. % (Table 1). In terms of TOC content, the dark shales of the Qusaiba Formation host a high amount of organic matter.
The sulfur (S) content in the studied Qusaiba organic-rich shale samples was also measured and found to be between 0.59 wt. % and 4.67 wt. % (Table 1). The total S content is usually employed to investigate the depositional environments of marine versus non-marine [28,29]. A high S content of more than 1 wt. % implies a marine environment [29], while a low S content of less than 0.5 wt. % suggests a non-marine environment (freshwater) [28]. Accordingly, the Qusaiba organic-rich shales were generally deposited under marine environmental setting conditions, with an S content of more than 0.5 wt. % (Table 1). The interpretation of the marine environmental setting for the Qusaiba dark shales is clearly highlighted from the biomarker measurements in the following subsections.

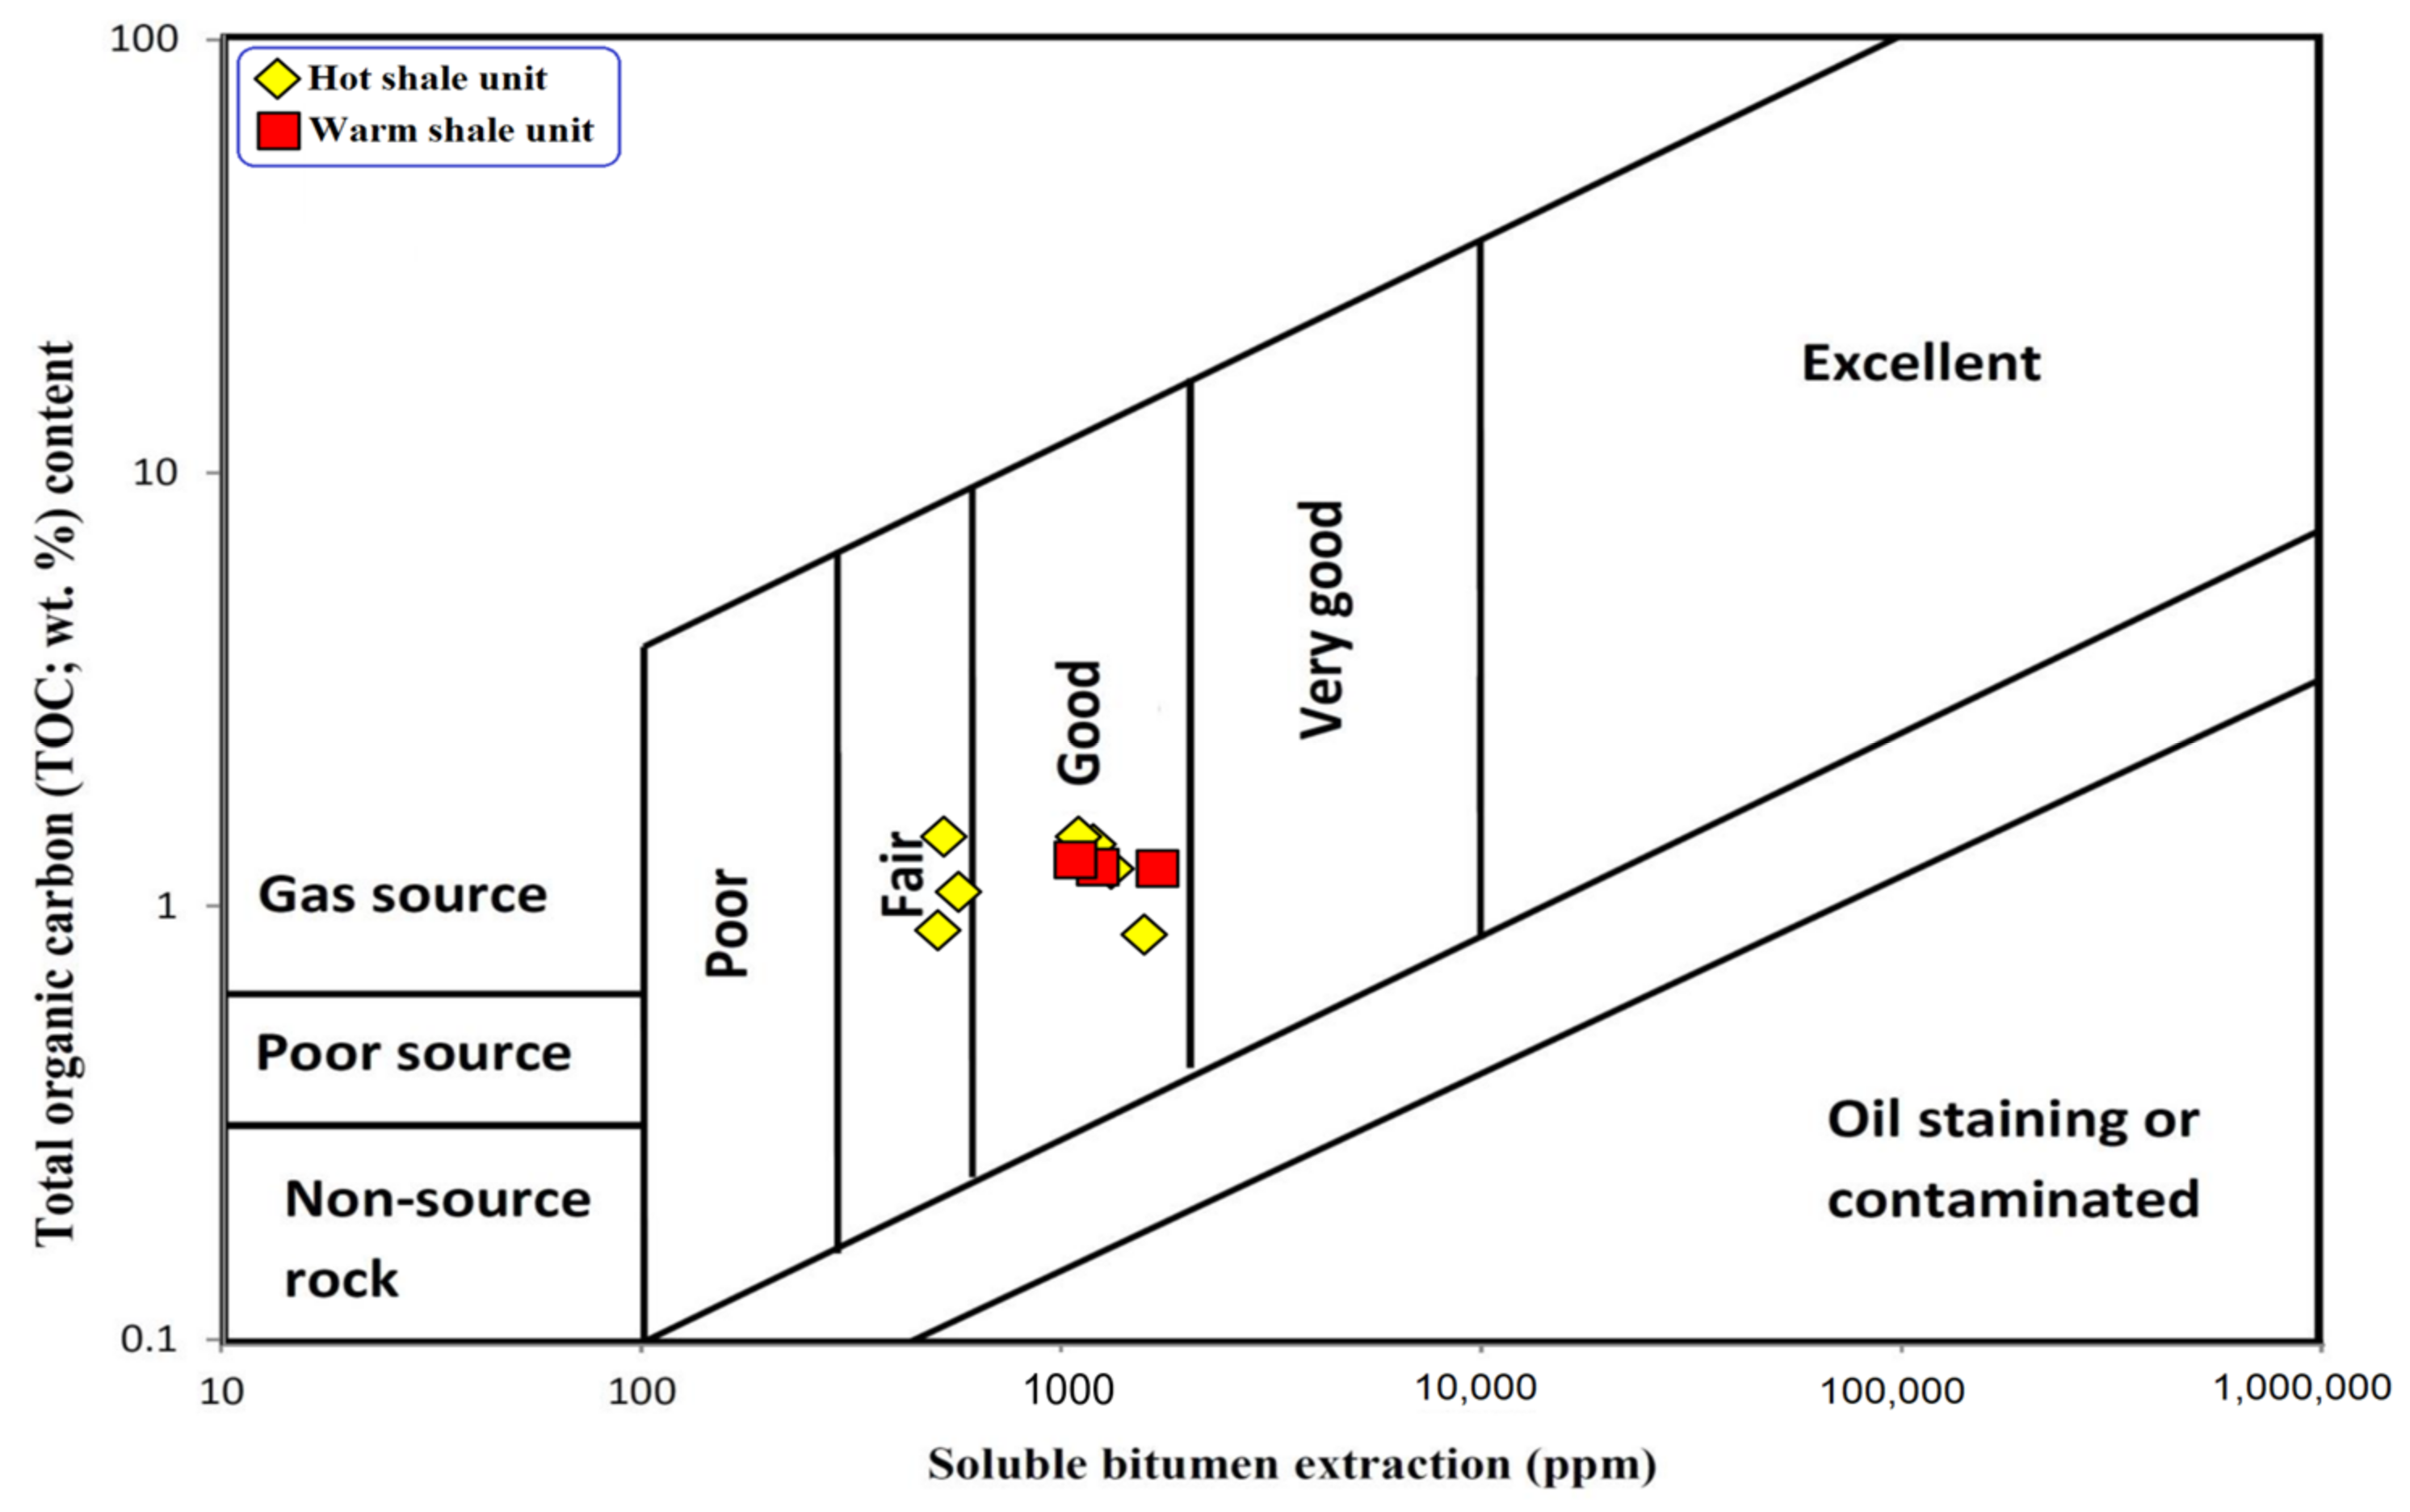
4.2. Soluble Bitumen and Its Composition

In this study, the soluble bitumen content in the analyzed shale samples was determined (Table 1). The concentration of extracted soluble bitumen was elevated in these samples, ranging between 500 and 1670 ppm (Table 1). Most of the Qusaiba shale samples had relatively high soluble bitumen values of more than 1000 ppm, while three samples had relatively the lowest values of the soluble bitumen in the range of 500 and 560 ppm (Table 1). However, the extracted soluble bitumen was well correlated with TOCs which further indicates the richness of the organic matter in the Qusaiba shale samples (Figure 5).
The relative contents of saturated, aromatic, and polar (NSO) fractions of the soluble bitumen in the analyzed samples were separated, and their comparative fragments were calculated and are presented in Table 1. According to the bulk composition distributions, the polar component (NSO) (69.70 percent–98.09 percent) prevails over the saturated and aromatic HC fractions, which range in amount from 1.27 to 12.12 percent and 0.64 to 18.18 percent, respectively (Table 1). In petroleum source rocks, the prevalence of polar component (NSO) is influenced by the rock’s thermal maturity and indicates immature source rock.

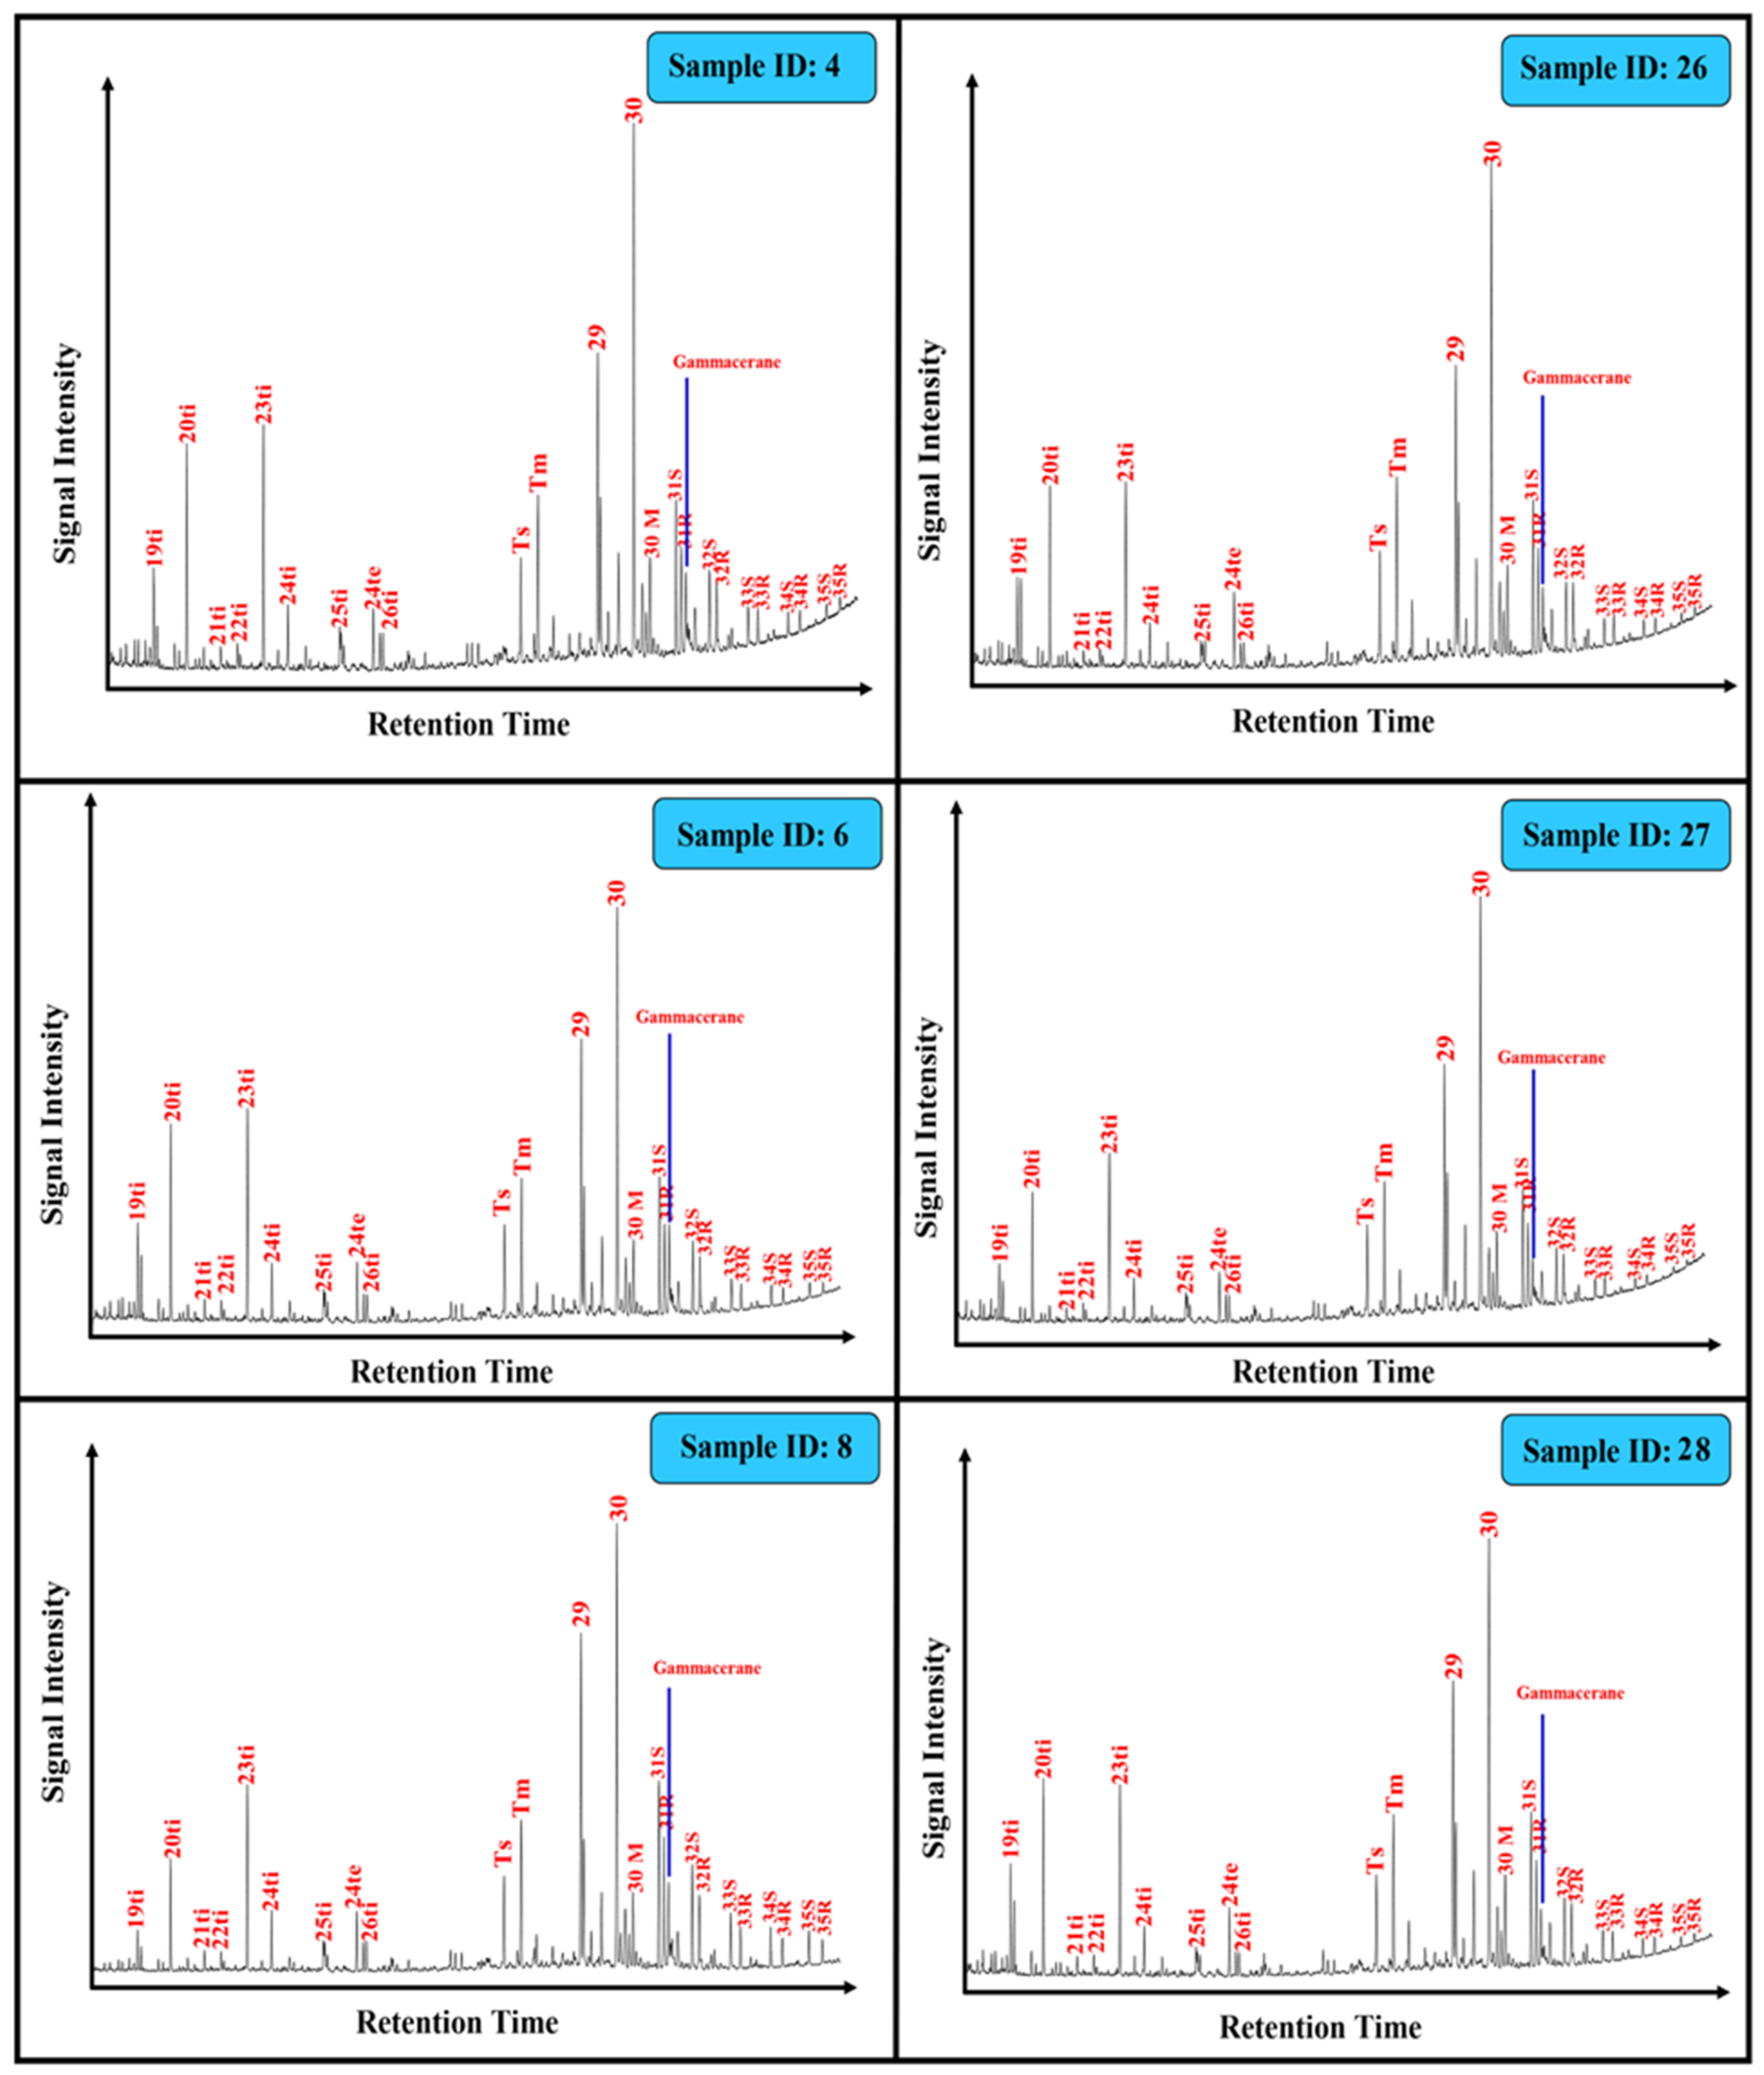
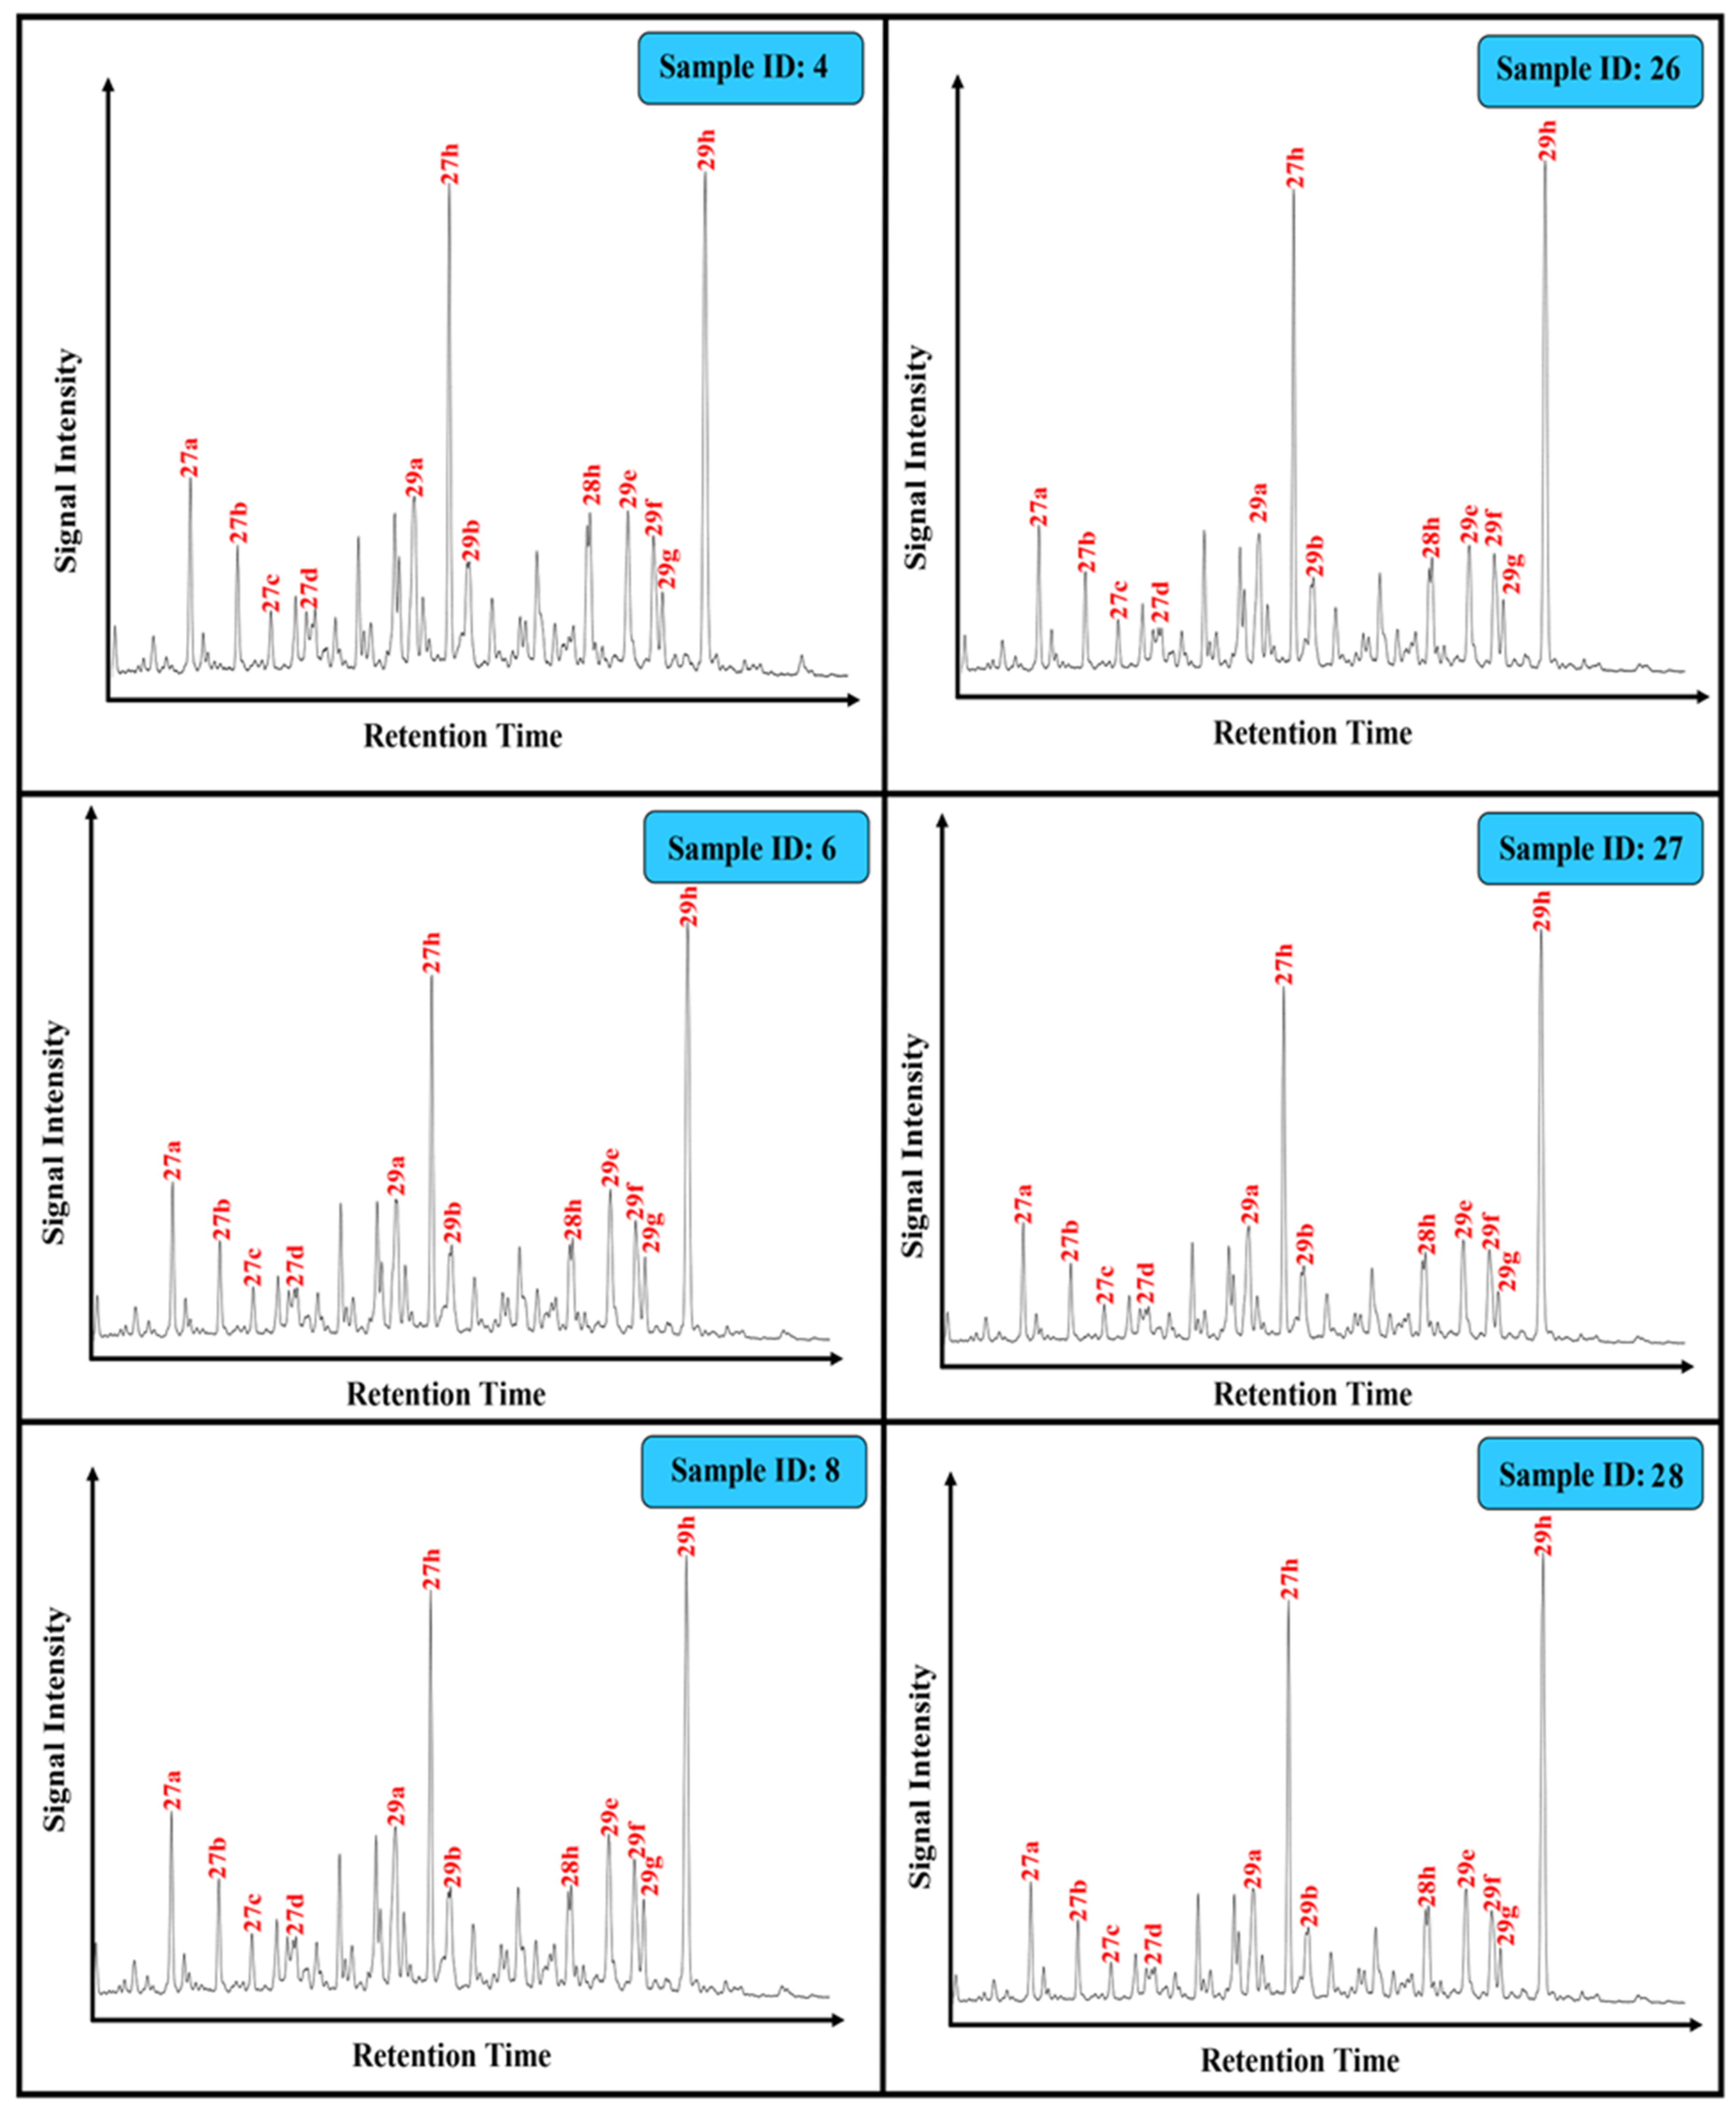
4.3. Lipid Biomarker Fingerprints

In the current study, the biomarker distributions of normal alkane, isoprenoid, hopanoid, terpanes, and sterane of the aliphatic HC fraction in the extracted Qusaiba shale samples were examined using mass fragmentograms of m/z 85, 191 and 217 ions, respectively (Figure 6, Figure 7 and Figure 8).
The mass fragmentograms of m/z 85 ions of the analyzed samples comprised mainly a series of n-C12 to n-C31 n-alkanes and were dominated by low-molecular-weight (LMW) homologues (n-C12 to n-C18) (Figure 6). Medium-molecular-weight (MMW) n-alkanes (n-C21 to n-C26) were present in subordinate abundance in the analyzed samples while high-molecular-weight (HMW) alkanes (>n-C26) were only present in low concentration (Figure 6). In this normal alkane’s distribution, the values of the carbon preference index (CPI) and waxiness degree (WI) were calculated and found to be in the range of 0.89 to 1.49 and 0.58 to 1.09, respectively (Table 1). These CPI and WI parameters can be employed to offer information on organic matter inputs [30].
The m/z 85 chromatograms also show the presence of acyclic isoprenoids pristane (Pr) and Phytane (Ph) in all extracted studied samples (Figure 6). Their relative abundance (Pr/Ph) is widely used to infer redox conditions during sedimentation and diagenesis [31,32,33]. For most of the studied samples (n = 6 samples), the Pr predominated over the Ph (Figure 6a–c), resulting in a relatively high Pr/Ph ratio of >1 and ranging from 1.02 to 1.24 (Table 1). Four other samples had relatively low Pr/Ph ratios between 0.50 and 0.97 (Table 1), based on the Ph over the Pr isoprenoids (Figure 6d–f). In addition, the isoprenoids were compared to n-alkane concentrations (C17–C18), showing the relative abundance of n-C17 and n-C18 over Pr and Ph, with low values of Pr/n-C17 and Ph/n-C18 ratios in the range of 0.29–0.68 and 0.21–0.69, respectively (Table 1).
Other important biomarkers, such as hopanoids and terpanes, were detected in the saturated HC fraction of all analyzed samples. They are often studied using GC–MS by examining the m/z 191 ion (Figure 7). In the extracted samples, hopanoids were abundant and characterized by the abundance of C30 hopanes, C29 norhopanes, and homohopanes of C31–C35 (Figure 7). The distribution of the homohopane series of extracted samples was observed on m/z 191 fragmentograms and showed that the C31 hopane dominates the homohopane distribution with decreasing abundance as carbon number increases (Figure 7).
C30 hopane is the most abundant hopanoid in most of the samples, followed by C29 norhopanes and C31 homohopane (Figure 7). Because the abundance of C30 hopanes in the extracted samples is higher than that of C29 norhopanes, the values of C29/C30 hopane ratio are <1 (0.46–0.74) and indicate clay-rich facies [34]. C30-hopane is also more prevalent than gammacerane, and C31 22R-homohopanes (Figure 7), resulting in low G/C30 and C31R/C30H ratios in the range of 0.13–0.48 and 0.25–0.33, respectively (Table 2). However, the shale samples of the hot shale unit had higher G/C30 and C31R/C30H ratios than the warm shale unit (Table 2). Furthermore, the m/z 191 mass fragmentograms showed substantial amounts of tricyclic terpanes, ranging from C19 to C26 (Figure 7). The distribution of tricyclic terpanes has been used to calculate several ratios such as C23 tricyclic/C24 tricyclic (C24T/C23T), C24 tetracyclic/ C26 tricyclic (C24Te/C26T), and C26 tricyclic/C25 tricyclic (C26T/C25T). The tricyclic terpane ratios are presented in Table 2.
Steranes and diasteranes are also the most important biomarker compounds found in the saturated HCs of the analyzed samples and are derived from the mass fragmentograms m/z 217 ion (Figure 8). Mass fragmentograms of m/z 217 generally show high sterane abundance compared to diasteranes (Figure 8). According to the steroid distributions, the C27-C29 regular steranes are characterized by high levels of C27 and C29 regular sterane compared to C28 regular steranes (Figure 9), resulting in relative percentages in the range of 40.5%–45.8%, 30.5%–48.3%, and 7.1%–23.7%, respectively (Table 2). The standard C27/C29 regular sterane ratio was further calculated as shown in Table 2.

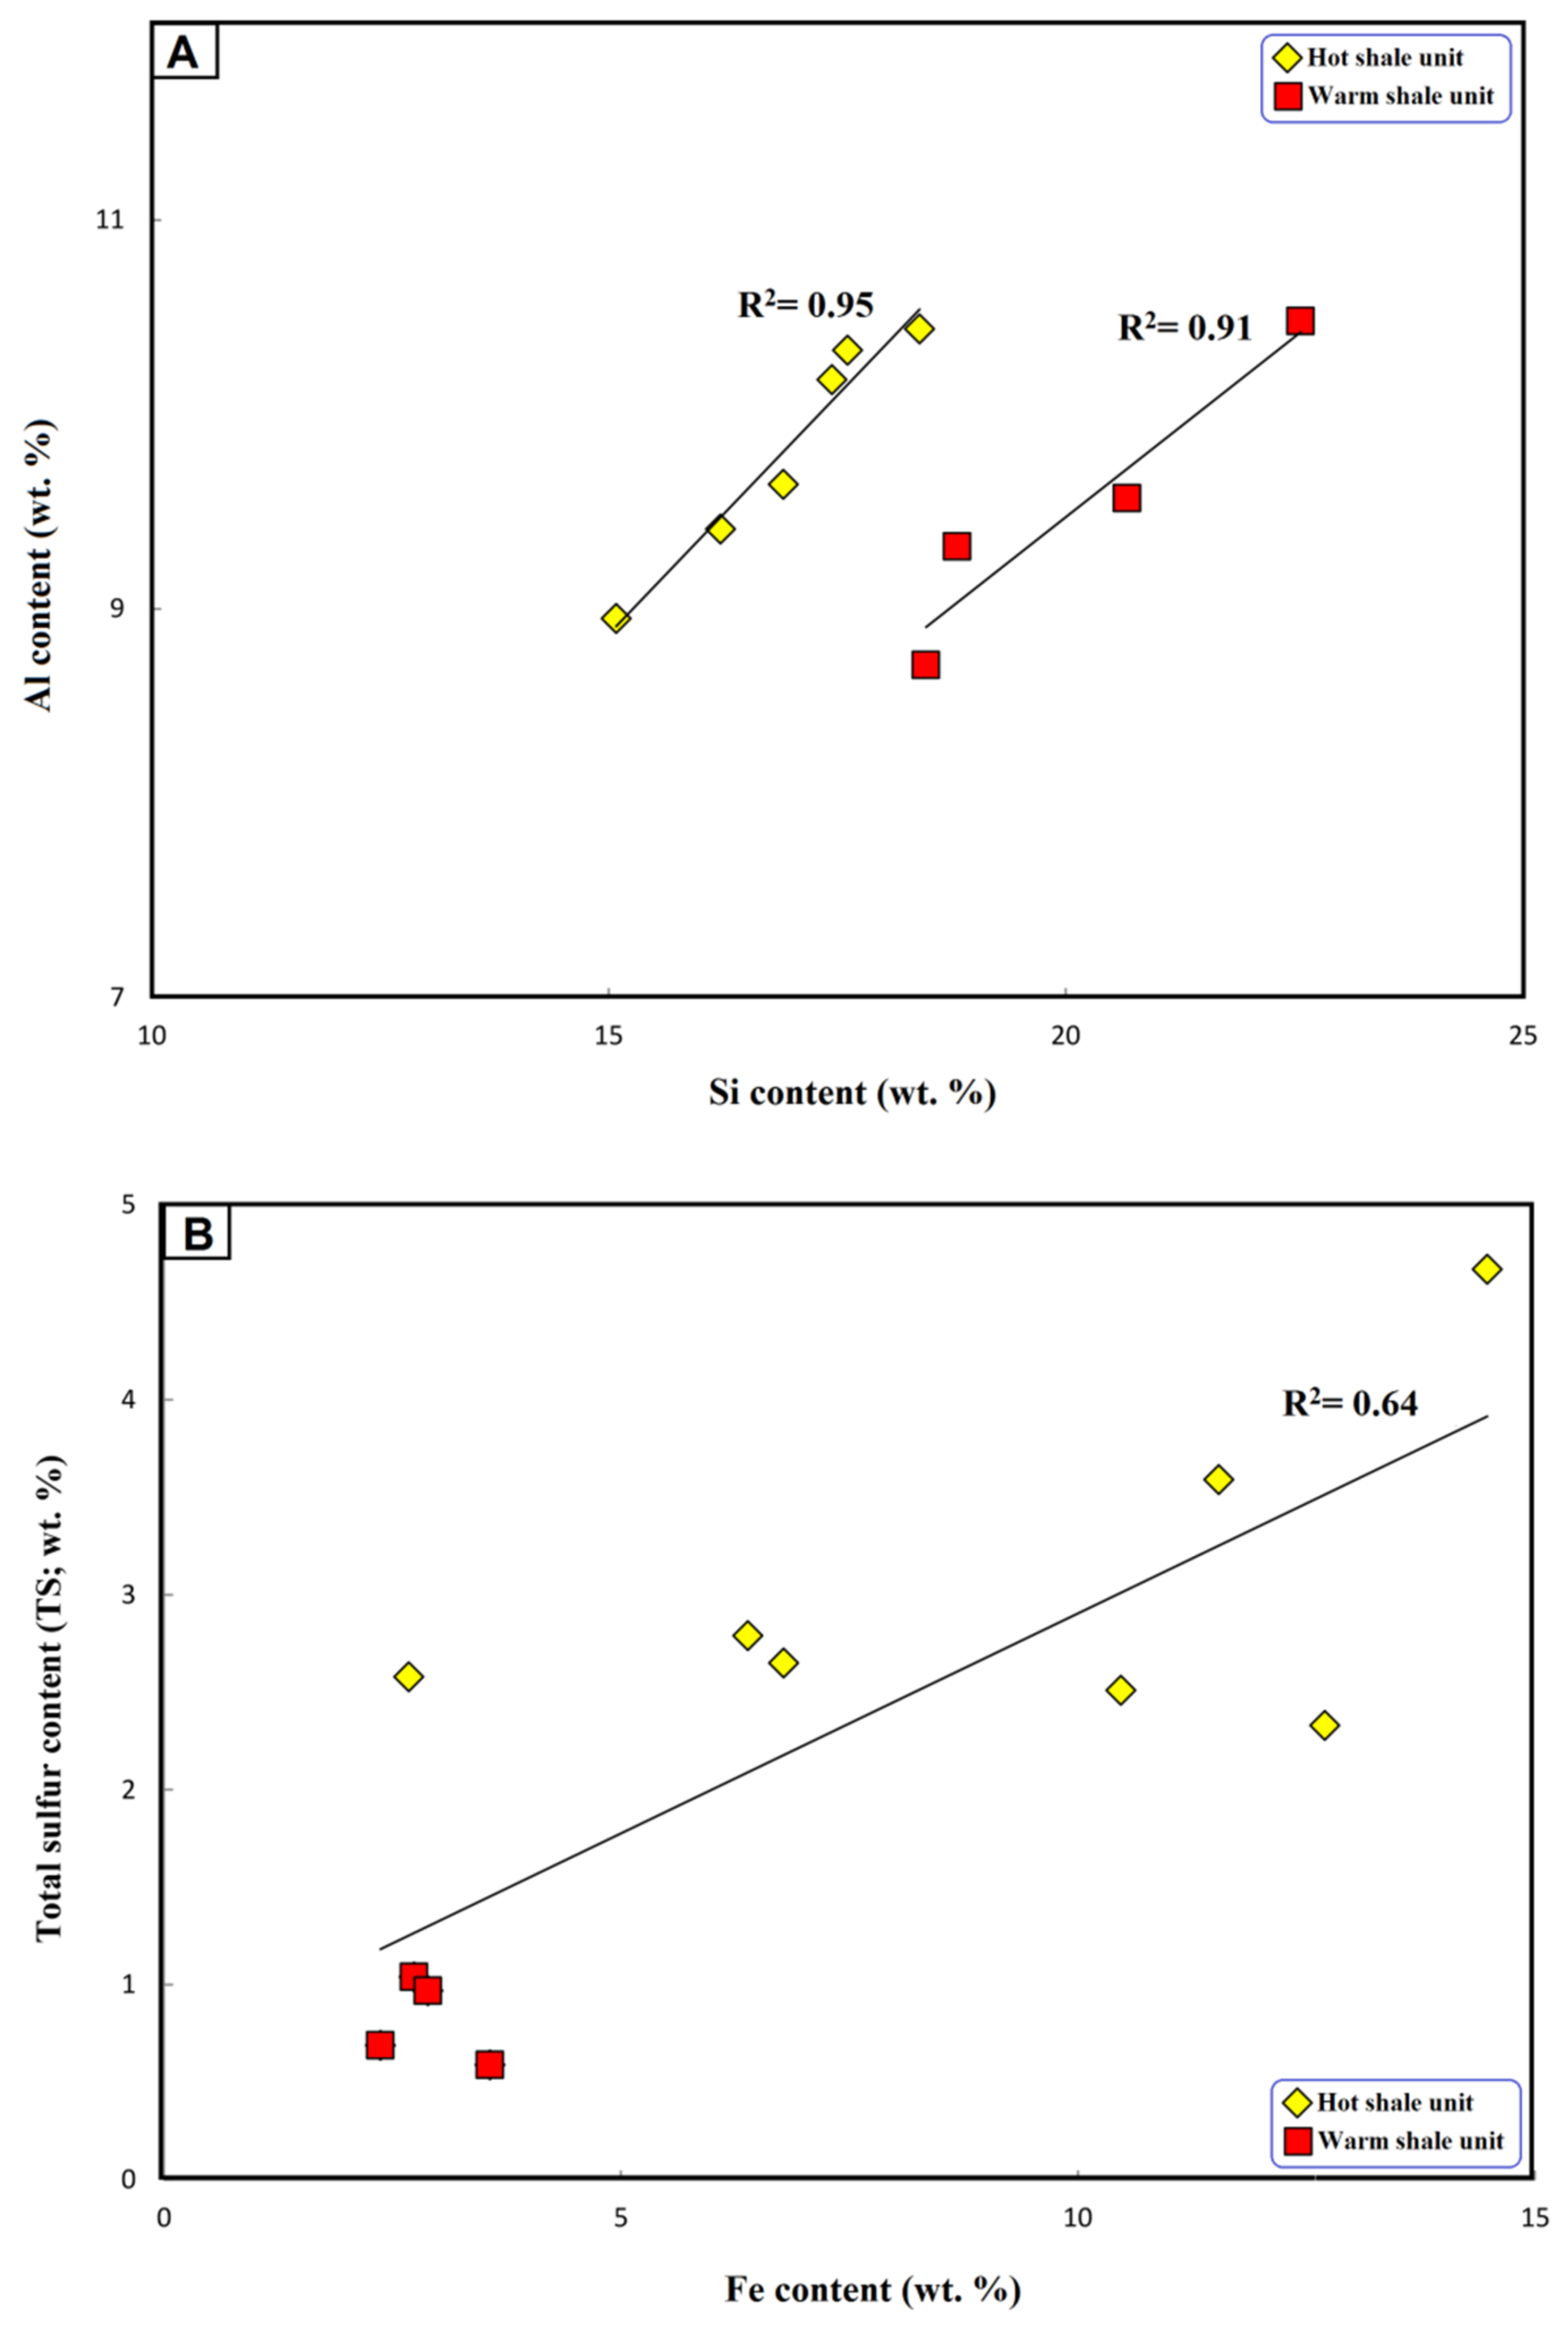
4.4. Major and Trace Element Distributions

The abundances of major elements and selected trace elements and their ratios in the analyzed black shales of the Qusaiba units are given in Table 3. The abundances of the Si, Al, Fe, and K in the analyzed samples were higher when compared with the other major elements. Most of the studied samples had high Si (15.08–22.57 wt %) and Al (8.71–10.48 wt %). The Qusaiba samples were depleted in Ti, Ca, and Mg elements, respectively (Table 3).
The Al and Si were well correlated as can be seen from the relatively high ratios between 0.46 and 0.49 (Table 3), and the positive relationship with R2 values of 0.95 and 0.91 (Figure 9A), suggesting that clay minerals are the main source of Si. Furthermore, the clay minerals contain a lot of Al and Ti, and Ti may be found inside clay lattices or in detrital minerals [35,36]. In this work, a significant amount of Ti in the range of 0.70%–1.11% was found in the analyzed Qusaiba shale samples (Table 3), indicating that Ti is extensively coupled with clay lattices and has a low input of detrital mineral matter during the development of the Qusaiba shale deposits.
In addition, a significant amount of Fe2O3 up to 14.48 wt % was recorded in the hot shale unit samples (Table 3). However, iron in sediments occurs in a number of forms, such as Fe sulfides (pyrite and marcasite), Fe carbonates (e.g., siderite and ankerite), Fe-bearing clays, Fe sulphate (e.g., ferrous sulphate and jarosite), and organically bound Fe [37]. In the studied shales, Fe2O3 is well correlated with total sulfur (S) as demonstrated by the high positive relationship (r = +0.64) (Figure 9B). This finding suggests that the Fe in the analyzed samples is mostly inorganic and probably related to the occurrence of pyrite mineral associated with the organic matter during deposition.
Furthermore, the analyzed shale samples of the Qusaiba shale units show enrichment for V, Ba, and Sr trace elements (Table 3). The observed enrichment of trace elements in the studied shale samples is suggestive of a brackish water environment [38,39]. However, several geochemical ratios such as V/Ni, V/(V+N), Sr/Ba, and Sr/Cu were calculated based on the abundances of these trace elements and found to be in the ranges 0.44–4.49, 0.31–0.82, 0.52–1.11 and 0.44–1.28, respectively (Table 3). These ratios derived from trace elements are widely used to assess the redox and climate conditions during the deposition of the organic-rich Qusaiba shale units, as discussed in the next subsections.

5. Discussion

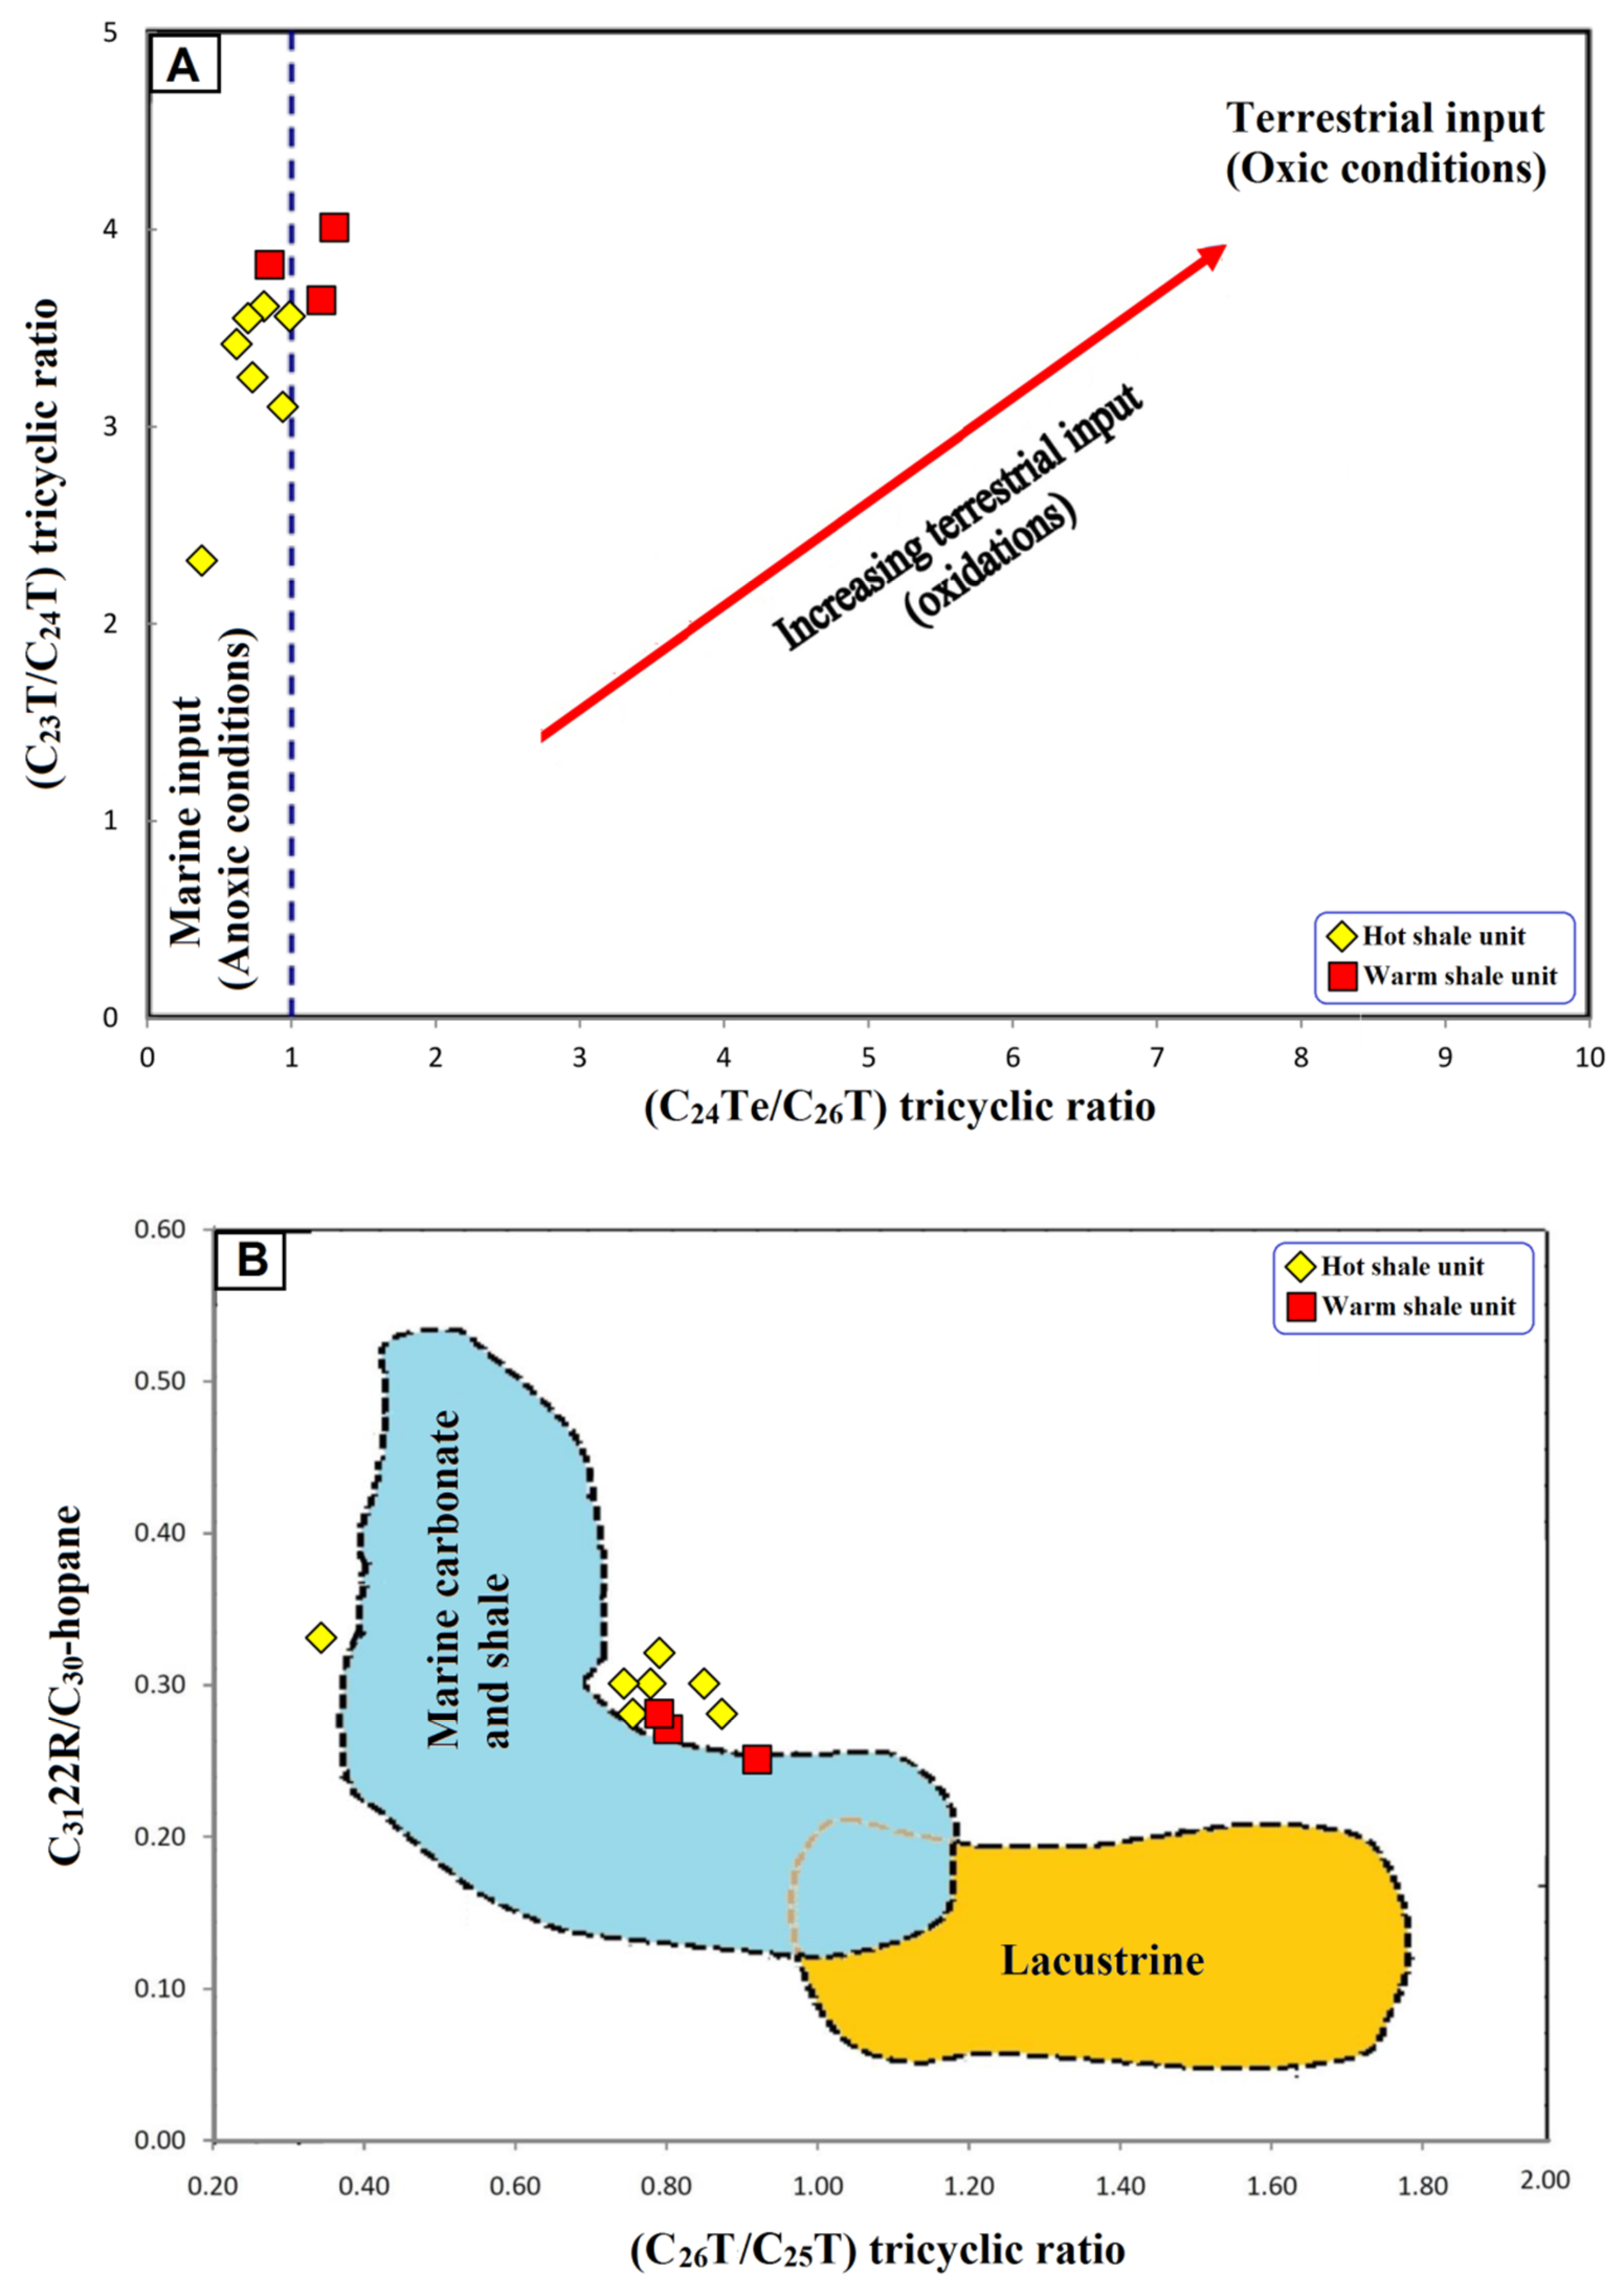
5.1. Origin and Source of Organic Matter (OM) Input

In this work, the nature of organic matter input during deposition of the analyzed Qusaiba shale units were assessed by employing multiple biomarker proxies, including normal alkane, isoprenoid, terpane, sterane, and their ratios and parameters. The unimodal distribution of normal alkanes and isoprenoids in the studied samples with a high abundance of the lower to medium molecular compounds (n-C12–n-C23), and low amounts of waxy alkanes (+n-C23) (Figure 6), indicates that the analyzed Qusaiba shale units were home to mixed marine organic matter of blended plankton and algae with a small amount of terrigenous OM input [40,41,42].
This mixture of organic matter was also demonstrated by the CPI and waxiness degree values (Table 1), and revealed a dominating contribution of marine organic matter input (Figure 10A). However, the pristane/n-C17 and phytane/n-C18 ratios (Table 2) further indicate mixed organic matter, with algal marine-derived organic matter during deposition of the Qusaiba shale units (Figure 10B).
This explanation is validated by the occurrence of the hopanes and tricyclic terpanes (Figure 7). The tricyclic terpanes in the studied samples are categorized by a high abundance of C23 tricyclic and relatively high C24 tricyclic and C26 tricyclic terpanes to C24 tetracyclic terpane (Figure 7), a with high C23tri/C24tri ratio of more than 2 and a low C24tetra/C26tri ratio of less than 1 (Table 3), implying a high contribution of marine organic matter into the Qusaiba shale units (Figure 11A). However, this relationship also shows that the samples of the Qusaiba hot shale unit were deposited in higher reducing conditions than the Qusaiba warm shale unit (Figure 11A). The C30 hopane dominates relative to the C31R homohopane (Figure 7) A relatively high C31R/C30 ranging from 0.25 to 0.33 (Table 2) was also used to infer a marine setting for the corresponding source rock, as values above 0.25 demonstrate marine depositional environments [40]. The origin of marine organisms is also supported by the relationship between C26tri/C25tri and C31R/C30 ratios (Figure 11B).
In addition, the higher abundance of the C27 regular sterane than C28 and C29 regular steranes of all examined samples (Figure 8 and Table 2) supports the explanation of primarily planktonic and algal origin, with significant amounts of organic matter resulting from plants based on the adapted ternary diagram of Huang and Meinschein [43] as shown in Figure 12. This mixed organic matter is also supported by the presence moderate C27/C28 regular sterane ratios of less than 1 (Figure 13).

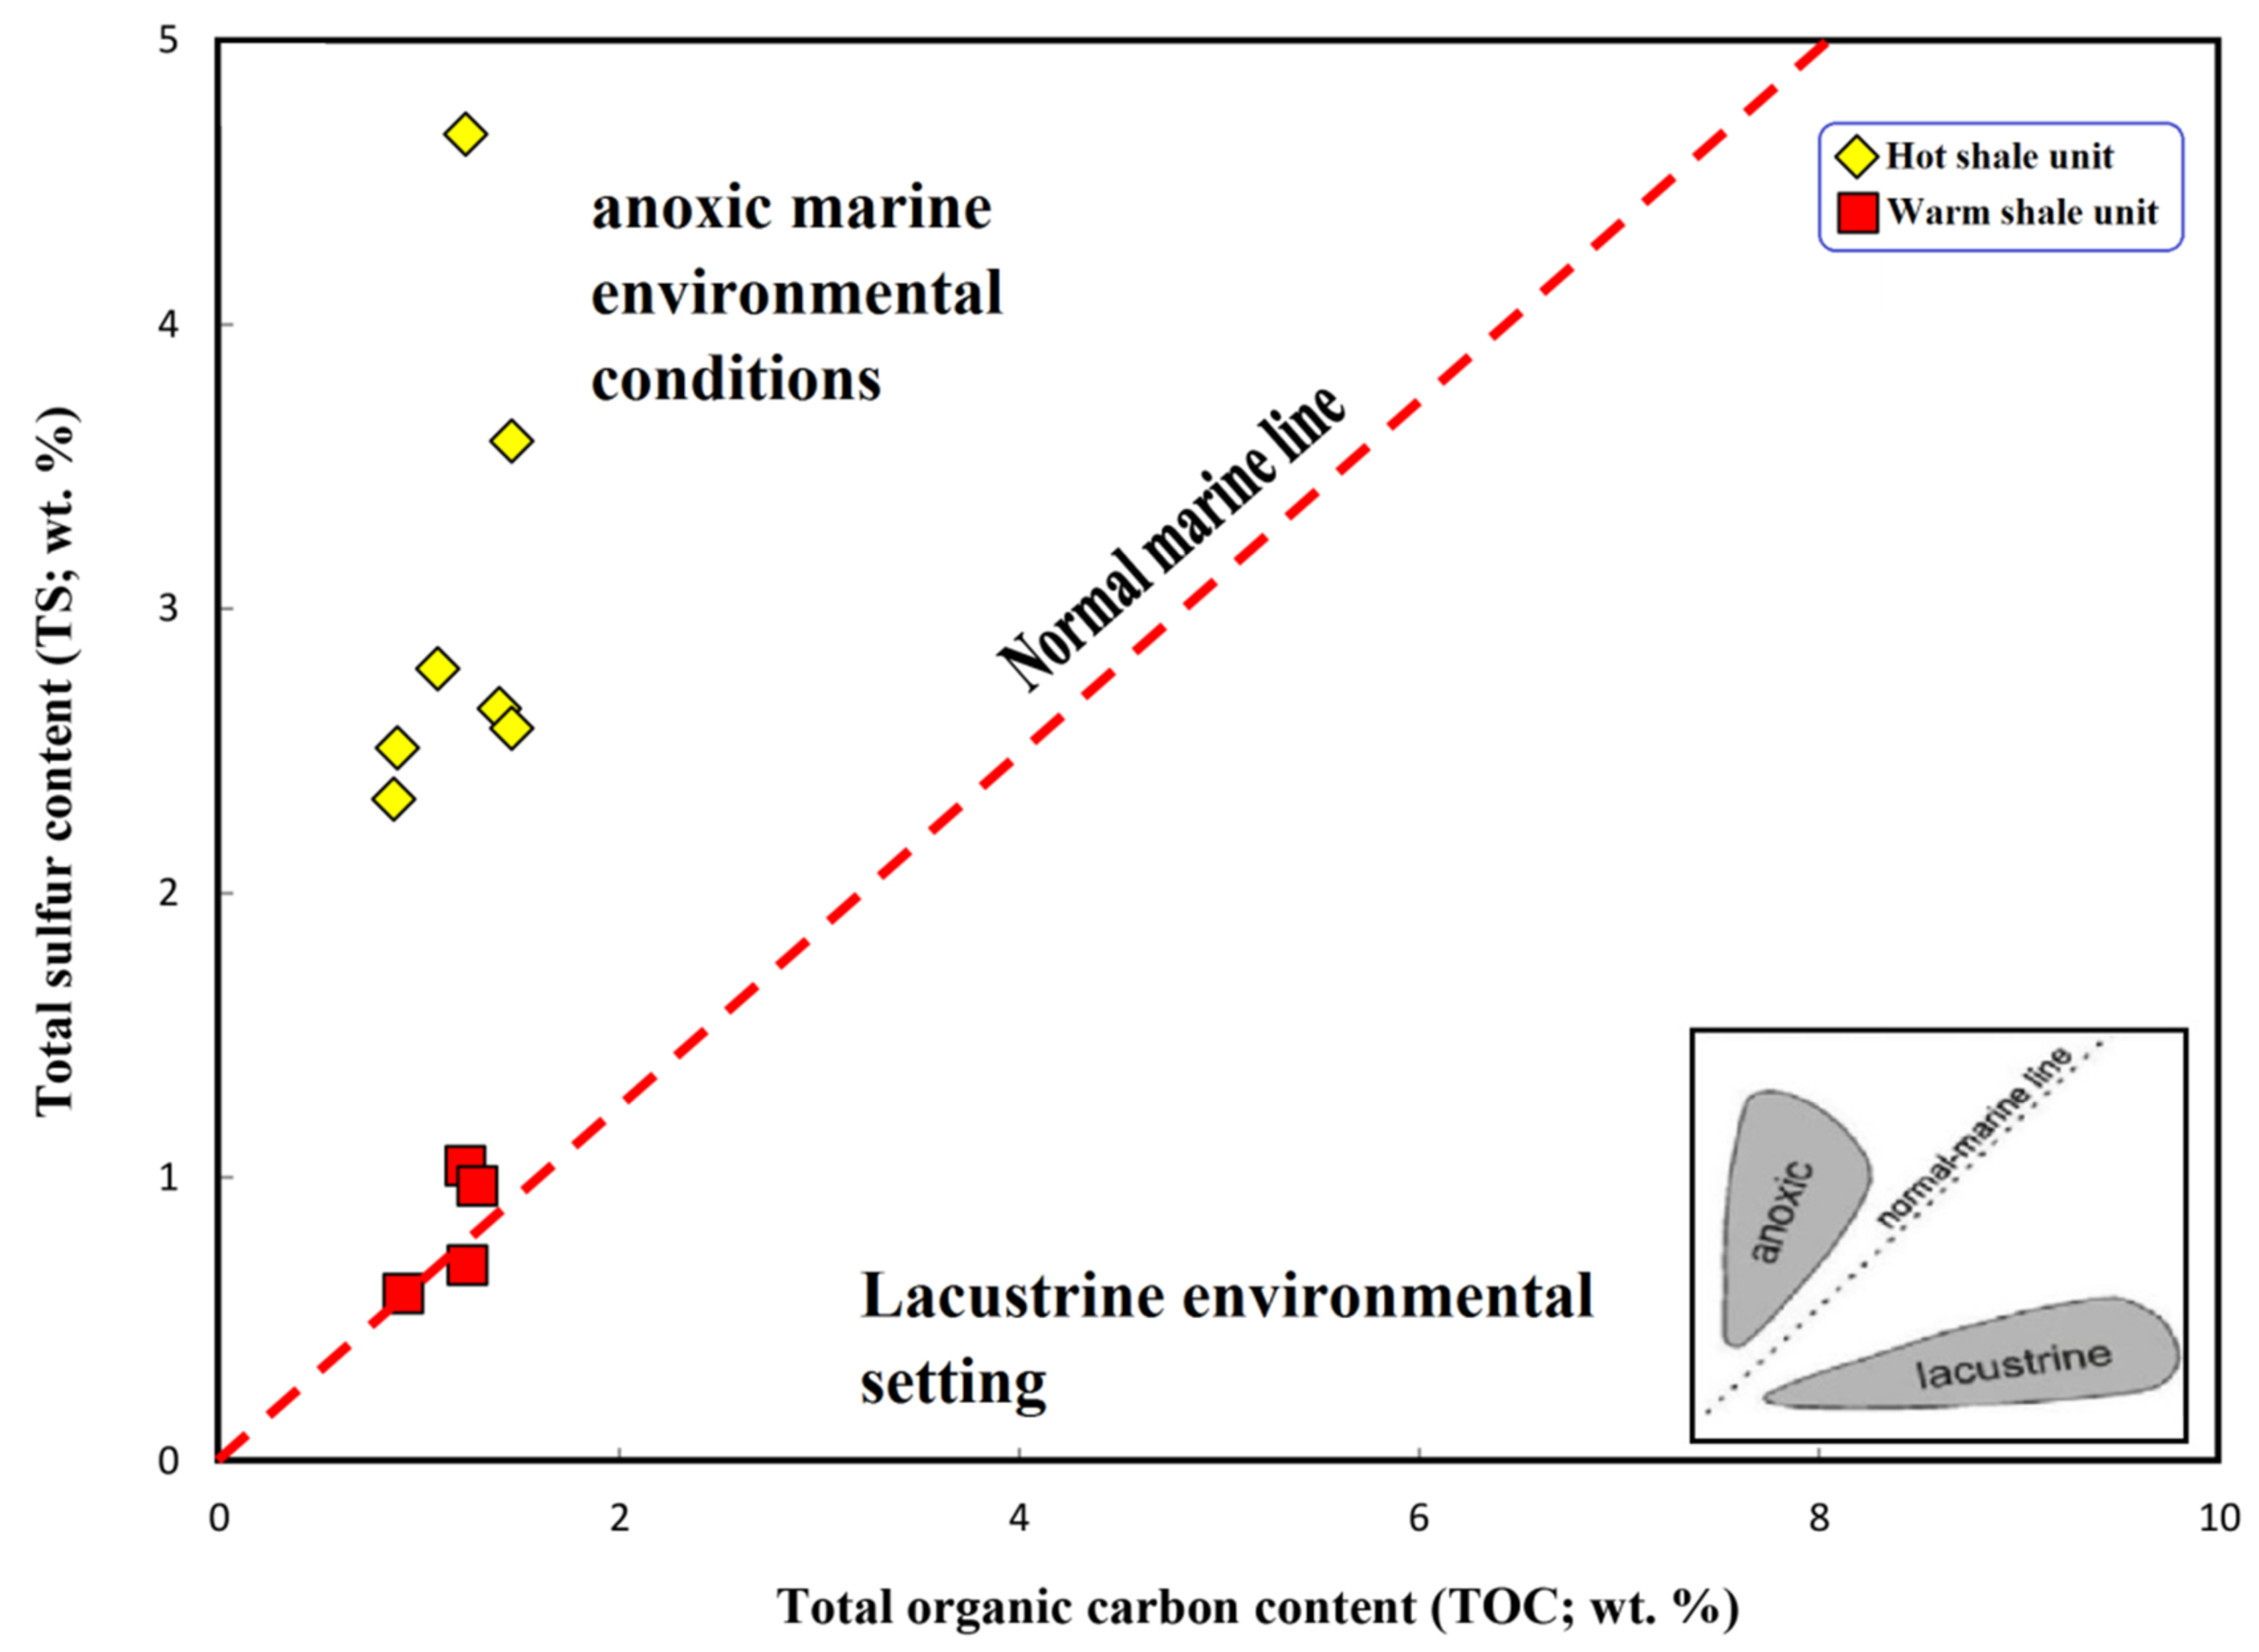
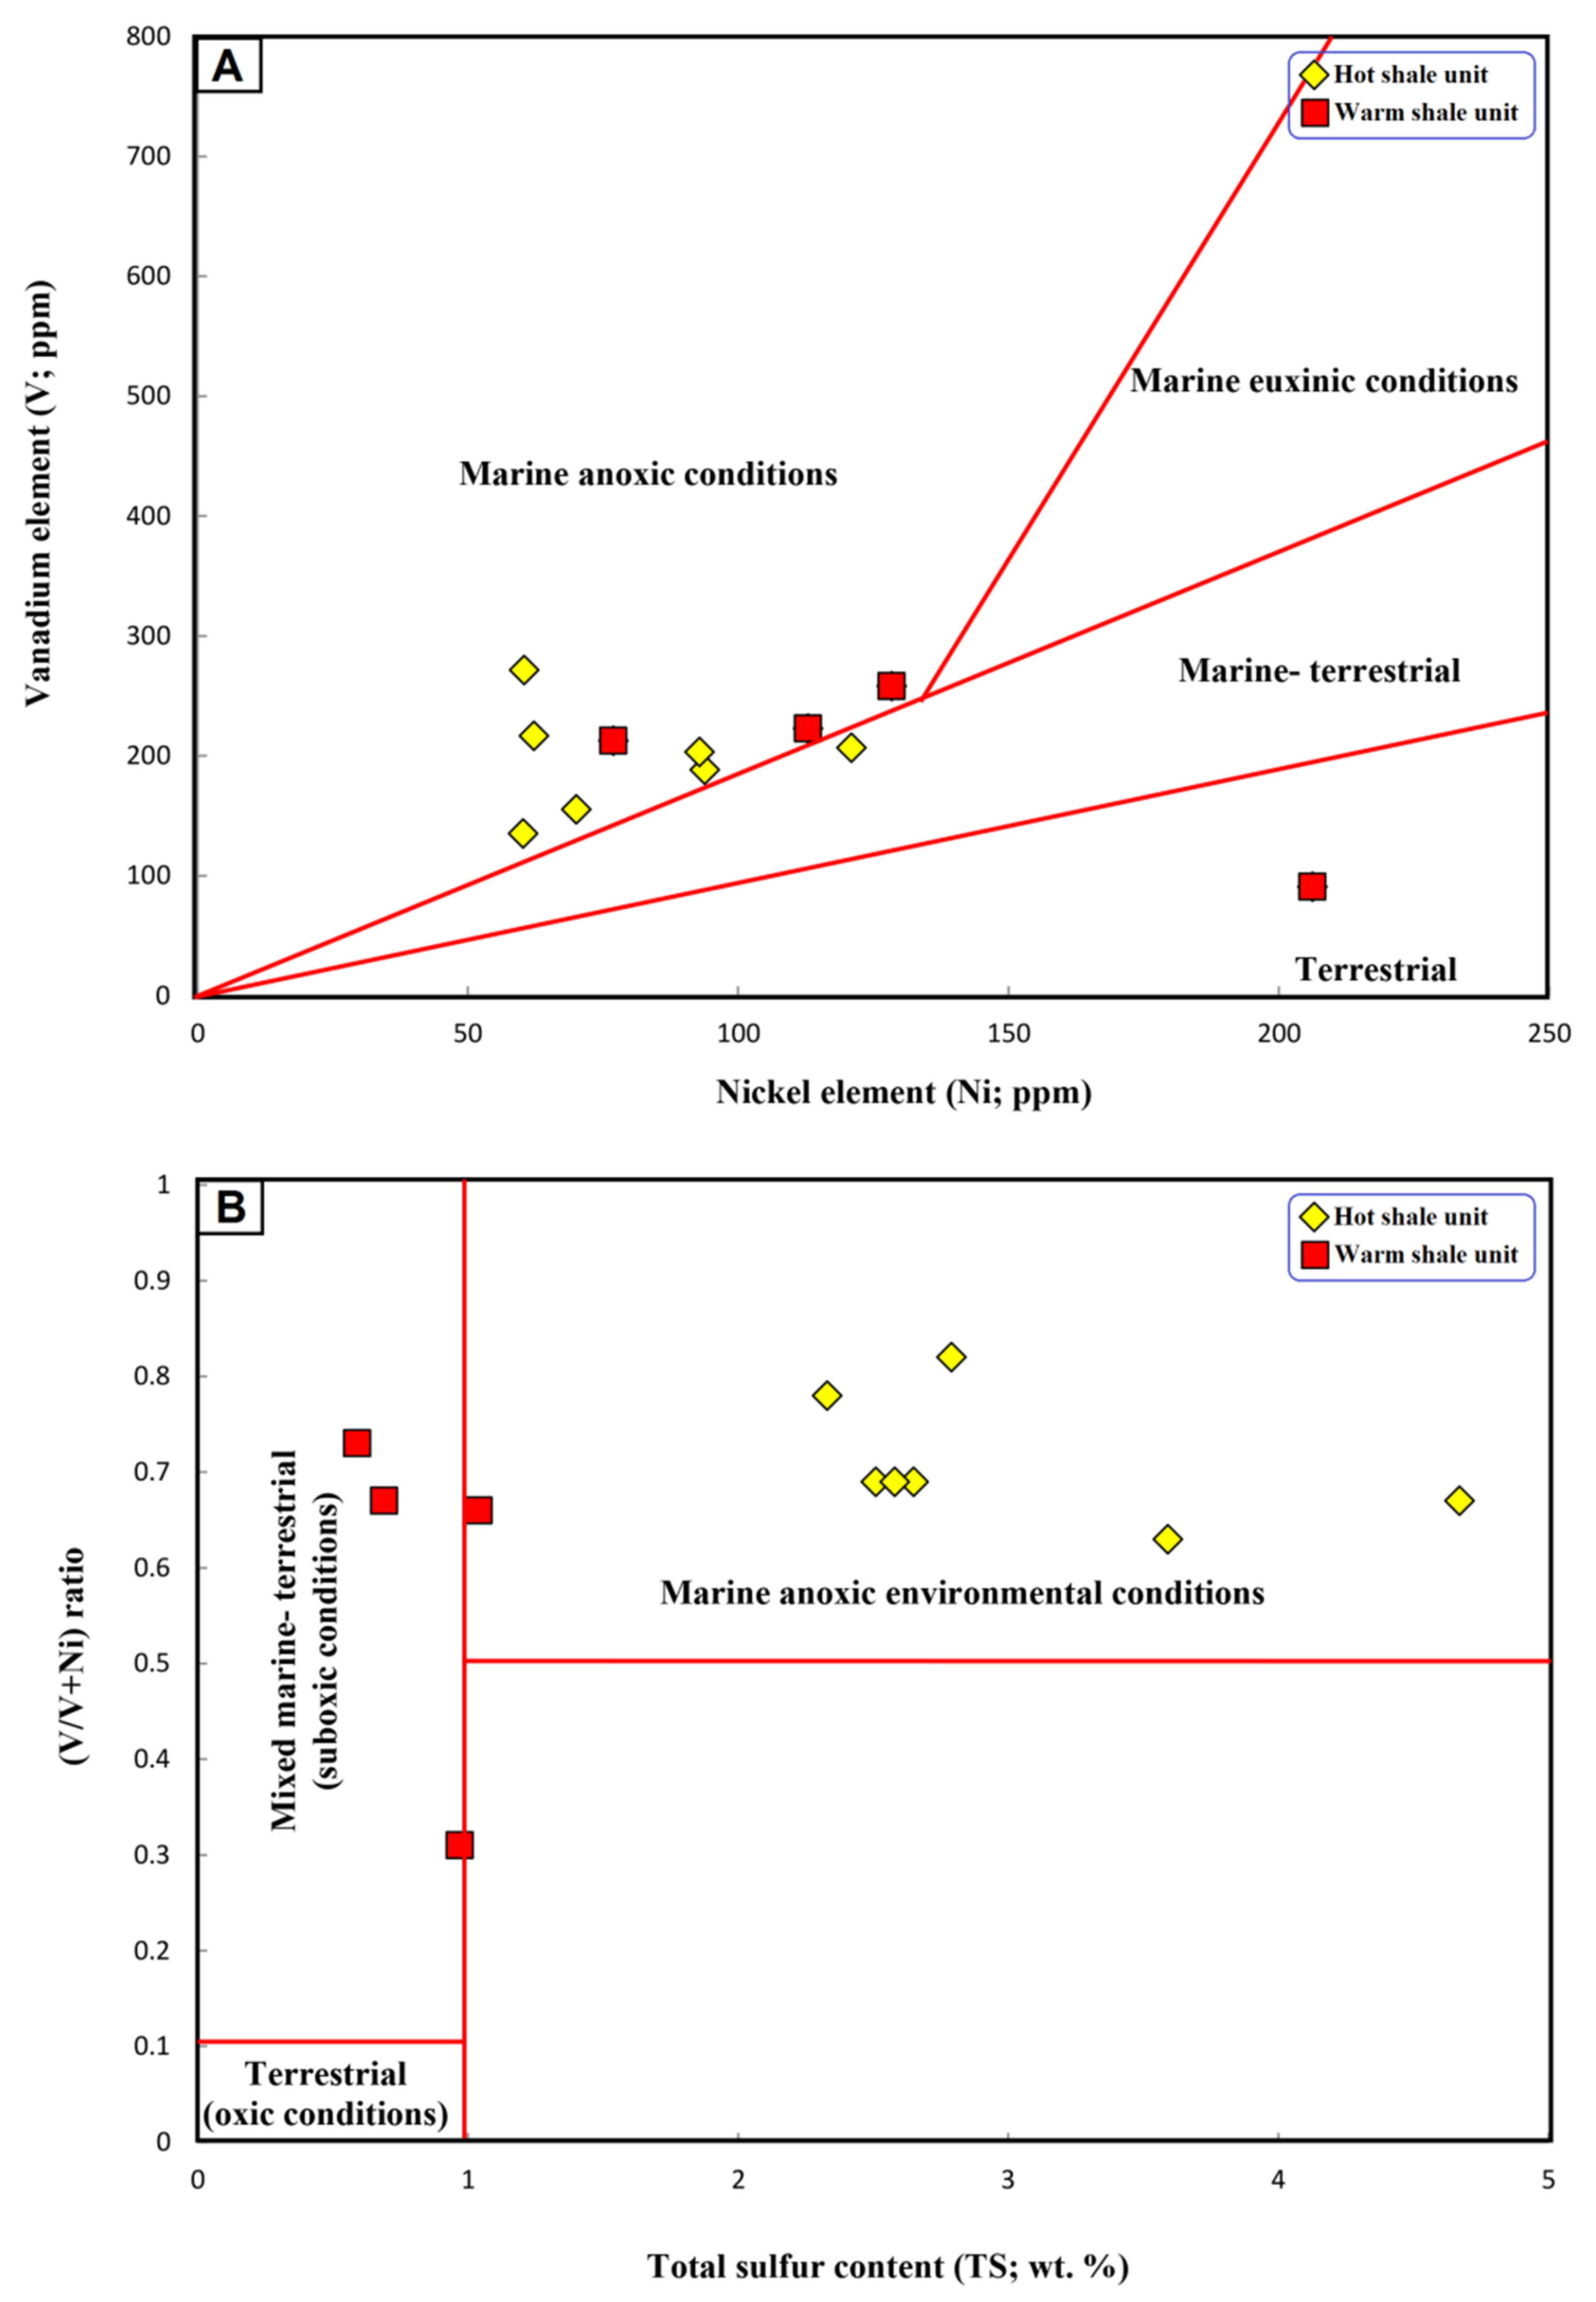
5.2. Paleoenvironmental Setting during Organic Matter (OM) Accumulation

In the current work, the paleoenvironmental setting, including paleoredox, salinity, and climatic conditions during the early Silurian time and their influence on the organic matter accumulation in the Qusaiba shale units are discussed.
The present work reveals that the shale samples of the Qusaiba shale units are characterized by a moderate to high amount of OM, with TOC content between 0.87 and 1.46 wt. %, and this could be attributed to the paleoredox environmental conditions, which commonly control the OM richness and its preservation during deposition [44,45].
The paleoredox conditions during sedimentation of the Qusaiba shale units are demonstrated by the biomarker distributions and further supported by the inorganic element results as presented in the previous subsections.
Acyclic isoprenoids and their Pr/Ph ratio are widely used to deduce the paleoredox conditions during sedimentation and diagenesis [31,33,46]. A Pr/Ph ratio of <1 suggests an anoxic environment associated with a stratified water column; on the other hand, a Pr/Ph of >2 is associated with contributions from terrestrial OM during oxic environmental conditions according to [31,33]. In this case, most of the Qusaiba shales accumulated during low-oxygen conditions as implied by the relatively low Pr/Ph ratio in the range of 0.50 to 1.24 (as shown in Table 3). The samples with a Pr/Ph ratio of more than 1 (1.02–1.24) indicate that these samples were deposited under dysoxic depositional settings, while the narrow Pr/Ph ratios between 0.50 and 0.97 for other samples are indicative of more reducing (anoxic) environmental conditions during deposition. This interpretation of these paleoredox (dysoxic to anoxic) conditions is confirmed by the values of the Ph/n-C18 and Pr/n-C17 ratios of all examined shale samples (Figure 10B).
Palaeo-redox conditions during sedimentation can also be assessed from the inorganic elements (i.e., S, V and Ni) as shown in Table 1 and Table 3. Total sulfur content (TS) associated with OM in sediments is considered more as a measure of the degree of marine environment and reducing conditions than the organic or pyritic sulfur in sediments [47,48]. A high S content of more than 2 wt. % implies high organic sulfur content derived from a source deposited in highly reducing marine conditions [29,47,48]. In this regard, the Qusaiba hot shale samples were deposited under more reducing environmental conditions with TS values of up to 4.67 wt. % (Table 1). This finding is confirmed by the combination between the TOC and total sulfur (S) contents (Figure 14). This relationship of the TOC and total sulfur (S) contents also shows that the Qusaiba warm shales were deposited in a normal marine environment, with relatively low (S) content, while the Qusaiba hot shale sediments were deposited in highly reducing marine environmental conditions (Figure 14). However, the relationship between Fe and TS shows that there is a positive correlation as demonstrated by the high (r = +0.64) as shown in Figure 9B. This finding suggests that the Fe in the analyzed samples is mainly sulfurized and mainly occurs in sulfide (pyrite) at periods of low oxygen concentrations in the pore water.
In addition, the concentrations of Fe and TS together with TOC content were plotted on Fe2O3-TOC-S ternary diagram and show the analyzed shale samples plotted on the zones of anoxic to dysoxic conditions (Figure 15). Most of the Qusaiba warm shale samples are plotted on the dysoxic zone, while the Qusaiba hot shale samples are found in the dysoxic to anoxic zones, indicating that the Qusaiba hot shale samples were deposited in more reducing environmental conditions.
The palaeo-redox (dysoxic–anoxic) conditions during sedimentation further demonstrated from the vanadium (V) and nickel (Ni) trace elements and their V/Ni and V/V+Ni ratios (Table 3). In anoxic marine environments, V is typically enriched in comparison to Ni [38,39,49]. Accordingly, the shales of the Qusaiba Formation were deposited in a marine environmental setting under dysoxic to anoxic conditions, as supported by the relationship between the concentrations of V and Ni (Figure 16A).
The paleoredox conditions during sedimentation were also assessed using V/Ni ratios [39]. V/Ni ratio of <2 indicates an anoxic environmental condition, while V/Ni ratio of >1 indicates deposition under oxic conditions. In this case, the Qusaiba shale sediments were deposited during anoxic to oxic depositional conditions. The anoxic depositional conditions of most of the samples mainly had a high V/Ni ratio of more than 2 (Table 3), while the other three samples were deposited under relatively oxic (dysoxic-oxic) conditions, with the lowest V/Ni ratio between 0.44 and 1.97 (Table 3). This interpretation of the anoxic to oxic depositional conditions is confirmed from the relationship between total sulfur (TS) content and values of the V/V+Ni ratio (Figure 16B).
The paleoclimate conditions during deposition of the shale of the Qusaiba Formation were also reconstructed based on both strontium (Sr) and copper (Cu) trace elements, which are important elemental indicators for paleoclimate conditions [29,35,50,51], and their concentrations were influenced by the water depth [52]. In general, a high Sr/Cu ratio of more than 5.0 is an indicator of a hot arid climate, and a low Sr/Cu ratio of less than 5.0 suggests a warm humid climate [50]. In our case, the Qusaiba shales in both units have lower Sr compared to Cu, with a Sr/Cu ratio in the range 0.44–1.28 (Table 3). This indicates that the Qusaiba shale units were deposited under warm humid climatic conditions during the early Silurian. The warm humid climatic conditions are also consistent with the enriched Al2O3 compared to K2O (Table 3), with a relatively high ratio of Al/K (Table 3). The aluminum (Al2O3) is generally enriched in kaolinite and is known to be associated with a warm humid climate [53,54].
However, the dominant warm humid climatic conditions are accompanied by a proportional decrease in surface water stratification as indicated by the relatively low gammacerane index of less than 0.5 (Table 2). The low gammacerane concentrations with low gammacerane index (Table 2) also provide evidence for low salinity stratification during deposition of the Qusaiba shale sediments as high gammacerane biomarker, and its index values are often associated with high salinity stratification (hypersalinity) conditions of the water columns during deposition [55]. Strontium (Sr) and Barium (Ba) are two elements regarded as empirical indicators of paleo-salinity [36,56,57,58]. A high Sr/Ba ratio reflects high salinity, and a low Sr/Ba ratio indicates low salinity [36]. The Qusaiba shale samples have a low Sr/Ba ratio (avg. 0.66), indicating low saline water during deposition of these sediments. The Sr/Ba ratio versus gammacerane index ratio diagram also reflects low salinity stratification during deposition of the Qusaiba shale sediments (Figure 17).

6. Conclusions

In this study, organic and inorganic geochemical methods were performed on the Silurian Qusaiba shales from the outcrop section in the Tayma area in the northwest of Saudi Arabia and used to determine the source and origin of organic matter and the main sedimentary paleoenvironmental conditions, including redox, salinity and climate conditions during organic matter accumulation. The results may lead to the following essential conclusions:
  • The examined Qusaiba shale samples had TOC and S values in the range of 0.87–1.76 wt. % and 0.59–4.64 wt. %, respectively, indicating dysoxic to anoxic conditions for marine environmental setting.
  • According to the examination of biomarkers in aliphatic HCs, the organic matter in Qusaiba shales is mostly supplied by marine algae and other aquatic organic matter, with some terrigenous land plants, and was deposited under dysoxic to anoxic environmental conditions.
  • Inorganic geochemical major and trace elements further indicate that the Qusaiba shales were deposited in dysoxic to anoxic marine environment and accumulated in warm humid climate and low salinity stratification conditions of the water columns.
  • Low oxygen concentrations in the dysoxic to anoxic environmental conditions contribute to the preservation of organic matter in the Qusaiba shales and result in the accumulation of organic matter during deposition.

Author Contributions

Conceptualization, A.L., M.H.H. and A.M.A.; Methodology, M.H.H., A.L., F.A. and A.M.A.; Software, M.H.H.; Validation, M.H.H. and A.L.; Formal analysis, M.H.H. and A.L.; Investigation, A.L., M.H.H. and F.A.; Resources, F.A., K.A.F., A.A., A.B.L., A.L. and A.M.A.; Data curation, K.A.F., F.A., A.A., A.B.L., A.L., M.H.H. and A.M.A.; Writing—review & editing, M.H.H., A.L. and A.M.A.; Visualization, M.H.H. and A.L.; Supervision, A.L and A.M.A.; Project administration, A.M.A. and A.L.; Funding acquisition, A.M.A. and A.L. All authors have read and agreed to the published version of the manuscript.

Funding

This research was funded by the National Plan for Science, Technology and Innovation (MAARIFAH), King Abdul-Aziz City for Science and Technology, Kingdom of Saudi Arabia, Award Number (15-OIL5420-02).

Data Availability Statement

Not applicable.

Acknowledgments

The authors would like also to thank the journal editor and the anonymous reviewers for their constructive reviews.

Conflicts of Interest

The authors declare that the research was conducted in the absence of any commercial or financial relationships that could be construed as a potential conflict of interest.

Nomenclature

Peak assignments for hydrocarbons in the gas chromatograms of saturated fractions in the m/z 191 (I) and 217 (II) mass fragmentograms (use for reference to explain Figure 10).
(I) Peak No. Compound Abbreviation
Ts18α(H),22,29,30-trisnorneohopaneTs
Tm17α(H),22,29,30-trisnorhopaneTm
2917α,21β(H)-nor-hopaneC29 hop
3017α,21β(H)-hopaneHopane
30M17 β,21α (H)-MoretaneC30Mor
31S17α,21β(H)-homohopane (22S)C31(22S)
31R17α,21β(H)-homohopane (22R)C31(22R)
32S17α,21β(H)-homohopane (22S)C32(22S)
32R17α,21β(H)-homohopane (22R)C32(22R)
33S17α,21β(H)-homohopane (22S)C33(22S)
33R17α,21β(H)-homohopane (22R)C33(22R)
34S17α,21β(H)-homohopane (22S)C34(22S)
34R17α,21β(H)-homohopane (22R)C34(22R)
35S17α,21β(H)-homohopane (22S)C35(22S)
35R17α,21β(H)-homohopane (22R)C35(22R)
(II) Peak No.
a13β,17α(H)-diasteranes 20SDiasteranes
b13β,17α(H)-diasteranes 20RDiasteranes
c13α,17β(H)-diasteranes 20SDiasteranes
d13α,17β(H)-diasteranes 20RDiasteranes
e5α,14α(H), 17α(H)-steranes 20Sααα20S
f5α,14β(H), 17β(H)-steranes 20Rαββ20R
g5α,14β(H), 17β(H)-steranes 20Sαββ20S
h5α,14α(H), 17α(H)-steranes 20Rααα20R

References

  1. Masters, J.A. Deep Basin Gas Trap, Western Canada. AAPG Bull. 1979, 63, 152–181. [Google Scholar]
  2. Meckel, L. Course Notes on Tight Gas Exploration. In Proceedings of the EAGE Second Middle East Tight Gas Reservoirs Workshop, Manama, Bahrain, 12–15 December 2010; pp. 12–15. [Google Scholar]
  3. Mahmoud, M.D.; Vaslet, D.; Al-Husseini, M.I. The Lower Silurian Qalibah Formation of Saudi Arabia—An important hydrocarbon source rock. AAPG Bull. 1992, 76, 1491–1506. [Google Scholar]
  4. Cole, G.A.; Abu-Ali, M.A.; Aoudeh, S.M.; Carrigan, W.J.; Chen, H.H.; Colling, E.L.; Gwathney, W.J.; Al-Hajji, A.A.; Halpern, H.I.; Jones, P.J.; et al. Organic geochemistry of the Paleozoic petroleum system of Saudi Arabia. Energy Fuel 1994, 8, 1425–1442. [Google Scholar] [CrossRef]
  5. Abu-Ali, M.A.; Rudkiewicz, J.L.; McGillivray, J.G.; Behar, F. Paleozoic petroleum system of Central Saudi Arabia. GeoArabia 1999, 4, 321–335. [Google Scholar] [CrossRef]
  6. Al-Laboun, A.A. Tectono-stratigraphy of the exposed Silurian deposits in Arabia. Arab. J. Geosci. 2009, 2, 119–131. [Google Scholar] [CrossRef]
  7. Arouri, R.K.; Van Laer, J.P.; Jenden, J.D.; Carrigan, J.W.; Al-Hajji, A.A. Controls on hydrocarbon properties in Paleozoic petroleum system in Saudi Arabia: Exploration and development implications. AAPG Bull. 2010, 2, 163–188. [Google Scholar] [CrossRef]
  8. Abu-Ali, M.A.; Franz, U.A.; Shen, J.; Monnier, F.; Mahmoud, M.D.; Chambers, T.M. Hydrocarbon generation and migration in the Paleozoic sequence of Saudi Arabia. Soc. Pet. Eng. 1991, 21376, 345–356. [Google Scholar]
  9. Bishop, R.S. The maturation history of the Paleozoic hydrocarbon system of the Arabian platform. In Proceedings of the AAPG Annual Convention & Exhibition, Houston, TX, USA , 5–8 May 1995. [Google Scholar]
  10. Jones, P.J.; Stump, T.E. Depositional and tectonic setting of the Lower Silurian hydrocarbon source rock facies, central Saudi Arabia. Am. Assoc. Pet. Geol. Bull. 1999, 83, 314–332. [Google Scholar]
  11. Sharland, P.R.; Archer, R.; Casey, D.M.; Davies, R.B.; Hall, S.H.; Heward, A.P.; Horbury, A.D.; Simmons, M.D. Arabian Plate Sequence Stratigraphy; Gulf PetroLink: Manama, Bahrain, 2001. [Google Scholar]
  12. Abouelresh, M.; Babalola, L.; Bokhari, A.K.; Boyde, D.; Thomas, K.; Omer, M. Understanding Reservoir Properties of the Organic-Rich Qusaiba Shale, a Potential Shale Gas Reservoir, Northwest Saudi Arabia: An Outcrop Approach. In Proceedings of the AAPG Annual Convention & Exhibition, Houston, TX, USA, 2–5 April 2017. [Google Scholar]
  13. Abouelresh, M.; Babalola, L.; Bokhari, A.; Omer, M.; Koithan, T.; Boyde, D. Sedimentology, geochemistry and reservoir, potential of the organic-rich Qusaiba shale, Tabuk basin, NW Saudi Arabia. Mar. Pet. Geol. 2020, 111, 240–260. [Google Scholar] [CrossRef]
  14. AlQuraishi, A.; AlLaboun, A.; AlGhamdi, F.; AlHussinan, S. Silurian Qusaiba shale: Petrophysical, mineralogical and geochemical analysis. J. Pet. Sci. Eng. 2020, 192, 107209. [Google Scholar] [CrossRef]
  15. AlGhamdi, F.; AlQuraishi, A.; Abiodun Amao, A.; Laboun, A.B.; Fattah, K.A.; Kahal, A.; Lashin, A. Depositional setting, mineralogical and diagenetic implication on petrophysical properties of unconventional gas reservoir of the Silurian Qusaiba Formation, northwestern Arabian Peninsula. Geoenergy Sci. Eng. 2023, 223, 211563. [Google Scholar] [CrossRef]
  16. Hayton, S.; Rees, A.J.; Vecoli, M. A punctuated late Ordovician and early Silurian deglaciation and transgression: Evidence from the subsurface of northern Saudi Arabia. AAPG Bull. 2016, 101, 863–886. [Google Scholar] [CrossRef]
  17. Wender, L.E.; Bryant, J.W.; Dickens, M.F.; Neville, A.S.; Al-Moqbel, A.M. Paleozoic (Pre-Khuff) hydrocarbon geology of the Ghawar area, eastern Saudi Arabia. GeoArabia 1998, 3, 273–302. [Google Scholar] [CrossRef]
  18. Inan, S.; Goodarzi, F.; Schmidt Mumm, A.; Arouri, K.; Qathami, S.; Ardakani, O.H.; Inan, T.; Tuwailib, A.A. The Silurian Qusaiba hot shales of Saudi Arabia: An integrated assessment of thermal maturity. Int. J. Coal Geol. 2016, 159, 107–119. [Google Scholar] [CrossRef]
  19. Vaslet, D.; Janjou, D.; Robelin, C.; Al-Muallem, M.S.; Halawani, M.A.; Brosse, J.M.; Brecton, J.P.; Courbouleix, S.; Roobol, M.J.; Dagain, J. Explanatory Notes of the Geologic Map of the Tayma Quadrangle, Sheet 27C, International Index NG-37-2; Saudi Geological Survey: Jeddah, Saudi Arabia, 1994.
  20. Luning, S.; Shahin, Y.M.; Loydell, D.; Al-Rabi, H.T.; Masri, A.; Tarawneh, B.; Kolonic, S. Anatomy of a world-class source rock: Distribution and depositional model of Silurian organic-rich shales in Jordan and implications for hydrocarbon potential. AAPG Bull. 2005, 89, 1397–1427. [Google Scholar] [CrossRef]
  21. Konert, G.; Afifi, A.M.; Al-Hajri, S.A.; Droste, H.J. Paleozoic stratigraphy and hydrocarbon habitat of the Arabian Plate. GeoArabia. 2001, 6, 407–442. [Google Scholar]
  22. Faqira, M.; Bhullar, A.; Ahmed, A. Silurian Qusaiba Shale Play: Distribution and Characteristics. In Proceedings of the AAPG Hedberg Conference, Austin, TX, USA, 5–10 December 2010. [Google Scholar]
  23. Stump, T.E.; Van Der Eem, J.G. The stratigraphy, depositional environments and periods of deformation of the Wajid outcrop belt, southwestern Saudi Arabia. J. Afr. Earth Sci. 1995, 21, 421–441. [Google Scholar] [CrossRef]
  24. Janjou, D.; Halawani, M.A.; Al-Muallem, M.S.; Robelin, C.; Brosse, J.-M.; Courbouleix, S.; Dagain, J.; Genna, A.; Razin, P.; Roobol, J.M.; et al. Explanatory Notes to the Geologic Map of the Al Qalibah Quadrangle, Kingdom of Saudi Arabia. Geoscience Map GM-135, Scale 1:250,000, Sheet 28C; Deputy Ministry for Mineral Resources, Ministry of Petroleum and Mineral Resources: Riyadh, Saudi Arabia, 1997; 44p.
  25. Jarvie, D.M. Total organic carbon (TOC) analysis. In Treatise of Petroleum Geology: Handbook of Petroleum Geology, Source and Migration Processes and Evaluation Techniques; Merrill, R.K., Ed.; American Association of Petroleum Geologists: Tulsa, OK, USA, 1991; pp. 113–118. [Google Scholar]
  26. Peters, K.E. Guidelines for evaluating petroleum source rock using programmed pyrolysis. AAPG Bull. 1986, 70, 318–329. [Google Scholar]
  27. Peters, K.; Cassa, M. Applied Source Rock Geochemistry. In The Petroleum System from Source to Trap; Magoon, L.B., Dow, W.G., Eds.; American Association of Petroleum Geologists: Tulsa, OK, USA, 1994; pp. 93–120. [Google Scholar]
  28. Makeen, Y.M.; Abdullah, W.H.; Hakimi, M.H.; Mustapha, K.A. Source rock characteristics of the lower cretaceous Abu Gabra formation in the Muglad Basin, Sudan, and its relevance to oil generation studies. Mar. Pet. Geol. 2015, 59, 505–516. [Google Scholar] [CrossRef]
  29. Hakimi, M.H.; Abdullah, W.H.; Alqudah, M.; Makeen, Y.M.; Mustapha, K.A. Organic geochemical and petrographic characteristics of the oil shales in the Lajjun area, Central Jordan: Origin of organic matter input and preservation conditions. Fuel 2016, 181, 34–45. [Google Scholar] [CrossRef]
  30. Sarki Yandoka, B.M.; Abdullah, W.H.; Abubakar, M.B.; Hakimi, M.H.; Mustapha, K.A.; Adegoke, A.K. Organic geochemical characteristics of Cretaceous Lamja Formation from Yola Sub-basin, Northern Benue Trough, NE Nigeria: Implication for hydrocarbon-generating potential and paleodepositional setting. Arab. J. Geosci. 2015, 8, 7371–7386. [Google Scholar] [CrossRef]
  31. Didyk, B.M.; Simoneit, B.R.T.; Brassell, S.C.; Eglinton, G. Organic geochemical indicators of paleoenvironmental conditions of sedimentation. Nature 1978, 272, 216–222. [Google Scholar] [CrossRef]
  32. Ten Haven, H.L.; De Leeuw, J.W.; Rullkötter, J.; Damsté, J.S. Restricted utility of the pristane/phytane ratio as a palaeoenvironmental indicator. Nature 1987, 330, 641–643. [Google Scholar] [CrossRef] [Green Version]
  33. Chandra, K.; Mishra, C.S.; Samanta, U.; Gupta, A.; Mehrotra, K.L. Correlation of different maturity parameters in the Ahmedabad-Mehsana block of the Cambay basin. Org. Geochem. 1994, 21, 313–321. [Google Scholar] [CrossRef]
  34. Gürgey, K. Geochemical characteristics and thermal maturity of oils from the Thrace Basin (western Turkey) and western Turkmenistan. J. Pet. Geol. 1999, 22, 167–189. [Google Scholar] [CrossRef]
  35. Wang, J.S.; Huang, X.Z.; Sui, J.C.; Shao, H.S.; Yan, C.F.; Wang, S.Q.; He, Z.R. Evolutional characteristics and their paleoclimate significance of trace elements in the Hetaoyuan Formation, Biyang depression. Acta Sedimentol. Sin. 1997, 15, 65–70, (In Chinese with English abstract). [Google Scholar]
  36. Deng, H.W.; Qian, K. Analysis on Sedimentary Geochemistry and Environment; Gansu China Science Technology Press: Lanzhou, China, 1993; pp. 15–85. (In Chinese) [Google Scholar]
  37. Wang, J.; Yamada, O.; Nakazato, T.; Zhang, Z.G.; Suzuki, Y.; Sakanishi, K. Statistical analysis of the concentrations of trace elements in a wide diversity of coals and its implications for understanding elemental modes of occurrence. Fuel 2008, 87, 2211–2222. [Google Scholar] [CrossRef]
  38. Barwise, A.J.G. Role of nickel and vanadium in petroleum classification. Energy Fuels 1990, 4, 647–652. [Google Scholar] [CrossRef]
  39. Galarraga, F.; Reategui, K.; Martïnez, A.; Martínez, M.; Llamas, J.F.; Márquez, G. V/Ni ratio as a parameter in paleoenvironmental characterisation of nonmature medium-crude oils from several Latin American basins. J. Pet. Sci. Eng. 2008, 61, 9–14. [Google Scholar] [CrossRef]
  40. Waples, D.W.; Machihara, T. Biomarkers for Geologists: A Practical Guide to the Application of Steranes and Triterpanes in Petroleum Geology; American Association of Petroleum Geologists Methods in Exploration: Tulsa, OK, USA, 1991. [Google Scholar]
  41. Murray, A.P.; Boreham, C.J. Organic Geochemistry in Petroleum Exploration; Australian Geological Survey Organisations: Canberra, Australia, 1992.
  42. Hadad, Y.T.; Hakimi, M.H.; Abdullah, W.H.; Kinawy, M.; El Mahdy, O.; Lashin, A. Organic geochemical characteristics of Zeit source rock from Red Sea Basin and their contribution to organic matter enrichment and hydrocarbon generation potential. J. Afr. Earth Sci. 2021, 177, 104151. [Google Scholar] [CrossRef]
  43. Huang, W.Y.; Meinschein, W.G. Sterols as ecological indicators. Geochim. Cosmochim. Acta 1979, 43, 739–745. [Google Scholar] [CrossRef]
  44. Tyson, R.V. The “productivity versus preservation” controversy: Cause, flaws, and resolution. Spec. Publ. 2005, 82, 17. [Google Scholar]
  45. Katz, B.J. Controlling Factors on Source Rock Development—A review of Productivity, Preservation, and Sedimentation rate. In The Depositional of Organic-Carbon-Rich Rocks: Models, Mechanisms and Consequences; Harris, N.N., Ed.; SEPM Special Publication: Tulsa, OK, USA, 2005; Volume 82, pp. 7–16. [Google Scholar] [CrossRef]
  46. Escobar, M.; Márquez, G.; Inciarte, S.; Rojas, J.; Esteves, I.; Malandrino, G. The organic geochemistry of oil seeps from the Sierra de Perijá eastern foothills, Lake Maracaibo Basin, Venezuela. Org. Geochem. 2011, 42, 727–738. [Google Scholar] [CrossRef]
  47. Huang, H.; Pearson, M.J. Source rock palaeoenvironments and controls on the distribution of dibenzothiophenes in lacustrine crude oils, Bohai Bay Basin, eastern China. Org. Geochem. 1999, 30, 1455–1470. [Google Scholar] [CrossRef]
  48. Berner, R.A.; Raiswell, R. Burial of organic carbon and pyrite sulfur in sediments over Phanerozoic time: A new theory. Geochim. Cosmochim. Acta 1983, 47, 855–862. [Google Scholar] [CrossRef]
  49. Bechtel, A.; Gratzer, R.; Sachsenhofer, R.F. Chemical characteristics of Upper Cretaceous (Turonian) jet of the gosau group of gams/hieflau (styria, Austria). Int. J. Coal Geol. 2001, 46, 27–49. [Google Scholar] [CrossRef]
  50. Lerman, A. Lakes: Chemistry, Geology, Physics; Geological Publishing House: Beijing, China, 1989; pp. 184–187. [Google Scholar]
  51. Adegoke, A.K.; Abdullah, W.H.; Hakimi, M.H.; Yandoka, B.M.S. Geochemical characterisation and organic matter enrichment of Upper Cretaceous Gongila shales from Chad (Bornu) Basin, northeastern Nigeria: Bioproductivity versus anoxia conditions. J. Pet. Sci. Eng. 2015, 135, 73–87. [Google Scholar] [CrossRef]
  52. Jia, J.; Liu, Z.; Bechtel, A.; Strobl, S.A.I.; Sun, P. Tectonic and climate control of oil shale deposition in the Upper Cretaceous Qingshankou Formation (Songliao Basin, NE China). Int. J. Earth Sci. 2013, 102, 1717–1734. [Google Scholar] [CrossRef]
  53. Hieronymus, B.; Kotschoubey, B.; Boulegue, J. Gallium behavior in some contrasting lateritic profiles from Cameroon and Brazil. J. Geochem. Explor. 2001, 72, 147–163. [Google Scholar] [CrossRef]
  54. Beckmann, B.; Flogel, S.; Hofmann, P.; Schulz, M.; Wagner, T. Orbital forcing of Cretaceous river discharge in tropical Africa and ocean response. Nature 2005, 437, 241–244. [Google Scholar] [CrossRef]
  55. Sinninghe Damste, J.S.; Kenig, F.; Koopmans, M.P.; Koster, J.; Schouten, S.; Hayes, J.M.; de Leeuw, J.W. Evidence for gammacerane as an indicator of water column stratification. Geochim. Cosmochim. Acta 1995, 59, 1895–1900. [Google Scholar] [CrossRef] [PubMed] [Green Version]
  56. Liu, Y.J.; Cao, L.M.; Li, Z.L.; Wang, H.N.; Chu, T.Q.; Zhang, J.R. Element Geochemistry; Science Press: Beijing, China, 1984; pp. 283–372. (In Chinese) [Google Scholar]
  57. Wang, A.H. Discriminant dffect of sedimentary environment by the Sr/Ba ratio of different existing forms. Acta Sedimentol. Sin. 1996, 14, 168–173. [Google Scholar]
  58. Liu, B.J. Sedimentary Petrology; Geological Press: Beijing, China, 1980; pp. 13–89. (In Chinese) [Google Scholar]
Figure 2. The stratigraphic column of the Paleozoic rocks at Tabuk and Widyan basins, northwestern Saudi Arabia (modified after [6]).
Minerals 13 00468 g002
Figure 3. The lithostratigraphic classification of the Qusaiba Formation at Tayma area.
Minerals 13 00468 g003
Figure 4. Examples of (A) outcrop sample and (B) core sample for the Qusaiba dark shale obtained from Tayma area.
Minerals 13 00468 g004
Figure 5. Relationship between TOC content and soluble bitumen extraction of the analyzed shales of the Qusaiba units, suggesting a fair to good organic matter accumulation.
Minerals 13 00468 g005
Figure 6. GC chromatography shows n-alkane and acyclic isoprenoid (e.g., pristane and phytane) distributions of the aliphatic hydrocarbon fraction in the analyzed shales of the Qusaiba units.
Minerals 13 00468 g006
Figure 7. m/z 191 mass fragmentograms of the aliphatic hydrocarbon fraction in the analyzed shales of the Qusaiba units.
Minerals 13 00468 g007
Figure 8. m/z 217 mass fragmentograms of the aliphatic hydrocarbon fraction in the analyzed shales of the Qusaiba units.
Minerals 13 00468 g008
Figure 9. Geochemical correlations of inorganic geochemical elements the analyzed shales of the Qusaiba units, showing (A) Al versus Si and (B) Fe versus TS.
Minerals 13 00468 g009
Figure 10. Geochemical biomarker results of the analyzed shales of the Qusaiba units showing (A) CPI versus waxiness degree and (B) pristane/n-C17 versus phytane/n-C18 (from Shanmugam, 1985), indicating that these sediments contain mixed organic matter and were deposited under suboxic to anoxic environmental conditions.
Minerals 13 00468 g010
Figure 11. Geochemical biomarker results of the analyzed shales of the Qusaiba units showing (A) C23 tricyclic/C24 tricyclic (C23T/24T) versus C24 tetracyclic/C26 tricyclic (C24Te/C26Ti) and (B) C26 tricyclic/C25 tricyclic (C26T/C25T) versus C31 regular homohopane/C30hopane (HCR31/HC30), further indicating that these sediments contain mainly marine organic matter and were deposited under suboxic to anoxic environmental conditions.
Minerals 13 00468 g011
Figure 12. Ternary diagram of regular steranes (C27-C29) in the aliphatic hydrocarbon fraction in the analyzed shale samples, indicating the relationship between sterane compositions, concerning organic matter input (modified after [43]).
Minerals 13 00468 g012
Figure 13. Geochemical biomarker result of the analyzed shales of the Qusaiba units shows pristane/phytane/n-C18 versus C27/C29 regular sterane ratio, further indicating that these sediments contain a mixture of organic matter and were deposited under suboxic to anoxic environmental conditions.
Minerals 13 00468 g013
Figure 14. Relationship between TOC and TS content for the analyzed shales of the Qusaiba units, showing normal to anoxic marine environmental conditions.
Minerals 13 00468 g014
Figure 15. Ternary Fe2O3-TOC-S diagram of the analyzed shales of the Qusaiba units, showing dysoxic to anoxic environmental conditions during deposition of the Qusaiba shale units.
Minerals 13 00468 g015
Figure 16. Geochemical correlations of the analyzed organic-rich shale samples of the Qusaiba units, showing (A) V and Ni trace elements and (B) total sulfur (TS) and V/(V+Ni) ratio.
Minerals 13 00468 g016
Figure 17. Geochemical correlation between gammacerane/C30 hopane (G/HC30) biomarker and Sr/Ba ratios result of the analyzed shales of the Qusaiba units shows low salinity during deposition of the Qusaiba shale units.
Minerals 13 00468 g017
Table 1. Geochemical results of the analyzed dark shales from the Silurian Qusaiba Formation in the Tayma area, Northwestern Saudi Arabia, including TOC and TS contents, soluble bitumen and its bulk compositions as well as distributions of normal alkane and isoprenoid.
UnitsSamples IDTOC Wt.%TS Wt.%Soluble Bitumen Extraction DataNormal Alkanes and Isoprenoids
Solid
Bitumen
(ppm)
Bulk CompositionsPr/PhPr/C17Ph/C18WICPI
Stature
(%)
Aromatic
(%)
NSO
(%)
Hot shale unit10.892.5150010.0010.0080.001.070.660.470.950.95
40.872.3315502.272.2795.461.240.680.690.791.14
51.402.6511704.352.1793.481.090.370.381.091.15
61.463.5951611.763.6884.560.630.400.510.920.97
71.234.67129012.1218.1869.700.970.440.421.051.08
81.462.5810801.270.6498.090.910.580.320.580.89
91.092.795603.333.3393.341.020.400.390.871.13
Warm shale unit261.240.6912035.201.7393.071.190.680.300.630.99
271.231.0416701.705.0893.220.500.290.690.781.49
281.290.9710642.371.5796.061.120.500.210.490.94
290.920.59
TOC—total organic carbon, TS—total sulfur content, CPI—Carbon preference index = {2(C23 + C25 + C27 + C29)/(C22 + 2[C24 + C26 + C28] + C30)}, Waxiness degree (WI) = Σ (n-C21–n-C31)/Σ (n-C15–n-C20).
Table 2. Lipid biomarker ratios of the saturated HC fraction in the analyzed dark shales from the Silurian Qusaiba Formation in the Tayma Basin, Northwestern Saudi Arabia, illustrating source organic matter and depositional environment conditions.
UnitsSamples IDLipid Biomarker Measurements
Terpanes (m/z 191 Ion)Steranes (m/z 217 Ion)Steranes/Hopanes
Hopanes Tricyclic TerpanesRegular Steranes
C29/C30G/C30HCR31/HC30Ts/TmH35/H34C24Tet/C26TitC23Tit/C24 TitC26Tit/C25TitC27/C29
Regular steranes
C27
(%)
C28
(%)
C29
(%)
Hot shale unit10.460.480.330.262.010.382.320.621.5045.823.730.51.26
40.570.160.300.390.770.813.610.990.9742.613.643.81.10
50.570.240.320.421.270.703.551.000.9441.714.144.20.98
60.740.200.300.390.850.943.101.050.9242.511.146.40.66
70.590.180.280.390.740.623.421.070.9240.515.643.90.99
80.660.230.280.410.820.993.560.970.8741.311.047.70.93
90.610.250.300.441.300.733.250.961.0042.614.742.70.92
Warm shale unit260.590.140.250.390.661.304.011.110.9443.610.046.41.19
270.580.130.270.410.730.853.821.010.8641.47.148.31.22
280.660.150.280.390.711.213.641.000.8942.49.947.70.98
Ts—(C27 18α (H)-22, 29, 30-trisnorneohopane), C29/C30: C29 norhopane/C30 hopane, Tm—(C27 17α (H)-22, 29, 30-trisnorhopane), HC35/HC34: C35 homohopane/C34 homohopane, HCR31/HC30: C31 regular homohopane/C30 hopane, G/HC30 = Gammacerane/C30 hopane.
Table 3. Major and trace elements (X-ray fluorescence analysis) of the analyzed dark shales from the Silurian Qusaiba Formation in the Tayma Basin, Northwestern Saudi Arabia.
UnitsSample IDMajor Elements (%)Trace Elements (ppm)
SiAlCaFeKMgTiAl/SiAl/KTi/AlVNiCuZnSrBaV/NiV/V+NiSr/BaSr/Cu
Hot shale unit117.6110.333.1110.473.100.230.750.593.340.07135.2760.20194.64175.67233.63381.972.250.690.611.20
415.088.950.4612.703.140.670.700.592.850.08216.6262.20224.69417.63202.04345.793.480.780.580.90
518.4010.440.506.783.740.100.720.572.790.07155.4170.07202.46187.29260.06347.002.220.690.751.28
616.919.640.1911.543.080.290.780.573.130.08206.86120.97255.40349.62180.01349.301.710.630.520.70
716.229.410.1114.482.560.110.790.583.680.08188.4793.84408.30169.25180.01301.072.010.670.600.44
817.4410.180.512.683.050.110.940.583.340.09203.0992.83221.71191.26191.85323.002.190.690.590.87
918.919.030.196.392.580.130.790.483.500.09271.5760.42301.14143.43178.76272.294.490.820.660.59
Warm shale unit2618.478.710.112.372.840.331.110.473.070.13258.09128.41300.62208.79171.98310.432.010.670.550.57
2720.679.570.122.743.610.521.090.462.650.11222.79112.89290.76196.82174.13251.921.970.660.690.60
2818.819.320.232.893.130.760.940.502.980.1090.74206.25188.55463.24162.30146.850.440.311.110.86
2922.5710.480.033.573.590.650.990.462.920.10212.6276.93273.82171.82148.73247.892.760.730.600.54
Disclaimer/Publisher’s Note: The statements, opinions and data contained in all publications are solely those of the individual author(s) and contributor(s) and not of MDPI and/or the editor(s). MDPI and/or the editor(s) disclaim responsibility for any injury to people or property resulting from any ideas, methods, instructions or products referred to in the content.

