Article

Stabilization of Aeolian Sand for Pavement Subbase Applications Using Alkali-Activated Fly Ash and Slag

1
School of Civil and Transportation Engineering, Hebei University of Technology, Tianjin 300130, China
2
Sinohydro Foundayion Engineering Co., Ltd., Tianjin 301700, China
3
Tianjin Key Laboratory of Ground and Foundation Engineering, Tianjin 301700, China
4
School of Civil Engineering, Iran University of Science and Technology, Tehran 16844, Iran
*
Author to whom correspondence should be addressed.
Minerals 2023, 13(3), 453; https://doi.org/10.3390/min13030453
Submission received: 3 January 2023 / Revised: 20 March 2023 / Accepted: 20 March 2023 / Published: 22 March 2023
(This article belongs to the Special Issue Alkali-Activated Binders)

Abstract

:
Using local materials to construct building elements as well as transport road facilities, including highways, intercity roads, and roads, in remote areas is a top topic of scholarly research all over the world. The main reason for that is the fact that these kinds of materials not only ease the intensity of material transportation but are also cost-efficient. In desert areas, aeolian sand is a commonly used local material and it has been investigated in unbound and cement-stabilized pavement base/subbase applications. However, the production of cement is associated with a high carbon footprint, leading this research to seek alternative low-carbon binders. This research investigated the strength properties and the carbon footprint of fly ash (FA) and a ground-granulated blast-furnace slag (S)-based geopolymer-stabilized aeolian sand. Setting time, compressive strength, California bearing ratio (CBR), and temperature shrinkage measurements of the stabilized aeolian sand were carried out in this research. The maximum strength of the stabilized aeolian sand was found at the optimal ratio of Si/Al ratio of 2.5 and Na/Al ratio of 1.0. The compressive strength increased as the geopolymer stabilizer content increased. A stabilizer content ranging between 8% and 20% is recommended in practice. The carbon footprint of the geopolymer-stabilized aeolian sand was lower than that of cement-stabilized aeolian sand. This tendency became more evident in the samples with higher strength, indicating the effectiveness of geopolymer as an alternative green soil stabilizer to traditional Portland cement.

1. Introduction

The particular geographical position of a desert area determines the dominant role of highway transportation in its comprehensive transportation system [1,2]. The unsuitable (dire) road construction conditions in deserts are why road construction in these areas is so rare. In deserts, the local materials are mainly aeolian sand, which has poor geotechnical properties compared to natural sand. Suppose the materials are transported from other regions. In that case, the distance could be from at least dozens to hundreds of kilometers, and, as we know, the longer the distance, the higher the transportation costs will be. These reasons combined with the local characteristics of low-grade roads, makes up for local materials used in desert areas. Aeolian sand is the primary material used in road construction. Due to the tremendous growth of many transportation infrastructures under development in arid regions around the world, it is necessary to consider the utilization of aeolian sand for construction purposes [3].
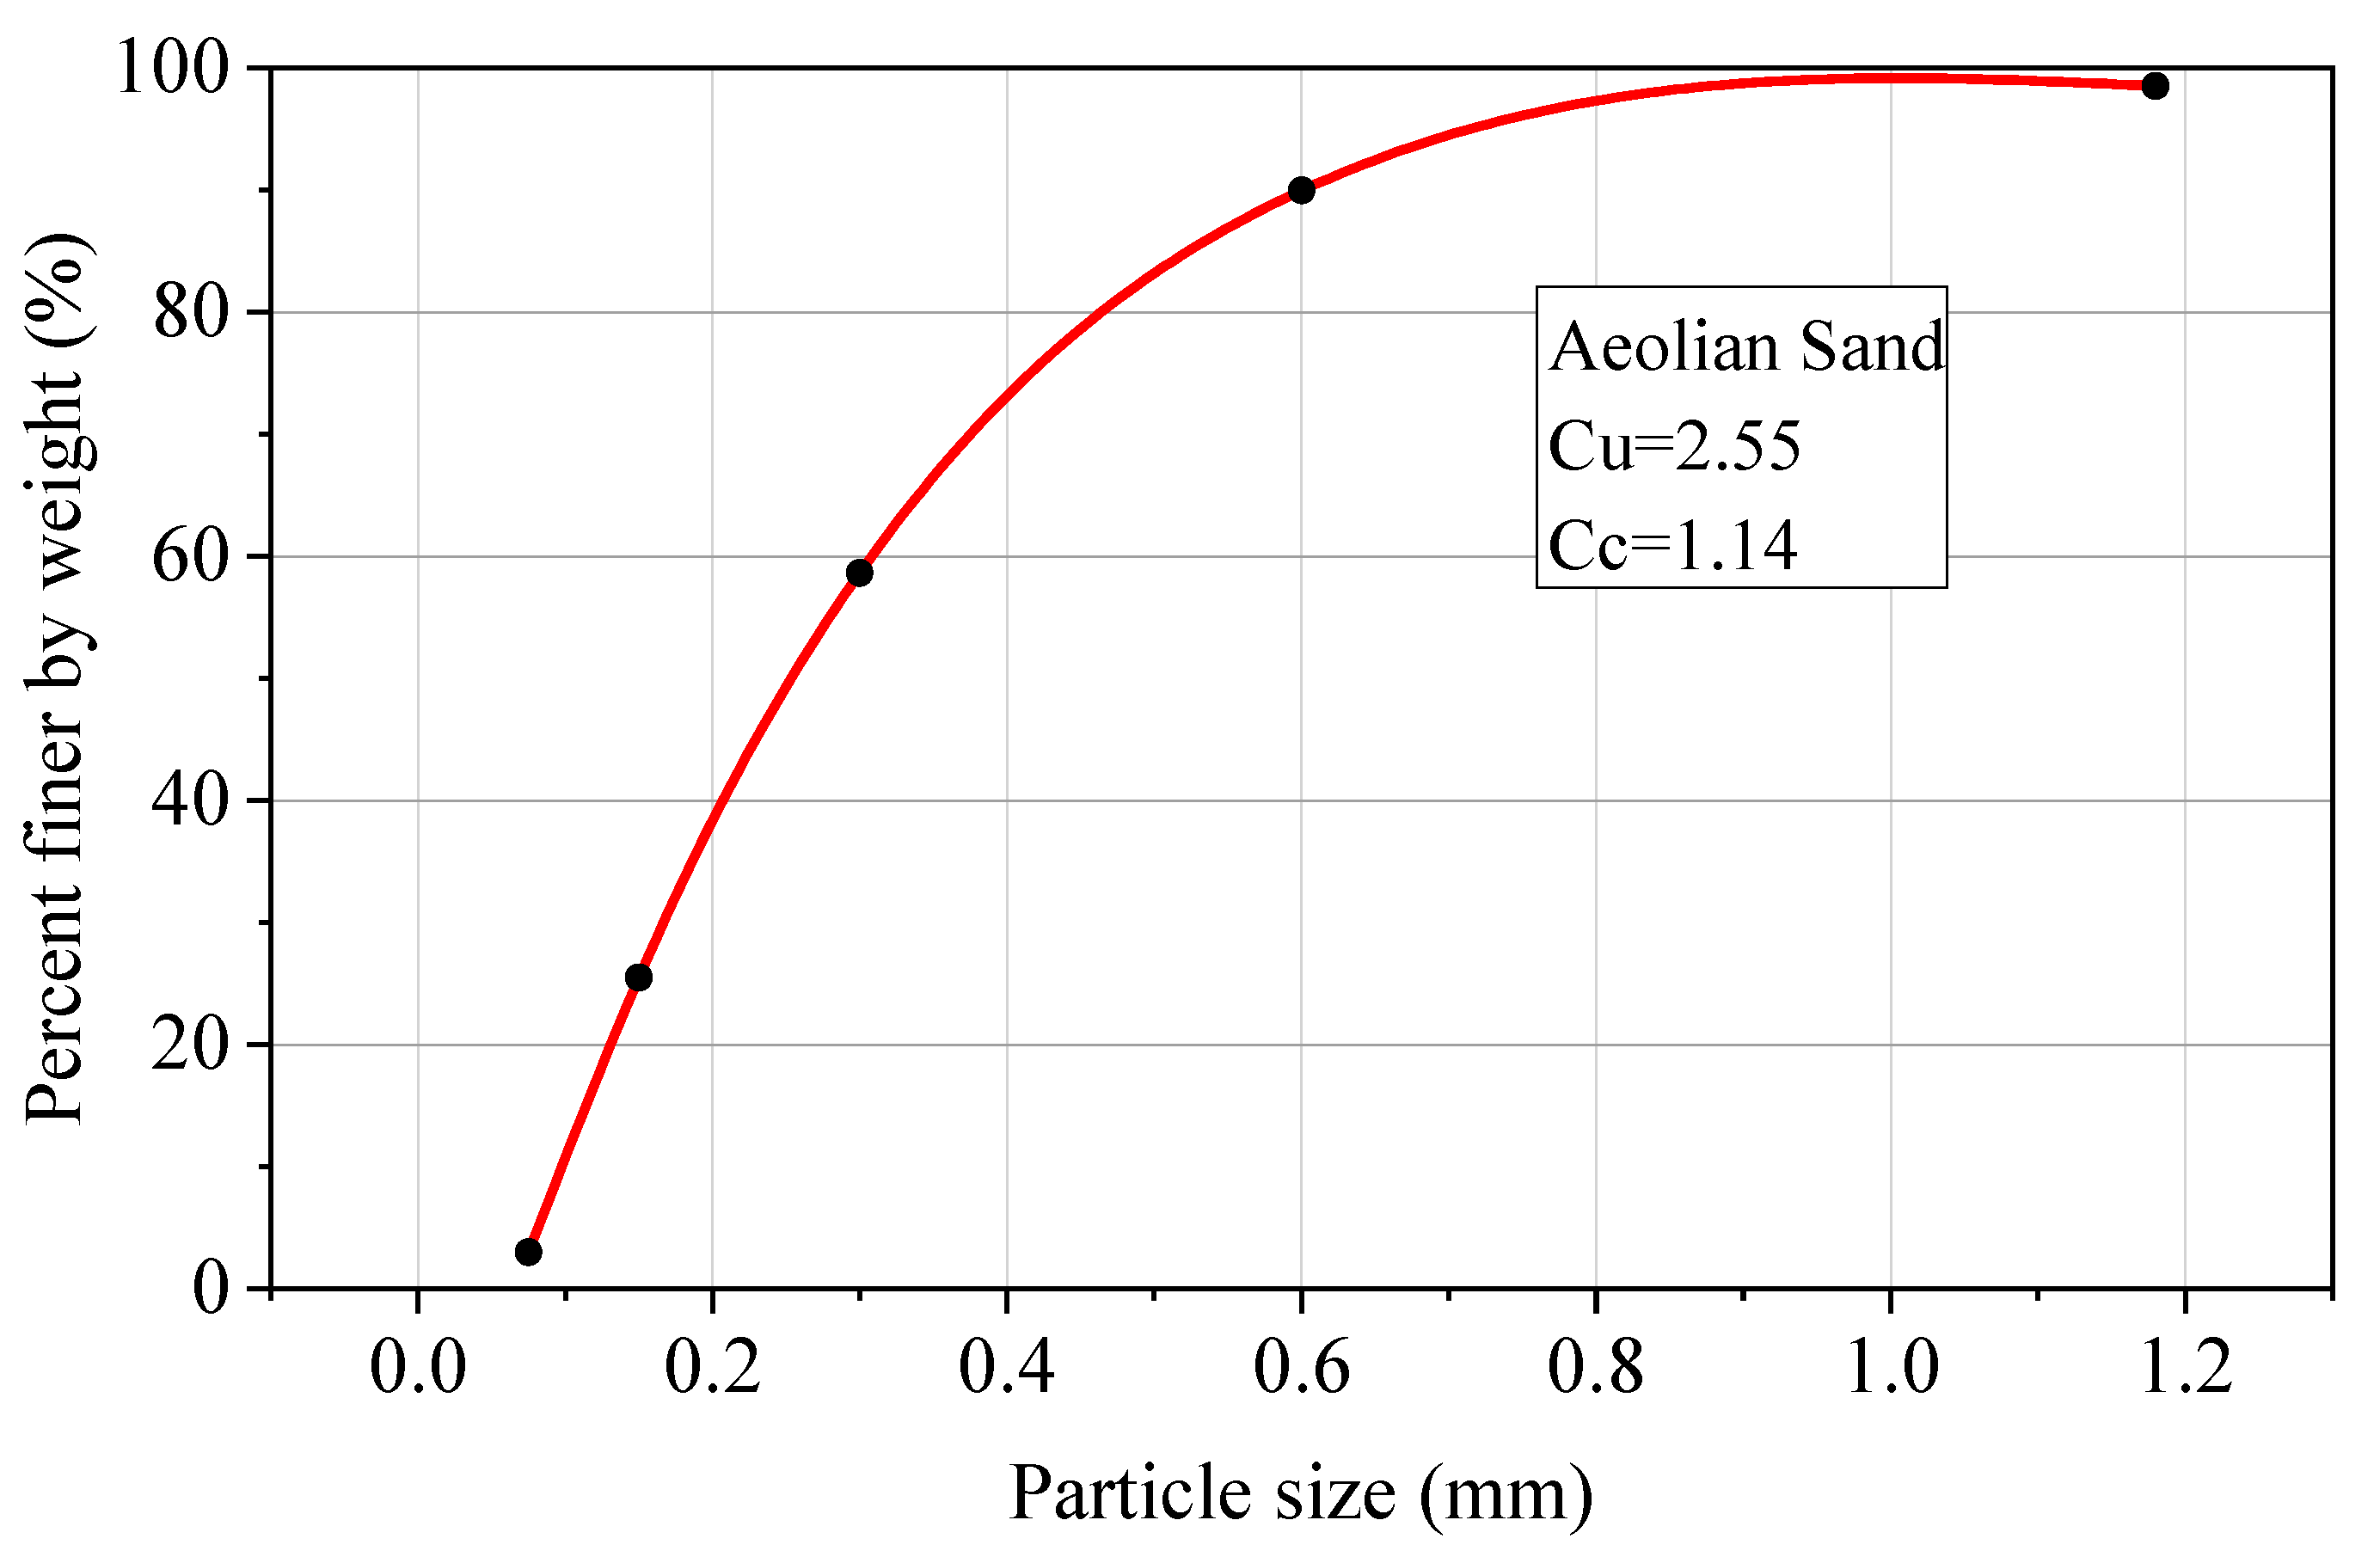
From the construction application point of view, aeolian sands are very particular materials due to their poor grading and their very uniform particle size distribution, small average size, and the rounded shape of their particles. It is difficult to shape aeolian sand because of its loose and low cohesion. Aeolian sand has poor shear performance and weak strength against external forces [4,5,6]. Aeolian sand also has the characteristics of high water permeability, poor water retention, and underdeveloped capillarity [7]. Aeolian sand occupies a vast area of the Earth’s surface, which makes it a valuable resource in engineering construction as long as its geotechnical properties are improved to meet the requirements of engineering projects [8].
Many attempts have been made to use aeolian sand in road engineering as a building material. Meng [9] used an inorganic binder to stabilize aeolian sand as the subbase material. A road section of one kilometer was constructed as part of this research project. The reliability of aeolian sand used as pavement material of desert highway was further verified using field testing and observation. Lopez-Querol et al. [10] improved the compaction and bearing capacity of aeolian sand collected in Jeddah (Saudi Arabia). They evaluated its performance after stabilization with Portland cement. They intended to use this type of soil for the construction of embankments for road applications. Li et al. [11] made aeolian sand powder samples from aeolian sand. The effect of aeolian sand powder modification was discussed through the test of the strength of aeolian sand powder cement mortar. The results of this research reported the practical significance for the applications of aeolian sand powder in water conservancy and pavement projects, with remarkable potential social benefits. Hazirbaba et al. [12] stabilized aeolian sand with the combined use of a geo-fiber and synthetic fluid. The beneficial effects of the additives in terms of both the CBR performance and shear strength of aeolian sand were discovered. Wu et al. [13] proposed a method of enzyme-induced carbonate precipitation combined with polyvinyl alcohol to solidify aeolian sand. The unconfined compressive strength, wind erosion resistance, and water erosion resistance of solidified aeolian sand were significantly improved. Peng et al. [14] used coal-based solid waste to prepare an aeolian sand-fixing material. Their work provided an effective solution for resource utilization of coal-based solid waste for enhancing the geotechnical properties of aeolian sand. Li et al. [15] proposed a method for microbial-induced calcite precipitation to solidify aeolian sand. Based on their experimental results, sand treated using this method can be used as a base course in road pavement.
In the above research, ordinary Portland cement (OPC) was commonly used as the stabilizer. OPC is recognized as the most widely used cementing agent in civil engineering infrastructure projects [16,17,18,19,20]. The production of OPC emits a large amount of greenhouse gases, notably carbon dioxide, into the atmosphere. Cement production worldwide releases up to 4 billion tons of carbon dioxide into the atmosphere annually [21,22]. Pollution and global warming, coupled with growing public environmental awareness, have been increasing rapidly in many developed and developing countries. Alternative environmentally friendly construction materials are increasingly being sought. Geopolymer is an inorganic aluminosilicate material synthesized by mixing source materials rich in silica (SiO2) and alumina (Al2O3), such as fly ash, metakaolin, granulated blast-furnace slag and silica fume with alkali activators [23,24,25,26,27]. Common geopolymerization alkali activators are alkali metals and alkaline earth metal compounds [28]. In general, the most effective alkali activator is a mixture of sodium hydroxide (NaOH) and sodium silicate (Na2SiO3), which creates the high strength and other superior properties. The emission factors of sodium silicate and cement production are 1.514 kg CO2−e/t [29] and 0.86 kg CO2−e/t, respectively [30]. Geopolymer, a novel green cementing agent manufactured from various industrial waste byproducts, is considered by many scholars as an alternative material to OPC. Mohammadinia et al. [31] used fly ash (FA) and granulated blast-furnace slag (GBFS) to replace the mixture composed of cement-stabilized crushed brick, recycled crushed aggregate, and reclaimed asphalt. Compared with cement, it was found that geopolymer-stabilized road base materials can not only meet the requirements of engineering specifications, but also reduce carbon emissions to a large extent. Itthikorn et al. [32] used granulated blast-furnace slag (GBFS) as a replacement material in marginal lateritic soil, while class C fly ash (FA) was used as a precursor for the geopolymerization process to develop a low-carbon pavement base material at ambient temperature. Phetchuay et al. [33] studied the strength development and carbon footprint ofa fly ash and calcium carbide residue-based geopolymer and found that the carbon footprint of geopolymer-stabilized soil was 43% lower than that of cement. Zhang et al. [34] proved that a metakaolin-based geopolymer can be an effective soil stabilizer for clayey soils. The microstructural analyses confirmed the formation of geopolymer gels in the stabilized soil and showed the soil tended to form more homogeneous and compact microstructures after stabilization. Shen et al. [35] prepared a new type of steel slag–fly ash phosphogypsum-solidified material composed of solid wastes to be utilized as a road material. The solidified material had the best water stability among the investigated road base materials, and its long-term strength was much higher than cement-stabilized granular material.
Therefore, using geopolymer as a soil stabilizer can be promising in terms of being cost-efficient and environmentally friendly. However, the physical, chemical, morphological, and mineralogical properties of aeolian sand differ from those of marginal lateritic soil [32] and clayey soils [34]. To date, the use of geopolymers incorporating aeolian sand appears to be scanty and, hence, could not be identified in the reported literature. This research investigated the feasibility of using geopolymer as a stabilizer for aeolian sand. The results of some experiments, including of the setting time, CBR, UCS, and temperature shrinkage tests, are presented, which will open up aeolian sand utilization for pavement subbase applications.

2. Materials

2.1. Aeolian Sand

The aeolian sand used in this research came from the stockyard in Tacheng, Xinjiang. The density of gravel was 2.5 g/cm3.The distribution of the particle size of the aeolian sand is shown in Figure 1. The particle size distribution generally refers to the percentage of particles with different sizes in the total particles in the powder sample reflected using specific instruments and methods. In this investigation, the particle size distribution of aeolian sand was determined using a sieving method, according to GB/T50123-2019 [36]. It was between 0.075 and 0.6 mm, and its content was as high as 90%. From this figure, it could be understood that the number of particles larger than 0.6 mm was very low and the particles smaller than 0.075 were less than 3% of the total. Referring to soil mechanics, soil with an uneven gradation coefficient Cu > 5 and curvature coefficient (Cc) of the gradation curve in the range of 1 to 3 is well-graded [37]. The Cu of the investigated aeolian sand was 2.55. Therefore, based on the mentioned classification method, the aeolian sand was categorized as poorly graded sand.

2.2. Slag

Slag samples were obtained from a steel plant in Xinjiang. The slag was white and powdery in appearance, as shown in Figure 2a. The main chemical composition was 38.45% CaO, 32.21% SiO2, 11.16% Al2O3, and 10.28% MgO (Table 1). An SEM image (Figure 3a) indicated that the particles were generally irregular in shape. The XRD pattern (Figure 4a) showed that the amorphous humps of slag varied within the range of 20° 2θ to 40° 2θ.

2.3. Fly Ash

Fly ash (FA) was collected from the Hefeng power plant. Lignite was used in the Hefeng power plant for electricity generation. The FA has the major components of SiO2, Al2O3, and Fe2O3 at 78.25%, and CaO at 9.57% (Table 1). It was white and powdery in appearance (Figure 2b) and was classified as a low calcium class F fly ash. Its particles were fine-grained and spherical in shape (Figure 3b). The XRD pattern of FA showed that it mainly consisted of glassy phase materials (amorphous humps in the range of 20° 2θ and 35° 2θ) with some crystalline additions of quartz and mullite (22° 2θ and 60° 2θ) (Figure 4b).

2.4. Cement

Class I Portland cement with strength of 42.5 MPa was employed. Its chemical composition is shown in Table 1.

2.5. Liquid Alkali Activator

A mixture of sodium silicate (Na2SiO3) solution and sodium hydroxide (NaOH) solution was used as the liquid alkali activator. As the reaction of the mentioned mixture with water is strongly exothermic, the alkaline solutes were left to cool down at ambient temperature before use. Two types of sodium silicate solution with modulus 2.4 and 3.0 were used. The modulus of sodium silicate solution is the mole ratio of SiO2 and Na2O.

3. Experimental Method

3.1. Designing of Slag–Fly Ash Geopolymer Mixture Ratio

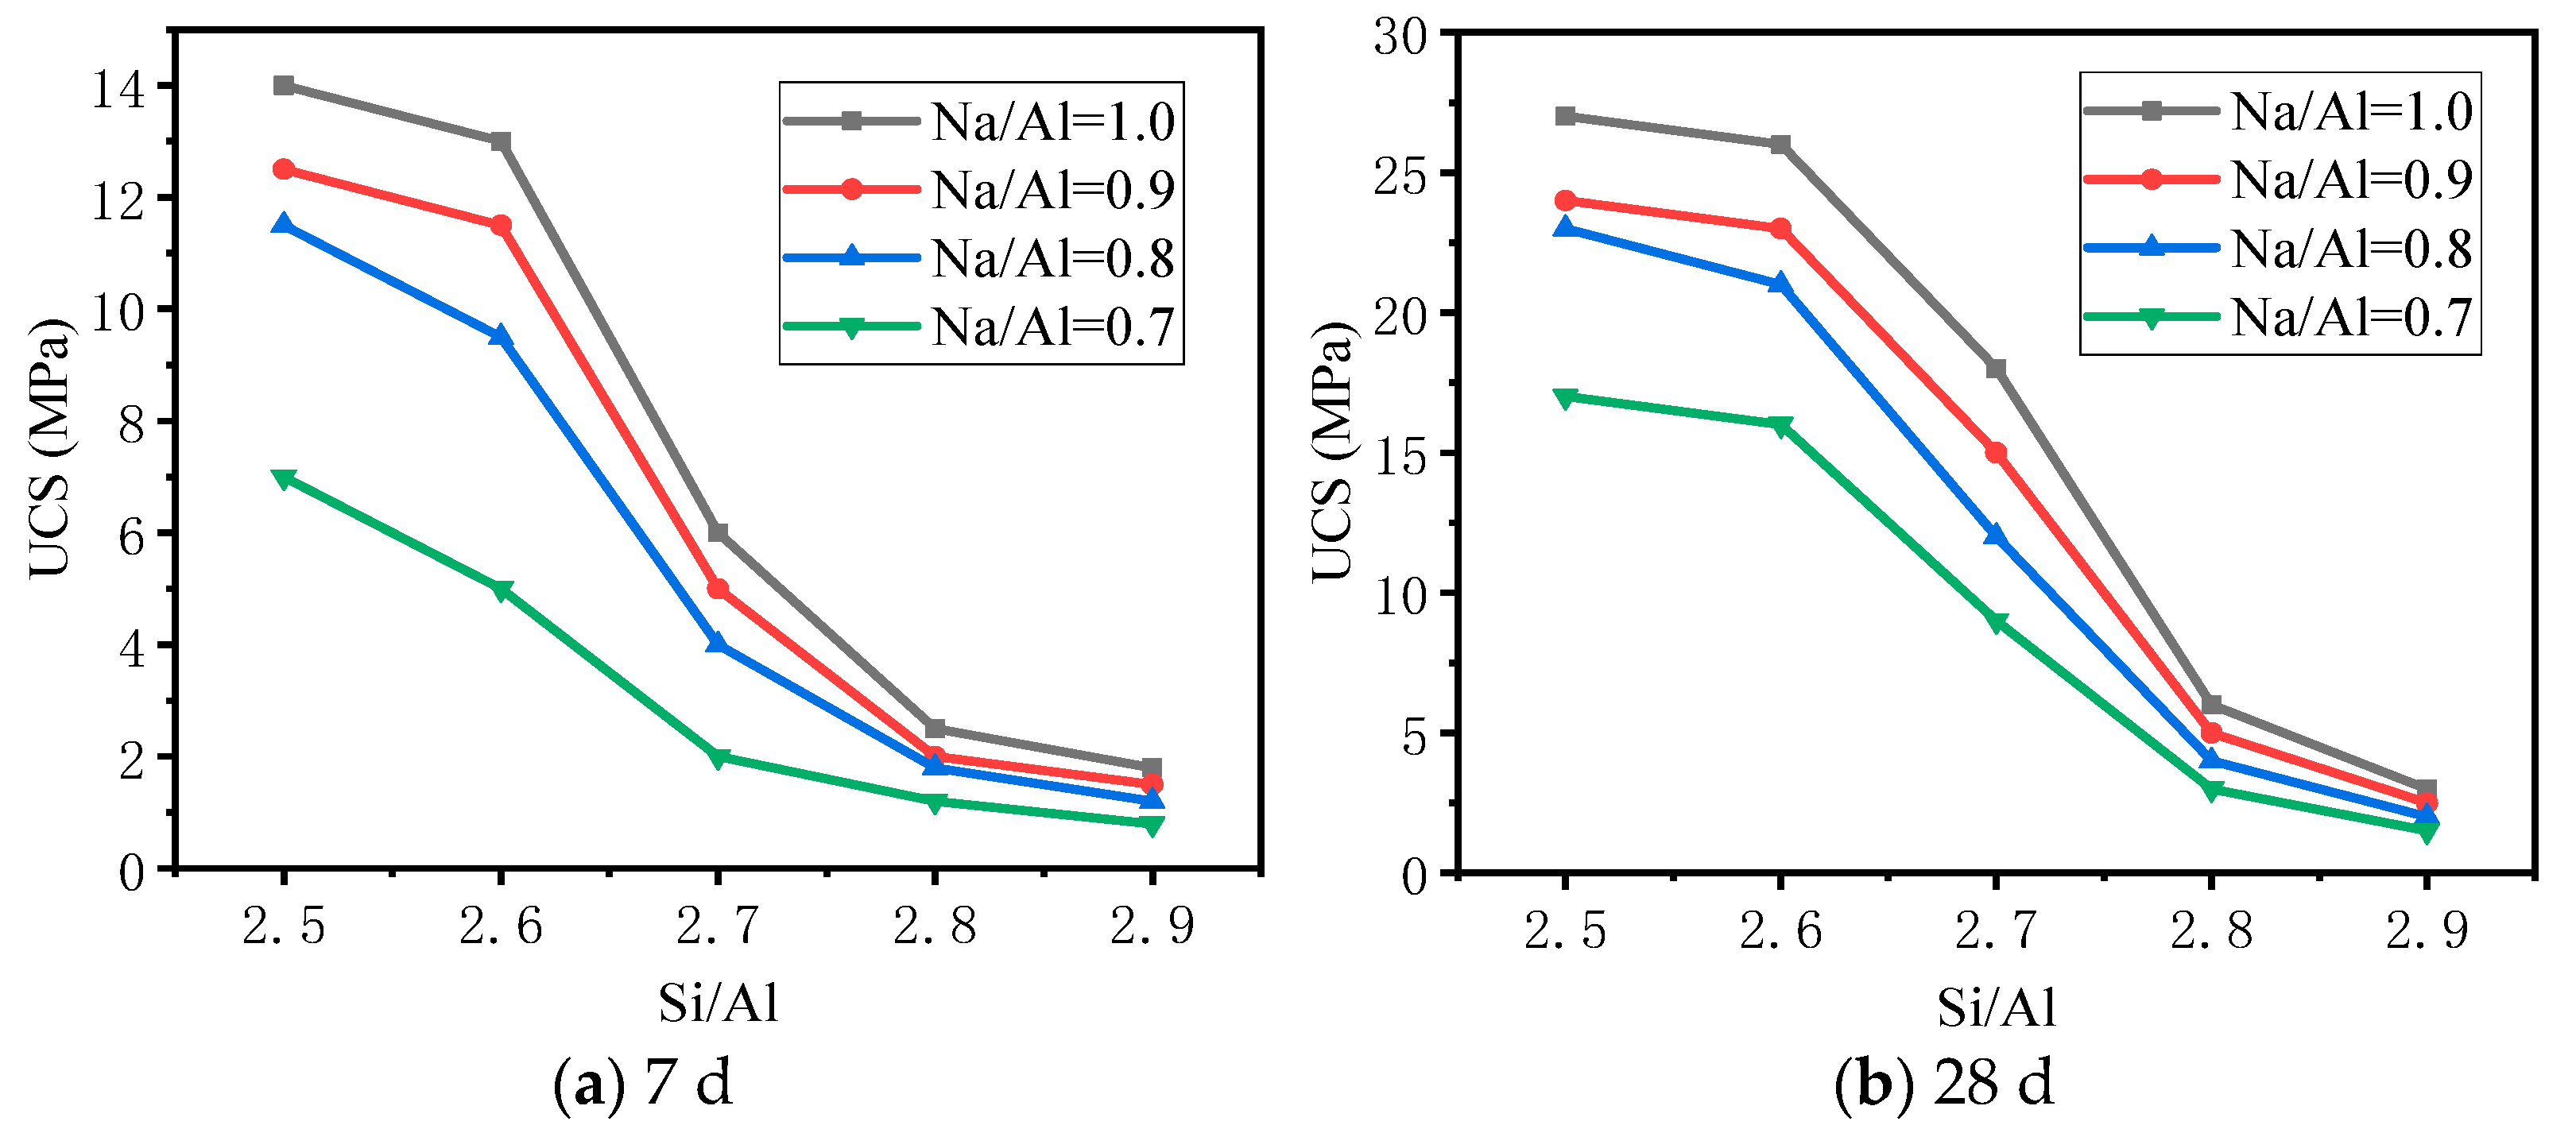
The XRF test data of slag and fly ash were used to calculate the content of solid materials Si and Al. By controlling the dosage of liquid alkali activator and adjusting the Si/Al of the binary geopolymer to 2.5, 2.6, 2.7, 2.8, and 2.9, the corresponding Na/Al was between 0.7 and 1.1 (the ratio is the element molar ratio). The slag–fly ash geopolymer ratio design is shown in Table 2. The sample ID can be explained using Si2.5N1.0 as an example, which means that Si/Al is 2.5, Na/Al is 1.0, and the ratio of slag to fly ash is 1:1. The number in the bracket represents the modulus of sodium silicate solution. For the ID without the bracket, the samples were prepared using a sodium silicate solution with a modulus of 2.4. NaOH solution should be prepared 24 h before mixing with solid materials, and NaOH solution should be mixed with Na2SiO3 3 h before mixing with solid materials. Mixing dry materials was conducted in a blender for 3 min to prepare the samples. Then, liquid alkali activator and water were added. Then, the mixing process should be continued for 3 min to form a uniform slurry.

3.2. Setting Time Test of Slag Fly Ash

The initial and final setting times of the fresh binders were measured using Vicat’s apparatus. The needle used was 1.13 ± 0.05 mm in diameter. This test was carried out in the laboratory with a relative humidity of 50% and at room temperature (20 ± 2 °C). This test was performed according to the Chinese National Standard GB/T 1346-2011.

3.3. Solidified Aeolian Sand Samples

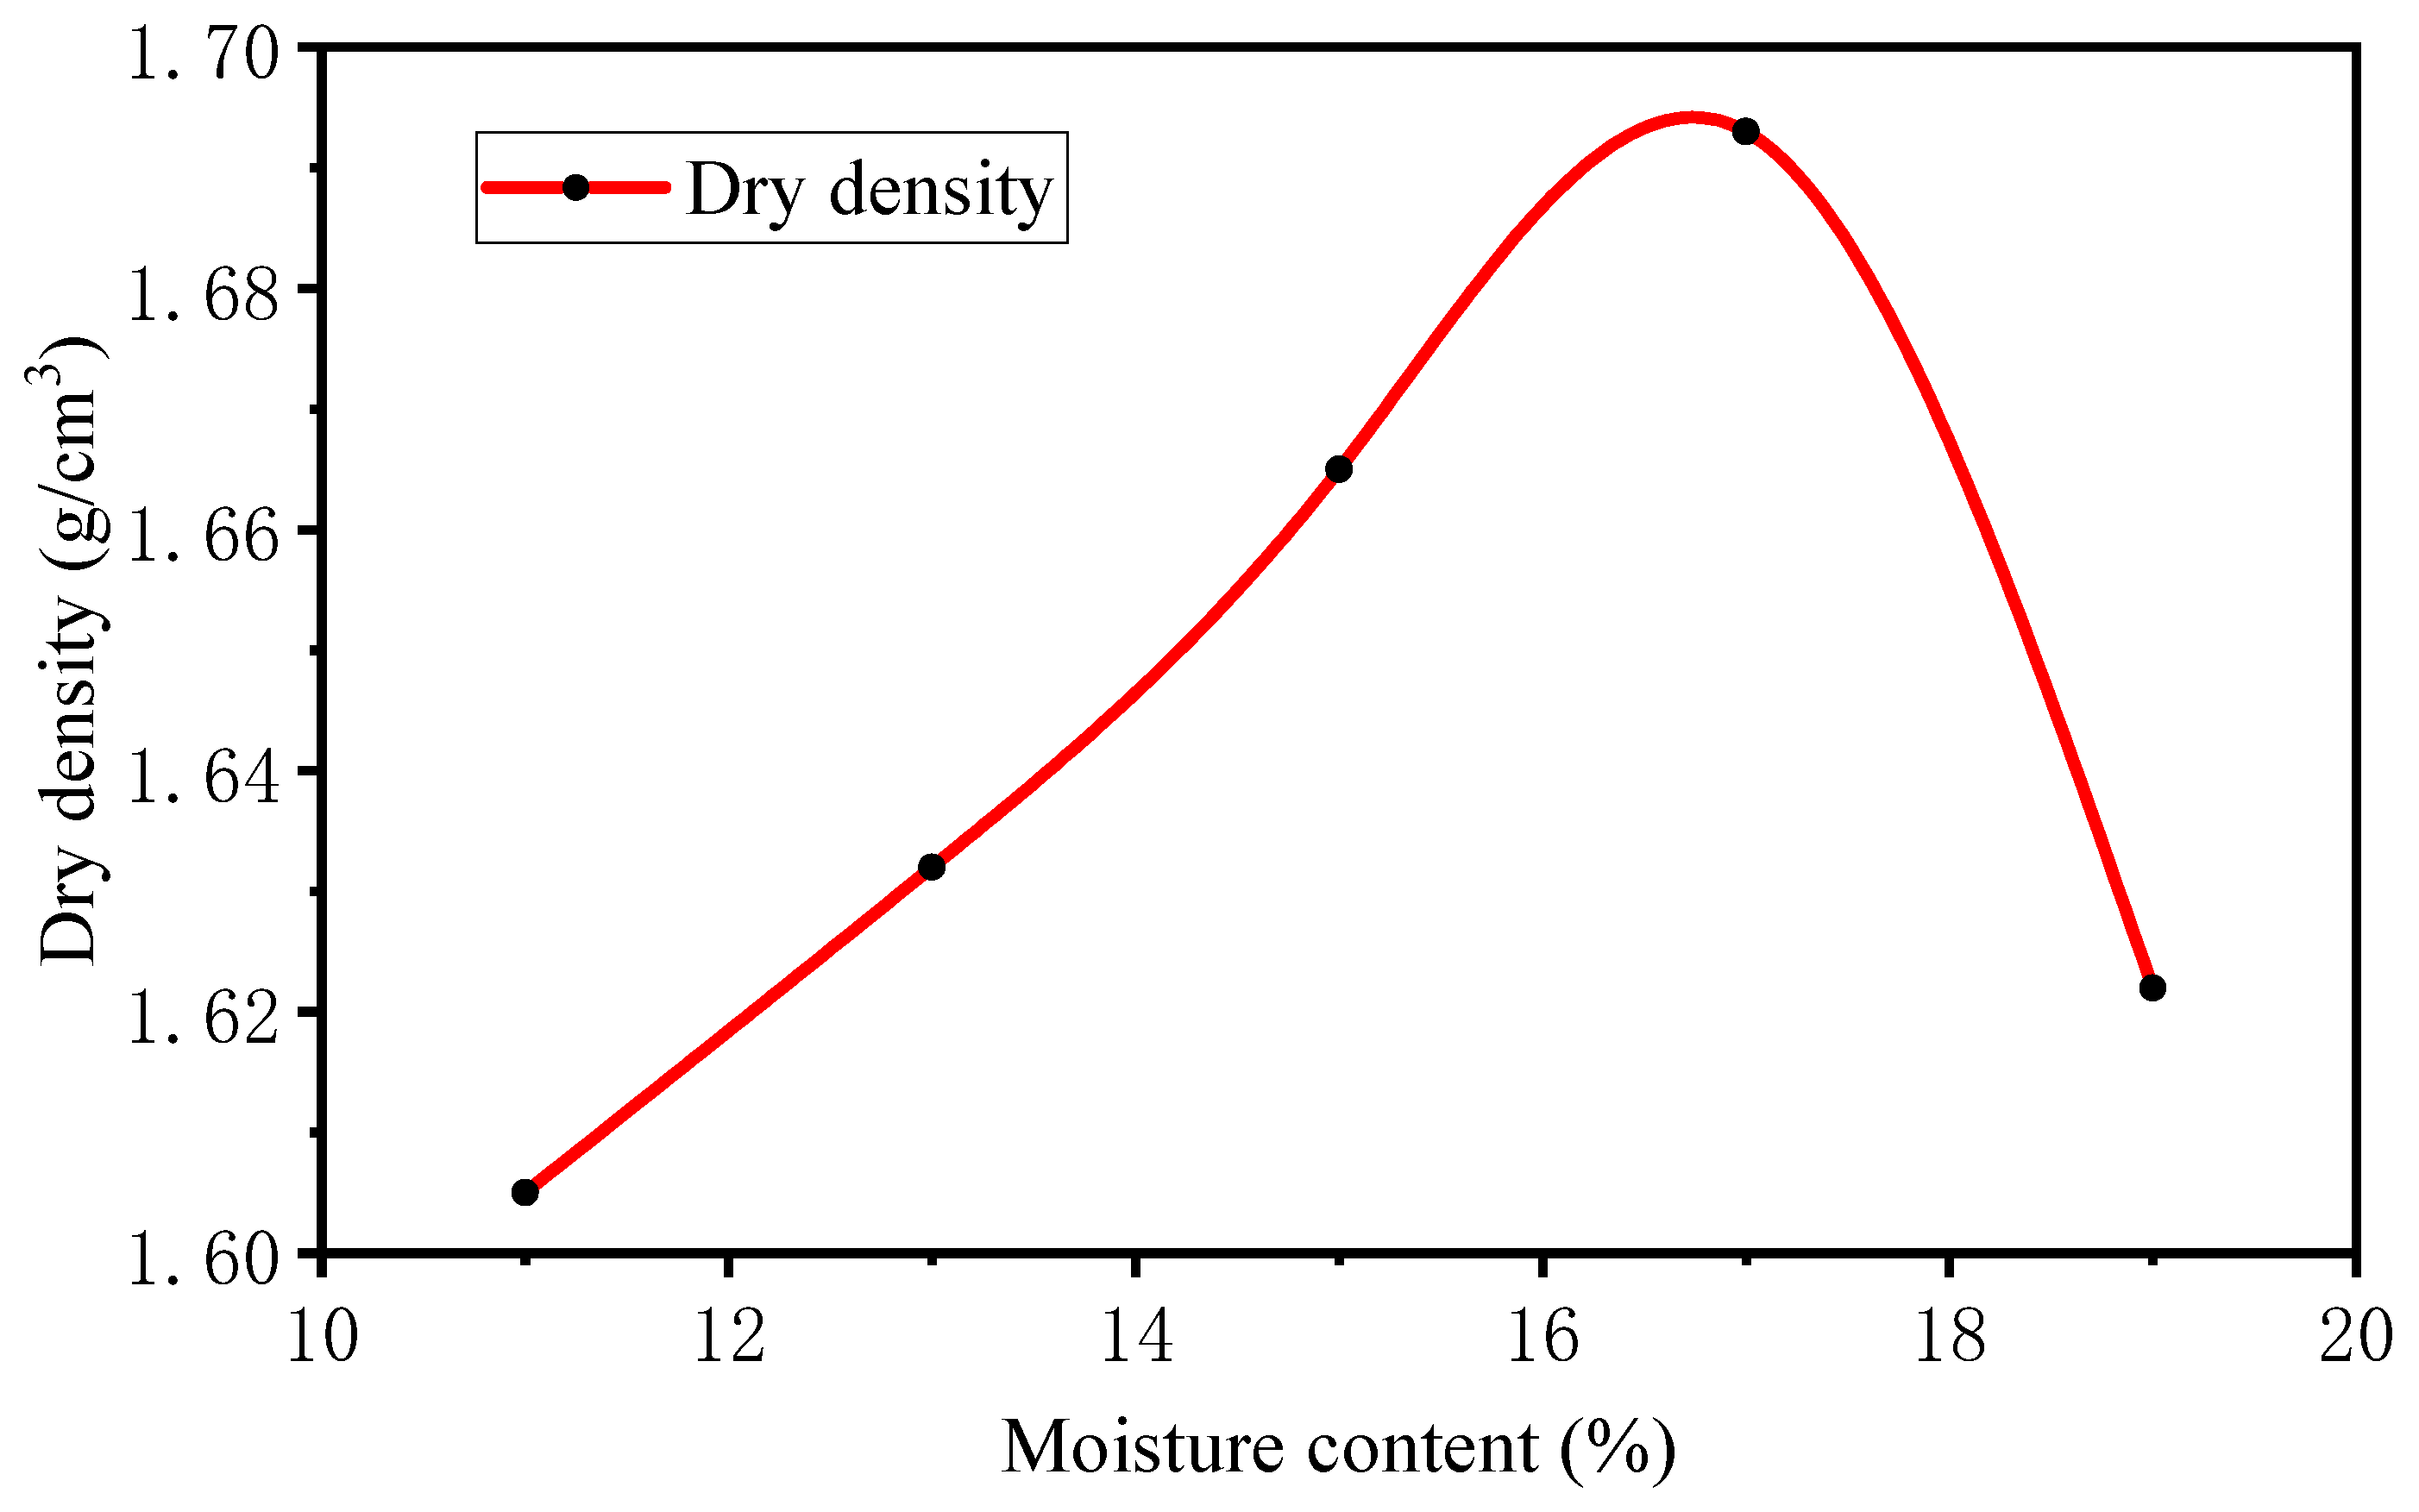
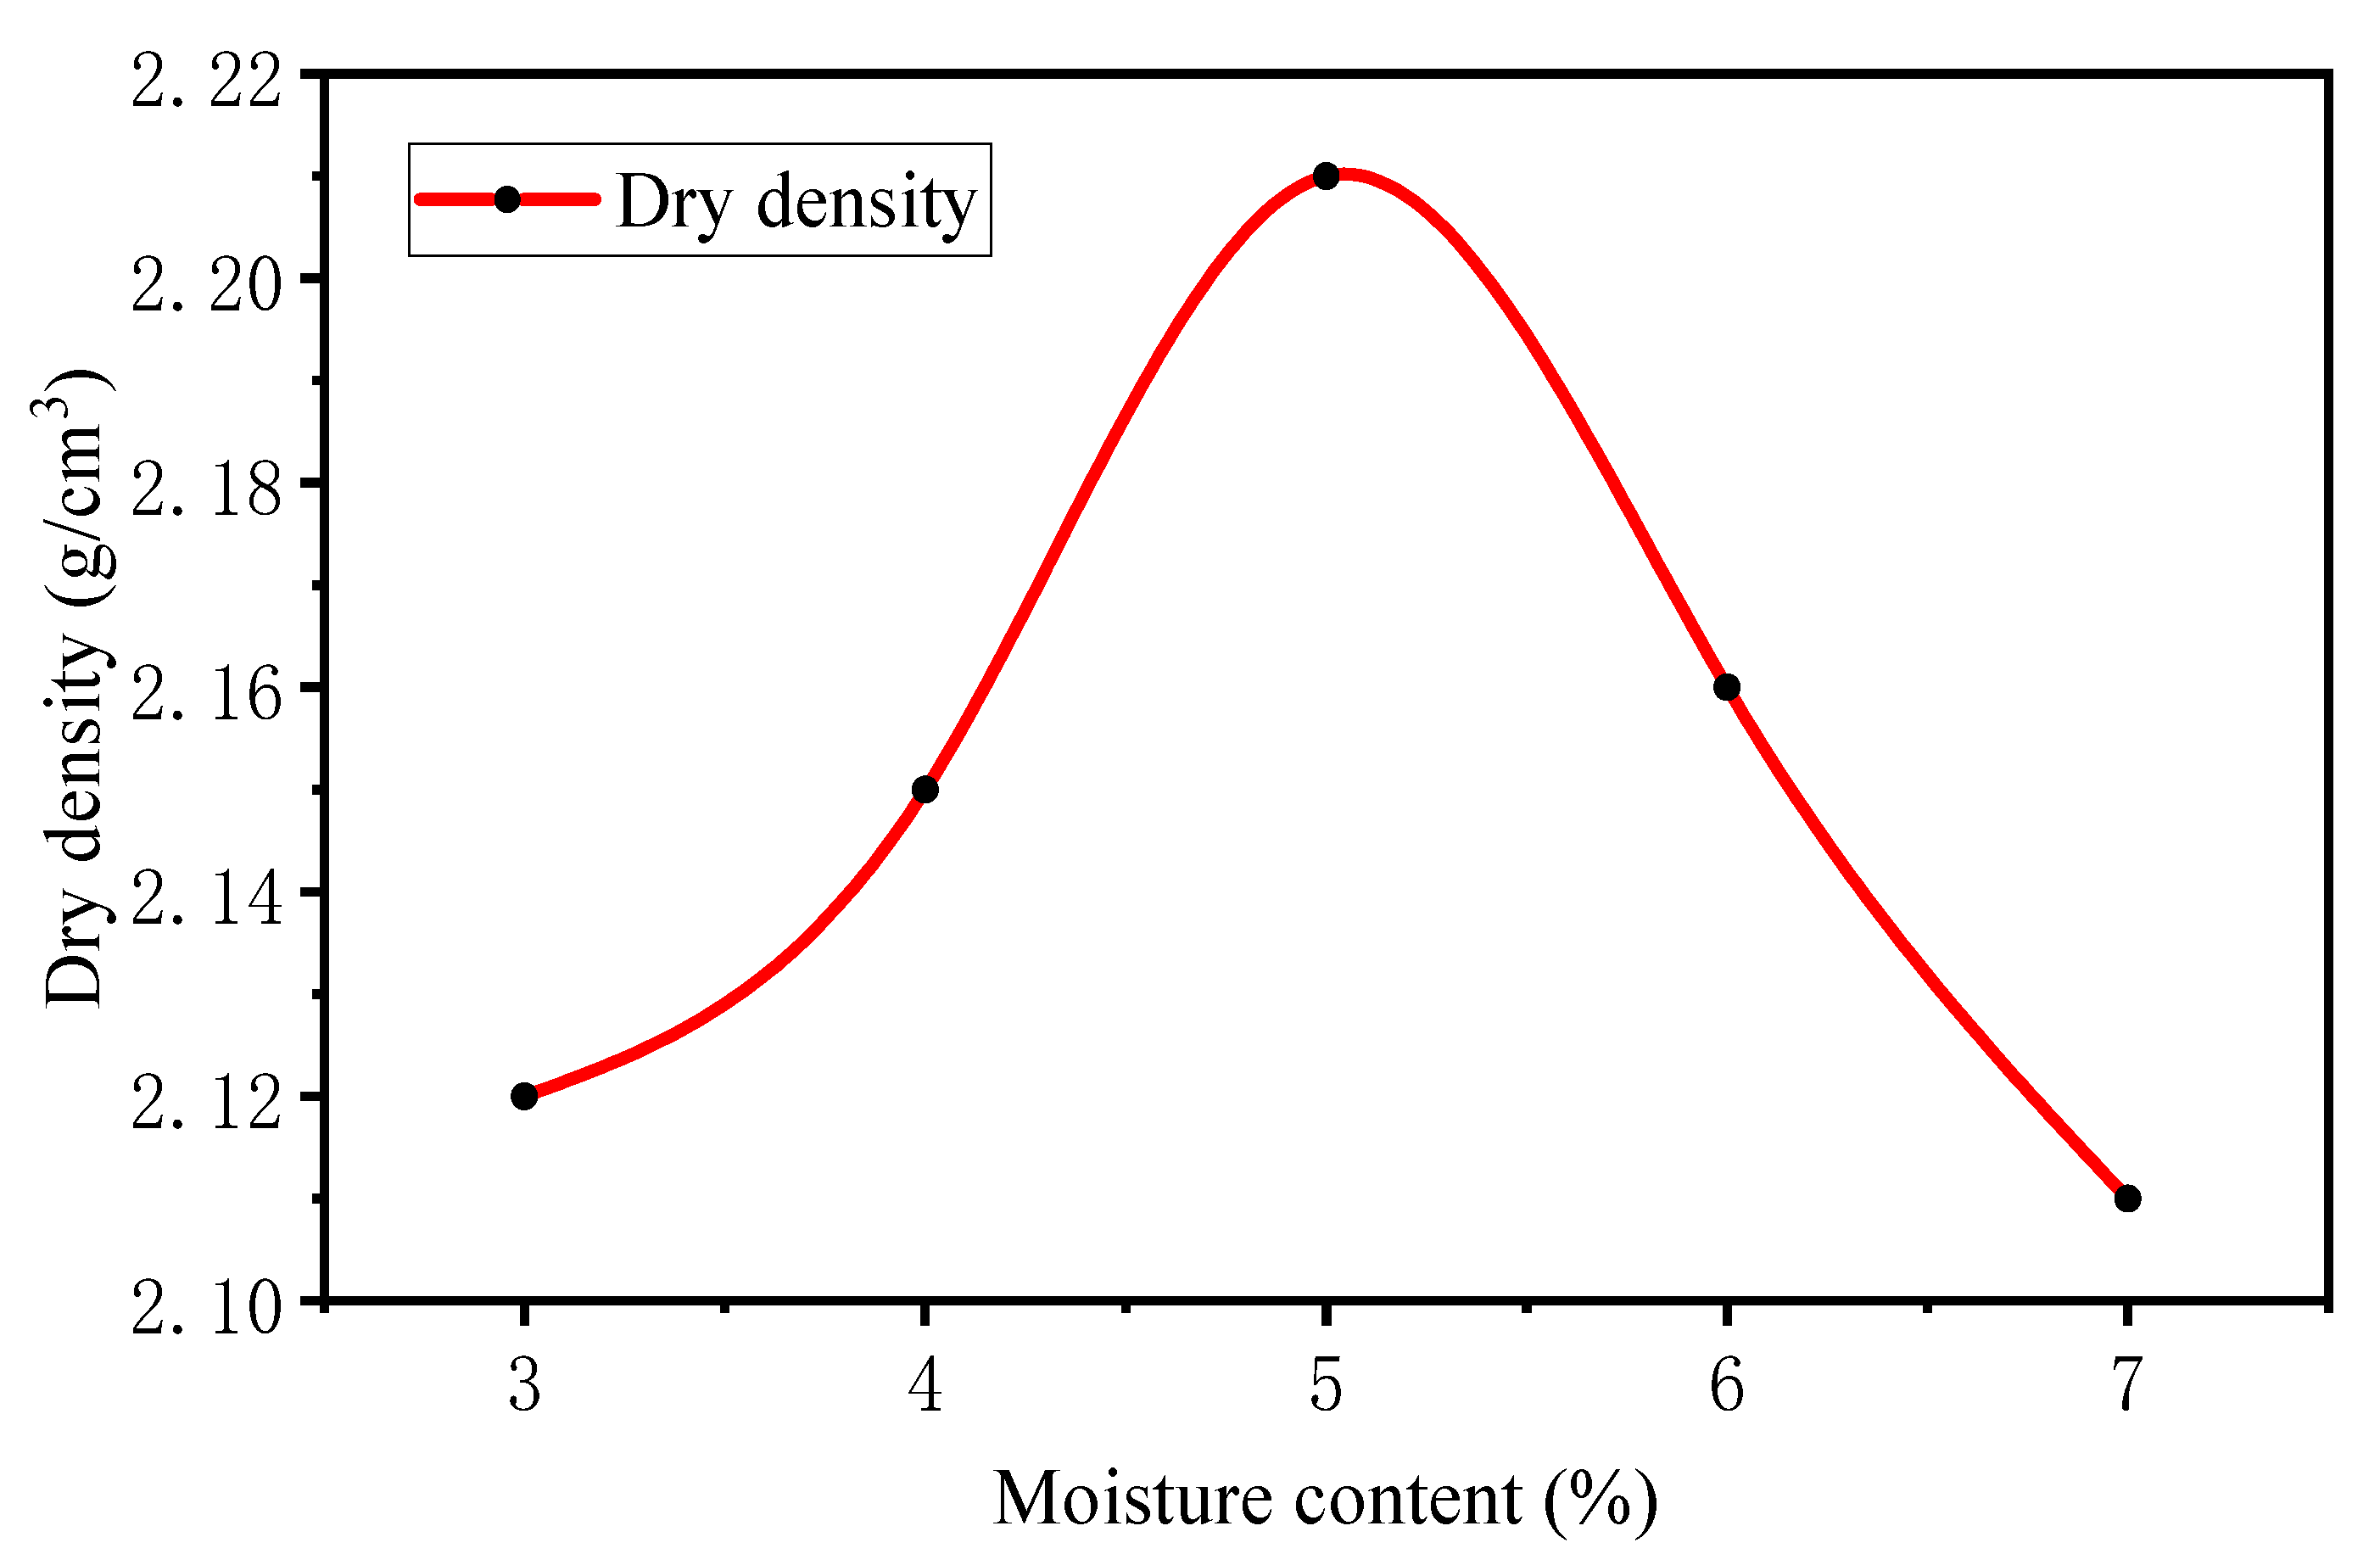
Table 3 presents the mix design of solidified aeolian sand. The ratio of water to solid in cement was 0.5. The water consumption for the preparation of geopolymer was determined according to the selected ratio of Si2.5N0.8, and the ratio of water to solid (w/s) was 0.46. Here, the ratio was calculated as the water in the activator divided by the mass of solids (fly ash + slag + solids in the activator). For the pavement base material, it was necessary to determine the optimum moisture content of the material through compaction test to ensure that the material reached the maximum compactness. Therefore, a set of compaction tests was carried out to determine the maximum dry density and the corresponding optimum water content (OWC) for each case, which was necessary to be known in advance for preparing the stabilized aeolian sand samples. The compaction test adhered to the Chinese National Standard JTG 3430-2020. The relationship between moisture content and dry density of aeolian sand is shown in Figure 5. The optimal moisture content of aeolian sand is 17%, and the corresponding maximum dry density is 1.693 g/cm
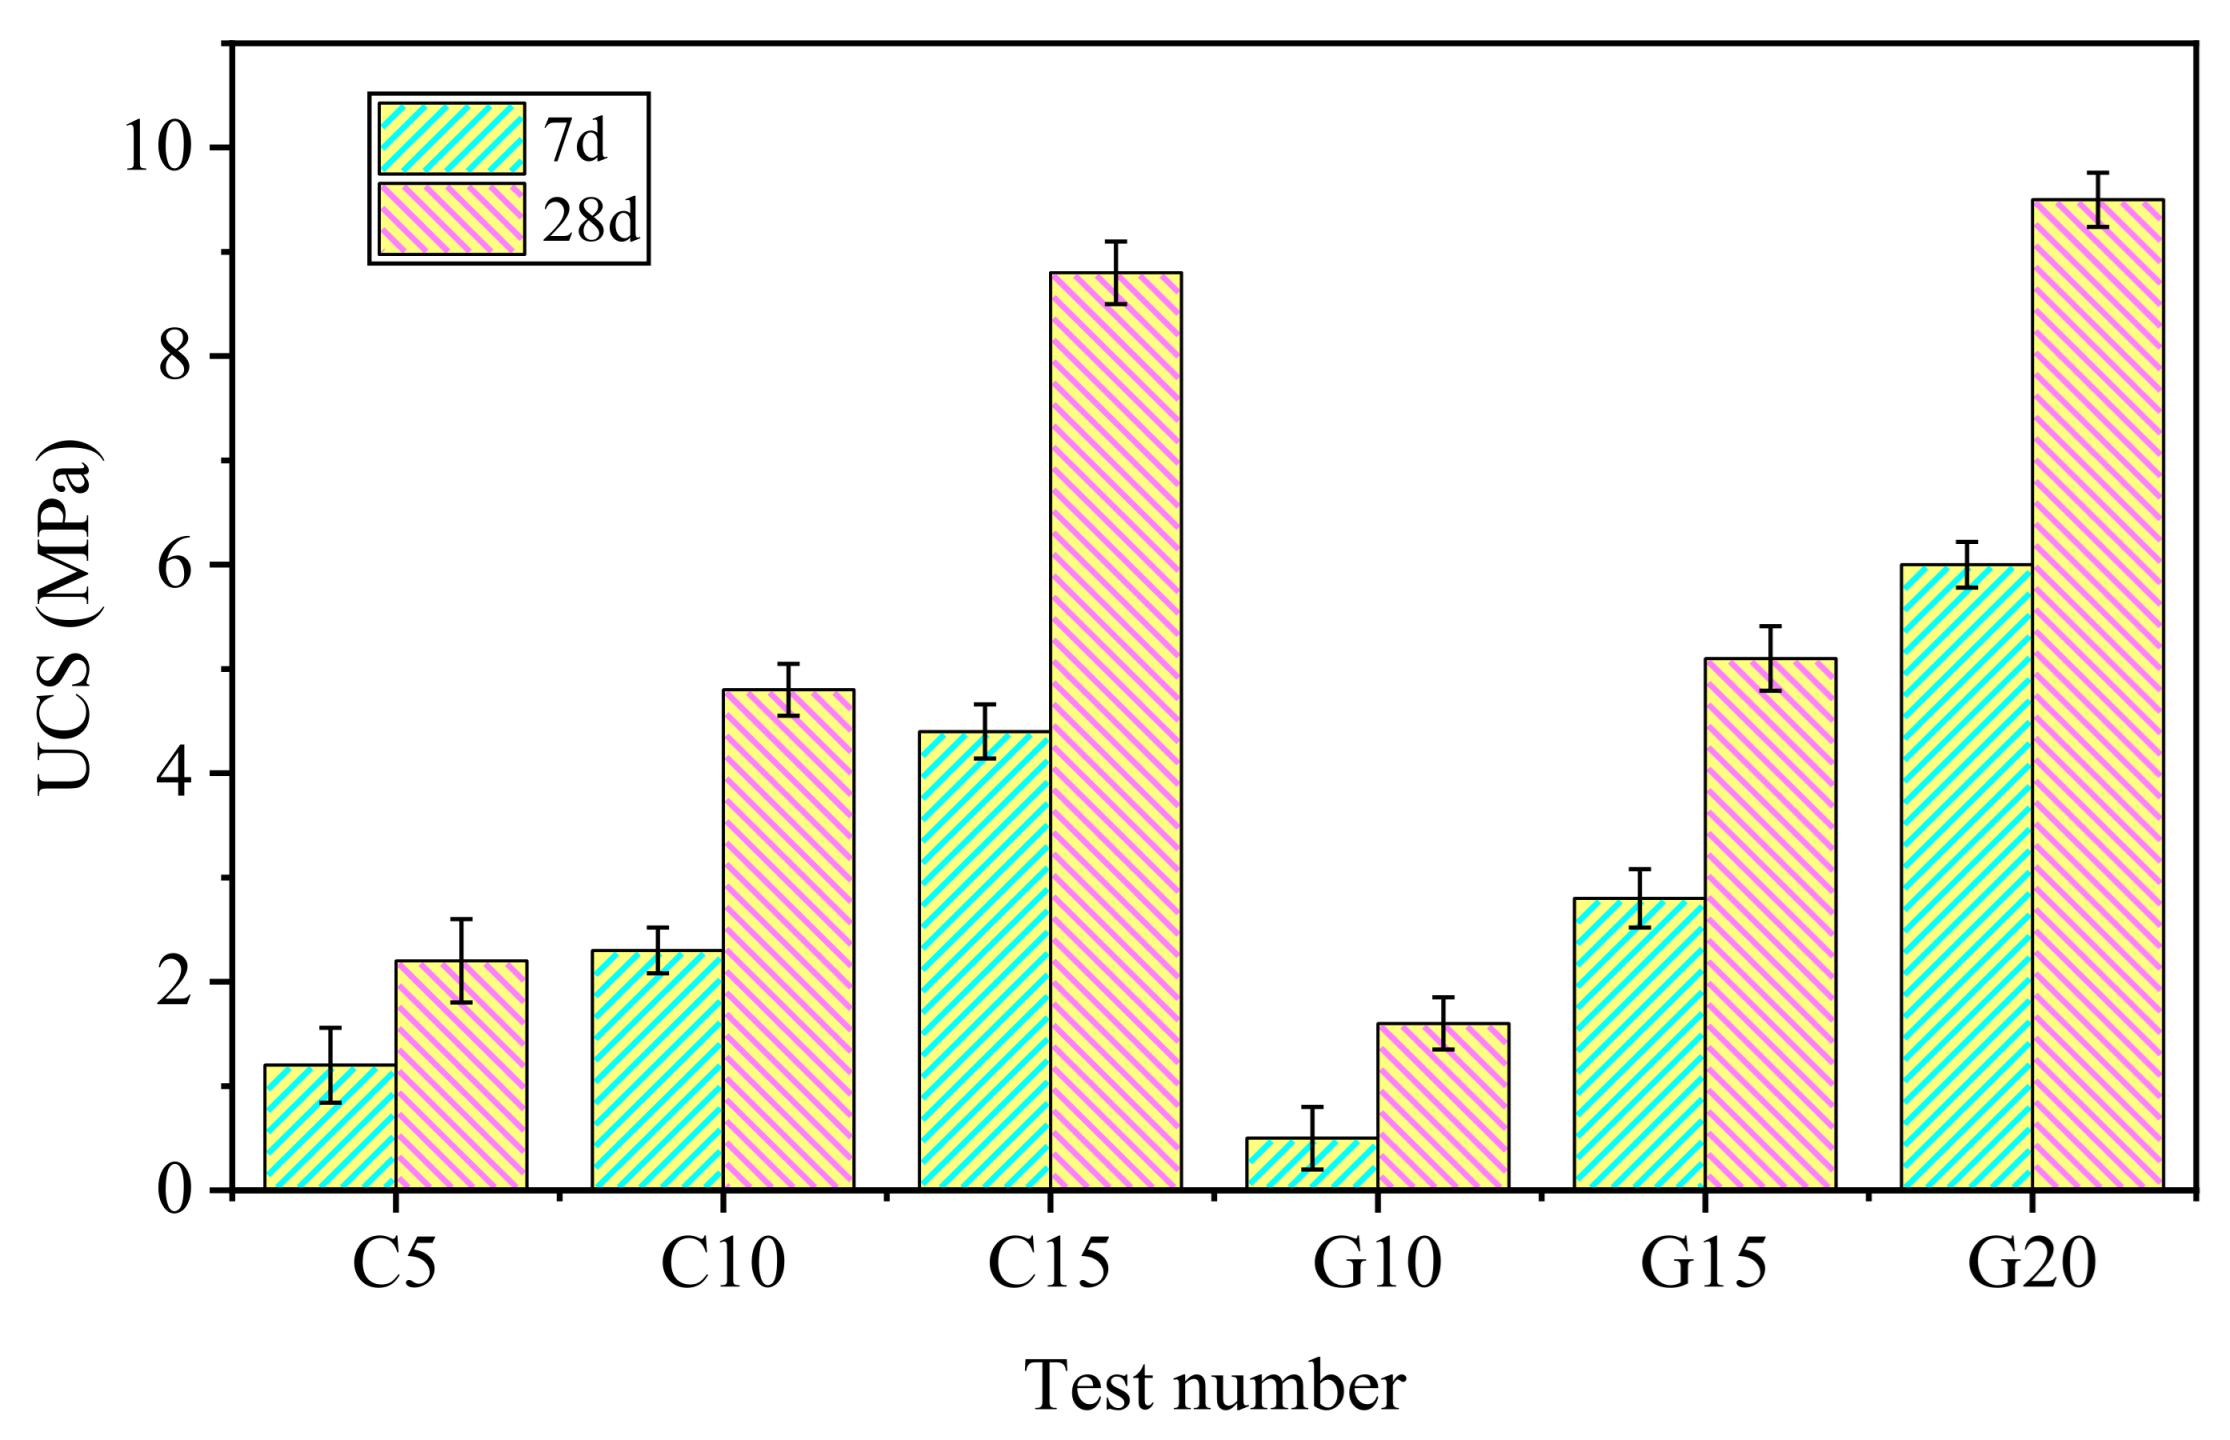
3. For geopolymer-stabilized aeolian sand, the geopolymer paste was prepared and poured into sand at the predetermined w/s ratio (0.46). Then, extra water was added to the mix to meet the OWC. The proportion of slag–fly ash geopolymer was 10%, 15%, and 20%, represented by G10, G15, and G20, respectively. On the other hand, C5, C10, and C15 represent the aeolian sand with 5%, 10%, and 15% cement content. It should be noted that they were used as control samples.

3.4. Unconfined Compressive Strength (UCS) Test

The unconfined compressive strength test referred to Chinese National Standard JTG 3430-2020. According to the optimal moisture content and maximum dry density obtained from the compaction test, several cylindrical samples with a height of 80 mm and a diameter of 39.1 mm were prepared. Samples and molds were sealed in a curing room with a temperature of 20 ± 1 °C and a relative humidity of no less than 95%. One day later, the samples were de-molded and kept sealed in the curing room until testing. The (UCS) samples were tested using the Universal Testing Machine (UTM) with a compression rate of 1 mm/min.

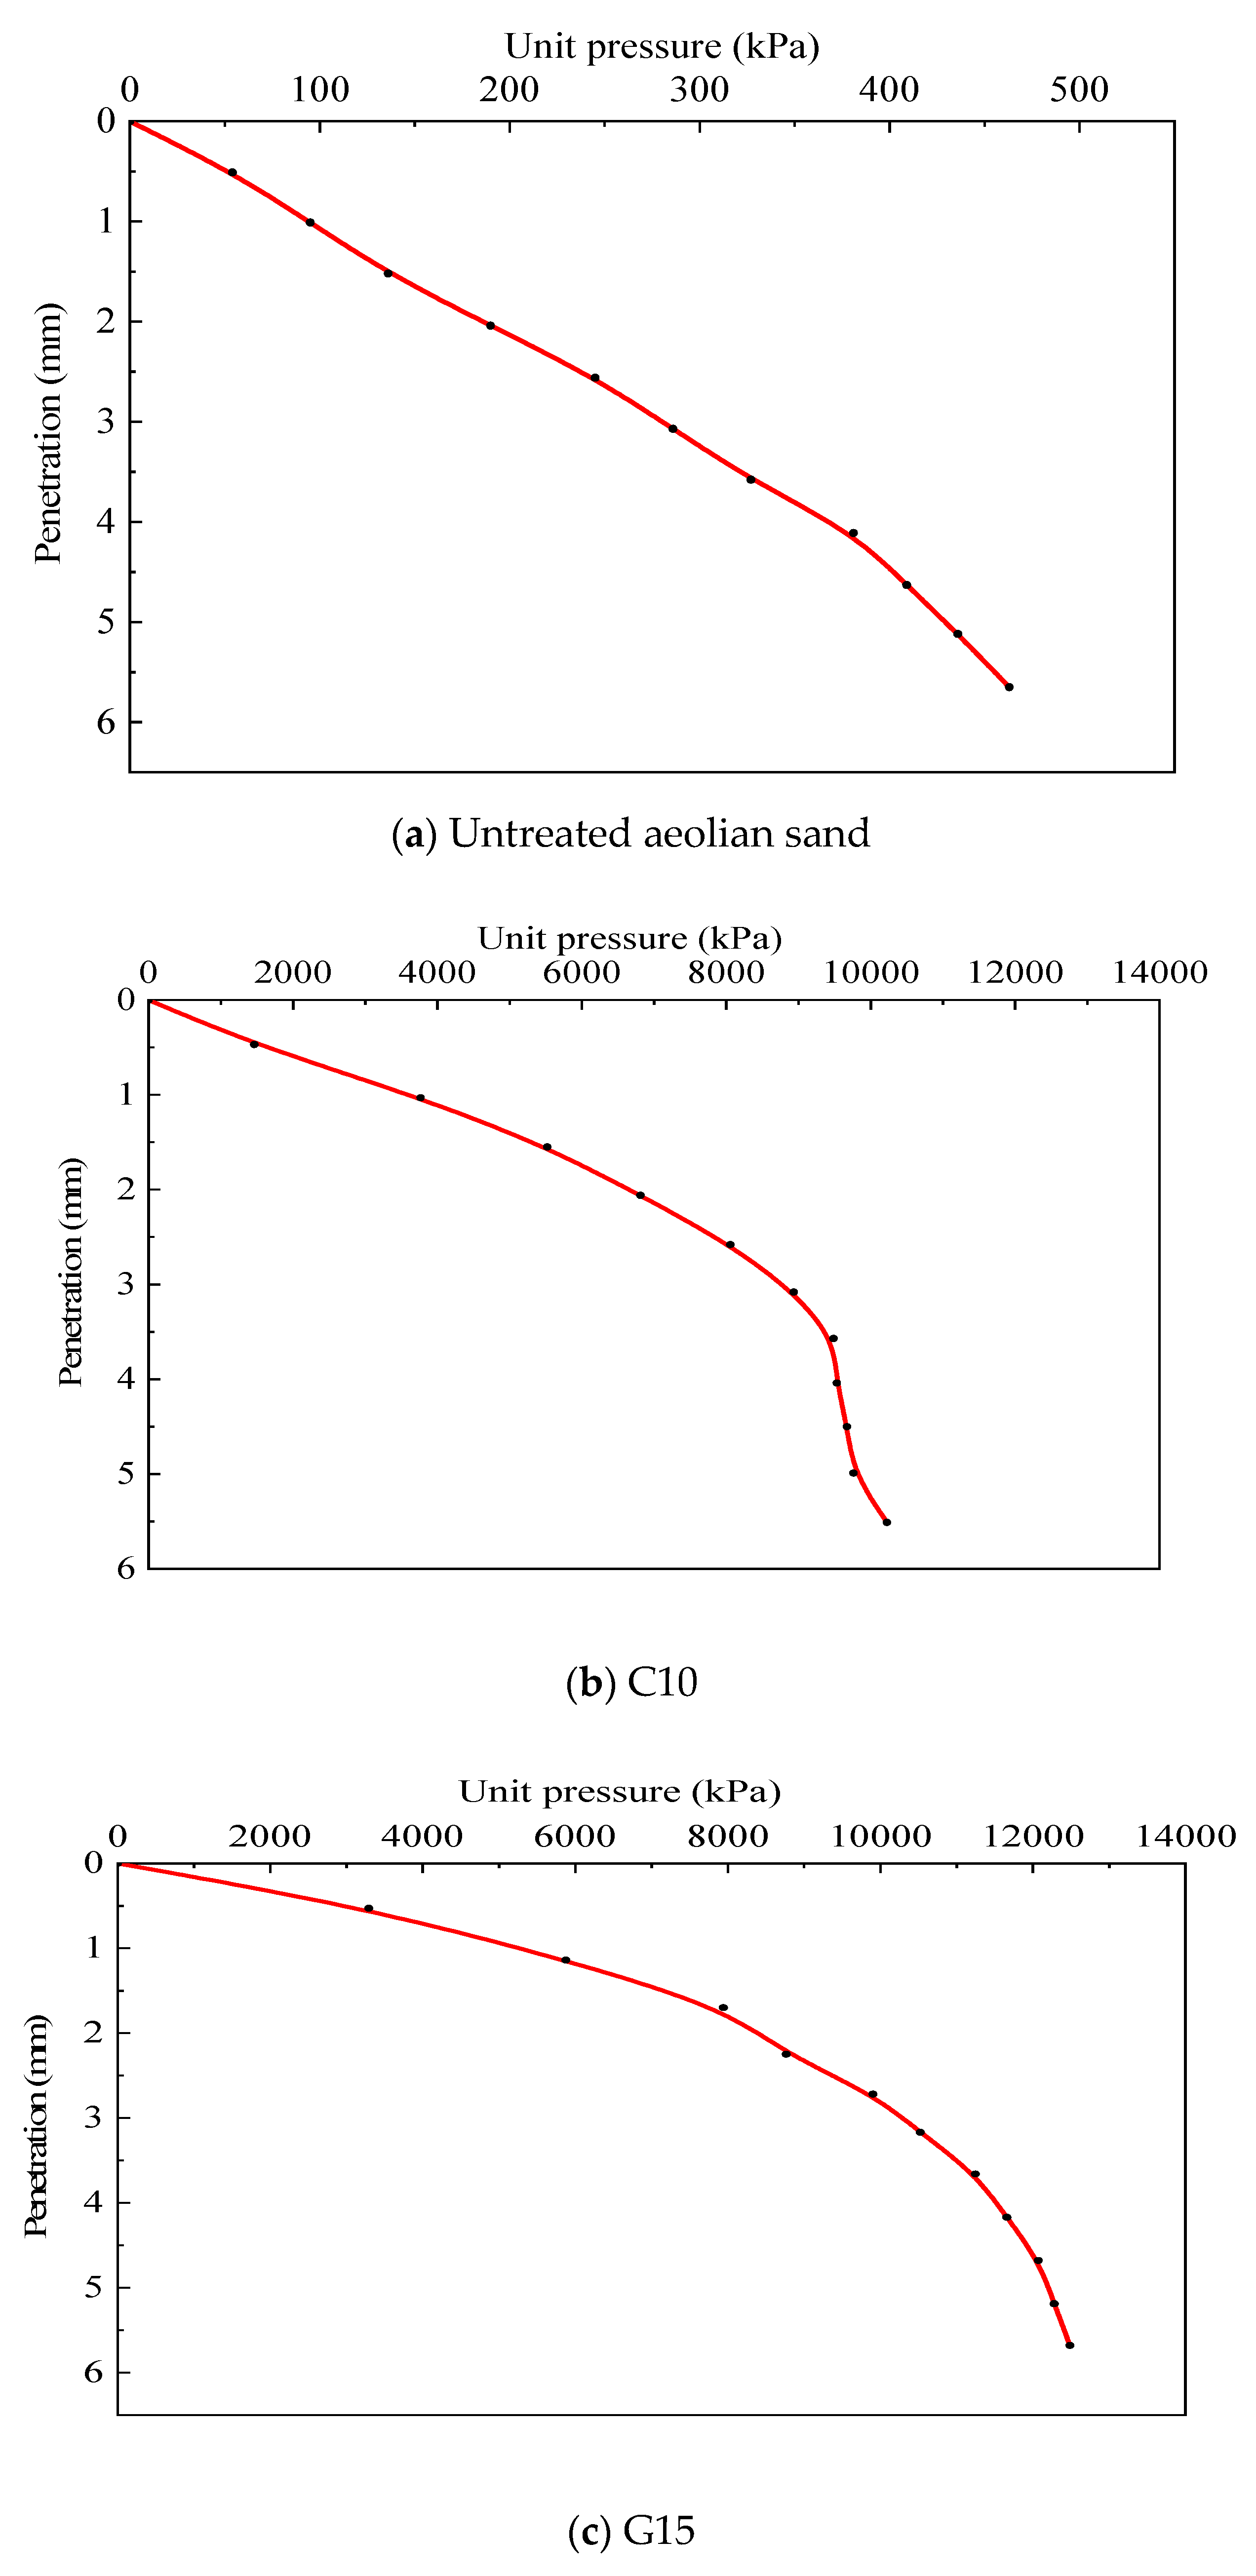
3.5. Bearing Capacity (CBR) Test

CBR tests, which are used as an indicator of the strength of subgrade soil, subbase, and base course material in roads, were in accordance with the Chinese National Standard JTG 3430-2020. A heavy compaction method was adopted in the CBR test, and the mixture was compacted into cylindrical specimens with a diameter of 152 mm and a height of 120 mm. The ratio of load strength of unit pressure and standard gravel pressure under uniform penetration mode was obtained at the penetration scale of 2.5 mm after placing the samples in water for four days. The CBR value can reflect the strength of subgrade materials, and it is also the primary reference basis for subgrade and pavement design.

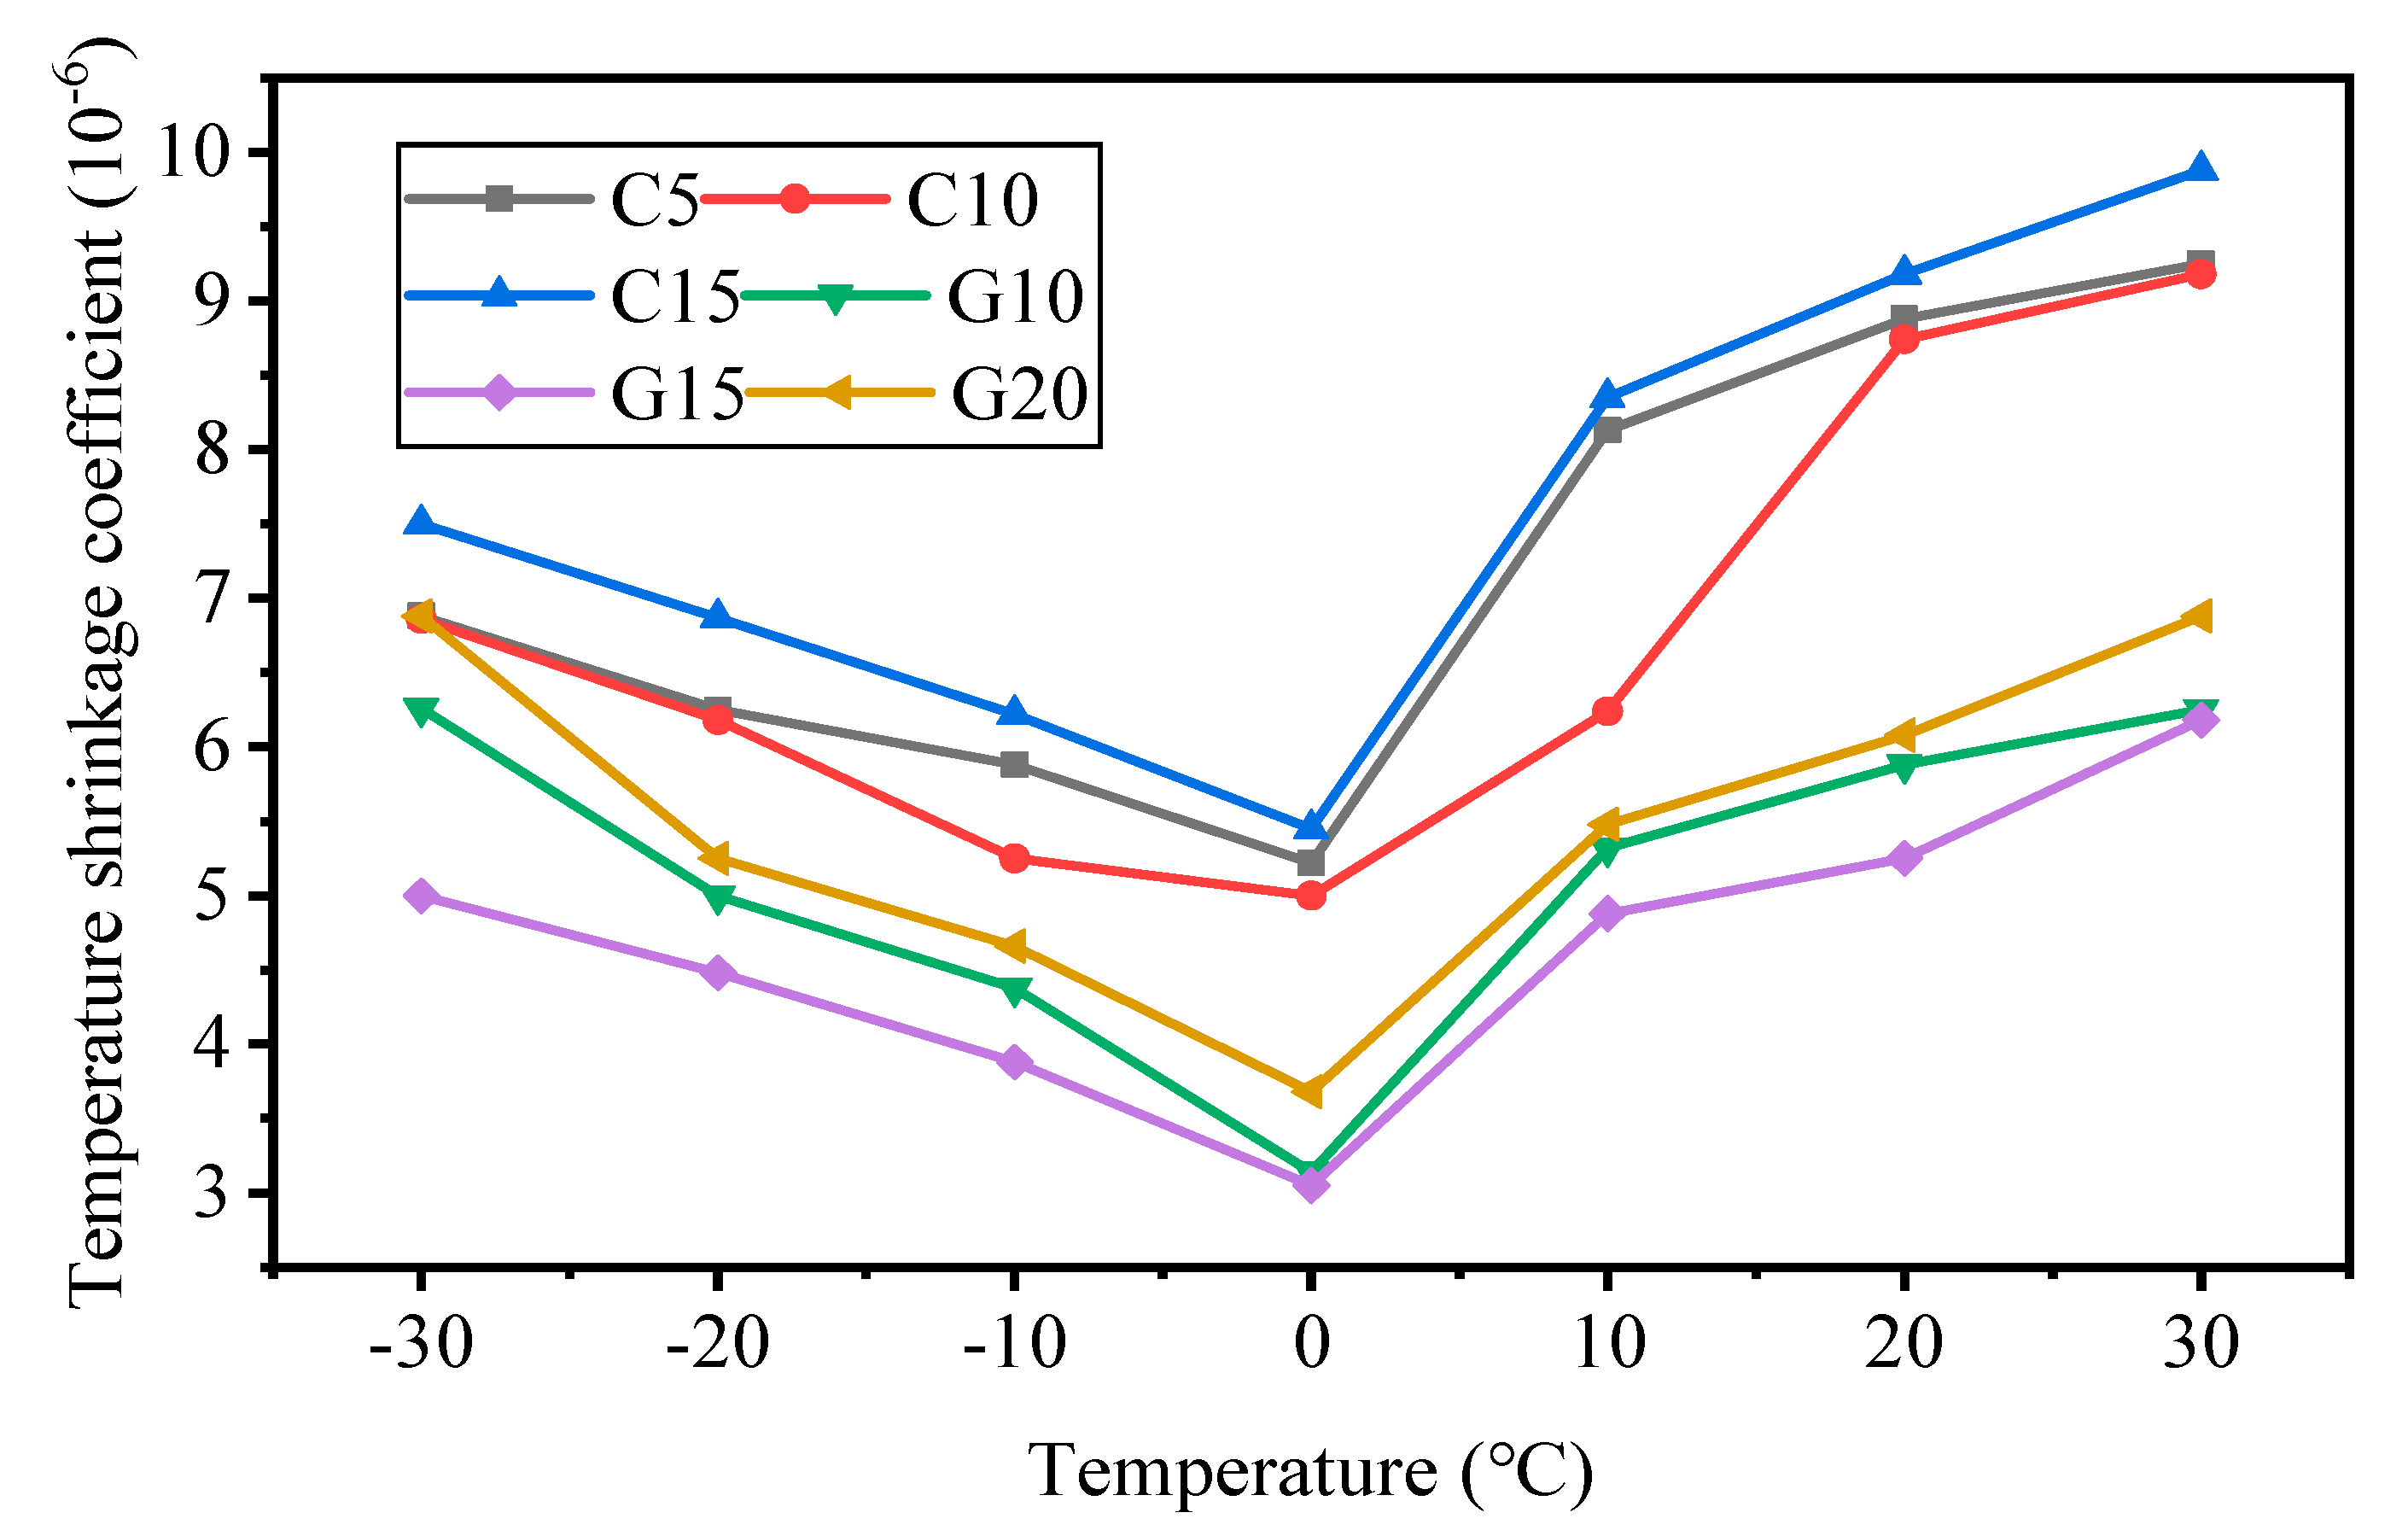
3.6. Temperature Shrinkage Test

The temperature shrinkage test referred to Chinese National Standard JTG E51-2019. Specimens of 40 mm × 40 mm × 160 mm were made and kept in a standard curing room with a temperature of 20 ± 2 °C and a relative humidity of more than 95% for 7 days. Then, they were placed in an electric blowing dry oven with a temperature of 105 °C for 10–12 h. Afterwards, they were set in a dry and ventilated environment to cool to room temperature, and the initial length value was measured. At the beginning of the test, the temperature was 30 °C; it was reduced by 10 °C at each step. Then, the sample was kept at each temperature for 4 h. The data were recorded at each time-step until the temperature reached −30 °C.

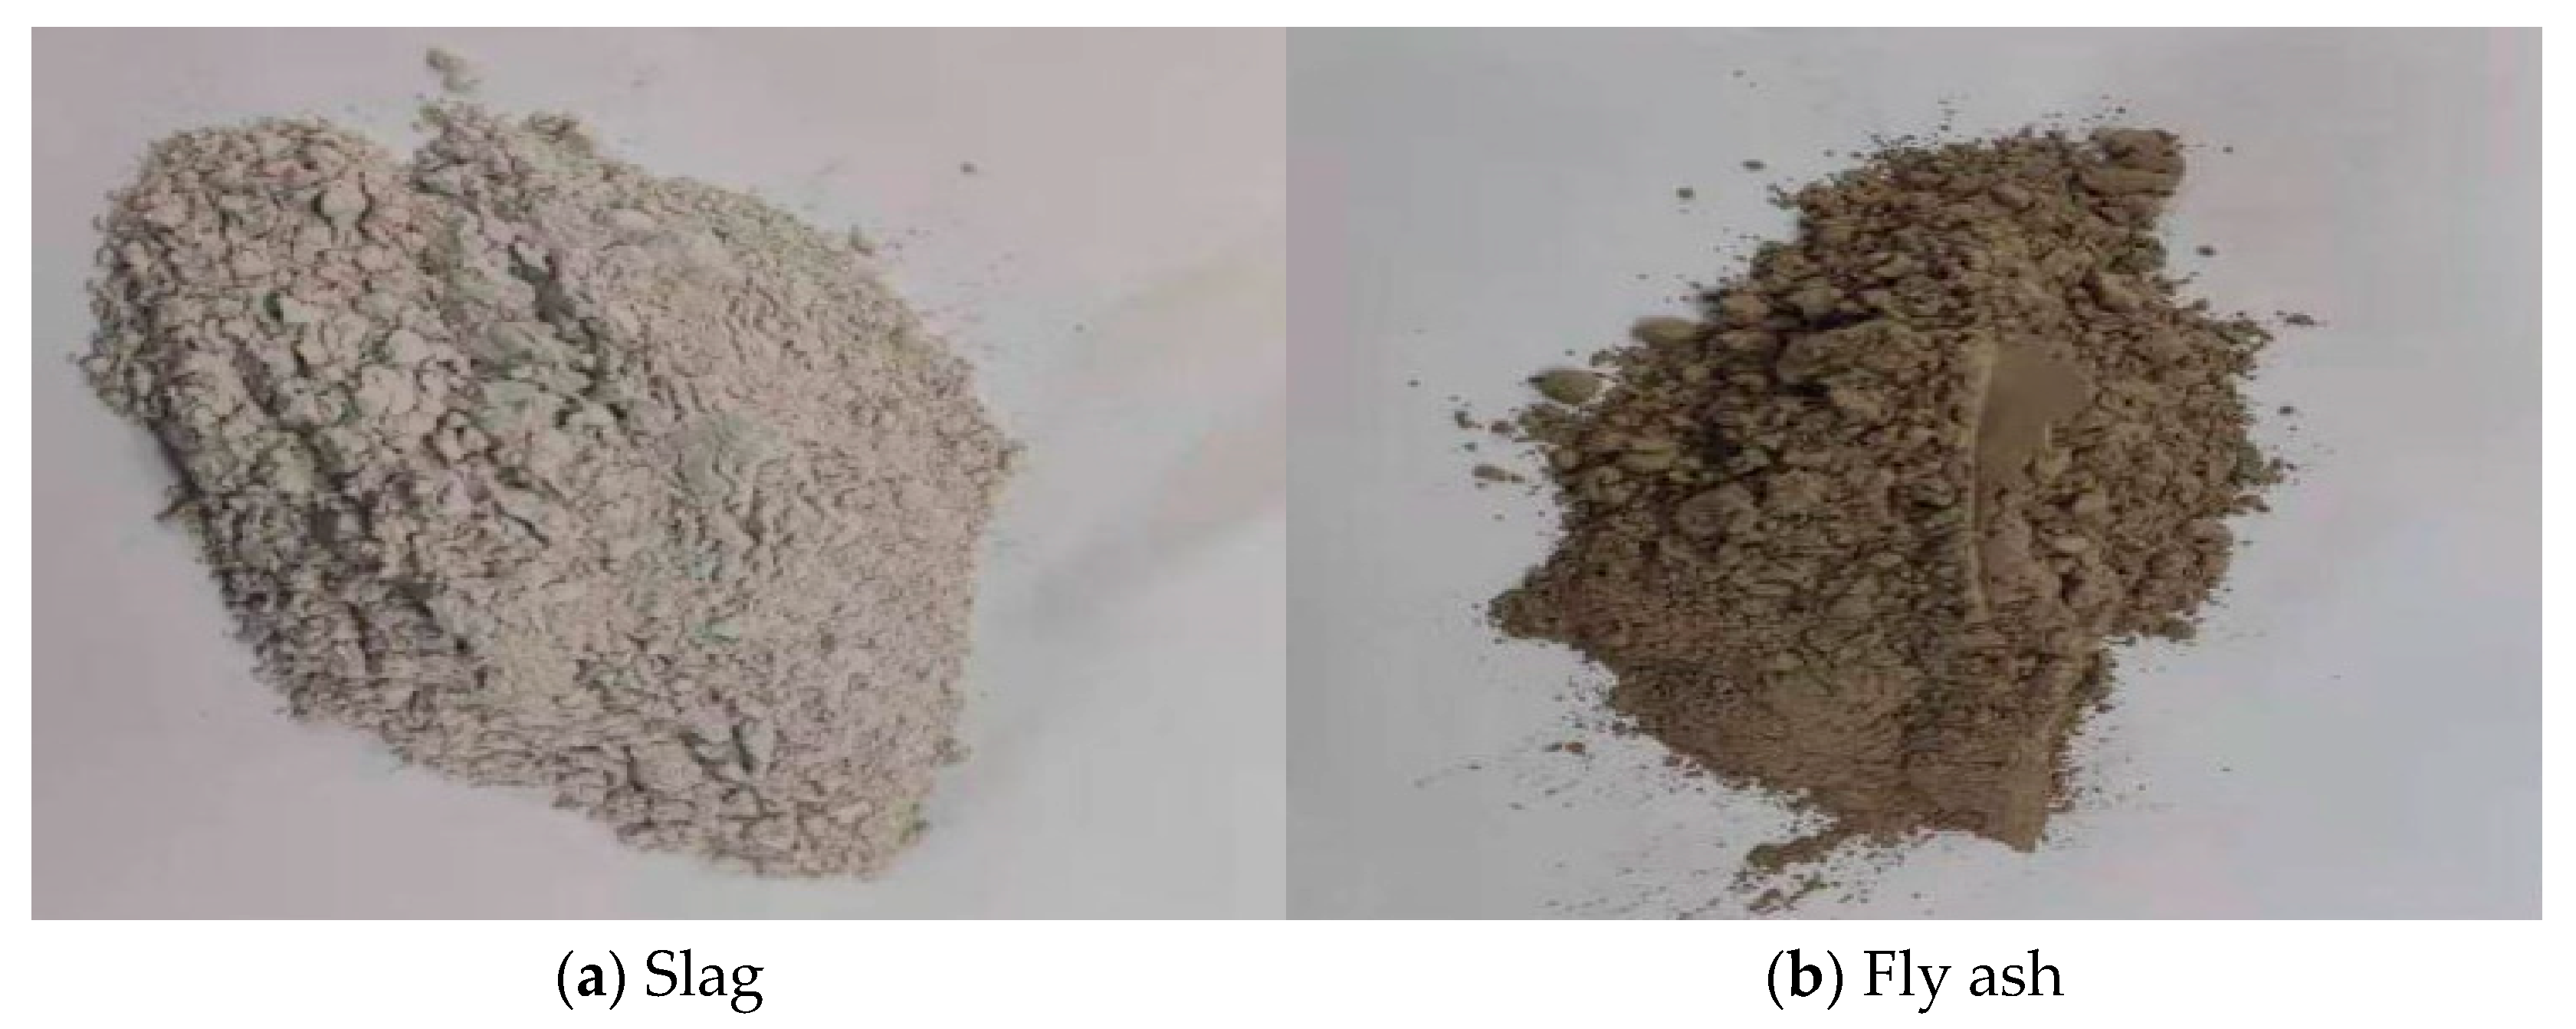
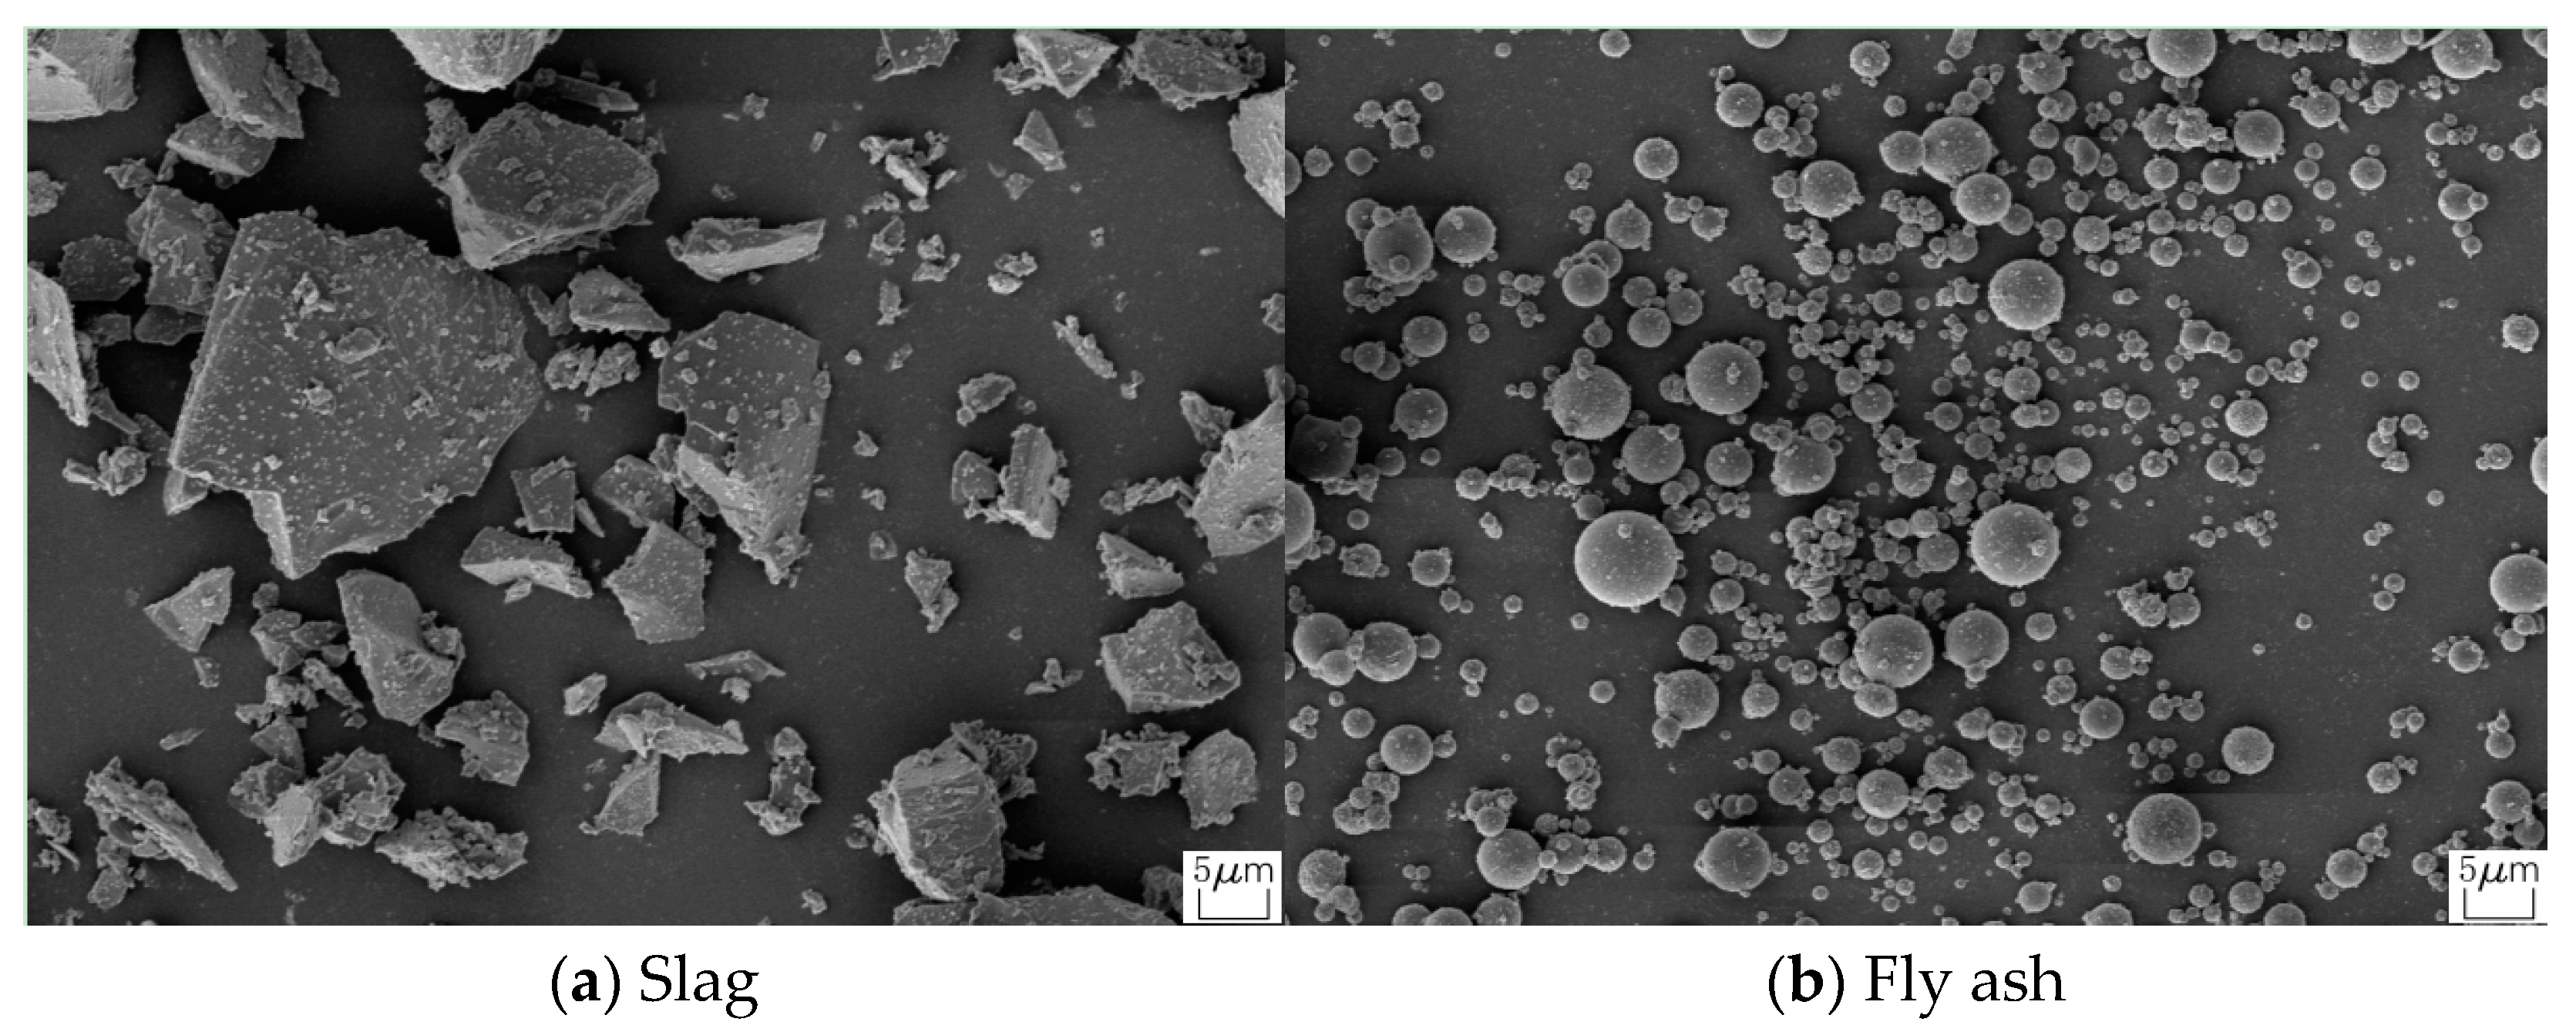
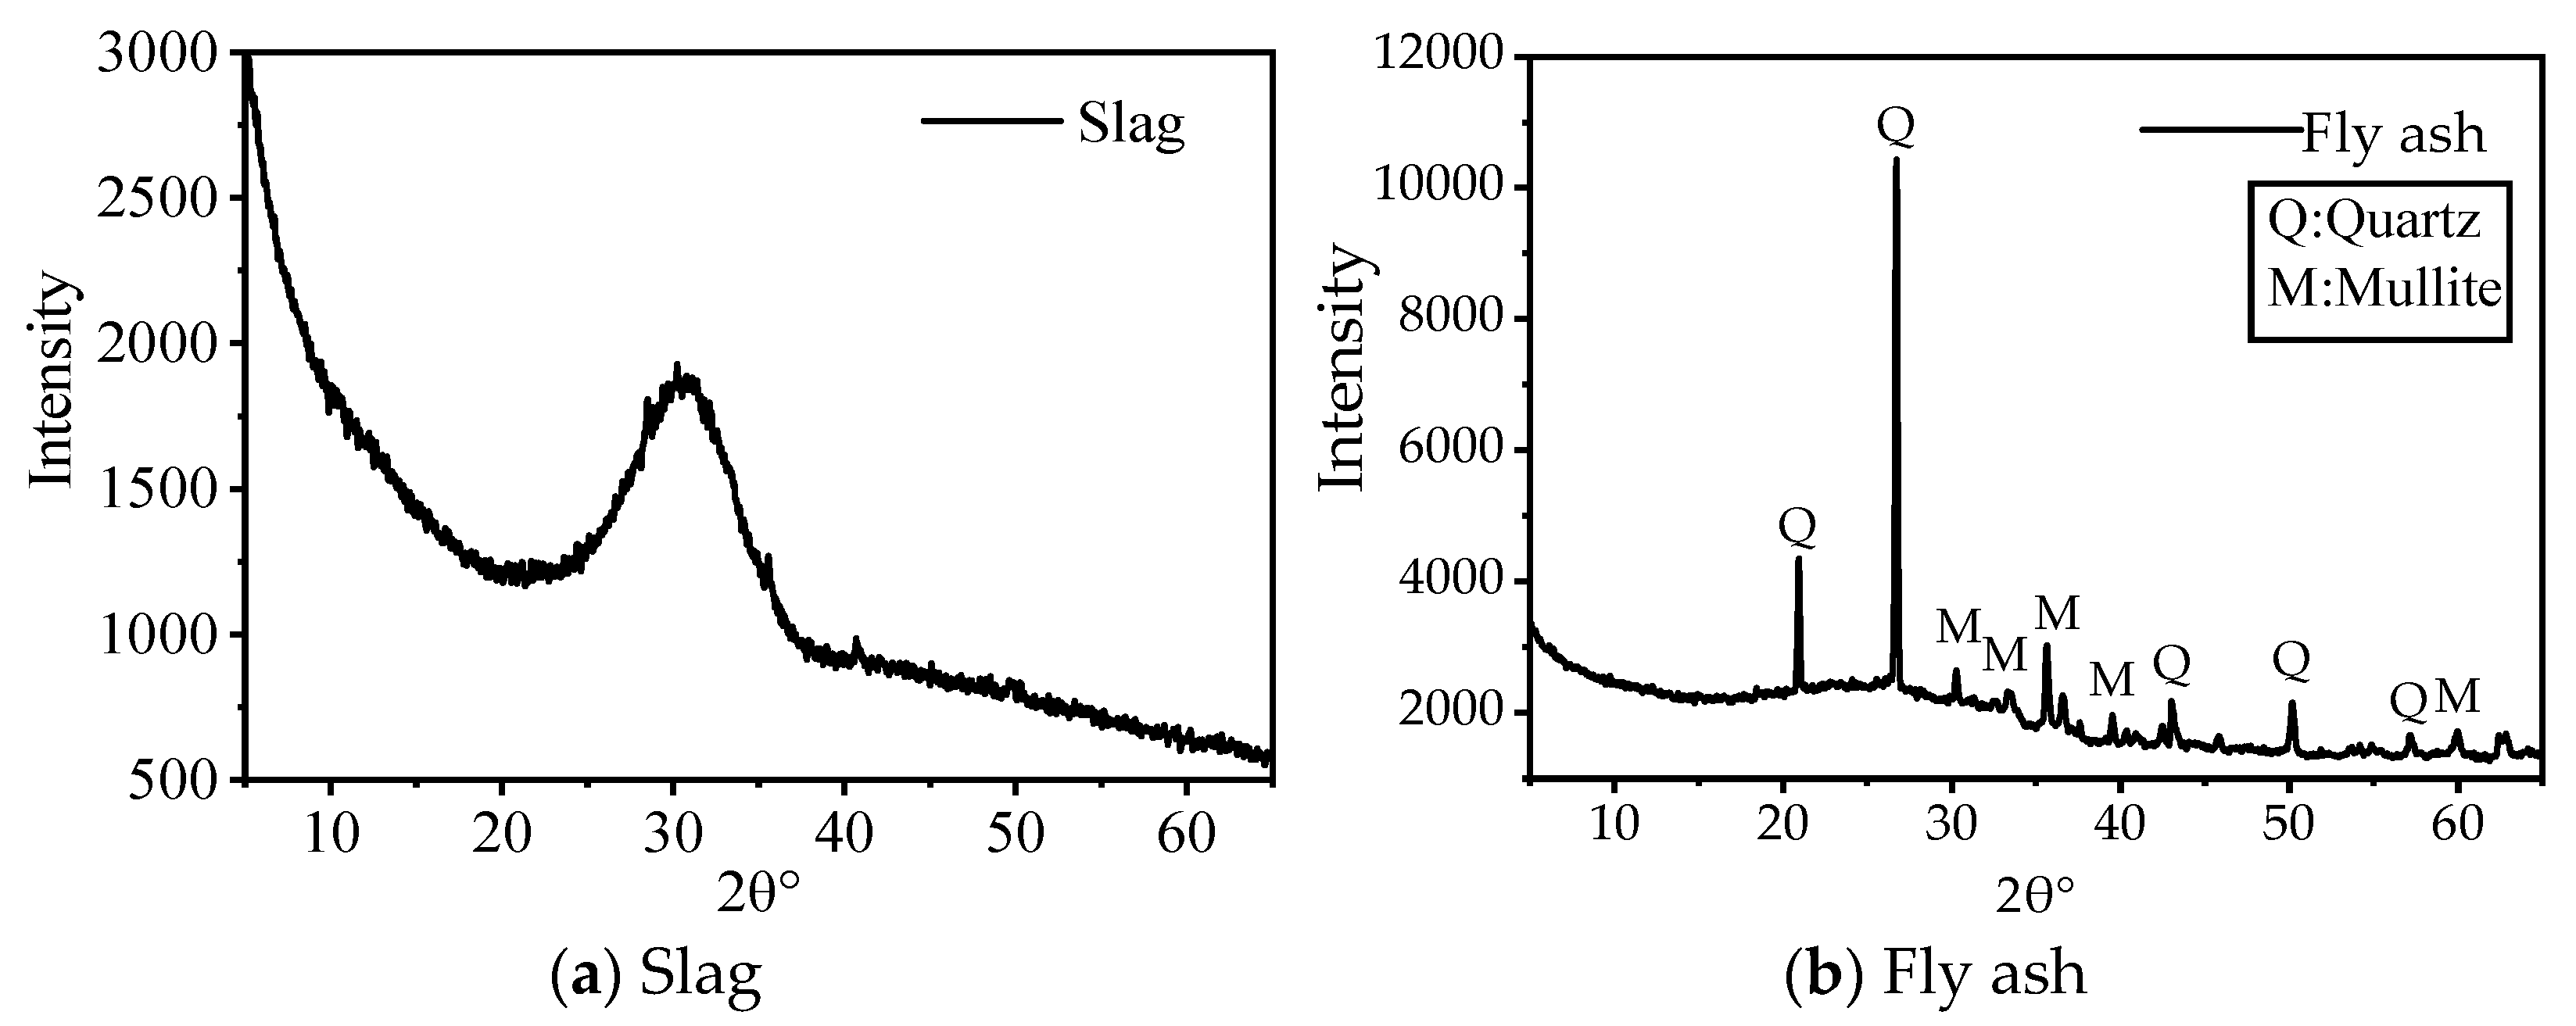
3.7. Microstructural Analysis

The characterization of fly ash and slag was carried out using SEM and XRD analysis. The powder samples were subjected to a high-resolution field emission scanning electron microscope device for SEM analysis. The powder samples were also subjected to XRD analysis to obtain microstructural information on amorphous and crystalline phases. The XRD scans were performed at 0–60° 2θ using a D/MAX-220PC device. The XRD analysis was carried out by scanning at 5° 2θ per min and at steps of 0.04° 2θ. The voltage and current of the XRD analysis were set to 40 kV and 20 mA, respectively.

4. Results and Discussion

4.1. Setting Time of Slag–Fly Ash Geopolymer

The setting time of cementing materials is affected by many factors. In this study, the influences on setting time were studied from three aspects: the mole ratio of elements, the mass ratio of slag to fly ash, and the modulus of sodium silicate (Na2SiO3). The influence of different Si/Al and Na/Al ratios on the setting time is shown in Table 4. When the Si/Al ratio was greater than 2.6, the initial setting time was 13 h, which did not meet the hardening time requirements of pavement construction. With the increase in the Si/Al ratio, the setting time was significantly prolonged. The setting time was prolonged when the Na/Al ratio was decreased. When the Si/Al ratio was 2.5 and the Na/Al ratio was 0.8, the initial setting time was 3 h, and the final setting time was 6 h. When the Si/Al ratio was 2.6 and the Na/Al ratio was 0.8, the initial setting time was 3.5 h, and the final setting time was 6.25 h. Therefore, these two mixes met the requirements of pavement construction.
Besides the mole ratio of elements, the effects of the mass ratio of slag to fly ash and the modulus of sodium silicate (Na2SiO3) on the setting time were also explored. The cementing material ratio was further designed under the premise of keeping the Si/Al ratio at 2.5 and the Na/Al ratio as 1.0 unchanged (Table 4). It was shown that by increasing the sodium silicate modulus, the setting time of the geopolymer was significantly shortened. On the other hand, by increasing the fly ash content, the mass ratio of slag to fly ash decreased gradually and the setting time increased.

4.2. Unconfined Compressive Strength of Slag–Fly Ash Geopolymer

The unconfined compressive strength of the paste specimen is shown in Figure 6. When the Na/Al ratio was 1.0, increasing the Si/Al ratio decreased the unconfined compressive strength of the slag–fly ash geopolymer. For an Si/Al ratio of 2.5 and Na/Al ratio of 1.0, the UCS of slag–fly ash geopolymer was the highest, and the strength after curing times of 7 and 28 days was 14 MPa and 27 MPa, respectively. With the gradual decrease in the Na/Al ratio, the UCS of slag–fly ash geopolymer also decreased. When the Na/Al ratio was 0.7, the compressive strength dropped sharply. This was because of the lower concentration of NaOH and Na2SiO3. All of that resulted in a slow gel formation in early geopolymerization and a decreased strength of the paste.

4.3. Unconfined Compressive Strength of Solidified Aeolian Sand Samples

Figure 7 shows the change in the unconfined compressive strength of solidified aeolian sand (stabilized by cement (denoted as C) or geopolymer (denoted as C)) with curing time. Due to the increase in content of cementing materials (from 5% to 15%), the chemical reaction was promoted to produce more gel-like materials, which significantly improved the strength. The improvement of solidified aeolian sand strength was related to chemical reactions (hydration or geopolymerization) in a solidified mechanism. With the extension of the curing age, the reaction degree was increased, and more gel materials were produced. The new skeleton was formed to support the aeolian sand body, so that the strength of aeolian sand as the primary material of the road base was constantly improved.

4.4. California Bearing Ratio (CBR)

CBR tests were carried out in three groups of aeolian sand samples. The relationship between unit pressure and penetration is shown in Figure 8. The CBR value of untreated aeolian sand obtained from laboratory testing was 4%, which did not meet the requirements of the general specifications of the base course (≥50%). The CBR of aeolian sand with 10% cement (denoted as C10) and 15% of slag–fly ash geopolymer (denoted as G15) was 133% and 112%, respectively, which was enough to meet the requirements of the specification. The observations showed that the bearing capacity of aeolian sand had significantly improved with the addition of cementing materials.

4.5. Resistance Temperature Shrinkage

The temperature shrinkage coefficient of typical samples varied with temperature, as shown in Figure 9. With a rising temperature, the temperature shrinkage coefficient decreased and then increased. The temperature shrinkage coefficient was lowest at 0 °C. The reason for this is that there was some uncrystallized free water in the solidified aeolian sand. These free waters expanded in the crystallization process and formed a specific constraint on the shrinkage deformation. With the increase in temperature, the temperature shrinkage coefficient increased after the loss of free water. When the temperature dropped below 0 °C, the mixture started to shrink continuously with the continuous decrease in temperature. As a result, the temperature shrinkage coefficient increased. The small temperature shrinkage coefficient was associated with the high shrinkage resistance of solidified aeolian sand. It can be seen from Figure 9 that the cementing material content significantly influenced the temperature shrinkage coefficient of solidified aeolian sand. When the cement content was low, the temperature shrinkage coefficient decreased with the increase in cement content. Aeolian sand mixed with slag–fly ash geopolymer had a similar tendency. The reason for this is that when the binder content was low, its content increased, and the reaction products increased. The formed gels filled in space (inside mixes), and the interaction between particles was strengthened, which restrained the shrinkage of the mixture caused by the temperature change. However, when the binder content was relatively high (20%), although the internal space continued to reduce, which limited the shrinkage due to particle movement, the shrinkage of largely increased gel productions dominated the macroscopic performance of materials. As the shrinkage of the matrix was much higher than the sand particles, the stabilized sand with 20% binder content had a higher temperature shrinkage coefficient than that of mixes with low binder content (5% and 10%). Therefore, the appropriate content of cementing materials should be selected to improve the mixture’s temperature shrinkage resistance. Excessively high or low content should be avoided. It is evident from Figure 9 that the temperature shrinkage resistance of aeolian sand solidified with a slag–fly ash geopolymer was higher than that of cement. This was because the volumetric stability of geopolymer was higher than that of OPC paste.

4.6. Road Base Performance Optimization

In this investigation, an optimization mix in which aeolian sand was partially replaced by gravel was prepared and tested. The density of gravel was 2.5 g/cm3. The reason why the gravel partially replaced the aeolian sand is that the addition of gravel transforms the poorly graded aeolian sand into a well-graded material and can meet the pavement strength requirements while reducing the content of cementitious materials. In addition, the rebound modulus is also an important index used to evaluate the road base material. When the base course thickness was 20 cm, the rebound modulus of semi-rigid base course material should be controlled between 1100 and 1700 MPa. The gravel partially replaced the aeolian sand, which can increased the rebound modulus from 800 MPa to 1500 MPa, thus, meeting the engineering requirements. For the optimization mix, the amount of cementing material, gravel, and aeolian sand was 8%, 55% and 37%, respectively. Aeolian sand and gravel were used as the primary materials of the mix so the cost could be minimized. The relationship between moisture content and dry density is shown in Figure 10. Looking at the figure, we observed that the optimal moisture content of the solidified material was 5%, and the corresponding maximum dry density was 2.21 g/cm3. From the compaction test, it can be seen that the optimum water content of the mixture was reduced from 17% to 5% because the gravel was partially used to replace the aeolian sand. When the proportion of fine aggregate was reduced, the specific surface area of the mixture decreased, leading to the reduction of water absorbed on the surface. As a result, the optimum water content was reduced during compaction. To prepare the optimization mix, the same geopolymer paste (Si2.5N0.8) was prepared and poured into the mixture at the predetermined w/s ratio (0.46). Then, extra water was added to the mixture to meet the OWC.
Considering the strength requirement and the reflection crack of an asphalt surface caused by cracking of the semi-rigid base, the UCS of the base material for 7 days should be controlled between 4 MPa and 6 MPa [36]. As shown in Figure 7, the stabilized sands with 15% cement and 20% slag–fly ash geopolymer had a strength much higher than 6 MPa. Moreover, the composition of aeolian sand is typically poorly graded, and the high content of binders results in a high cost. Based on this research, aeolian sand, as a single primary material, was poorly graded and increased the use of cementing materials. Therefore, the aeolian sand was partially replaced with gravel in the optimization mix. A comparison of properties between the optimization mix and the stabilized sand with 20% geopolymer is summarized in Table 5. It can be seen from this table that the maximum dry density of stabilized aeolian sand was 1.693 g/cm3, which increased to 2.21 g/cm3 after the gravel was added. The lower the density was, the lower the rebound modulus. A low rebound modulus would lead to high deformation of the materials. Partially replacing aeolian sand with gravel improved the gradation of the road base materials and reduced the deformation. After curing for 6 days and soaking in water for 1 day, the 7-day UCS of the optimization mix was measured to be 4.5 MPa, which met the requirements of the specification. The binder content in the optimization mix was reduced from 20% to 8%. As a result, the cost and carbon emission of the optimization mix was reduced by approximately 60% compared to the stabilized sand.

5. Cost and Carbon Footprint

5.1. Cost

According to the above test scheme and test results, the cost of cement-stabilized aeolian sand and slag–fly ash geopolymer-stabilized ones were compared. The cost of cementing materials per cubic meter of stabilized aeolian sand material is shown in Table 6. The cost per cubic meter of stabilized aeolian sand per unit strength is compared in Table 7. Whether it was cement or slag–fly ash geopolymer, the cost of unit strength of the mixture decreased with the increase in content, so it can be seen that the rate of strength growth was higher than the content. The stabilization cost of the slag–fly ash geopolymer was lower than that of cement. The higher the strength was, the more pronounced was the cost advantage of the geopolymer.

5.2. Carbon Footprint

Carbon emissions mainly include greenhouse gas emissions caused by individual activities, including producing raw materials and organizational activities. The carbon emission factors of cementing materials are shown in Table 8. The carbon emissions of cementing materials per cubic meter of stabilized aeolian sand material are shown in Table 9. Regardless of whether it was the cement or the slag–fly ash geopolymer, with an increase in the binder content, the carbon emissions generated by reaching the unit strength of the mixture decreased. This indicates that with the rise of the content of cementing materials, the rate of strength growth was higher than the rate of carbon emission growth. As a stabilizer, the carbon emissions generated by slag–fly ash geopolymer were much lower than cement. On the other hand, the higher the strength of the mixture, the more pronounced the environmental performance advantage of the slag–fly ash geopolymer.

6. Conclusions

Given the mechanical properties, road performance, cost, and carbon emission of slag–fly ash geopolymer-stabilized aeolian sand, a series of tests and theoretical analysis were carried out in this study. The main conclusions are as follows.
(1)
With the increase in Si/Al, the setting time was significantly prolonged. When Si/Al was increased from 2.5 to 2.9, the initial setting time was extended from 1 h to 26 h, and the final setting time was extended from 2 h to 35 h. When Na/Al was reduced from 1.0 to 0.7, the initial setting time was extended from 1 h to 6.5 h and the final setting time was extended from 2 h to 10 h. In addition, increasing the proportion of fly ash or the modulus of sodium silicate could also prolong the setting time.
(2)
Both Si/Al and Na/Al ratios significantly influenced the UCS of the slag–fly ash geopolymer. When Si/Al decreased from 2.9 to 2.5, the 7-day UCS of slag–fly ash geopolymer increased from 3 MPa to 14 MPa, and the 28-day UCS increased from 4 MPa to 27 MPa. When Na/Al rose from 0.7 to 1.0, the 7-day UCS of slag–fly ash geopolymer increased from 7 MPa to 14 MPa, and the 28-day UCS increased from 17 MPa to 27 MPa.
(3)
The slag–fly ash geopolymer could effectively improve the mechanical properties of solidified aeolian sand, and the properties increased significantly with the increase in curing age and geopolymer content. When the content of geopolymer rose from 10% to 20%, the 7-day strength of solidified aeolian sand increased from 0.5 MPa to 6 MPa and the 28-day strength of solidified aeolian sand increased from 1.6 MPa to 9.5 MPa. The CBR of aeolian sand without a stabilizer was 4%. The CBR of sand with 10% cement and 15% geopolymer reached 133% and 112%, respectively.
(4)
The temperature shrinkage coefficient of solidified aeolian sand reached the lowest value at 0 °C. With the increase in the cementing agent content, the temperature shrinkage coefficient of solidified aeolian sand showed a trend of decreasing first and then increasing. This result revealed that the proper content of cementing agent could better improve the temperature shrinkage resistance of the solidified aeolian sand. As a cementing agent, the temperature shrinkage resistance of the slag–fly ash geopolymer was better than that of cement.
(5)
At a low strength level, the cost of geopolymer-stabilized sand is 19.93% less than that of cement-stabilized sand. At a high strength level, the cost of geopolymer-stabilized sand is 67.89% less than that of cement-stabilized sand. Regarding carbon emissions, geopolymer-stabilized sand had a much lower value than cement-stabilized sand. This was independent of the strength level.
(6)
Aeolian sand, as a single-road base material, needs a high content of cementing agent (15% cement and 20% slag–fly ash geopolymer) to obtain the required strength for the pavement base. Gravel replacing aeolian sand could not only improve the gradation of the base material but also increase the strength of the base material. When the replacement rate of gravel was 37% and the content of geopolymer was 8%, the 7-day strength of the base material reached 4.5 MPa, which meets the requirements for pavement construction.

Author Contributions

Investigation, Writing—original draft, Data curation, L.B.; Project administration, Conceptualization, Methodology, Resources, Validation, Funding acquisition, Z.Y. and Y.W.; Visualization, Writing—review & editing, M.A.; Supervision, Funding acquisition, Writing—review & editing, Z.P. All authors have read and agreed to the published version of the manuscript.

Funding

This research was funded by the National Nature Science Foundation of China (No. U20A20313), the Central Government Leading Local Science and Technology Development of Hebei (No. 226Z1502G) and the Natural Science Foundation of Hebei (No. E2021202172).

Data Availability Statement

Data are contained within the article.

Conflicts of Interest

The authors declare no conflict of interest.

References

  1. Rodrigue, J.-P. The Geography of Transport Systems; Routledge: London, UK, 2020. [Google Scholar]
  2. Jia, Z.L.; Yan, S.W.; Huo, Z.L. Laboratory tests on engineering properties of wind-blown sand. In Applied Mechanics and Materials; Trans Tech Publications Ltd.: Bäch, Switzerland, 2012; Volume 170–173, pp. 706–709. [Google Scholar]
  3. Arias-Trujillo, J.; Matías-Sanchez, A.; Cantero, B.; López-Querol, S. Effect of polymer emulsion on the bearing capacity of aeolian sand under extreme confinement conditions. Constr. Build. Mater. 2020, 236, 117473. [Google Scholar] [CrossRef]
  4. Xia, H.; Zhang, J.; Cai, J.; Pan, H.; She, X. Study on the bearing capacity and engineering performance of aeolian sand. Adv. Mater. Sci. Eng. 2020, 2020, 3426280. [Google Scholar] [CrossRef]
  5. Zheng, Z.; Du, S.; Taubenböck, H.; Zhang, X. Remote sensing techniques in the investigation of aeolian sand dunes: A review of recent advances. Remote Sens. Environ. 2022, 271, 112913. [Google Scholar] [CrossRef]
  6. Xin, J.; Liu, L.; Xu, L.; Wang, J.; Yang, P.; Qu, H. A preliminary study of aeolian sand-cement-modified gasification slag-paste backfill: Fluidity, microstructure, and leaching risks. Sci. Total Environ. 2022, 830, 154766. [Google Scholar] [CrossRef]
  7. Zheng, X.-J. Electrification of wind-blown sand: Recent advances and key issues. Eur. Phys. J. E 2013, 36, 138. [Google Scholar] [CrossRef]
  8. Padmakumar, G.; Srinivas, K.; Uday, K.; Iyer, K.; Pathak, P.; Keshava, S.; Singh, D. Characterization of aeolian sands from Indian desert. Eng. Geol. 2012, 139, 38–49. [Google Scholar] [CrossRef]
  9. Meng, Q. Research on Performance of Inorganic Binder to Stabilize Aeolian Sand for Road Use. Master’s Thesis, Chang’an University, Xi’an, China, 2003. [Google Scholar]
  10. Lopez-Querol, S.; Arias-Trujillo, J.; Gm-Elipe, M.; Sánchez, A.M.; Cantero, B. Improvement of the bearing capacity of confined and unconfined cement-stabilized aeolian sand. Constr. Build. Mater. 2017, 153, 374–384. [Google Scholar] [CrossRef]
  11. Li, G.; Shen, X.; Yuan, Q.; Zou, Y.; Xiong, L. Study on the Activity of Aeolian Sand Powder and Alkali Excitation Modification. JOM 2018, 71, 984–994. [Google Scholar] [CrossRef]
  12. Hazirbaba, K.; Shukla, S.K. Stabilization of aeolian sand with combined use of geofiber and synthetic fluid. Cogent Eng. 2019, 6, 1589895. [Google Scholar] [CrossRef]
  13. Wu, L.; Miao, L.; Sun, X.; Wang, H. Enzyme-Induced Carbonate Precipitation Combined with Polyvinyl Alcohol to Solidify Aeolian Sand. J. Mater. Civ. Eng. 2021, 33, 04021373. [Google Scholar] [CrossRef]
  14. Peng, D.; Wang, Y.; Liu, X.; Tang, B.; Zhang, N. Preparation, characterization, and application of an eco-friendly sand-fixing material largely utilizing coal-based solid waste. J. Hazard. Mater. 2019, 373, 294–302. [Google Scholar] [CrossRef]
  15. Duo, L.; Kan-Liang, T.; Hui-Li, Z.; Yu-Yao, W.; Kang-Yi, N.; Shi-Can, Z. Experimental investigation of solidifying desert aeolian sand using microbially induced calcite precipitation. Constr. Build. Mater. 2018, 172, 251–262. [Google Scholar] [CrossRef]
  16. Li, X.; Qin, D.; Hu, Y.; Ahmad, W.; Ahmad, A.; Aslam, F.; Joyklad, P. A systematic review of waste materials in cement-based composites for construction applications. J. Build. Eng. 2022, 45, 103447. [Google Scholar] [CrossRef]
  17. Wang, D.; Xiao, J.; Duan, Z. Duan, Strategies to accelerate CO2 sequestration of cement-based materials and their application prospects. Constr. Build. Mater. 2022, 314, 125646. [Google Scholar] [CrossRef]
  18. You, X.; Hu, X.; He, P.; Liu, J.; Shi, C. A review on the modelling of carbonation of hardened and fresh cement-based materials. Cem. Concr. Compos. 2022, 125, 104315. [Google Scholar] [CrossRef]
  19. Sharmilan, S.; Stang, H.; Michel, A. A multi-species reactive transport model based on ion-solid phase interaction for saturated cement-based materials. Cem. Concr. Res. 2022, 159, 106861. [Google Scholar] [CrossRef]
  20. Tawfik, A.; Curosu, I.; Alsous, G.; Mechtcherine, V. A testing device to investigate the properties of strain-hardening, cement-based composites (SHCC) under impact shear loading. Int. J. Impact Eng. 2022, 167, 104280. [Google Scholar] [CrossRef]
  21. Wu, T.; Ng, S.T.; Chen, J. Deciphering the CO2 emissions and emission intensity of cement sector in China through decomposition analysis. J. Clean. Prod. 2022, 352, 131627. [Google Scholar] [CrossRef]
  22. Nie, S.; Zhou, J.; Yang, F.; Lan, M.; Li, J.; Zhang, Z.; Chen, Z.; Xu, M.; Li, H.; Sanjayan, J.G. Analysis of theoretical carbon dioxide emissions from cement production: Methodology and application. J. Clean. Prod. 2022, 334, 130270. [Google Scholar] [CrossRef]
  23. Song, T.-Y.; Qu, X.-Y.; Pan, Z.; Xiang, K.; Zhou, H. Fire Resistance Tests on Concrete-Filled Steel Tubular Columns with Geopolymeric Recycled Aggregate. Fire Technol. 2022, 58, 2727–2754. [Google Scholar] [CrossRef]
  24. Wang, F.; Sun, X.; Tao, Z.; Pan, Z. Effect of silica fume on compressive strength of ultra-high-performance concrete made of calcium aluminate cement/fly ash based geopolymer. J. Build. Eng. 2022, 62, 105398. [Google Scholar] [CrossRef]
  25. Ahmed, H.U.; Mohammed, A.A.; Mohammed, A.S. The role of nanomaterials in geopolymer concrete composites: A state-of-the-art review. J. Build. Eng. 2022, 49, 104062. [Google Scholar] [CrossRef]
  26. Luo, S.; Zhao, M.; Jiang, Z.; Liu, S.; Yang, L.; Mao, Y.; Pan, C. Microwave preparation and carbonation properties of low-carbon cement. Constr. Build. Mater. 2022, 320, 126239. [Google Scholar] [CrossRef]
  27. Lu, N.; Ran, X.; Pan, Z.; Korayem, A.H. Use of Municipal Solid Waste Incineration Fly Ash in Geopolymer Masonry Mortar Manufacturing. Materials 2022, 15, 8689. [Google Scholar] [CrossRef]
  28. Pan, Z.; Tao, Z.; Cao, Y.-F.; George, L.; Wuhrer, R. High-temperature performance of alkali-activated binders of fly ash and calcium aluminate. Ceram. Int. 2023; in press. [Google Scholar] [CrossRef]
  29. Turner, L.K.; Collins, F.G. Carbon dioxide equivalent (CO2-e) emissions: A comparison between geopolymer and OPC cement concrete. Constr. Build. Mater. 2013, 43, 125–130. [Google Scholar] [CrossRef]
  30. McLellan, B.C.; Williams, R.P.; Lay, J.; van Riessen, A.; Corder, G.D. Costs and carbon emissions for geopolymer pastes in comparison to ordinary portland cement. J. Clean. Prod. 2011, 19, 1080–1090. [Google Scholar] [CrossRef] [Green Version]
  31. Mohammadinia, A.; Arulrajah, A.; Sanjayan, J.; Disfani, M.M.; Bo, M.W.; Darmawan, S. Stabilization of demolition materials for pavement base/subbase applications using fly ash and slag geopolymers. J. Mater. Civ. Eng. 2016, 28, 04016033. [Google Scholar] [CrossRef]
  32. Phummiphan, I.; Horpibulsuk, S.; Rachan, R.; Arulrajah, A.; Shen, S.-L.; Chindaprasirt, P. High calcium fly ash geopolymer stabilized lateritic soil and granulated blast furnace slag blends as a pavement base material. J. Hazard. Mater. 2018, 341, 257–267. [Google Scholar] [CrossRef]
  33. Phetchuay, C.; Horpibulsuk, S.; Arulrajah, A. Strength development in soft marine clay stabilized by fly ash and calcium carbide residue based geopolymer. Appl. Clay Sci. 2016, 127, 134–142. [Google Scholar] [CrossRef]
  34. Zhang, D.-W.; Wang, D.-M.; Lin, X.-Q.; Zhang, T. The study of the structure rebuilding and yield stress of 3D printing geopolymer pastes. Constr. Build. Mater. 2018, 184, 575–580. [Google Scholar] [CrossRef]
  35. Shen, W.; Zhou, M.; Ma, W.; Hu, J.; Cai, Z. Investigation on the application of steel slag–fly ash–phosphogypsum solidified material as road base material. J. Hazard. Mater. 2009, 164, 99–104. [Google Scholar] [CrossRef] [PubMed]
  36. JTG/TF20-2015; Technical Rules for Construction of Highway Pavement Base, Chinese National Standard. Ministry of Transport of the People’s Republic of China: Beijing, China, 2015.
  37. GB/T50123-2019; Standard for Soil Test Method, Chinese National Standard. Ministry of Housing and Urban-Rural Development of China: Beijing, China, 2019.
Figure 1. Particle grading curve.
Minerals 13 00453 g001
Figure 2. Slag and fly ash samples.
Minerals 13 00453 g002
Figure 3. SEM of slag and fly ash.
Minerals 13 00453 g003
Figure 4. XRD of slag and fly ash.
Minerals 13 00453 g004
Figure 5. Moisture content and dry density curve of aeolian sand.
Minerals 13 00453 g005
Figure 6. Effects of different Si/Al and Na/Al ratios on unconfined compressive strength of slag–fly ash geopolymer.
Minerals 13 00453 g006
Figure 7. UCS values of test samples.
Minerals 13 00453 g007
Figure 8. Relationship between unit pressure and penetration.
Minerals 13 00453 g008
Figure 9. Variation of temperature shrinkage coefficient of typical sample with temperature.
Minerals 13 00453 g009
Figure 10. Moisture content and dry density curve of partially replaced aeolian sand with graded gravel.
Minerals 13 00453 g010
Table 1. Main chemical composition and ignition loss of slag, fly ash, and cement.
Raw MaterialsChemical Composition and Ignition Loss (wt %)
SiO2Al2O3CaOFe2O3MgOK2ONa2OMnO2TiO2Ignition Loss
Slag32.2111.1638.4551.0210.280.811.310.540.870.8
Fly ash49.6118.099.5710.555.202.522.080.230.617.2
Cement21.604.1364.444.571.060.650.114.2
Table 2. Mix compositions of geopolymer binders.
SampleSlagFly AshNa2SiO3NaOHH2O Si/AlNa/Al
Si2.5N1.00.50.50.0430.06550.52.51
Si2.6N1.00.50.50.07850.05350.52.61
Si2.7N1.00.50.50.1130.03250.52.71
Si2.8N1.00.50.50.1480.010.52.81
Si2.9N1.00.50.50.1830.0020.52.91
Si2.5N0.90.50.50.0430.05550.52.50.9
Si2.6N0.90.50.50.07850.04850.52.60.9
Si2.5N0.80.50.50.0430.03750.52.50.8
Si2.6N0.80.50.50.07850.03950.52.60.8
Si2.5N0.70.50.50.0430.03250.52.50.7
Si2.6N0.70.50.50.07850.02850.52.60.7
S0.5F0.5 (2.4)0.50.50.0430.06550.52.51
S0.5F0.5 (3.0)0.50.50.03870.06880.52.51
S0.45F0.55 (2.4)0.450.550.0460.06570.52.51
S0.45F0.55 (3.0)0.450.550.04140.07050.52.51
S0.4F0.6 (2.4)0.40.60.0490.0660.52.51
S0.4F0.6 (3.0)0.40.60.04410.07220.52.51
S0.35F0.65 (2.4)0.350.650.0520.06620.52.51
S0.35F0.65 (3.0)0.350.650.04680.07350.50.51
Note: the sample naming method is explained using S0.5F0.5 (2.4) as an example, which means that the ratio of slag and fly ash is 0.5:0.5, and the modulus of sodium silicate is 2.4. In the current research, Si2.5N0.8 was used as a geopolymer to stabilize aeolian sand.
Table 3. Mix compositions of solidified aeolian sand samples.
SampleAeolian Sand (g)Cement (g)Slag (g)Fly Ash (g)NaOH (g)Na2SiO3 (g)Water for Cement/Geopolymer (g)Extra Water
(g)
C595050 25145
C10900100 50120
C15850150 7595
G10900 50503.754.350120
G15850 75755.6256.47595
G20800 1001007.58.610070
Table 4. Setting time.
SampleSi/AlNa/AlInitial Setting TimeFinal Setting Time
Si2.5N1.02.511 h2 h
Si2.6N1.02.611.25 h3 h
Si2.7N1.02.7113 h18 h
Si2.8N1.02.8119 h26 h
Si2.9N1.02.9126 h35 h
Si2.5N0.92.50.91.25 h3.5 h
Si2.6N0.92.60.92 h3.75 h
Si2.5N0.82.50.83 h6 h
Si2.6N0.82.60.83.5 h6.25 h
Si2.5N0.72.50.76.5 h10 h
Si2.6N0.72.60.77.25 h11 h
S0.5F0.5 (2.4)2.511 h2 h
S0.5F0.5 (3.0)2.510.5 h1.25 h
S0.45F0.55 (2.4)2.512.3 h4 h
S0.45F0.55 (3.0)2.511.5 h2.6 h
S0.4F0.6 (2.4)2.512.6 h4.75 h
S0.4F0.6 (3.0)2.512.3 h3.5 h
S0.35F0.65 (2.4)2.513 h5.2 h
S0.35F0.65 (3.0)2.512.6 h3.8 h
Table 5. Performance index of pavement base material.
Material CompositionReplacement Rate of Graded Gravel (%)Geopolymer Content (%)Maximum Dry Density (g/cm3)Optimal Moisture Content (%)Strength (MPa)Cost ($/(t·MPa))Carbon Emission (kg CO2-e/(t∙MPa))
Aeolian sand0201.693175.85.7484.14
Partially replaced aeolian sand with graded gravel3782.2154.52.2991.656
Table 6. Cost of cementing materials per cubic meter of stabilized aeolian sand.
SampleCost of Cementing Materials ($/m3)
CementSlagFly AshNaOHNa2SiO3WaterTotal Cost
73.998.886.45266.3873.990.61/
C56.2600000.176.43
C1012.5300000.1712.7
C1518.7900000.1718.96
G1000.690.511.560.50.173.43
G1501.030.762.340.750.175.05
G2001.381.023.1210.176.69
Table 7. Cost of cementing materials per cubic meter of stabilized aeolian sand reaching unit strength.
SampleMaterial Cost/$UCS/MPaMaterial Cost per Unit Strength/$/(m3·MPa)
C56.432.13.06
C1012.74.72.7
C1518.968.72.18
G103.431.42.45
G155.055.10.99
G206.699.60.7
Table 8. Emission factors of raw materials.
Raw MaterialsEmission Factor (kg CO2−e/kg)Reference
Cement0.86McLellan et al. (2011) [30]
Fly ash0.007McLellan et al. (2011) [30]
Slag0.007McLellan et al. (2011) [30]
NaOH1.915Turner and Collins (2013) [29]
Na2SiO31.514Turner and Collins (2013) [29]
Table 9. Carbon emissions of cementing materials per cubic meter of stabilized aeolian sand.
SampleCO2−e (kg CO2−e/m3)
CementSlagFly AshNaOHNa2SiO3Sum
C572.8000072.8
C10145.60000145.6
C15218.40000218.4
G1000.550.5511.2510.222.55
G1500.8250.82516.87515.333.825
G2001.11.122.520.445.1
Disclaimer/Publisher’s Note: The statements, opinions and data contained in all publications are solely those of the individual author(s) and contributor(s) and not of MDPI and/or the editor(s). MDPI and/or the editor(s) disclaim responsibility for any injury to people or property resulting from any ideas, methods, instructions or products referred to in the content.

