
Extraction of Iron and Alumina from Red Mud with a Non-Harmful Magnetization Sintering Process
Abstract
:1. Introduction
2. Materials and Methods
2.1. Materials
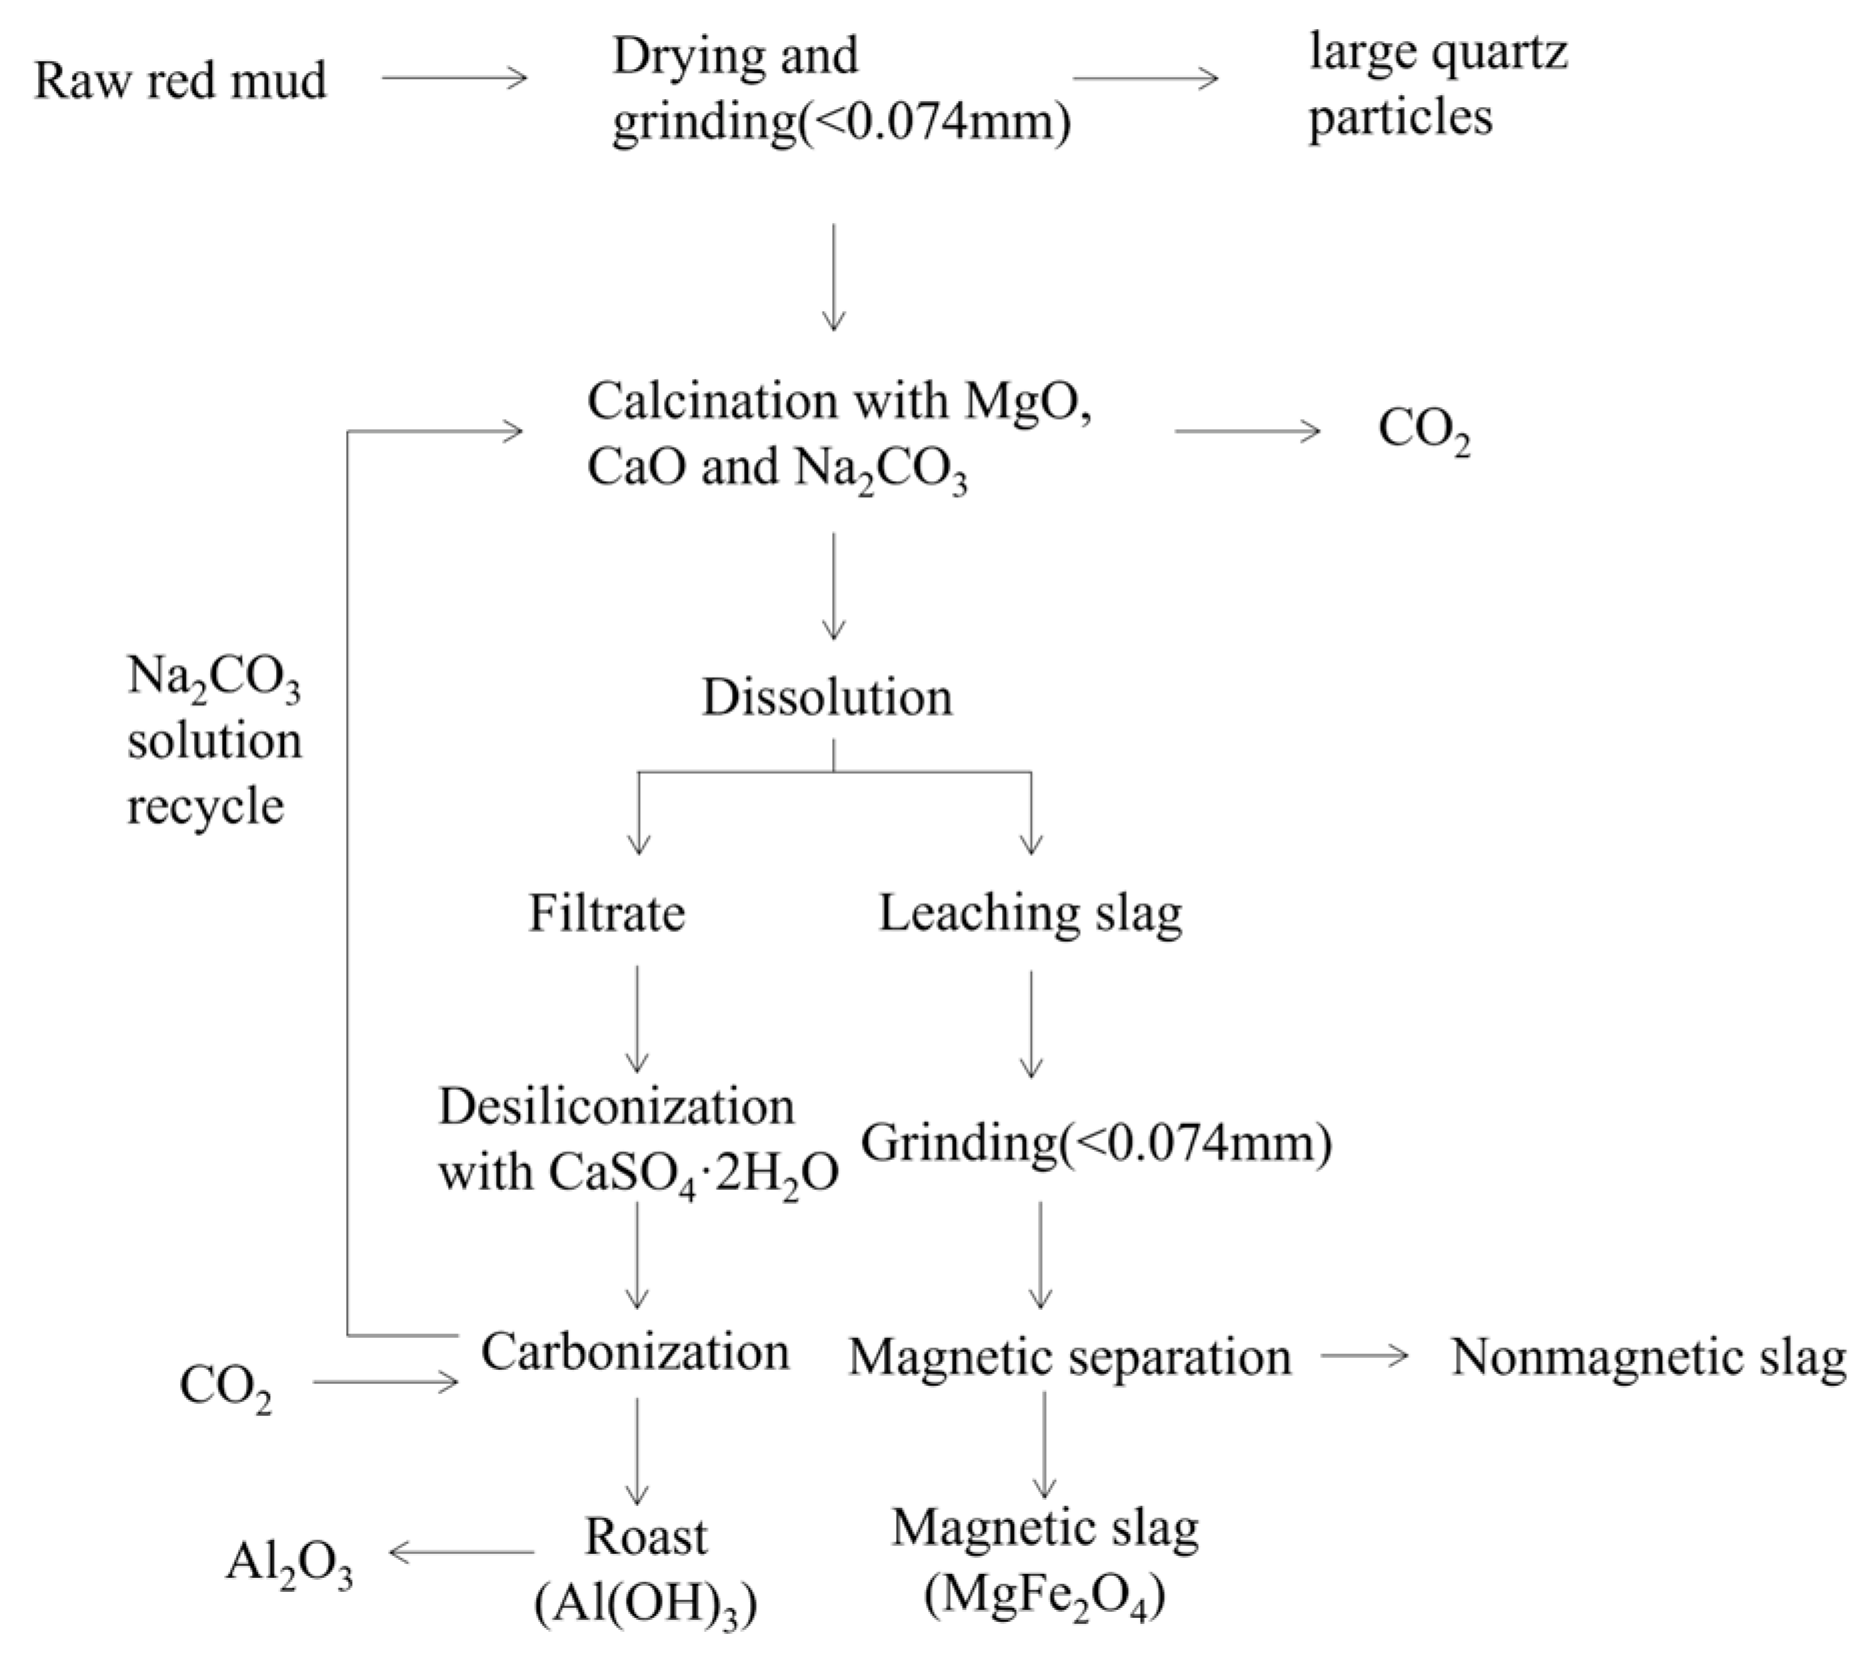
2.2. Methods
2.3. Characterization
3. Results and Discussion
3.1. Characterization of Red Mud
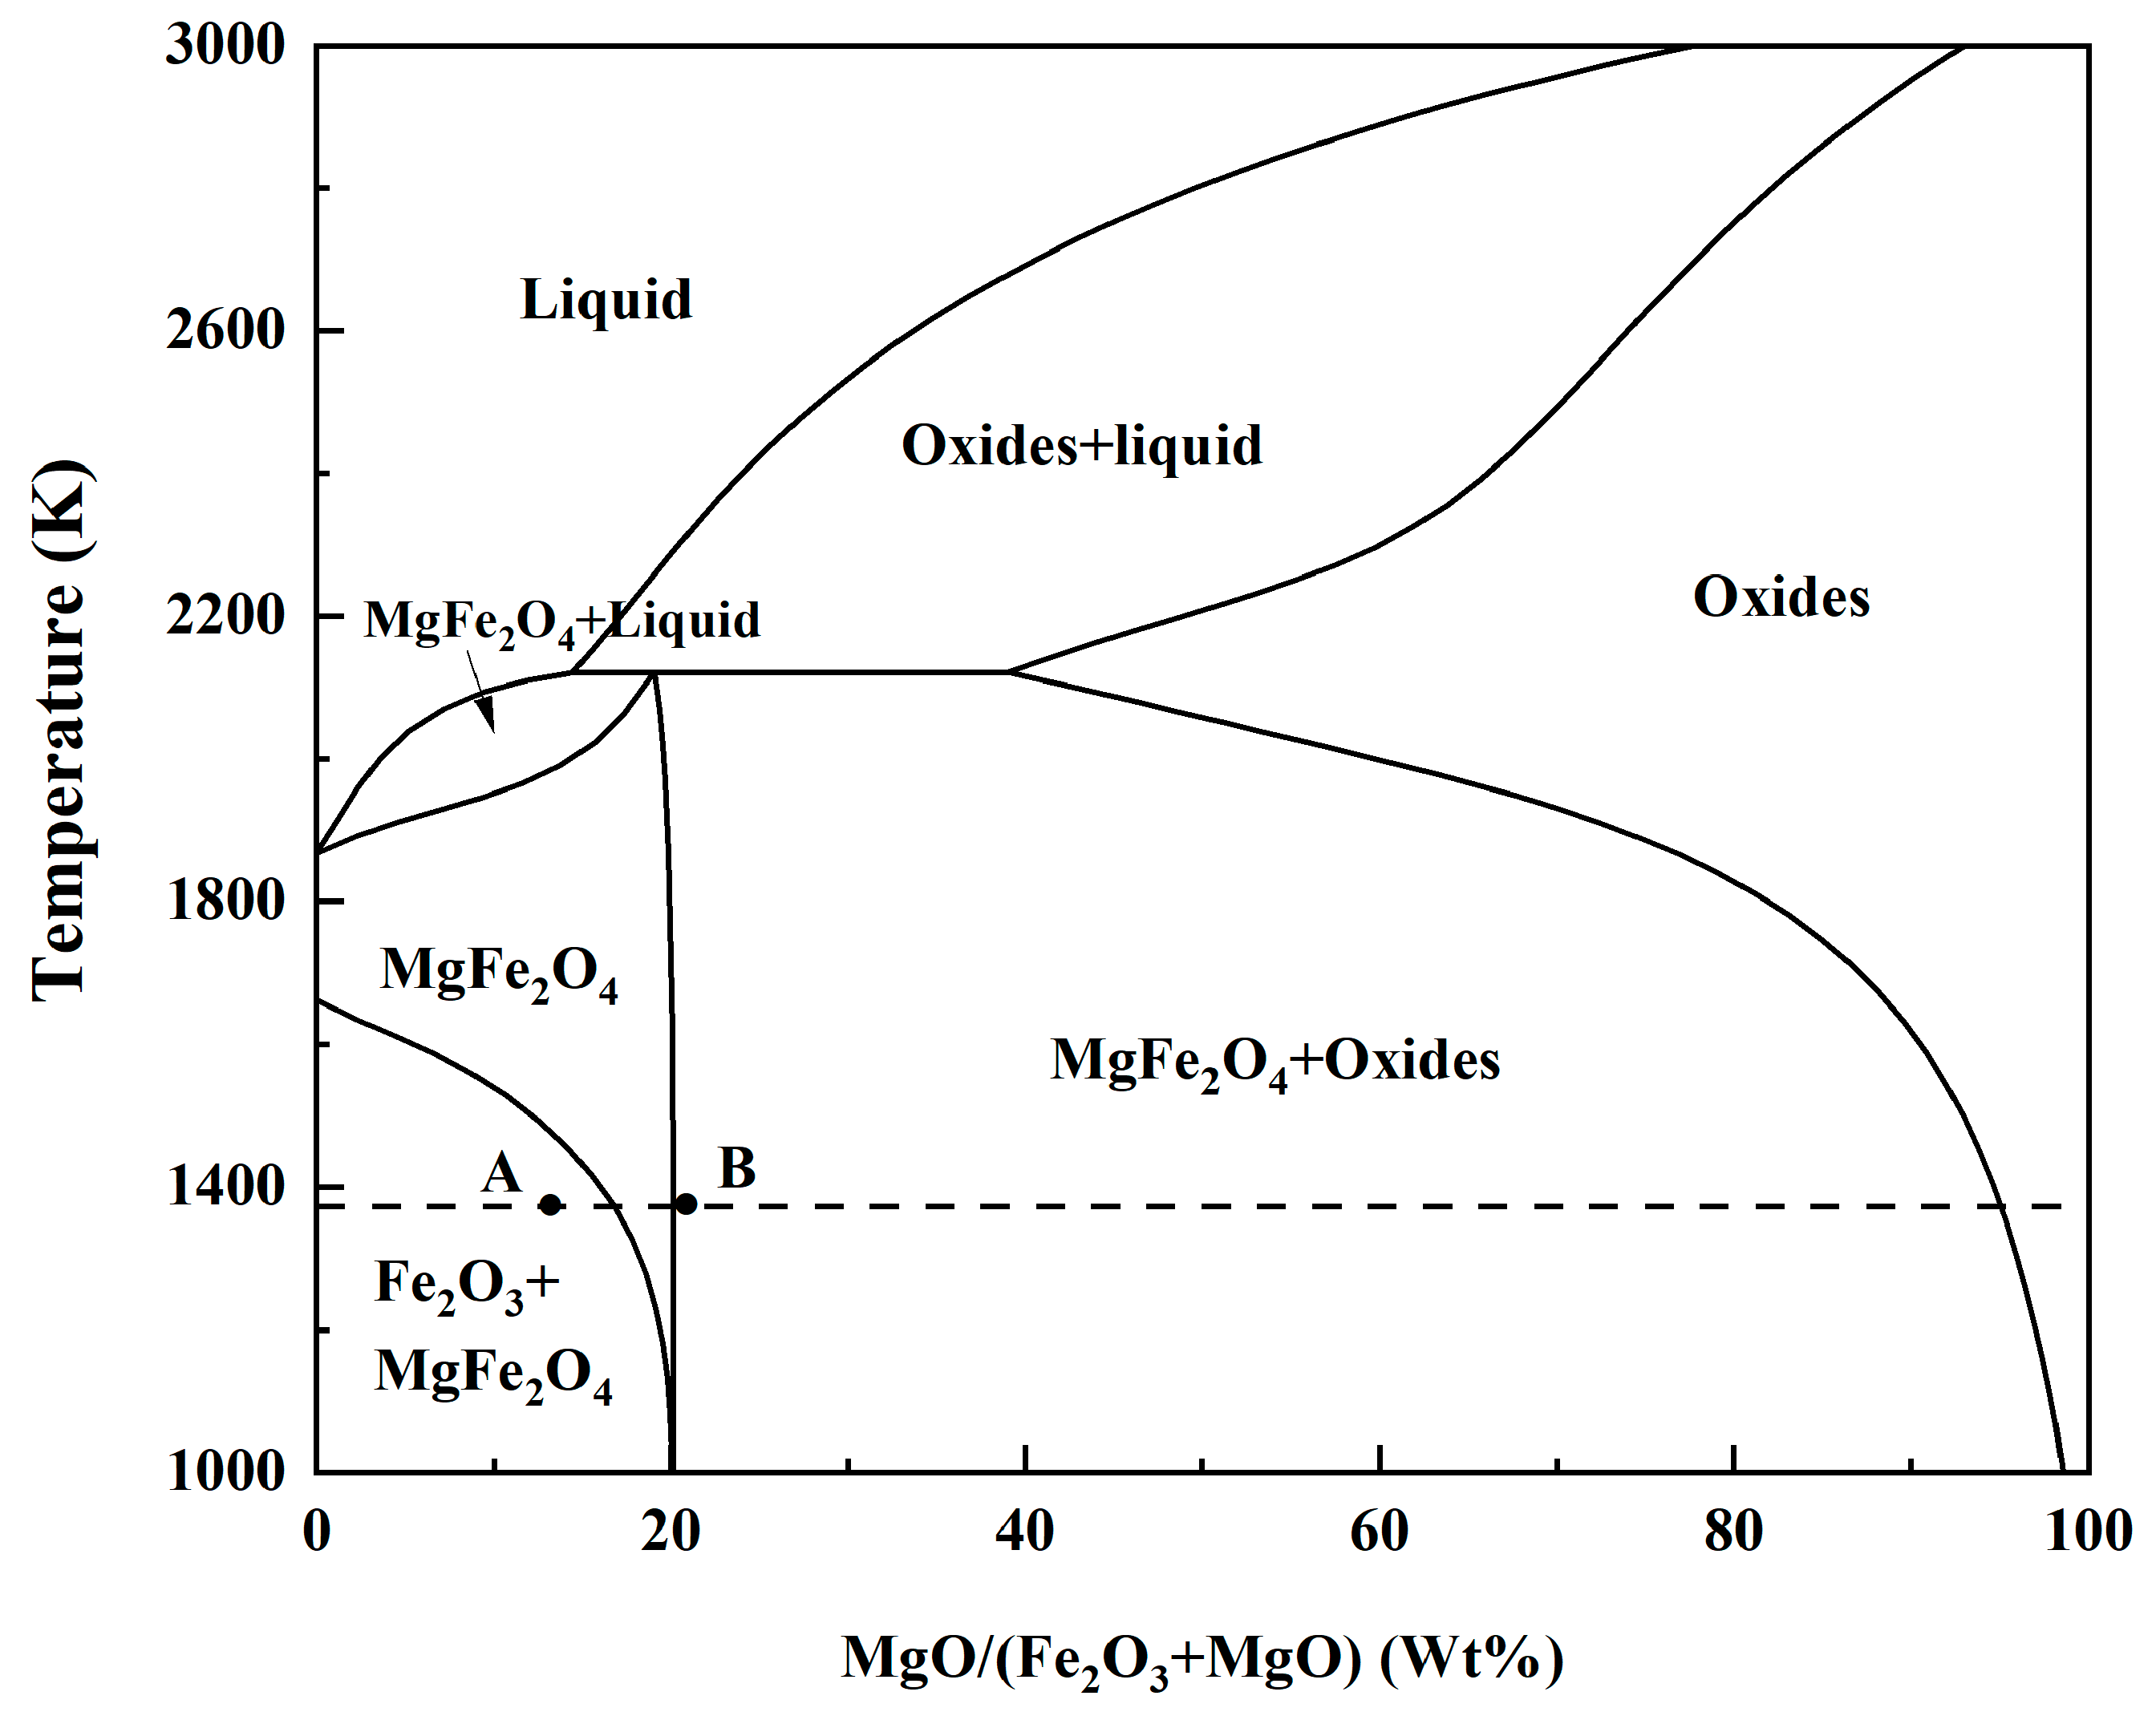
3.2. Feasibility Analysis of MgFe2O4 Formation in the Sintering Process
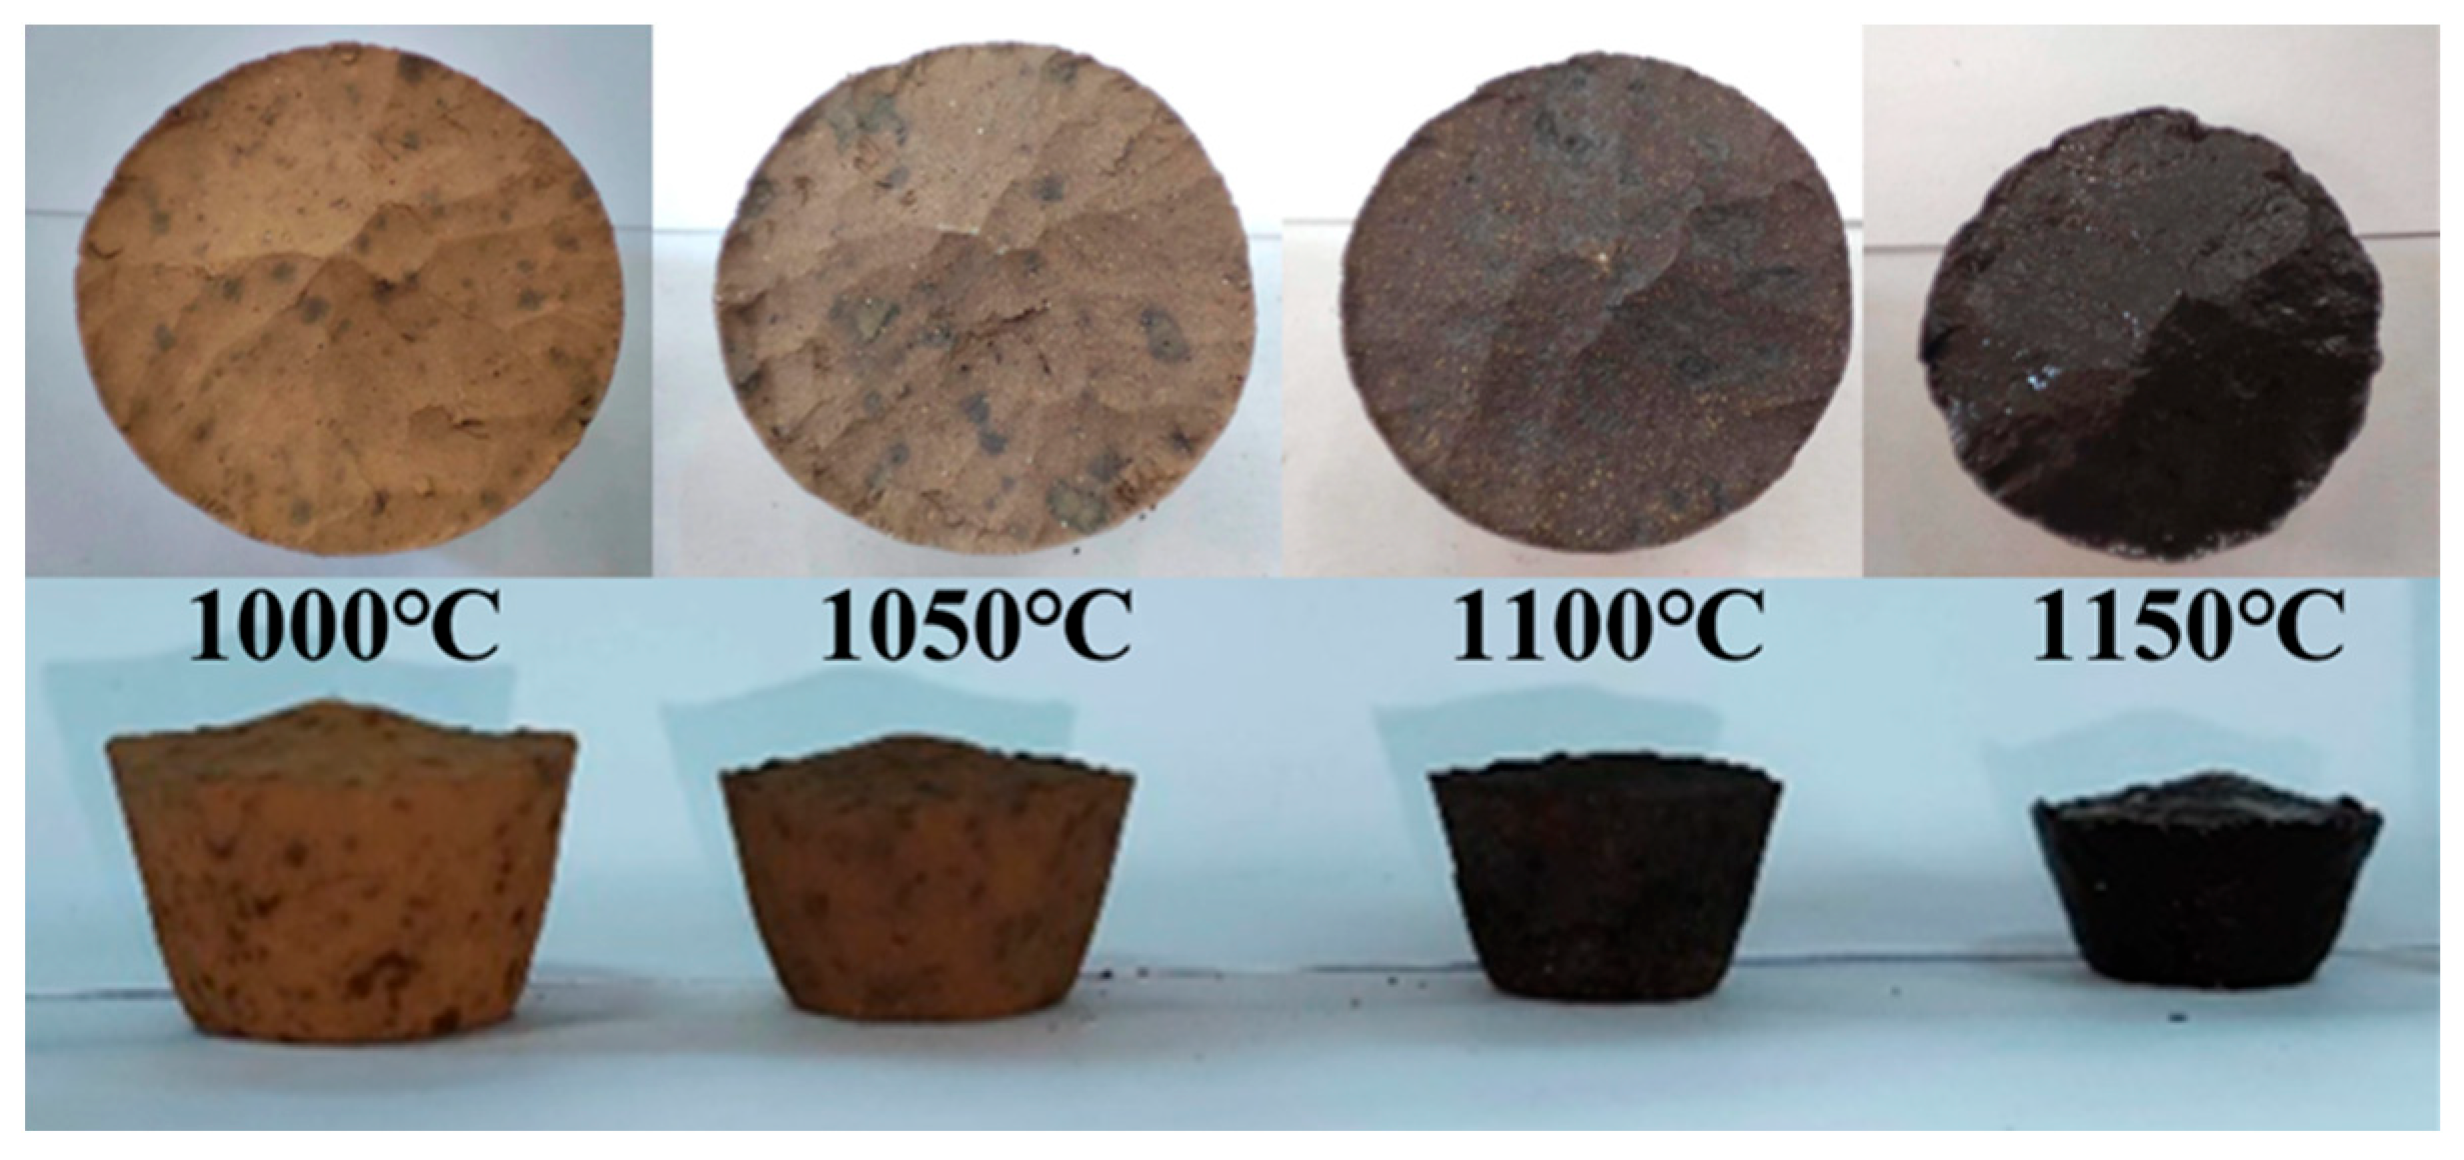
3.2.1. Effect of Temperature on Sintering Behavior
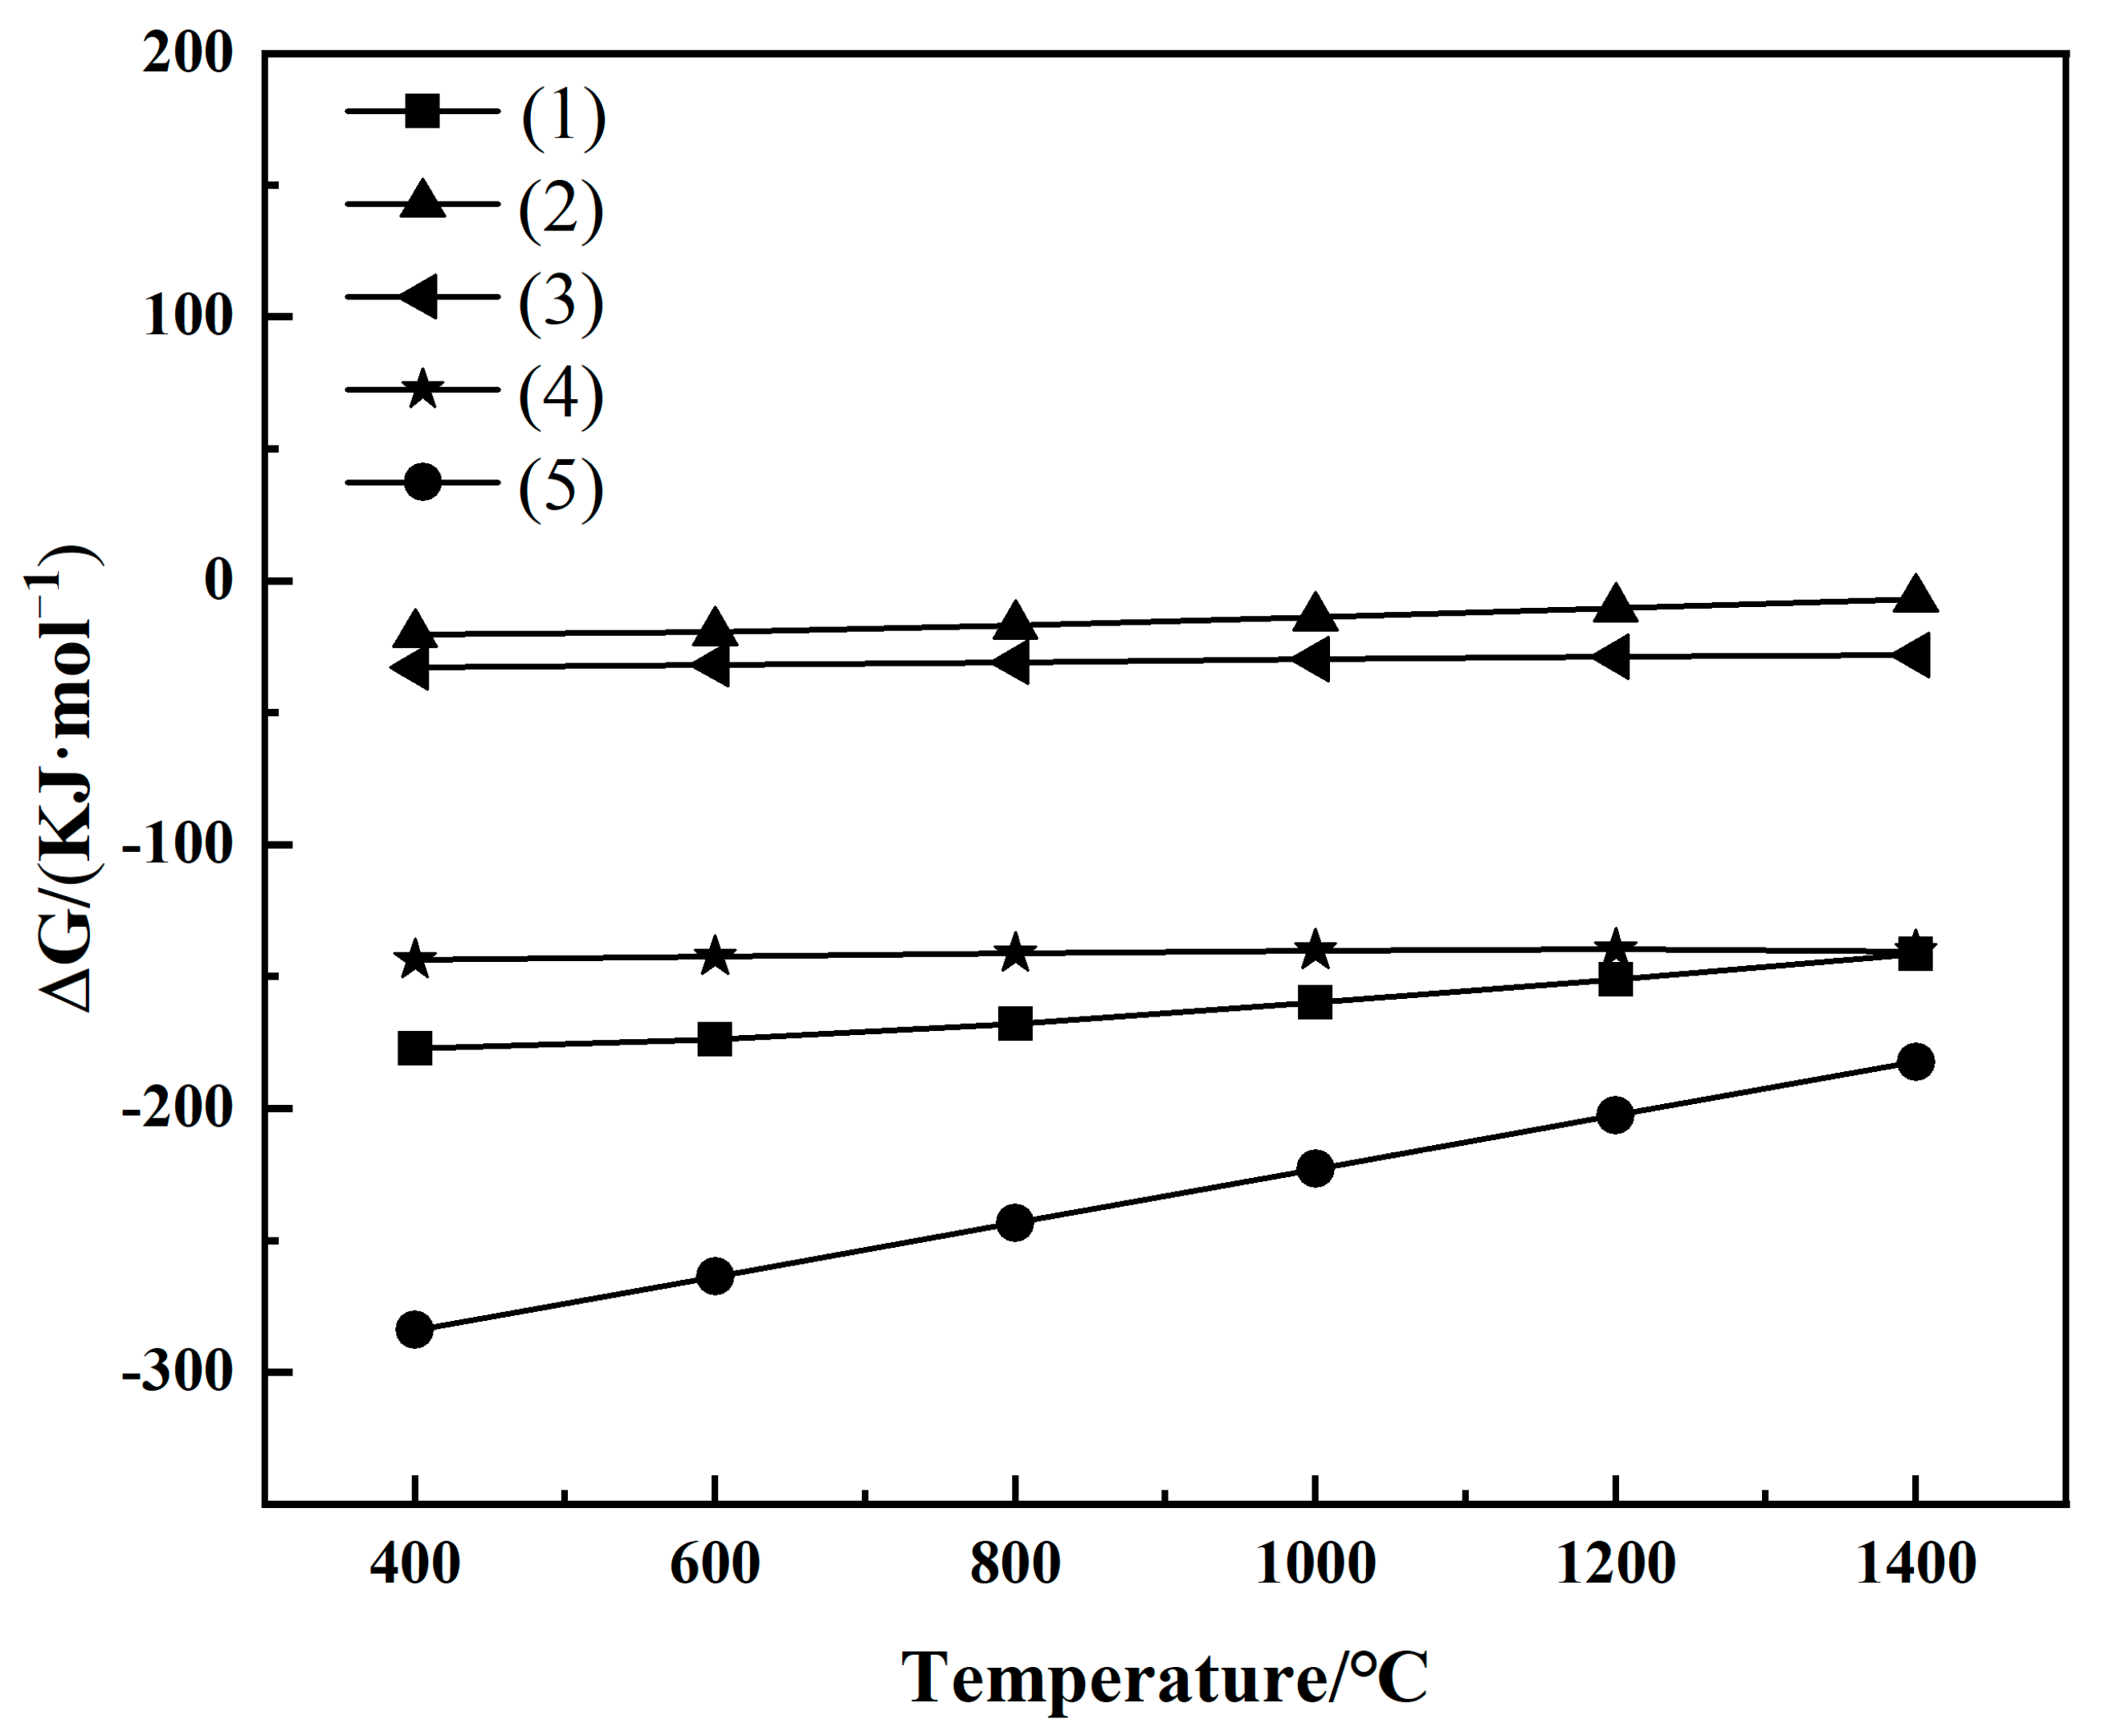
3.2.2. Thermodynamic Trends in the Generation of Mineral Phases
3.3. The Formation of Phase in Sintered Product under Different Roasting Parameters
3.3.1. Temperature
3.3.2. Time
3.3.3. The Effect of MgO on Sintering Samples
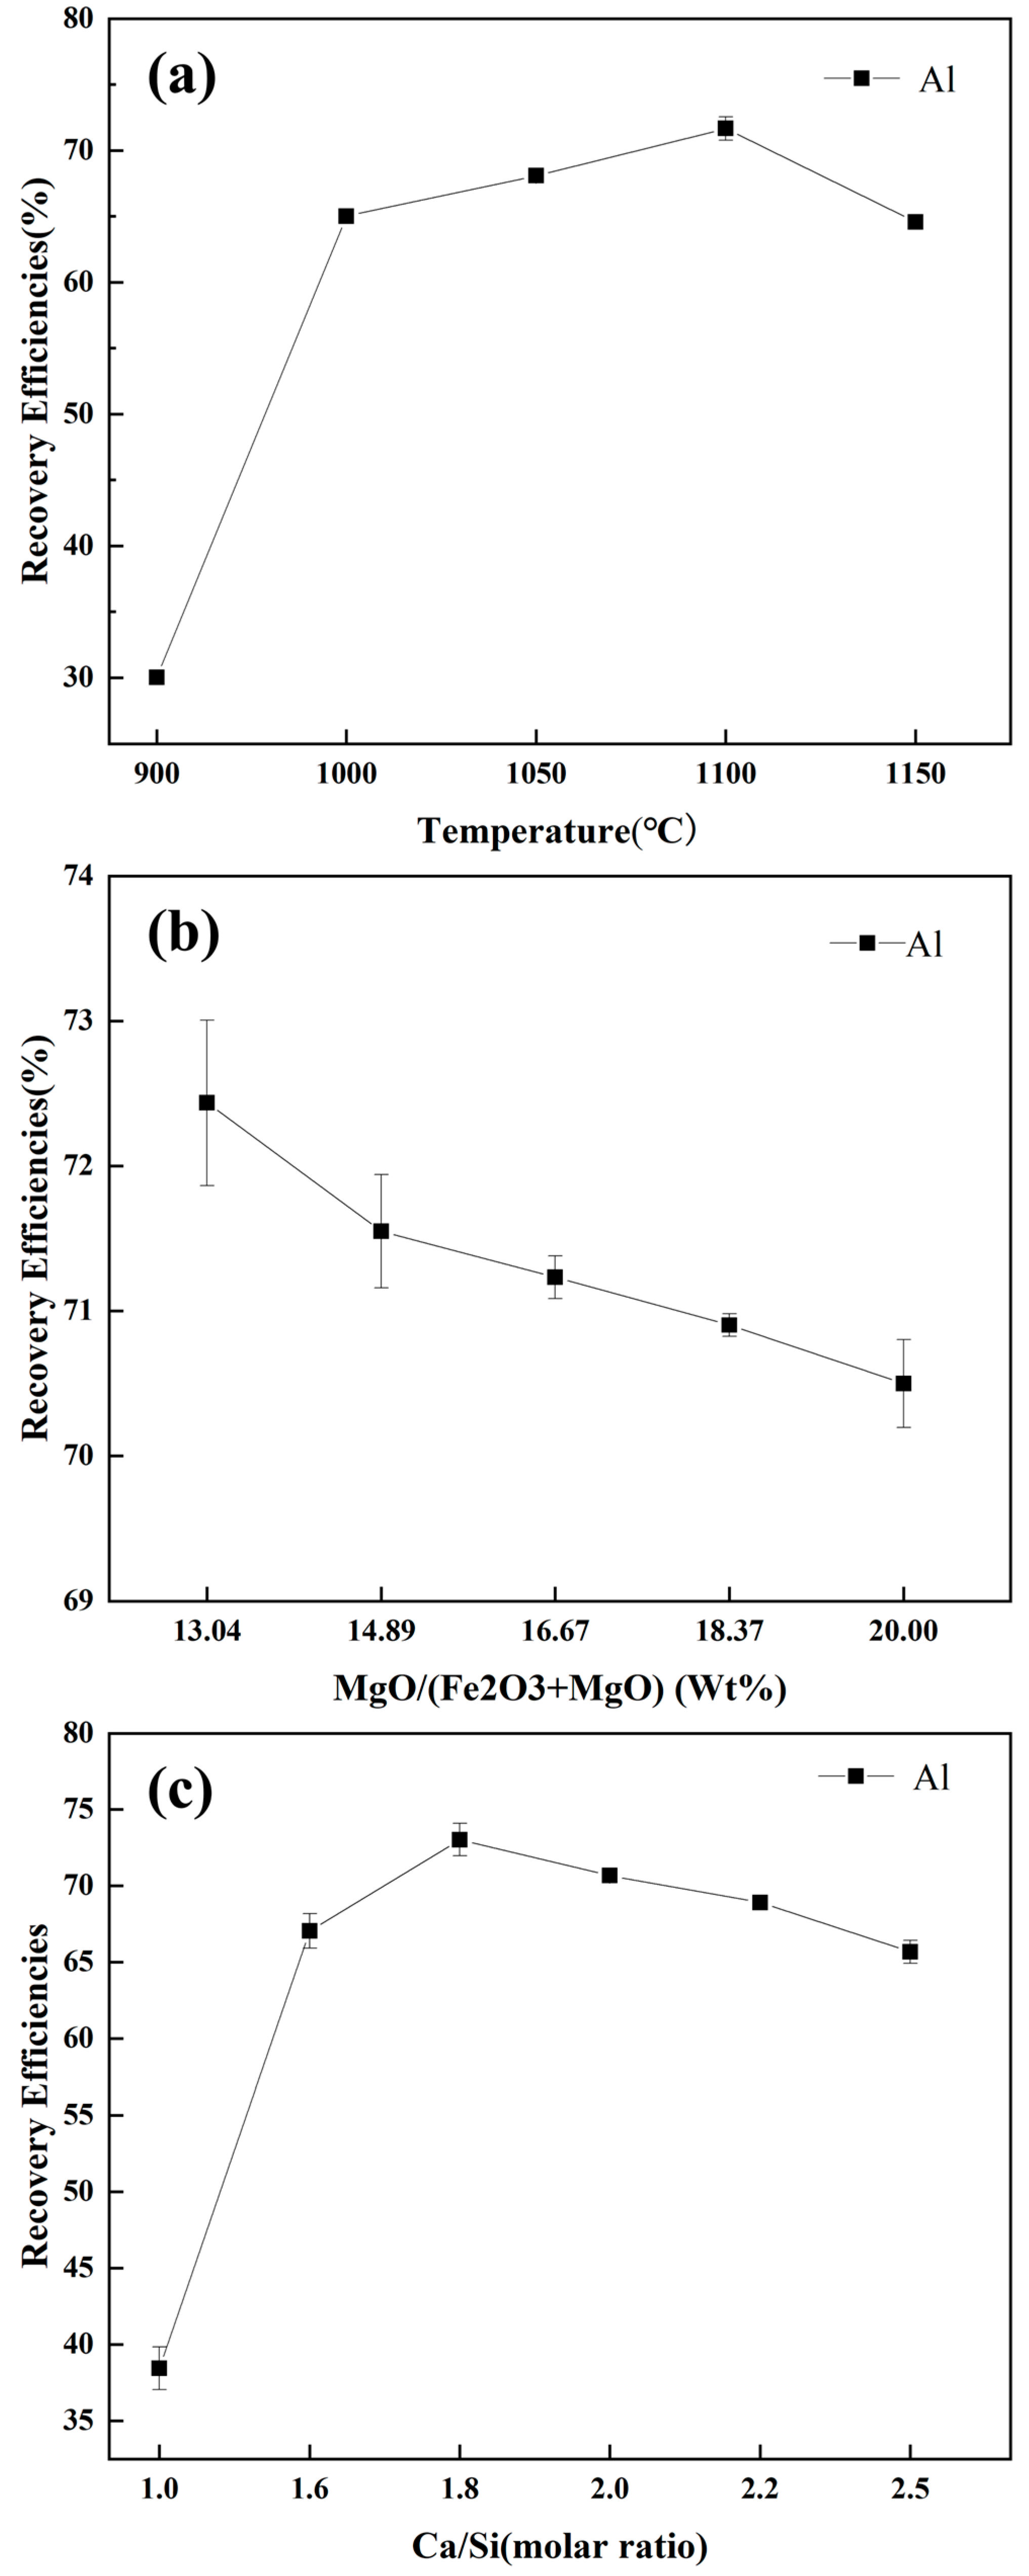
3.4. Recovery Efficiencies of Alumina from Red Mud
3.4.1. Effect of Calcination Conditions on Alumina Extraction
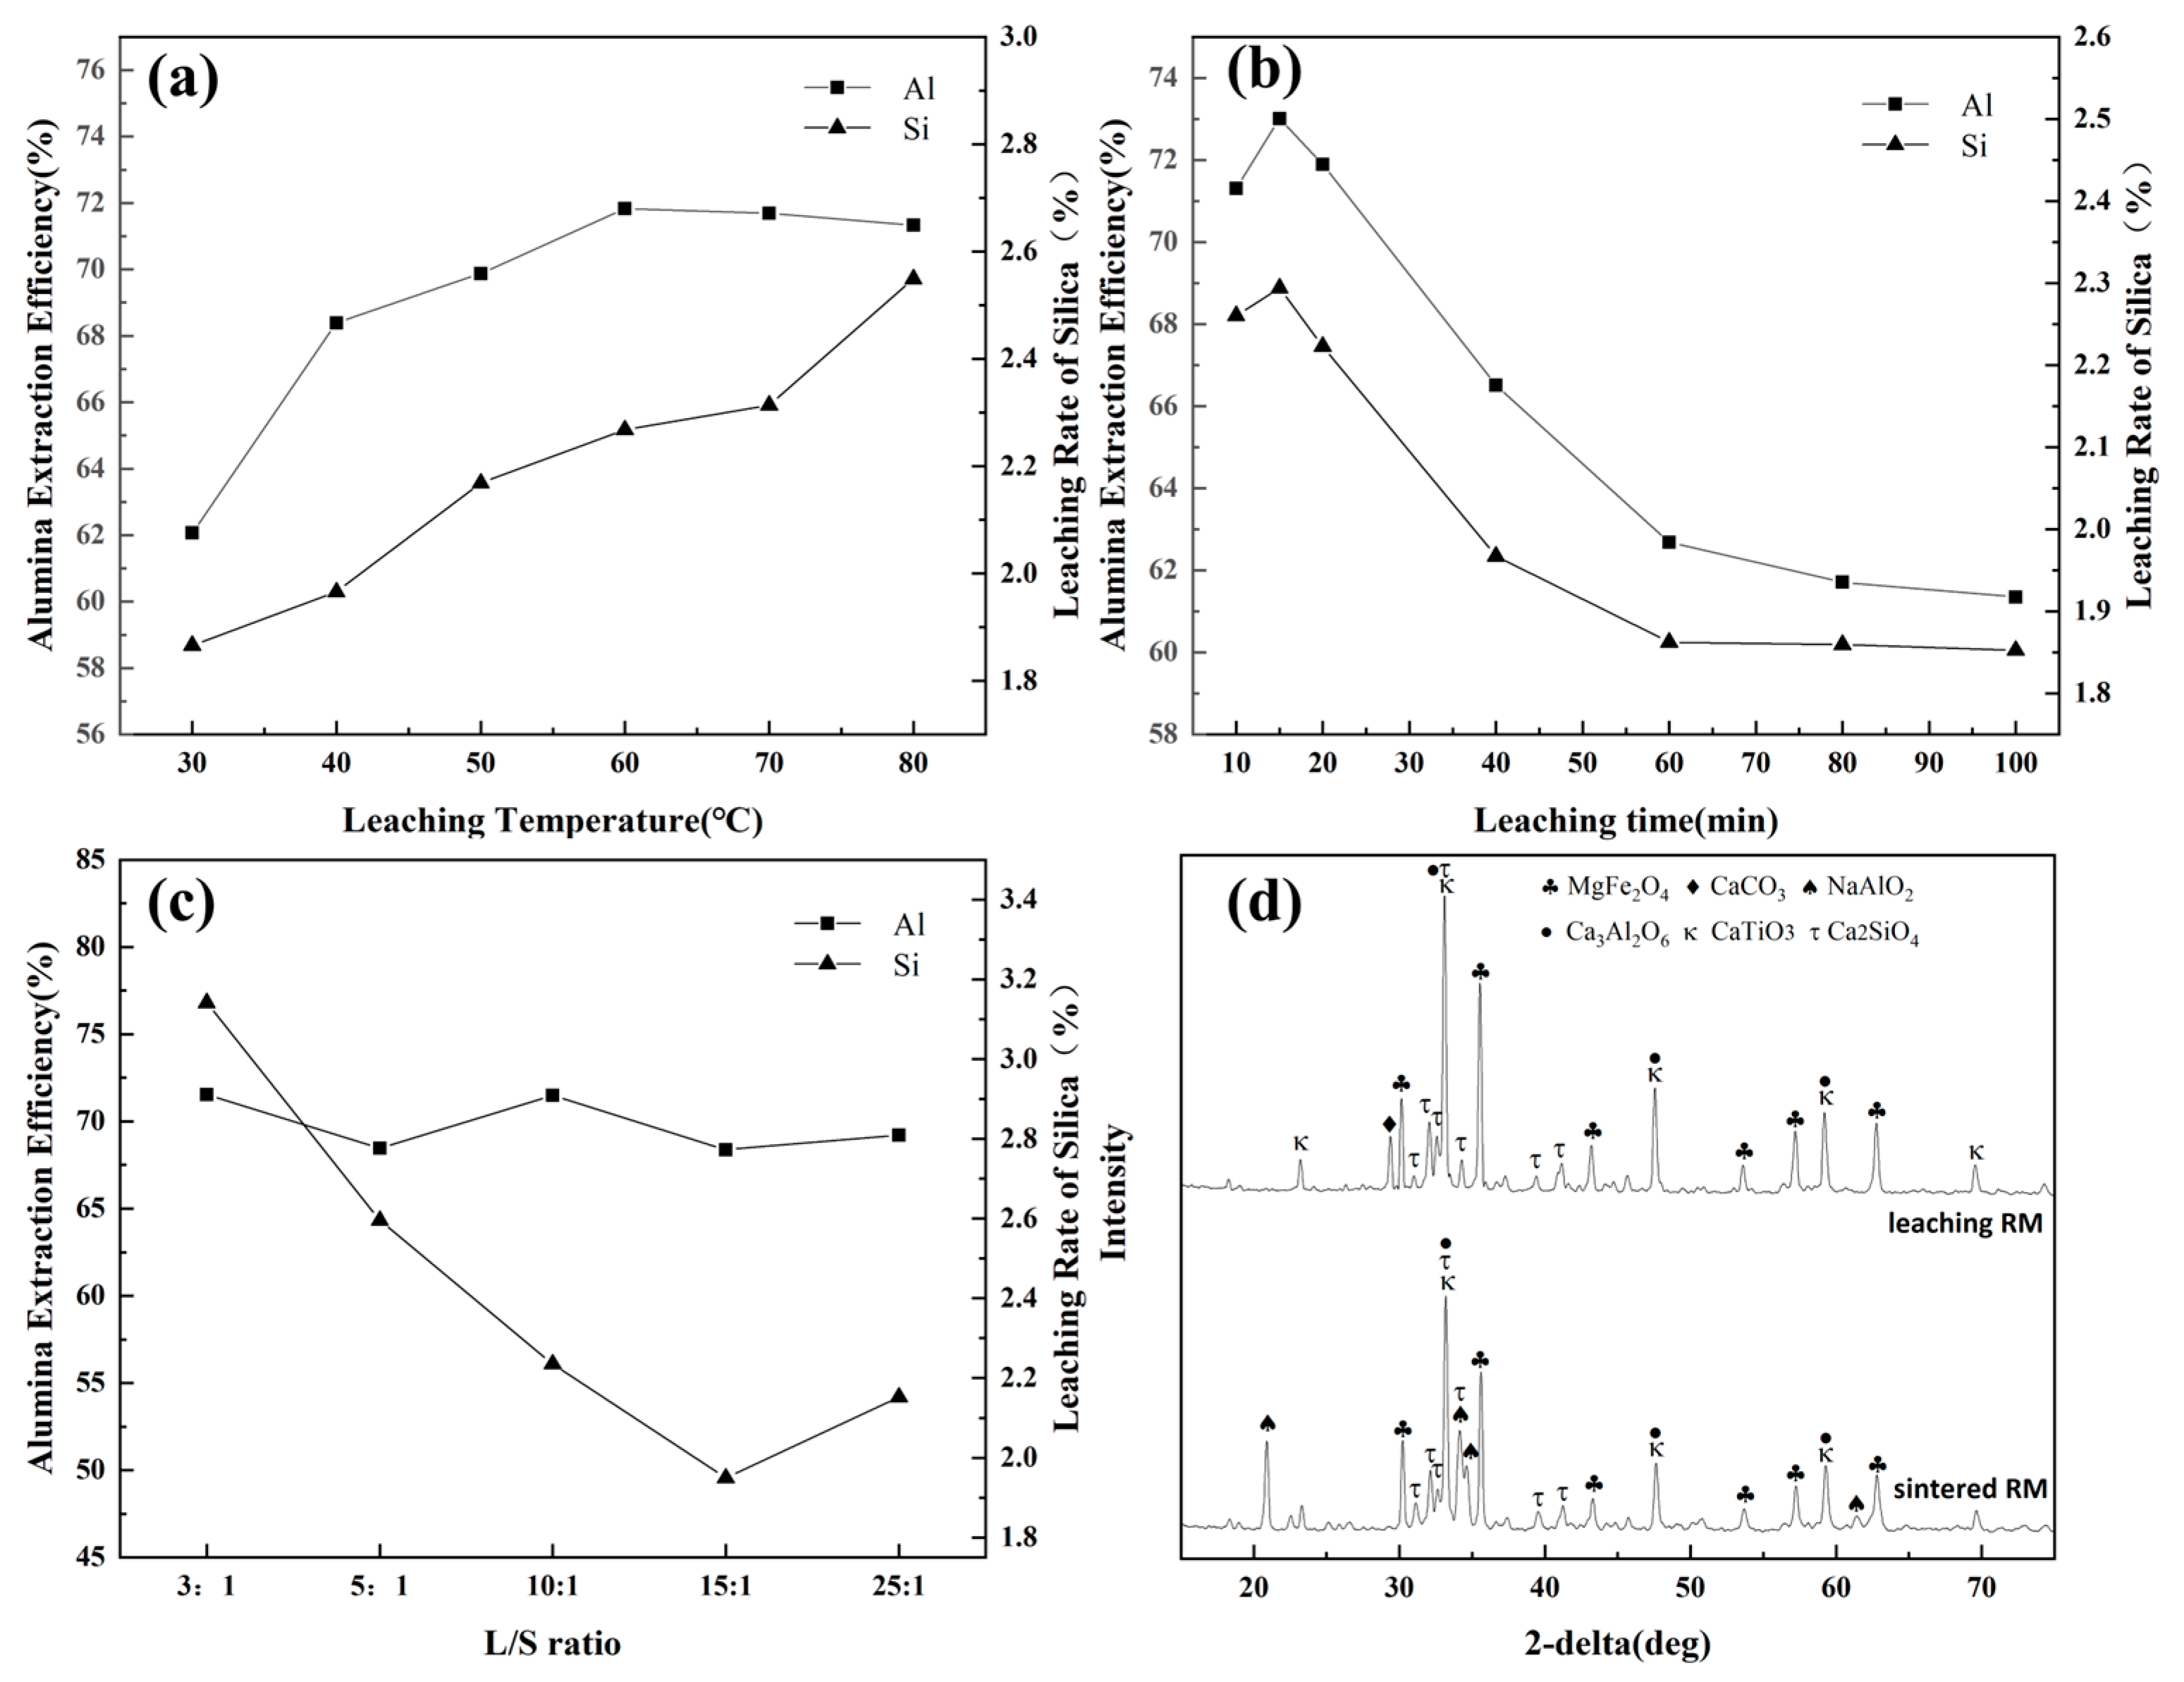
3.4.2. Effect of Leaching Conditions on Alumina Extraction
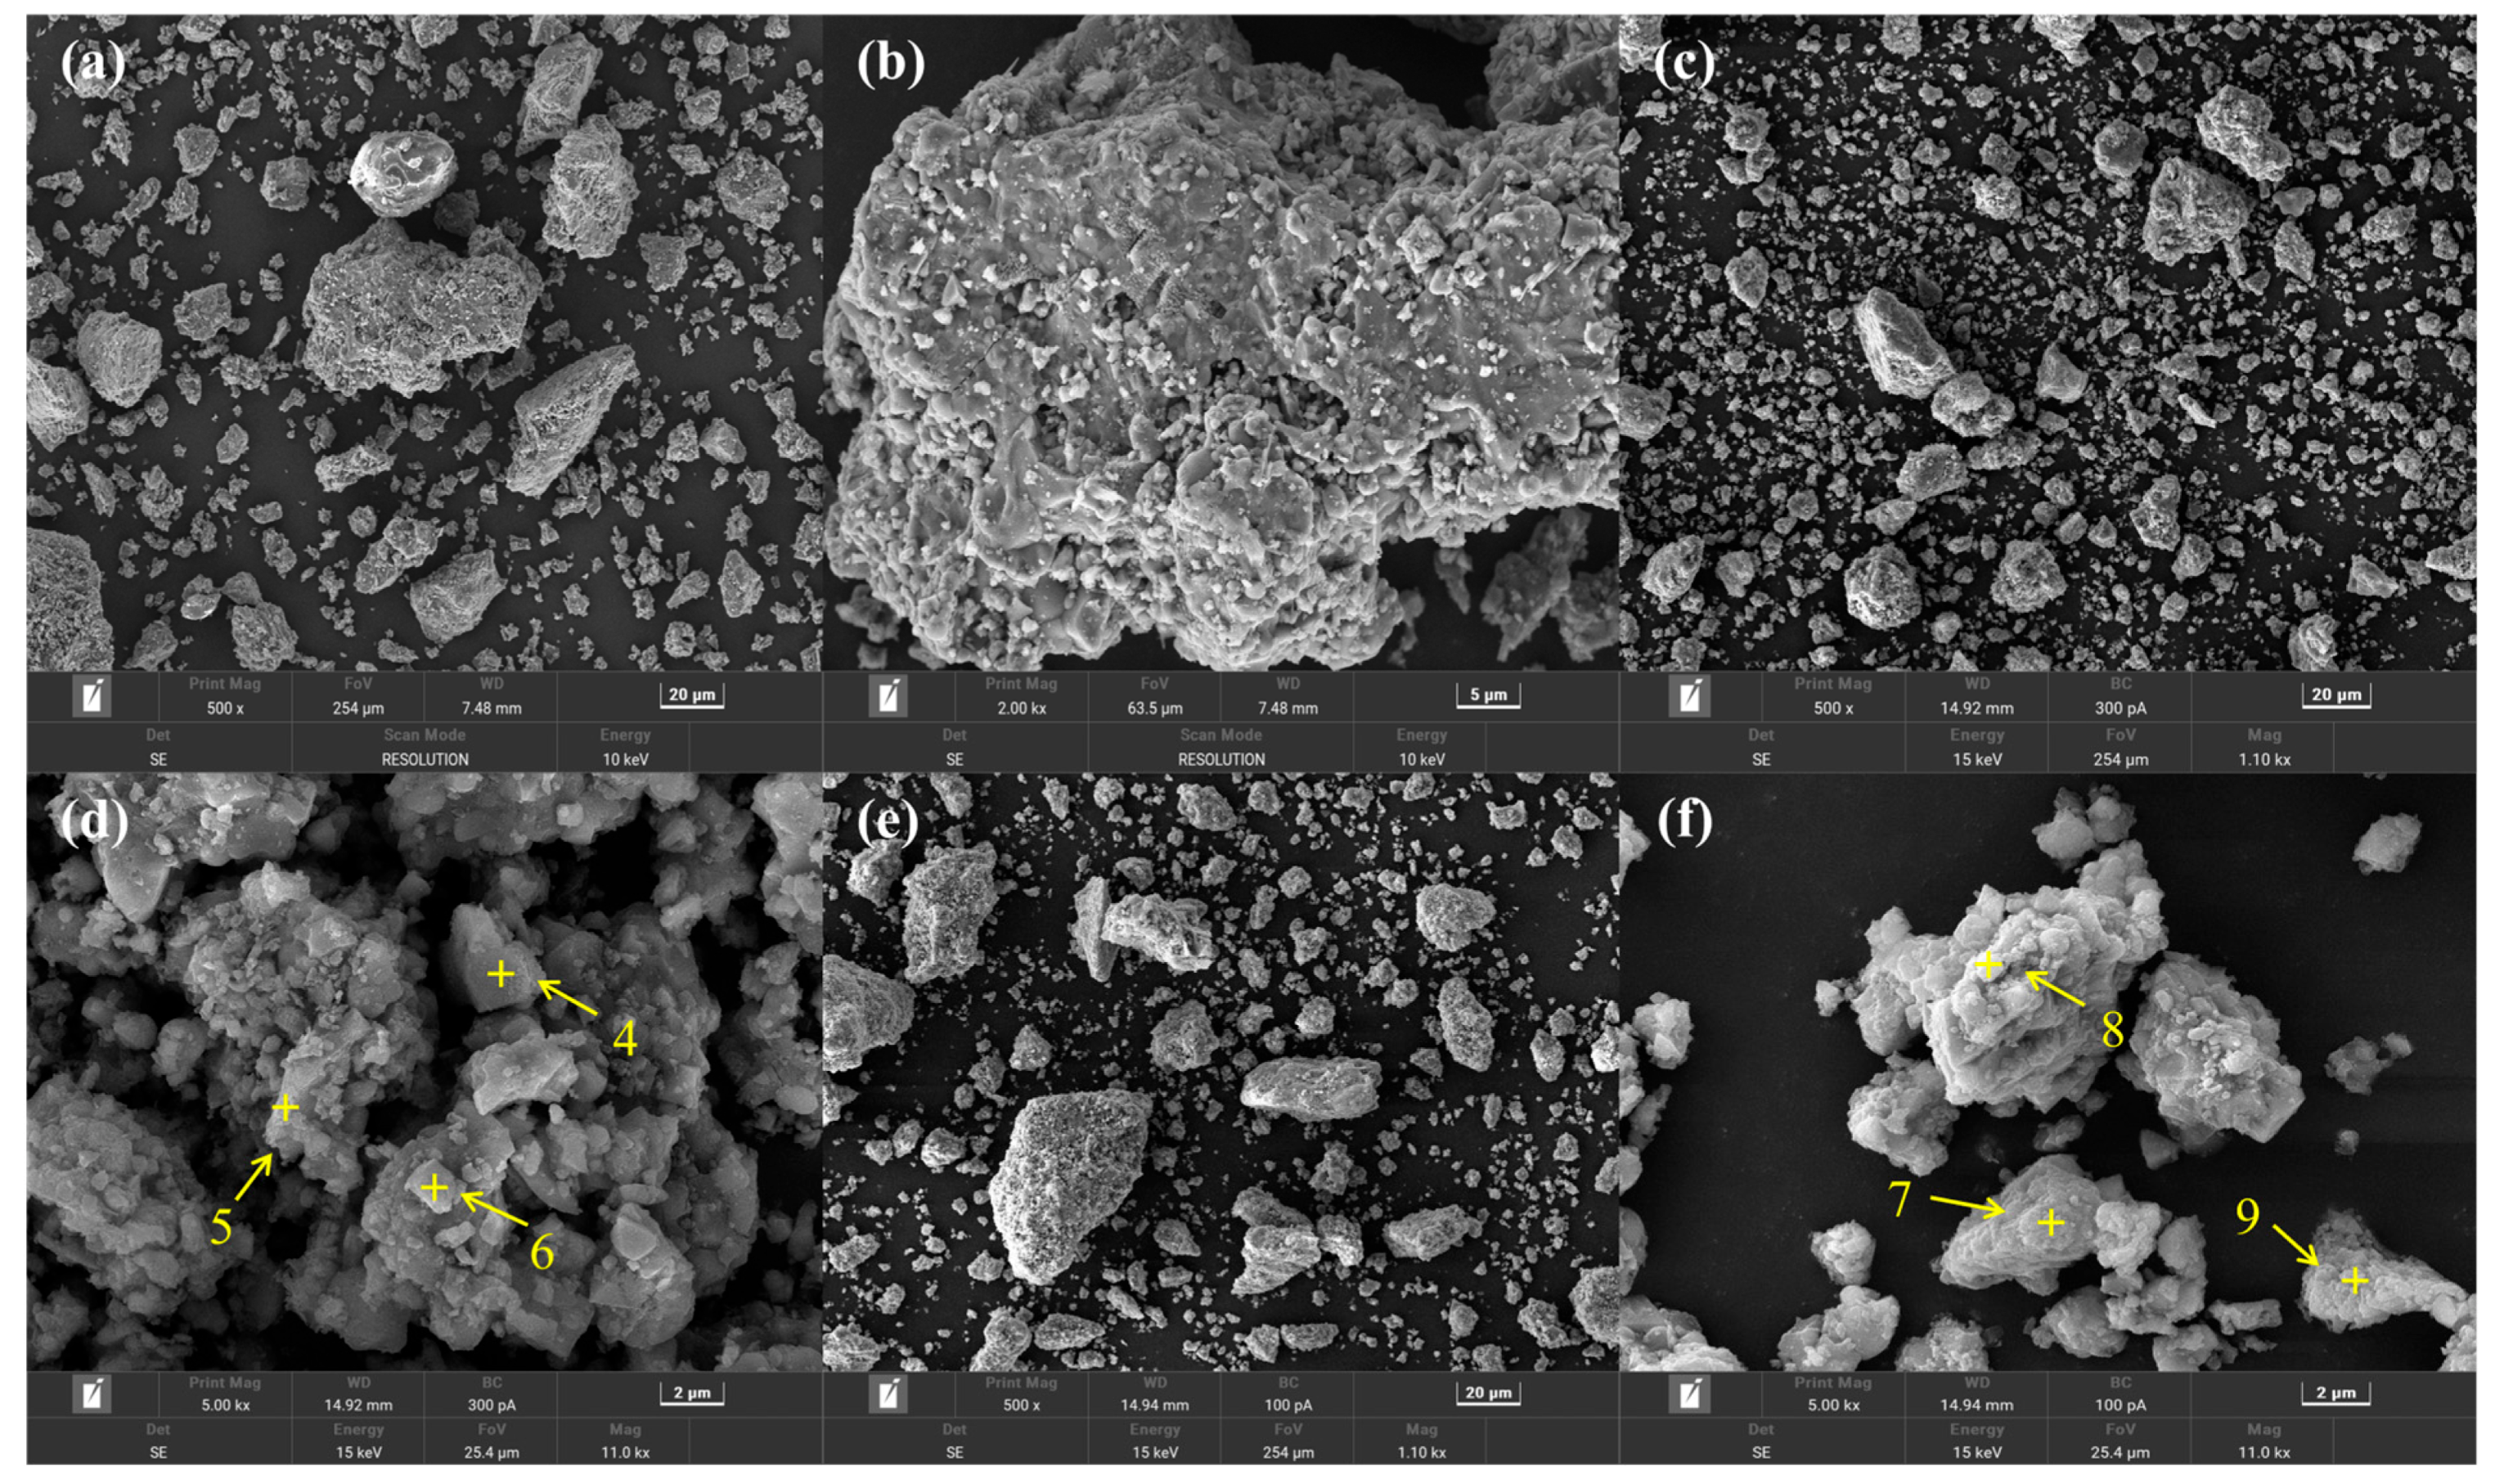
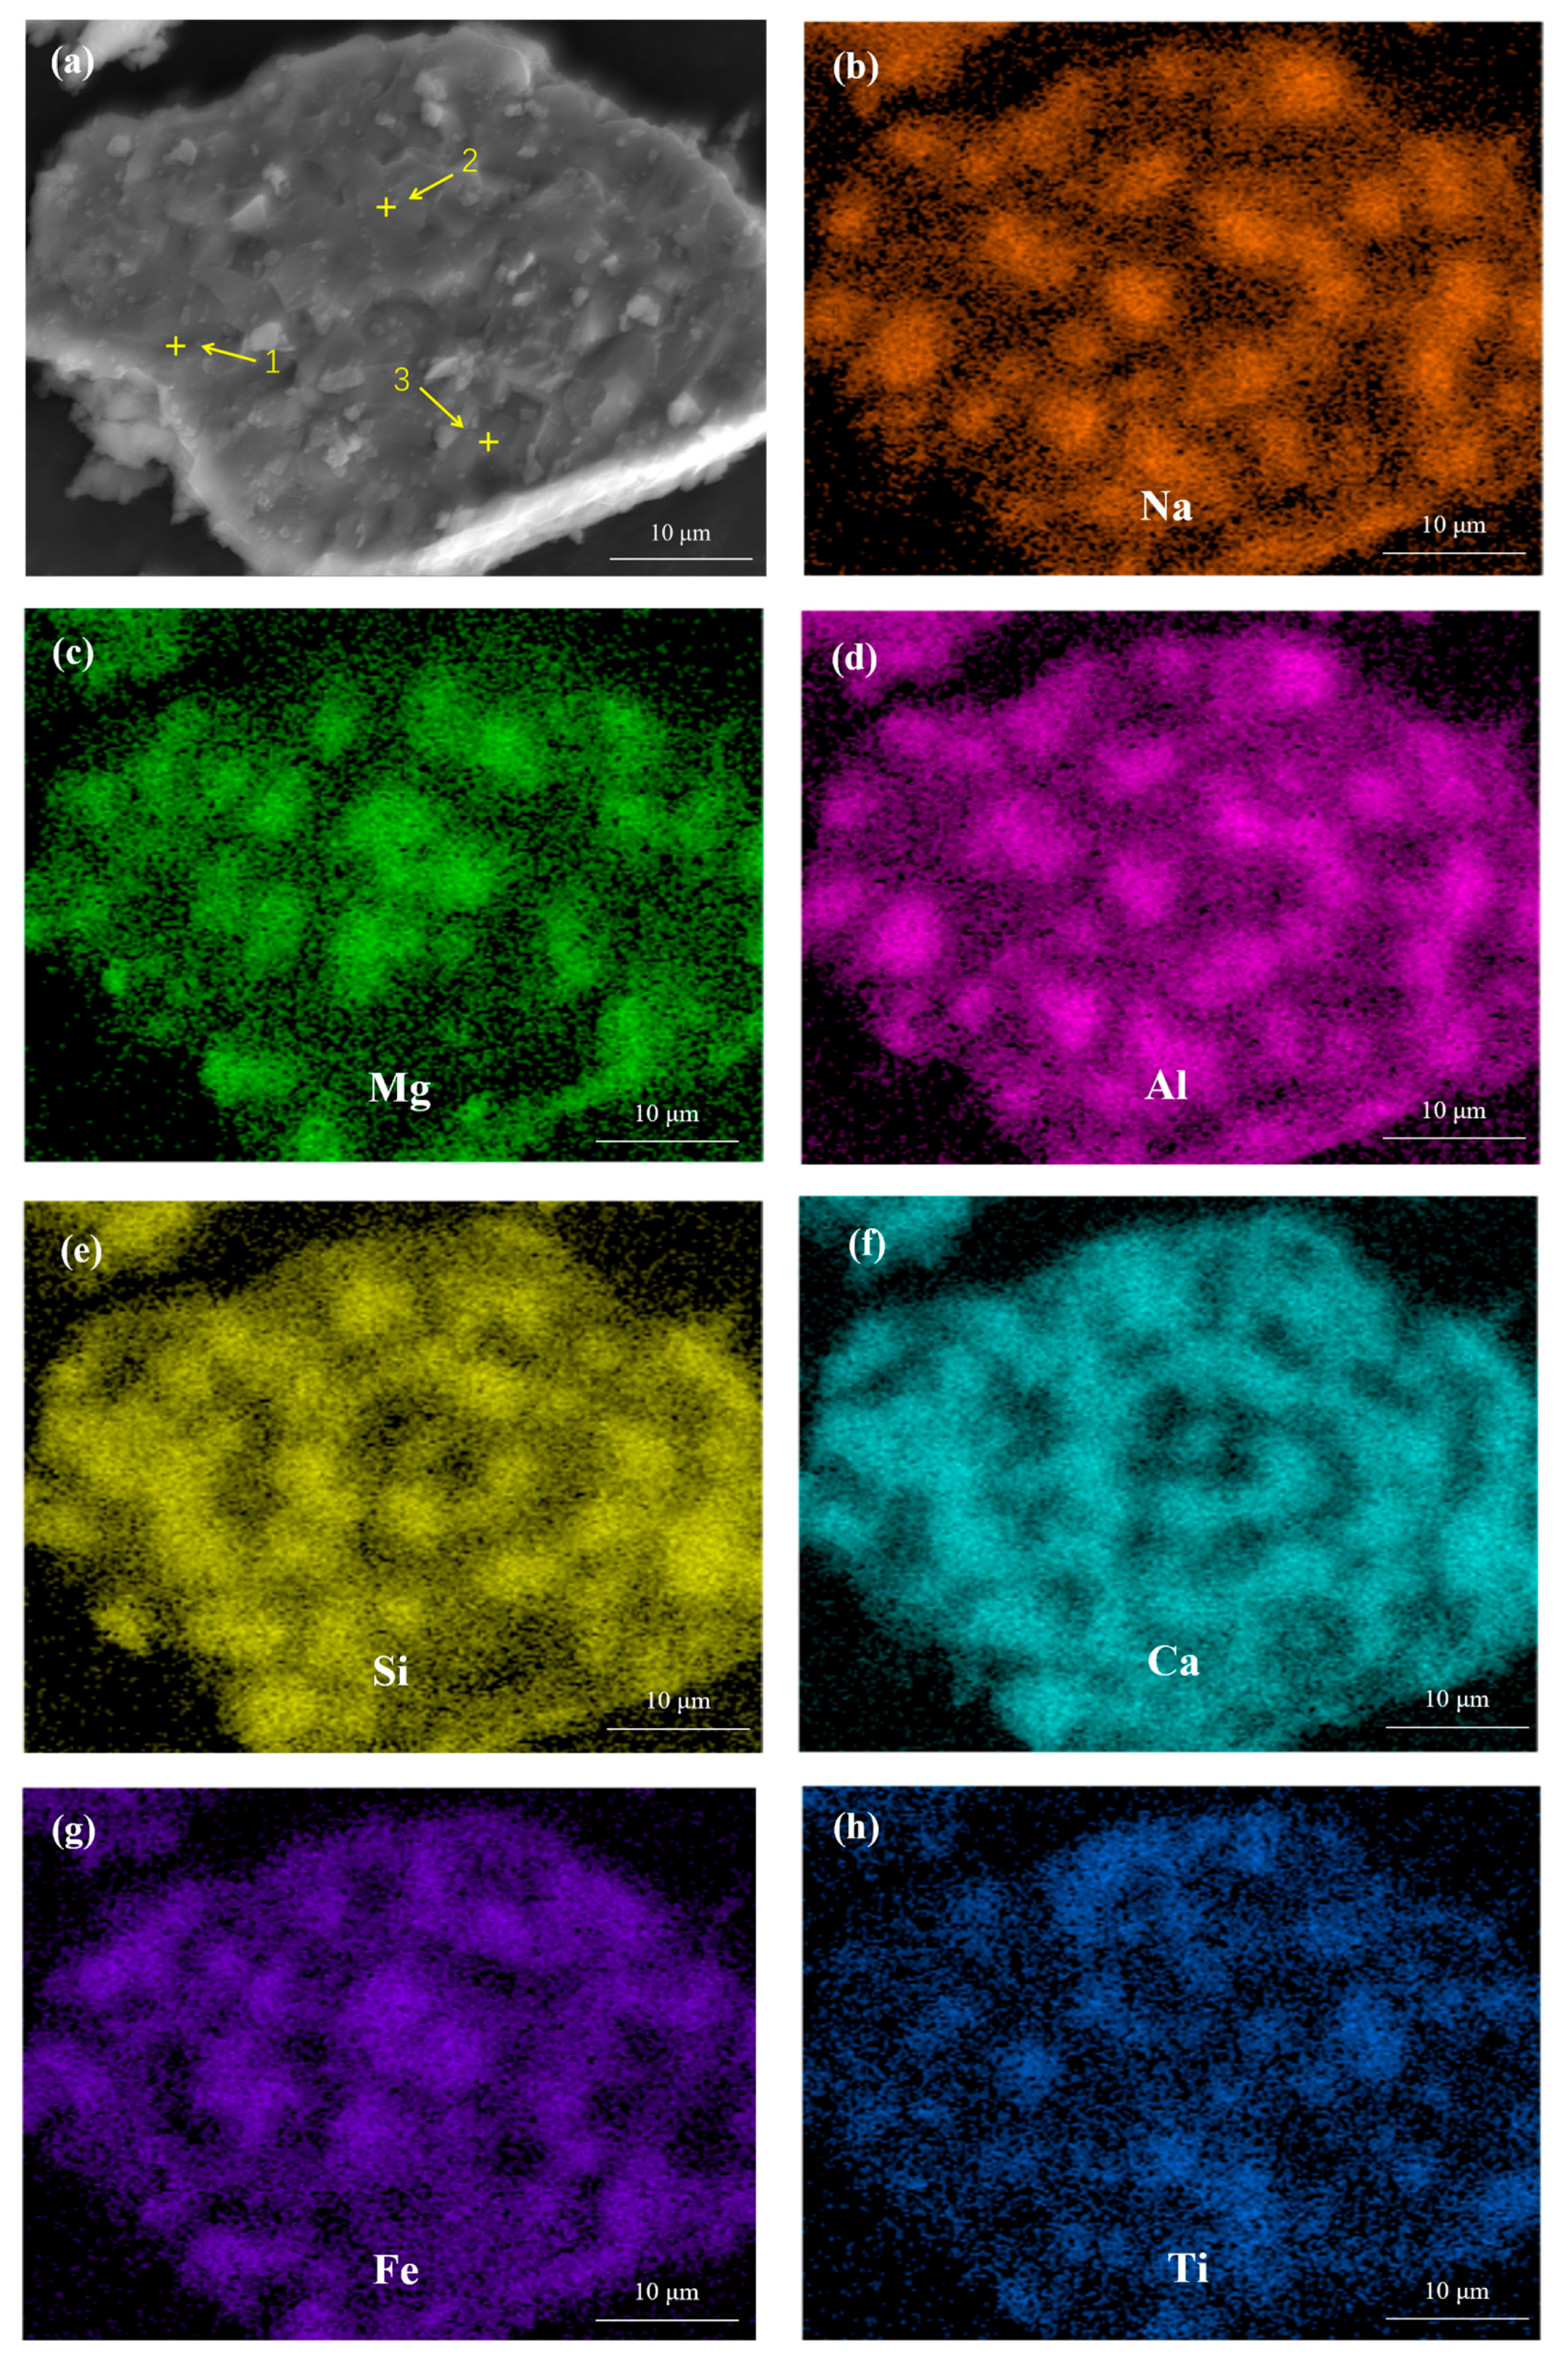
3.5. Microstructural Studies
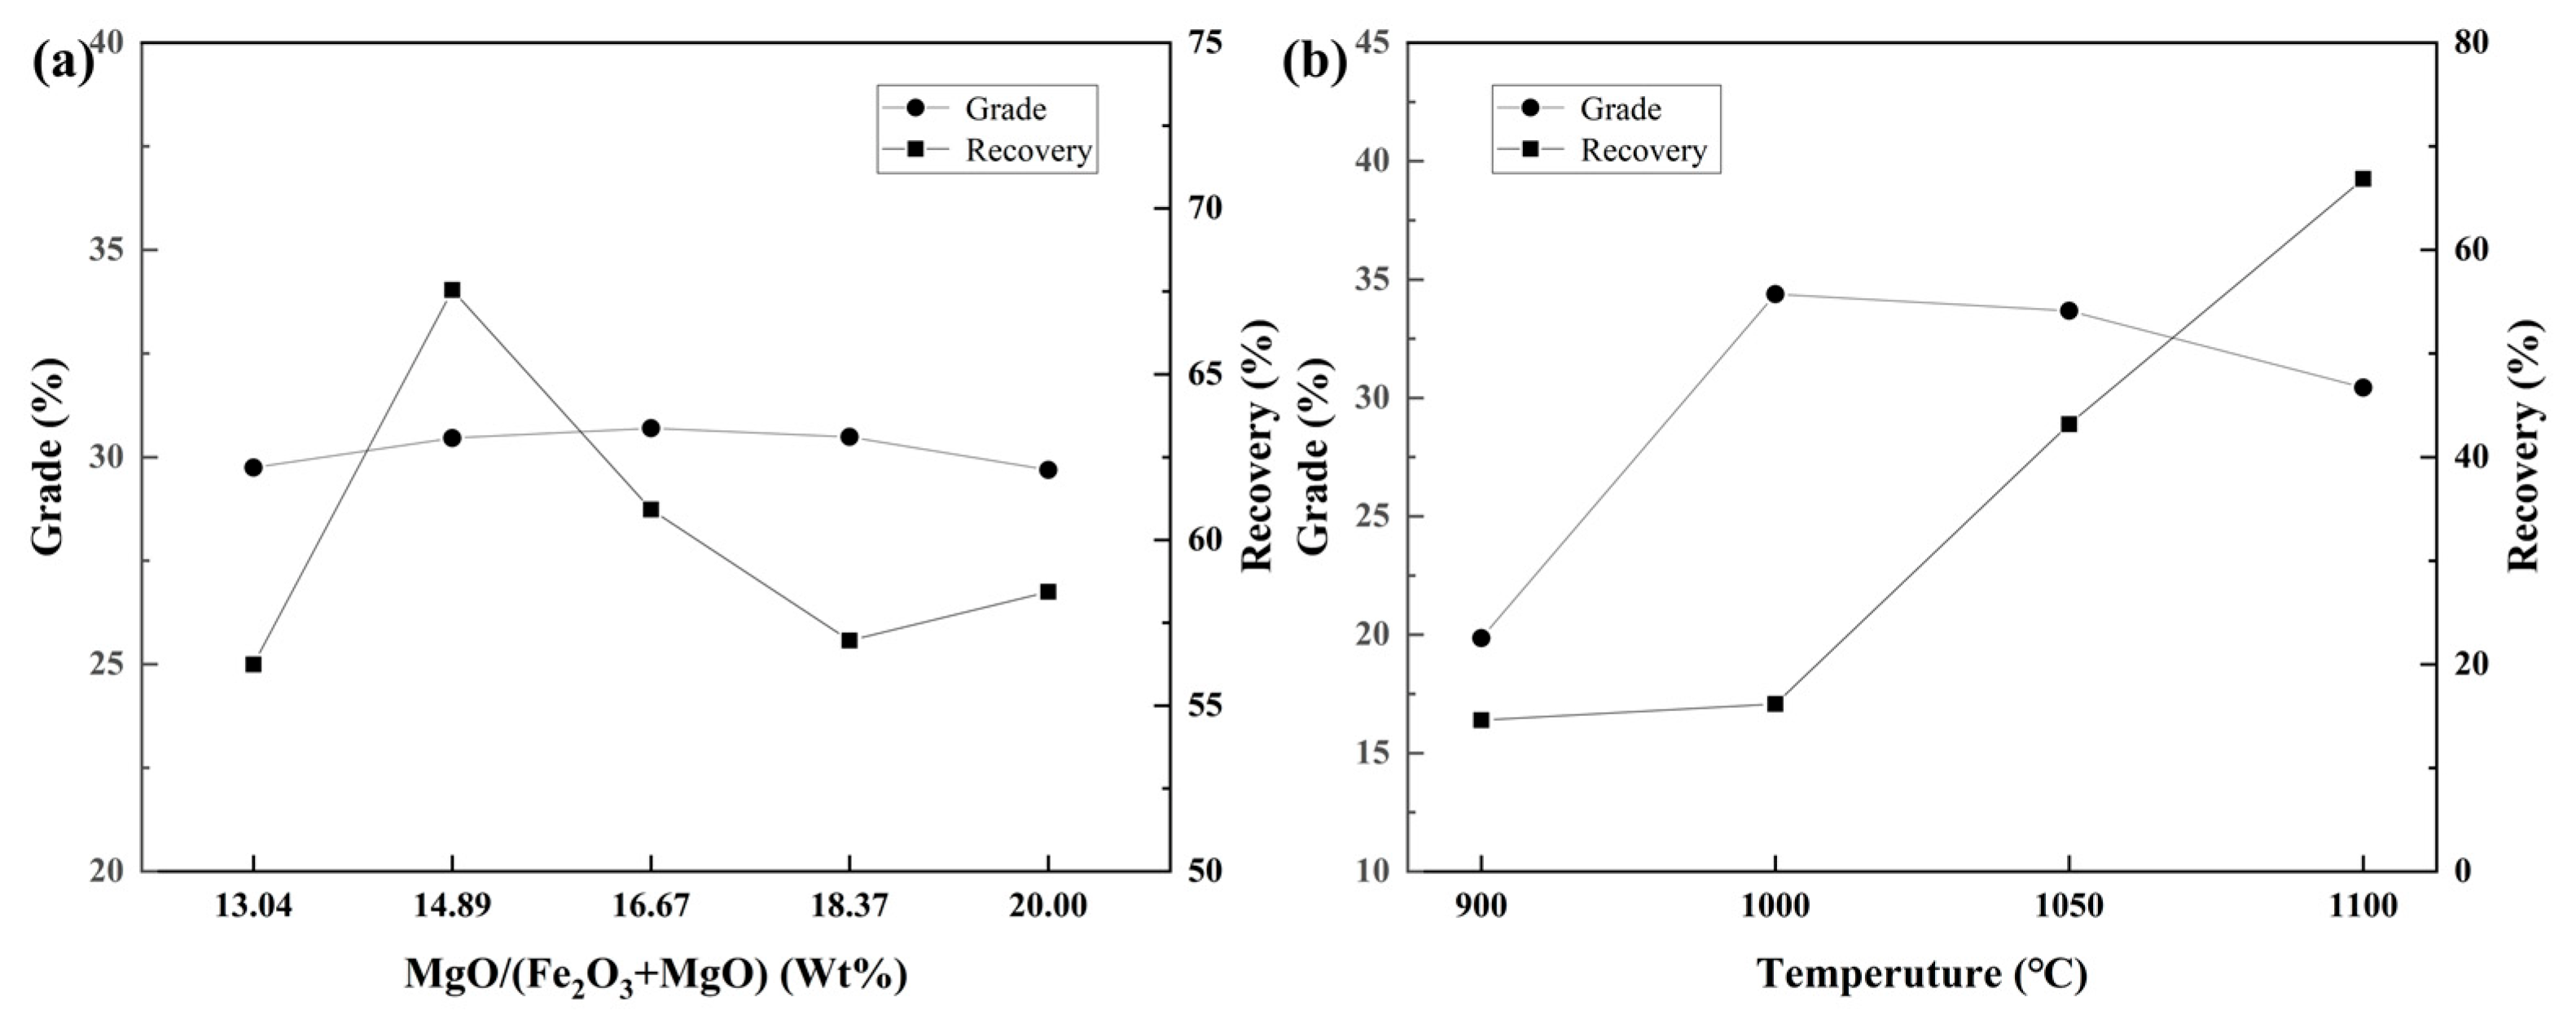
3.6. Magnetic Separation of Iron from Leaching Red Mud
4. Conclusions
Author Contributions
Funding
Data Availability Statement
Conflicts of Interest
References
- Economou-Eliopoulos, M. Potential leaching of Cr(VI) from laterite mines and residues of metallurgical products (red mud and slag): An integrated approach. J. Geochem. Explor. 2016, 162, 40–49. [Google Scholar] [CrossRef]
- Agrawal, S.; Dhawan, N. Evaluation of red mud as a polymetallic source—A review. Miner. Eng. 2021, 171, 107084. [Google Scholar] [CrossRef]
- Hadji, R.; Boumazbeur, A.E.; Limani, Y.; Baghem, M.; Chouabi, A.E.M.; Demdoum, A. Geologic, topographic and climatic controls in landslide hazard assessment using GIS modeling: A case study of Souk Ahras region, NE Algeria. Quat. Int. 2013, 302, 224–237. [Google Scholar] [CrossRef]
- Zhang, T.A.; Wang, K.; Liu, Y.; Lyu, G.Z.; Li, X.F.; Chen, X. A Review of Comprehensive Utilization of High-Iron Red Mud of China. In Proceedings of the Light Metals Symposia at the 149th The-Minerals-Metals-and-Materials-Society (TMS) Annual Meeting and Exhibition, San Diego, CA, USA, 23–27 February 2020; Springer International Publishing Ag: San Diego, CA, USA, 2020; pp. 65–71. [Google Scholar]
- Chen, X.; Guo, Y.; Ding, S.; Zhang, H.; Xia, F.; Wang, J.; Zhou, M. Utilization of red mud in geopolymer-based pervious concrete with function of adsorption of heavy metal ions. J. Clean. Prod. 2019, 207, 789–800. [Google Scholar] [CrossRef]
- Mukiza, E.; Zhang, L.; Liu, X.; Zhang, N. Utilization of red mud in road base and subgrade materials: A review. Resour. Conserv. Recycl. 2019, 141, 187–199. [Google Scholar] [CrossRef]
- Ahmadi, H.; Khalaj, G.; Najafi, A.; Abbasi, S.M.; Safari, M. Metakaolin-red mud/carbon nanotubes geopolymer nanocomposite: Mechanical properties and structural studies. Mater. Res. Express 2022, 9, 025011. [Google Scholar] [CrossRef]
- Wang, M.; Liu, X. Applications of red mud as an environmental remediation material: A review. J. Hazard. Mater. 2021, 408, 124420. [Google Scholar] [CrossRef]
- Luo, H.-L.; Huang, S.-S.; Luo, L.; Liu, Y.; Tian, J. In-situ stabilization remediation of lead contaminated soil by application of red mud based particles. J. Cent. South Univ. 2011, 42, 1819–1824. [Google Scholar]
- Liu, Q.; Xin, R.; Li, C.; Xu, C.; Yang, J. Application of red mud as a basic catalyst for biodiesel production. J. Environ. Sci. 2013, 25, 823–829. [Google Scholar] [CrossRef]
- Sushil, S.; Batra, V.S. Catalytic applications of red mud, an aluminium industry waste: A review. Appl. Catal. B-Environ. 2008, 81, 64–77. [Google Scholar] [CrossRef]
- Rezaei, H.; Shafaei, S.Z.; Abdollahi, H.; Shahidi, A.; Ghassa, S. A sustainable method for germanium, vanadium and lithium extraction from coal fly ash: Sodium salts roasting and organic acids leaching. Fuel 2022, 312, 122844. [Google Scholar] [CrossRef]
- Kaußen, F.M.; Friedrich, B. Methods for Alkaline Recovery of Aluminum from Bauxite Residue. J. Sustain. Metall. 2016, 2, 353–364. [Google Scholar] [CrossRef] [Green Version]
- Bruckard, W.J.; Calle, C.M.; Davidson, R.H.; Glenn, A.M.; Jahanshahi, S. Smelting of bauxite residue to form a soluble sodium aluminium silicate phase to recover alumina and soda. Miner. Process. Extr. Metall. 2010, 119, 18–260. [Google Scholar] [CrossRef]
- Li, X.B.; Xiao, W.; Liu, W.; Liu, G.H.; Peng, Z.H.; Zhou, Q.S.; Qi, T.G. Recovery of alumina and ferric oxide from Bayer red mud rich in iron by reduction sintering. Trans. Nonferrous Met. Soc. China 2009, 19, 1342–1347. [Google Scholar] [CrossRef]
- Liu, W.; Sun, S.; Zhang, L.; Jahanshahi, S.; Yang, J. Experimental and simulative study on phase transformation in Bayer red mud soda-lime roasting system and recovery of Al, Na and Fe. Miner. Eng. 2012, 39, 213–218. [Google Scholar] [CrossRef]
- Pei, J.; Pan, X.; Zhang, Y.; Yu, H.; Tu, G. A novel process to fully utilize red mud based on low-calcium sintering. J. Environ. Chem. Eng. 2021, 9, 106754. [Google Scholar] [CrossRef]
- Rayapudi, V. Extraction of Iron values from Red mud. Mater. Today Proc. 2018, 5, 17064–17072. [Google Scholar]
- Qi, Z.; Joshi, I.P.; Liu, R.; Li, Y.; Liu, H.; Qu, J. Adsorption combined with superconducting high gradient magnetic separation technique used for removal of arsenic and antimony. J. Hazard. Mater. 2018, 343, 36–48. [Google Scholar] [CrossRef]
- Archambo, M.; Kawatra, S.K. Red Mud: Fundamentals and New Avenues for Utilization. Miner. Process. Extr. Metall. Rev. 2021, 42, 427–450. [Google Scholar] [CrossRef]
- Rao, M.; Zhuang, J.; Li, G.; Zeng, J.; Jiang, T. Iron Recovery from Red Mud by Reduction Roasting-Magnetic Separation. In Light Metals 2013; Springer: Berlin/Heidelberg, Germany, 2013. [Google Scholar]
- Ding, W.; Xiao, J.-H.; Peng, Y.; Shen, S.-Y.; Chen, T. Iron Extraction from Red Mud using Roasting with Sodium Salt. Miner. Process. Extr. Metall. Rev. 2021, 42, 153–161. [Google Scholar]
- Li, G.; Liu, M.; Rao, M.; Jiang, T.; Zhuang, J.; Zhang, Y. Stepwise extraction of valuable components from red mud based on reductive roasting with sodium salts. J. Hazard. Mater. 2014, 280, 774–780. [Google Scholar] [CrossRef]
- Ding, W.; Xiao, J.; Peng, Y.; Shen, S.; Chen, T.; Zou, K.; Wang, Z. A novel process for extraction of iron from a refractory red mud. Physicochem. Probl. Miner. Process. 2020, 56, 125–136. [Google Scholar] [CrossRef]
- Gateshki, M.; Petkov, V.; Pradhan, S.K.; Vogt, T. Structure of nanocrystalline MgFe2O4 from X-ray diffraction, Rietveld and atomic pair distribution function analysis. J. Appl. Crystallogr. 2005, 38, 772–779. [Google Scholar] [CrossRef] [Green Version]
- Foroughi, F.; Hassanzadeh-Tabrizi, S.A.; Bigham, A. In situ microemulsion synthesis of hydroxyapatite-MgFe2O4 nanocomposite as a magnetic drug delivery system. Mater. Sci. Eng. C-Mater. Biol. Appl. 2016, 68, 774–779. [Google Scholar] [CrossRef]
- Manikandan, M.; Manimuthu, P.; Venkateswaran, C. Structural and Magnetic properties of MgFe2O4 Ceramic. In Proceedings of the 2nd International Conference on Optoelectronic Materials and Thin Films for Advanced Technology (OMTAT), Kochi, India, 3–5 January 2013; pp. 194–196. [Google Scholar]
- Sattar, A.A.; Wafik, A.H.; Kandil, K.M. The effect of sintering temperature on microhardness and Barkhausen jumps of Ni and Mg ferrites. J. Phys. D 1996, 29, 25–28. [Google Scholar] [CrossRef]
- Xue, P.; He, D.; Xu, A.; Gu, Z.; Yang, Q.; Engstrom, F.; Bjorkman, B. Modification of industrial BOF slag: Formation of MgFe2O4 and recycling of iron. J. Alloy. Compd. 2017, 712, 640–648. [Google Scholar] [CrossRef]
- He, Z.; Lan, M.; Hu, X.; Xue, X.; Chou, K.-C. Study on Oxidation Behavior of Industrial Basic Oxygen Furnace Slag and Recovery of Magnetic Iron-Containing Phase. Steel Res. Int. 2022, 93, 2100558. [Google Scholar] [CrossRef]
- He, L.; Shi, L.; Huang, Q.; Hayat, W.; Shang, Z.; Ma, T.; Wang, M.; Yao, W.; Huang, H.; Chen, R. Extraction of alumina from aluminum dross by a non-hazardous alkaline sintering process: Dissolution kinetics of alumina and silica from calcined materials. Sci. Total Environ. 2021, 777, 146123. [Google Scholar] [CrossRef]
- Hodge, H.; Rowles, M.R.; Hayes, P.C.; Hawker, W.; Vaughan, J. Bauxite residue sinter leach process—Phases formation, reaction pathways and kinetics. Miner. Process. Extr. Metall. 2021, 130, 341–353. [Google Scholar] [CrossRef]
- Qi, T.; Liu, N.; Li, X.; Peng, Z.; Liu, G.; Zhou, Q. Thermodynamics of chromite ore oxidative roasting process. J. Cent. South Univ. Technol. 2011, 18, 83–88. [Google Scholar] [CrossRef]
- Thibodeau, E.; Gheribi, A.E.; Jung, I.-H. A Structural Molar Volume Model for Oxide Melts Part III: Fe Oxide-Containing Melts. Metall. Mater. Trans. B 2016, 47, 1187–1202. [Google Scholar] [CrossRef]
- Eremin, N.I. Phase composition of aluminocalcium sinters in the system CaO-Al2O3-SiO2-Na2O-MgO-Fe2O3. Inorg. Mater. 1973, 9, 1102–1104. [Google Scholar]
- Blackman, L. On the Formation of Fe2+ in the System MgO-Fe2O3-MgFe2O4 at High Temperatures. J. Am. Ceram. Soc. 1959, 42, 143–145. [Google Scholar] [CrossRef]
- O’Neill, H.S.C.; Annersten, H.; Virgo, D. The temperature dependence of the cation distribution in magnesioferrite (MgFe2O4) from powder XRD structural refinements and Mössbauer spectroscopy. Am. Mineral. 1992, 77, 725–740. [Google Scholar]
- Dieckmann, R.; Schmalzried, H. Defects and Cation Diffusion in Magnetite (I). In Berichte Der Bunsengesellschaft Für Physikalische Chemie; Wiley: Hoboken, NJ, USA, 1977. [Google Scholar]
- Dieckmann, R.; Schmalzried, H. Defects and Cation Diffusion in Magnetite (II). In Berichte Der Bunsengesellschaft Für Physikalische Chemie; Wiley: Hoboken, NJ, USA, 1977. [Google Scholar]
- Yang, J.; Sun, H.; Peng, T.; Zeng, L.; Chao, L. Separation of alumina from aluminum-rich coal fly ash using NaOH molten salt calcination and hydrochemical process. Clean Technol. Environ. Policy 2022, 24, 1507–1519. [Google Scholar] [CrossRef]
- Whittington, B.I. The Chemistry of CaO and Ca(OH)2 Relating to the Bayer Process. Hydrometallurgy 1996, 43, 13–35. [Google Scholar] [CrossRef]
- Liu, G.H.; He, Q.; Li, X.B.; Peng, Z.H.; Zhou, Q.S. Synthesis and reaction behavior of calcium silicate hydrate in basic system. Trans. Nonferrous Met. Soc. China 2004, 14, 1204–1209. [Google Scholar]


| Compound | Fe2O3 | Al2O3 | CaO | Na2O | SiO2 | TiO2 | SO3 | ZrO2 | K2O |
|---|---|---|---|---|---|---|---|---|---|
| Mass percentage | 27.95 | 23.36 | 16.58 | 8.05 | 14.93 | 6.21 | 0.771 | 0.364 | 0.344 |
| Compound | Cr2O3 | MgO | P2O5 | V2O5 | Cl | MnO | CeO2 | As2O3 | Nb2O5 |
| Mass percentage | 0.322 | 0.244 | 0.236 | 0.131 | 0.104 | 0.0932 | 0.0687 | 0.0432 | 0.0411 |
| Compound | ZnO | SrO | Sc2O3 | PbO | NiO | CuO | WO3 | Ga2O3 | Sum |
| Mass percentage | 0.0131 | 0.0129 | 0.0121 | 0.0106 | 0.0093 | 0.0078 | 0.0061 | 0.0042 | 96.5 |
| Point | O | Na | Al | Si | Ca | Fe |
|---|---|---|---|---|---|---|
| 1 | 53.58 | 8.42 | 5.91 | 4.09 | 0.71 | 27.30 |
| 2 | 60.51 | 13.02 | 11.12 | 10.55 | 1.01 | 3.79 |
| 3 | 63.43 | 4.31 | 3.08 | 2.07 | 0.65 | 24.46 |
| Reaction Number | Chemical Reaction |
|---|---|
| (1) | 2CaO + MgO + 2SiO2 = Ca2MgSi2O7 |
| (2) | MgO + Fe2O3 = MgFe2O4 |
| (3) | 2MgO + SiO2 = Mg2SiO4 |
| (4) | MgO + CaO + 2SiO2 = CaMgSi2O6 |
| (5) | 2CaO + SiO2 = Ca2SiO4 |
| (6) | Fe2O3 + Na2CO3 = 2NaFeO2 + CO2 (g) |
| (7) | Fe2O3 + CaO = CaO·Fe2O3 |
| (8) | Fe2O3 + 2CaO = 2CaO·Fe2O3 |
| (9) | 2 CaO·Fe2O3 + 2MgO + SiO2 = 2MgFe2O4 + Ca2SiO4 |
| (10) | 2CaO·Fe2O3 + MgO + SiO2 = MgFe2O4 + Ca2SiO4 |
| Point | Mineral Phases | O | Na | Mg | Al | Si | Ca | Ti | Fe |
|---|---|---|---|---|---|---|---|---|---|
| 1 | NaAlO2 | 52.13 | 22.28 | 0.15 | 16.91 | 2.44 | 1.41 | 0.41 | 4.26 |
| 2 | MgFe2O4 | 47.23 | 1.42 | 13.30 | 4.60 | 1.16 | 3.42 | 0.42 | 28.44 |
| 3 | C2S | 63.11 | 3.00 | 0.24 | 1.58 | 10.00 | 19.87 | 0.81 | 1.4 |
| 4 | C2F | 57.89 | 1.32 | 0.34 | 2.18 | 1.25 | 18.48 | 0.97 | 17.56 |
| 5 | C2S | 68.59 | 0.62 | 0.39 | 0.81 | 9.72 | 17.78 | 0.40 | 1.70 |
| 6 | MgFe2O4 | 58.74 | 0.15 | 11.55 | 2.90 | 1.24 | 2.49 | 0.37 | 22.55 |
| 7 | CaCO3 | 71.80 | 0.13 | 0.64 | 0.72 | 1.14 | 22.07 | 0.96 | 2.64 |
| 8 | MgFe2O4 | 59.13 | 0.32 | 10.70 | 2.62 | 1.60 | 4.45 | 0.93 | 20.26 |
| 9 | MgFe2O4 | 56.70 | 0.54 | 11.89 | 2.11 | 1.93 | 2.82 | 2.42 | 22.58 |
| Sample | MgO/(Fe2O3 + MgO) (wt%) | Temperature (°C) | |||||||
|---|---|---|---|---|---|---|---|---|---|
| 13.04 | 14.89 | 16.67 | 18.37 | 20.0 | 900 | 1000 | 1050 | 1100 | |
| Grade (%) | 29.75 | 30.46 | 30.70 | 30.49 | 29.69 | 19.86 | 34.38 | 33.68 | 29.43 |
| Recovery (%) | 56.24 | 67.54 | 60.92 | 56.96 | 58.43 | 14.60 | 16.18 | 43.18 | 66.85 |
Disclaimer/Publisher’s Note: The statements, opinions and data contained in all publications are solely those of the individual author(s) and contributor(s) and not of MDPI and/or the editor(s). MDPI and/or the editor(s) disclaim responsibility for any injury to people or property resulting from any ideas, methods, instructions or products referred to in the content. |
© 2023 by the authors. Licensee MDPI, Basel, Switzerland. This article is an open access article distributed under the terms and conditions of the Creative Commons Attribution (CC BY) license (https://creativecommons.org/licenses/by/4.0/).
Share and Cite
Chen, R.; Shi, L.; Huang, H.; Yuan, J. Extraction of Iron and Alumina from Red Mud with a Non-Harmful Magnetization Sintering Process. Minerals 2023, 13, 452. https://doi.org/10.3390/min13030452
Chen R, Shi L, Huang H, Yuan J. Extraction of Iron and Alumina from Red Mud with a Non-Harmful Magnetization Sintering Process. Minerals. 2023; 13(3):452. https://doi.org/10.3390/min13030452
Chicago/Turabian StyleChen, Rui, Lin Shi, Haoyong Huang, and Jie Yuan. 2023. "Extraction of Iron and Alumina from Red Mud with a Non-Harmful Magnetization Sintering Process" Minerals 13, no. 3: 452. https://doi.org/10.3390/min13030452