Article

Cracking and Microstructure Transition of Iron Ore Containing Goethite in Fe-C Melt Based on the HIsmelt Process

1
School of Metallurgy and Ecological Engineering, University of Science and Technology Beijing, Beijing 100083, China
2
School of Intelligence Science and Technology, University of Science and Technology Beijing, Beijing 100083, China
*
Authors to whom correspondence should be addressed.
Minerals 2023, 13(3), 448; https://doi.org/10.3390/min13030448
Submission received: 19 February 2023 / Revised: 8 March 2023 / Accepted: 15 March 2023 / Published: 22 March 2023
(This article belongs to the Section Mineral Processing and Extractive Metallurgy)

Abstract

:
The phenomenon of cracking and deterioration of iron ore particles is a widespread scientific problem in the field of mineral processing and metallurgy. In this paper, the thermal decomposition properties of iron ore were investigated by a non-isothermal method using thermogravimetric equipment, and the crack evolution behavior of iron ore within Fe-C melt was investigated experimentally, by scanning electron microscopy and Micro-CT. The results show that the start decomposition temperature of #2 iron ore is 292.7 °C, which is 37.3 °C higher compared to that of #1 iron ore, because of its smaller pores and the difficulty of water vapor diffusion. The initial decomposition of iron ore is the decomposition goethite to form water vapor, and as heat transfer continues, hematite particles break into smaller particles and decompose to form Fe3O4. During the smelting reduction process, the Crack index (CI) of #1 iron ore was 5.50% at 4 s, and the CI index increased to 23.54% when time was extended to 16 s, and the internal evolved from locally interconnected holes to cracked structure. The iron ore maintains a relatively intact form during reduction within the Fe-C melt, and interfacial reduction reaction is dominant in the later stage.

1. Introduction

Crack and deterioration of iron ore particles is a common scientific problem during the iron ore processing such as mining, blast furnace and smelting reduction process [1,2,3,4,5]. Generally, the cracking and microstructure transition of iron ore are caused by mechanical degradation, thermal decomposition or reduction degradation [5]. The mechanical degradation is mainly due to the crushing between the particles during transportation or processing [4]. This has been more fully studied by previous authors.
Cracking of iron ore during thermal decomposition and reduction degradation is related to the volatilization of minerals containing volatile substances [6], thermal expansion and phase transformation during reduction [7,8,9,10]. The influence of these factors varies in the actual process. Strezov et al. investigated the thermal deterioration of two types of iron ore, goethite and hematite, during thermal processing. The goethite would undergo decomposition reaction near 300 °C because of removal of hydrogen bonds [4]. The study have indicated that the high goethite content of iron ore will increase the fines during thermal treatment [11]. The thermal decomposition of hematite starts at a higher temperature than that of goethite, and the decomposition products are mainly magnetite [12,13]. Qu et al. studied the decomposition behavior of iron ore fine in the HIsarna smelting reduction process [14]. The decomposition temperature of Fe2O3 in inert atmosphere was 1200–1300 °C, and that of Fe3O4 was higher than 1500 °C. The activation energies of hematite decomposition in air and inert atmosphere are 382 kJ/mol and 324 kJ/mol, respectively [15]. Different atmospheres would cause different thermal decomposition temperatures. The thermal decomposition temperature in air atmospheres is lower than that in inert places [16,17].
Meanwhile, iron ore as an important raw material for blast furnace ironmaking will be broken inside the blast furnace. Qi et al. showed that after standard thermal cracking experiments, a large number of cracks existed inside the lump, which were highly susceptible to generate fine by extrusion inside a blast furnace [18]. Additionally, the thermal cracking index of lump ore under a reducing atmosphere and a N2 atmosphere at 900 °C was compared and analyzed, showing that the thermal cracking effect of the reducing atmosphere on lump better reflects the objective situation of the blast furnace. Mizutani et al. investigated the cracking phenomenon of sinter, pellet and lump due to reduction in the blast furnace by an in situ evaluation method [19]. Large amounts of acoustic emissions (AEs) are detected at the thermal process of iron ore containing goethite, and the cracking is associated with the reduction ability of H2 and CO. The decomposition and bursting phenomena of iron ore in inert atmosphere, air atmosphere and reducing gas conditions have been studied by previous authors, but less research has been performed on the cracking and crushing of iron ore within Fe-C melt with the development of the bath smelting reduction process [20,21,22,23,24]. The main differences with previous studies are as follows: firstly, the temperature conditions of the iron ore are different; the former mainly studied the decomposition phenomenon of goethite at 700–900 °C, while the temperature of high temperature melts is generally 1400 °C and above. Secondly, the reducing atmospheres are different; the microstructural transformation of iron ore under reducing gases such as H2 or CO was mainly studied by previous authors, while the reducing agent of iron ore under high temperature melt is liquid Fe-C melt, which could not be ignored [25,26,27]. Thirdly, the confining pressure is different. The confining pressure of iron ore in the previous study is atmospheric pressure, and the confining pressure is small, while the iron ore in the melt is under the pressure of the melt, which results in a larger confining pressure. Therefore, this paper firstly investigates the thermal decomposition properties of iron ore under the TG-DSC method and X-ray diffraction analysis technique. Secondly, the microstructure and characteristic indexes of iron ore within the Fe-C melt were explored by experiments, scanning electron microscopy and Micro-CT technologies in order to clarify its cracking and microstructural evolution within the Fe-C melt.

2. Materials and Methods

2.1. Raw Materials

Two iron ores containing goethite samples were selected in the experiment, of which the chemical composition tested by the indicator titration method is shown in Table 1. The total iron content (TFe) of #1 and #2 is 64.54wt % and 63.85wt %, respectively. The SiO2 content of #1 is 0.79wt %, which is lower than that of #2. The Al2O3 content of #1 of is 1.64wt %, which is higher than that of #2. The LOSS of samples indicates that the two iron ores contain a goethite phase.
The microstructure of #1 iron ore is shown in Figure 1. The iron-bearing minerals are embedded with the gangue in a distributed structure, and some of the gangues are covered by hematite. Goethite and hematite in ore have symbiotic structure. Additionally, goethite, that is mainly distributed in the edge of pores or holes, is mainly embedded inside hematite. Most of the pore sizes inside #1 iron ore are around 20 μm in diameter.
The diameter of local connecting pores could reach 67 μm, and there are also 2.5 μm tiny pores. The hematite in #2 iron ore (as shown in Figure 2) shows irregularly shaped crystalline structure. Goethite in the hematite matrix presents a larger patchy structure, with local strips of finer needle iron ore structures distributed at the edges of pores. The pore diameters within #2 iron ore are smaller compared to that of #1 iron ore, with the small pores being mostly 2.5 μm in diameter; the large pores are mostly 20 μm in diameter.

2.2. Experimental Methods

The equipment used for non-isothermal decomposition experiments of iron ore is the simultaneous thermal analyzer (NETZSCH STA 449F3). Iron ore of 50 mg was placed in the equipment with temperature range of 30–1500 °C and heating rate of 20 °C/min. The experimental atmosphere was protected by argon, and the weighing accuracy was 0.1 μg. The data were automatically recorded during the experiment. The TG-DSC curve was finally calculated and the thermal decomposition of iron ore.
Cracking experiments of iron ore in Fe-C melt were conducted in a self-made high-temperature tube furnace device. The 300 g mixed sample of reduced iron powder and graphite was placed in a corundum crucible, then the corundum crucible was placed in the high-temperature tube furnace device. The sample was heated to 1450 °C in an inert atmosphere (Ar 5 L/min), and maintain for 30min for homogenization. The 10 mm × 10 mm × 10 mm iron ore was placed in Fe-C melt and left to quench to room temperature after a certain period of time. The samples were further analyzed to study the internal microstructure and crack distribution.

2.3. Analytical Methods

The microstructure of iron ore with different dissolution times are observed by scanning electron microscope (SEM) (GEMINISEM 500, ZEISS, Oberkochen, Germany) equipped with energy dispersive spectrometer (EDS) (ULTIM MAX40, Oxford Instruments, Oxford, UK). Additionally, the internal cracking characteristics are obtained by Micro-CT (YXLON FF35CT, YXLON, Hamburg, Germany).

3. Results and Discussion

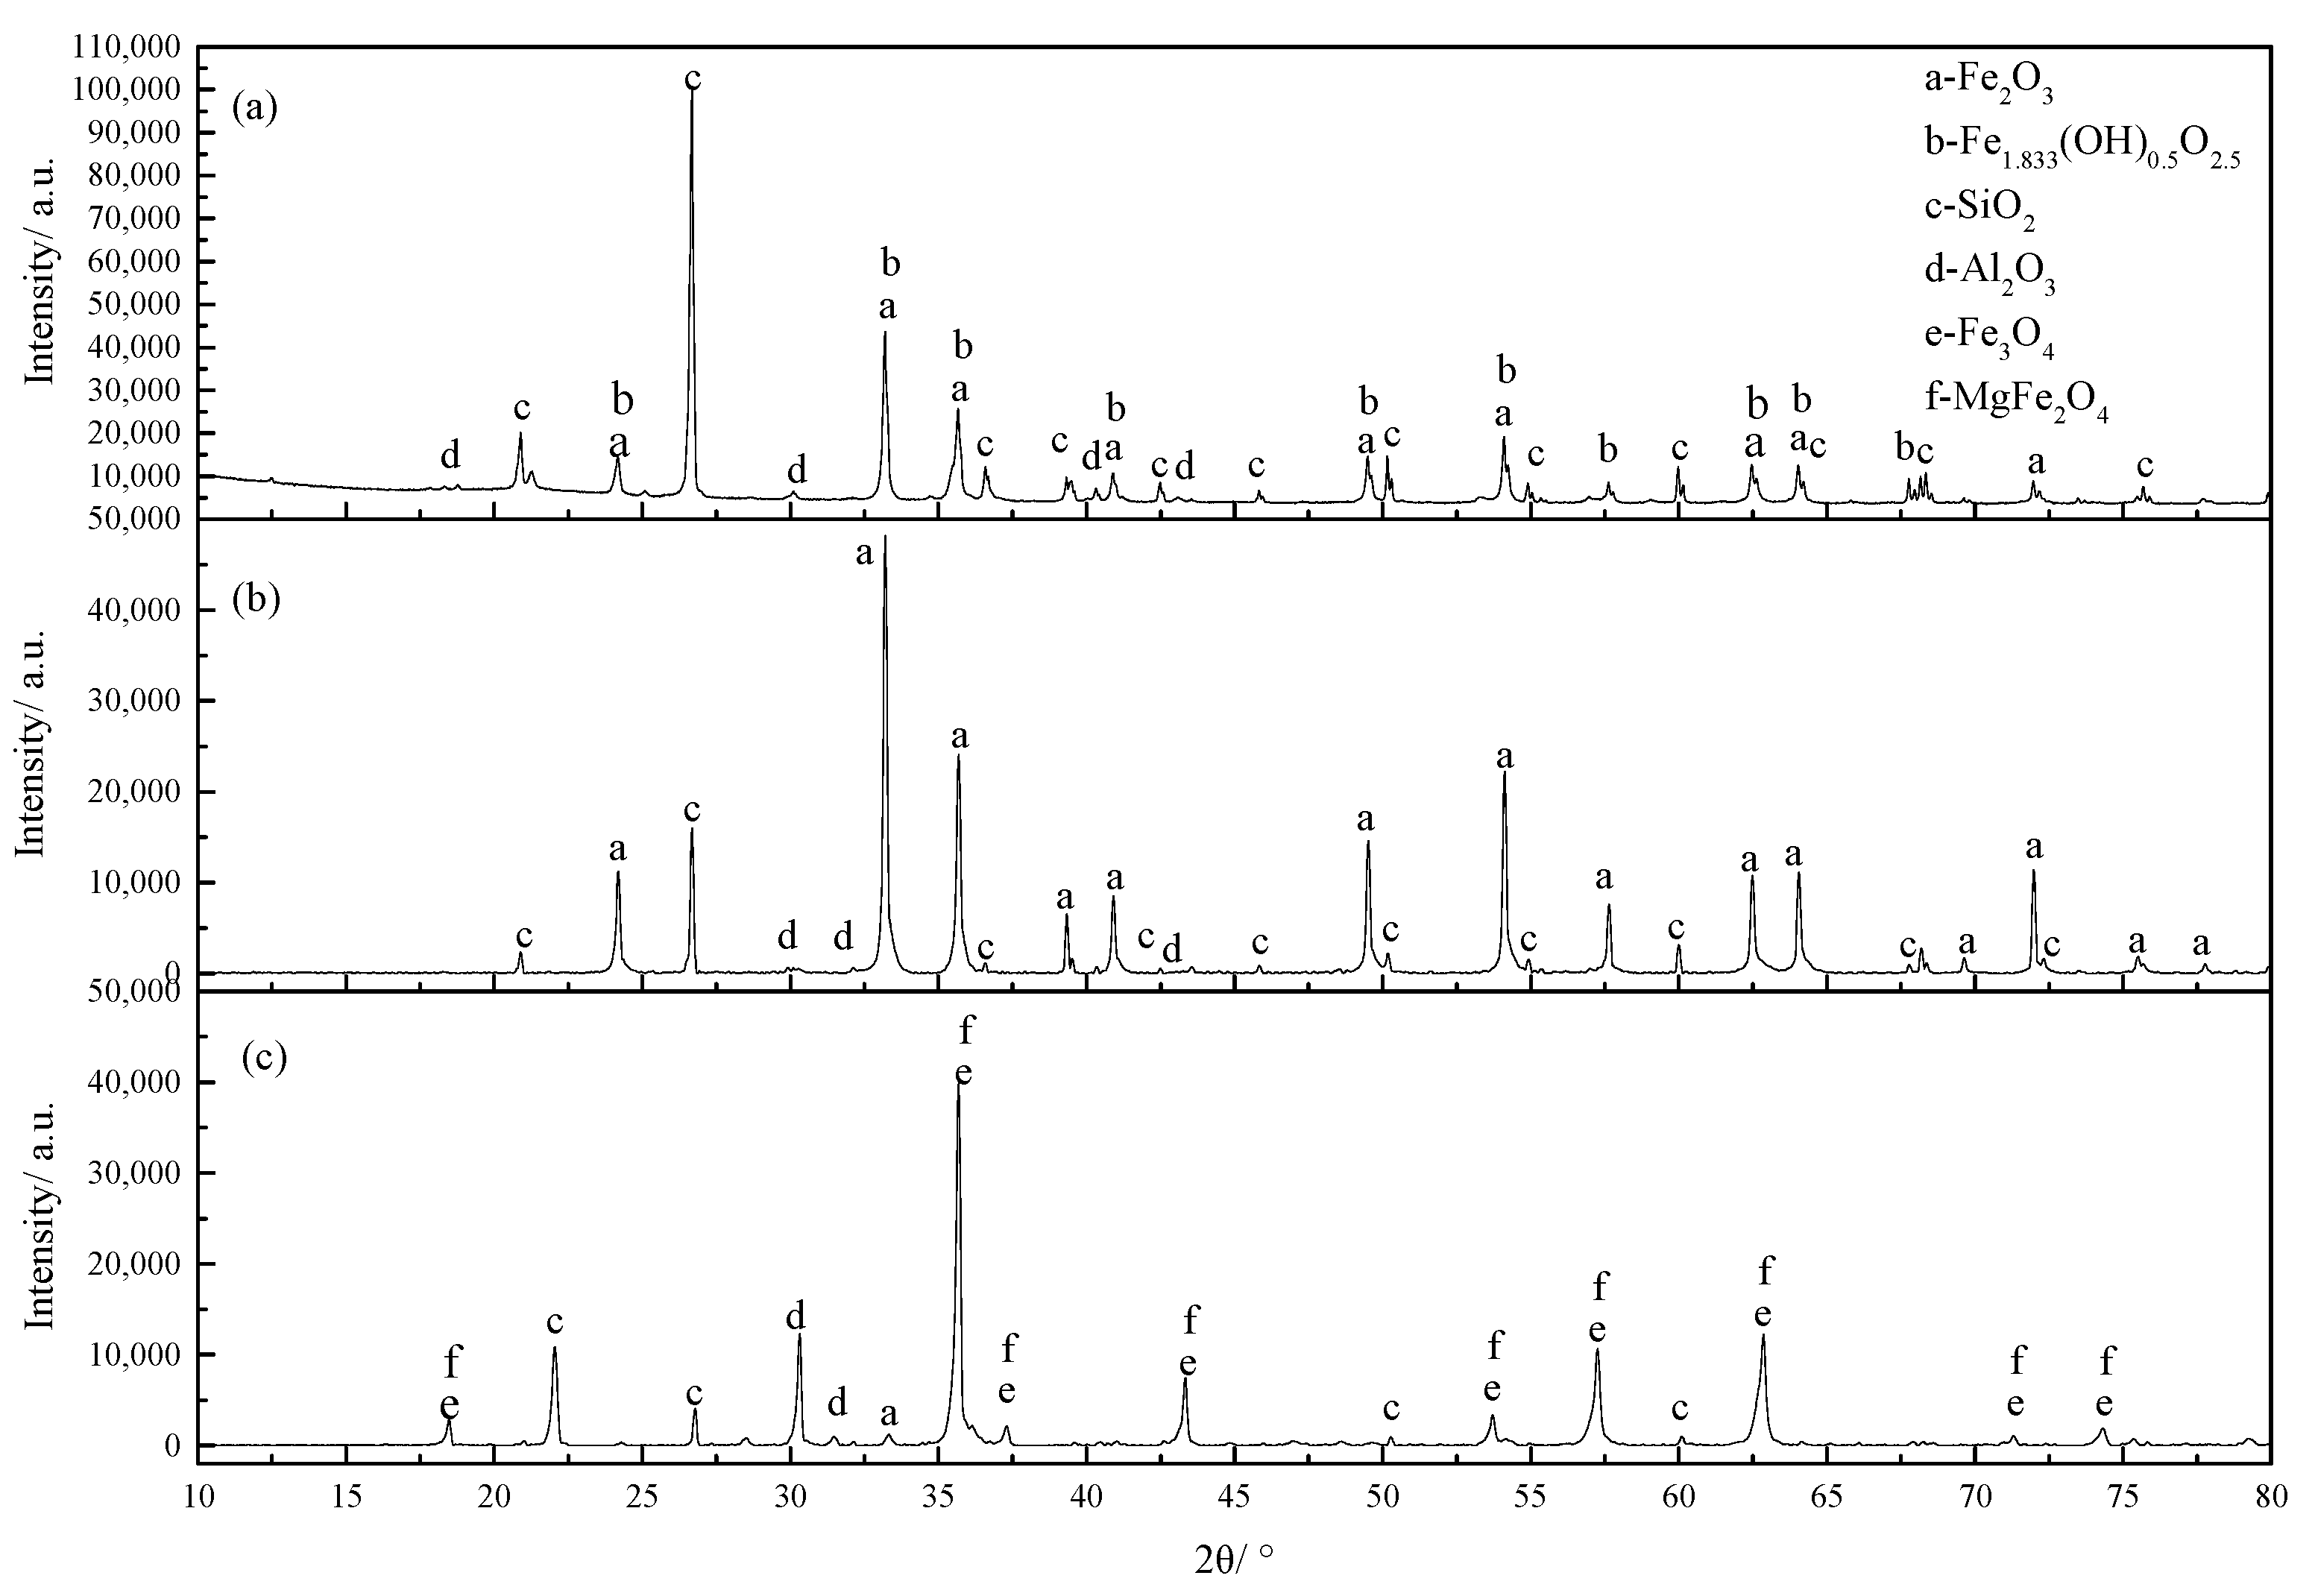
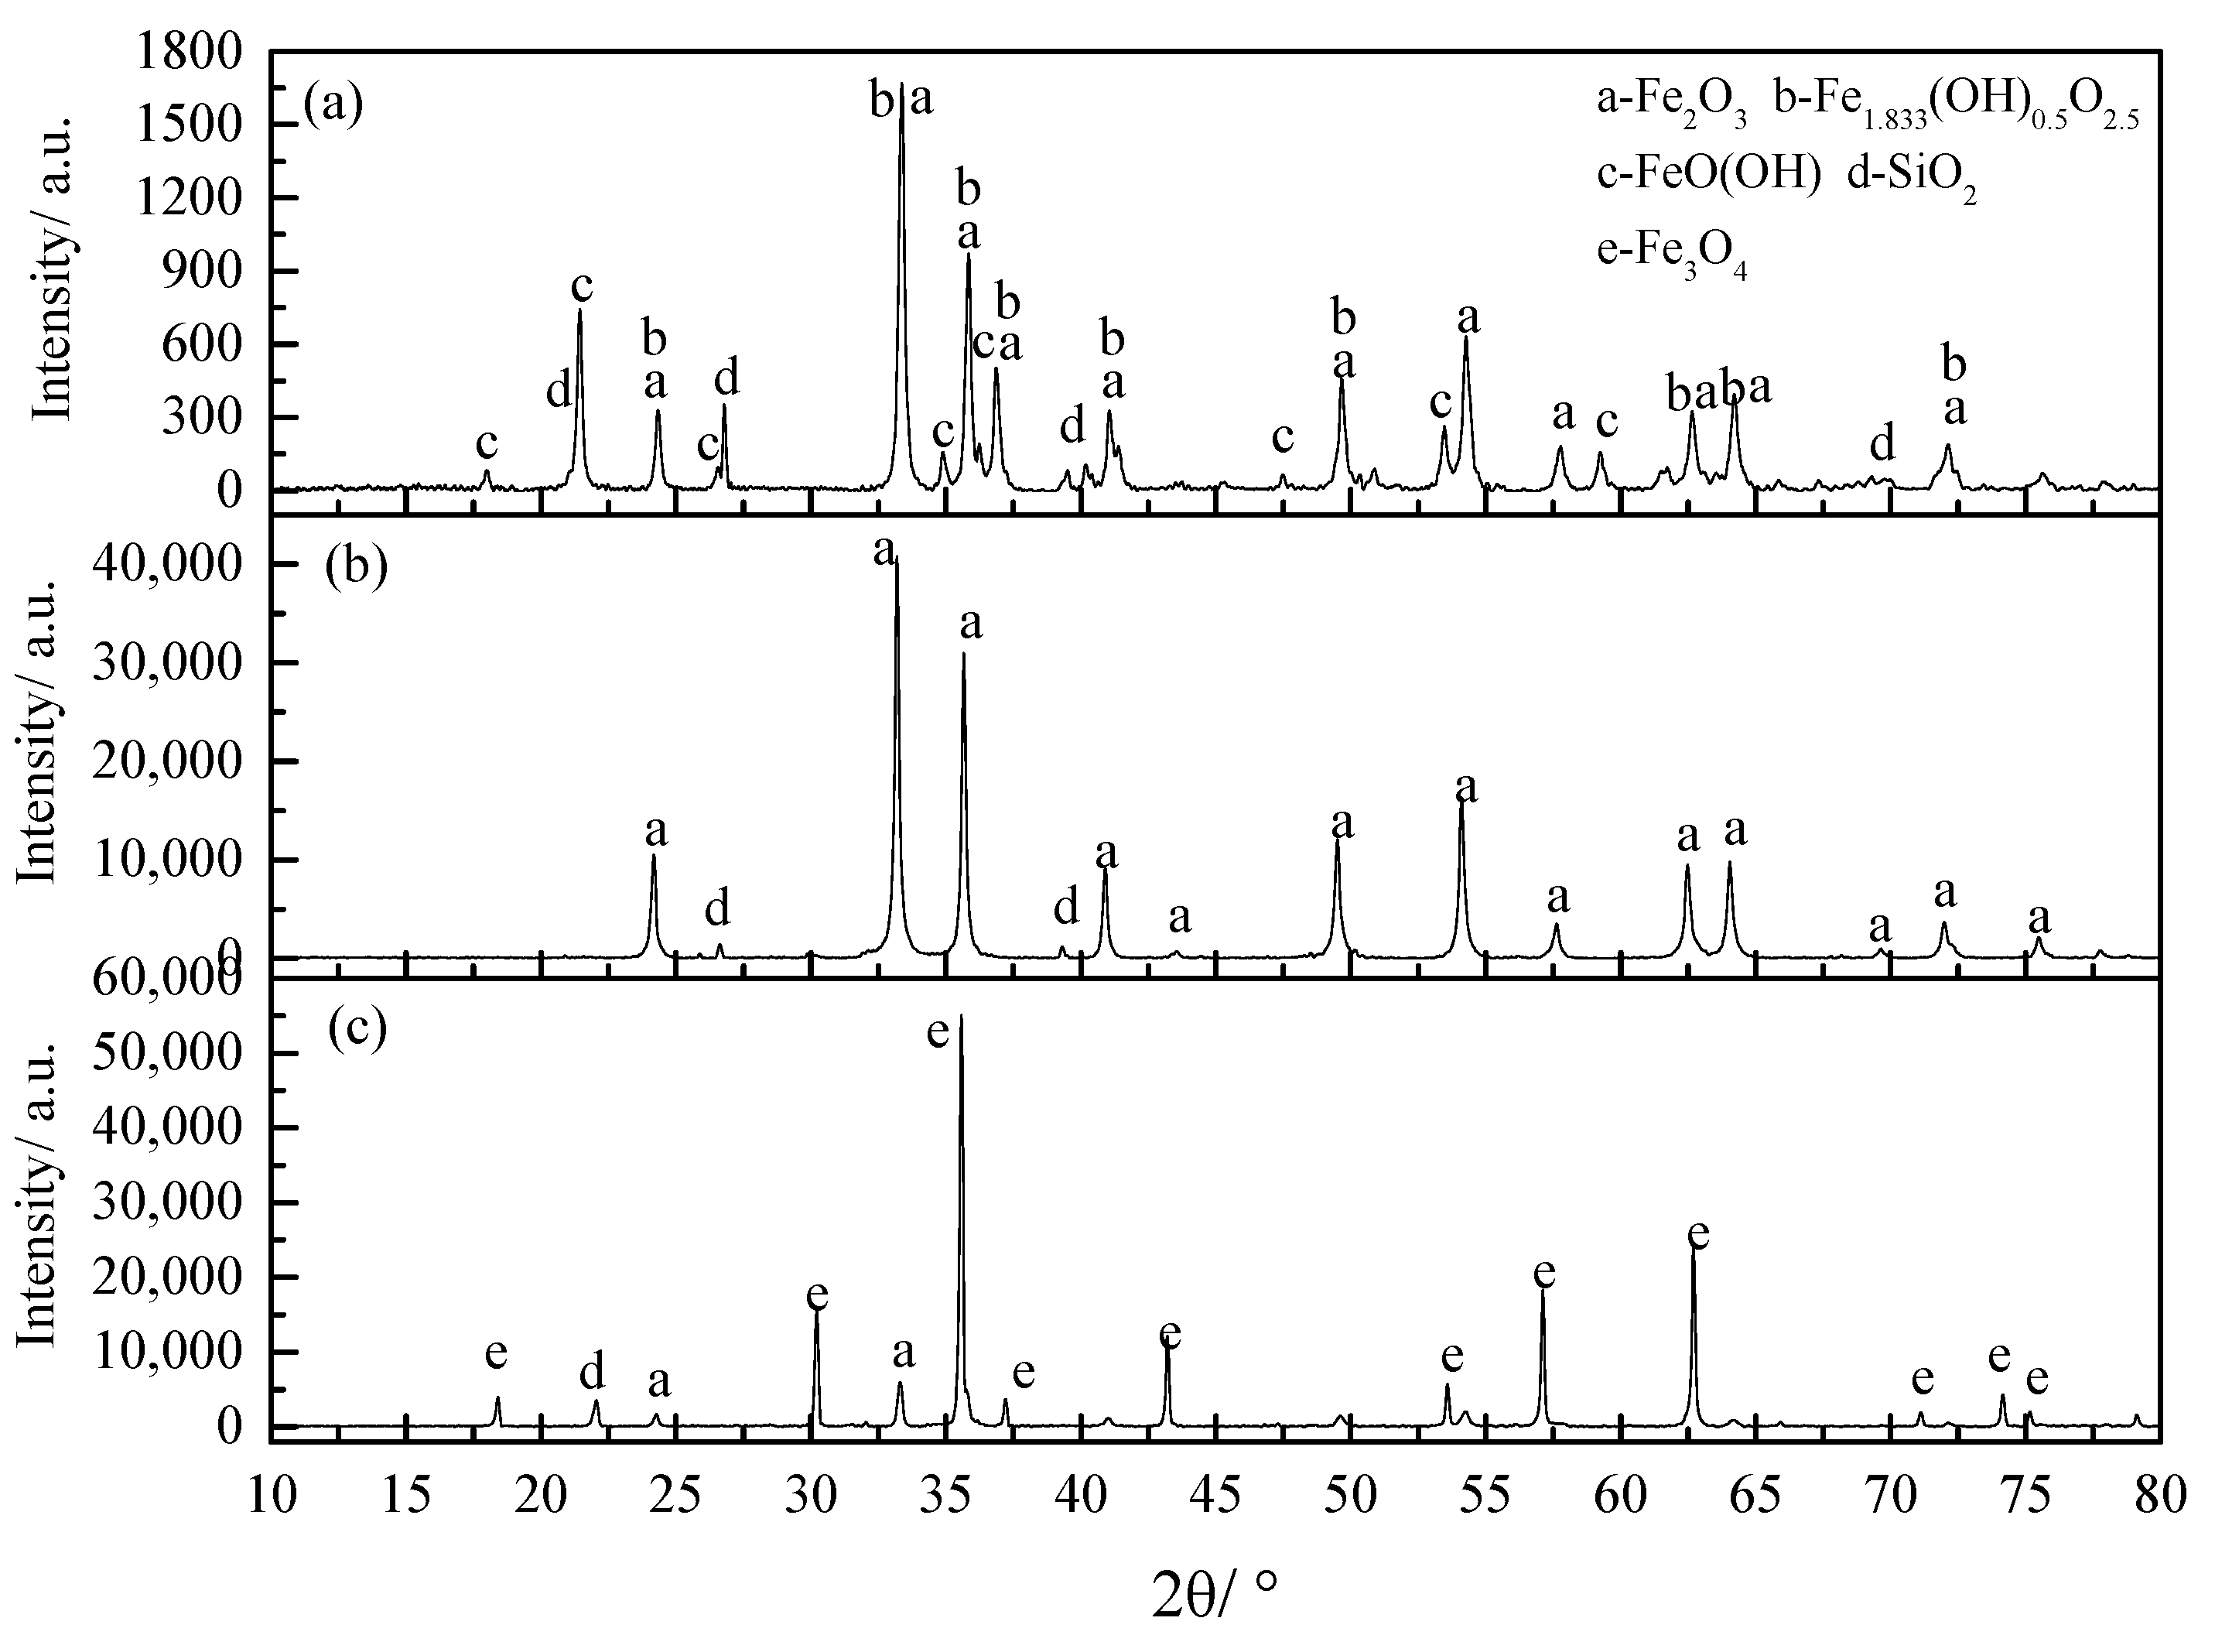
3.1. Thermal Decomposition Analysis

The TG/DSC curves of #1 and #2 iron ore are shown in Figure 3. It can be seen that #1 iron ore had two stages of decomposition weight loss during the heat process. The weight loss in the first stage was 6.88 wt% with initial decomposition temperature of 255.4 °C and end decomposition temperature of 303.0 °C, in which the decomposition rate decreased by two-fold. The decomposition rate was the fastest at 291.2 °C, and then the decomposition was obvious at 350.7 °C. The overall decomposition heat absorption in the first stage was 66.41 J/g, with two decomposition heat absorption peaks. The weight loss at high temperature (second stage) was 3.83%, the reaction started at 1053.8 °C and ended at 1366.2 °C; in the second decomposition stage, the DSC curve showed a total of two consecutive heat absorption peaks, 24.54 J/g and 12.60 J/g, respectively.
The weight loss of #2 iron ore in first stage of decomposition is 6.75%. The initial temperature of decomposition is 292.7 °C, the end temperature of decomposition is 382.7 ℃ with endothermic peak of 209.8 J/g. Compared with #1 iron ore, the initial decomposition temperature #2 iron ore increased by 37.3 °C, the end of decomposition temperature increased by 79.7 °C, and the heat absorption increased by 143.39 J/g. The weight loss of #2 at high temperature is 3.05%, the initial temperature of decomposition is 1165.0 °C, and the end temperature is 1340.0 °C, with two heat absorption peaks of 258.18 J/g and 254.94 J/g, respectively, which is higher than that of #1.
In order to investigate the phase transformation of iron ore during the whole decomposition process, X-ray diffraction analysis was performed on the iron ore and with different temperatures. The results of XRD analysis are shown in Figure 4. Combined with TG curves analysis, what occurs in first stage is the decomposition of Fe1.833(OH)0.5O2.5 phase, as shown in Equation (1) [4]. It was noted that the hematite was produced directly without any intermediate phases [28,29]. The XRD results are mainly dominated by the characteristic peak (Fe2O3 phase), and the SiO2 phase is mainly quartz phase at 750 °C, as shown in Figure 4b. When the decomposition temperature continued to increase to 1350 °C, XRD phase analysis results indicates that the disappearance of Fe2O3 phase peak and the appearance of Fe3O4 phase peak occur at this time. The reaction is shown in Equation (2) [30]. XRD analysis shows that MgO in the ore would react with Fe2O3 in solid phase to form the spinel phase.
2 FeOOH Fe 2 O 3 + H 2 O
6 Fe 2 O 3 = 4 Fe 3 O 4 + O 2     Δ G θ = 500,406 280.75 T   J / mol
The results of XRD analysis of #2 iron ore at different temperatures (Figure 5) indicate that the decomposition in the first stage is mainly the process of decomposition of goethite such as Fe1.833(OH)0.5O2.5 and FeO(OH) to produce Fe2O3 and O2. Additionally, the microstructure analysis shows that the goethite of #1 iron ore is mostly dispersed around the pores, while the goethite of #2 is mostly embedded in the hematite matrix; the pore diameter of #2 is smaller than that of #1, which makes it more difficult to diffuse water vapor generated by decomposition, so its decomposition temperature is higher and higher heat-absorbing value. It can be seen from Figure 6c that the reaction of Equation (2) mainly occurs in the high temperature decomposition stage, but a part of Fe2O3 phase still remains at this time. It has been reported that the thermal decomposition of Fe3O4 occurs at high temperature, such as above 1600 °C [31]. There is no decomposition of magnetite in this study.

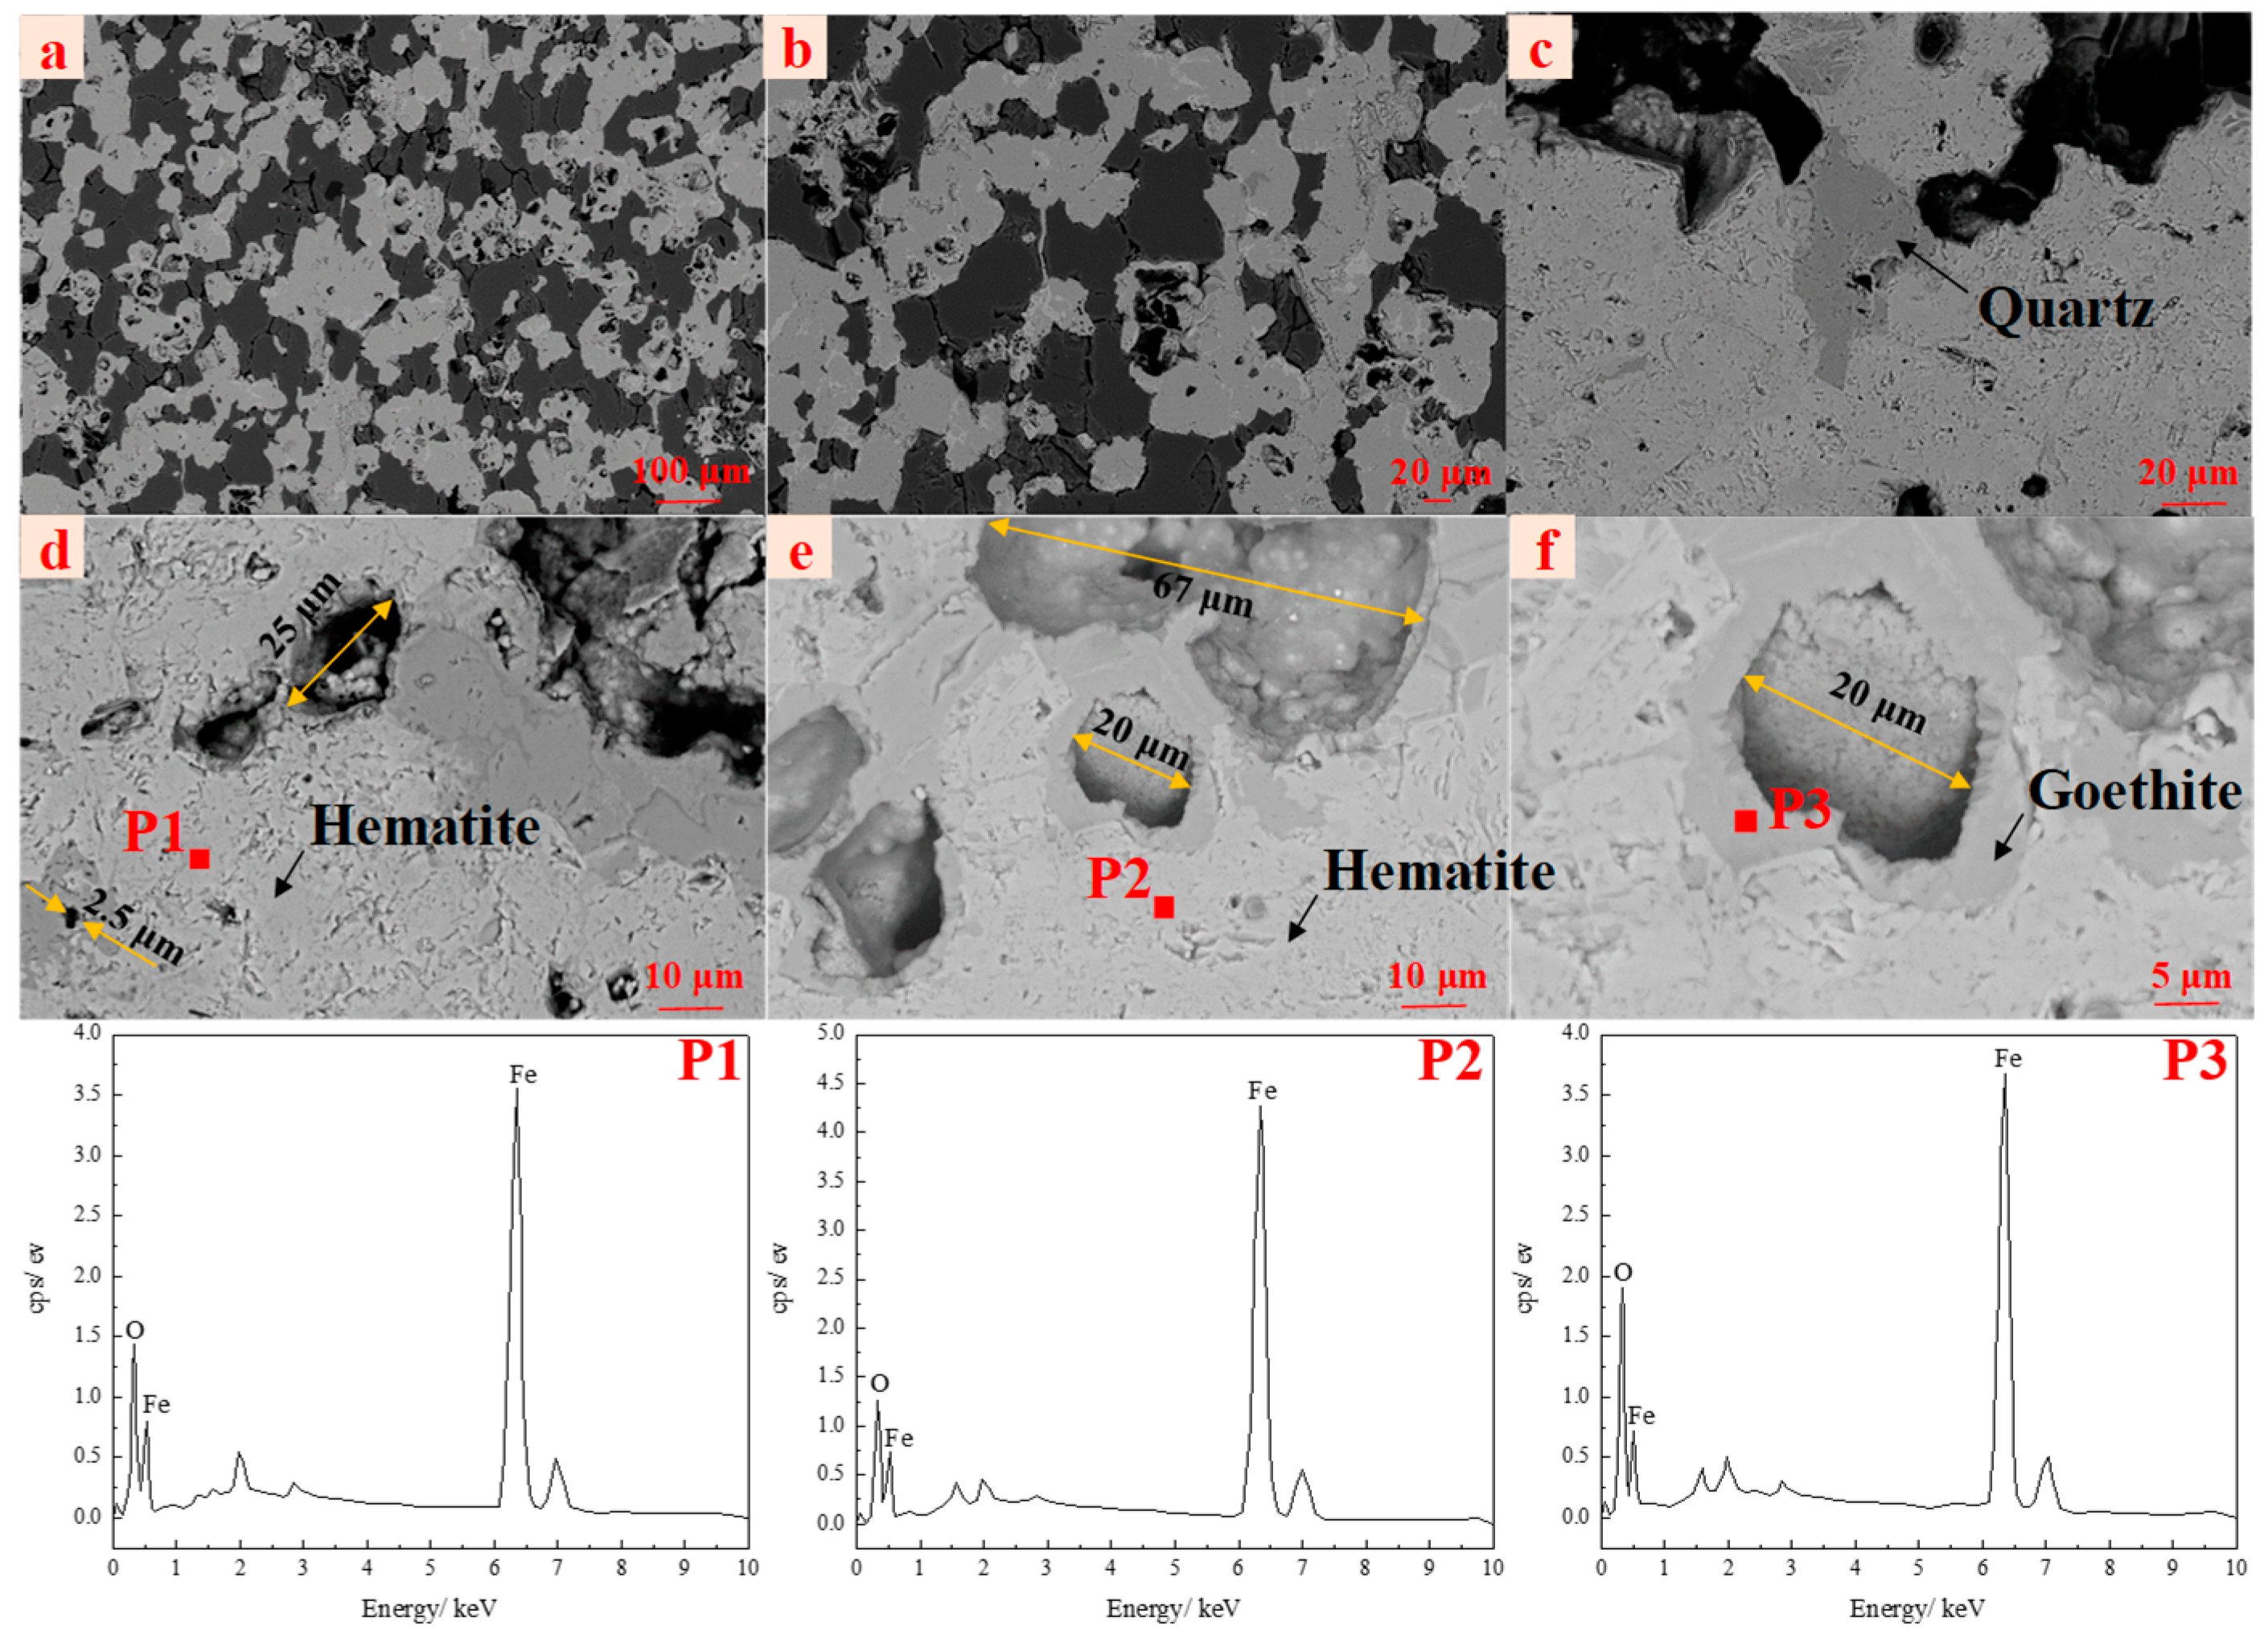
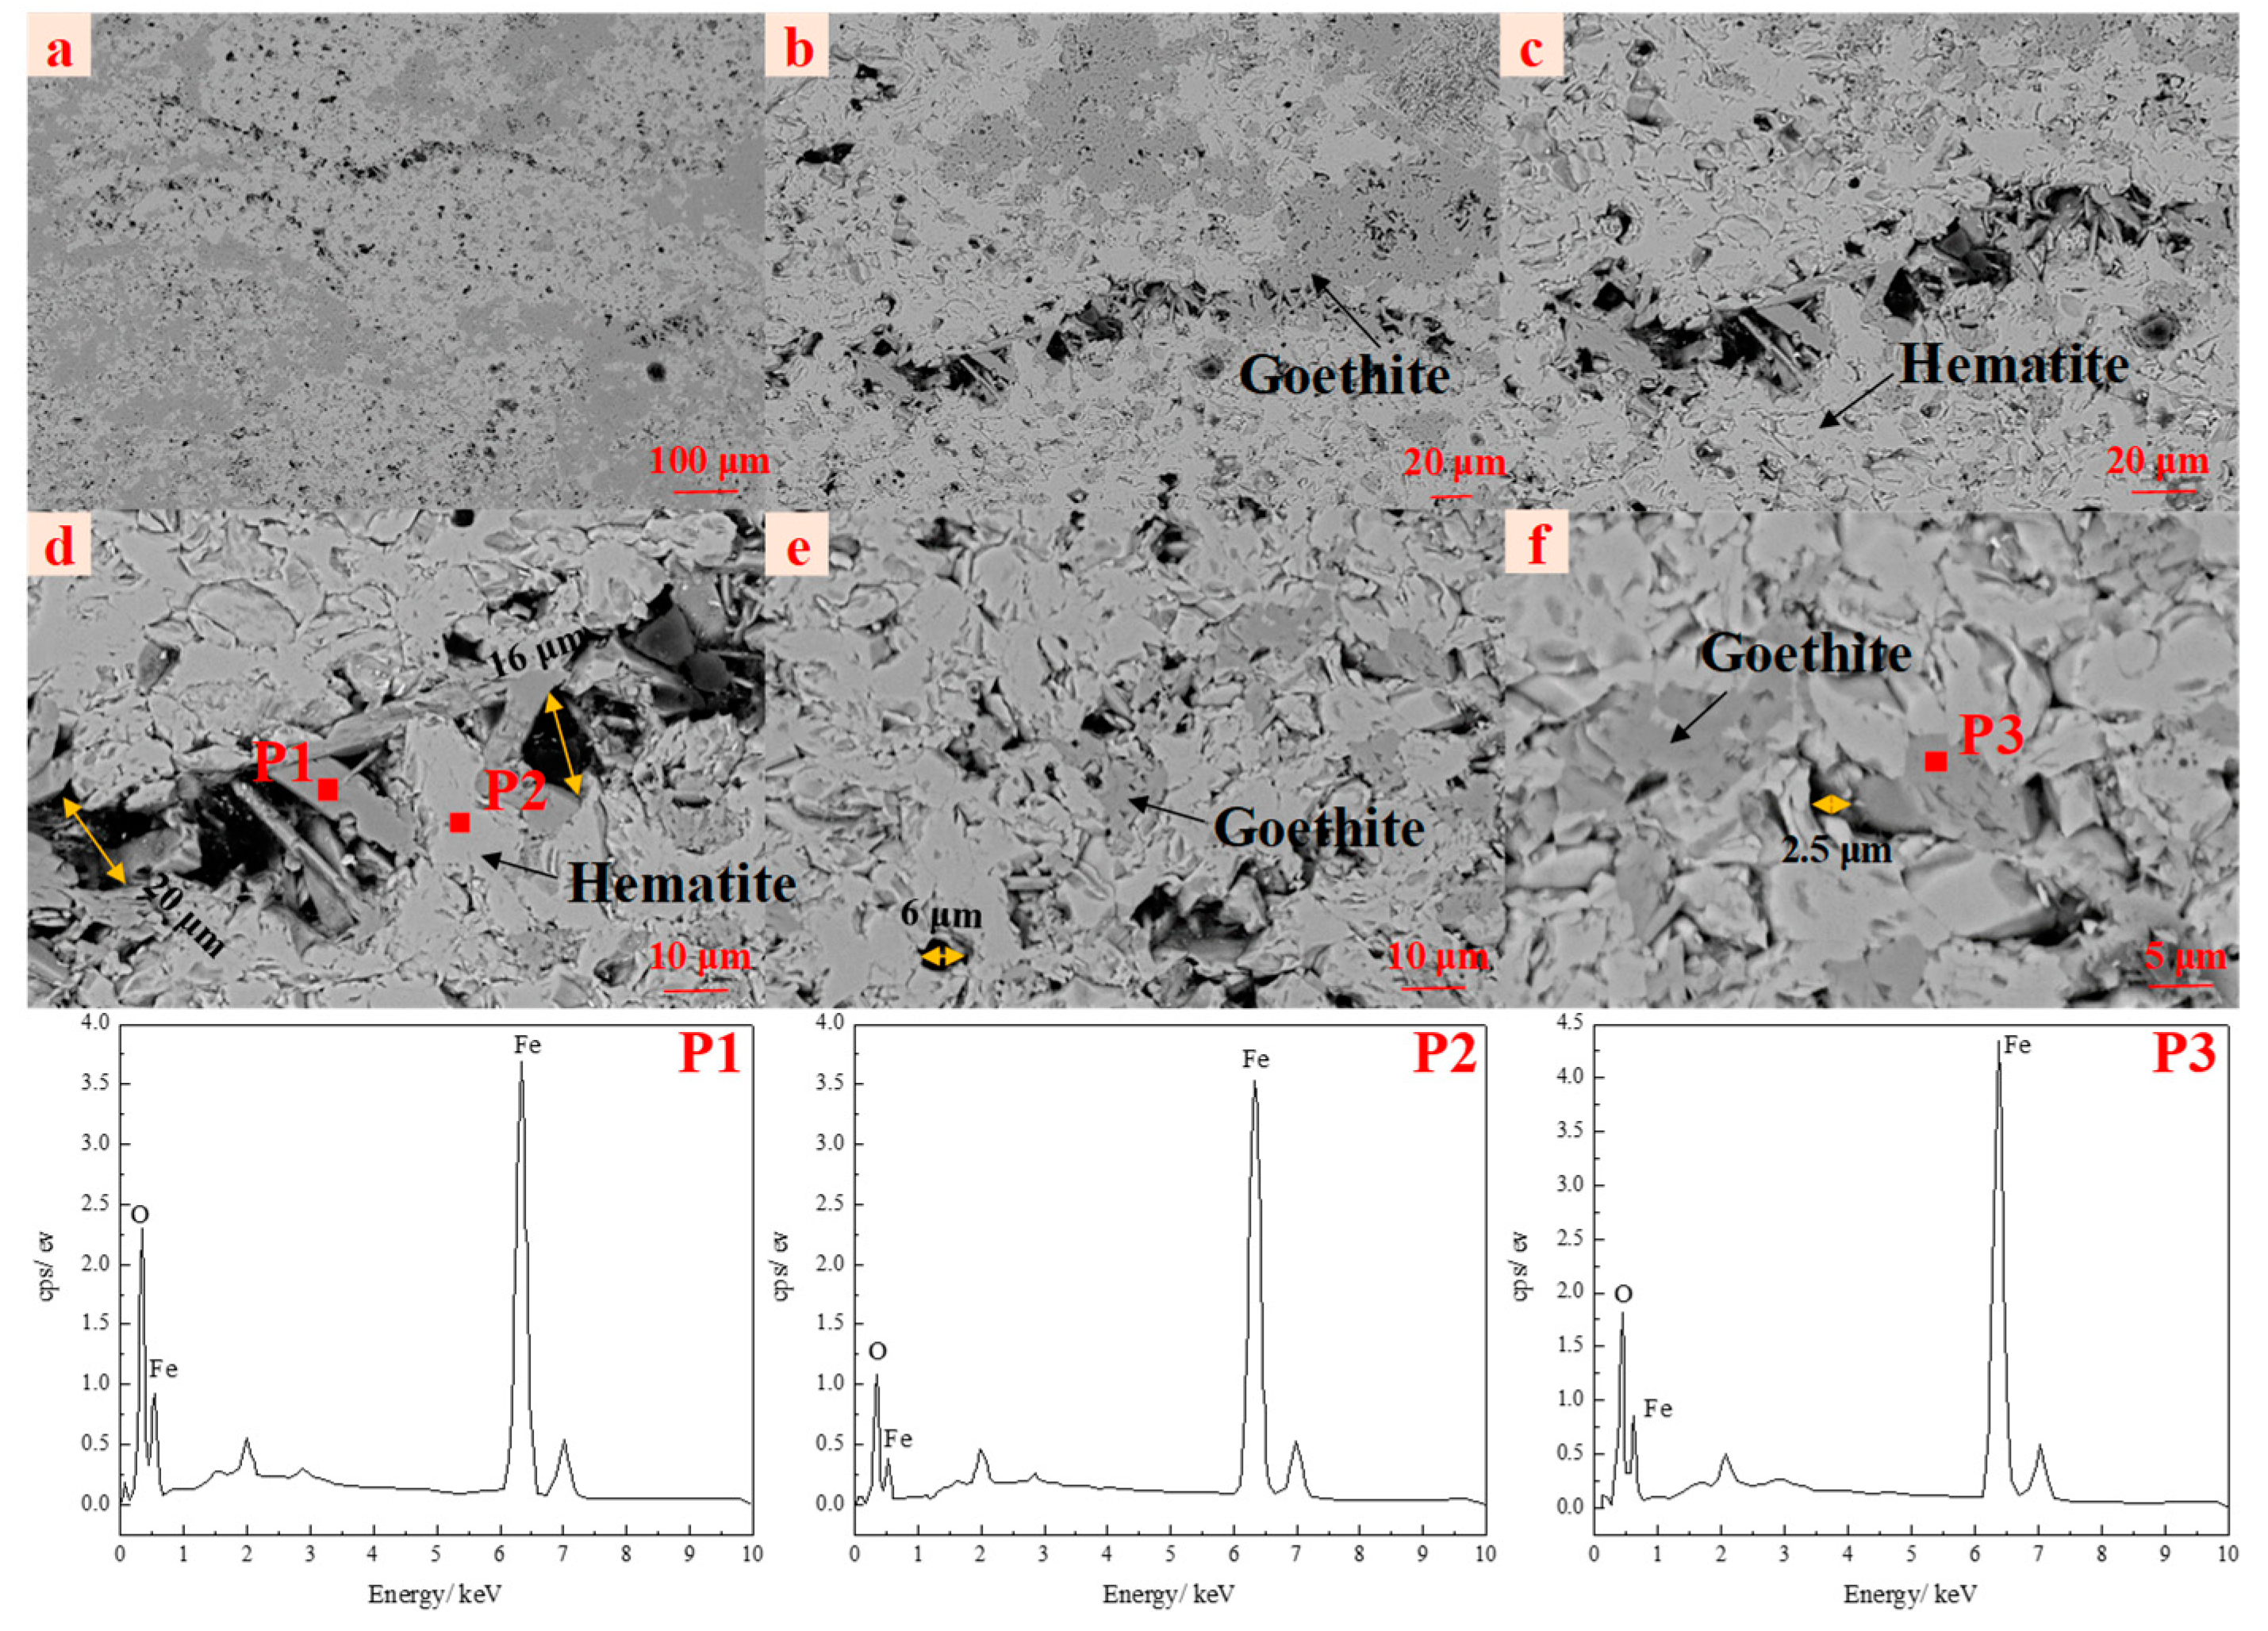
3.2. Study on the Evolution of Micromorphology

Figure 6 shows the microstructure results of internal cracks during the smelting reduction of #1 iron ore in the Fe-C melt. Measurement of crack widths by processing SEM photos through image recognition. It can be seen from Figure 6a that when the iron ore is immersed in the melt for 4 s, the mineral phase inside is heated to produce expansion, which makes a certain amount of internal cracks with a crack width of 33 μm. During the crack growth, some pores would provide space for the stress, as shown in Figure 1, so the cracks formed at this stage are small and show the characteristics of connecting the pores of iron ore [32,33,34]. From Figure 6b, it indicates that the water vapor generated by the decomposition of goethite would increase the internal pressure after reaching decomposition temperature, resulting in new cracks inside the goethite particles.
The analysis of Figure 6c,d demonstrate that when the iron ore is immersed in the melt for 8 s, the cracks inside #1 would grow further and the width of the cracks because of heat expansion, resulting a large number of small hematite particles. When the immersion time increases to 12 s, there are still mainly fine hematite and gangue grains. Additionally, when the crack expands to the interface layer, the crack disappears at the interface layer. The Fe2O3 on the surface of hematite gradually decomposes into Fe3O4 as reaching the decomposition temperature of hematite at 16 s [35]. Therefore, the surface of hematite particles in Figure 6g is looser and the inside is denser. The Fe3O4 phase produced by the decomposition will react with the surrounding gangue phase in solid phase, as shown in the EDS results for P3 and P5 of Figure 6.
The results of the internal microstructure of #2 iron ore during smelting reduction process are shown in Figure 7. It can be seen from Figure 7a that its internal cracks generated at 4 s of smelting reduction are mainly micro-cracks formed along the direction of original pores and through all pores. There is no splitting phenomenon in hematite particles. Large cracks have been formed internally at 8 s with a crack width of 36 μm, at which time the larger hematite particles split into fine particles, producing more fine cracks, as shown in Figure 7c,d. Figure 7e,f shows the internal microstructure of #2 at 16 s of smelting reduction. It can be seen that the hematite particles are basically all split into smaller particles at this time, and the solid phase reaction between gangue phase and surface of the small particles starts at this time.
In order to further investigate the internal microstructural evolution of iron ore containing goethite in Fe-C melt, #2 iron ore was selected for a 30 s smelting reduction experiment, and the internal microstructure are shown in Figure 8.
The hematite particles are undergoing decomposition reaction, resulting a dense Fe2O3 core and porous Fe3O4 boundary layer. Additionally, part of Fe3O4 reacts with the gangue in solid phase, so the cracks produced by shrinkage are formed between the particles, as shown in Figure 8a.

3.3. Internal Crack Evolution

The internal morphology of iron ore and the distribution characteristics of cracks were studied based on the reduction reaction between iron ore and Fe-C melt, and the coupling of the action of heat transfer from the high temperature melt. Figure 9 shows the crack morphology structure evolution of #1 iron ore at different smelting reduction moments. At the time of 4 s, the #1 retains a good original form, with only some internal micro-cracking. At 8 s of smelting reduction, the internal cracks would grow and widen, and defects generated by the reduction reaction with Fe-C melt will appear in the upper part of the iron ore. After a further increase in the smelting reduction time, the internal bursting factor of iron ore gradually decreases, and the disappearance of the iron ore is mainly caused by its reduction reaction.
As the iron ore dissolves in the iron liquid, a liquid interface layer would be produced on the surface, the stress of its internal cracks will be released in the interface layer region, so that the iron ore within Fe-C melt to maintain a complete shape and does not undergo bursting and crushing phenomenon that happens inside the blast furnace.
Figure 10 investigated the crack morphology structure of #2 at different smelting reduction time. It was so found that an interfacial layer is formed on the surface of the iron ore in contact with Fe-C melt. At reaction times of 4 s and 8 s, the changes in the iron ore morphology are mainly the evolution of its cracks and internal pores, with less disappearance produced by the reduction reaction. A certain amount of interfacial disappearance was observed only at 16 s.
In initial period, what happens in the interface of the iron ore is a reduction reaction between iron ore and Fe-C melt, of which in interior is thermal decomposition reaction of iron ore [24,27]. In order to further investigate the differences between the bursting and reduction reactions of iron ores, the cracking index (CI) was further taken to characterize the development characteristics of cracks generated by heat transfer, the smelting reduction index (SI) was taken to characterize the smelting reduction and internal crack expansion of iron ore, and the interfacial reduction index (IRI) was taken to characterize the interfacial reduction reaction of iron ore. The schematic diagram and expression formulas of the three indices are shown in Figure 11 and Formulas (3)–(5).
CI = V pores   in   the   selected   area   V selected   area = V c V 1 × 100 %
SI = V pores   in   iron   ore + V conversion   zone V iron   ore = V p + V r V 0 × 100 %
IRI = SI - CI
V1 is the volume of the selected area in internal central part of iron ore, mm3; Vc shows the volume of cracks inside the V1 region, mm3; V0 is the initial volume of iron ore, mm3; Vp is the volume of all cracks inside iron ore, mm3; Vr is the volume of the part of iron ore interface that disappears due to reduction reaction, mm3.
Figure 12 shows the results of pore structure evolution in V1 region for samples #1 and #2 at different smelting reduction times. #1 sample produces more connected pores at 4 s, while #2 has mainly smaller pores. Goethite in #1 iron ore is mainly distributed at the boundary of pore, resulting that gas generated by decomposition easily connect with the pore. So, it is easy to form locally interconnected holes. The mesh structure formed by cracks when the time was increased to 8 s. Meanwhile at 16 s, the cracks inside the #1 iron ore increased significantly compared to #2.
By further analyzing the CT results, the characteristic indexes were derived, as shown in Figure 13 and Figure 14. The CI of #1 is 5.50% at 4 s and 23.64% at 16 s. Additionally, it can be seen that the crack volume of #1 at 16 s is larger than that at 4 s. The CI of #1 at 4 s is higher compared to the IRI, but the IRIs after 8 s is higher than CIs. It can be seen that the smelting reaction is accelerated after 8 s due to the increase in interfacial reduction. #2 has higher CI at 4 s and 8 s compared to #1, but lower CI at 16 s compared to #1. Before 16 s, the growth of internal crack of #2 was the main occurrence, and the proportion of interfacial reaction was low. Compared with the characteristic indexes of smelting reduction at 16 s, the IRI of #1 iron ore is 26.44%, while that of #2 iron ore is 12.06%, so the smelting reduction reaction speed of #1 is faster.
According to the analysis, the crack evolution mechanism of iron ore containing goethite in Fe-C melt is shown in Figure 15, when the iron ore is immersed in melt, due to the influence of heat transfer, goethite mineral of iron ore decomposes and produces water vapor, which generates cracks inside the iron ore. The morphology and number of cracks vary from one iron ore to another, because of different microstructures and goethite mineral content in iron ore. A liquid interfacial reduction layer is formed on the surface of the iron ore in Fe-C melt. When the internal temperature increases further, hematite particles gradually break into smaller hematite particles, and the hematite particles begin to decompose to produce Fe3O4 and O2, where the gangue elements would react with the surrounding generated Fe3O4. This crack grows and extends furtherly in the process, and the crack disappears into the liquid interface layer on the surface. The iron ore remains in a relatively intact form. Thereafter, the iron ore is gradually reduced and disappeared by the reduction reaction.

4. Conclusions

The thermal decomposition crack evolution mechanism of iron ore containing goethite were investigated in the paper. The main conclusions were drawn as follows:
(1)
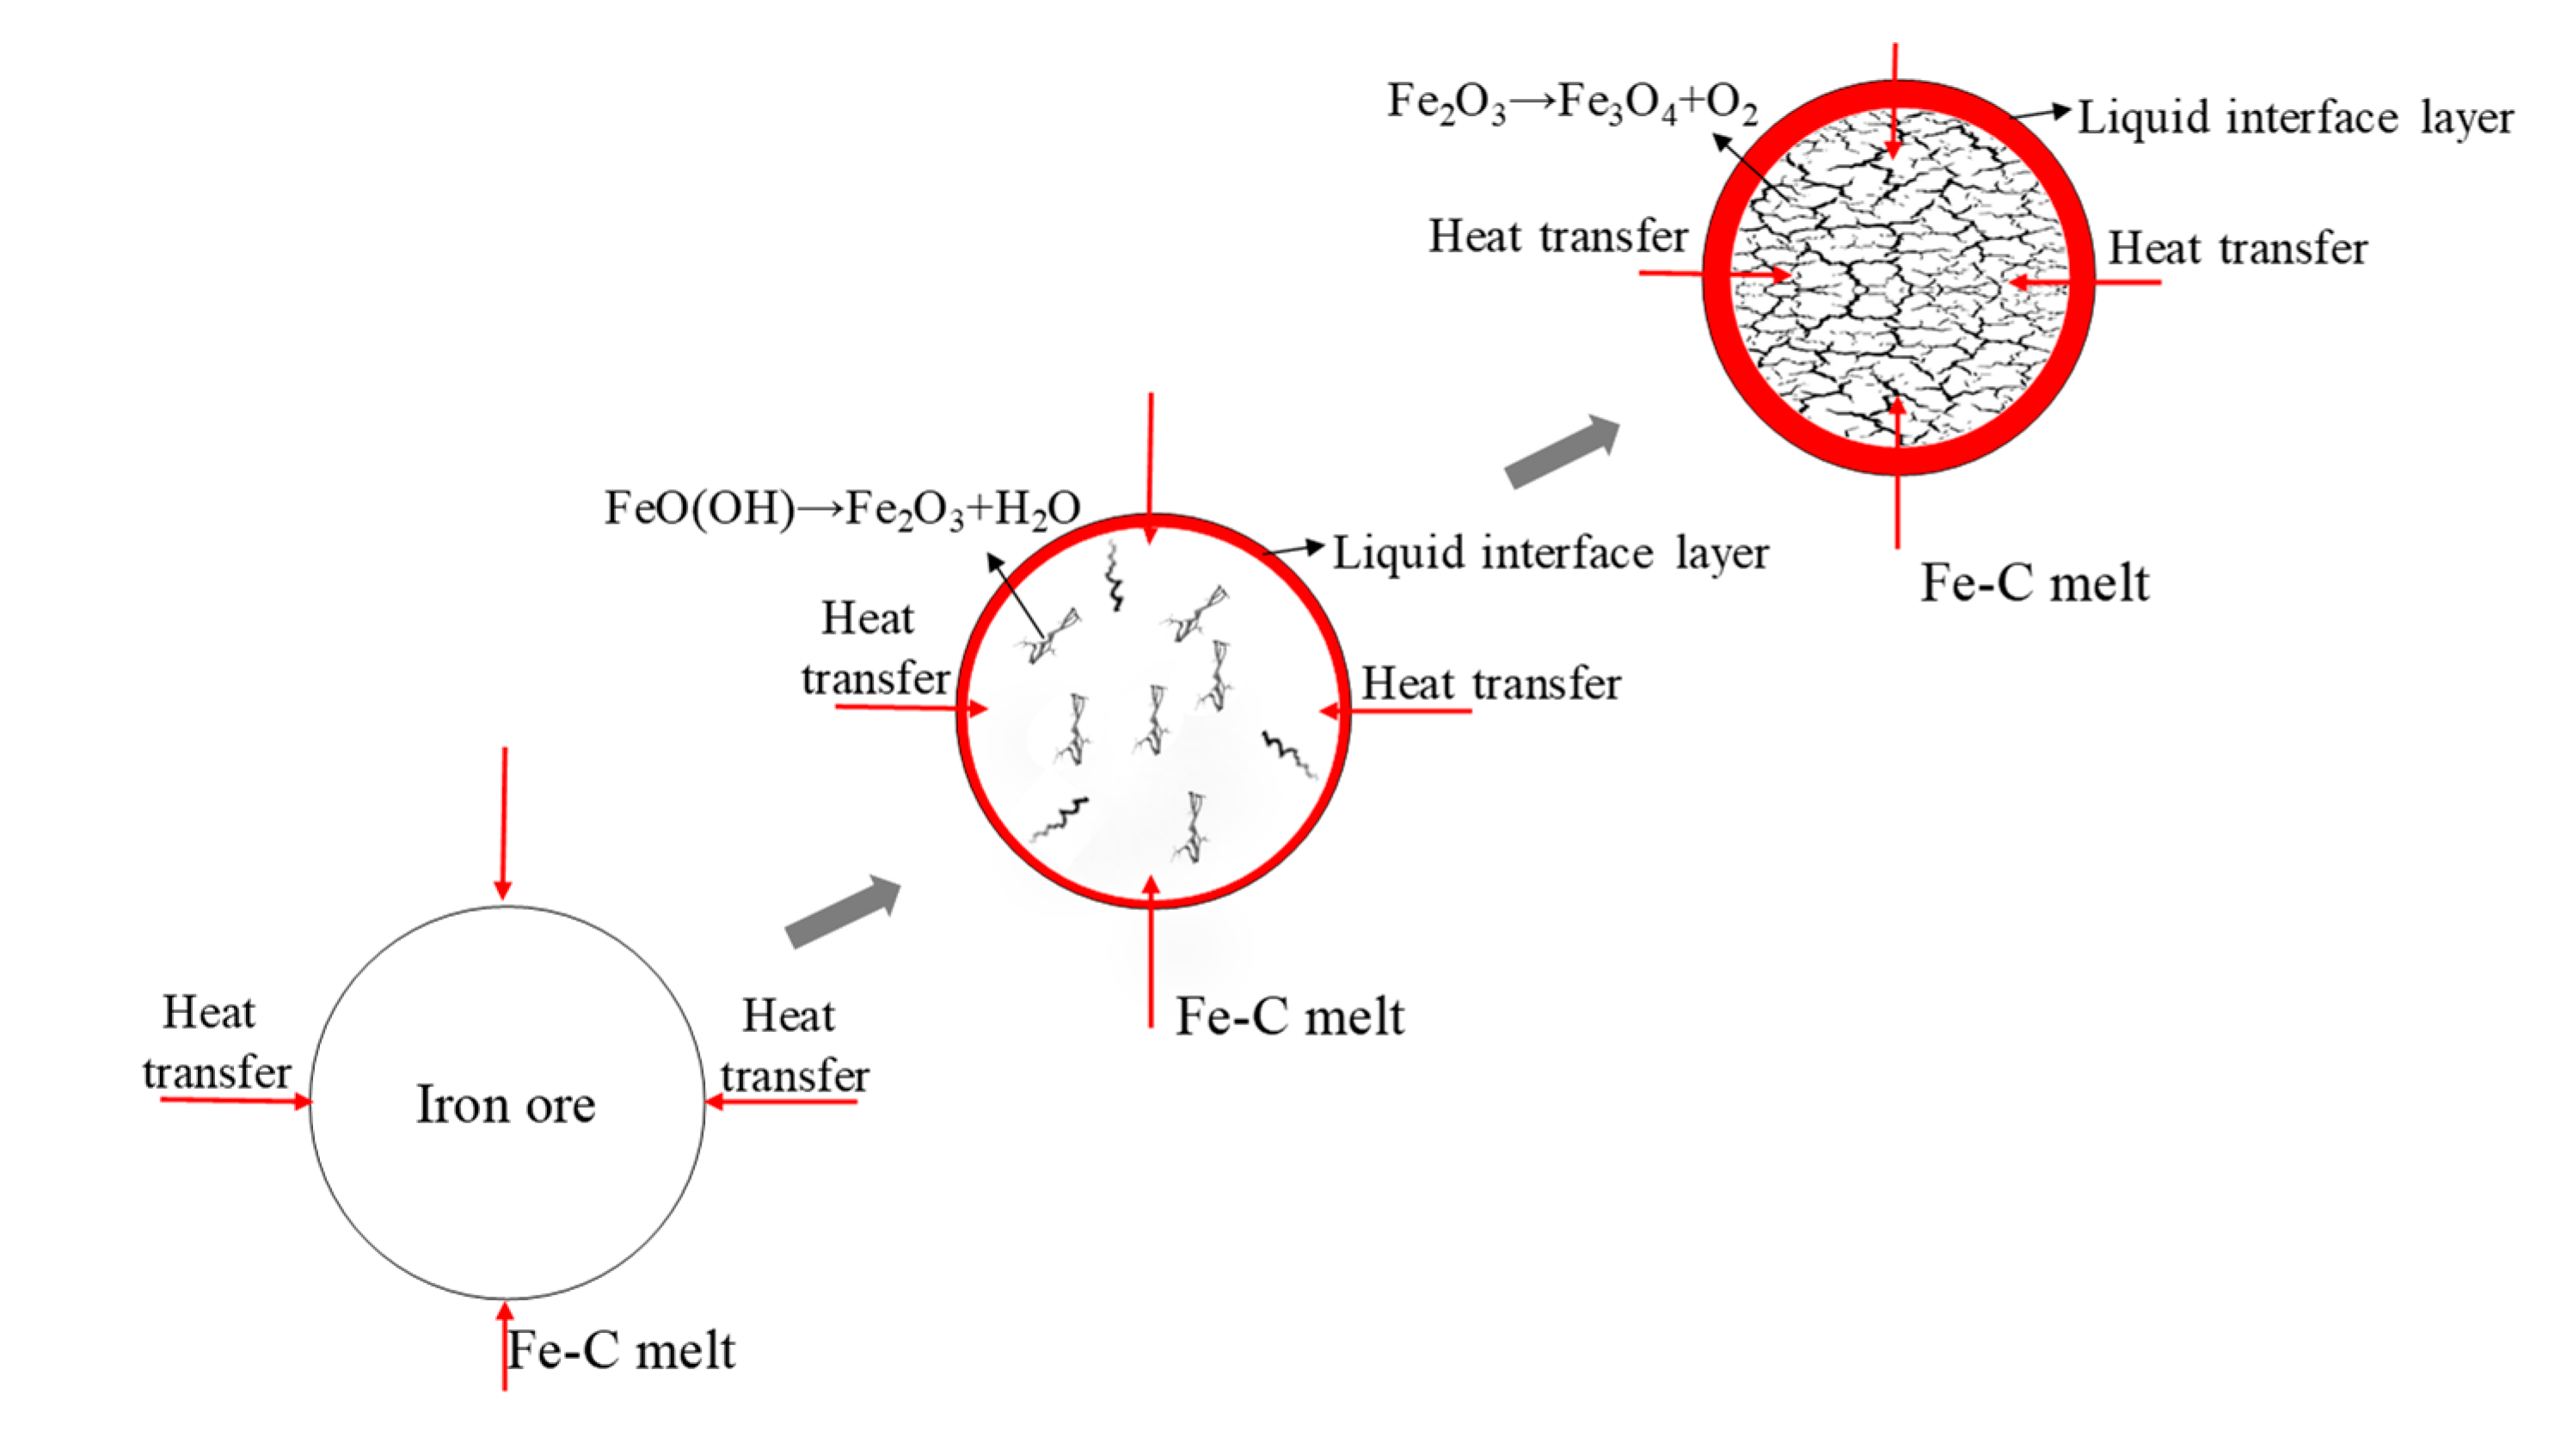
In the decomposition process of iron ore, internal goethite decomposition occurs to produce water vapor and hematite. However, due to the difference in internal microstructure, differences in internal decomposition temperature arise. As the temperature continues to rise, the hematite begins to decompose to produce Fe3O4.
(2)
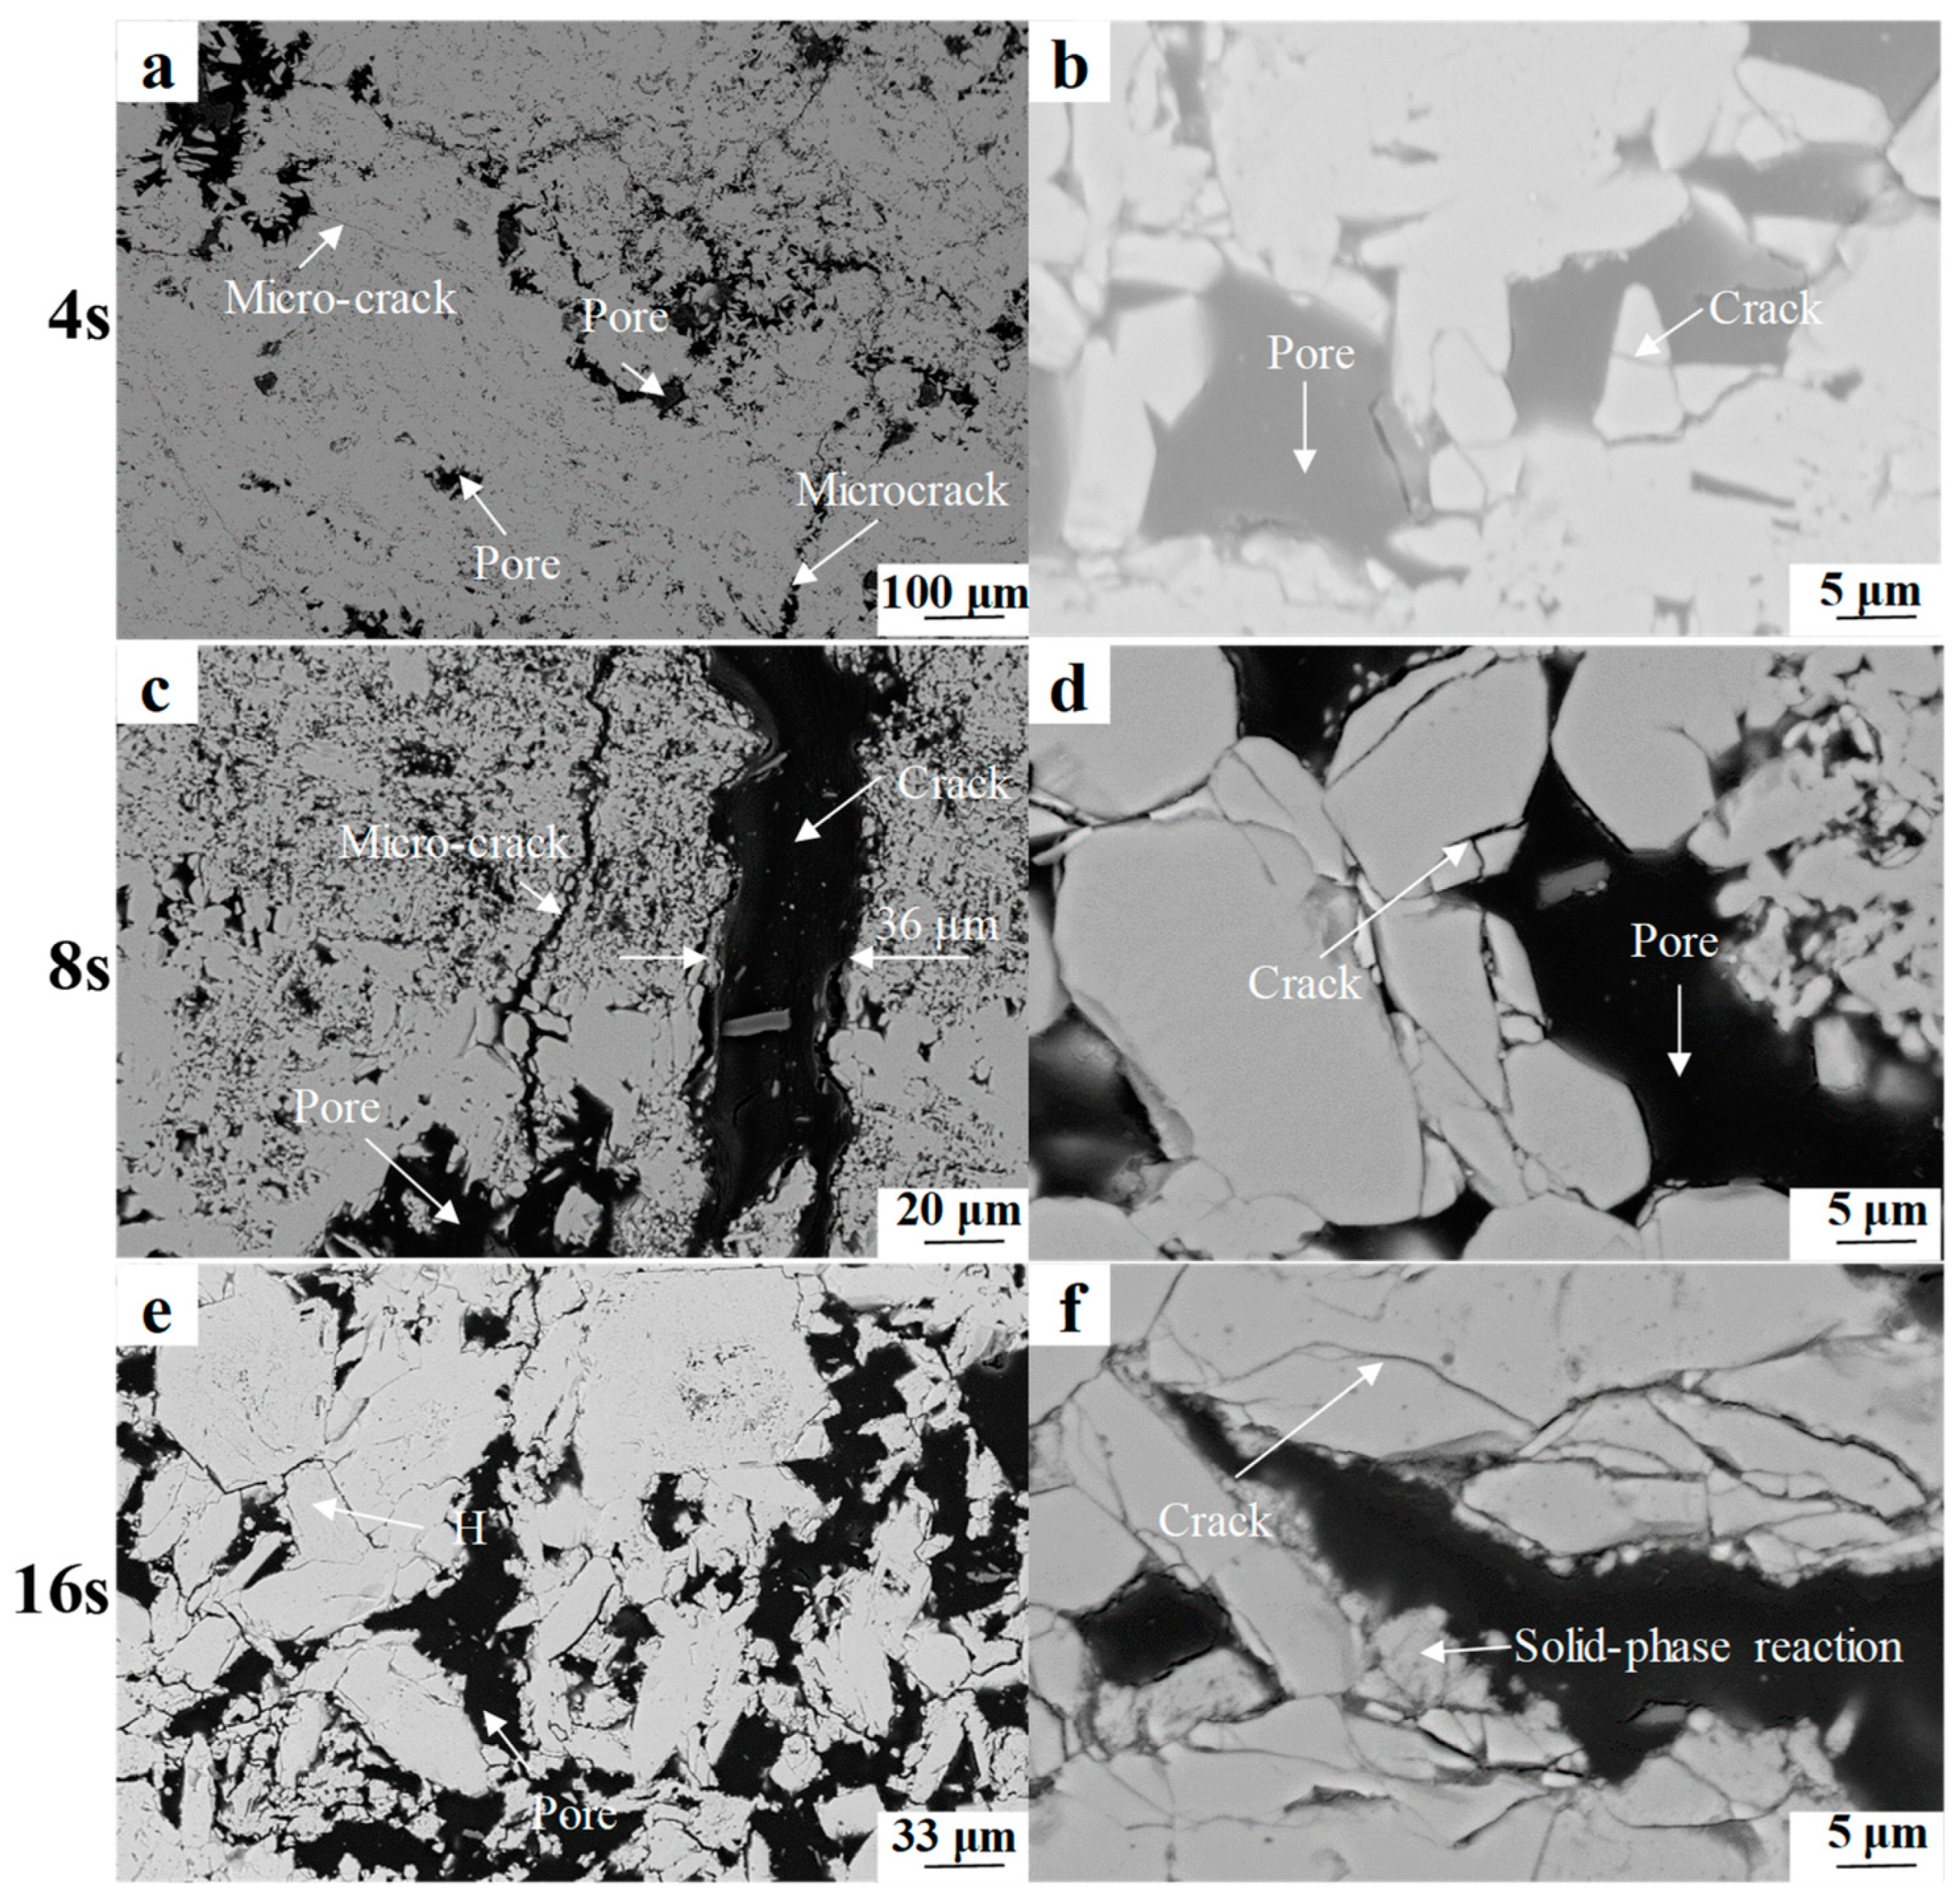
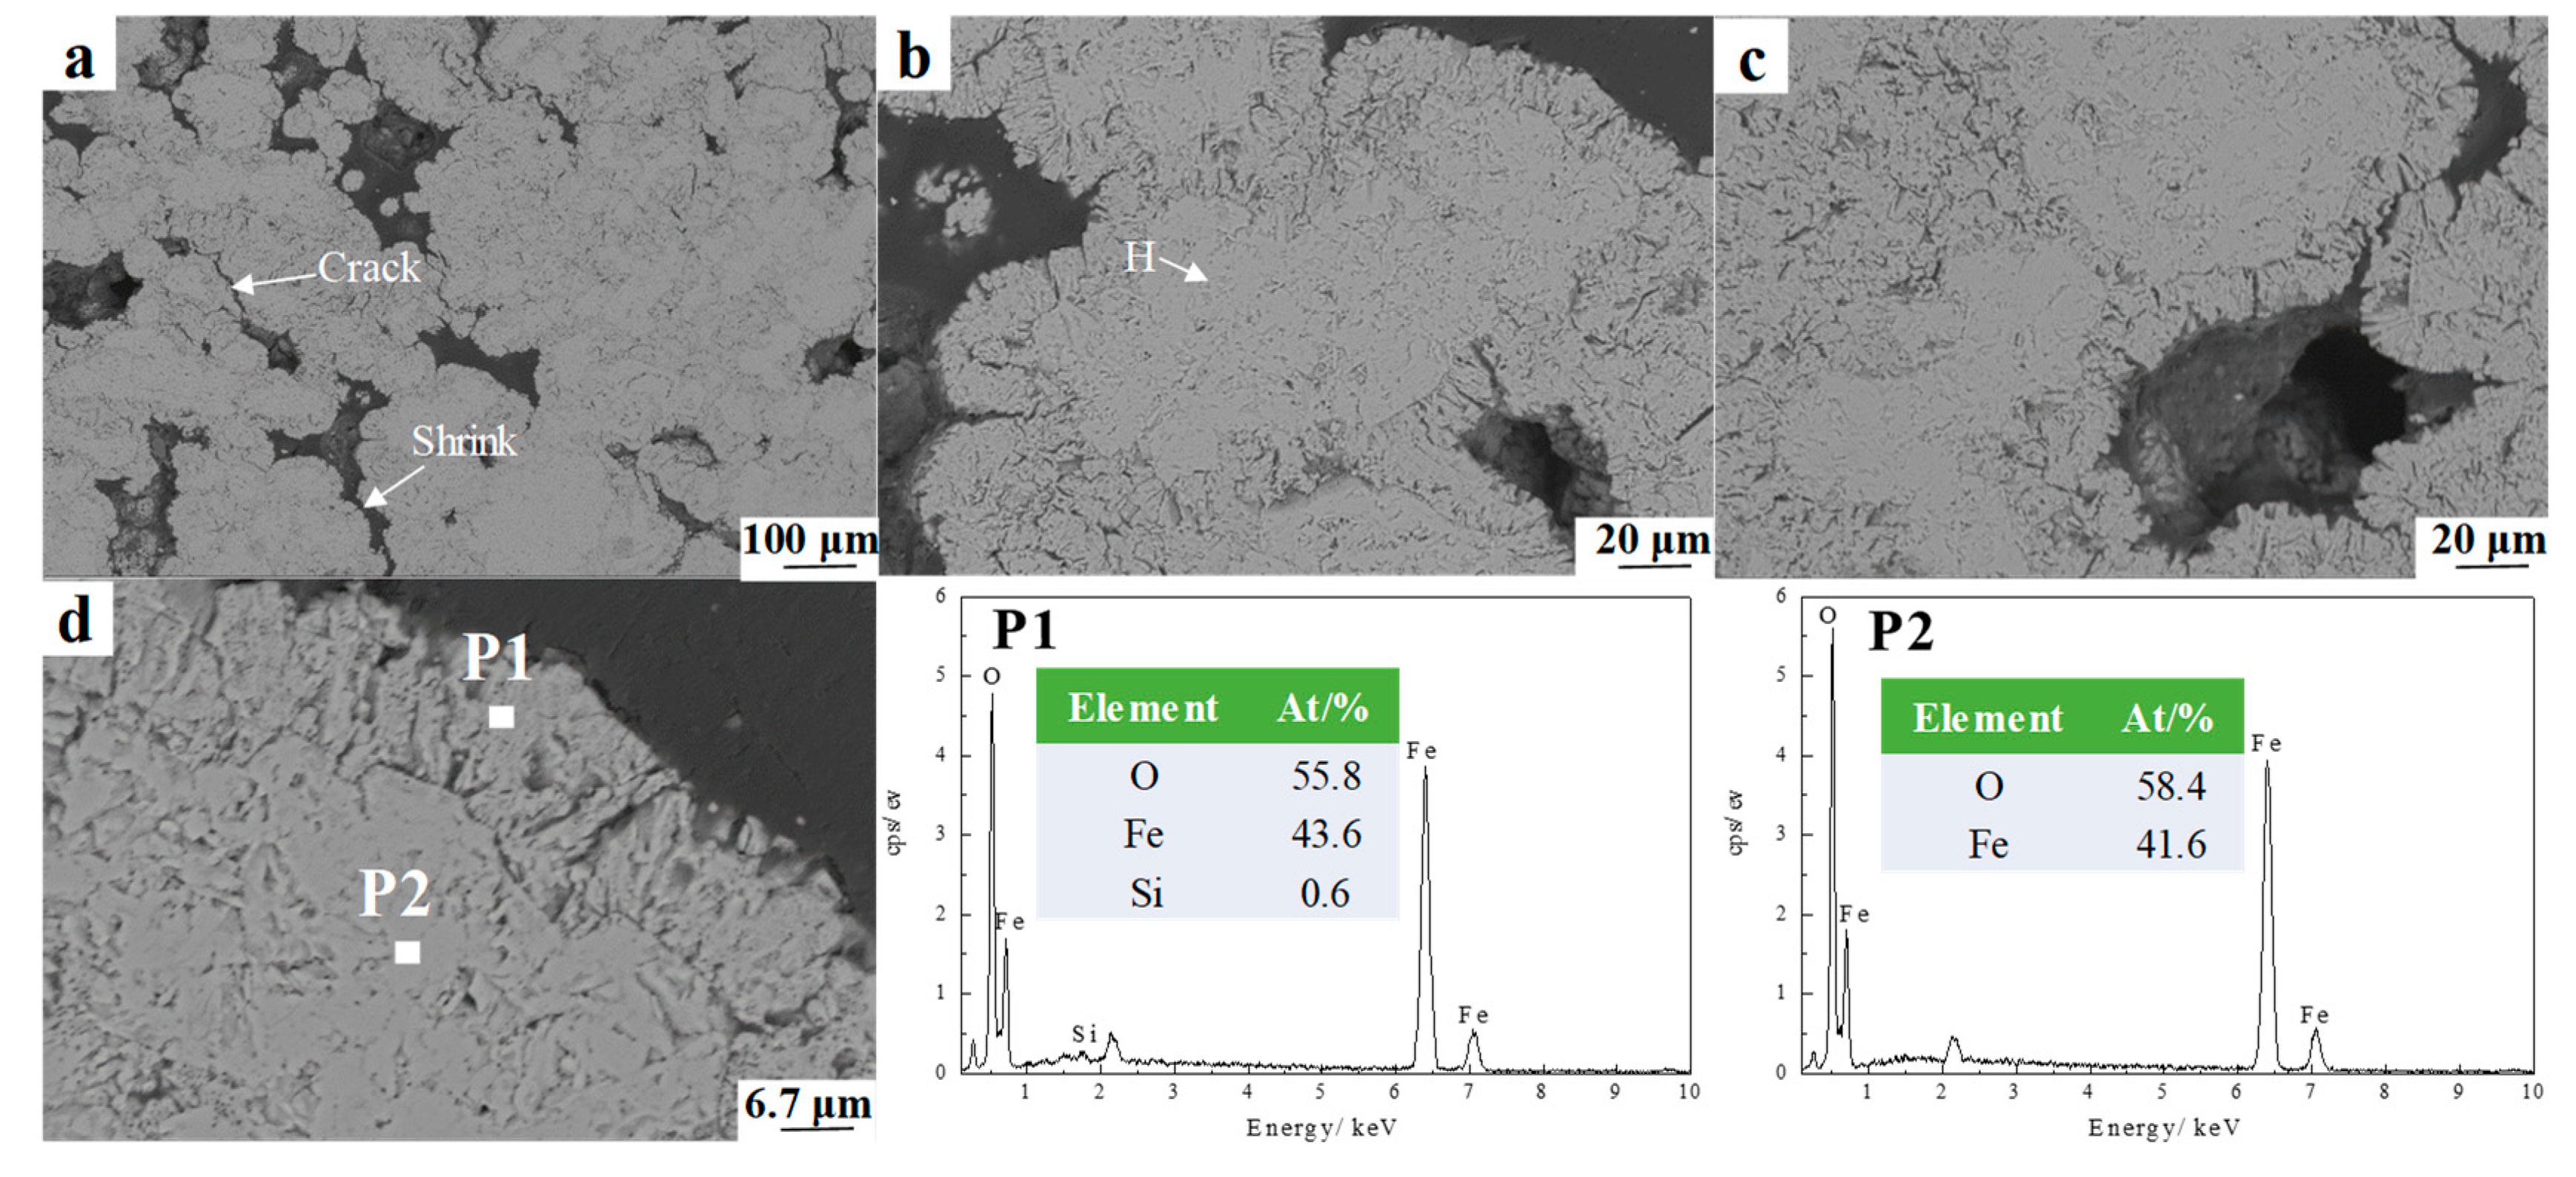
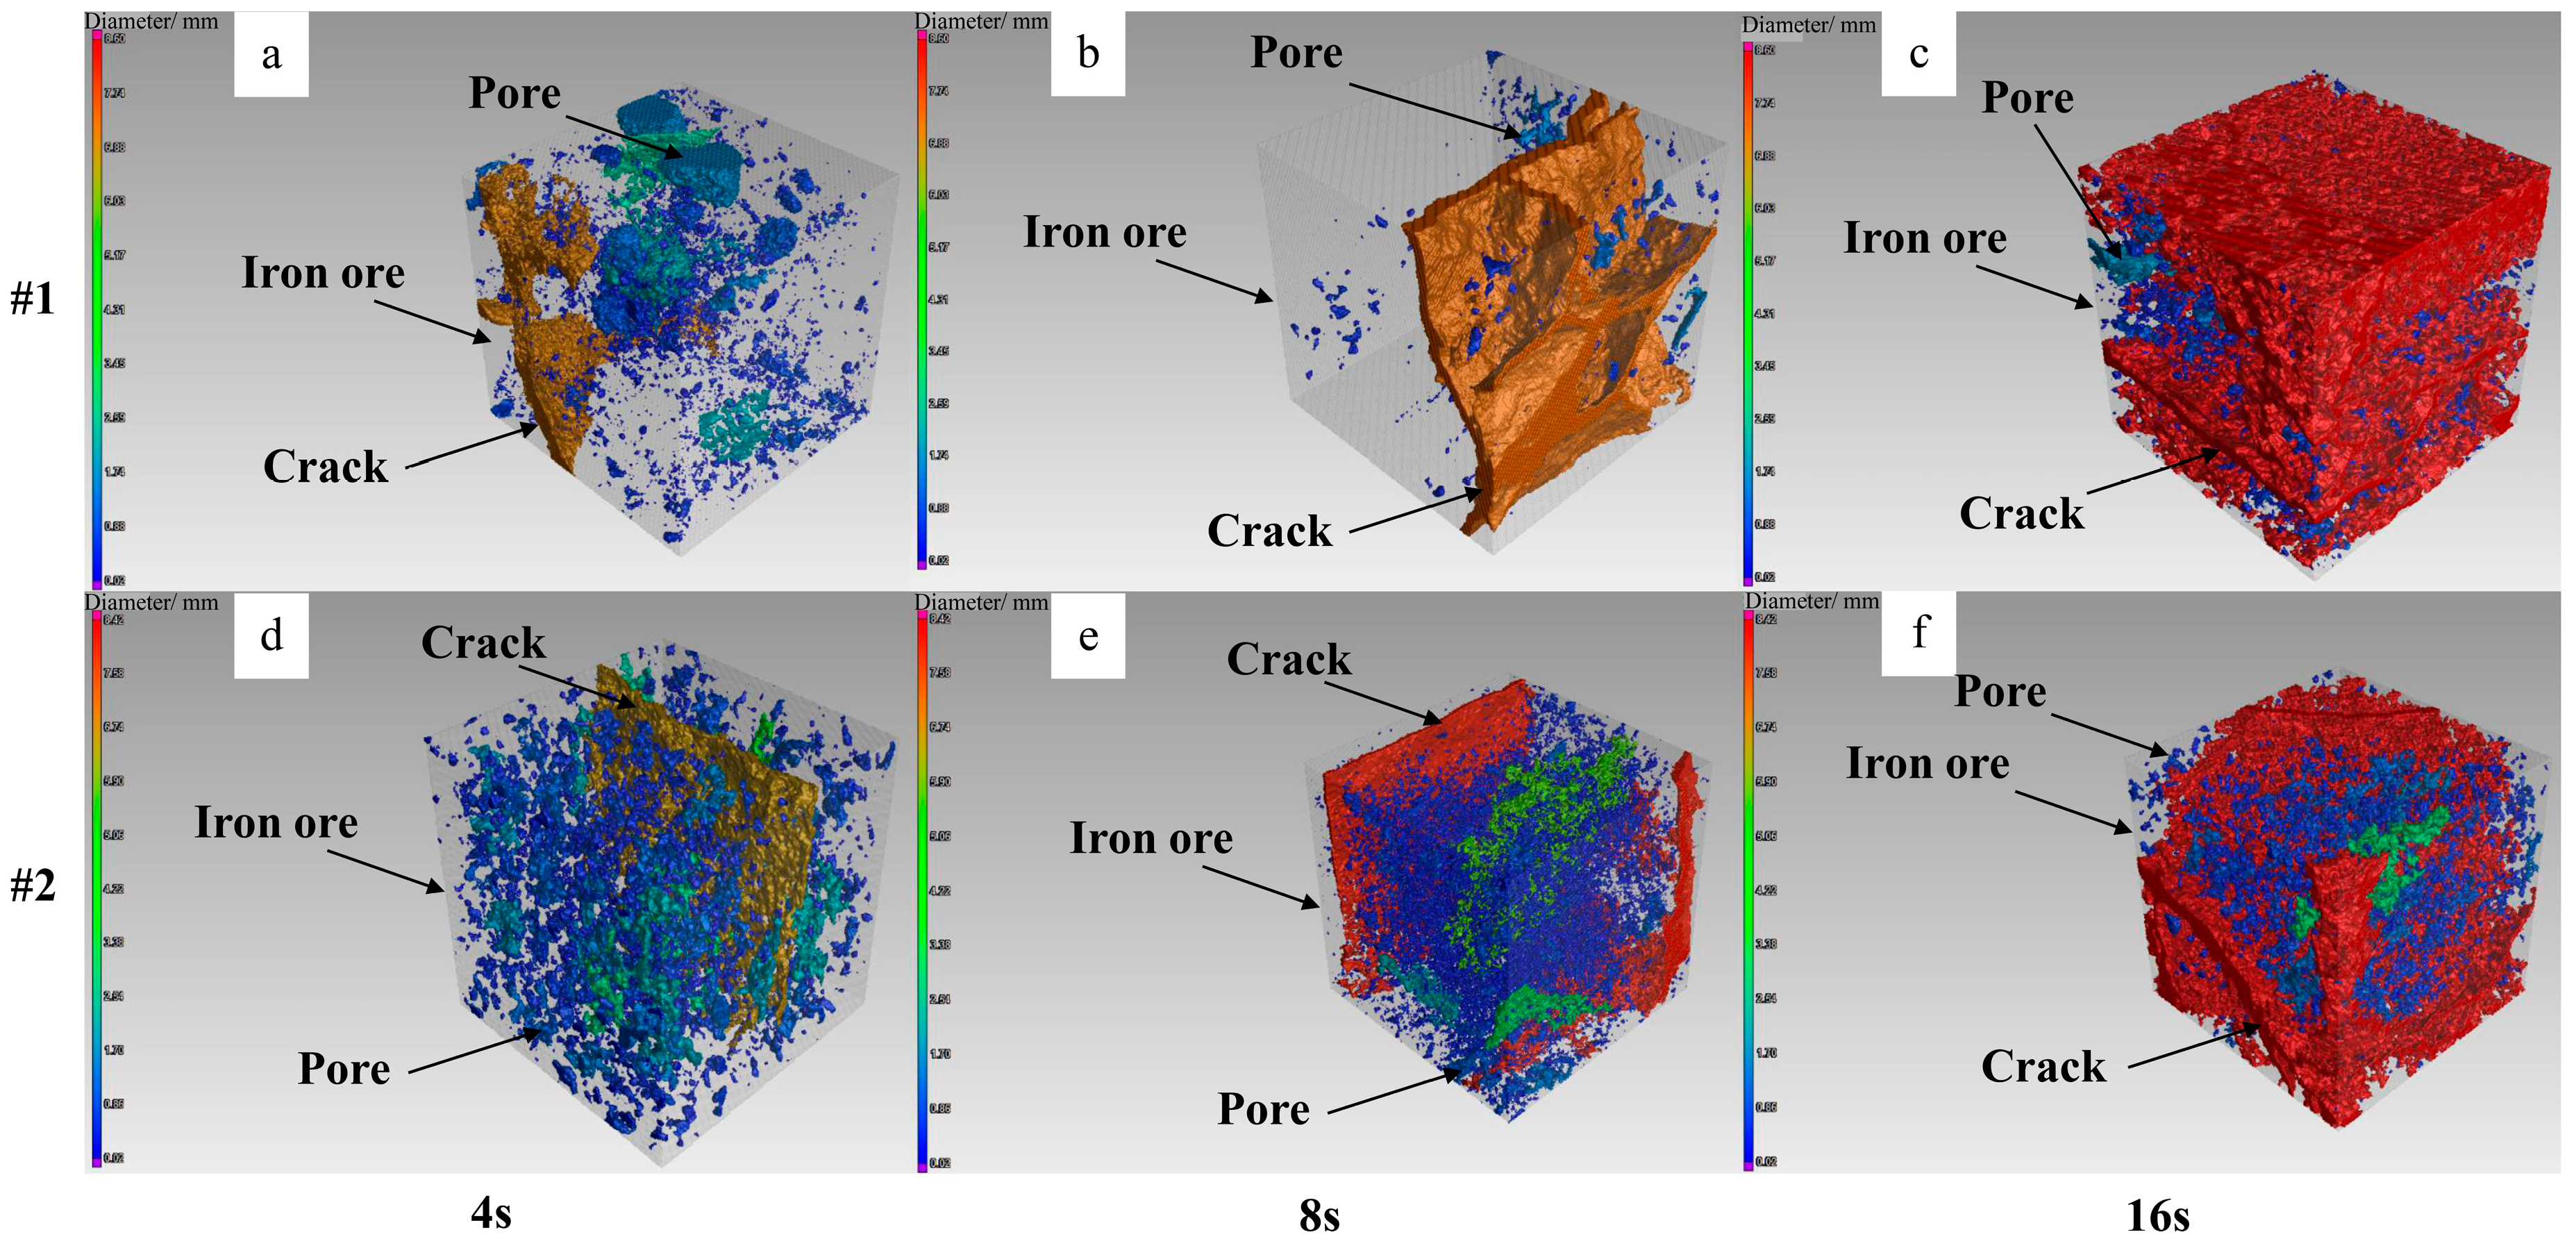
The microstructural evolution revealed that the crack width produced during low temperature decomposition rupture was fine and increased with time within Fe-C melt, gradually extending to the liquid interfacial layer produced due to reduction reaction. The internal large grains of hematite break up to form finer grained hematite, and the gangue elements would react in solid phase with surrounding nascent Fe3O4.
(3)
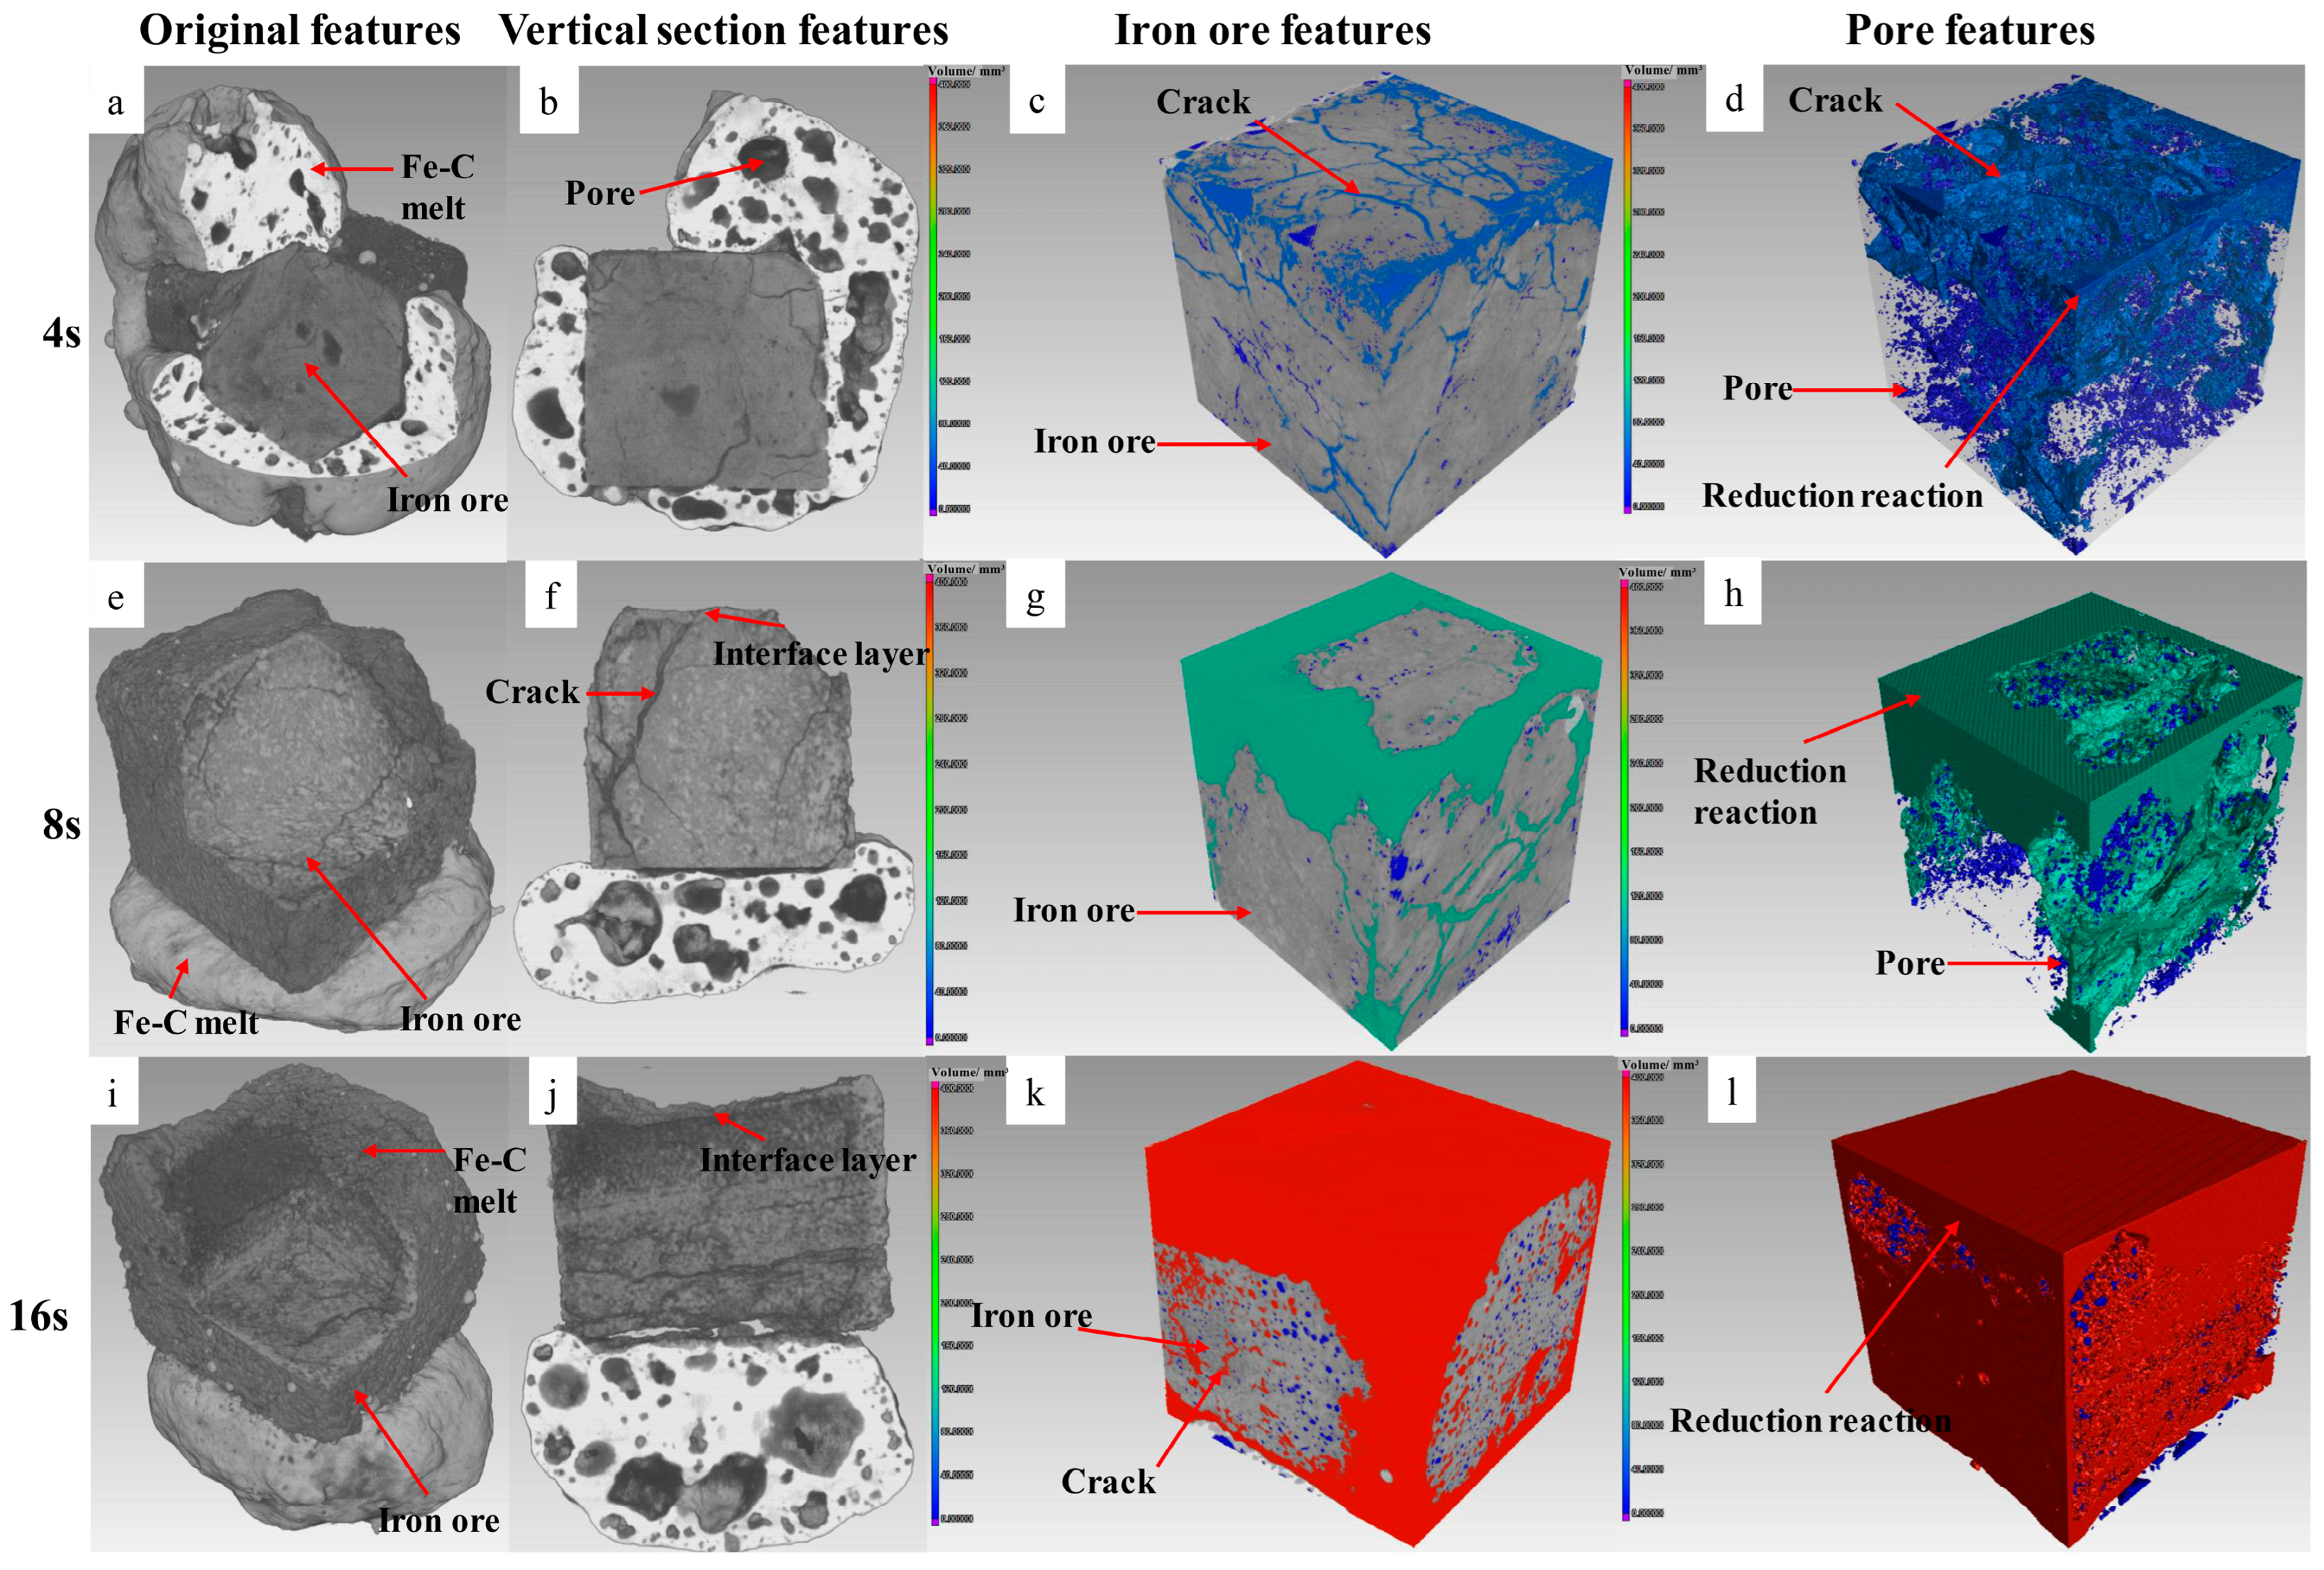
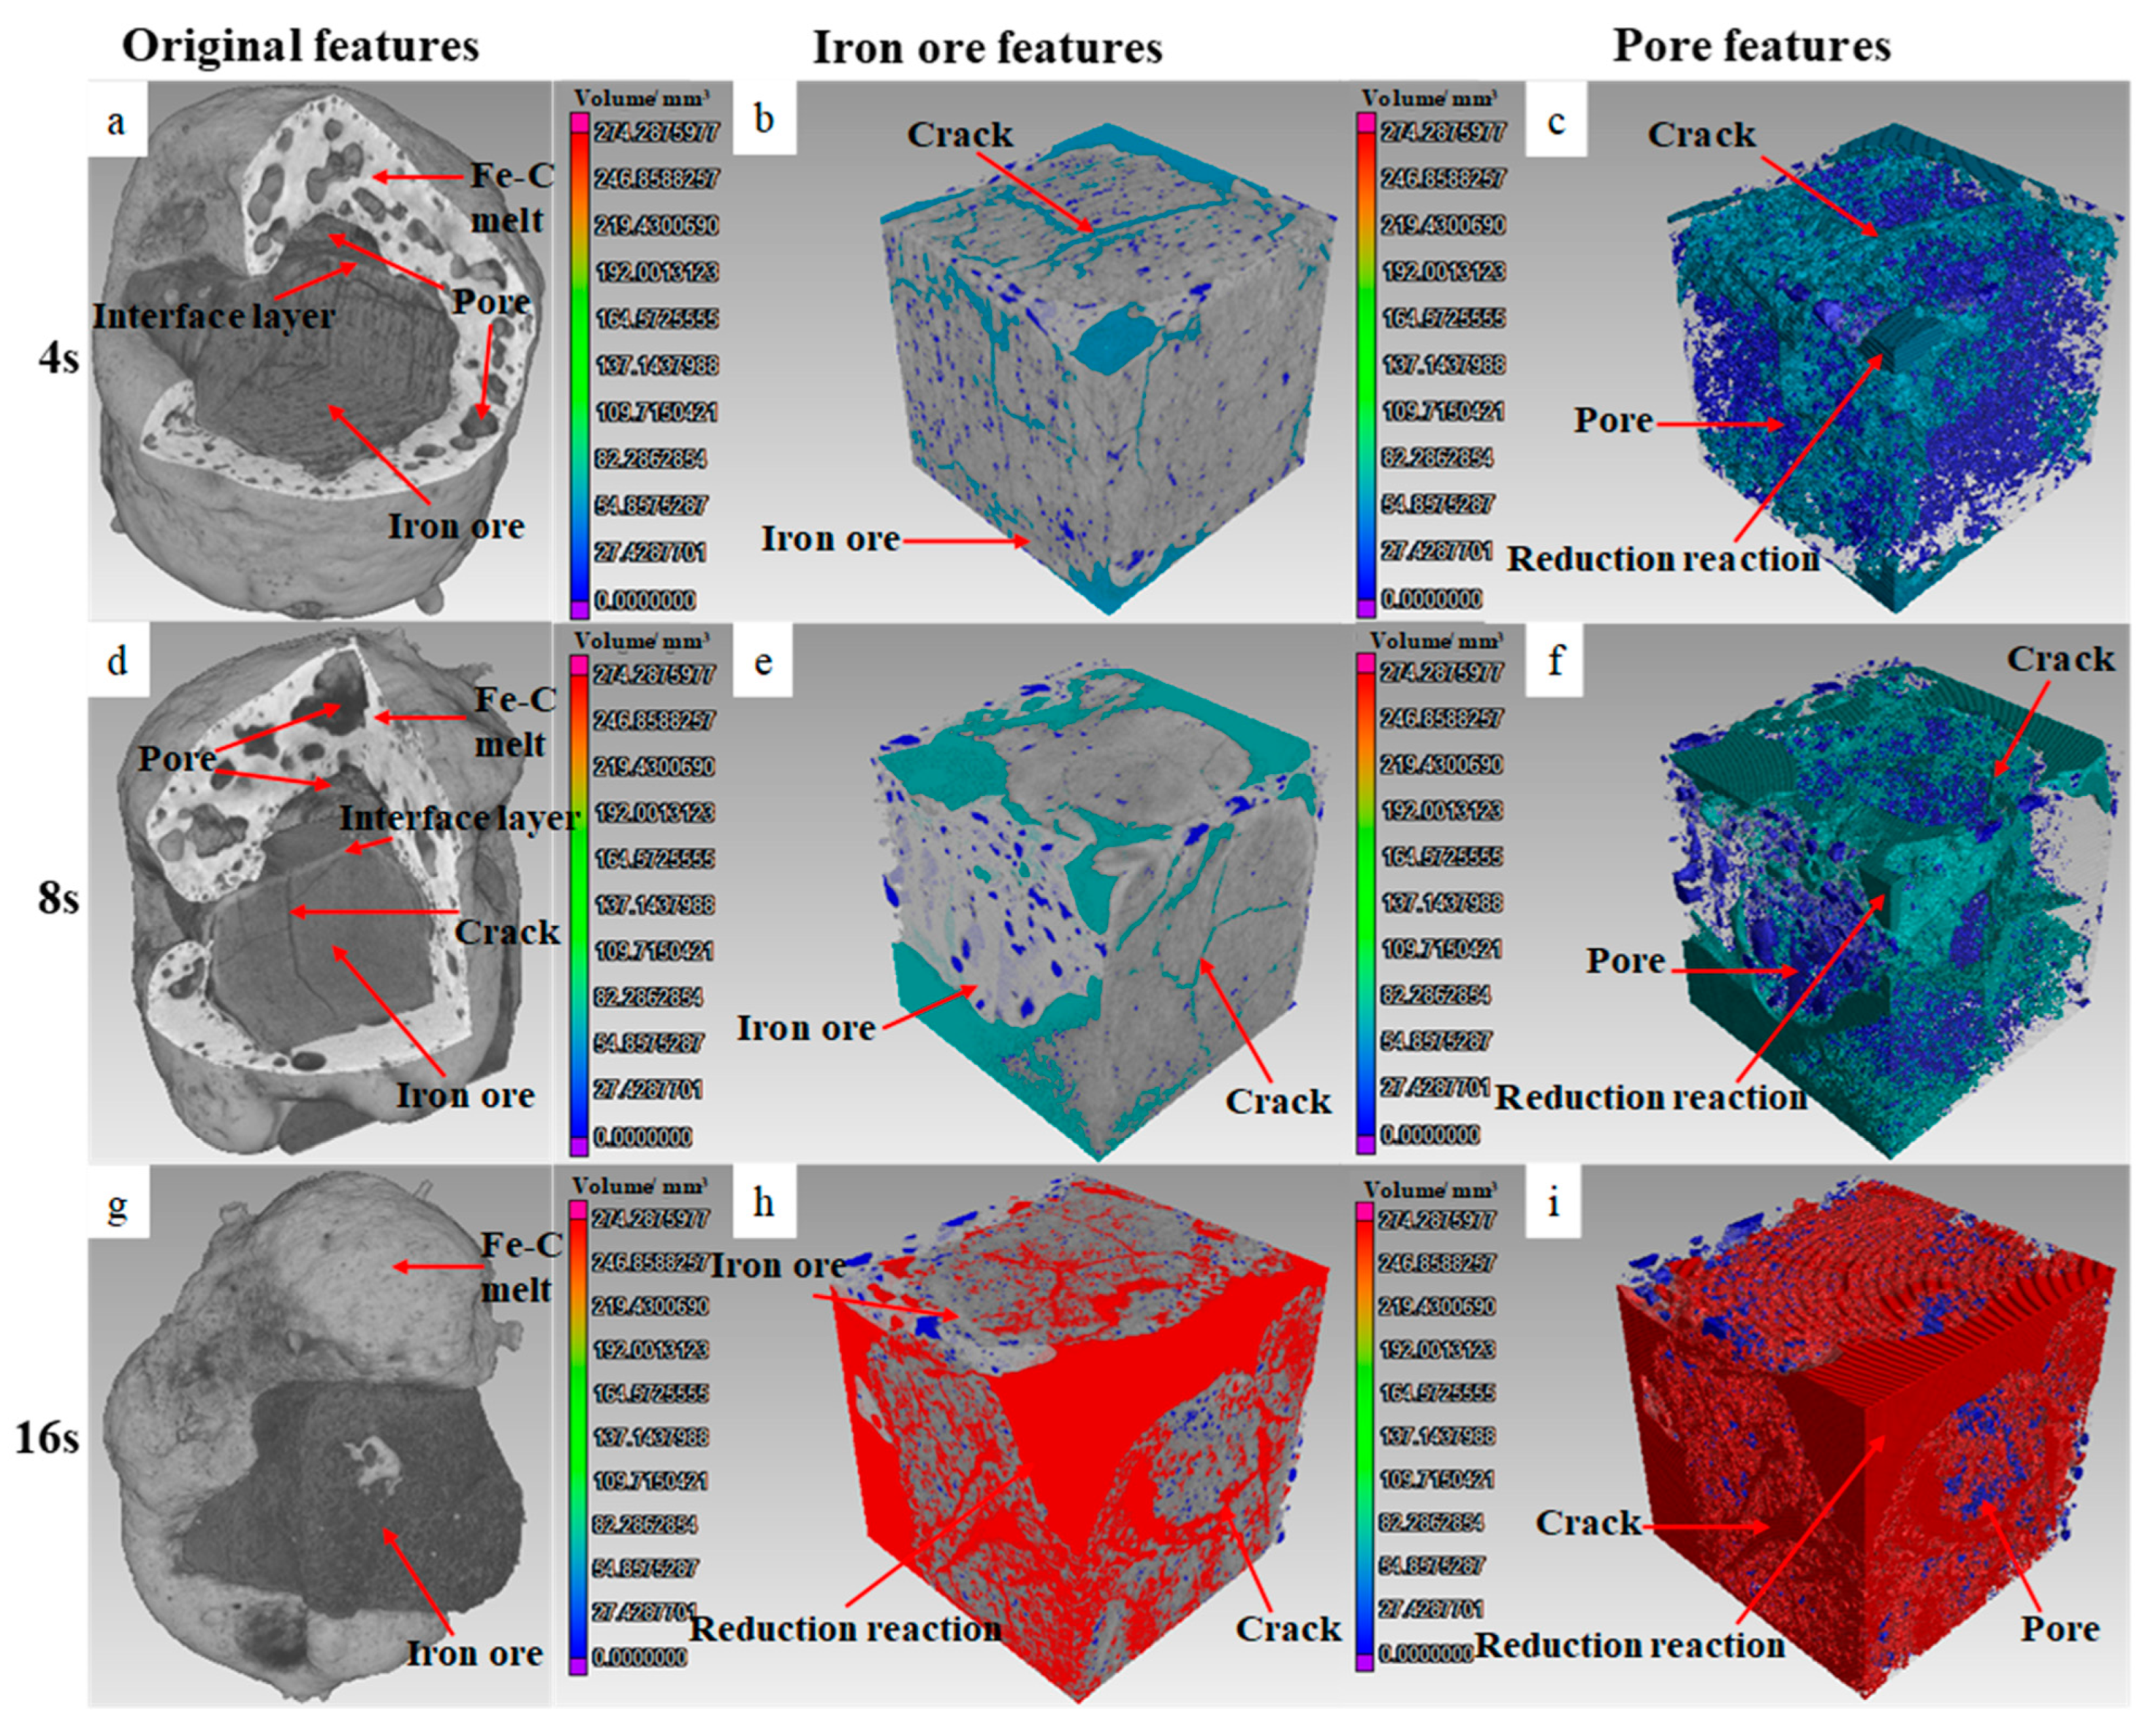
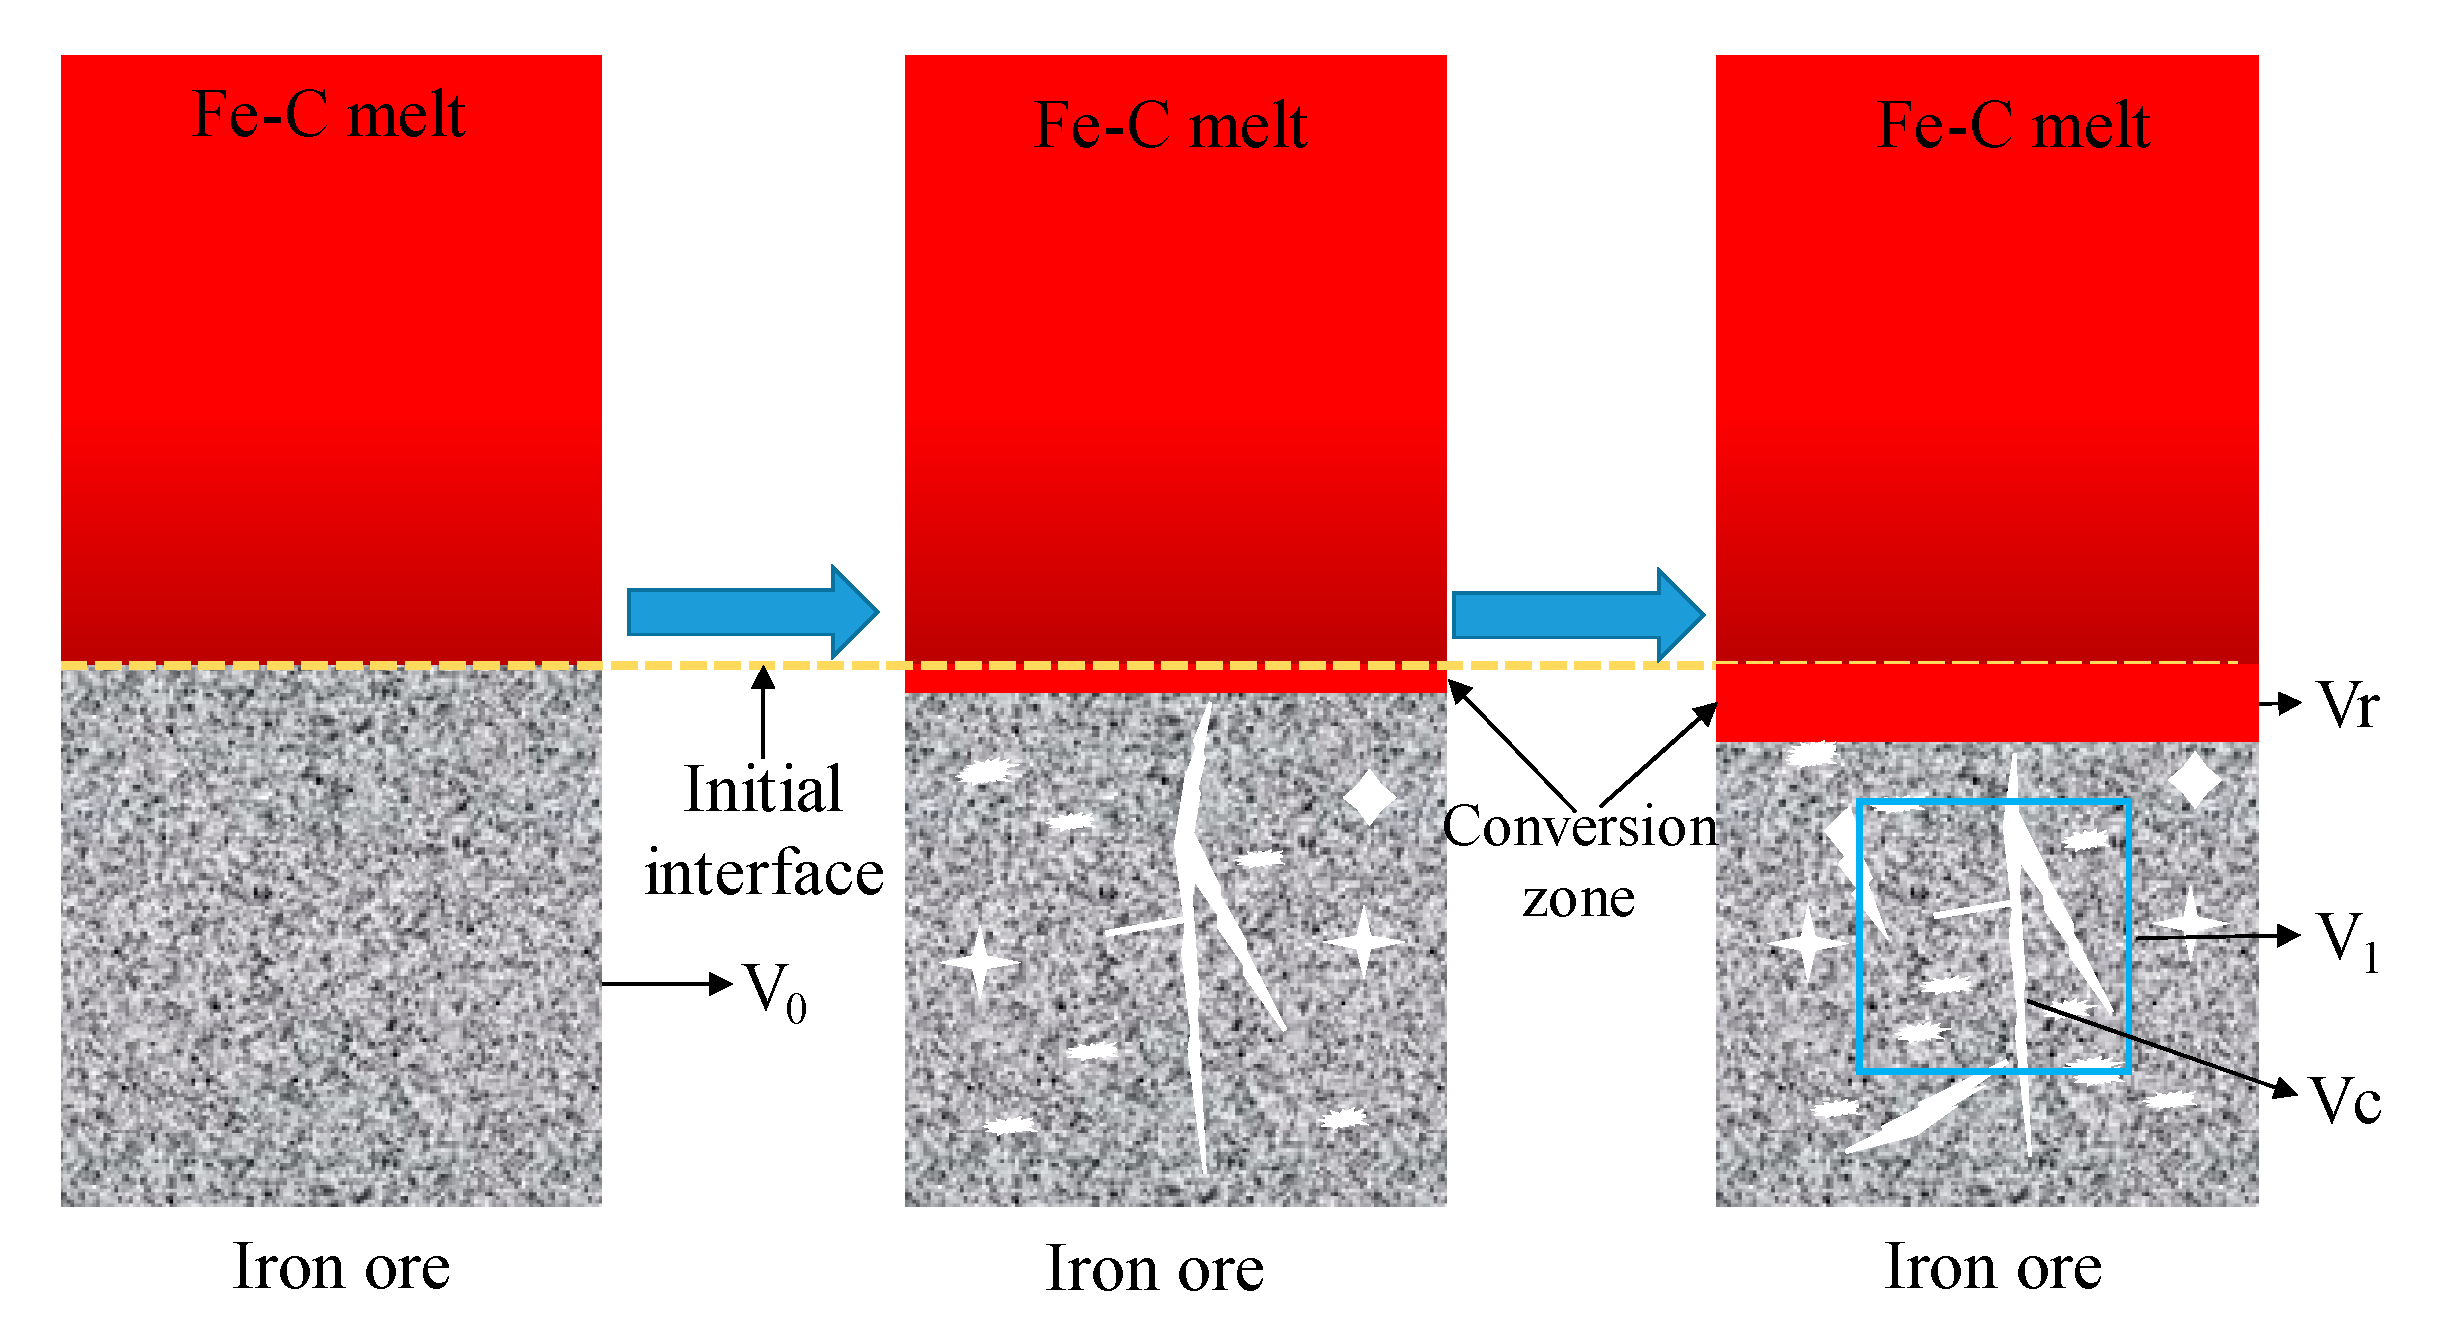
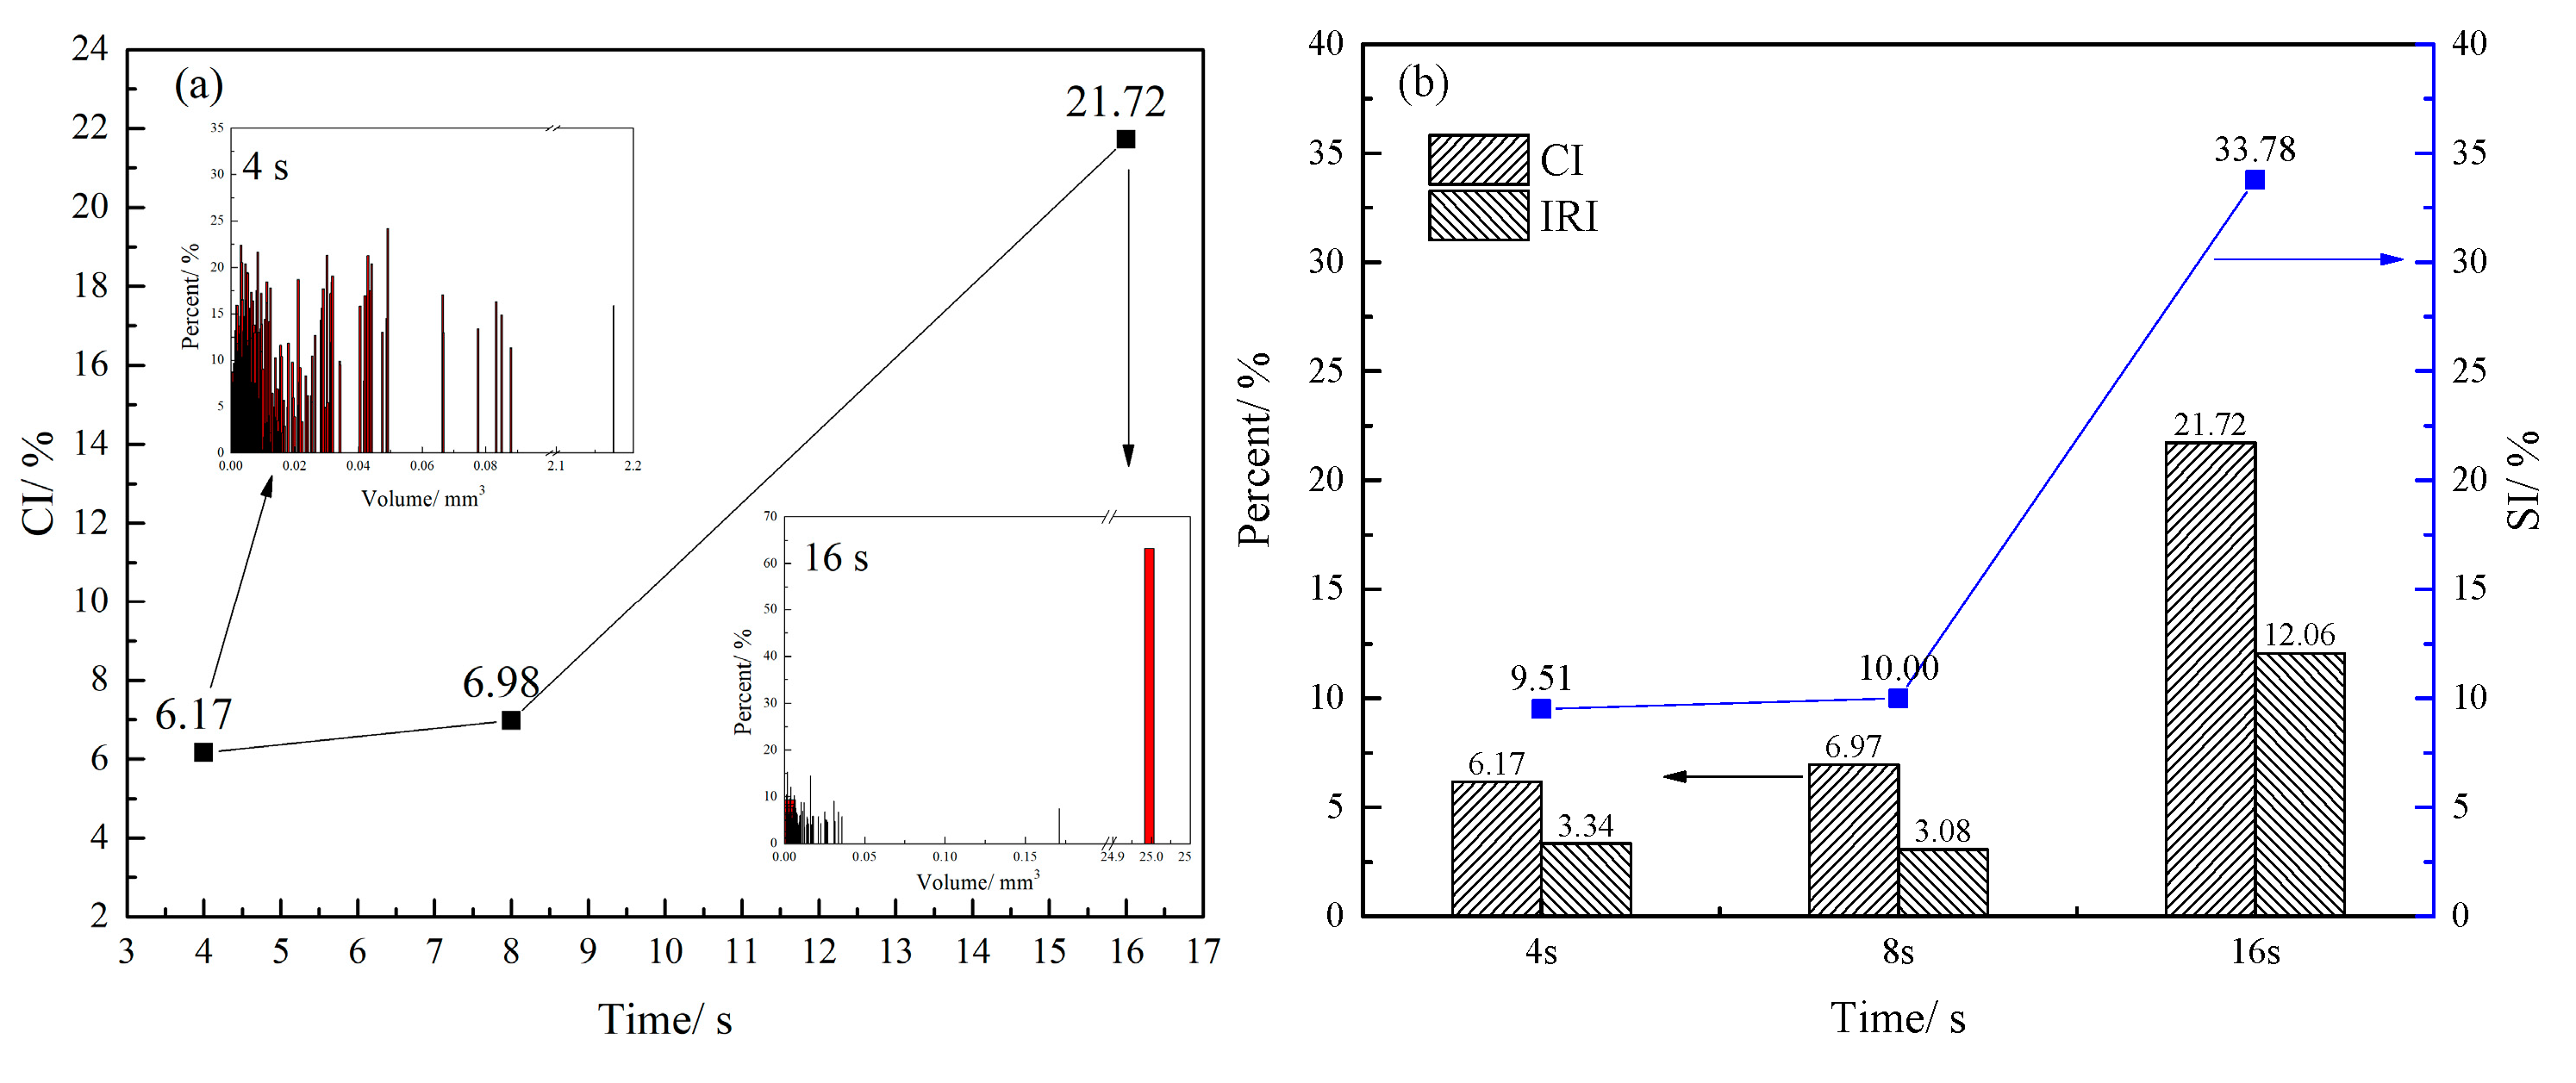
After the iron ore is immersed in the Fe-C melt, when smelting reduction time is 4s, the CI of #1 iron ore can be up to 5.50% with the local connected pores mainly generated by decomposition reaction. As the time is extended to 8 s, the CI gradually increases, and the net-like cracks appear. In the late stage of smelting reduction, the disappearance of iron ore is mainly caused by interfacial reduction reaction, and for instance, the IRI of #1 iron ore at 16 s is 26.44% and the CI is 23.54%.

Author Contributions

Data curation, G.W.; Funding acquisition, Y.W.; Methodology, G.W. and Y.T.; Project administration, J.Z. and Z.L.; Writing—Original draft, G.W.; Writing—Review and editing, G.W. and Y.W. All authors have read and agreed to the published version of the manuscript.

Funding

This research was funded by the financial support provided by the National Natural Science Foundation of China (52174291) and the Beijing New-Star Plan of Science and Technology (Z211100002121115).

Data Availability Statement

All the data that support the findings of this study are included within the article.

Conflicts of Interest

The authors declare no conflict of interest.

References

  1. Dehghan-Manshadi, A.; Manuel, J.; Hapugoda, S.; Ware, N. Sintering Characteristics of Titanium Containing Iron Ores. ISIJ Int. 2014, 54, 2189–2195. [Google Scholar] [CrossRef] [Green Version]
  2. Ding, Y.L.; Merchant, A.J. Kinetics and Mechanism of Smelting Reduction of Fluxed Chromite Part 1 Carbon–Chromite–Flux Composite Pellets in Fe–Cr–C–Si Melts. Ironmak. Steelmak. 1999, 26, 247–253. [Google Scholar] [CrossRef]
  3. Ding, Y.L.; Merchant, A.J. Kinetics and Mechanism of Smelting Reduction of Fluxed Chromite Part 2 Chromite–Flux Pellets in Fe–C–Si Melts. Ironmak. Steelmak. 1999, 26, 254–261. [Google Scholar] [CrossRef]
  4. Strezov, V.; Evans, T.J.; Zymla, V.; Strezov, L. Structural Deterioration of Iron Ore Particles during Thermal Processing. Int. J. Miner. Process. 2011, 100, 27–32. [Google Scholar] [CrossRef]
  5. Veena, H.-G. Degradation Characteristics of Lron Ore Fines of a Wide Size Distribution in Fluidized-Bed Reductlon. ISIJ Int. 1998, 38, 10. [Google Scholar]
  6. Faria, G.L.; Jannotti, N.; da Araújo, F.G.S. Decrepitation Behavior of Manganese Lump Ores. Int. J. Miner. Process. 2012, 102–103, 150–155. [Google Scholar] [CrossRef]
  7. Dhawan, N.; Manzoor, U.; Agrawal, S. Hydrogen Reduction of Low-Grade Banded Iron Ore. Miner. Eng. 2022, 187, 107794. [Google Scholar] [CrossRef]
  8. Hayes, P.C.; Grieveson, P. Microstructural Changes on the Reduction of Hematite to Maanetite. Met. Mater. Trans. B 1981, 12, 579–587. [Google Scholar] [CrossRef]
  9. Moholwa, M.S.; Steenkamp, J.D.; Rutto, H.L. Method to Determine the Decrepitation Index of South African Manganese Ores When Heating in a Rotary Kiln. MethodsX 2022, 9, 101720. [Google Scholar] [CrossRef]
  10. Niu, L.; Zhang, J.; Wang, Y.; Huang, J.; Feng, B.; Liu, Z. Lump Iron Ore Pre-Heating Treatment to Improve Softening-Melting Performance and Reduce Energy Consumption in Ironmaking Process. JOM 2022, 74, 2733–2741. [Google Scholar] [CrossRef]
  11. Santos, L.D.; Brandao, P.R.G. Morphological Varieties of Goethite in Iron Ores from Minas Gerais, Brazil. Miner. Eng. 2003, 16, 1285–1289. [Google Scholar] [CrossRef]
  12. Chen, Z.; Zeilstra, C.; Van Der Stel, J.; Sietsma, J.; Yang, Y. Thermal Decomposition Reaction Kinetics of Hematite Ore. ISIJ Int. 2020, 60, 65–72. [Google Scholar] [CrossRef] [Green Version]
  13. Kashiwaya, Y.; Yamaguchi, Y.; Kinoshita, H.; Ishii, K. In Situ Observation of Reduction Behavior of Hematite with Solid Carbon and Crystallographic Orientation between Hematite and Magnetite. ISIJ Int. 2007, 47, 226–233. [Google Scholar] [CrossRef] [Green Version]
  14. Qu, Y.; Yang, Y.; Zou, Z.; Zeilstra, C.; Meijer, K.; Boom, R. Thermal Decomposition Behaviour of Fine Iron Ore Particles. ISIJ Int. 2014, 54, 2196–2205. [Google Scholar] [CrossRef] [Green Version]
  15. Salmani, M.; Alamdari, E.K.; Firoozi, S. Isoconversional Analysis of Thermal Dissociation Kinetics of Hematite in Air and Inert Atmospheres. J. Therm. Anal. Calorim. 2017, 128, 1385–1390. [Google Scholar] [CrossRef]
  16. Darken, L.S.; Gurry, R.W. The System Iron—Oxygen. II. Equilibrium and Thermodynamics of Liquid Oxide and Other Phases. J. Am. Chem. Soc. 1946, 68, 798–816. [Google Scholar] [CrossRef]
  17. Ferreira, S.; Siguin, D.; Garcia, F. Thermal Analysis of Sintering of Magnetite Pellets. Ironmak. Steelmak. 1994, 21, 119–123. [Google Scholar]
  18. Qi, C.; Feng, G.; Xu, M.; Wang, X.; Wang, Z. A new method for evaluating decrepitation index (DI) of natural lump ore under BF ironmaking. Sinter. Pelletizing 2022, 47, 67–73+109. [Google Scholar] [CrossRef]
  19. Mizutani, M.; Nishimura, T.; Orimoto, T.; Higuchi, K.; Nomura, S.; Saito, K.; Kasai, E. In-Situ Evaluation Method for Crack Generation and Propagation Behaviors of Iron Ore Burden during Low Temperature Reduction by Applying Acoustic Emission Method. ISIJ Int. 2018, 58, 1413–1419. [Google Scholar] [CrossRef] [Green Version]
  20. Bo, Z.; Jie, G.; Huaiwei, Z.; Jiajun, M.; Qiuju, L.; Dongyan, W.; Xin, H. Experimental Investigation on the Optimal Carbon/Hydrogen Ratio for Developing an Iron Bath Reactor with H 2 -C Mixture Reduction-II. Rev. Metall. 2012, 109, 261–269. [Google Scholar] [CrossRef]
  21. Bogdanov, S.P.; Lavrov, B.A.; Udalov, Y.P.; Germanskii, A.M. Effect of Solid Reagent Dispersion in Heterogeneous Chemical Reactions. Refract. Ind. Ceram. 2016, 57, 85–91. [Google Scholar] [CrossRef]
  22. Coetsee, T. A Review of Ore Smelting in High Carbon Ferromanganese Production. Miner. Process. Extr. Metall. Rev. 2020, 41, 255–278. [Google Scholar] [CrossRef]
  23. Leczo, T. HIsmelt Technology: The Future of Ironmaking. Iron Steel Technol. 2009, 6, 21176745. [Google Scholar]
  24. Mourão, M.B. Kinetics and mechanism of reactions between iron oxides and iron-carbon melts. Steel Res. 2000, 71, 3–8. [Google Scholar] [CrossRef]
  25. Gao, L.; Ma, T.; Yan, Z.; Hu, M. Dissolution Kinetics of Titanium in Carbon-Saturated Iron. In Proceedings of the 10th International Symposium on High-Temperature Metallurgical Processing, San Antonio, TX, USA, 13 February 2019; Jiang, T., Hwang, J.-Y., Gregurek, D., Peng, Z., Downey, J.P., Zhao, B., Yücel, O., Keskinkilic, E., Padilla, R., Eds.; Springer International Publishing: Cham, Switzerland, 2019; pp. 545–552. [Google Scholar]
  26. Liu, Y.; Jiang, M.; Xu, L.; Wang, D. A Coupling Dynamic Model for Dissolution and Reduction of Chromium Ore in a Smelting Reduction Converter. J. Iron Steel Res. Int. 2012, 19, 5–10. [Google Scholar] [CrossRef]
  27. Liu, Y.; Jiang, M.-F.; Wang, D.-Y.; Xu, L.-X. Dissolution Kinetics of Chromium Ore in Slag System for Stainless Steelmaking. Can. Metall. Q. 2012, 51, 24–30. [Google Scholar] [CrossRef]
  28. Thrierr-Sorel, A.; Larpin, J.-P.; Mougin, G. Etude Cinétique de La Transformation de La Goethite Alpha-FeOOH En Hematite Alpha-Fe2O3. Annal. Chim. 1978, 3, 305–315. [Google Scholar]
  29. Goss, C.J. The Kinetics and Reaction Mechanism of the Goethite to Hematite Transformation. Mineral. Mag. 1987, 51, 437–451. [Google Scholar] [CrossRef] [Green Version]
  30. Zhang, J.; Liu, Z.; Yang, T. Non-Blast Furnace Ironmaking; Metallurgical Industry Press: Beijing, China, 2015. [Google Scholar]
  31. Xing, L.; Qu, Y.; Wang, C.; Shao, L.; Zou, Z.; Song, W. Kinetic Study on Thermal Decomposition Behavior of Hematite Ore Fines at High Temperature. Metall. Mater. Trans. B 2020, 51, 395–406. [Google Scholar] [CrossRef]
  32. Udalov, Y.P.; Mikhailov, M.N.; Smirnov, V.V.; Sharov, D.Y. Interaction of Molten Iron with Materials Containing Hematite. Glass Phys. Chem. 2008, 34, 305–312. [Google Scholar] [CrossRef]
  33. Udalov, Y.P.; Lavrov, B.A.; Smirnov, V.V.; Sharov, D.Y.; Sidorov, A.S. Interaction of Molten Iron with Ceramics Based on Iron and Aluminum Oxides. Glass Phys. Chem. 2004, 30, 90–97. [Google Scholar] [CrossRef]
  34. Udalov, Y.P.; Mikhailov, M.N.; Fil’chakov, I.F. Interaction of a Ceramic Material Based on Hematite with Molten Iron Produced by an Aluminothermic Reaction. Glass Phys. Chem. 2007, 33, 174–179. [Google Scholar] [CrossRef]
  35. Ozturk, B.; Fruehan, R.J. Dissolution of Fe2O3 and FeO Pellets in Bath Smelting Slags. ISIJ Int. 1992, 32, 538–544. [Google Scholar] [CrossRef] [Green Version]
Figure 1. Microstructure and EDS results of #1 iron ore. (a) Microstructure image with 100 μm scale; (b) Microstructure image with 20 μm scale; (c) Microstructure image with 20 μm scale; (d) Pore structure with 10 μm scale; (e) Pore structure with 10 μm scale; (f) Pore structure with 5 μm scale; (P1) EDS results for hematite in (d); (P2) EDS results for hematite in (e); (P3) EDS results for goethite in (f).
Minerals 13 00448 g001
Figure 2. Microstructure and EDS results of #2 iron ore. (a) Microstructure image with 100 μm scale; (b) Microstructure image with 20 μm scale; (c) Microstructure image with 20 μm scale; (d) Pore structure with 10 μm scale; (e) Pore structure with 10 μm scale; (f) Pore structure with 5 μm scale; (P1) EDS results for hematite in (d); (P2) EDS results for goethite in (d); (P3) EDS results for goethite in (f).
Minerals 13 00448 g002
Figure 3. The TG/DSC analysis of #1 and #2 iron ore. (a) TG-DTG of #1; (b) TG-DSC of #1; (c) TG-DTG of #2; (d) TG-DSC of #2.
Minerals 13 00448 g003
Figure 4. XRD physical phase analysis results of #1 iron ore after thermal decomposition at different temperatures. (a) raw material; (b) 750 °C; (c) 1350 °C.
Minerals 13 00448 g004
Figure 5. XRD physical phase analysis results of #2 iron ore after thermal decomposition at different temperatures. (a) raw material; (b) 750 °C; (c) 1350 °C.
Minerals 13 00448 g005
Figure 6. Internal cracking microstructure during the smelting reduction of #1 iron ore. (a) Microstructure of cracks at 4 s with 100 μm scale; (b) Microstructure of cracks at 4 s with 10 μm scale; (c) Microstructure of cracks at 8 s with 100 μm scale; (d) Microstructure of cracks at 8 s with 10 μm scale; (e) Microstructure of cracks at 12 s with 100 μm scale; (f) Microstructure of cracks at 12 s with 100 μm scale; (g) Microstructure of cracks at 16 s with 20 μm scale; (h) Microstructure of cracks at 16 s with 10 μm scale; (P1) EDS results in (b); (P2) EDS results in (d); (P3) EDS results in (g); (P4) EDS results in (h); (P5) EDS results in (h).
Minerals 13 00448 g006
Figure 7. Internal cracking microstructure during the smelting reduction of #2 iron ore. (a) Microstructure of cracks at 4 s with 100 μm scale; (b) Microstructure of cracks at 4 s with 5 μm scale; (c) Microstructure of cracks at 8 s with 20 μm scale; (d) Microstructure of cracks at 8 s with 5 μm scale; (e) Microstructure of cracks at 16 s with 33 μm scale; (f) Microstructure of cracks at 16 s with 5 μm scale.
Minerals 13 00448 g007
Figure 8. Cracking microstructure of #2 iron ore at 30 s of smelting reduction. (a) Cracking microstructure with 100 μm scale; (b) Cracking microstructure with 20 μm scale; (c) Cracking microstructure with 20 μm scale; (d) Cracking microstructure with 6.7 μm scale; (P1) EDS results in (d); (P2) EDS results in (d).
Minerals 13 00448 g008
Figure 9. Crack morphology structure evolution of #1 at different smelting reduction moments. (ad) 4 s; (eh) 8 s; (il) 16 s.
Minerals 13 00448 g009
Figure 10. Crack morphology structure evolution of #2 at different smelting reduction moments. (ac) 4 s; (df) 8 s; (gi) 16 s.
Minerals 13 00448 g010
Figure 11. Schematic diagram of interfacial reaction and internal crack development in two-dimensional state.
Minerals 13 00448 g011
Figure 12. Evolution of the internal pore structure of iron ore at different times of smelting reduction. (a) Pore structure of #1 iron ore at 4 s; (b) Pore structure of #1 iron ore at 8 s; (c) Pore structure of iron #1 ore at 16 s; (d) Pore structure of #2 iron ore at 4 s; (e) Pore structure of #2 iron ore at 8 s; (f) Pore structure of #2 iron ore at 16 s.
Minerals 13 00448 g012
Figure 13. Characteristics Index of #1 iron ore at different times of smelting reduction. (a) CI results; (b) CI and IRI results.
Minerals 13 00448 g013
Figure 14. Characteristics Index of #2 iron ore at different times of smelting reduction. (a) CI results; (b) CI and IRI results.
Minerals 13 00448 g014
Figure 15. Crack formation mechanism of iron ore in Fe-C melt.
Minerals 13 00448 g015
Table 1. Chemical composition of iron ore raw materials (wt %).
No.TFeFeOSiO2Al2O3CaOMgOTiO2K2ONa2OSPLOSS
#165.540.310.791.640.040.010.140.020.070.040.052.94
#263.850.563.460.740.060.030.040.020.100.030.073.74
Disclaimer/Publisher’s Note: The statements, opinions and data contained in all publications are solely those of the individual author(s) and contributor(s) and not of MDPI and/or the editor(s). MDPI and/or the editor(s) disclaim responsibility for any injury to people or property resulting from any ideas, methods, instructions or products referred to in the content.

