Article

Phonolite-Carbonatite Liquid Immiscibility at 3–6 GPa

by
Anton V. Arefiev
1,
Anton Shatskiy
1,*,
Altyna Bekhtenova
1 and
Konstantin D. Litasov
2
1
Vernadsky Institute of Geochemistry and Analytical Chemistry, Russian Academy of Science, 119991 Moscow, Russia
2
Vereshchagin Institute for High Pressure Physics, Russian Academy of Science, Troitsk, 108840 Moscow, Russia
*
Author to whom correspondence should be addressed.
Minerals 2023, 13(3), 443; https://doi.org/10.3390/min13030443
Submission received: 4 February 2023 / Revised: 3 March 2023 / Accepted: 17 March 2023 / Published: 20 March 2023
(This article belongs to the Special Issue Sulphate and Carbonate Minerals)

Abstract

:
Liquid immiscibility plays an important role in the formation of carbonatites and associated alkaline Si-undersaturated magmas. Experiments in the sodium carbonate-aluminosilicate systems suggest that the carbonate-silicate miscibility gap is limited by crustal and shallow mantle pressures (up to 2.5 GPa). Unlike in the potassium-rich carbonate-aluminosilicate systems, the carbonate-silicate miscibility gap was established at pressures of 3.5–6 GPa. It is therefore interesting to elucidate the immiscibility range under intermediate pressures, corresponding to 100–200 km depths. Here we conducted experiments over 3–6 GPa and 1050–1500 °C in the systems corresponding to immiscible melts obtained by partial melting of carbonated pelite (DG2) at 6 GPa and 1200 °C. We found that partial melting begins with the alkali-rich carbonatite melt, while immiscible phonolite melt appears over 1050–1200 °C at 3 GPa, 1200 °C at 4.5 GPa, and 1200–1500 °C at 6 GPa. As pressure decreases from 6 to 3 GPa, Na becomes less compatible, and the concentration of the jadeite component in clinopyroxene decreases by a factor of 1.5–6. As a result, the compositions of the immiscible phonolite and carbonatite melts evolve from ultrapotassic (K2O/Na2O weight ratio = 10–14) resembling silicic and carbonatitic micro-inclusions in diamonds from kimberlites and placers worldwide to moderately potassic (K2O/Na2O = 1–2), which may correspond to phonolitic and associated carbonatitic melts of the spinel facies of the shallow mantle.

1. Introduction

Liquid immiscibility is an important mechanism of magmatic differentiation of alkaline carbonatite complexes. Carbonate-silicate liquid immiscibility has been observed in the sodium aluminosilicate systems under P–T conditions of the crust and shallow mantle (0.1–2.5 GPa) [1,2,3,4,5,6]. The experiments both in model systems, for example, Di + Jd + 2Mgs at 3–6 GPa [7,8], and in the carbonate-eclogite systems [9,10,11,12] indicate that the immiscibility between sodic carbonate and aluminosilicate melts ceases above 2.5–3 GPa. There is also a report on a carbonate-silicate miscibility gap in the Opx + Na2CO3 system established at a higher pressure of 4 GPa and 1140 °C [13]. Yet, this system is difficult to classify as an aluminosilicate. Another experimental study of the kamafugite–carbonatite system at 1.7 GPa revealed that liquid immiscibility may also occur in the potassium carbonate–aluminosilicate systems [14]. Findings of ultrapotassic aluminosilicate and carbonatite melt/fluid inclusions in diamonds from kimberlites and placers worldwide led to the assumption that the carbonate-silicate liquid immiscibility extends to the base of the subcontinental lithospheric mantle [15]. Recent experiments at 2.5–6 GPa in the K-rich carbonate-aluminosilicate systems modeling recycled carbonated sediments, metapelites, support this hypothesis [16,17,18,19,20]. The studies of dehydrated carbonated metapelite (DG2) have revealed that at 5.5–6.5 GPa, the partial melting begins with a K-rich dolomite-ankerite melt [16,21]. The carbonate melt is stable from 1000 to 1180 °C [16,21], while the second immiscible CO2-bearing phonolite melt appears at 6 GPa and 1200 °C [16]. It was found that at 6 GPa, K-rich Ca-Mg-Fe carbonate and conjugate K-rich aluminosilicate (CO2-bearing phonolite) melts coexist over 1200–1500 °C [16] (Figure 1). At the next stage, it is interesting to fundamentally determine the P–T field of liquid immiscibility and trends in the composition of melts at intermediate pressures corresponding to depths of 100–200 km.
Here, we carried out multi-anvil experiments over the range of 3–6 GPa and 1050–1500 °C. Since the abundance of refractory crystalline phases restricts the fraction of liquid phases, which complicates their detection and analysis, the experiments were carried out in the systems corresponding to the immiscible carbonate and silicate melts established in carbonated pelite (DG2) at 6 GPa and 1200 °C by Shatskiy et al. [16]. Two systems were studied. The first one, L(S) + L(C), corresponds to a mixture of two immiscible melts, CO2-bearing phonolite and K-rich carbonate (Table 1). The second one, L(S), corresponds to the composition of the CO2-bearing phonolite melt from the same experiment (Table 1).

2. Methods

We conducted a set of experiments over 3–6 GPa and 1050–1500 °C using a multianvil DIA-type press, «Discoverer-1500» [29]. Eight 26 mm tungsten carbide cubes, “Fujilloy N-05” (Fuji Die Co., Ltd., Tokyo, Japan), with 12 mm truncations were used as inner-stage anvils. ZrO2 pressure media (OZ-8C, MinoYogyo Co., Ltd., Nagoya, Japan, [30] were shaped as 20.5 mm octahedra with ground edges and corners. Pyrophyllite gaskets, 4.0 mm in both width and thickness, were used to seal the compressed volume and support the anvil flanks. A multi-charge assembly was employed, which allows simultaneous loading of up to 16 cylindrical samples of 0.9 mm in size in a single run. Depending on the location of the sample relative to the center of the heater, the hot temperature zone is located at the top or bottom of the sample. A description of the assembly and experimental procedures are given in [31]. The sample temperature was measured by a W97Re3-W75Re25 thermocouple and controlled automatically within 2 °C of the desired value. No correction of the effect of pressure on emf was applied. The maximum temperature gradients within the sample charge vary from 5 to 8 °C/mm as temperature increases from 1000 to 1500 °C, respectively. High-temperature pressure calibration was carried out using known phase transitions in SiO2 (quartz-coesite) [32] and CaGeO3 (garnet-perovskite) [33]. Uncertainties in the temperature and pressure measurements were less than 20 °C and 0.5 GPa, respectively [34]. The experiments were run in graphite capsules. Thus, the redox condition of the experiments should approximately correspond to the graphite–carbon dioxide (CCO) buffer [35].
Two starting mixtures were prepared: L(S) + L(C) and L(S) (Table 1). Starting materials were prepared using reagent-grade oxides, carbonates, synthetic KAlSi3O8 glass, natural magnesite (<0.1% impurity), and dolomite (<0.3% impurity) from Brumado (Bahia, Brazil). The starting materials were blended in an agate mortar under acetone and loaded as a powder into graphite capsules. The loaded capsules were dried at 300 °C for 1–2 h. Prepared assemblies were stored at 200 °C in a vacuum for ≥12 h before the experiment. All experiments were conducted at 15%–35% indoor humidity. Despite these efforts, phlogopite was detected in two L(S) + L(C) samples synthesized at 3 GPa (Table 2), which indicates their contamination with atmospheric water.
The recovered samples were polished using an anhydrous lubricant, WD-40, and cleaned using benzine before carbon coating [34]. The composition and phase relations of the recovered samples were studied using a MIRA 3 LMU scanning electron microscope (Tescan Orsay Holding) coupled with an INCA energy-dispersive X-ray microanalysis system [36]. The Raman spectra of the quench products of carbonate and silicate melts were collected using a Horiba Jobin Yvon Lab-RAM HR800 spectrometer equipped with a multi-channel LN/CCD detector with a resolution of 1024 pixels and a solid-state laser wavelength of 532.1 nm.

3. Results

The compositions of the starting mixtures, L(S) + L(C) and L(S), are given in Table 1. Experimental conditions and phase proportions for the systems L(S) + L(C) and L(S) are listed in Table 2 and Table 3, respectively. BSE images of the run products and phase proportions inferred from mass-balance calculations are shown in Figure 2, Figure 3, Figure 4 and Figure 5. Corresponding BSE images and phase proportions for the L(S) system are presented in Figure 6, Figure 7, Figure 8 and Figure 9, respectively. The compositions of minerals and melts are given in Table 4, Table 5, Table 6, Table 7 and Table 8, Table S1 and S4 and plotted in Figure 10, Figure 11, Figure 12 and Figure 13. The mineral symbols are given in the abbreviations section at the end of the manuscript just before the reference section.

3.1. Phase Assemblages and Textures

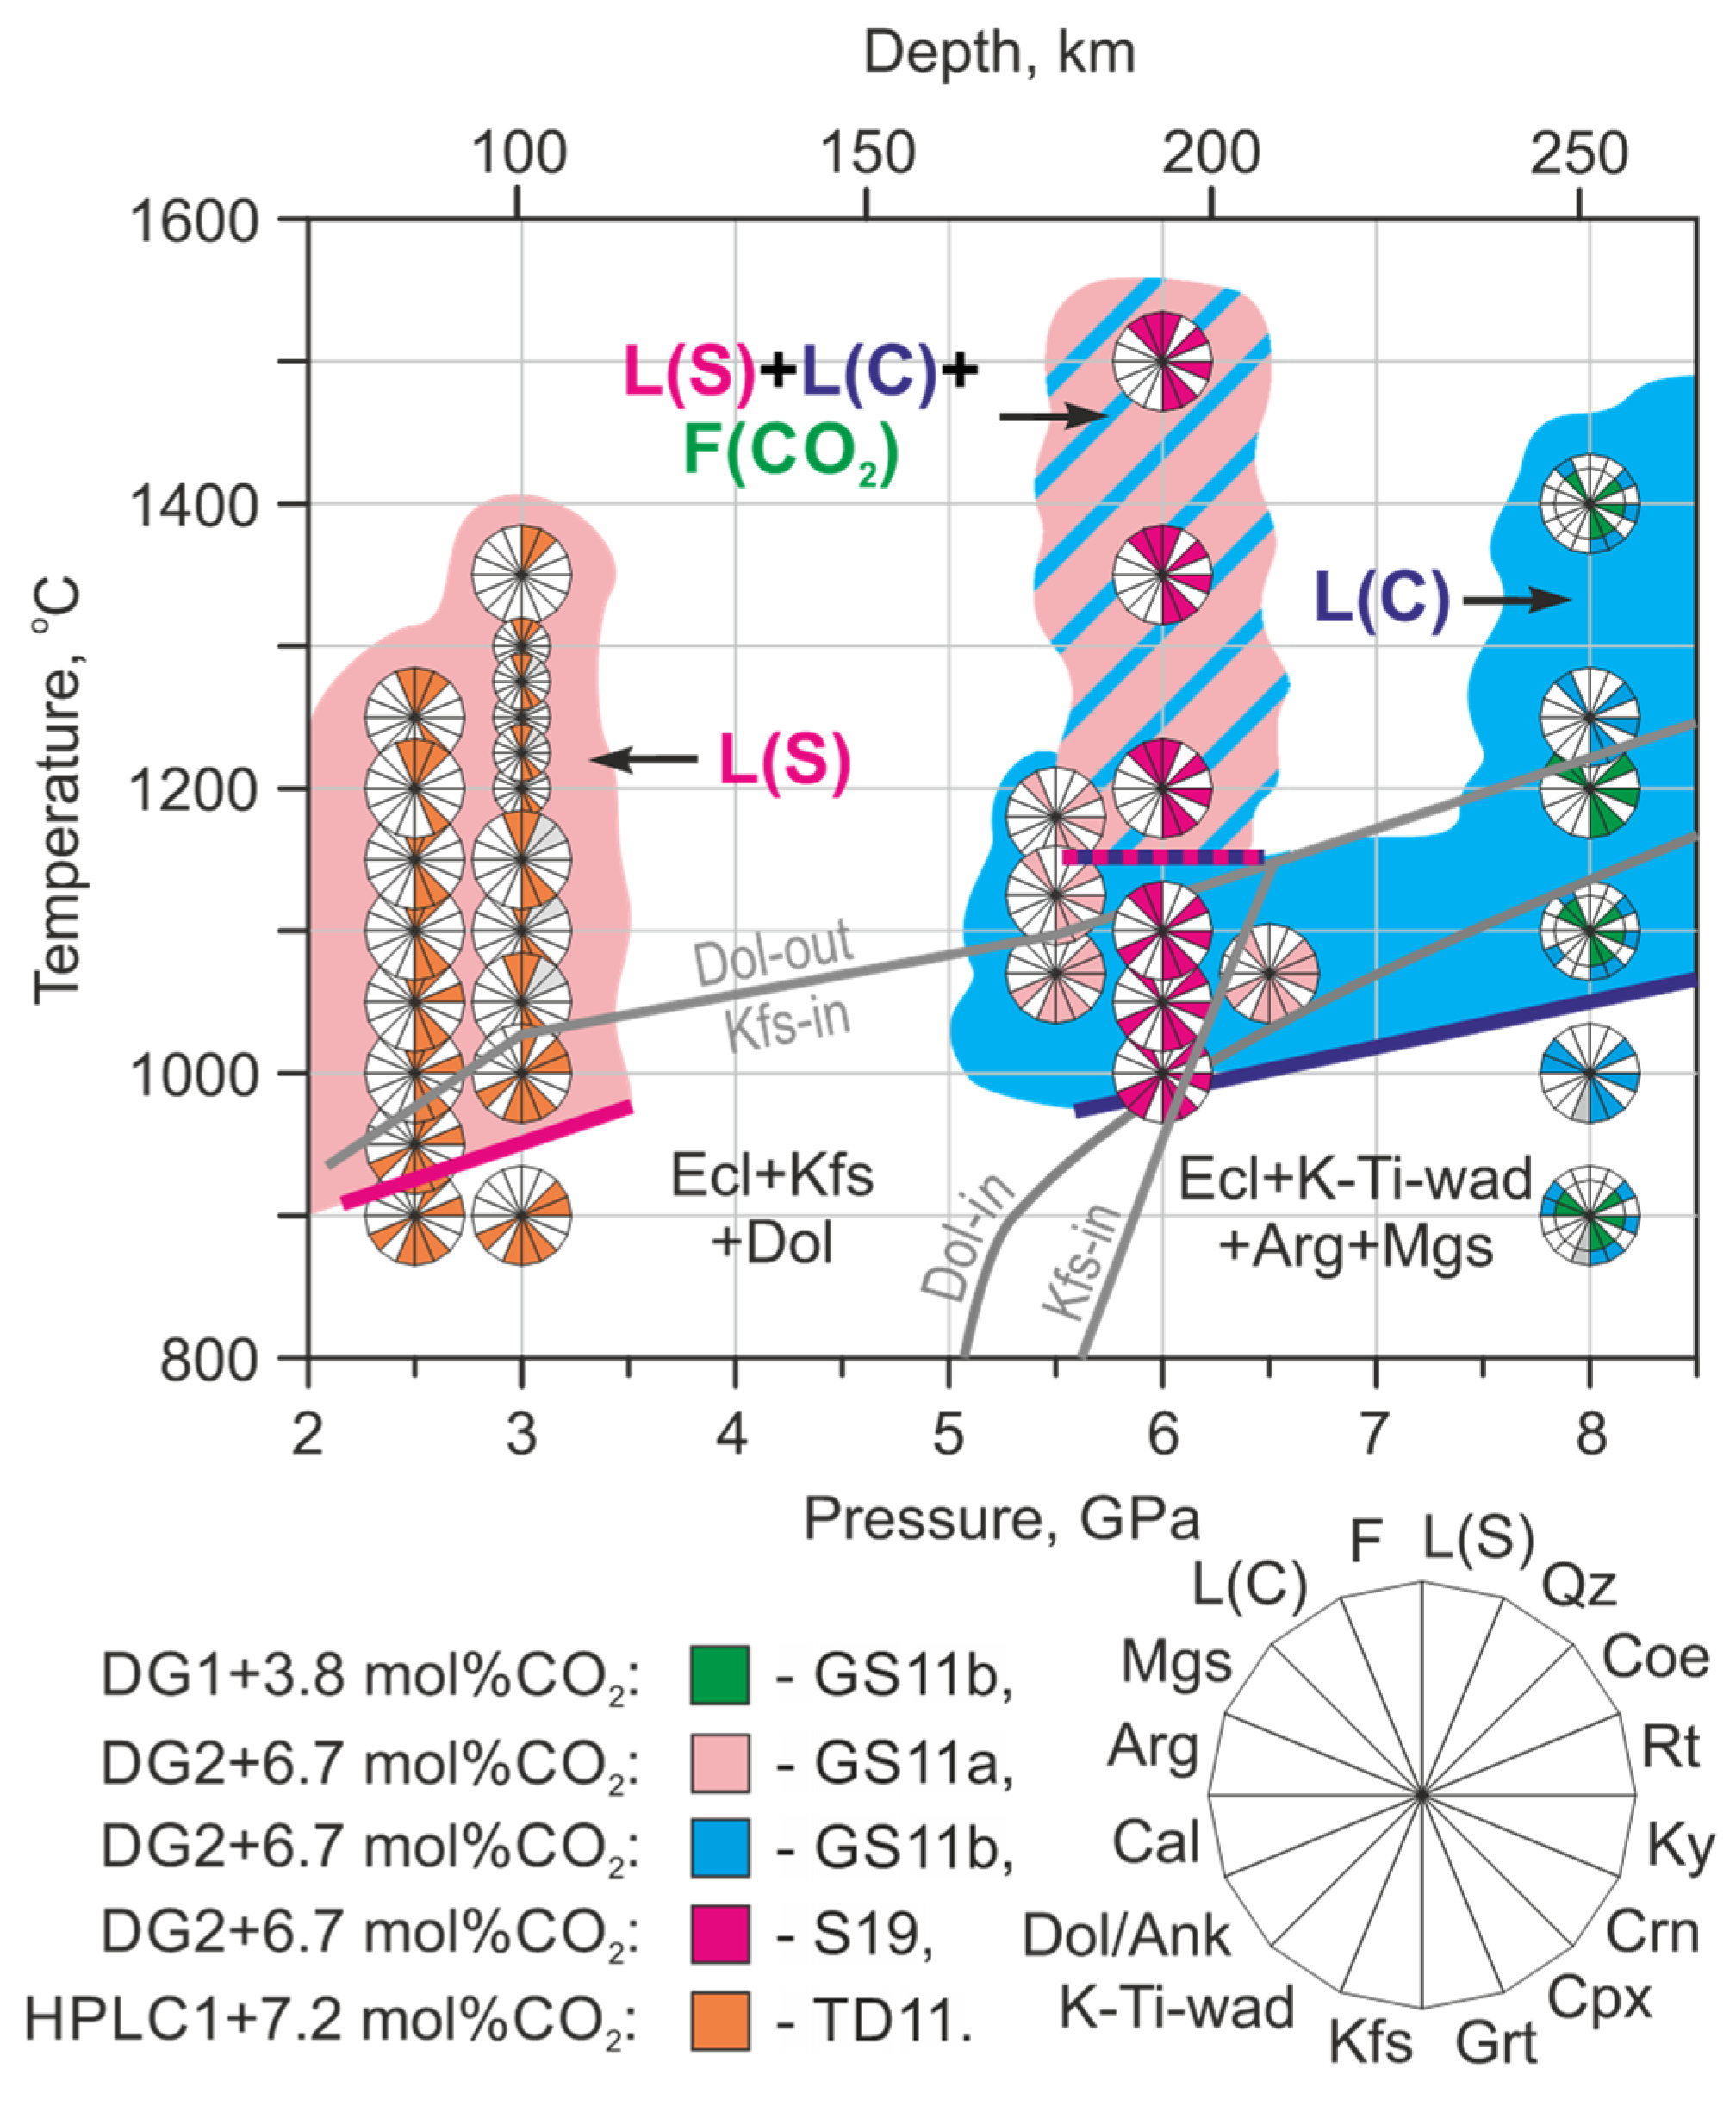
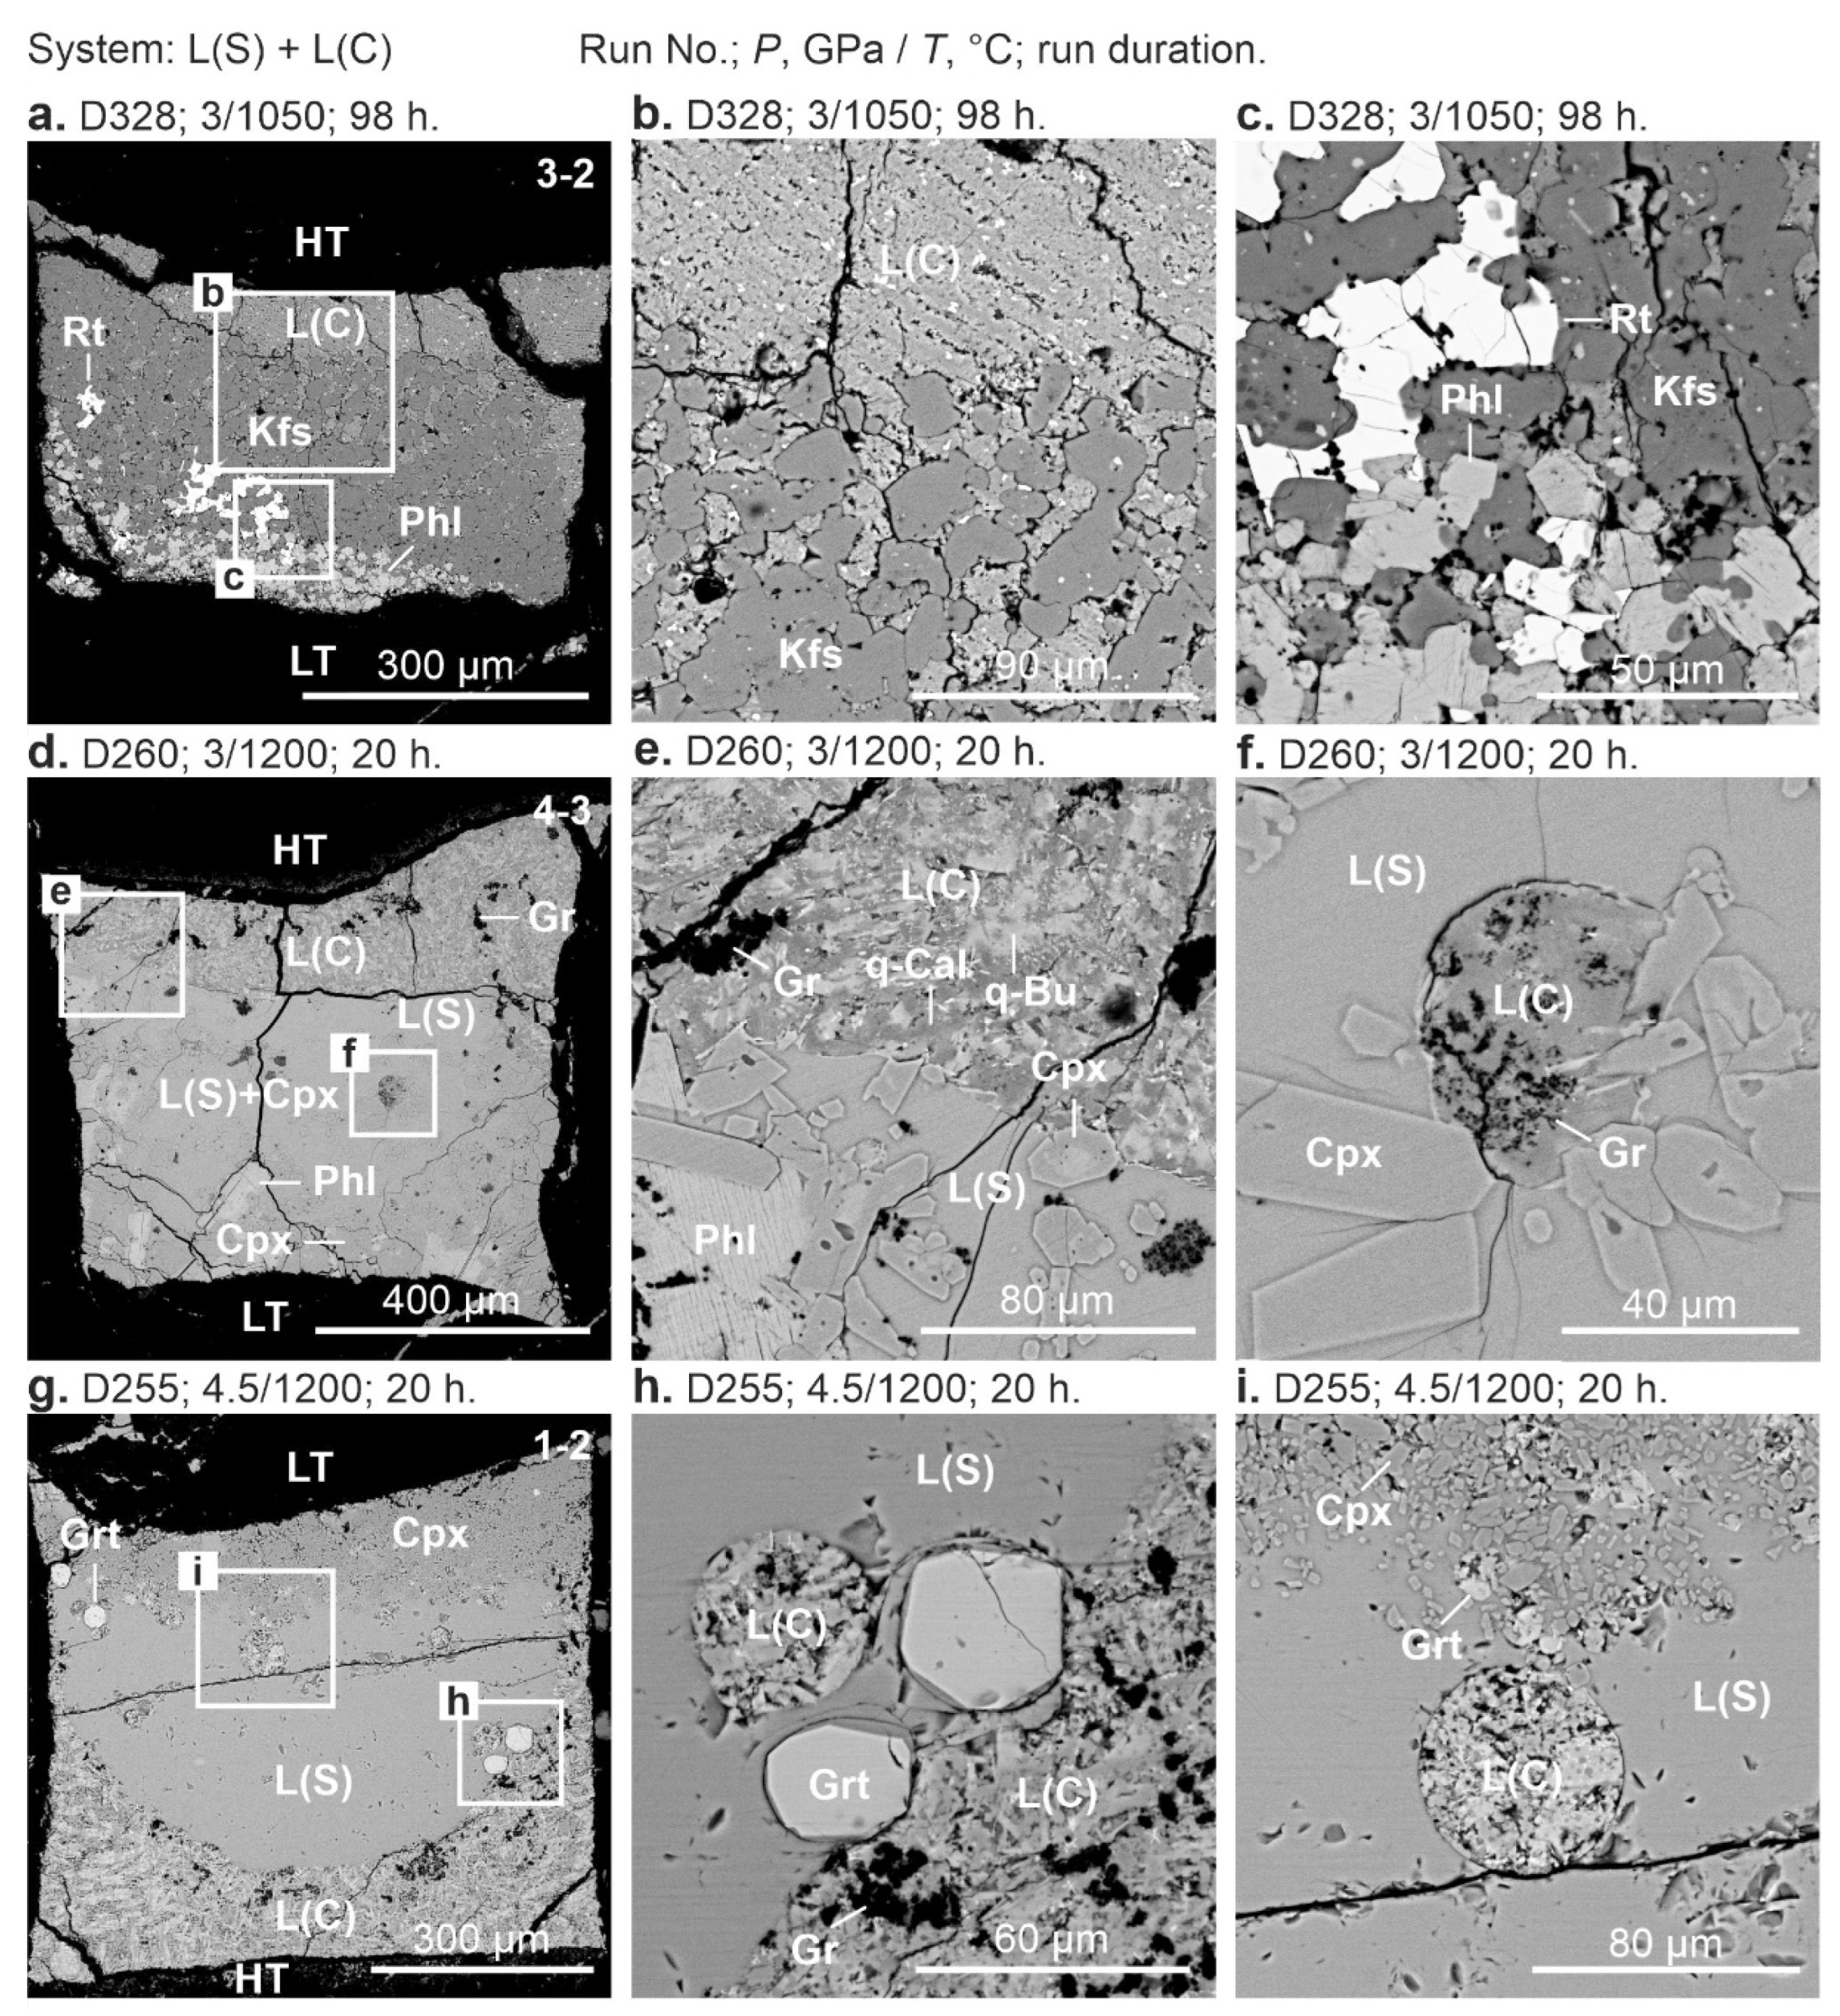
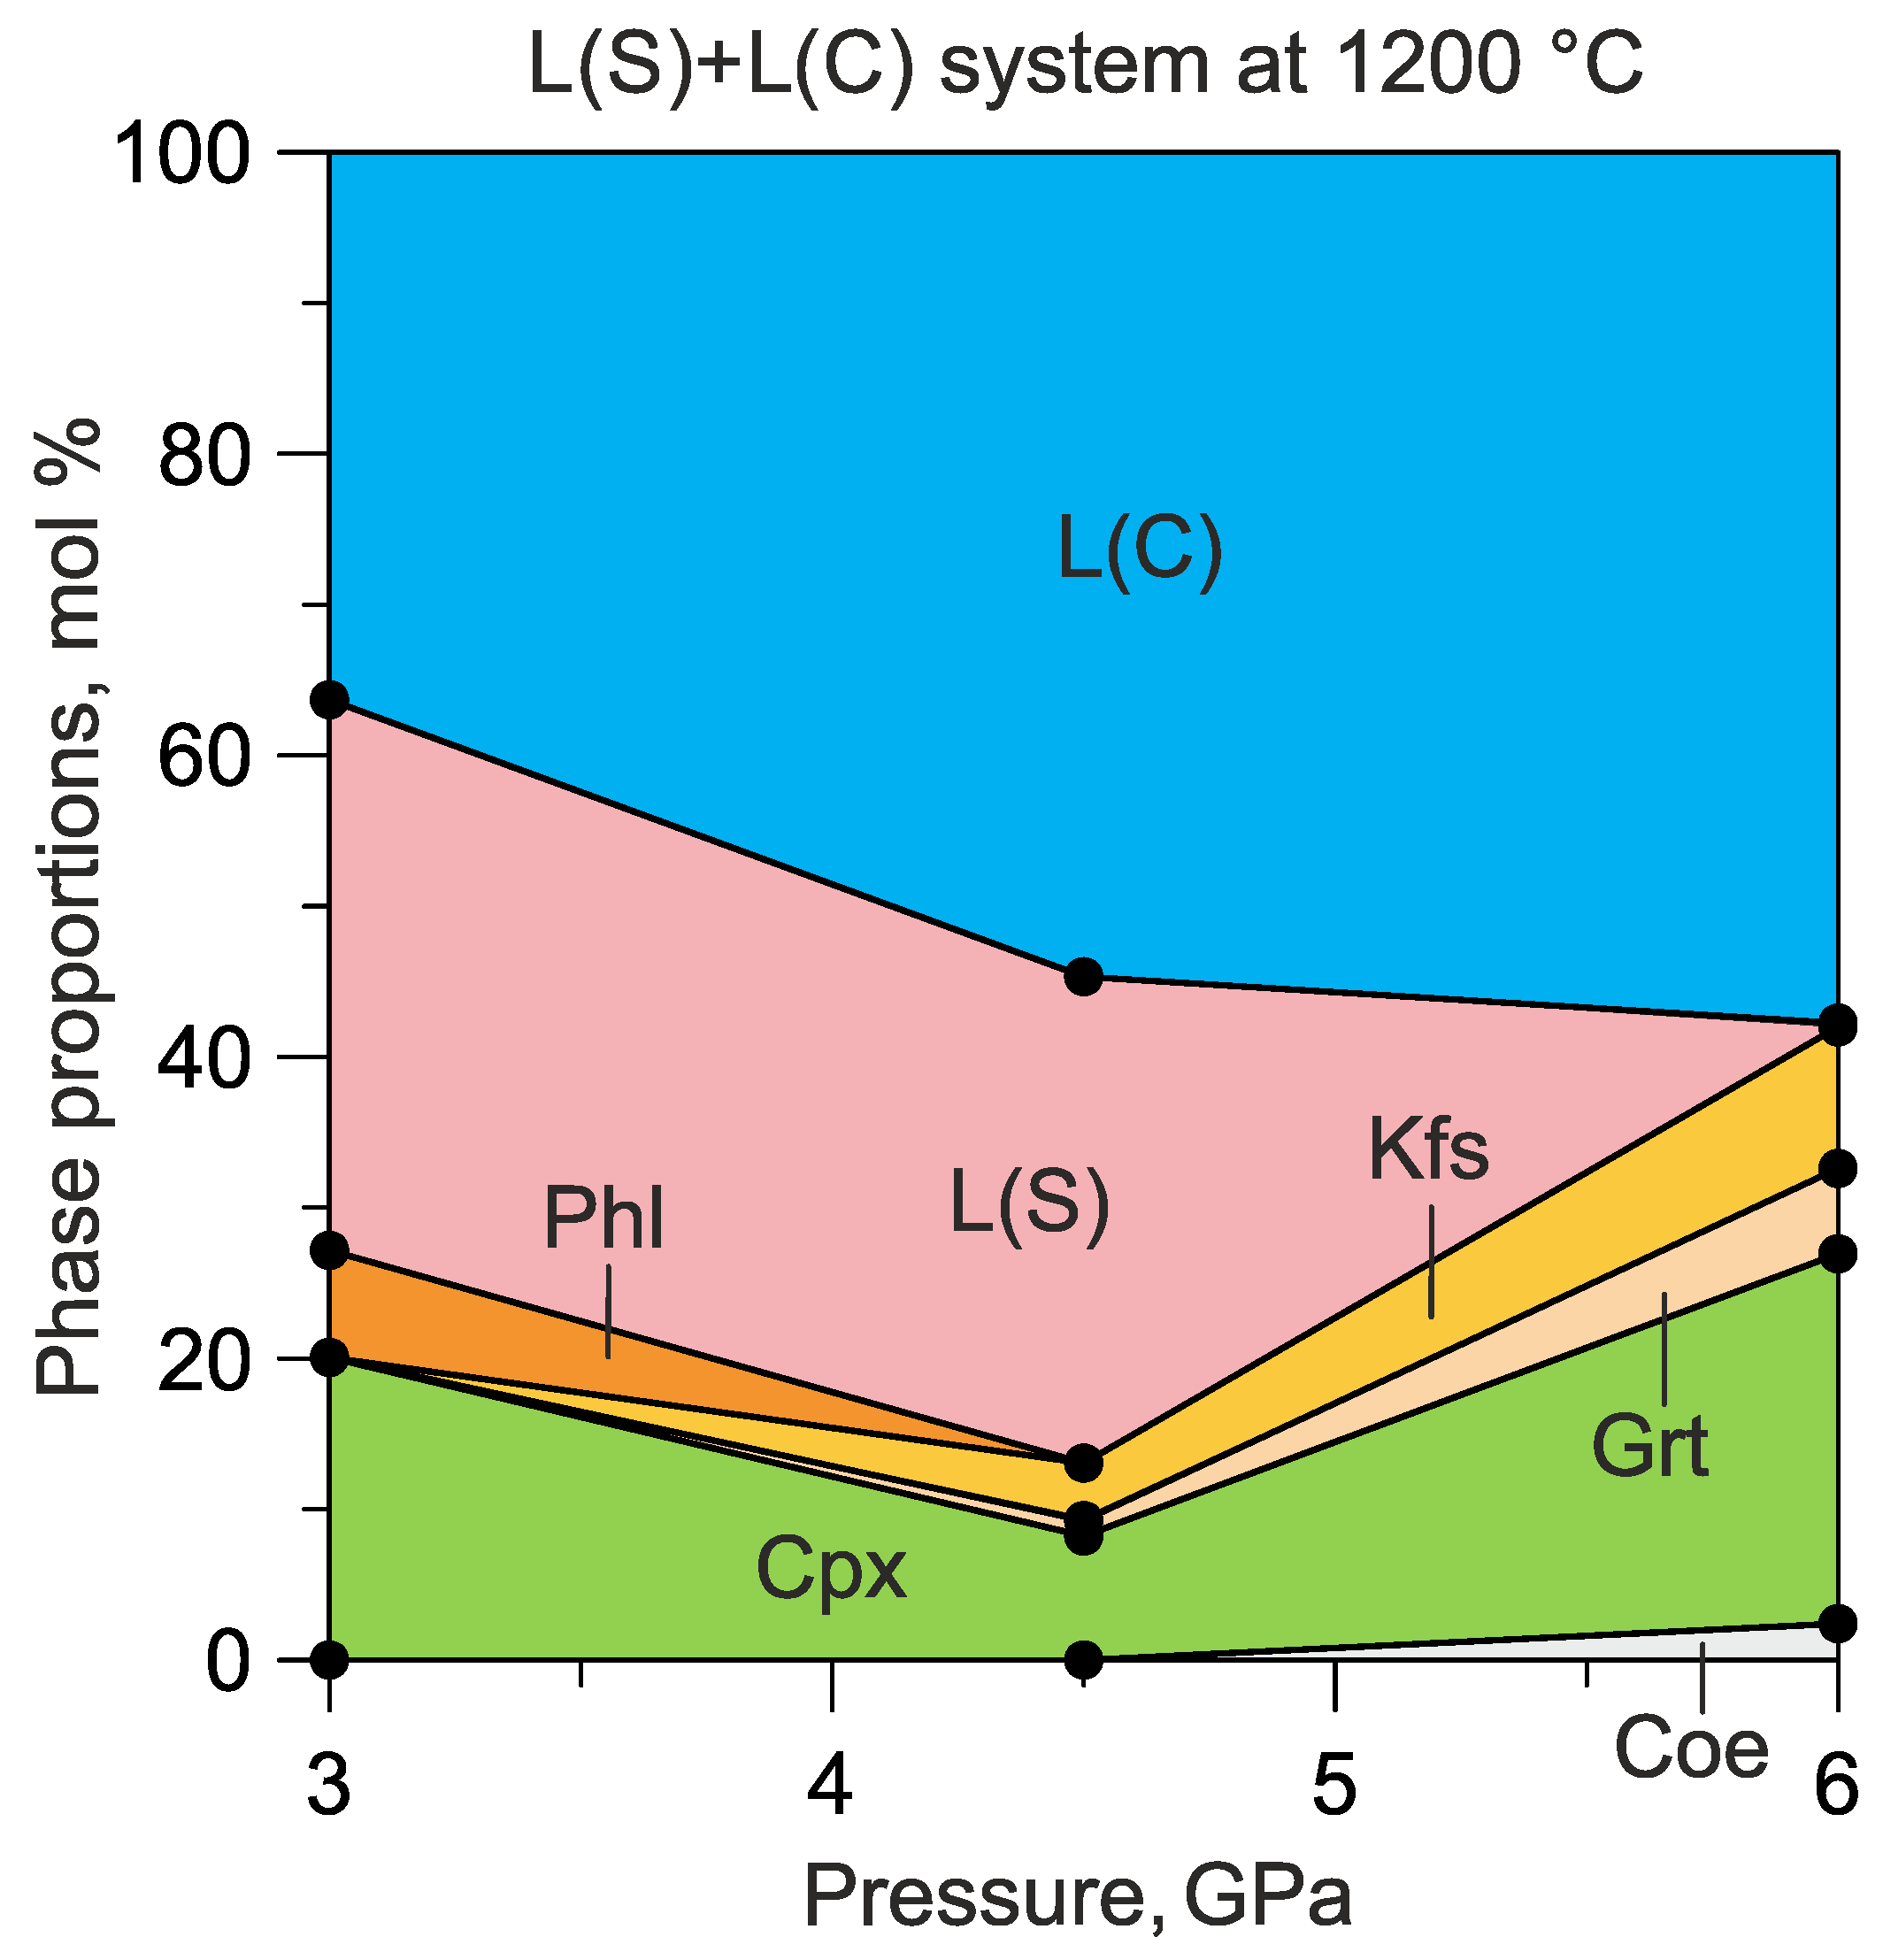
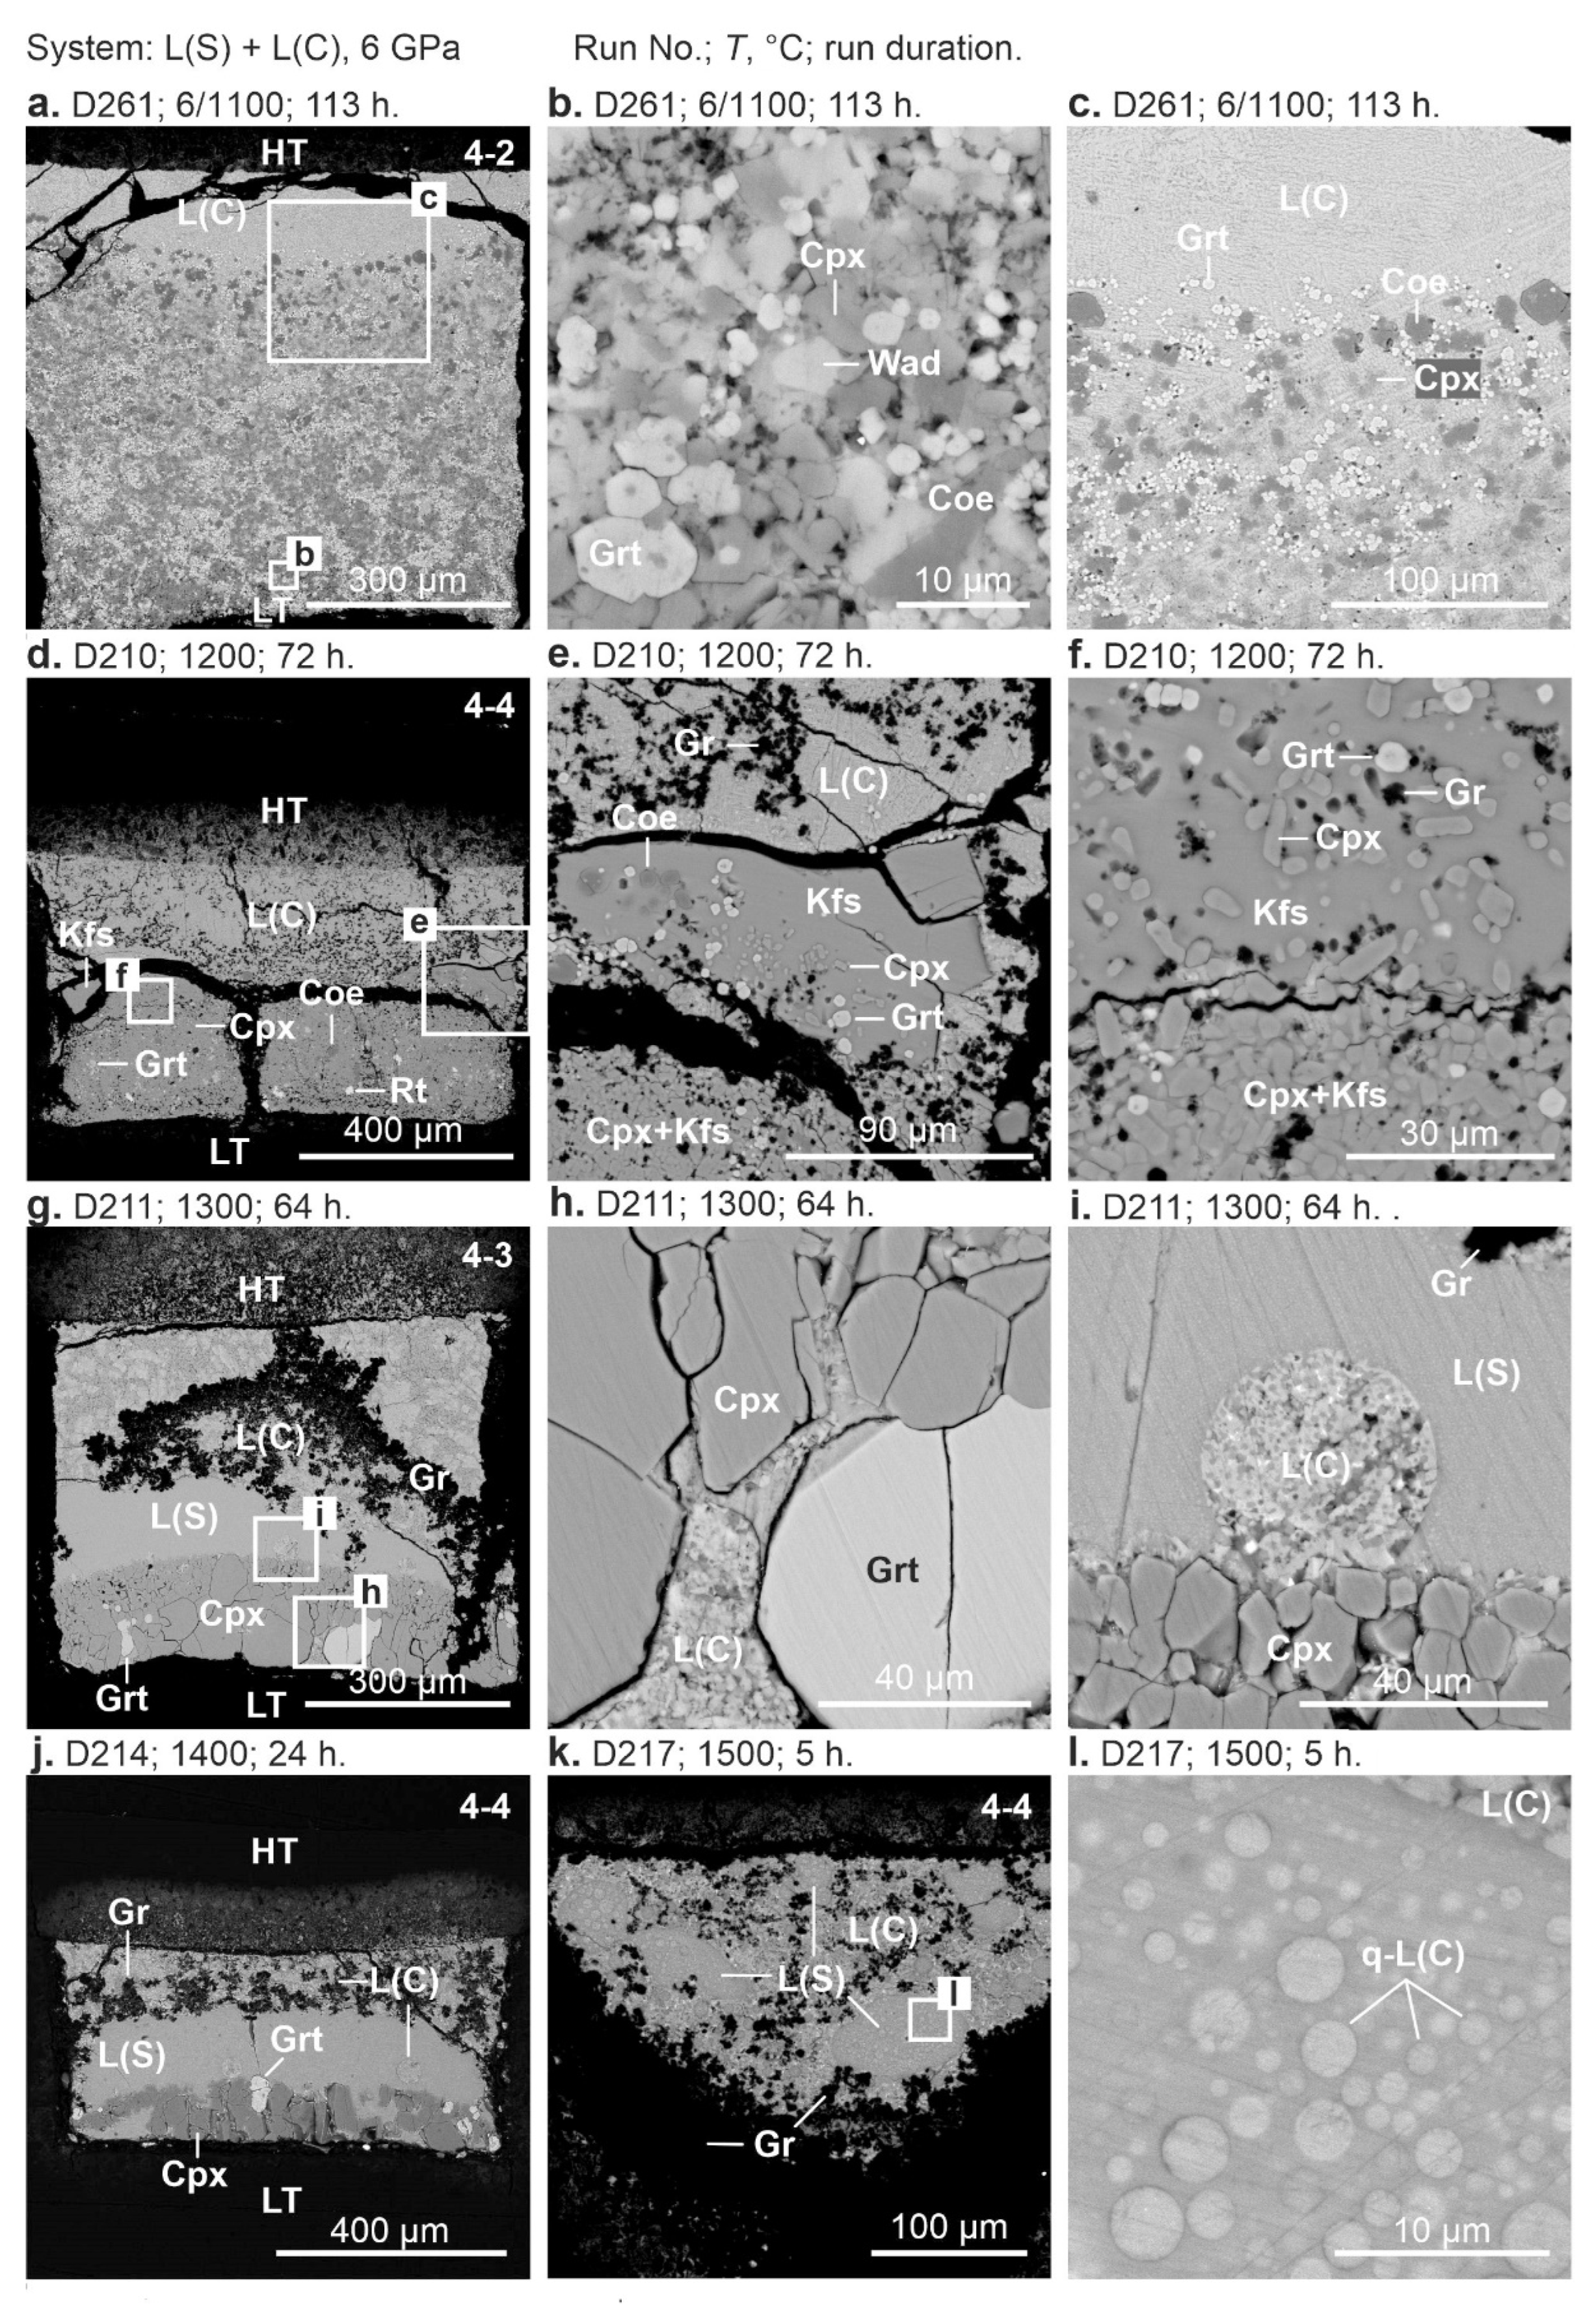
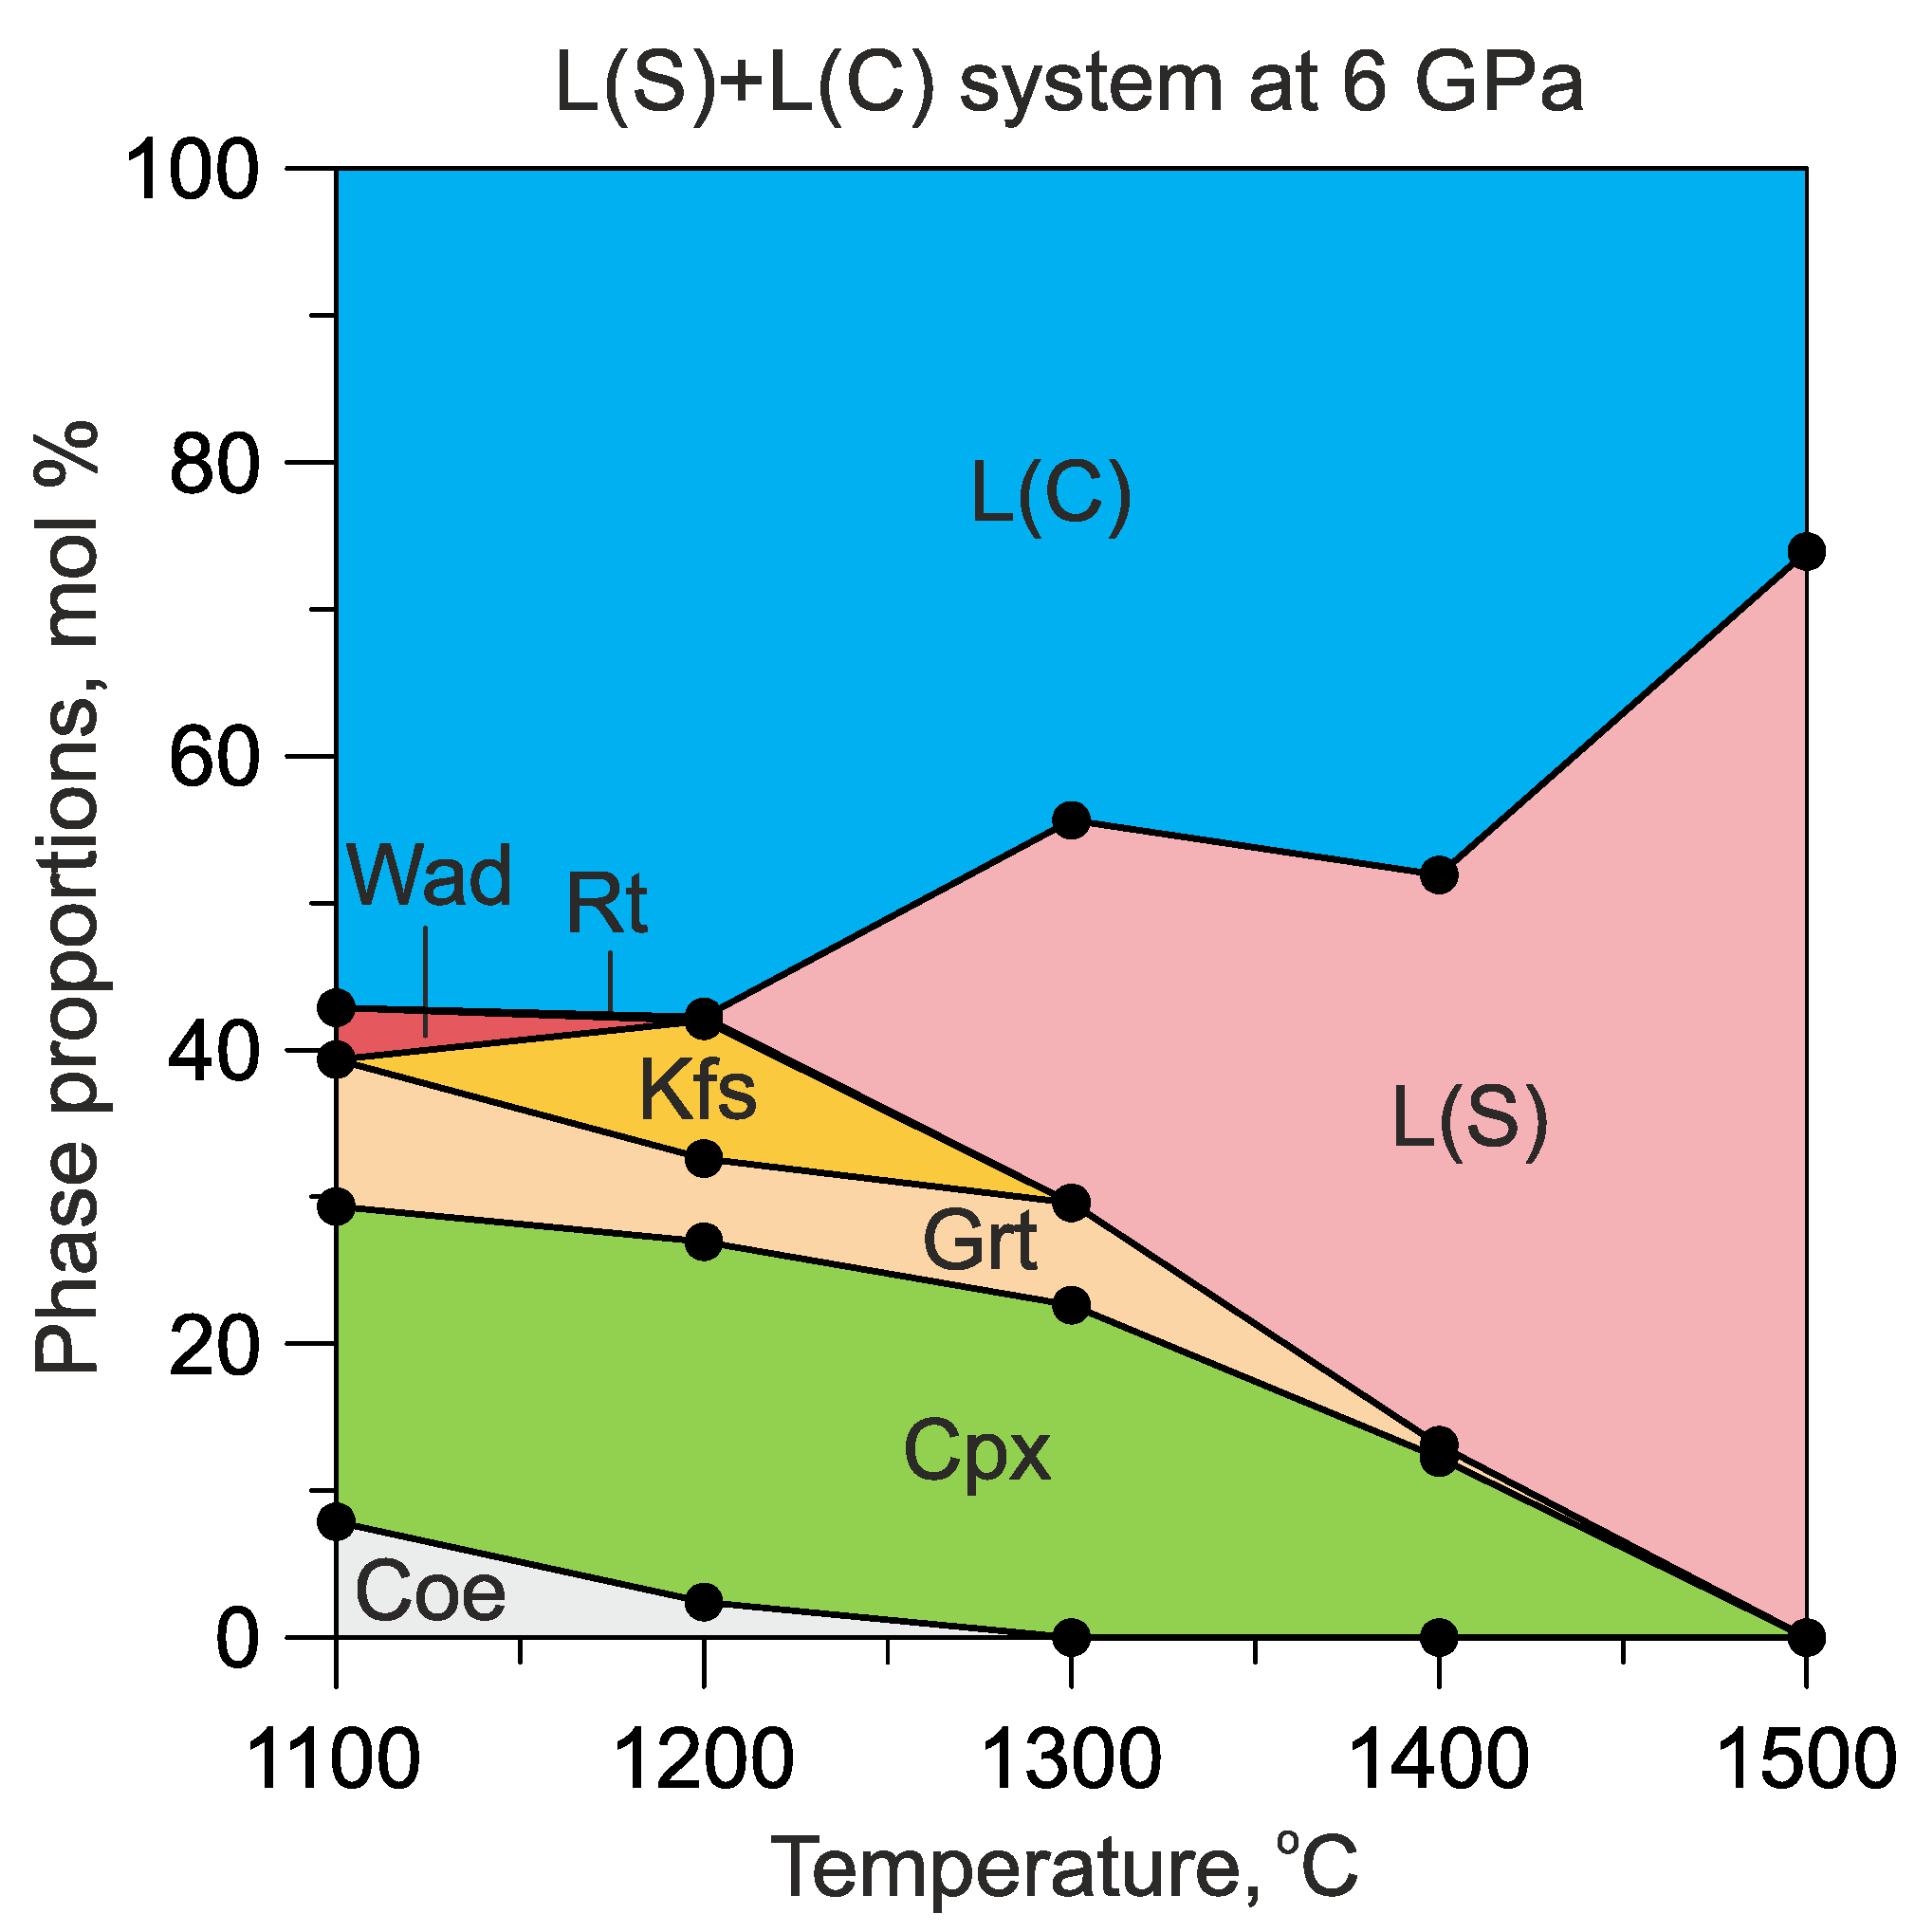
3.1.1. The System L(S) + L(C)

At 3 GPa and 1050 °C (run D328, 98 h), the sample mainly consists of Kfs (53 mol%) and melt (41 mol%) (Table 2). The melt is segregated as a separate layer adjacent to the high-temperature (HT) capsule end (Figure 2a). Kfs makes up the majority of the sample. Kfs forms isometric grains, 10–30 µm in size, with irregular roundish outlines (Figure 2b). The Kfs aggregate contains interstitial melt, whose fraction decreases toward the low-temperature (LT) side. The layer of Phl + Kfs aggregate is adjacent to the LT capsule end (Figure 2a). Phl forms isometric euhedral crystals 15–25 µm in size (Figure 2c). In addition, the sample contains Rt adjacent to the Phl + Kfs layer in the LT zone (Figure 2a, Table 2). Rt forms clusters of anhedral grains 10–20 µm in size (Figure 2c).
Figure 2. BSE of sample cross-sections in the system L(S) + L(C) at 3–4.5 GPa: (ac) 3 GPa, 1050 °C (run D328, 98 h); (df) 3 GPa, 1200 °C (run D260, 20 h); (gi) 4.5 GPa, 1200 °C (D255, 20 h). HT—high-temperature, and LT—low-temperature sample sides. The gravity vector is directed downward. See the Abbreviations section for mineral and phase symbols.
Minerals 13 00443 g002
As temperature increases to 1200 °C at 3 GPa (run D260, 20 h), Kfs completely melts to form phonolite melt with a fraction of 37 mol%, while the fraction of carbonate melt slightly decreases (from 41 to 37 mol%) (Table 2). The layer of carbonate melt is adjacent to the HT sample side (Figure 2a,d,g). Quenched silicate melt (glass) with suspended Cpx crystals appears in the central part of the sample. Cpx forms well-shaped prismatic crystals 40–50 µm in length. L(S) also contains sporadic beads of L(C) up to 50 µm in diameter (Figure 2f). In addition, a few large (50–150 µm) euhedral Phl crystals appear near the capsule walls in the middle and LT zones (Figure 2d). In the BSE images, Phl crystals are distinguished by perfect cleavage (Figure 2e).
As pressure increases to 4.5 GPa at 1200 °C (run D255, 20 h), the melt fractions change as follows: 37 → 54 mol% L(C) and 37 → 32 mol% L(S). A layer of L(C) appears as a separate pool on the HT side. The L(S) pool is located in the central part of the sample and has a dome-shaped interface with L(C) (Figure 2g). A few euhedral Grt crystals of up to 40 µm in diameter are suspended in L(S) (Figure 2g–i). In addition, silicate melt contains sporadic carbonate melt beads 20–50 µm in diameter (Figure 2g–i). Cpx crystals a few micrometers in size are concentrated in the LT region (Figure 2g,i).
The further pressure increase to 6 GPa at 1200 °C (run D210, 72 h) is accompanied by the disappearance of L(S) and the crystallization of Kfs. The fraction of L(C) increases from 54 to 57 mol% (Figure 3, Table 2). The carbonate melt fills the upper, hotter half of the sample, while the LT half of the sample consists mainly of Cpx (Figure 4d). Carbonate melt contains numerous graphite flakes (Figure 4d,e) and impregnates the overlying graphite cap to a depth of up to 150 µm (Figure 4d). Cpx forms an aggregate of euhedral short prismatic crystals 3–7 µm in size (Figure 4d,f). K-feldspar fills the interstitials between Cpx crystals and appears as separate grains with irregular outlines up to 100–200 µm in size at the Cpx-L(C) interface (Figure 4d,e). Isometric crystals of Grt and Coe are present in the Cpx aggregate, as inclusions in Kfs grains, and also as a suspension in the carbonate melt in the central part of the sample near the surface of the aggregate of crystalline phases (Figure 4d–f).
Figure 3. Calculated modes in mole fractions (Table 2 and Table S2) of the phases in the system L(S) + L(C) as a function of pressure at 1200 °C.
Minerals 13 00443 g003
Figure 4. BSE of sample cross-sections in the system L(S) + L(C) at 6 GPa: (ac) 1100 °C (run D261, 113 h); (df) 1200 °C (run D210, 72 h); (gi) 1300 °C (run D211, 64 h); (j) 1400 °C (D214, 24 h); (k,l) 1500 °C (D217, 5 h). See the Figure 1 caption for other details.
Minerals 13 00443 g004
As temperature decreases to 1100 °C at 6 GPa (run D261, 113 h), the carbonate melt fraction remains unchanged (Figure 5, Table 2), while Kfs disappears to produce Ti-wadeite with an approximate composition of K2TiSi3O9 similar to that synthesized previously at 2 GPa and 1200–1400 °C [37]. A phase with an apparent formula K(Si, Ti)9O20 was also obtained from Kfs-Phl lamproite in experiments at 6–7 GPa and 1000–1400 °C [38] and was detected among groundmass minerals in lamproites from Middle Table Mountain, Leucite Hills, Wyoming [39]. In our experiment, Ti-wadeite coexists with Cpx, Grt, and Coe, which form an aggregate of euhedral to subhedral crystals a few micrometers in diameter (Figure 4a–c).
Figure 5. Calculated modes in mole fractions (Table 2) of the phases in the system L(S) + L(C) as a function of temperature at 6 GPa.
Minerals 13 00443 g005
At 1300 °C and 6 GPa (run D211, 64 h), the upper, hotter half of the capsule is filled with carbonate melt. The melt contains numerous graphite flakes (Figure 4g). The melt also infiltrated the overlying graphite cap to a depth of 200 µm (Figure 4g). An aggregate of Cpx crystals with a few Grt crystals adjoins the LT part of the sample (Figure 4g,h). The crystals are isometric in shape, and their size varies from 3 to 70 µm (Figure 4g–i). Quenched silicate melt (glass) appears as a separate layer at the Cpx-L(C) interface (Figure 4g). L(S) contains sporadic beads of L(C) up to 35 µm in diameter (Figure 4i).
As the temperature increases to 1400 °C (run D214, 24 h) and then to 1500 °C, the fraction of L(C) decreases, while the fraction of L(S) increases at the expense of Cpx and Grt (Figure 5; Table 2). At 1400 °C, the sample consists of a layer of L(C) adjacent to the HT capsule end, a layer of L(S) in the middle, and prismatic Cpx crystals up to 150 µm in length at the LT sample side. In addition, euhedral Grt crystals appear as a minor phase in the LT region (Figure 4j).
At 1500 °C (run D217, 5 h), the sample undergoes complete melting and consists of the products of quenching two melts: a carbonate melt stuffed with graphite flakes and a silicate melt forming 100 µm beads in a carbonate melt (Figure 4k). The quench products of silicate melt are glass with numerous carbonate beads of 1–7 µm in size or less (Figure 4l).

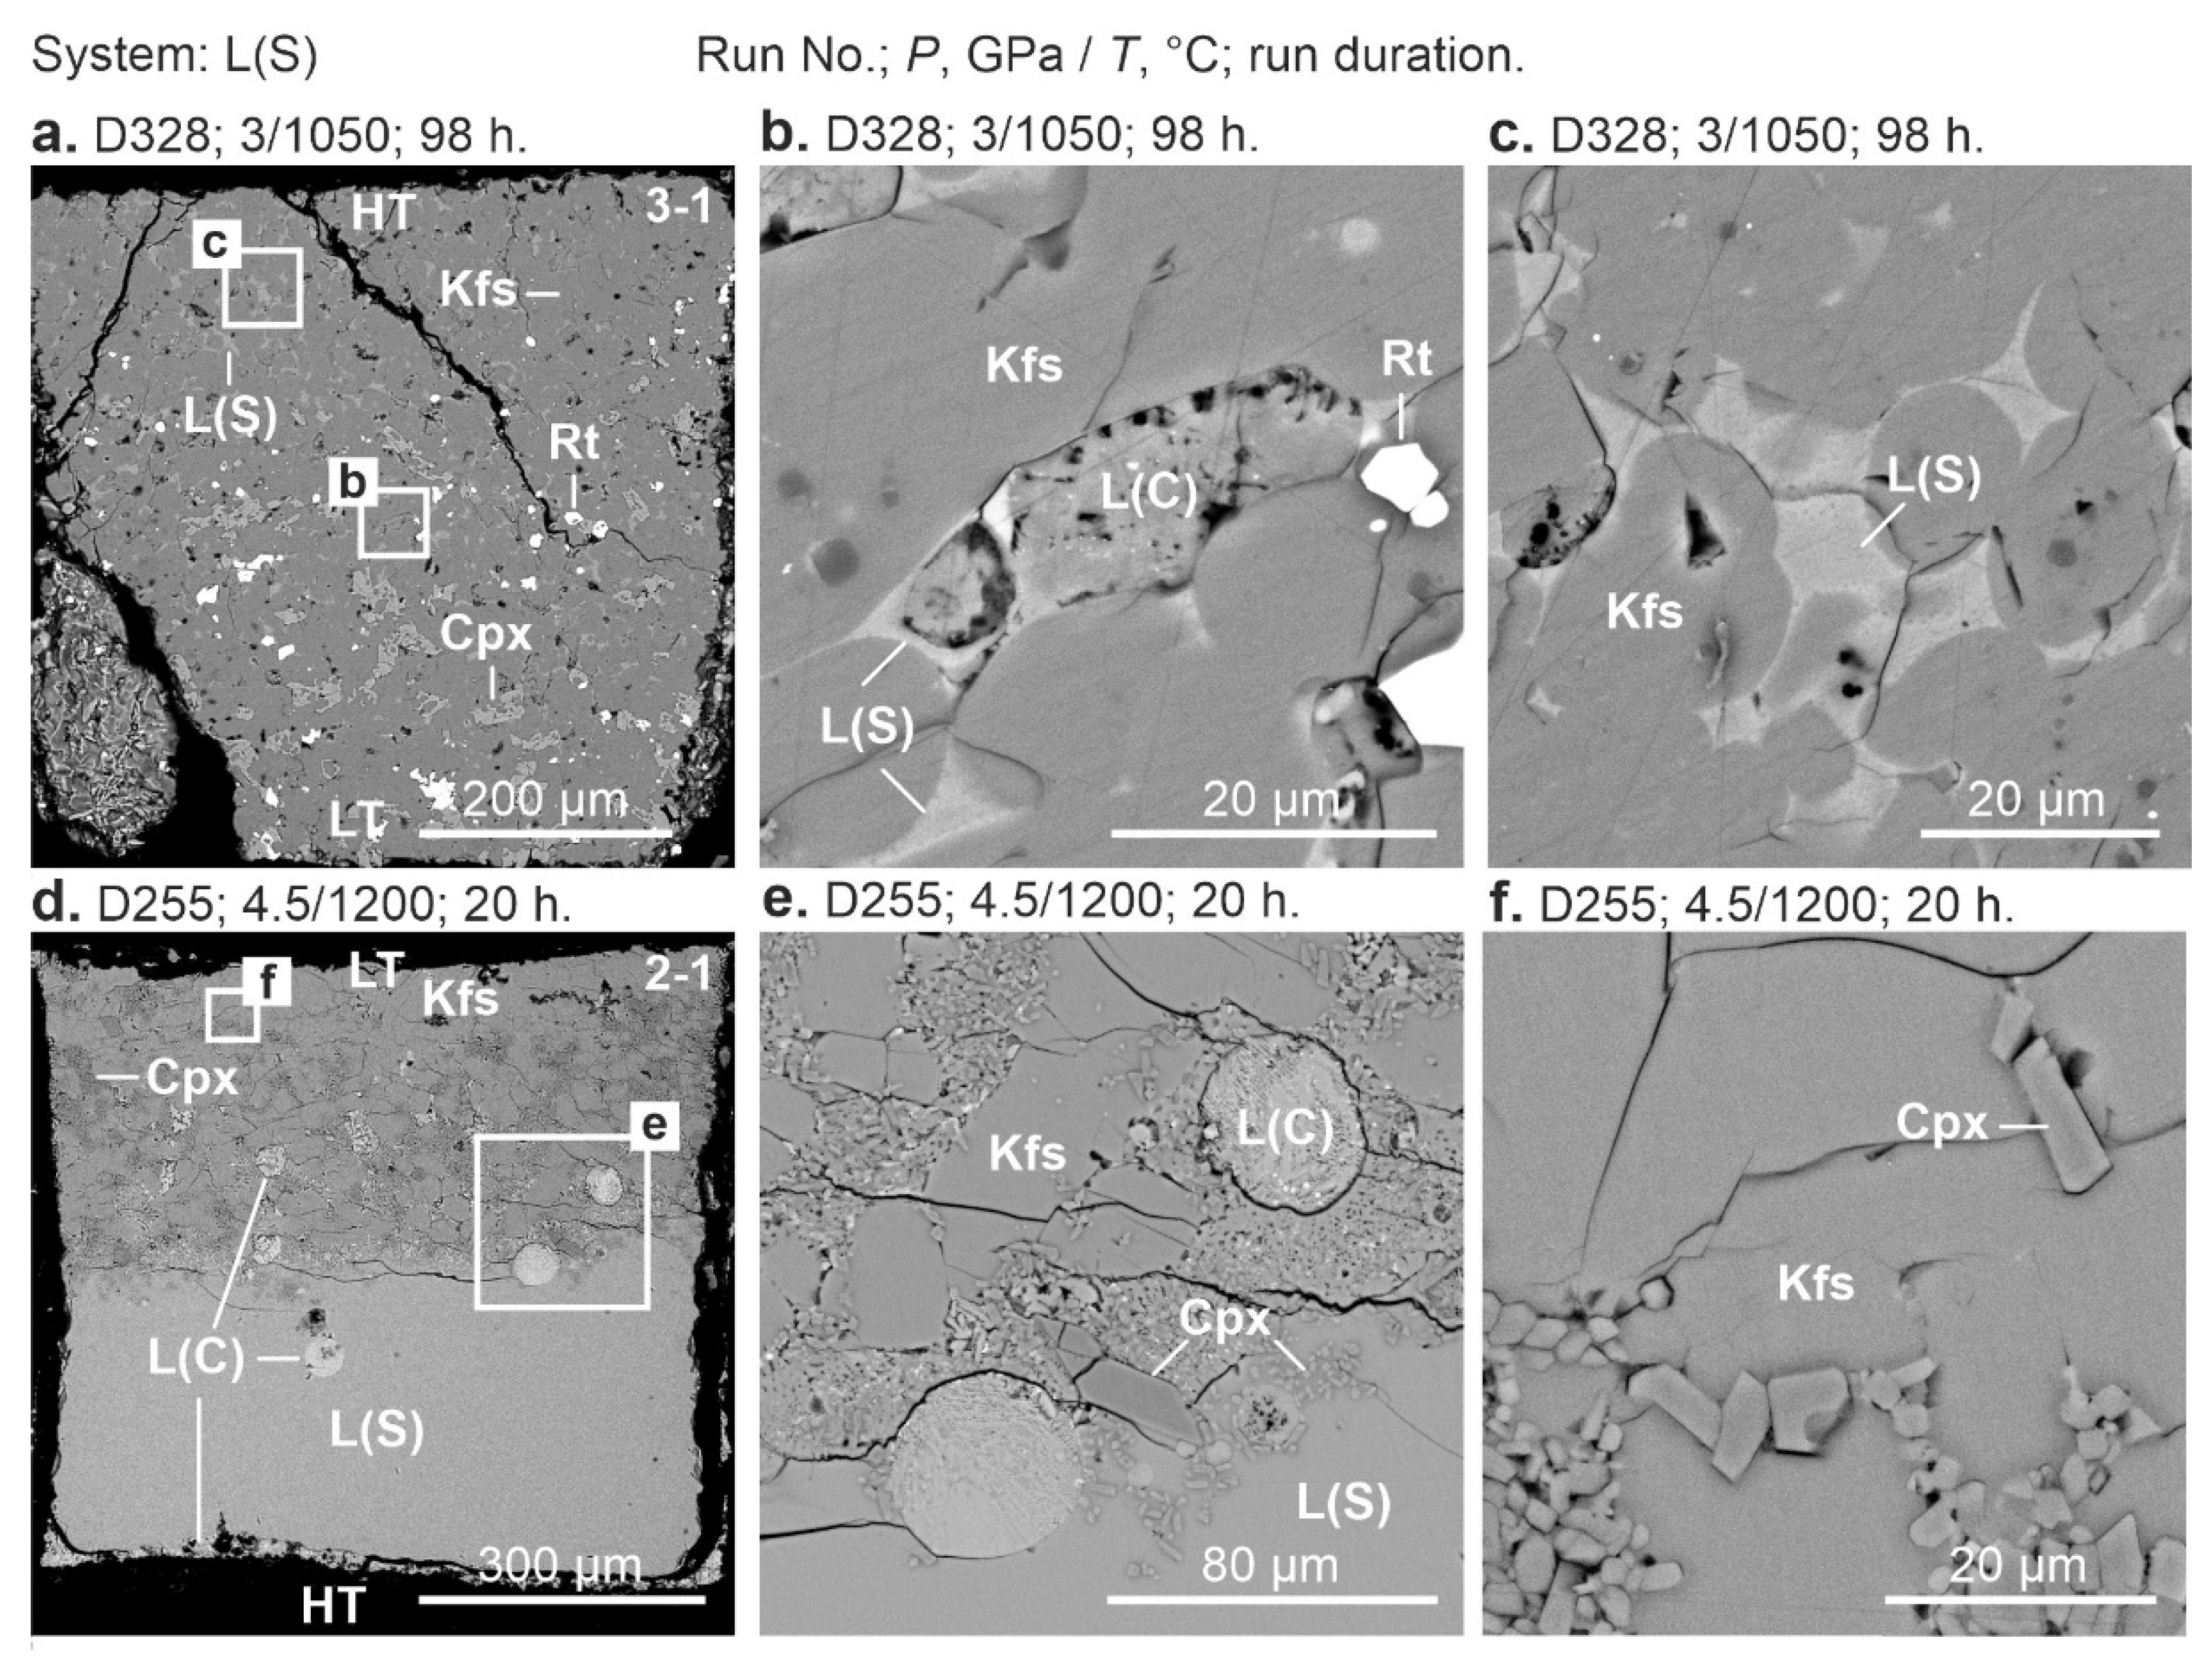
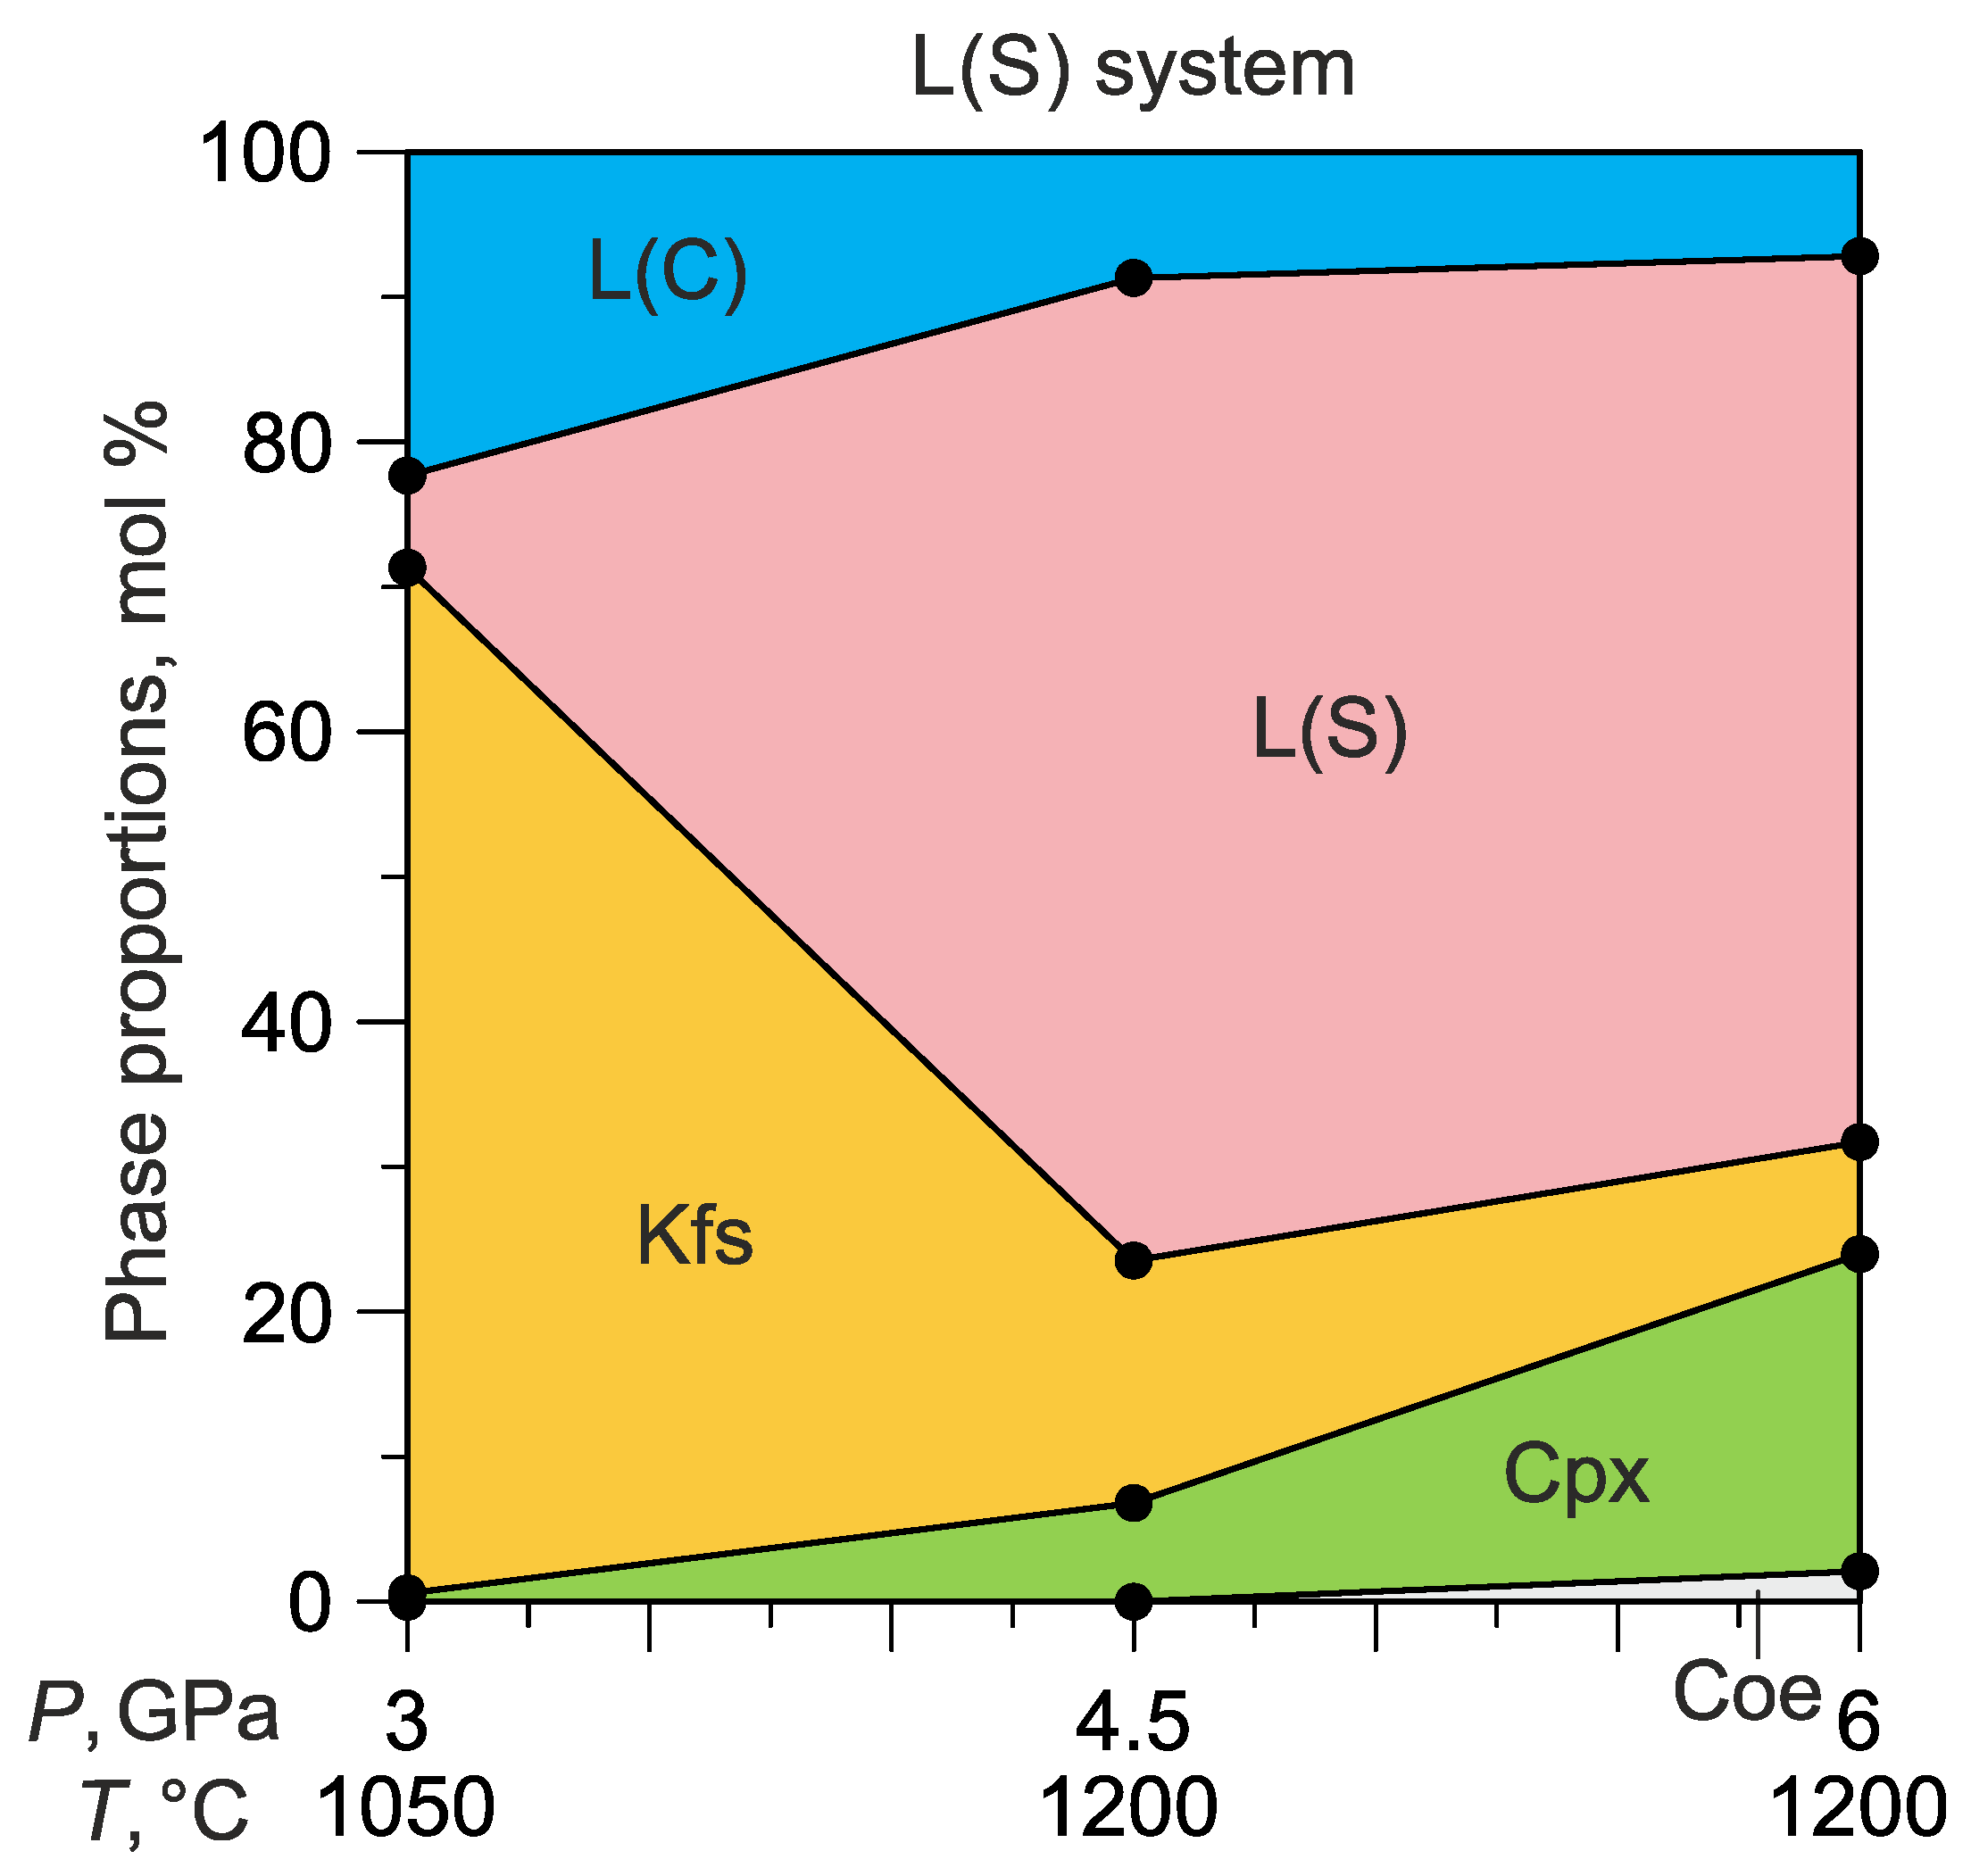
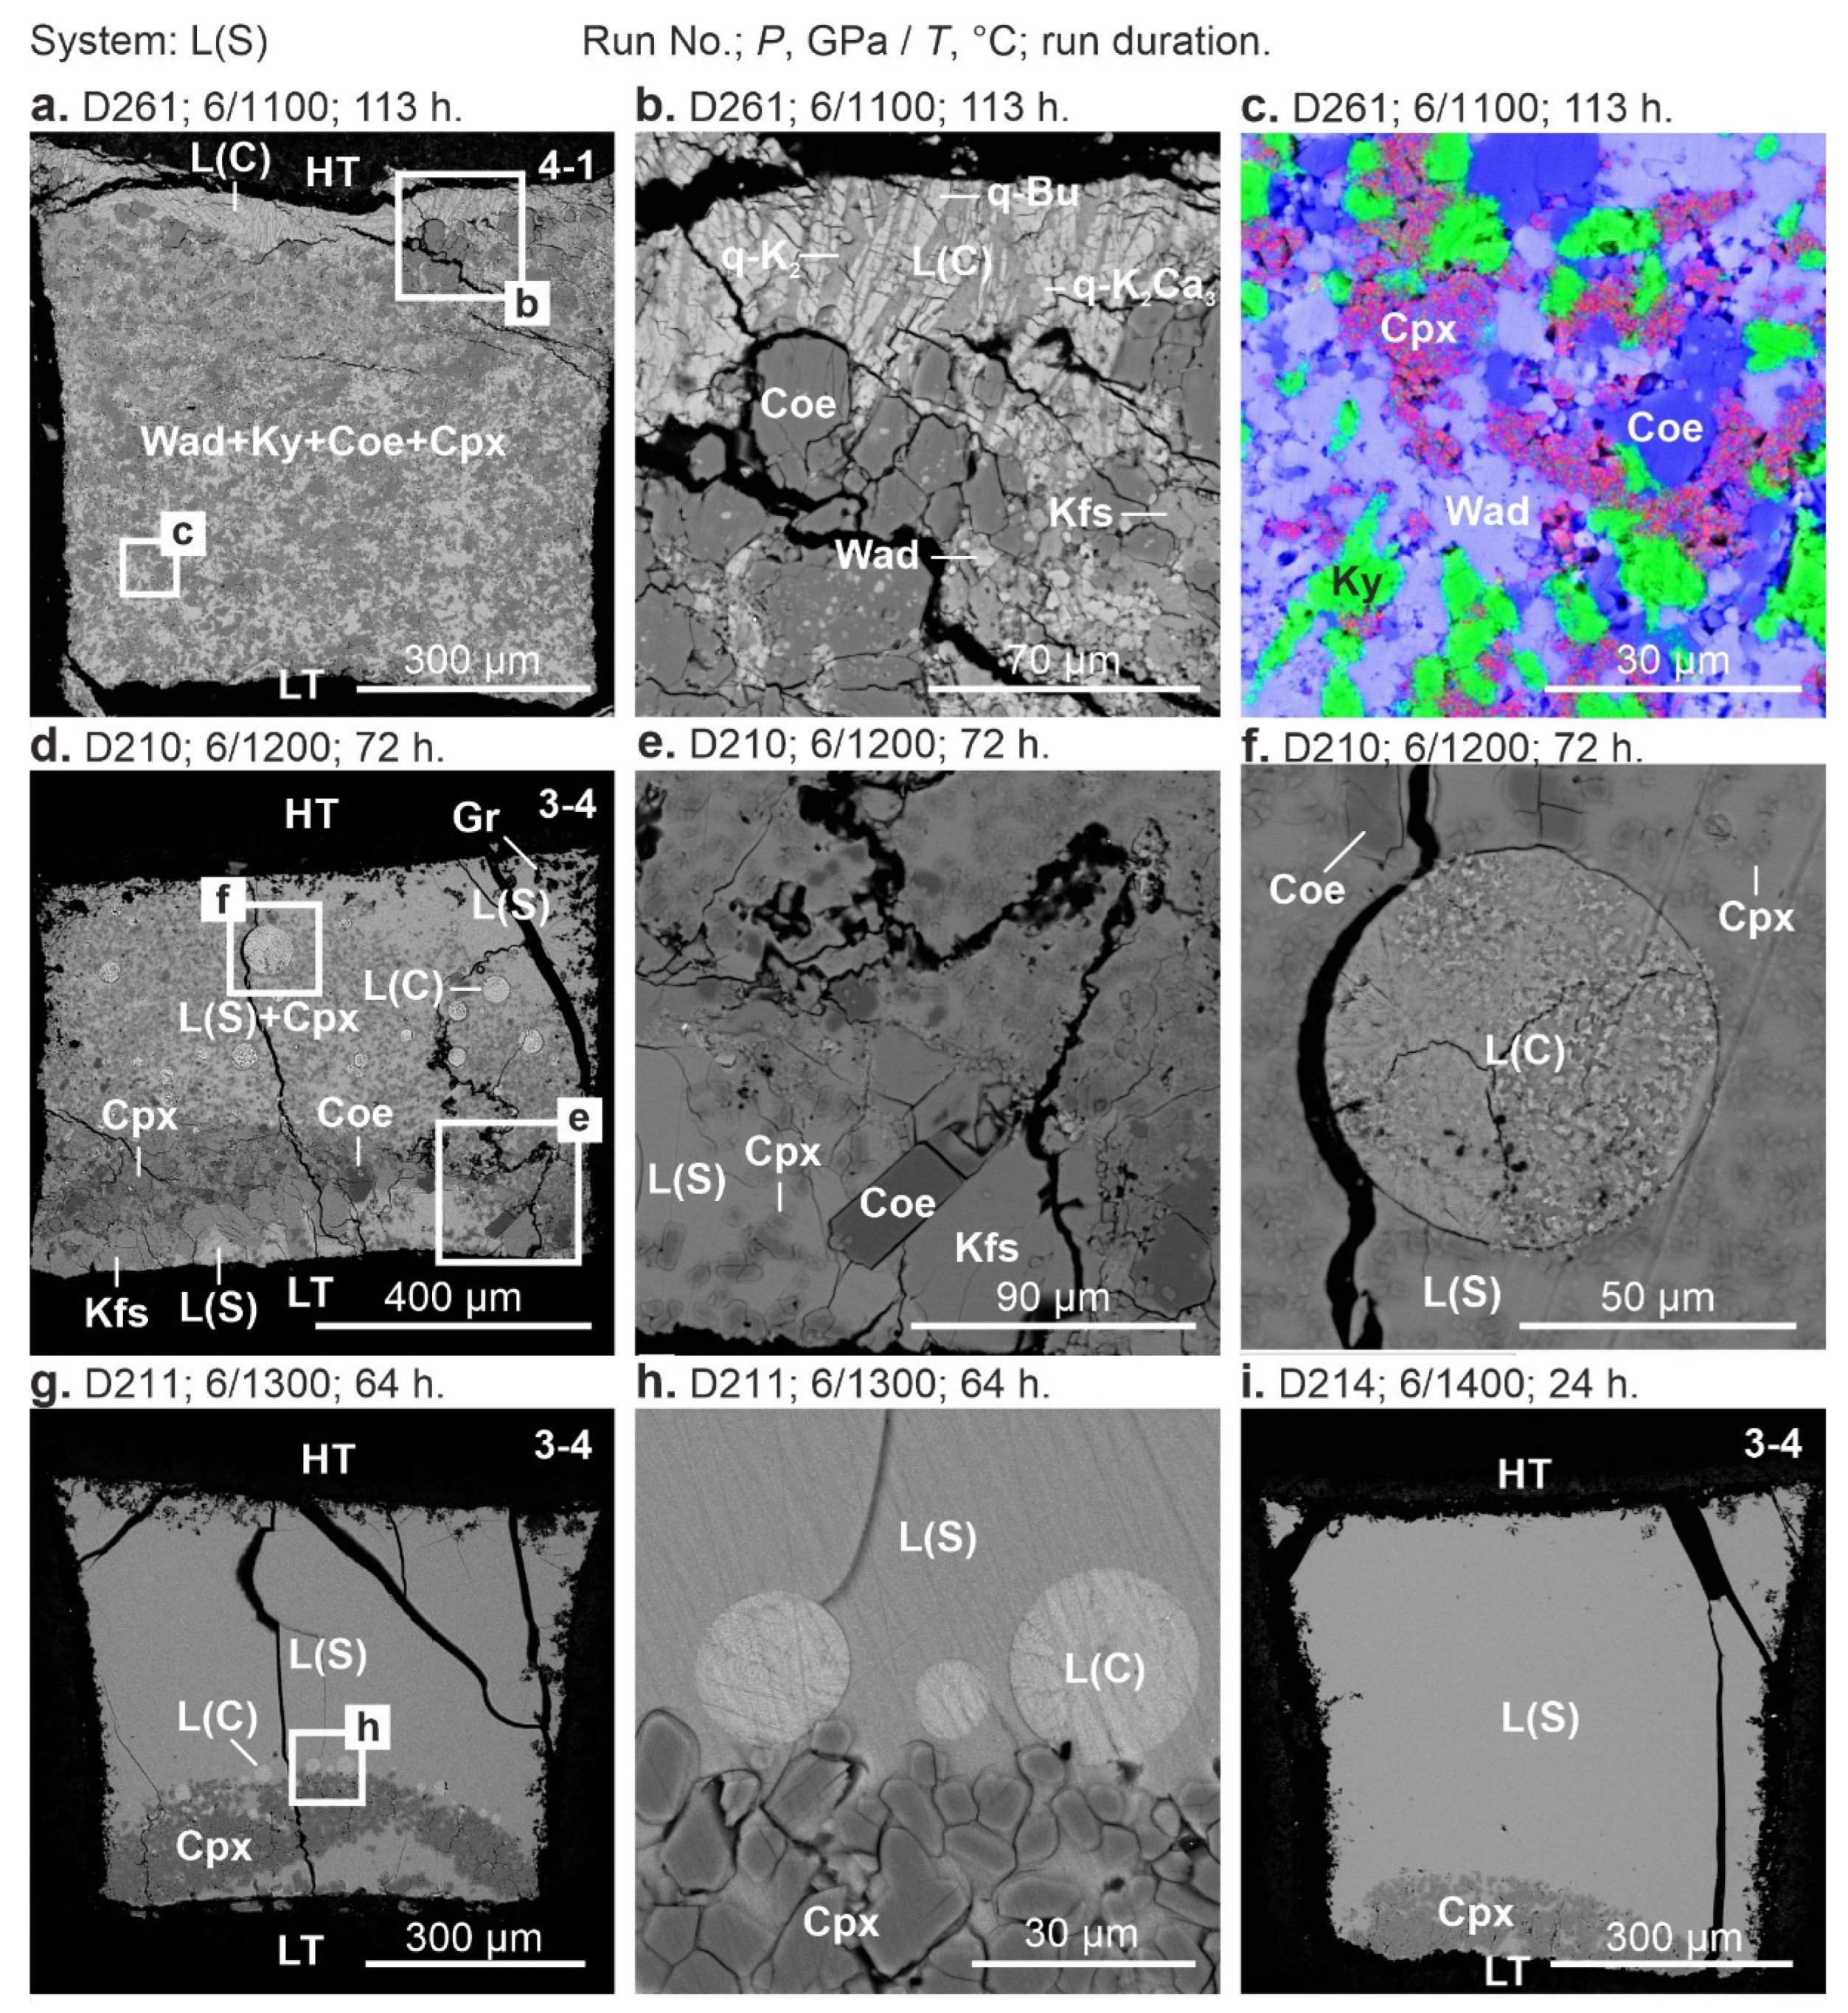
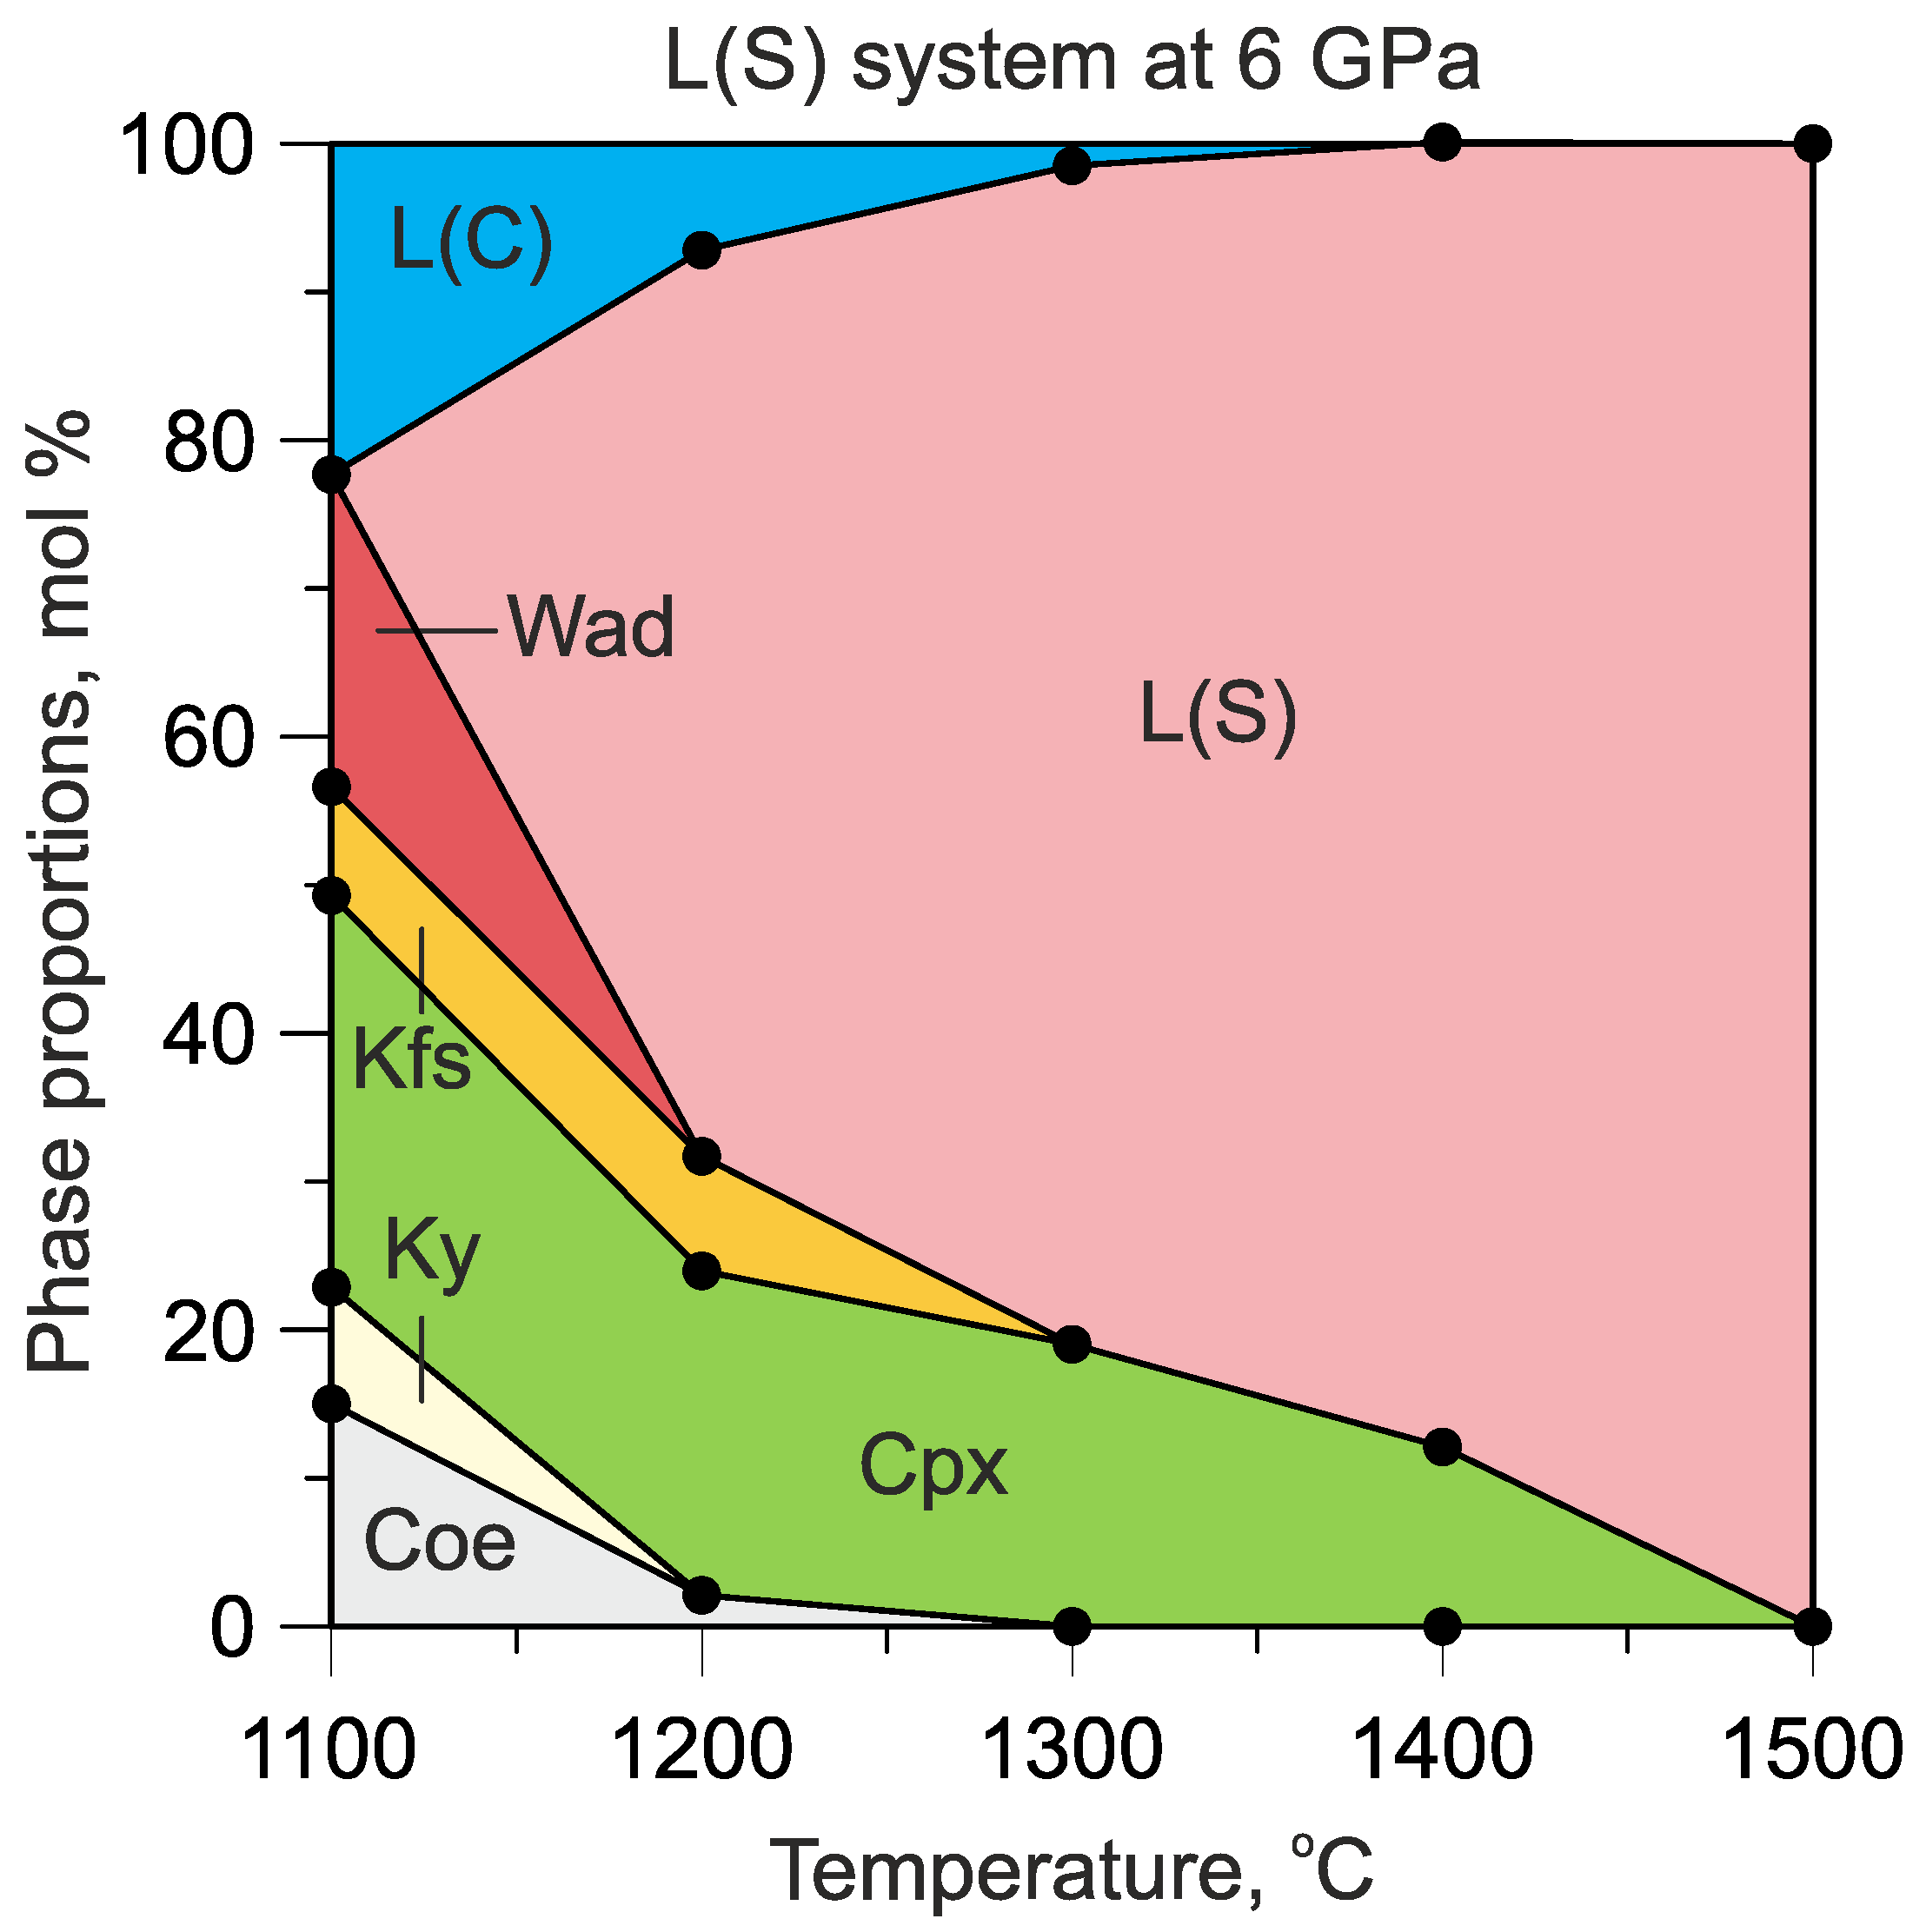
3.1.2. The System L(S)

At 3 GPa and 1050 °C (run D328, 98 h), the sample mainly consists of Kfs (71 mol%), L(C) (22 mol%), and L(S) (5 mol%) (Table 3 and Table S5). One-third of the sample from the HT side consists of Kfs and interstitial silicate melt (glass) (Figure 6a,c). L(S) appears in triple junctions of Kfs grains (Figure 6b,c). The rest of the sample consists of Kfs, Cpx, rutile, interstitial carbonate, and silicate melts (Figure 6a,b). Cpx forms short, prismatic hopper crystals up to 40 µm in size with large interior hollows filled with Kfs (Figure 6a).
Figure 6. BSE of sample cross-sections in the system L(S) at 3–4.5 GPa: (ac) 3 GPa, 1050 °C (run D328, 98 h); (df) 4.5 GPa, 1200 °C (D255, 20 h). See the Figure 1 caption for other details.
Minerals 13 00443 g006
As pressure and temperature increase to 4.5 GPa and 1200 °C (run D255, 20 h), the fraction of L(S) drastically increases from 5 to 68 mol% at the expense of Kfs, whose fraction decreases from 71 to 17 mol% (Figure 7 and Table 3). Such a significant increase in the fraction of L(S) containing CO32− (see further subsections) is accompanied by a decrease in the fraction of L(C) from 22 to 9 mol% (Figure 7). The quenched-silicate melt forms a homogeneous glassy mass in the lower half of the sample, located in the HT zone (Figure 6d). An aggregate of Kfs + Cpx fills the upper half of the sample, located in the HT zone. The carbonate melt forms a thin layer adjacent to the bottom of the graphite capsule in the HT zone (Figure 6d). The carbonate melt is also present in the form of beads with a diameter of 30–50 µm suspended in L(S) and embedded in the crystalline aggregate in the LT zone. Cpx appears as clusters of euhedral short-prismatic crystals 1–10 µm in size and individual 20–30 µm crystals embedded in Kfs. The latter forms cracked grains 20–70 µm in size (Figure 6d–f).
Table 3. Summary of run conditions and calculated phase proportions (mol%) in the system L(S).
Run#P, GPaT, °Ct, h#Run Products
L(C)L(S)KfsWadCoeKyCpxRtSum r2
D3283.01050983-122571110.04
D2554.51200201-1, 2-19681770.05
D2616.011001134-2, 4-422721158260.01
D2106.01200723-486182220.13
D2116.01300642-2180190.51
D2146.01400253-289120.64
D2176.0150053-4100
Notes: same as in Table 2. The mass balance calculations in both mol% and wt% are given in Tables S5–S7.
Figure 7. Calculated modes in mole fractions (Table 3) of the phases in the system L(S) as a function of pressure.
Minerals 13 00443 g007
An increase in pressure to 6 GPa at 1200 °C (run D210, 72 h) is not accompanied by a fundamental change in the phase composition and ratio (Figure 7, Table 3). The sample consists of 61 mol% silicate glass located in the upper HT zone (Figure 8d). At the interface with the capsule walls, L(S) contains graphite flakes (Figure 8d). Most of the melt pool is clogged with 1–7 µm euhedral short-prismatic Cpx crystals (Figure 8d–f). Nevertheless, the Cpx-free regions are present at the HT and LT edges of the capsule (Figure 8d). The identity of the composition of silicate glass from areas without crystallites and from areas with crystallites indicates the equilibrium, rather than quenching, nature of the latter, and that the composition of the silicate glass corresponds to the composition of L(S). In addition to Cpx, silicate glass contains beads of quenched-carbonate melt whose size varies from 10 to 70 µm (Figure 8d,f). L(C) forms a mat of acicular carbonate crystals on quenching. In the LT zone of the sample, in addition to Cpx and L(S), there are also Kfs crystals adjoining the capsule bottom and short-prismatic Coe crystals. Kfs forms cracked grains with irregular outlines, while Coe appears as well-shaped short prismatic crystals 10–50 µm in size (Figure 8e).
As the temperature decreases to 1100 °C at 6 GPa (run D261, 113 h), L(S) disappears, whereas Ti-wadeite and Ky appear in addition to Kfs, Cpx, and Coe (Figure 9; Table 3). The carbonate melt is segregated as a 50 µm layer adjacent to the upper HT capsule end, whereas most of the sample is represented by a homogeneous aggregate of Cpx + Wad + Coe + Ky + Kfs (Figure 8a). Cpx, Wad, and Ky form clusters consisting of 1–3 µm isometric grains, while Coe appears as isometric grains of up to 7 µm in size with irregular outlines (Figure 8c). At the interface with L(C), Coe grows to 10–30 µm short prismatic crystals (Figure 8b). L(C) is quenched into a mat of fibrous crystals of K2CO3, K2Ca(CO3)2, bütschliite, K2Ca3(CO3)4, and Mg-calcite (Figure 8b).
Figure 8. BSE of sample cross-sections in the system L(S) at 6 GPa: (ac) 1100 °C (run D261, 113 h); (df) 1200 °C (run D210, 72 h); 1300 °C (run D211, 64 h); (gh) 1300 °C (D211, 64 h); (i) 1400 °C (D214, 25 h). The color image (c) was taken in element mapping mode. See the Figure 1 caption for other details.
Minerals 13 00443 g008
At 1300 °C and 6 GPa (run D211, 64 h), Kfs and Coe disappear, and only Cpx remains among the solid phases. The L(S) fraction increases from 61 to 80 mol%, while the L(C) fraction decreases from 8 to 1 mol% (Figure 9; Table 3). L(S) is quenched into a homogeneous glass containing graphite flakes at the interface with the capsule walls (Figure 8g). Beads of carbonate melt 10–25 µm in size are located along the Cpx-L(S) interface (Figure 8g,h). Cpx forms euhedral short prismatic crystals 5–15 µm in size (Figure 8h).
As the temperature increases to 1400 °C at 6 GPa (run D214, 24 h), L(C) disappears, the Cpx fraction decreases, and the L(S) fraction increases (Figure 8i and Figure 9). At 1500 °C and 6 GPa (run D217, 5 h), the sample melts completely and quenches to a homogeneous glass (Table 3).
Figure 9. Calculated modes in mole fractions (Table 3) of the phases in the system L(S) as a function of temperature at 6 GPa.
Minerals 13 00443 g009

3.2. Phase Compositions

In this section, we summarize the compositions of the minerals and melts observed in our experiments in the systems L(S) + L(C) and L(S) at 3–6 GPa.

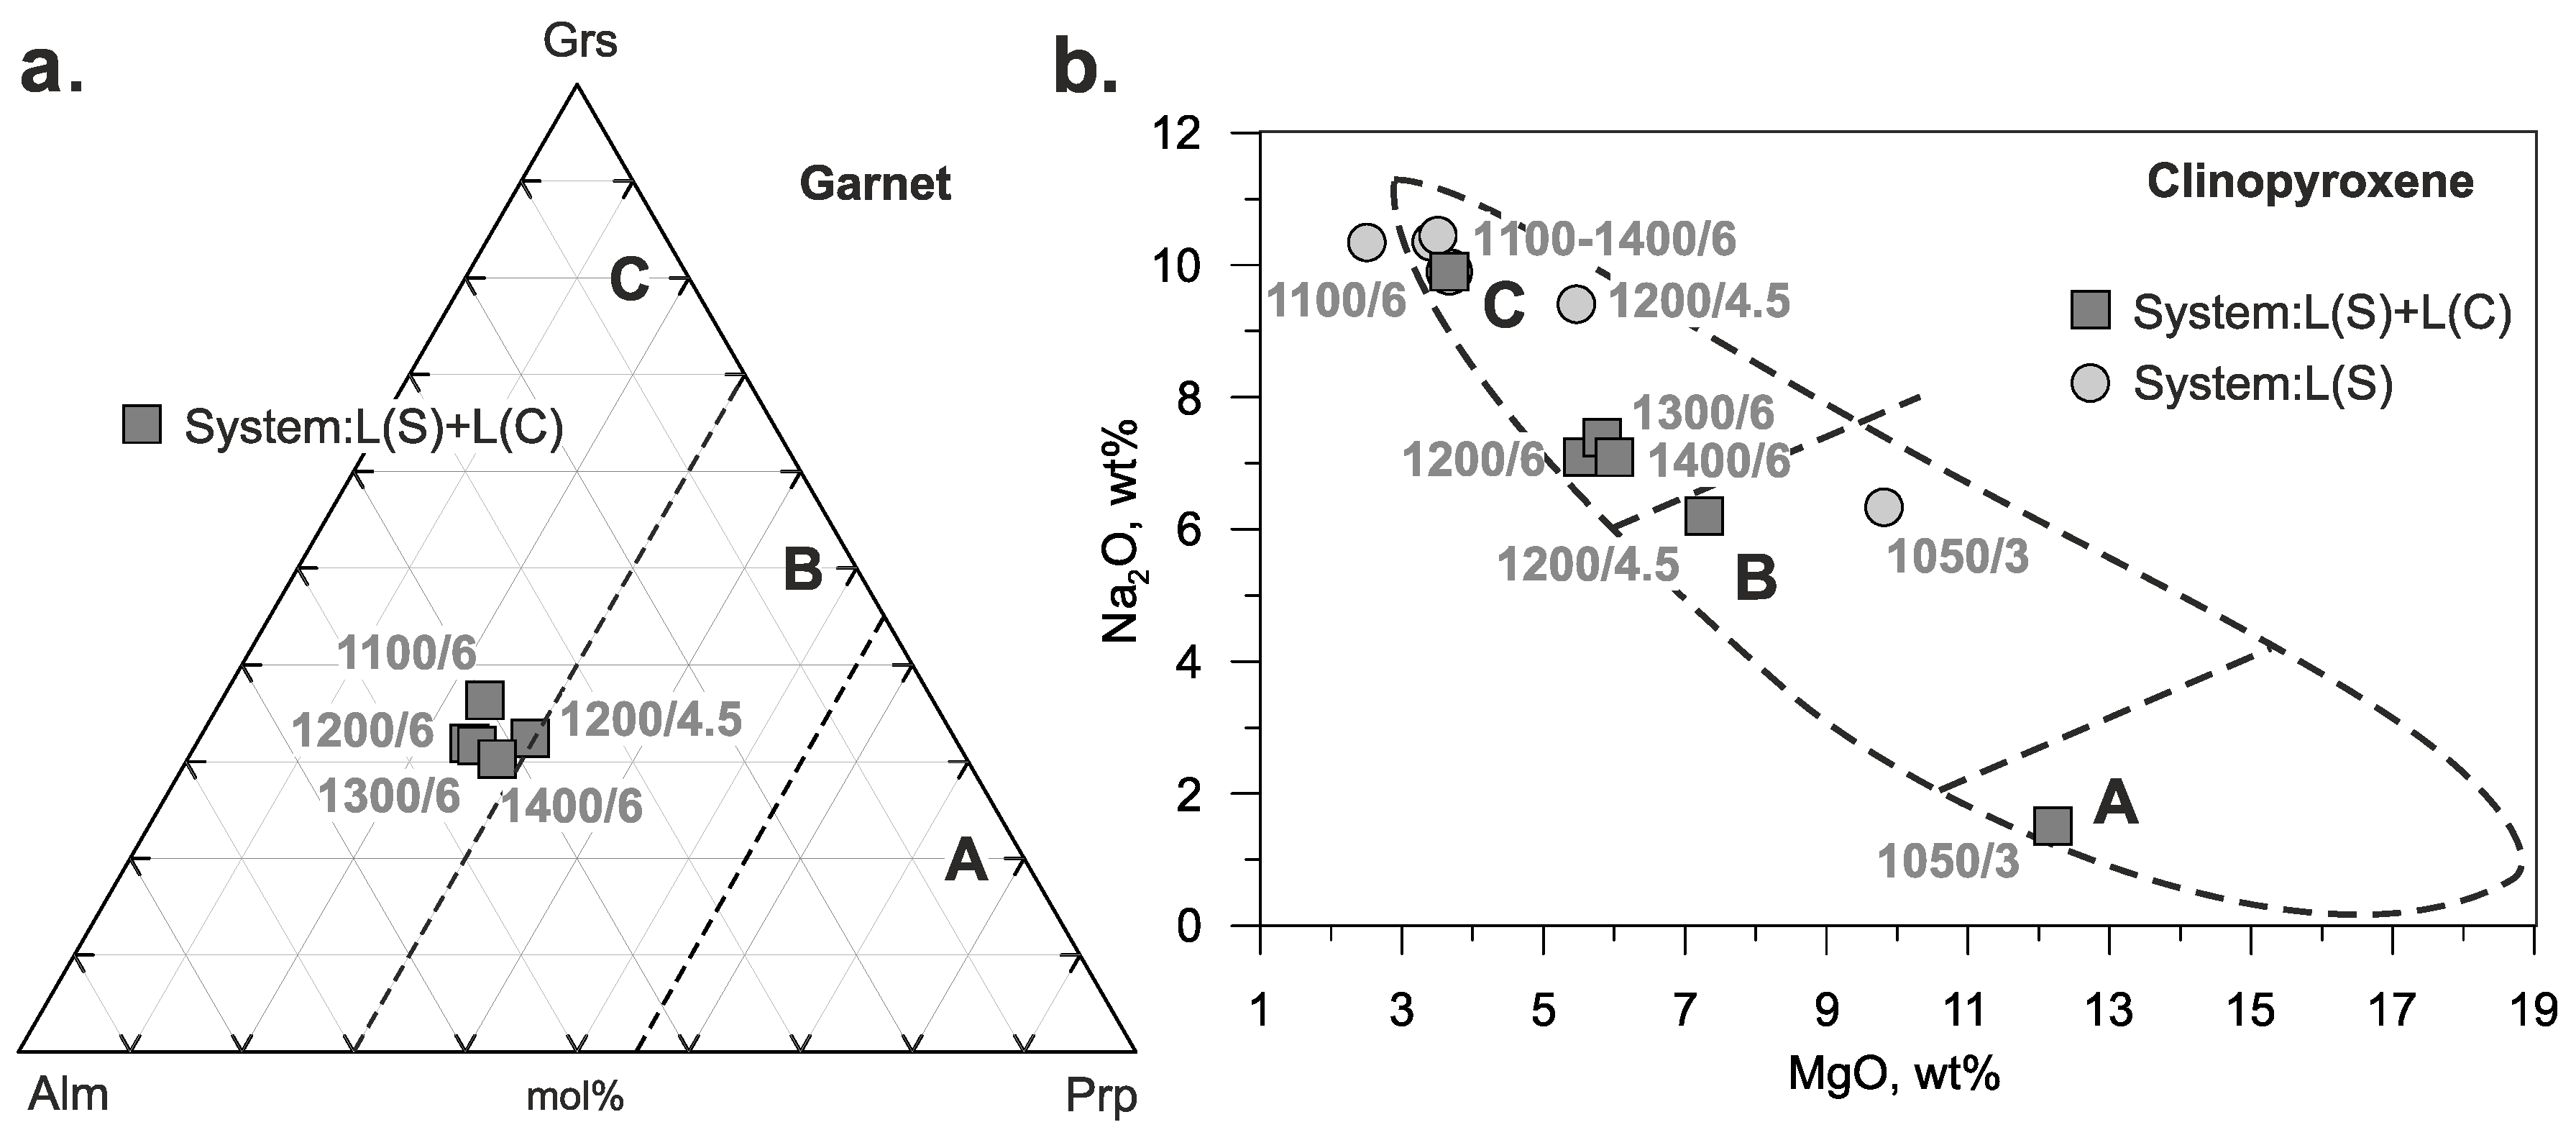
3.2.1. Clinopyroxene

Cpx compositions are given in Table 4 and plotted in Figure 10. At 6 GPa and 1100–1400 °C, Mg# varies a little from 72 to 75 in the L(S) + L(C) system and increases with temperature from 72 to 81 in the L(S) system (Table 4 and Table S8). Ca# varies from 49 to 52 in both systems (Table S8), where Ca# = Ca/(Ca + Mg + Fe) × 100 mol%. Cpx contains 7–10 wt% Na2O, 0.3–1.3 wt% K2O, and 0.2–0.6 wt% TiO2 (Table 4). With the decreasing temperature at 6 GPa, K2O contents increase from 0.3–0.5 to 1.1–1.3 wt% but are then reduced to 0.3 wt% as pressure decreases to 3 GPa (Table 4). With decreasing pressure, Na2O and Al2O3 contents decrease steadily from 10 to 19–21 wt% at 6 GPa to 2–6 and 4–8 wt% at 3 GPa, respectively (Figure 10, Table 4). As the pressure decreases to 3 GPa, TiO2 concentrations increase to 2 and 6 wt% at 1200 and 1050 °C, respectively (Figure 10, Table 4). At 1050 °C and 3 GPa, Cpx contains (in mol%): 4.1 TiO2, 2.3 Al2O3, and 6.0 Na2O (Table S8). These observations suggest coupled substitution Na+Ti3+ → Ca2+Mg2+, which has been investigated previously (see [40] and references therein). At 6 GPa and 1100–1400 °C, the compositions of Cpx in both systems correspond to the range of Group C eclogites according to the classification in [41] (Figure 11b).
Table 4. Composition of clinopyroxene.
Conditionswt%, Normalized to 100%mol%
RunSystemP, GPaT, °CSiO2TiO2Al2O3FeOMgOCaONa2OK2OMg#JdNTS
D260L(S) + L(C)3120049.71.77.75.912.221.11.50.37916
D255L(S) + L(C)4.5120053.30.914.14.77.312.96.20.673284
D261L(S) + L(C)6110057.30.718.92.23.76.79.90.675563
D210L(S) + L(C)6120055.80.715.43.85.610.67.11.172393
D211L(S) + L(C)6130055.40.415.93.85.810.97.40.573402
D214L(S) + L(C)6140054.30.516.43.76.011.57.10.574382
D328L(S)3105056.25.53.96.29.811.76.30.374918
D255L(S)4.5120056.71.315.82.75.58.09.40.679435
D261L(S)6110058.10.320.71.72.55.110.31.372661
D210L(S)6120057.30.718.92.23.76.79.90.675563
D211L(S)6130057.60.519.81.73.46.210.30.578602
D214L(S)6140057.20.520.21.43.56.510.40.381602
Notes: Mg# = Mg/(Mg + Fe) × 100 mol%; Jd—NaAlSi2O6 content in Cpx; NTS—NaTiSi2O6 content in Cpx. The recalculation of the composition of clinopyroxene into components is given in Supplementary Table S8. Standard deviations are given in Supplementary Tables S1 and S5.
Figure 10. Compositions of clinopyroxene versus temperature. (a) TiO2, (b) Al2O3, (c) FeO, (d) MgO, (e) CaO, (f) Na2O. FeO* = total Fe as Fe2+.
Minerals 13 00443 g010
Figure 11. Compositions of Grt (a) and clinopyroxene (b) form the present experiments. (a) Ca-Mg-Fe diagram. Group A, B, and C according to the classification of Coleman et al. [42]. (b) Na2O vs. MgO in clinopyroxenes. Group A, Group B, and Group C according to the classification of Taylor and Neal [41].
Minerals 13 00443 g011

3.2.2. Garnet

Grt was formed only in the L(S) + L(C) system at 6 GPa in the range of 1100–1400 °C and 4.5 GPa at 1200 °C (Figure 3 and Figure 5, Table 2). Compositions of Grt fall in the range Prp24–30Alm30-36Grs38–44 (Table 5 and Table S8), which correspond to Group C eclogites according to the classification of Coleman et al. [42] (Figure 11a). At 1300, 1400 °C, and 6 GPa, Grt contains 1.4 wt% TiO2. As temperature decreases to 1100 °C, TiO2 content increases to 2.1 wt%, while as pressure decreases from 6 to 4.5 GPa at 1200 °C, that varies very little from 1.7 to 1.8 wt% (Table 5 and Table S8).
Table 5. Composition of garnet in the system L(S) + L(C).
Conditionswt%, Normalized to 100%mol%
RunP, GPaT, °CSiO2TiO2Al2O3FeOMgOCaONa2OPrpAlmGrs
D2554.5120039.41.821.015.47.914.10.4303238
D2616110039.22.121.514.76.315.70.5243244
D2106120040.11.720.416.76.114.40.6243640
D2116130039.31.421.115.16.716.10.3253243
D2146140039.51.421.114.57.515.70.3283042
Notes: standard deviations are given in Supplementary Tables S1 and S5.

3.2.3. Other Minerals

Rutile was detected at 3/1050 and 6/1200 GPa/°C. EDS analysis of Rt indicates the presence of 0.2–0.9 wt% SiO2, 0.2–1.0 wt% Al2O3, and 0.7–1.0 wt% FeO (Table 2 and Table 4). Two samples synthesized in the L(S) + L(C) system at 3 GPa include phlogopite as a minor phase. Phl contains 9 and 11 wt% TiO2 at 1050 and 1200 °C, respectively (Table S8). In both systems, the samples recovered from the experiment at 6 GPa and 1100 °C contain Ti-wadeite with an approximate composition of K2TiSi3O9 (Table S8). Among the run products, there are also crystalline phases with a concentration of impurities, if any, below the detection limit. The composition of these phases is close to the ideal stoichiometry of Coe, Ky, and Kfs.

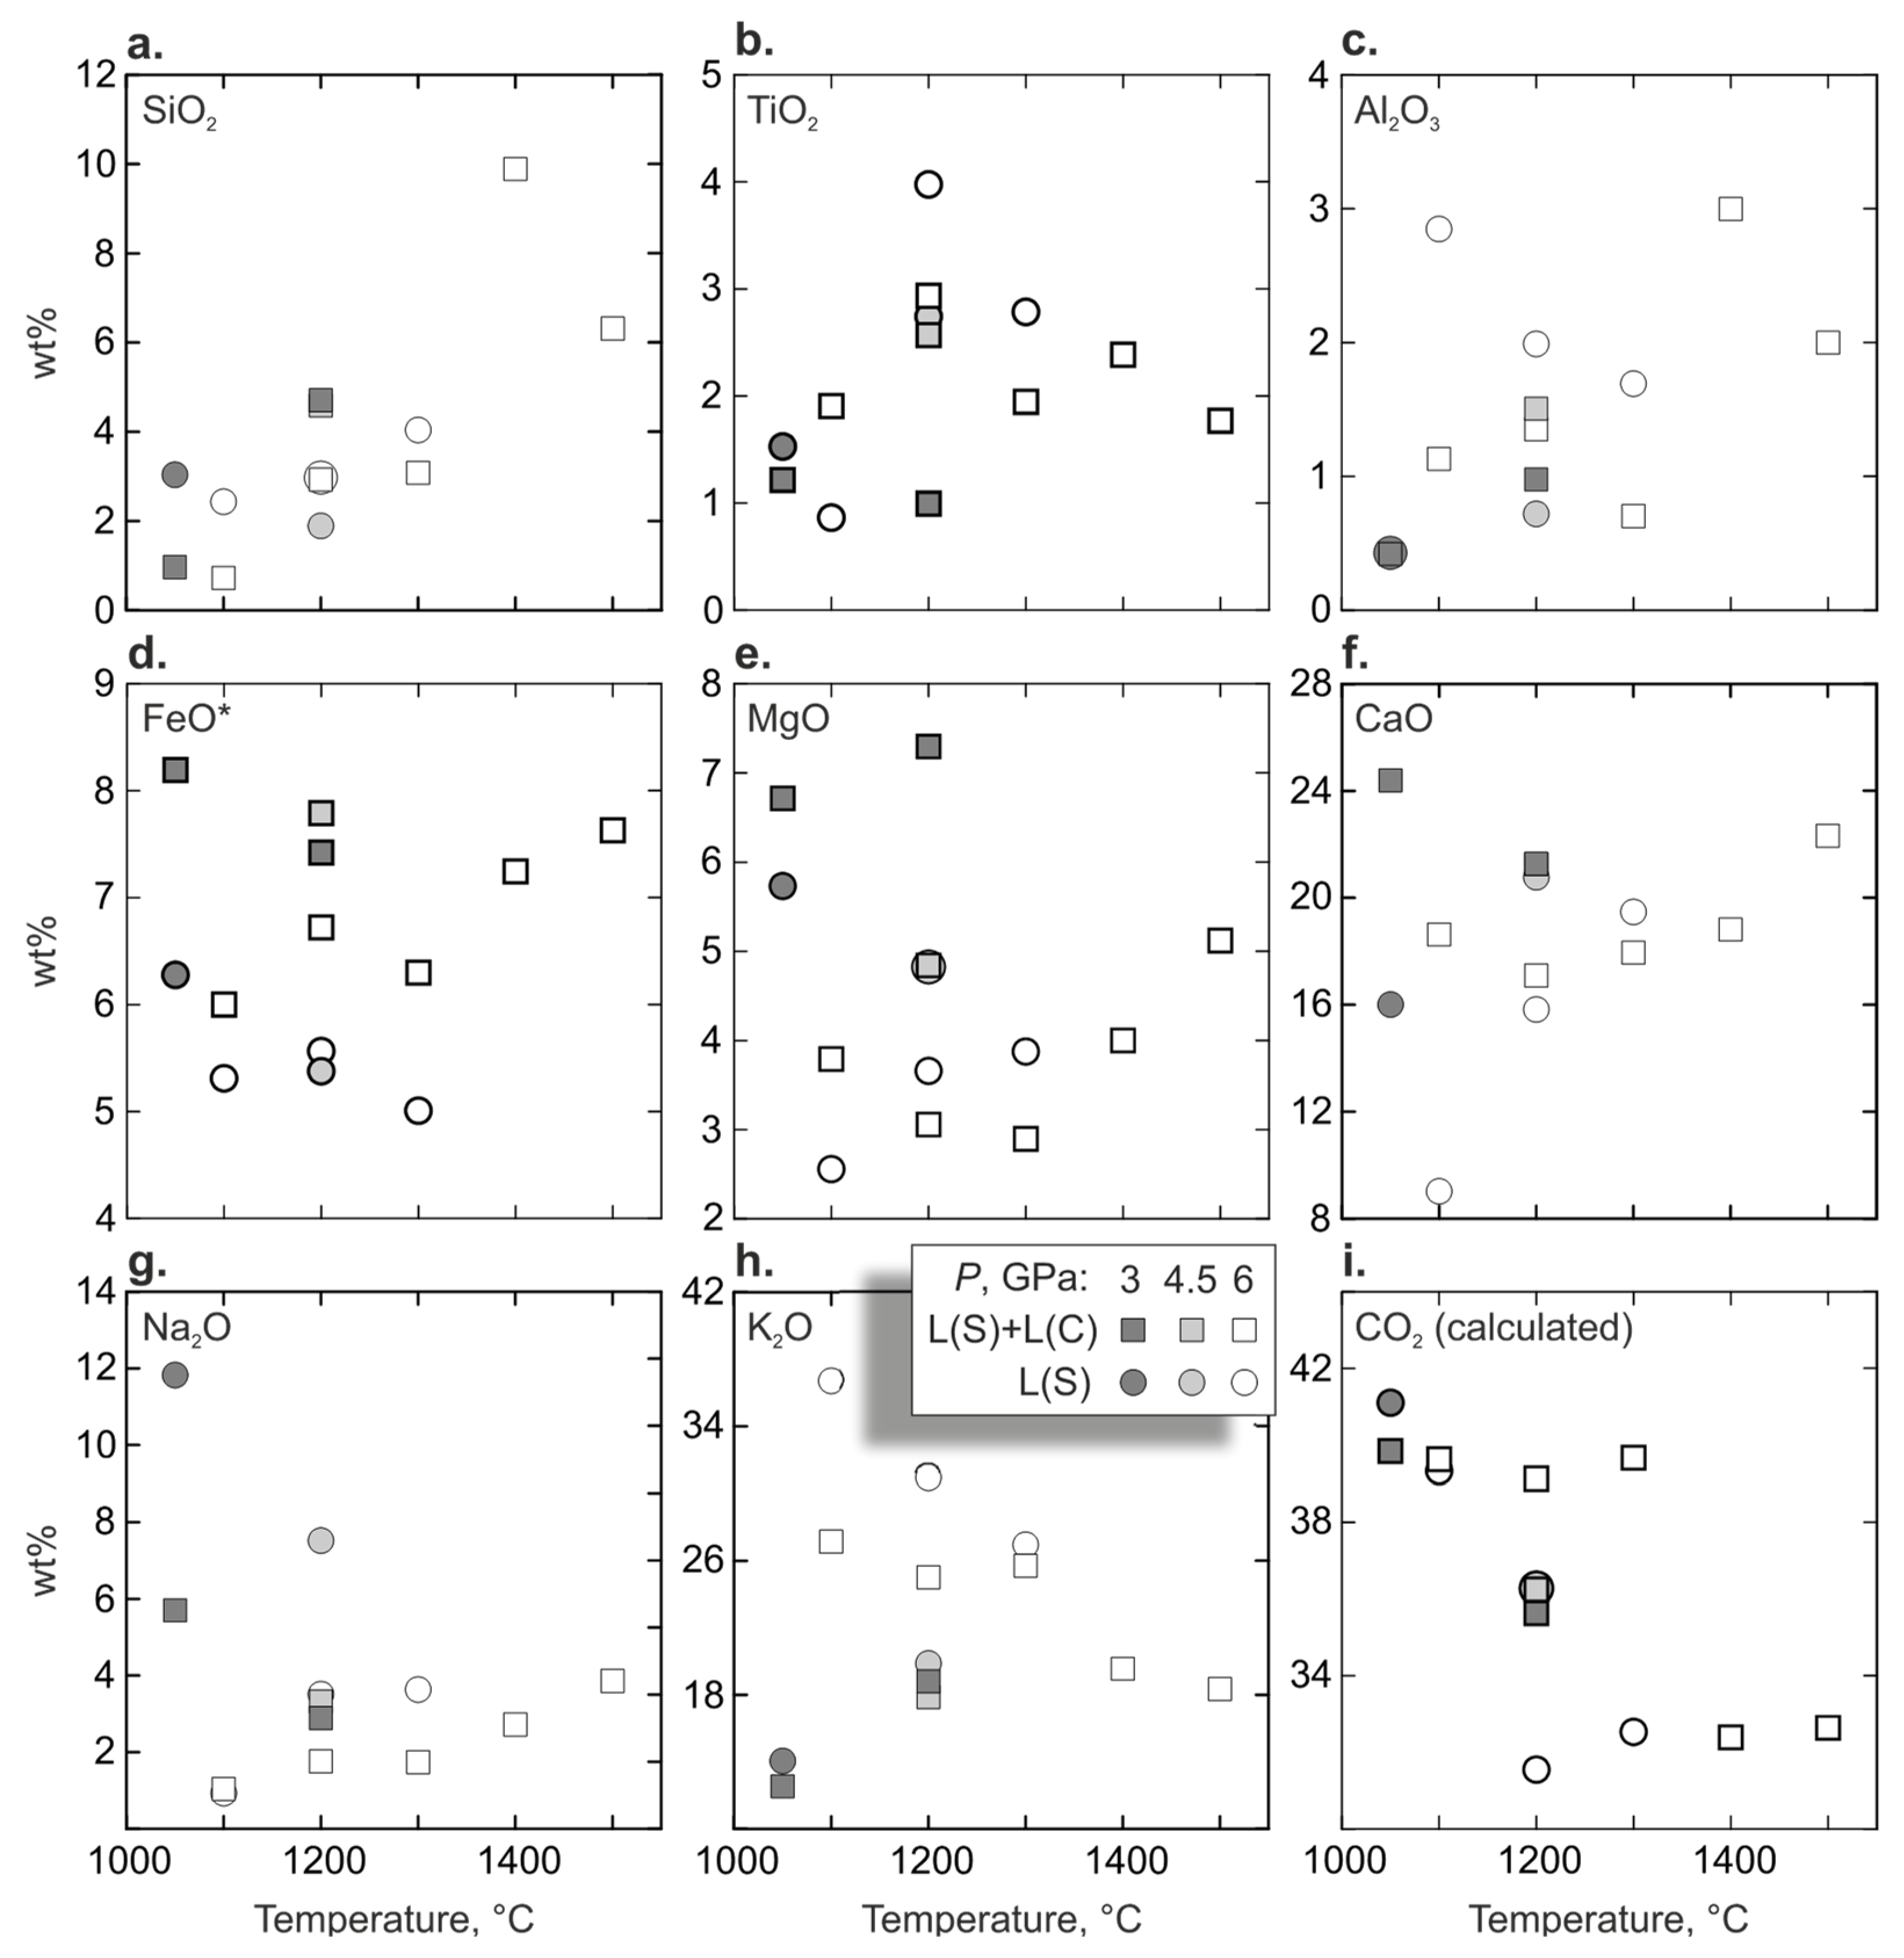
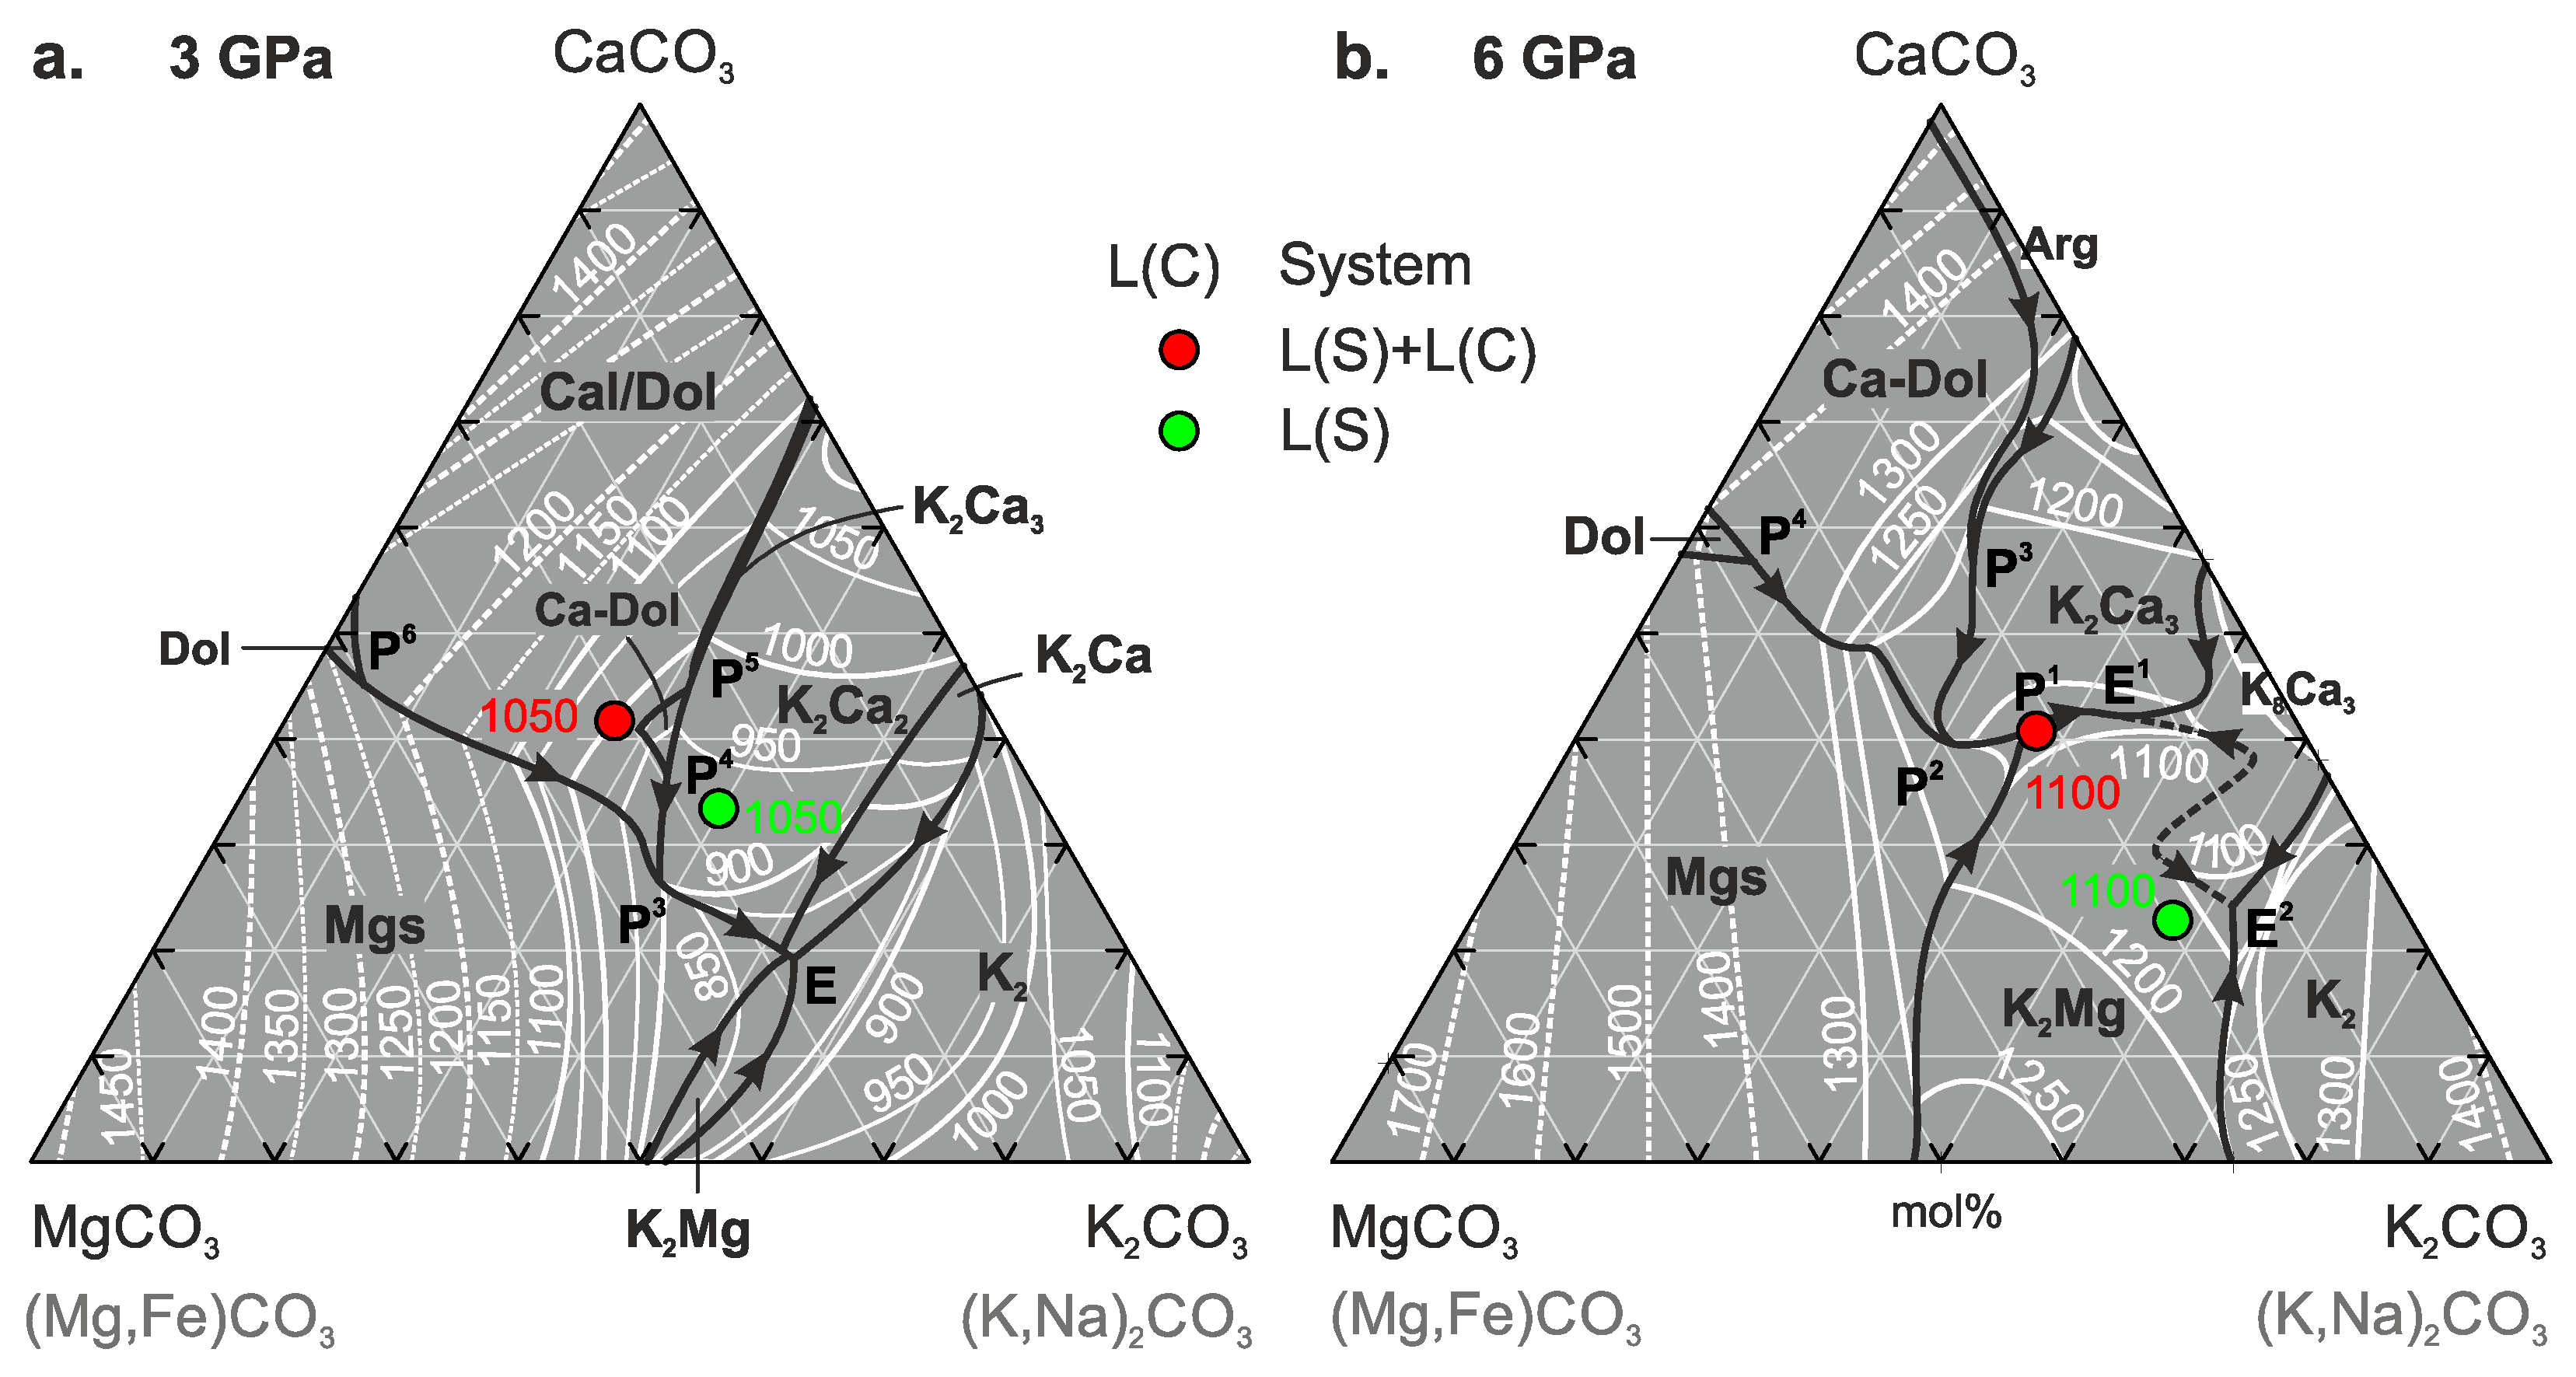
3.2.4. Carbonate Melt

In both systems, the carbonate melt is characterized by high concentrations of alkalis, 1–12 wt% Na2O and 13–37 wt% K2O (Figure 12g,h). Ca# of the melt varies between 55–68, and Mg#—45–64 (Table 6 and Table S9). In molar ratios, the composition of the carbonate melt can be expressed as follows: 24-58(K0.44–0.91Na0.09–0.66)2CO3∙42-76CaO0.23–0.46MgO0.09–0.20FeO0.08–0.12CO3 + 1–16 mol% SiO2 + 3–7 mol% TiO2 + 1–4 mol% Al2O3. With increasing temperature, the content of SiO2 in the melt increases from 1–3 to 6–10 wt%, while the content of Al2O3 does not exceed 3 wt% (Figure 12a,c). Carbonate melt coexisting with titanium phases (rutile, Ti-wadeite, and Ti-phlogopite) at 3/1050, 3/1200, and 6/1100 GPa/°C contains 1–2 wt% TiO2 (Figure 12b, Table 6). As the temperature increases to 1200 °C at 4.5 and 6 GPa, the Ti-minerals disappear (Figure 3, Figure 5 and Figure 9, Table 2 and Table 3), and the content of TiO2 in the melt increases to 3–4 wt%. (Figure 12b, Table 6). An increase in temperature to 1500 °C is accompanied by a decrease in the TiO2 concentration in the melt to ~2 wt% at 6 GPa (Figure 12b, Table 6). With increasing pressure, the content of Na2O in the melt decreases from 6 to12 wt% at 3 GPa and 1050 °C to 1 wt% at 6 GPa and 1100 °C (Figure 12g, Table 6). The minimum K2O content of 12–14 wt% was found in the melt coexisting with phlogopite at 3 GPa and 1050 °C (Figure 12h, Table 6). With an increase in temperature to 1200 °C at 3 and 4.5 GPa, the K2O content in the carbonate melt increases to 18–20 wt% (Figure 12h). An increase in pressure to 6 GPa and a decrease in temperature to 1100 °C are accompanied by the disappearance of the silicate melt and phlogopite, which leads to an increase in the K2O content in the carbonate melt to 26–37 wt% (Figure 7, Figure 9 and Figure 12h). With a further increase in temperature at 6 GPa, the content of K2O in the melt gradually decreases to 18 wt% at 1500 °C (Figure 12h). The content of CO2 in a form of CO32− in the melt varies within 32–41 wt% (Figure 12h, Table 6).
Table 6. Compositions (wt%) of carbonate melts.
P, GPa/T, °CSystemnSiO2TiO2Al2O3FeOMgOCaONa2OK2OCO2 ContentK2O/
Na2O
Ca#Mg#
CalcBD
Starting Mixture L(S) + L(C) 27.82.207.955.653.5612.92.7615.821.465853
3/1050L(S) + L(C)90.97(37)1.22(49)0.42(06)8.20(31)6.72(19)24.4(6)5.70(44)12.5(2)39.842.1(1.0)26159
3/1200L(S) + L(C)64.71(1.10)0.99(15)0.98(13)7.42(22)7.30(50)21.3(1.0)2.89(23)18.8(8)35.638.4(2.0)75764
4.5/1200L(S) + L(C)74.59(1.53)2.57(29)1.51(27)7.79(47)4.84(38)21.3(1.1)3.32(29)17.9(8)36.339.5(1.7)56253
6/1100L(S) + L(C)90.72(08)1.90(06)1.13(04)6.00(11)3.79(11)18.6(3)1.04(07)27.1(2)39.642.8(4)266553
6/1200L(S) + L(C)152.93(19)2.94(09)1.35(07)6.72(18)3.06(19)17.1(7)1.76(22)25.0(5)39.141.0(1.2)146445
6/1300L(S) + L(C)13.081.950.706.302.9018.01.7425.739.743.2156745
6/1400L(S) + L(C)149.89(17)2.39(05)3.00(04)7.25(22)4.00(04)18.8(0)2.72(07)19.6(1)32.434.6(1)76350
6/1500L(S) + L(C)76.31(96)1.77(58)2.00(17)7.63(60)5.12(83)22.3(1.3)3.86(28)18.4(1.2)32.638.6(2.8)56354
Starting mixture L(S) 52.42.1413.31.571.193.232.9915.28.055357
3/1050L(S)63.04(30)1.53(12)0.43(15)6.28(09)5.73(11)16.0(1)11.8(3)14.1(1)41.142.3(4)15562
4.5/1200L(S)181.89(1.27)2.74(26)0.72(21)5.38(31)4.83(51)20.8(8)7.52(61)19.9(6)36.342.6(1.7)36662
6/1100L(S)102.43(55)0.86(05)2.85(46)5.31(41)2.56(45)9.02(68)0.93(08)36.7(8)39.345.3(1.6)395446
6/1200L(S)202.97(91)3.98(13)1.99(11)5.57(18)3.66(26)15.8(6)3.51(54)31.0(4)31.641.9(1.3)96354
6/1300L(S)154.04(78)2.79(09)1.69(13)5.01(16)3.88(30)19.5(7)3.63(18)27.0(5)32.542.9(1.1)76858
Notes: n—the number of EDS analysis, standard deviations are given in parents, K2O/Na2O is a weight ratio, Ca# = Ca/(Ca + Mg + Fe) × 100 mol%, Mg# = Mg/(Mg + Fe) × 100 mol%.
Figure 12. Compositions of carbonate melt as a function of temperature. (a) SiO2, (b) TiO2, (c) Al2O3, (d) FeO, (e) MgO, (f) CaO, (g) Na2O, (h) K2O, (i) CO2. FeO* = total Fe as Fe2+.
Minerals 13 00443 g012

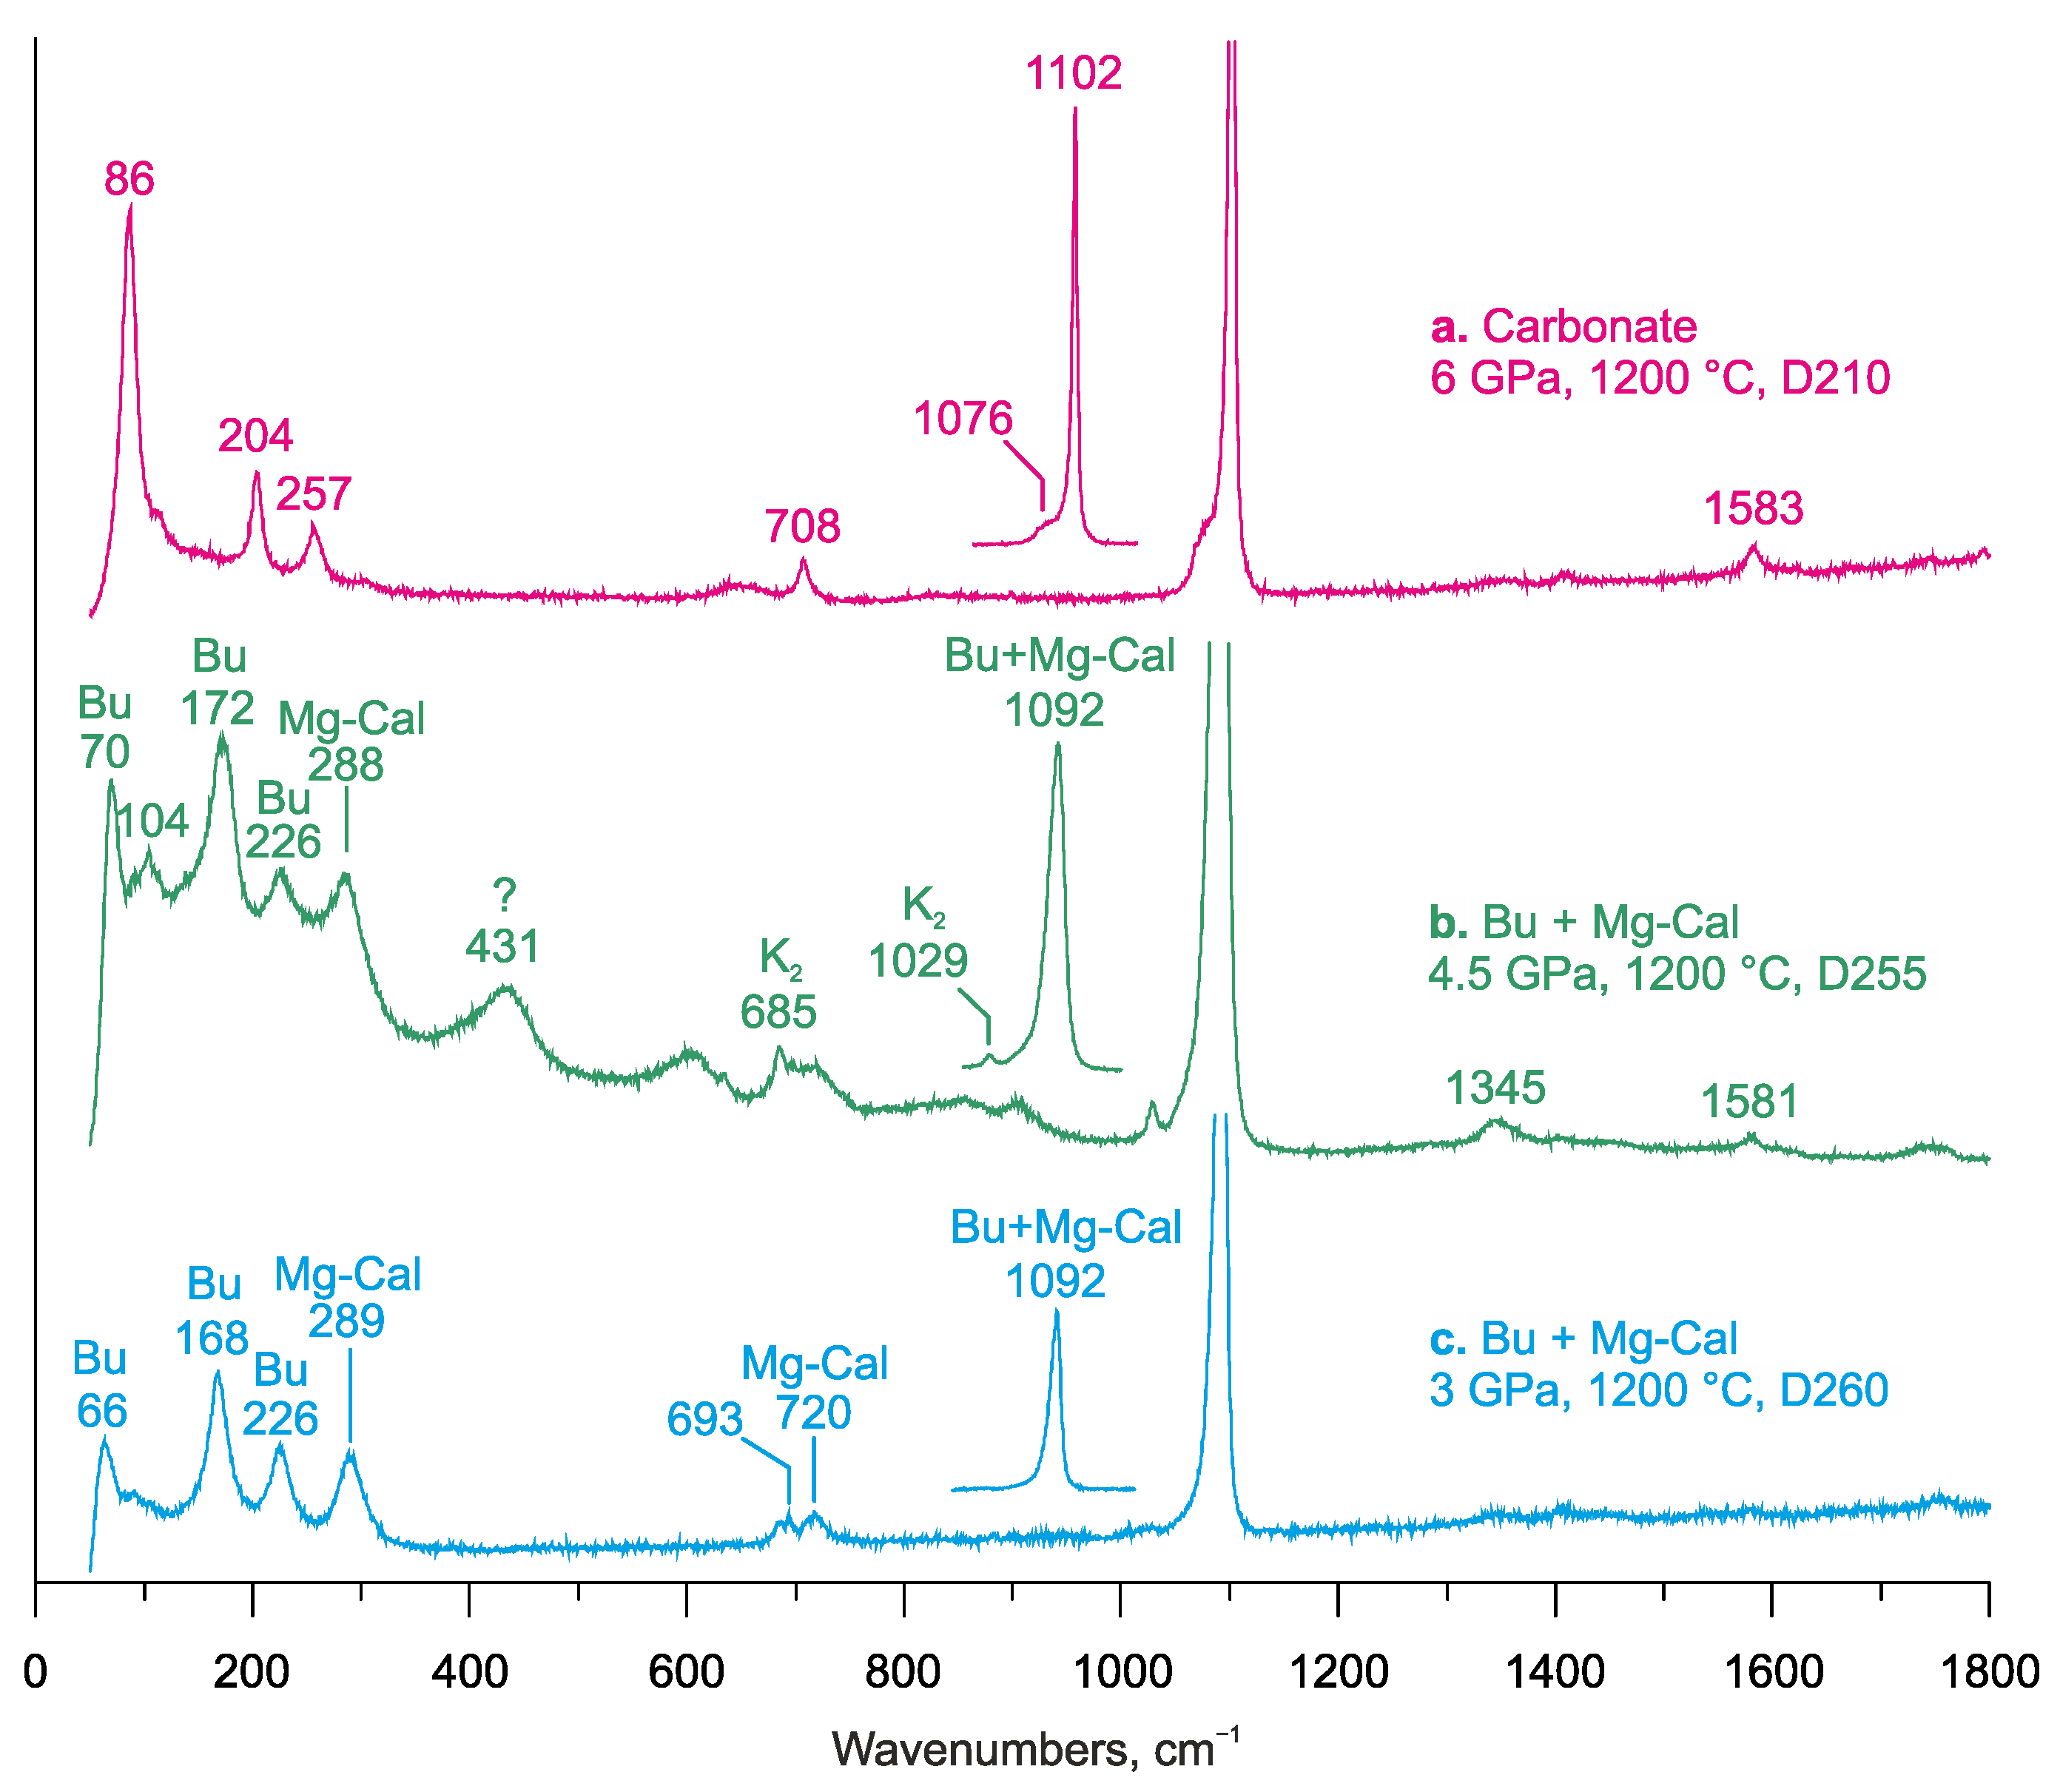
3.2.5. Quench Products of Carbonate Melt

At 3 GPa and 1200 °C, the products of melt quenching are K2Ca(CO3)2 (Ca# 50) and Mg-bearing calcite (Ca# 70) (Figure 2e, Table 7). The Raman spectrum of the melt contains bands at 66, 168, and 226 cm−1, which correspond to bütschliite-R 3 ¯ 2/m [43] synthesized at 1 atm, 3 and 6 GPa [44,45], and bands at 289 and 720 cm−1, which correspond to calcite containing 20–30 mol% MgCO3 [46] (Figure 13c). Bütschliite and Mg-bearing calcite were previously found in the quench products of an alkaline carbonate melt obtained at 3 and 6 GPa in systems K2CO3-CaCO3 and K2CO3-CaCO3-MgCO3 [47,48].
Table 7. Composition of quench products of carbonate melt.
Run#P, GPaT, °CSystemPhasewt%, Normalized to 100%Ca#
mol%
SiO2TiO2Al2O3FeOMgOCaONa2OK2OCO2 (Calc)
D26031200L(S) + L(C)Bu2.40.30.77.25.012.92.733.535.450
Mg-Cal1.90.30.75.47.935.30.86.341.470
D2554.51200L(S) + L(C)Kfs62.32.217.80.60.10.20.216.6
Phl47.14.814.111.66.21.40.814.0
K22.61.50.62.91.07.43.749.131.267
Bu3.11.30.87.33.815.23.530.934.158
Mg-Cal3.51.81.28.87.332.60.76.138.166
D26161100L(S) + L(C)Bu0.71.21.88.66.019.30.624.837.056
D2554.51200L(S)Mg-Cal0.82.50.27.76.933.31.56.740.568
D26161100L(S)Bu1.50.71.17.74.510.90.738.334.647
K22.82.16.22.10.55.91.452.626.272
K2Ca32.30.56.46.92.530.80.615.834.278
Notes: K2—Ca-bearing K2CO3, Bu—bütschliite K2Ca(CO3)2, K2Ca3—K2Ca3(CO3)4, Mg-Cal—Mg-bearing calcite. The number of EDS analysis and standard deviations are given in Supplementary Tables S1 and S5. Ca# = Ca/(Ca + Mg + Fe) × 100 mol%.
Figure 13. Representative Raman spectra of carbonate melt quench products in the system L(S) + L(C). (a) run D210 at 6 GPa and 1200 °C, (b) run D255 at 4.5 GPa and 1200 °C, and (c) run D260 at 3 GPa and 1200 °C.
Minerals 13 00443 g013
At 4.5 GPa and 1200 °C, K2CO3, K2Ca(CO3)2 (Ca# 56), Mg-bearing calcite (Ca# 66), Ti-phlogopite, and potassium feldspar (Table 7). In addition to bütschliite and Mg-bearing calcite, the Raman spectrum of the melt contains bands at 685 and 1029 cm−1, which correspond to γ-K2CO3, stable at 1 atm and 3 GPa [44,49] (Figure 13b).
Microprobe analysis of the quenched-carbonate melt recovered from 6 GPa and 1100 °C revealed the presence of K2CO3, K2Ca(CO3)2 (Ca# 47), and K2Ca3(CO3)4 (Ca# 78) (Figure 8b, Table 7). The Raman spectra did not reveal peaks corresponding to the above phases; however, the established bands are close to K2Mg(CO3)2 and eitelite (Figure 13a) [50].

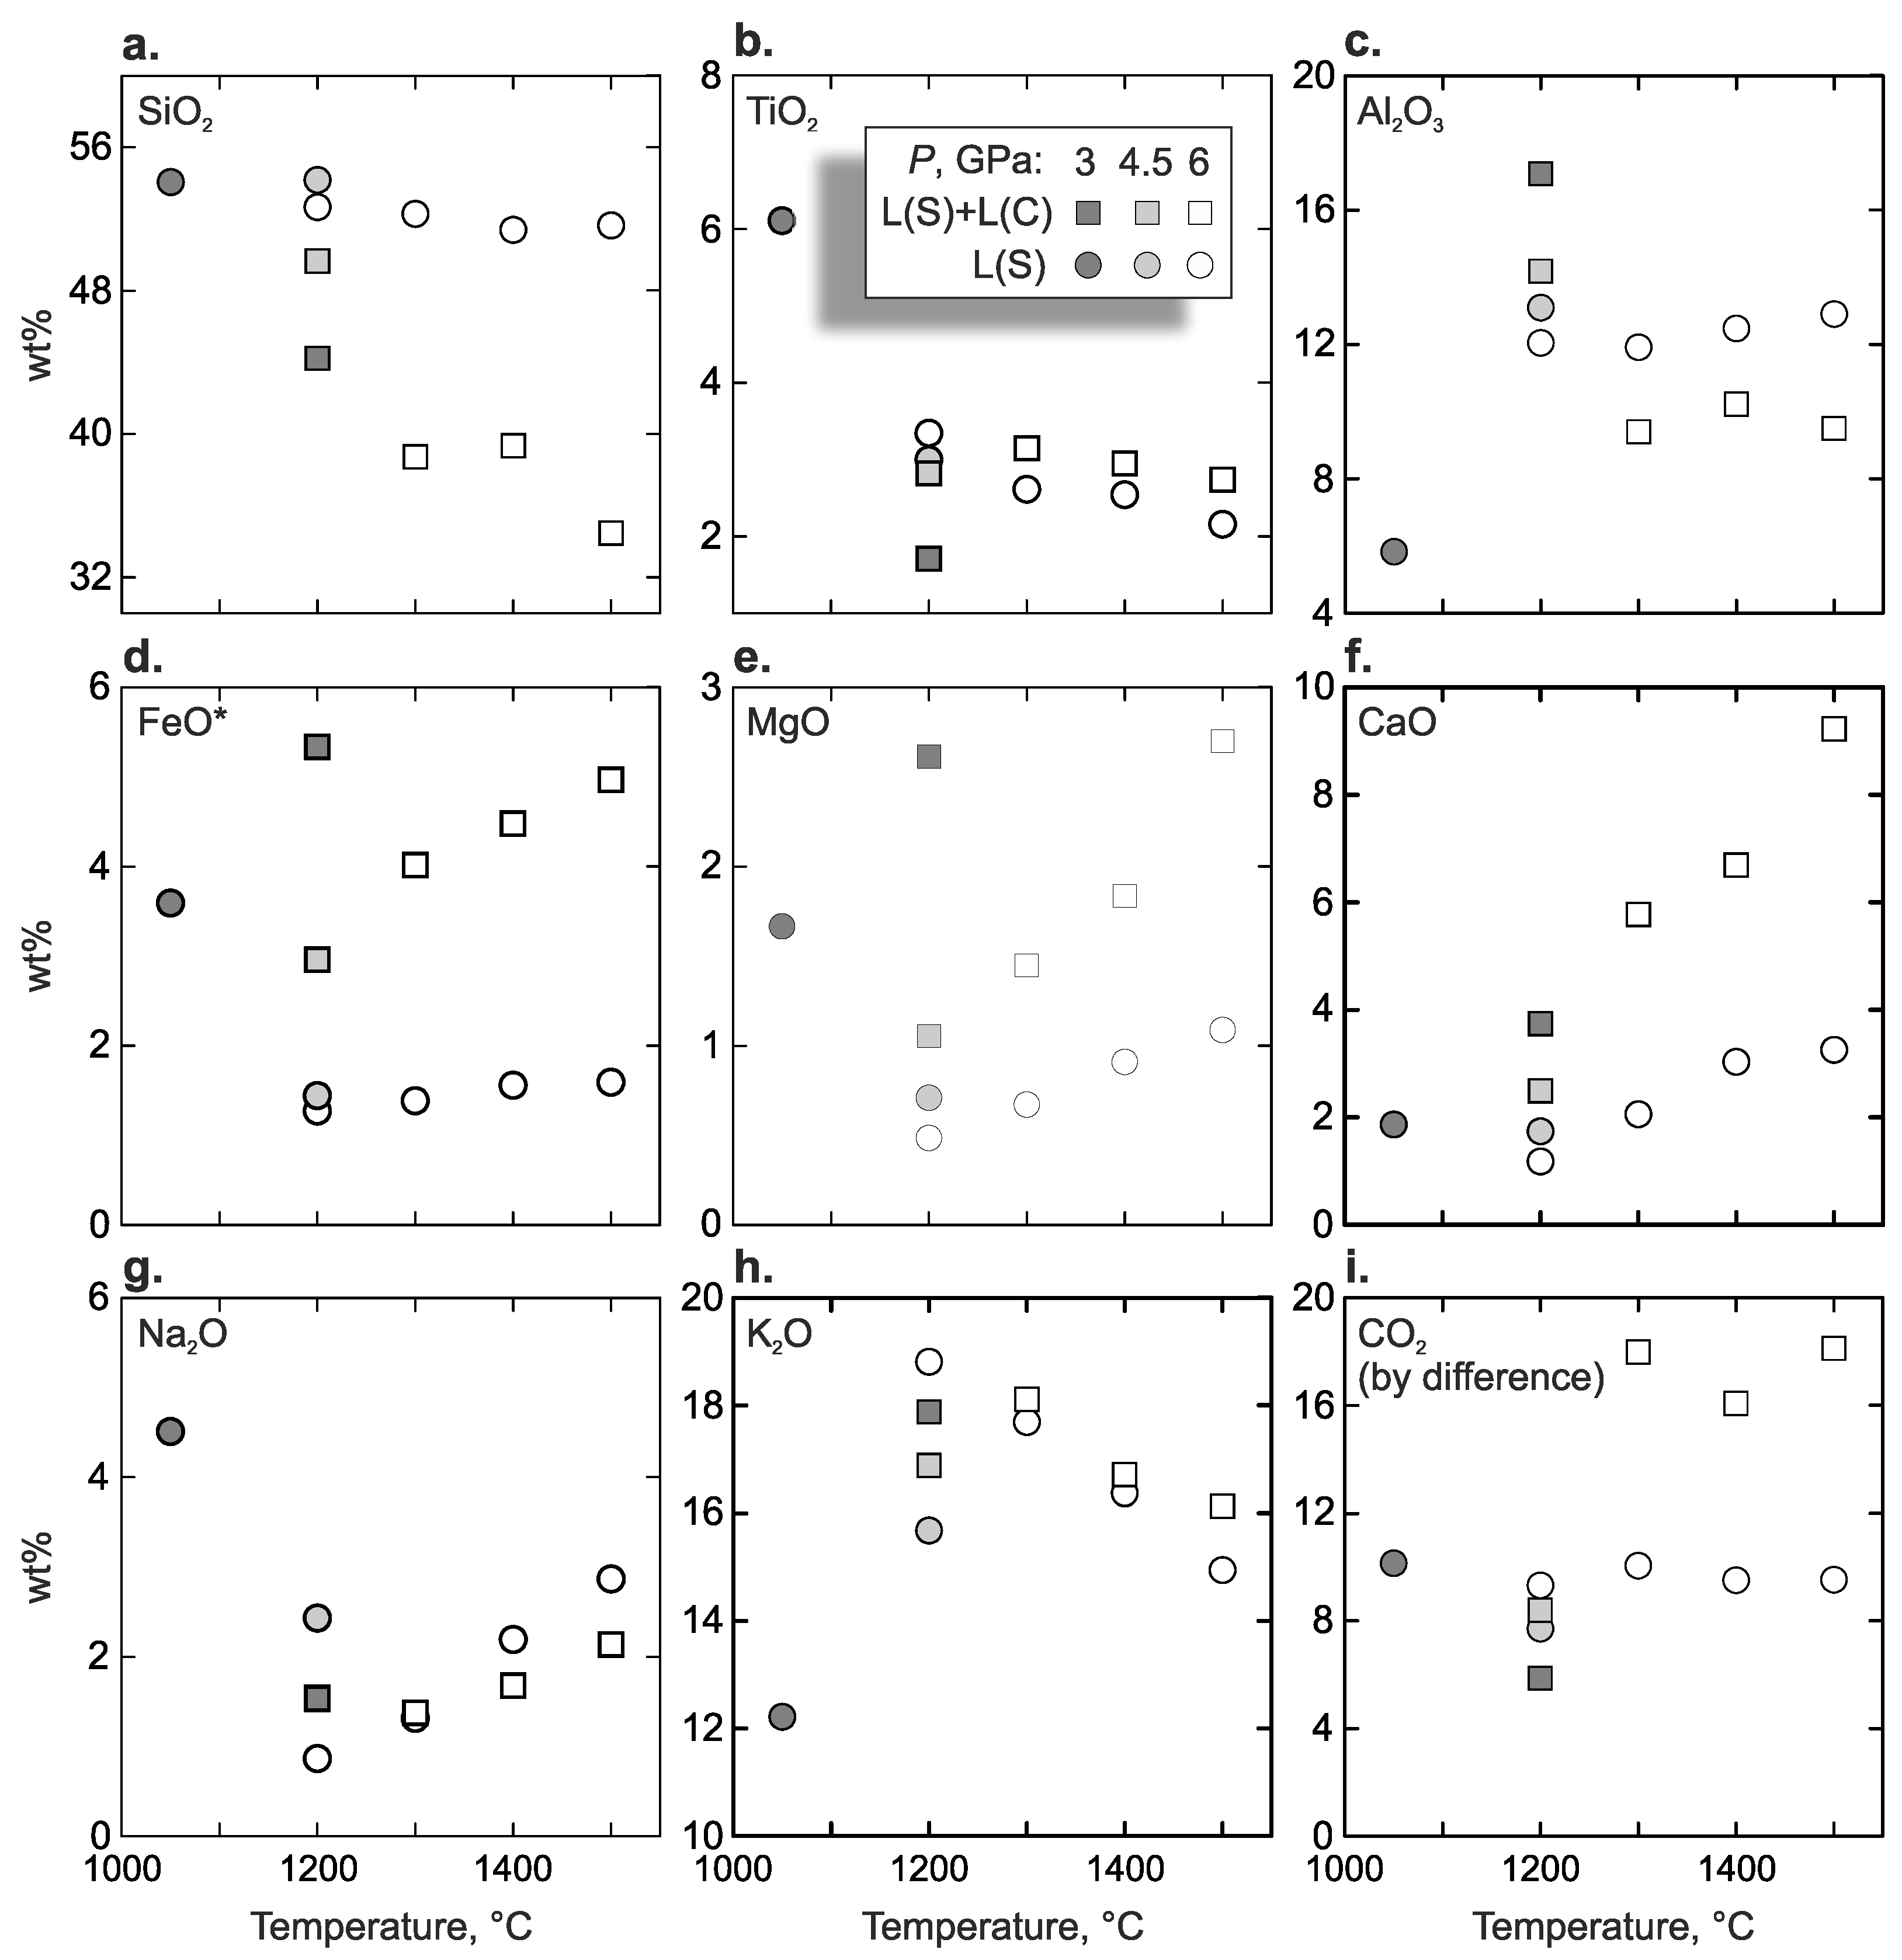
3.2.6. Silicate Melt

The obtained silicate melts are alkali-rich (19–24 wt% Na2O + K2O) and contain 12–19 wt% K2O (calculated on a volatile-free basis) (Tables S4 and S9). The content of SiO2 in the melt (calculated on a volatile-free basis) varies from 42 to 60 wt% (Tables S4 and S9). The compositions of the resulting silicate melts fall within the phonolite region on the TAS diagram (Figure 14). In the L(S) system, the melt contains 7–10 wt% CO2 and 51–55 wt% SiO2, which do not change with temperature (Figure 15a,i) and are close to the bulk concentrations of 8 wt% CO2 and 52 wt% SiO2 (Table 8). At the same time, in the L(S) + L(C) system, the silicate melt coexisting with the carbonate melt shows an increase in CO2 from 8 to 18 wt% and a decrease in SiO2 from 50 to 35 wt% as temperature increases from 1200 to 1500 °C (Figure 15a,i and Table 8).
Table 8. Compositions (wt%) of silicate melt.
P, GPa/T, °CSystemnSiO2TiO2Al2O3FeOMgOCaONa2OK2OCO2K2O/Na2O
Starting mixture L(S) + L(C) 27.82.207.955.653.5612.92.7615.821.46
3/1200L(S) + L(C)644.2(4)1.71(10)17.1(3)5.33(17)2.61(10)3.74(18)1.54(03)17.9(2)5.9(4)12
4.5/1200L(S) + L(C)949.7(7)2.82(06)14.2(2)2.96(09)1.05(09)2.49(18)1.54(09)16.9(1)8.4(9)11
6/1300L(S) + L(C)738.7(2)3.15(05)9.39(08)4.01(08)1.45(05)5.77(12)1.38(06)18.1(3)18.0(3)13
6/1400L(S) + L(C)939.4(6)2.95(06)10.2(1)4.48(16)1.84(07)6.69(12)1.71(1)16.7(2)16.1(8)10
6/1500L(S) + L(C)534.5(3.1)2.74(19)9.5(8)4.97(52)2.70(41)9.23(1.44)2.14(12)16.1(3)18.1(1.9)8
Starting mixture L(S) 52.42.1413.31.571.193.232.9915.28.05
3/1050L(S)454.1(3)6.11(15)5.83(24)3.59(10)1.67(07)1.87(09)4.51(27)12.2(1)10.1(3)3
4.5/1200L(S)1055.2(1.7)2.96(27)13.3(4)1.42(17)0.67(22)1.58(42)2.38(45)15.7(8)6.9(1.8)6
6/1200L(S)1652.6(1.0)3.34(12)12.0(2)1.27(06)0.49(06)1.18(11)0.87(06)18.8(5)9.3(1.3)22
6/1300L(S)1052.3(5)2.61(07)11.9(2)1.39(04)0.67(05)2.06(09)1.37(1)17.7(1)10.1(7)13
6/1400L(S)351.4(2)2.54(01)12.5(1)1.56(03)0.91(04)3.03(08)2.20(06)16.4(1)9.5(1)7
6/1500L(S)451.6(2)2.16(10)12.9(1)1.59(05)1.09(03)3.26(10)2.87(05)14.9(0)9.6(3)5
Notes: n—the number of EDS analysis, standard deviations are given in parents, K2O/Na2O is a weight ratio.
Figure 14. Silicate-melt compositions are plotted on the total alkali versus SiO2 diagram (TAS). Fields for volatile-poor rocks are taken from [51]. The concentrations are from the volatile-free compositions normalized to 100 wt%. Silicate melts from experiments [16,18], diamond inclusions [52,53,54,55,56], mantle xenoliths [57,58] and alkaline complexes [59,60,61] are shown for comparison. TS—this study, S20—[18], S21—[17]. Kfs + Dol, and Kfs + Jd + Dol, and Kfs + Jd + Di + Dol are the system compositions expressed in mineral mole ratios.
Minerals 13 00443 g014
The content of Na2O in the melt successively decreases from 4.5 to 2.4 and 0.9 wt% as pressure increases from 3 to 4.5 and 6 GPa at 1050 and 1200 °C (Figure 15g, Table 8), which correlates with the simultaneous increasing Na2O in Cpx (Figure 11b). The subsequent increase in temperature at 6 GPa is accompanied by an increase in Na2O in the silicate melt (Figure 15g) due to an uptake of omphacite (Figure 9). With an increase in pressure from 3 to 4.5 and 6 GPa at 1050 and 1200 °C, the concentration of K2O increases from 12 to 16 and 19 wt%. As the temperature increases from 1200 to 1500 °C at 6 GPa, the melting degree increases, and the concentration of K2O in the silicate melt decreases from 19 to 15 wt% (Figure 15h, Table 8).
The maximum TiO2 content of 6 wt% in the silicate melt was recorded in the L(S) system at 3 GPa and 1050 °C. At 6 GPa, the TiO2 concentration decreases from 3.2–3.3 to 2.2–2.7 with an increase in temperature from 1200 to 1500 °C (Figure 15b, Table 8). With an increase in temperature and degree of melting, the concentrations of FeO, MgO, and CaO in the silicate melt increase (Figure 15d–f).
Figure 15. Compositions of silicate melt versus temperature. (a) SiO2, (b) TiO2, (c) Al2O3, (d) FeO, (e) MgO, (f) CaO, (g) Na2O, (h) K2O, (i) CO2. The volatile-bearing compositions normalized to 100%. FeO* = total Fe as Fe2+.
Minerals 13 00443 g015

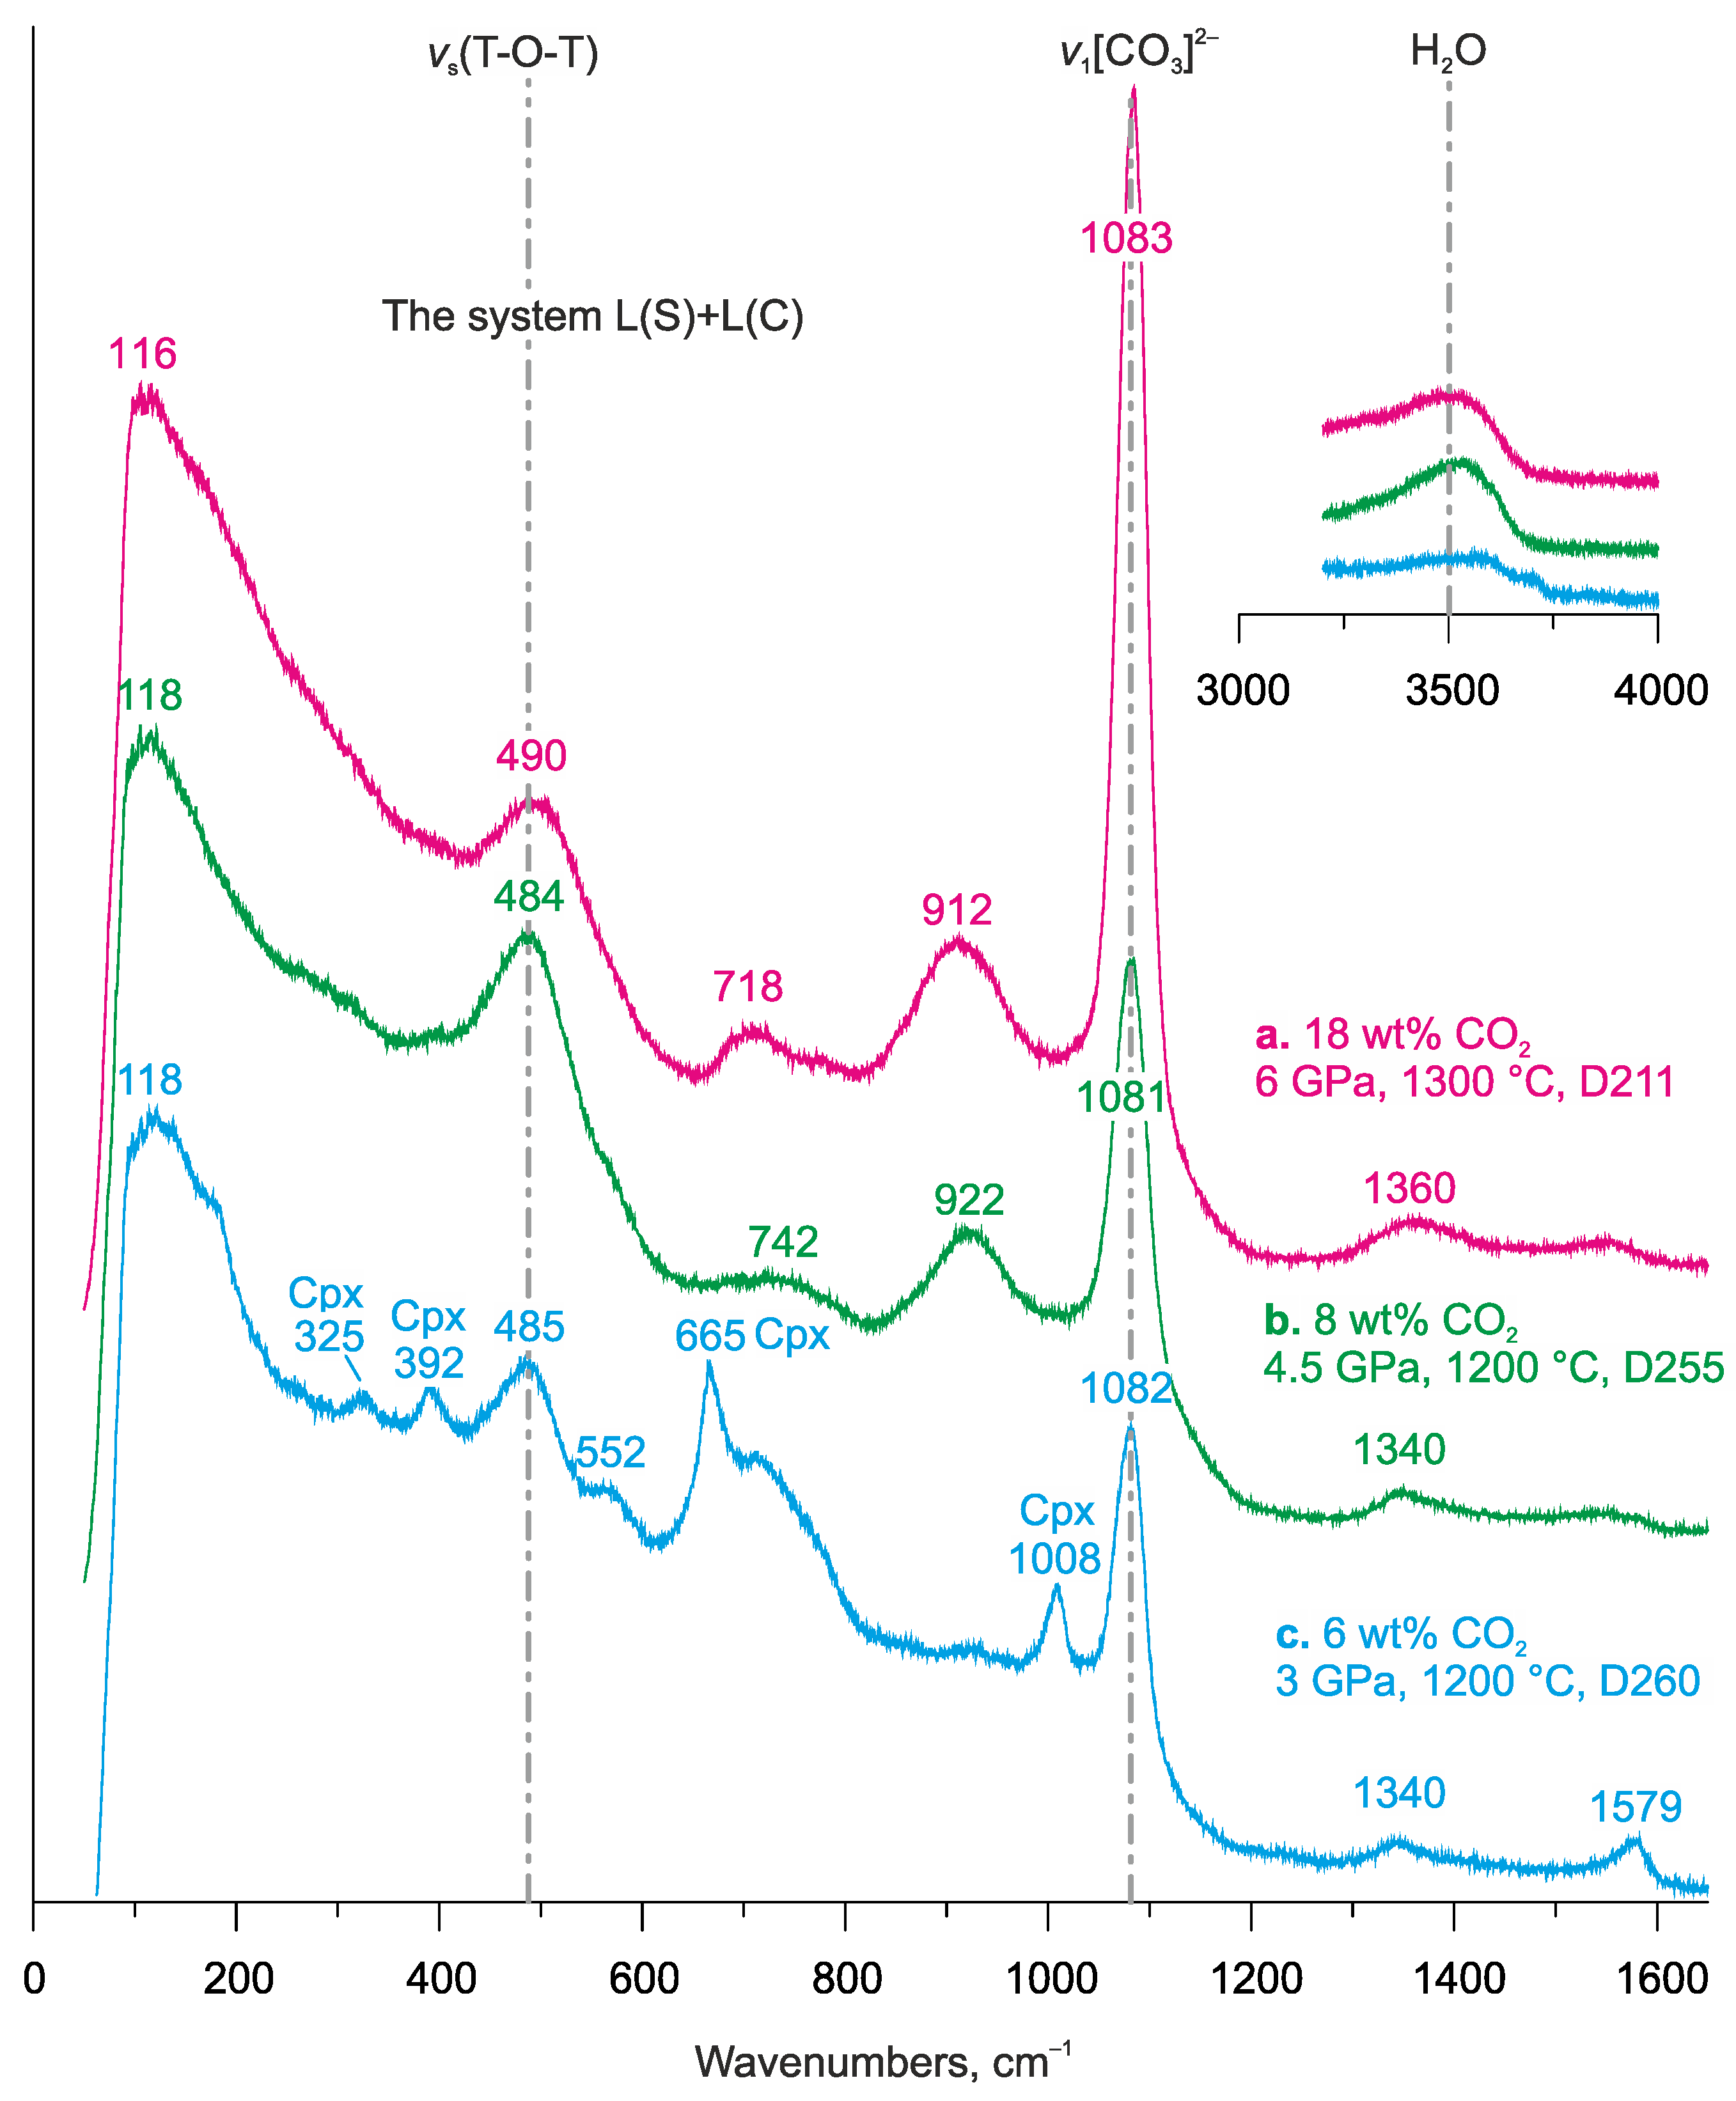
3.2.7. Raman Spectra of Silicate Melt

The Raman spectra of glass-quenched silicate melt are shown in Figure 16. The Raman spectra contain bands at 485–490 cm−1, which correspond to the delocalized vibrational mode of symmetric stretching vibrations of bridging oxygens in T-O-T bonds νs (T-O-T)] [62]. The spectra are characterized by the presence of bands at 1080 and 720–740 cm−1, which correspond to the modes of symmetric stretching vibrations (ν1) and the mode of in-plane bending vibrations (ν4) of CO32− anionic groups, respectively [49,63]. Similar peaks were found in the spectra of CO2-bearing NaAlSi3O8 and NaCaAlSi2O7 glasses synthesized at 1–3 GPa [64,65]. The intensity of the CO32− bands, 1081–1083 cm−1, increases with increasing CO2 concentration in the glass (Figure 16). The most intense band of the carbonate group was observed in the glass containing 18 wt% CO2 (Figure 15a), and the less intense one in the glass containing 8 and 6 wt% CO2 (Figure 15b,c). The Raman spectra also contain a broad band in the region of 3500–3600 cm−1, which is characteristic of OH groups [61]. Raman spectra do not contain peaks corresponding to molecular CO2 at 1280 and 1380 cm−1, however, they have broad bands at 1340 (Figure 15b,c) and 1360 cm−1 (Figure 15a). A band near 1340 cm−1 was previously observed in the Raman spectra of carbonate-silicate glass obtained in the CaCO3-CaSiO3 system at 6 GPa and 1650 °C [66]. In addition, the spectra of glasses synthesized at 4.5 and 6 GPa contain bands in the range 912–922 cm−1 (Figure 15a,b). Similar bands were observed earlier in the Raman spectra of glasses obtained in the carbonized pelite system and the Kfs-dolomite system at 6 GPa [16,18].
The Raman spectra show that, at 3–6 GPa, CO2 dissolves in the phonolite melt as a carbonate anion. The intensity of the CO32− bands decreases with decreasing pressure, which is consistent with the decrease in the CO2 concentration estimated from the total deficit of microprobe analyses (Figure 15i and Figure 16).

3.2.8. Capsule Integrity

Any capsules are characterized by the time during which they can ensure the closeness of the system concerning certain elements. This time is determined by the composition of the sample, the thickness of the capsule, and the temperature. In this work, capsules made of high-density grades of graphite with a grain size of <<1 µm were used, while upper plugs were made of less dense graphite. In long-term experiments at high temperatures, infiltration of the melt into graphite to a depth of up to 200 μm was found in the direction of the HT zone located above the sample (Figure 4a,d,g,j). As can be seen, as the temperature increases, the infiltration depth increases, while the run duration decreases. The presence of graphite flakes in the bulk of the sample (mainly in the carbonate melt) indicates that the infiltration was realized by the dissolution-precipitation mechanism [67,68]. The direction of infiltration towards the HT zone indicates that the driving force of this process was the difference in solubility of metastable graphite in a carbonate melt in the field of temperature gradient [31,34]. Since the thickness of the walls of the capsules above the sample was 600 μm, the integrity of the capsules was not violated.

3.2.9. Approach to Equilibrium

At 4.5 and 6 GPa, the samples in the L(S) + L(C) system contain Grt and Cpx. This allowed the use of geothermometers based on the exchange of Mg-Fe2+ between Cpx and Grt to assess the degree of equilibrium achieved in the experiments. The calculations were performed using the PTEXL code developed by Thomas Koehler and Andrei Girnis (personal communication). In our calculation, we used Fetotal = Fe2+ without taking into account the presence of Fe3+. In most cases, the deviation from the nominal temperature of the experiment does not exceed 50 °C, although in the experiment at 4.5 GPa and 1200 °C, the deviation is greater and varies within +89–128 °C (Table 9). Thus, in the experiments carried out, the system was close to reaching equilibrium. Because garnet is absent from all products of the L(S) system and products of the L(S) + L(C) system at 3 GPa, we could not use the Cpx-Grt thermometer for these experiments.

4. Discussion

4.1. Discussion of Experimental Data

According to the data obtained, the melting of the studied systems begins with the formation of a K-rich Ca-Mg-Fe carbonate melt (Figure 17). This is in good agreement with the experiments in the carbonated pelite system (DG2), in which melting begins with a K-rich dolomite-ankerite melt at 5.5–6.5 GPa [16,21]. The carbonate melt is stable from 1000 to 1180 °C [16,21], while the second immiscible CO2-bearing phonolite melt appears at 6 GPa and ≥1200 °C [16].
The compositions of the obtained carbonate melts are in good agreement with the composition and the P-T-X field of stability of the carbonate melt in the K2CO3-CaCO3-MgCO3 ternary [73,74,75] and multicomponent carbonate systems [78]. The compositions of melts obtained at 1050 °C and 3 GPa fall within the field of complete melting on the corresponding T-X diagram (Figure 18a) [74]. At 6 GPa, the minimum temperature of our experiments was only 50–100 °C higher than the temperatures of the eutectics in the K2CO3-CaCO3-MgCO3 ternary [73,75]. As can be seen in Figure 18b, carbonate melts are close to the compositions of the K2CO3-CaCO3-MgCO3 ternary eutectics in terms of the (K, Na)2CO3:CaCO3:(Mg, Fe)CO3 ratio. In the L(S) + L(C) system, the melt is close to the E1 eutectic, and in the L(S) system, it is close to the E2 eutectic (Figure 18b).
We have previously shown [18] that the solidus of potassium carbonate-aluminosilicate systems is controlled by the melting reaction of the Kfs + Dol assemblage:
6KAlSi3O8 (Kfs) + 6CaMg(CO3)2 (Dol) = 2(Can,Mg1-n)3Al2Si3O12 (Grt) + Al2SiO5 (Ky) + 11SiO2 (Coe) + 3K2(Ca1-n,Mgn)2(CO3)3 (L) + 3CO2 (F and/or L).
According to the data obtained, in addition to Kfs, another potassium phase, Ti-wadeite, crystallizes in the studied system at 6 GPa and 1100 °C. The Ti-wadeite was also established in the carbonated pelite DG2 system at 6 GPa and 1000 °C [16]. The formation of Ti-wadeite at 6 GPa and 1100 °C suggests the following reaction limiting Kfs stability at high pressures:
2KAlSi3O8 (Kfs) + TiO2 (Rt) = K2TiSi3O9 (Wad) + Al2SiO5 (Ky) + 2SiO2 (Coe).
Reaction (2) is shifted to lower pressures relative to the pressure-induced decomposition of Kfs [25,26,27,28] (Figure 17):
K2Si4O9 (Wad) + Al2SiO5 (Ky) + SiO2 (Coe) = 2KAlSi3O8 (Kfs).
Reaction (2) is consistent with the experiments of Mitchell [38], who studied a Kfs-Phl-lamproite and found that Kfs observed at 4–5 GPa and 1100–1250 °C is replaced by K4(Si, Ti)9O20-bearing assemblages at 6–7 GPa and 1000–1400 °C, but disagrees with the experiments by Grassi and Schmidt [21,22], where almost pure Kfs appears in DG2 at 8 GPa and 900–1000 °C. The formation of Kfs from KAlSi3O8 glass (a component of the starting mixture of the DG2 system) out of the Kfs stability field was also observed by Shatskiy et al. [16] at 900 °C, 6 GPa, and a run duration of 96 h and was attributed to the kinetic problem.
The stabilization of titanium wadeite as well as the destabilization of dolomite, according to the reaction:
CaMg(CO3)2 (Dol) = CaCO3 (Arg) + MgCO3 (Mgs),
suggests that with an increase in pressure to 6 GPa and higher, the melting reaction of potassium carbonate-aluminosilicate systems is controlled by the following reaction [18]:
3K2Si4O9 (Wad) + 2Al2SiO5 (Ky) + 6CaCO3 (Arg) + 6MgCO3 (Mgs) = 2(Can,Mg1-n)3Al2Si3O12 (Grt) + 8SiO2 (Coe) + 3K2(Ca1-n,Mgn)2(CO3)3 (L) + 3CO2 (F and/or L),
The formation of a conjugate, immiscible silicate melt was recorded at 3/1050 and 6/1200 GPa/°C (Figure 17b). The appearance of a silicate melt is associated with the disappearance of potassium feldspar, which is its main component. With increasing temperature, the mutual solubility of the silicate and carbonate melts increases; however, even at 1500 °C and 6 GPa, i.e., at a temperature exceeding the temperature of the convective mantle, the potassium carbonatite and phonolite melts are far from complete miscibility (Figure 12 and Figure 15). The disappearance of the carbonate melt in the L(S) system with increasing temperature (Figure 17b) is explained by the limited amount of the carbonate component in the bulk composition of the L(S) system, which at 1400 and 1500 °C is completely absorbed by the silicate melt due to an increase in mutual solubility.
We also found that as the pressure decreased, the K2O/Na2O weight ratio in both carbonate and silicate melts decreased from 22–38 at 6 GPa and 1100 °C to 1–3 at 3 GPa and 1050 °C. (Figure 19). This decrease correlates with a decrease in the sodium content of Cpx (Table 4). This supports the assumption [21] that with decreasing pressure, sodium becomes less compatible with Cpx and the coexisting melt becomes more sodic. This trend is consistent with the ultrapotassic composition of carbonatite and silicate inclusions in natural diamonds and the more sodic composition of melt pockets from spinel-facies mantle xenoliths [79]. At the same time, it should also be noted that with increasing temperature, more and more sodium is redistributed both into silicate and carbonate melts, and at mantle adiabatic temperatures of 1400–1500 °C at 6 GPa [80], the K2O/Na2O ratio decreases to 5–8 (Figure 19).

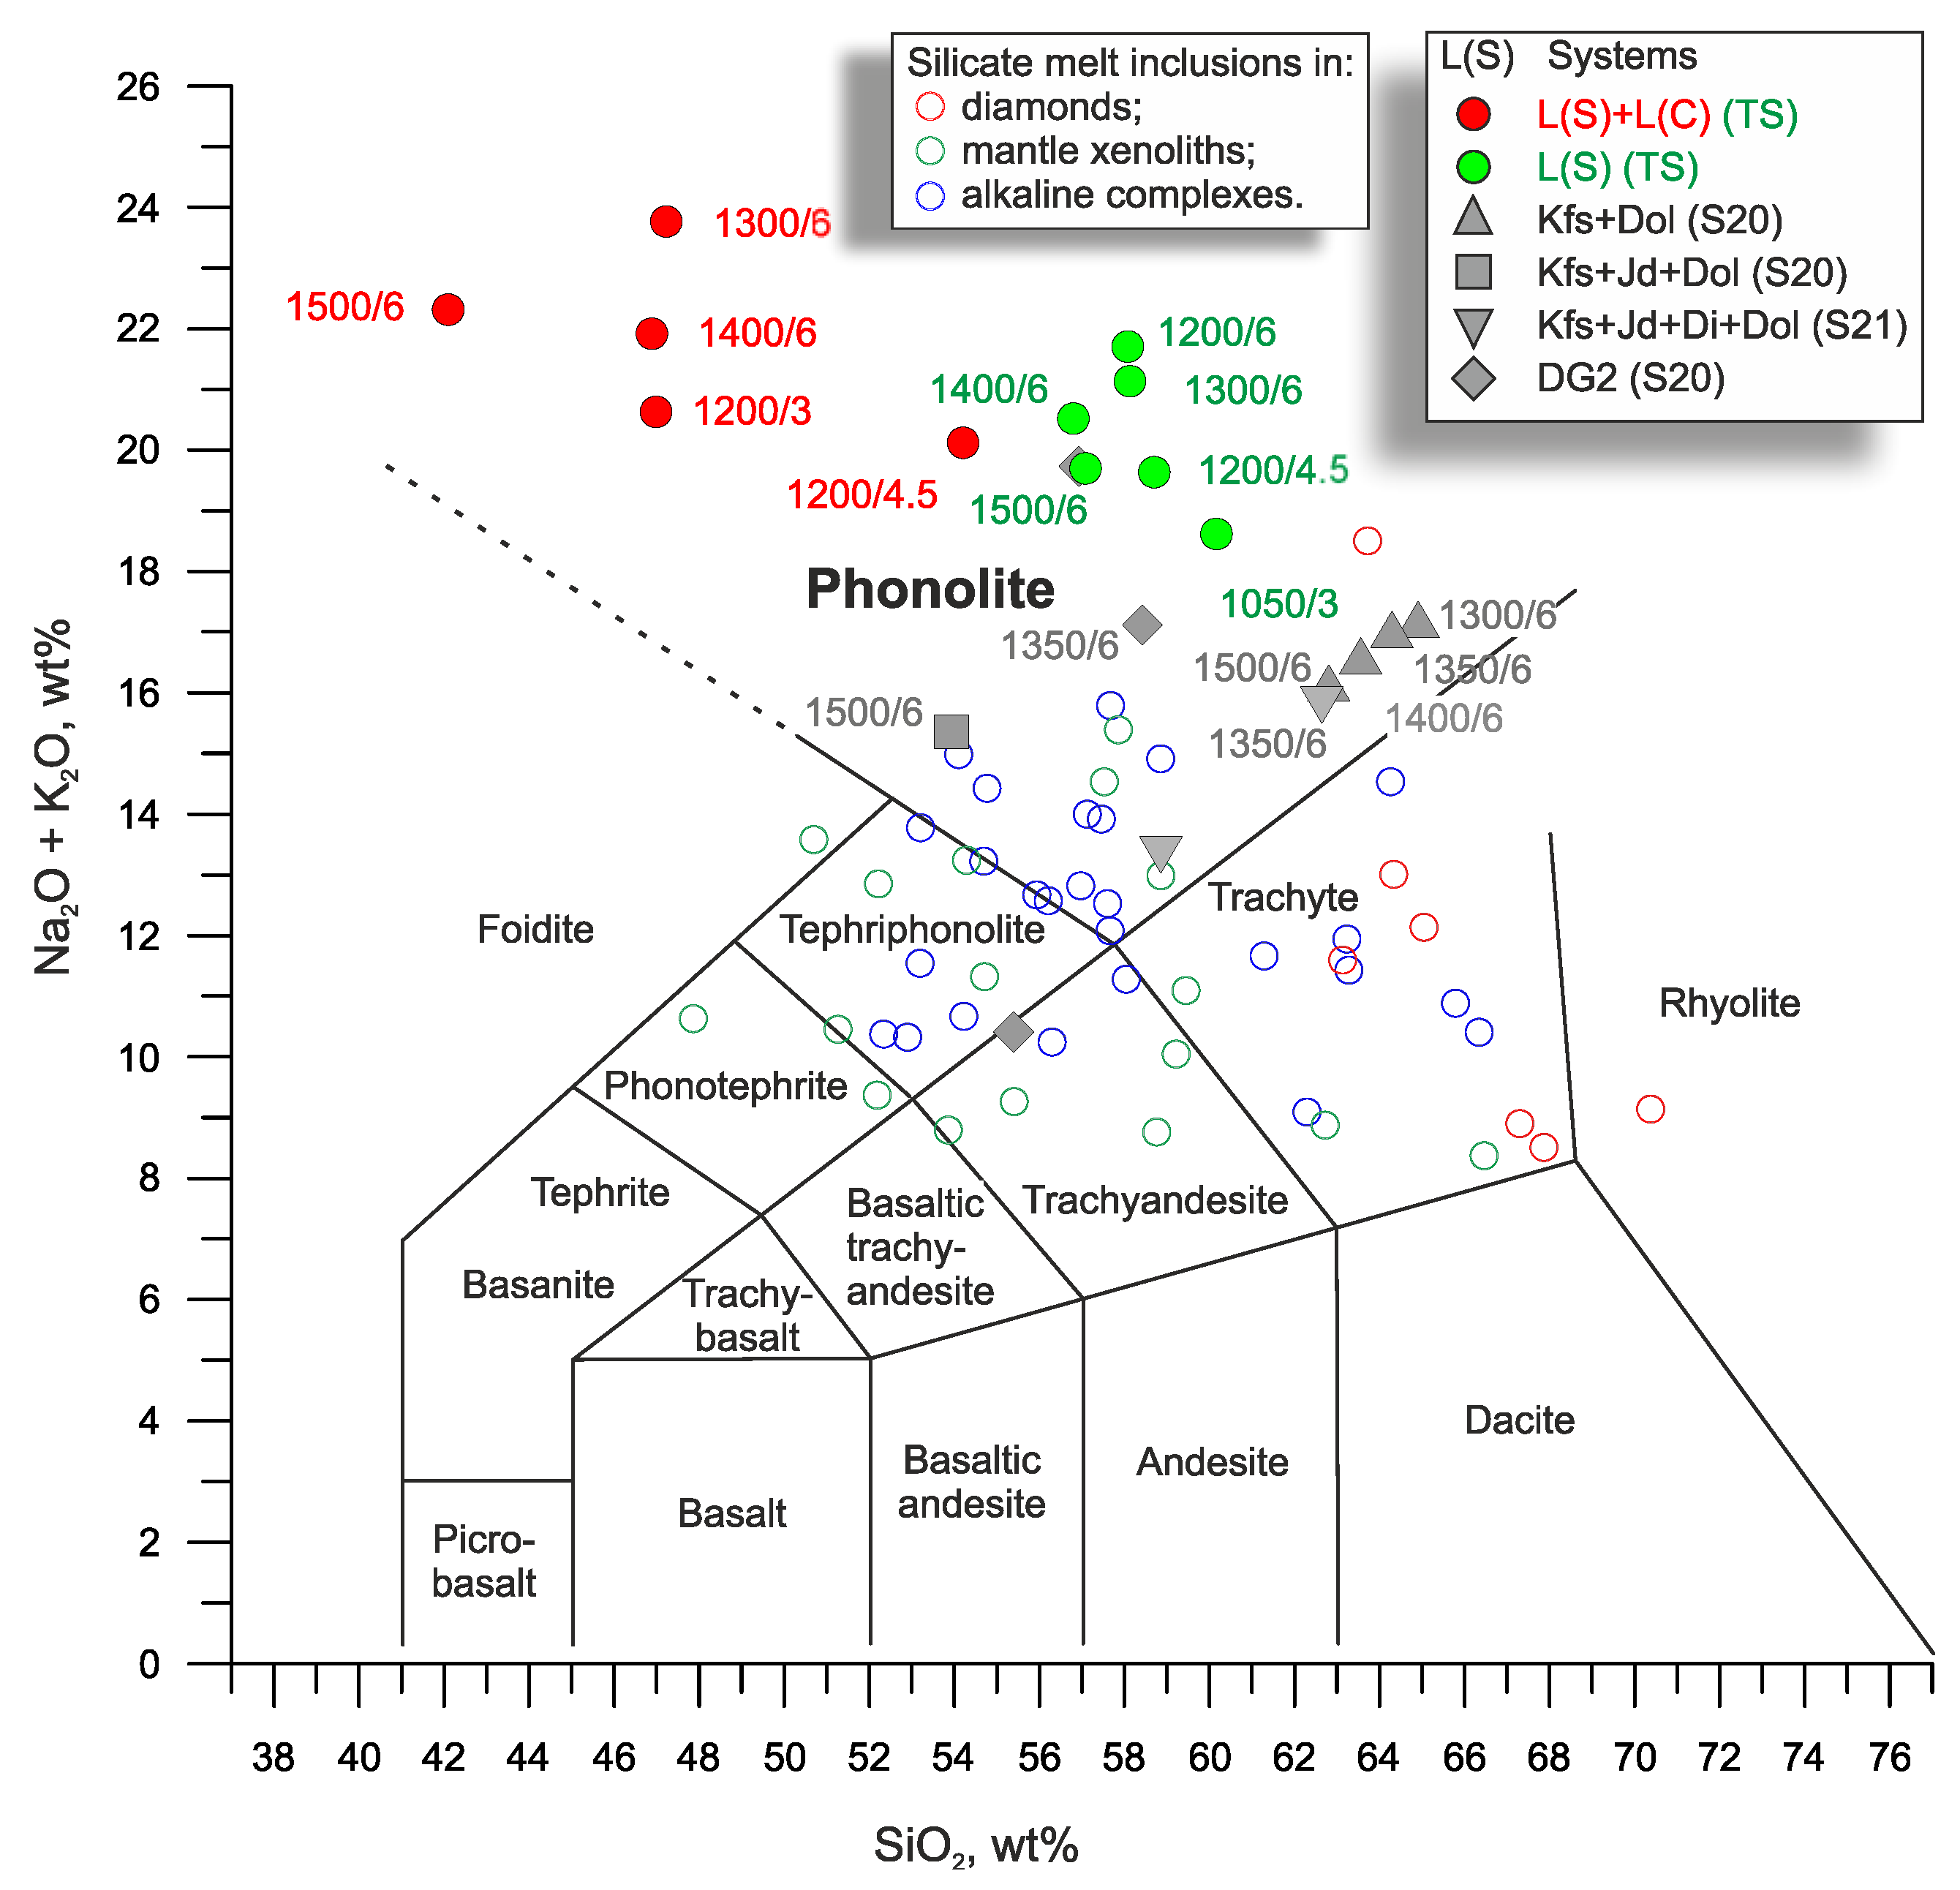
4.2. Comparison with Natural Data

Little is known about the nature of liquid immiscibility in potassium aluminosilicate systems. The task of the first approximation is to establish the area of this immiscibility, the features of the composition of protoliths, and the resulting melts over the entire range of depths where manifestations of this immiscibility occur. To address this problem, it seems important to compare the available natural and experimental data. Among the natural manifestations of the immiscibility of potassium aluminosilicate and carbonatite melts, alkaline carbonatite complexes, melt inclusions in spinel-facies mantle xenoliths, and melt inclusions in diamonds should be noted. These objects reflect the phenomenon of immiscibility between potassium aluminosilicate and carbonatite melts at depths varying from the crust to the base of the cratonic mantle. Below, we compare these natural observations with our experimental data.

4.2.1. K-Alkaline Carbonatite Complexes

In many K-alkaline complexes, silicate and silicate-carbonate magma layering take place [60,61,81,82,83,84]. The complexes contain paragenetic associations of carbonatites and K-alkaline silicate rocks such as ultramafic lamprophyres [85,86,87,88,89,90]. Alkaline silica-undersaturated rocks and carbonatites have similar ages and similar geochemical characteristics [81]. Textural and compositional criteria, melt inclusions, geochemical, and isotopic data show that the complexes are formed by the liquid immiscibility of a carbonate-saturated parental silicate melt [81,82,83].
Reconstruction of the initial composition of immiscible carbonatite and aluminosilicate melts is complicated by serious post magmatic changes, including the recrystallization of silicate melts and their inclusions as well as the removal of alkalis, REE, and Nb with alkali-rich aqueous fluids that metasomatize the surrounding country rocks, forming fenites [91,92,93,94,95]. One of the most important sources of information on the primary composition of immiscible ultrapotassic melts are melt inclusions in magmatic minerals.
Silicate glasses were found in inclusions in diopsides and apatites from lamprophyres of the alkaline ultrabasic carbonatite complex of the Tomtor massif, Russia [60]. The core of the massif consists of carbonatites, surrounded by a discontinuous ring of ultramafic rocks and foidolites [96]. The mineralization of carbonatites varies from dolomite-ankerite, dolomite-siderite, and calcite-ankerite (late) to dolomite-calcite and calcite (early) [60]. The Tomtor massif was formed between 800 and240 Ma [97]. It is thought that the last episode developed under the influence of the Vilyui plume in an environment of active rifting [98]. The potassic glasses in the inclusions contain (normalized to 100% on a volatile-free basis) 53–56 wt% SiO2 and 10–14 wt% K2O + Na2O and fall in the field of tephriphonolites and phonolites on the TAS diagram (Figure 14). Measured compositions of K-glasses contain 50–53 wt% SiO2, 1–2 wt% TiO2, 15–18 wt% Al2O3, 3–7 wt% FeO, 1–2 wt% MgO, 2–8 wt% CaO, 3–7 wt% Na2O, and 4–10 wt% K2O [60]. The total deficit of microprobe analyses is up to 9 wt%, and the presence of a gas phase in heated inclusions may indicate the presence of CO2. The K2O/Na2O weight ratio of K-glasses varies from 0.6 to 3.4, which approaches this ratio in the glasses obtained in our experiment at 3 GPa and 1050 °C (K2O/Na2O = 3) (Figure 19b). The glasses from the inclusions coincide within 1–2 wt% with the silicate melt obtained at 3 GPa and 1050 °C in the content of SiO2, FeO, MgO, Na2O, and K2O and the total deficit (presumably CO2), but are richer in Al2O3 (15–18 vs. 6 wt%) and CaO (2–8 vs. 2 wt%) but depleted in TiO2 (1–2 vs. 6 wt%) (Figure 15, Table 8). It is interesting to note that the Cpx-containing K-glass inclusions are similar in Na2O ~1 wt% and MgO 11–13 wt% to the ones in our experiment at 3 GPa (Figure 10, Table 4). These pyroxenes contain 1–3 wt% TiO2, similar to the pyroxenes obtained in our experiments at 3 GPa and containing 1–6 wt% TiO2 (Figure 10a; Table 4). In addition to K-glass, diopside contains the inclusions Kfs, mica, and calcite. Kfs contains 0.3–0.9 wt% Na2O, which is comparable to that in the experimental Kfs, 0.3–0.7 wt% Na2O (Tables S1 and S5). Mica has a lower Mg# (23–44 vs. 61–67) and contains up to 3 wt% TiO2 vs. 11 wt% in our experiments at 3 GPa (Table S8).
Recently, Berndt and Klemme [59] presented results from a study of hauyne-hosted conjugate silicate–carbonate melt inclusions from the phonolitic Laacher See volcano (13,006 ± 9 years BP), located in the alkaline continental intraplate East Eifel Volcanic Field, Germany. The phonolitic glass contains 55–57 wt% SiO2, ≤1 wt% TiO2, 20 wt% Al2O3, 2 wt% FeO, 0.3–0.6 wt% MgO, 0.4–0.7 wt% CaO, 6 wt% Na2O, 8–9 wt% K2O, and has a K2O/Na2O weight ratio of 1.4–1.6. A melt with similar contents of FeO (4 wt%), MgO (2 wt%), CaO (2 wt%), Na2O (4 wt%), and K2O (12 wt%) was obtained in our experiment at 3 GPa and 1050 °C. However, unlike the natural ones, it has higher TiO2 (1–6 wt%), lower Al2O3 (6 wt%), and a weight ratio of K2O/Na2O = 3 (Table 8). The conjugate carbonatite melt inclusions are enriched in CaO (47–51 wt%), SiO2 (15 wt%), and less alkaline (4 wt% Na2O, 0.5–0.7 K2O). In contrast, the carbonate melts in our work contain less CaO (≤24 wt%) and SiO2 (≤10 wt%) and incomparably more K2O (up to 37 wt%) (Figure 12, Table 6).

4.2.2. Mantle Xenoliths

Yaxley et al. [58] observed glass patches in carbonate-bearing spinel peridotite xenoliths from Western Victoria, Australia. Glass compositions vary over a wide range: 47–72 wt% SiO2, 16–25 wt% Al2O3, 1–12 wt% Na2O, 1.2–6.4 wt% K2O, and 0.1–2.9 wt% TiO2. Some of them fall into the field of phonolites and tefriphonolites on the TAS diagram (Figure 14). Recently, Loges et al. [57] described inclusions of tephriphonolitic glass and Ca-Mg-Fe carbonates (presumably former carbonate melt) in ultramafic xenoliths from a basanite from Spitzberg, Cotta, Germany. The silicate glass contains 55–56 wt% SiO2, 20 wt% Al2O3, ≤1 wt% TiO2, 3–4 wt% FeO, ≤1 wt% MgO, 1–2 wt% CaO, 7–9 wt% Na2O, and 5 wt% K2O. The low K2O/Na2O ratios in the glasses are consistent with the shallow formation depths of these xenoliths.

4.2.3. Melt Inclusions in Diamonds

Silicic melt micro inclusions in diamonds from kimberlites and placers around the world fall in the range of 37–60 wt% SiO2, 5–17 wt% Al2O3, 0.6–5 wt% TiO2, 1–18 wt% FeO, 0.8–20 wt% CaO, 0.2–17 wt% MgO, 0.6–10 wt% Na2O, and 1–23 wt% K2O [54,98,99,100,101,102]. Some of them contain inclusions of Kfs, rutile, and eclogitic minerals and fall into the range of phonolites and trachytes on the TAS diagram [53,54,56,99] (Figure 14). Novgorodov et al. [54] found ultrapotassic aluminosilicate inclusions in a diamond from the Mir pipe. The diamond also contains inclusions of Kfs, Rt, Coe, and Gr. The glass contains 61 wt% SiO2, 15 wt% Al2O3, 2 wt% TiO2, 2 wt% Na2O, and 16 wt% K2O, with a total deficit of 4 wt%. The K2O/Na2O weight ratio of nine falls in the range observed in the present experiments at 4.5 and 6 Γ∏a (Figure 19b). Trachyandesite glass + omphacite + rutile inclusions were found in two alluvial diamonds from the Kholomolokh placer, northeastern Siberian Platform [56]. The glasses contain 60–61 wt% SiO2, 1 wt% TiO2, 20 wt% Al2O3, 2 wt% FeO, 1 wt% MgO, 1 wt% CaO, 5–7 wt% Na2O, and 5 wt% K2O, and have a K2O/Na2O weight ratio of 0.6–1. The glasses are similar in composition to the phonolite melts obtained by us but have a lower K2O/Na2O ratio. In terms of the (SiO2 + Al2O3 + TiO2):(CaO + MgO + FeO + MnO):(K2O + Na2O) ratio, the conjugate phonolite and carbonate melts established in our experiments fall in the range of silicic and carbonatitic micro inclusions in diamonds from kimberlites and placers worldwide (Figure 20).
The abundant precipitation of graphite flakes in carbonate melt and their minor amount in silicate glass indicate the limited ability of silicate melt to dissolve and transport elementary carbon. This is in agreement with a failed attempt to dissolve graphite and grow diamond in the molten KAlSi3O8, even at 7 GPa, 1700–1750 °C, and a run duration of 18 h [100].
The problem of crystallization of natural diamonds is beyond the scope of this work, so here we only note that diamonds with a fibrous internal structure [101,102,103,104] and some monocrystalline diamonds [54,99,105] contain alkaline K-rich inclusions of melts or so-called high-density fluids (HDFs) [106] varying in composition from silicate [99] to carbonate [100] and chloride [107]. The compositions of these inclusions were recently reviewed by Weiss et al. [108], and the effect of the composition of those HDFs has been experimentally studied [109,110,111] and discussed in the review by Luth et al. [112].

4.3. P-T-X Region of Carbonate-Silicate Immiscibility

The present experiments show that carbonate-silicate liquid immiscibility can be realized not only in the conditions of the crust and shallow mantle but also at depths of 100–200 km (Figure 17). It was previously shown that immiscibility between natroaluminosilicate (nephelinite) and Na-Ca carbonate (natrocarbonatite) melts occurs at depths of <100 km (<3 GPa) [4,5,113,114]. With increasing depth, pressure-induced freezing of the silicate melt occurs owing to the stabilization of refractory jadeite. This is probably why carbonate-silicate immiscibility has not been established in natroaluminosilicate systems at pressures of 3–6 GPa [7,8]. In aluminosilicate systems, under nominally anhydrous conditions, potassium is concentrated in the Kfs. According to the data obtained, in the presence of a carbonate melt, Kfs enters a silicate melt at relatively moderate temperatures, 1200 °C at 6 GPa (Figure 17b). The addition of water lowers the appearance temperature of the silicate melt to lower temperatures, which leads to the simultaneous formation of carbonate and silicate melts [16,17]. The experimentally obtained silicate (phonolitic) and ultrapotassic dolomite (low-magnesian carbonatite) melts resemble inclusions in natural diamonds from kimberlites and placers around the world [108]. Like natural diamonds, the K2O/Na2O weight ratio in these melts exceeds 20. A decrease in pressure is accompanied by a decrease in sodium compatibility with Cpx, which leads to a decrease in the K2O/Na2O ratio to 1–3, which coincides with those in phonolitic glasses from spinel-facies xenoliths.
It has been experimentally shown [16,19] that potassic dolomite and phonolite melts can be formed during partial melting of carbonate-bearing material of the continental crust (carbonated metapelites) subducted to a depth of 120–180 km as part of sediments overlying oceanic slabs or in the form of blocks of continental crust during the collision of continents.
Our previous results indicate that the CO2-bearing phonolite melt, derived by the partial melting of carbonated pelite, reacts with peridotite according to the following reaction [115]:
2[K2O + 5SiO2 + Al2O3 + CO2] (L(S)) + 10Mg2SiO4 (Ol) = 2K2CO3 (L(C)) + 7Mg2Si2O6 (Opx) + 2Mg3Al2Si3O12 (Prp).
Reaction (6) increases the SiO2 and Al2O3 contents in the peridotite, decreases olivine, and increases orthopyroxene and Grt contents. Considering similar CO2-bearing trachyandesitic-phonolitic compositions of siliceous melt, derived by partial melting of carbonated K-bearing altered mid-ocean ridge basalts [116], this melt would also react with peridotite according to reaction (6). Unlike the siliceous melt, the carbonate melt remains in coexistence with Grt lherzolite. However, its composition evolves from low-Mg to high-Mg [115].
Thus, low-Mg ultrapotassic carbonatite and potassium phonolitic melts are not stable in the ultramafic mantle, and their emplacement into peridotites is accompanied by the disappearance of the phonolitic melt and the transformation of the ultrapotassic low-Mg (Ca# > 35) carbonatite melt into a high-Mg (Ca# < 35). These data are in good agreement with experiments on the melting of potassium-carbonated peridotite and phlogopite-bearing carbonated peridotite. According to these data, the partial melting of these systems at 6 GPa is accompanied by the formation of an ultrapotassic, high-Mg carbonatite melt.
In contrast, according to the obtained data at 4.5–6 GPa, conjugate potassium phonolitic and low-Mg carbonatitic melts are stable with eclogites of Groups B and C according to the classification of Taylor and Neal [41] (Figure 11). In our experiments at 3 GPa, garnet is absent. The lack of multiphase saturation in our experiments may indicate that the immiscible, K-rich aluminosilicate and carbonate melts cannot be in equilibrium with eclogites. However, in water-bearing carbonated pelites, silicate and carbonate immiscible melts were established in equilibrium with both Grt and Cpx at 3.5 and 5 GPa and 1100 °C, while at 2.5–4 GPa the carbonate melt disappears while the potassium aluminosilicate melt continues to coexist with garnet and clinopyroxene [19,20] (see Figure 1a,b in [16]), the same as at 3 GPa under dry conditions [23] (Figure 1). Possibly, with decreasing pressure, the low-Mg potassium carbonate melt reacts with garnet. Under conditions of excess garnet, this leads to the disappearance of the carbonate melt, as occurs in the carbonated pelite system. Unlike that, when excess carbonate melts in our experiments, garnet disappears. This may indicate the instability of the carbonate melt conjugated with the potassium aluminosilicate melt in eclogite in the shallow mantle.
However, Thomsen and Schmidt [19] reported the formation of immiscible Na-bearing but K-poor carbonatite and K-rich phonolite melts coexisting with Cpx + Grt + Ky in the system of carbonated pelite at 3.7 GPa and 1100 °C. Kiseeva et al. [116] observed the formation of immiscible K-rich trachyandesite and less alkaline potassic carbonatite melts in equilibrium with garnet and clinopyroxene in the carbonated eclogite system at 3.5 GPa and 1100 °C. It is likely that in eclogite, under the pressures of the shallow mantle, the carbonate melt conjugated with the potassium aluminosilicate melt evolves towards a less potassium one, since the latter, being coupled with alumina and silica from garnet, enters the silicate melt. The latter, however, requires further study.

5. Conclusions

The immiscibility gap between K-rich dolomite-ankerite and CO2-bearing phonolite melts was established above 1050 °C at 3 GPa and 1200 °C at 6 GPa. The mutual solubility of the melts does not exceed 10% even as temperatures increase to 1200 °C at 3 GPa and 1500 °C at 6 GPa. The conjugate melts coexist with garnet Prp24–30Alm30–36Grs38–44 and omphacite, which correspond to eclogites Groups B and C. As pressure decreases from 6 to 3 GPa, the K2O/Na2O weight ratio in the immiscible melts decreases from that corresponding to carbonatitic and silicic micro inclusions in diamonds from kimberlites and placers worldwide to that approaching phonolite glasses in carbonated spinel peridotite xenoliths.

Supplementary Materials

The following supporting information can be downloaded at: https://www.mdpi.com/article/10.3390/min13030443/s1. Table S1: Summary of run conditions, composition of phases (in mol% and wt%), and mole/weight fraction of phases (MFP/WFP) in the system L(S) + L(C) at 3.0, 4.5, and 6.0 GPa; Table S2: Calculations of mole fraction of phases (MFP) in the experiments in the system L(S) + L(C); Table S3: Calculations of weight fraction of phases (WFP) in the experiments in the system L(S) + L(C); Table S4: Compositions of carbonate and silicate that melt in the system L(S) + L(C); Table S5: Summary of run conditions, composition of phases (in mol% and wt%), and mole/weight fraction of phases (MFP/WFP) in the system L(S); Table S6: Calculations of mole fraction of phases (MFP) in the experiments in the system L(S); Table S7: Calculations of weight fraction of phases (WFP) in the experiments in the system L(S); Table S8: Summary of run conditions and compositions of Cpx, Grt, Wad, Rt, and Phl (in mol% and wt%) in the systems L(S) + L(C) and L(S); Table S9: Compositions of carbonate and silicate melts in the system L(S).

Author Contributions

Conceptualization, A.S.; methodology, A.S. and K.D.L.; formal analysis, A.B., and A.S.; investigation, A.V.A., resources, A.V.A., K.D.L.; data curation, A.V.A. and A.B.; writing—original draft preparation, A.V.A. and A.S.; writing—review and editing, A.S.; visualization, A.V.A. and A.S.; supervision, A.S.; project administration, A.S.; funding acquisition, A.V.A. All authors have read and agreed to the published version of the manuscript.

Funding

This research was funded by the Russian Science Foundation (project No 21-77-10057).

Data Availability Statement

MDPI Research Data Policies at https://www.mdpi.com/ethics (accessed on 1 February 2023).

Acknowledgments

We are grateful to A.G. Sokol and two anonymous referees for their constructive reviews; N.S. Karmanov, A.T. Titov, and M.V. Khlestov for assistance in the analytical works; and I.R. Prokopyev for discussion.

Conflicts of Interest

The authors declare no conflict of interest.

Abbreviations

AlmalmandineKfspotassium feldspar
AnkankeriteKykyanite
ArgaragoniteL(C)carbonate melt
CalcalciteL(S)aluminosilicate melt
CoecoesiteMgsmagnesite
CpxclinopyroxeneQzquartz
CrncorundumPhlphlogopite
DiadiamondPrppyrope
DoldolomiteRtrutile
F(CO2)CO2 fluidWadK2SiSi3O9 or K2TiSi3O9 wadeite
GrgraphiteCa# = Ca/(Ca + Mg + Fe) × 100 mol%
GrtgarnetMg# = Mg/(Mg + Fe) × 100 mol%

References

  1. Van Groos, A.F.K.; Wyllie, P.J. Experimental data bearing on the role of liquid immiscibility in the genesis of carbonatites. Nature 1963, 199, 801–802. [Google Scholar] [CrossRef]
  2. Lee, W.-J.; Wyllie, P.J. Experimental data bearing on liquid immiscibility, crystal fractionation, and the origin of calciocarbonatites and natrocarbonatites. Int. Geol. Rev. 1994, 36, 797–819. [Google Scholar] [CrossRef]
  3. Lee, W.J.; Wyllie, P.J. Liquid immiscibility between nephelinite and carbonatite from 1.0 to 2.5 GPa compared with mantle melt compositions. Contrib. Mineral. Petrol. 1997, 127, 1–16. [Google Scholar] [CrossRef]
  4. Brooker, R.A. The effect of CO2 saturation on immiscibility between silicate and carbonate liquids: An experimental study. J. Petrol. 1998, 39, 1905–1915. [Google Scholar] [CrossRef] [Green Version]
  5. Brooker, R.A.; Kjarsgaard, B.A. Silicate-carbonate liquid immiscibility and phase relations in the system SiO2-Na2O-Al2O3-CaO-CO2 at 0.1-2.5 GPa with applications to carbonatite genesis. J. Petrol. 2011, 52, 1281–1305. [Google Scholar] [CrossRef]
  6. Kjarsgaard, B. Phase relations of a carbonated high-CaO nephelinite at 0.2 and 0.5 GPa. J. Petrol. 1998, 39, 2061–2075. [Google Scholar] [CrossRef]
  7. Shatskiy, A.; Podborodnikov, I.V.; Arefiev, A.V.; Bekhtenova, A.; Vinogradova, Y.G.; Stepanov, K.M.; Litasov, K.D. Pyroxene-carbonate reactions in the CaMgSi2O6 ± NaAlSi2O6 + MgCO3 ± Na2CO3 ± K2CO3 system at 3-6 GPa: Implications for partial melting of carbonated peridotite. Contrib. Mineral. Petrol. 2021, 176, 34. [Google Scholar] [CrossRef]
  8. Shatskiy, A.; Podborodnikov, I.V.; Arefiev, A.V.; Litasov, K.D.; Chanyshev, A.D.; Sharygin, I.S.; Karmanov, N.S.; Ohtani, E. Effect of alkalis on the reaction of clinopyroxene with Mg-carbonate at 6 GPa: Implications for partial melting of carbonated lherzolite. Am. Mineral. 2017, 102, 1934–1946. [Google Scholar] [CrossRef]
  9. Shatskiy, A.; Bekhtenova, A.; Podborodnikov, I.V.; Arefiev, A.V.; Litasov, K.D. Carbonate melt interaction with natural eclogite at 6 GPa and 1100–1200 °C: Implications for metasomatic melt composition in subcontinental lithospheric mantle. Chem. Geol. 2020, 558, 119915. [Google Scholar] [CrossRef]
  10. Yaxley, G.M.; Brey, G.P. Phase relations of carbonate-bearing eclogite assemblages from 2.5 to 5.5 GPa: Implications for petrogenesis of carbonatites. Contrib. Mineral. Petrol. 2004, 146, 606–619. [Google Scholar] [CrossRef]
  11. Dasgupta, R.; Hirschmann, M.M.; Withers, A.C. Deep global cycling of carbon constrained by the solidus of anhydrous, carbonated eclogite under upper mantle conditions. Earth Planet. Sci. Lett. 2004, 227, 73–85. [Google Scholar] [CrossRef]
  12. Litasov, K.D.; Ohtani, E. The solidus of carbonated eclogite in the system CaO-Al2O3-MgO-SiO2-Na2O-CO2 to 32 GPa and carbonatite liquid in the deep mantle. Earth Planet. Sci. Lett. 2010, 295, 115–126. [Google Scholar] [CrossRef]
  13. Kamenetsky, V.S.; Yaxley, G.M. Carbonate–silicate liquid immiscibility in the mantle propels kimberlite magma ascent. Geochim. Cosmochim. Acta 2015, 158, 48–56. [Google Scholar] [CrossRef]
  14. Martin, L.H.; Schmidt, M.W.; Mattsson, H.B.; Ulmer, P.; Hametner, K.; Günther, D. Element partitioning between immiscible carbonatite–kamafugite melts with application to the Italian ultrapotassic suite. Chem. Geol. 2012, 320, 96–112. [Google Scholar] [CrossRef]
  15. Klein-BenDavid, O.; Izraeli, E.S.; Hauri, E.; Navon, O. Fluid inclusions in diamonds from the Diavik mine, Canada and the evolution of diamond-forming fluids. Geochim. Cosmochim. Acta 2007, 71, 723–744. [Google Scholar] [CrossRef]
  16. Shatskiy, A.; Arefiev, A.V.; Podborodnikov, I.V.; Litasov, K.D. Origin of K-rich diamond-forming immiscible melts and CO2 fluid via partial melting of carbonated pelites at a depth of 180–200 km. Gondwana Res. 2019, 75, 154–171. [Google Scholar] [CrossRef]
  17. Shatskiy, A.; Arefiev, A.V.; Podborodnikov, I.V.; Litasov, K.D. Effect of water on carbonate-silicate liquid immiscibility in the system KAlSi3O8–CaMgSi2O6–NaAlSi2O6–CaMg(CO3)2 at 6 GPa: Implications for diamond-forming melts. Am. Mineral. 2021, 106, 165–173. [Google Scholar] [CrossRef]
  18. Shatskiy, A.; Arefiev, A.V.; Podborodnikov, I.V.; Litasov, K.D. Liquid immiscibility and phase relations in the join KAlSi3O8–CaMg(CO3)2±NaAlSi2O6±Na2CO3 at 6 GPa: Implications for diamond-forming melts. Chem. Geol. 2020, 550, 119701. [Google Scholar] [CrossRef]
  19. Thomsen, T.B.; Schmidt, M.W. Melting of carbonated pelites at 2.5–5.0 GPa, silicate–carbonatite liquid immiscibility, and potassium–carbon metasomatism of the mantle. Earth Planet. Sci. Lett. 2008, 267, 17–31. [Google Scholar] [CrossRef]
  20. Tsuno, K.; Dasgupta, R.; Danielson, L.; Righter, K. Flux of carbonate melt from deeply subducted pelitic sediments: Geophysical and geochemical implications for the source of Central American volcanic arc. Geophys. Res. Lett. 2012, 39, L16307. [Google Scholar] [CrossRef] [Green Version]
  21. Grassi, D.; Schmidt, M.W. The melting of carbonated pelites from 70 to 700 km depth. J. Petrol. 2011, 52, 765–789. [Google Scholar] [CrossRef] [Green Version]
  22. Grassi, D.; Schmidt, M.W. Melting of carbonated pelites at 8–13 GPa: Generating K-rich carbonatites for mantle metasomatism. Contrib. Mineral. Petrol. 2011, 162, 169–191. [Google Scholar] [CrossRef] [Green Version]
  23. Tsuno, K.; Dasgupta, R. Melting phase relation of nominally anhydrous, carbonated pelitic-eclogite at 2.5–3.0 GPa and deep cycling of sedimentary carbon. Contrib. Mineral. Petrol. 2011, 161, 743–763. [Google Scholar] [CrossRef]
  24. Luth, R.W. Experimental determination of the reaction aragonite plus magnesite = dolomite at 5 to 9 GPa. Contrib. Mineral. Petrol. 2001, 141, 222–232. [Google Scholar] [CrossRef]
  25. Urakawa, S.; Kondo, T.; Igawa, N.; Shimomura, O.; Ohno, H. Synchrotron radiation study on the high-pressure and high-temperature phase relations of KAlSi3O8. Phys. Chem. Miner. 1994, 21, 387–391. [Google Scholar] [CrossRef]
  26. Yagi, A.; Suzuki, T.; Akaogi, M. High pressure transitions in the system KAlSi3O8-NaAlSi3O8. Phys. Chem. Miner. 1994, 21, 12–17. [Google Scholar] [CrossRef]
  27. Akaogi, M.; Kamii, N.; Kishi, A.; Kojitani, H. Calorimetric study on high-pressure transitions in KAlSi3O8. Phys. Chem. Miner. 2004, 31, 85–91. [Google Scholar] [CrossRef]
  28. Yong, W.; Dachs, E.; Withers, A.; Essene, E. Heat capacity and phase equilibria of hollandite polymorph of KAlSi3O8. Phys. Chem. Miner. 2006, 33, 167–177. [Google Scholar] [CrossRef]
  29. Osugi, J.; Shimizu, K.; Inoue, K.; Yasunami, K. A compact cubic anvil high pressure apparatus. Rev. Phys. Chem. Jpn. 1964, 34, 1–6. [Google Scholar]
  30. Shatskiy, A.; Litasov, K.D.; Terasaki, H.; Katsura, T.; Ohtani, E. Performance of semi-sintered ceramics as pressure-transmitting media up to 30 GPa. High Press. Res. 2010, 30, 443–450. [Google Scholar] [CrossRef]
  31. Shatskiy, A.; Podborodnikov, I.V.; Arefiev, A.V.; Minin, D.A.; Chanyshev, A.D.; Litasov, K.D. Revision of the CaCO3–MgCO3 phase diagram at 3 and 6 GPa. Am. Mineral. 2018, 103, 441–452. [Google Scholar] [CrossRef]
  32. Hemingway, B.S.; Bohlen, S.R.; Hankins, W.B.; Westrum, E.F.; Kuskov, O.L. Heat capacity and thermodynamic properties for coesite and jadeite, reexamination of the quartz-coesite equilibrium boundary. Am. Mineral. 1998, 83, 409–418. [Google Scholar] [CrossRef]
  33. Ono, S.; Kikegawa, T.; Higo, Y. In situ observation of a garnet/perovskite transition in CaGeO3. Phys. Chem. Miner. 2011, 38, 735–740. [Google Scholar] [CrossRef]
  34. Shatskiy, A.; Sharygin, I.S.; Gavryushkin, P.N.; Litasov, K.D.; Borzdov, Y.M.; Shcherbakova, A.V.; Higo, Y.; Funakoshi, K.-i.; Palyanov, Y.N.; Ohtani, E. The system K2CO3-MgCO3 at 6 GPa and 900–1450 °C. Am. Mineral. 2013, 98, 1593–1603. [Google Scholar] [CrossRef]
  35. Médard, E.; McCammon, C.A.; Barr, J.A.; Grove, T.L. Oxygen fugacity, temperature reproducibility, and H2O contents of nominally anhydrous piston-cylinder experiments using graphite capsules. Am. Mineral. 2008, 93, 1838–1844. [Google Scholar] [CrossRef]
  36. Lavrent’ev, Y.G.; Karmanov, N.S.; Usova, L.V. Electron probe microanalysis of minerals: Microanalyzer or scanning electron microscope? Russ. Geol. Geophys. 2015, 56, 1154–1161. [Google Scholar] [CrossRef]
  37. Chang, L.; Liu, X.; Wu, C.; Liu, X.; Li, G. Full and ideal mixing behavior between Zr–Wd (K2ZrSi3O9) and Ti–Wd (K2TiSi3O9): Evidences from mineral chemistry, X-ray diffraction pattern and Raman spectrum. Phys. Chem. Miner. 2015, 42, 223–234. [Google Scholar] [CrossRef]
  38. Mitchell, R.H. Melting experiments on a sanidine phlogopite lamproite at 4–7 GPa and their bearing on the sources of lamproitic magmas. J. Petrol. 1995, 36, 1455–1474. [Google Scholar] [CrossRef]
  39. Mitchell, R.H.; Steele, I. Potassian zirconium and titanium silicates and strontian cerian perovskite in lamproites from the Leucite Hills, Wyoming. Can. Mineral. 1992, 30, 1153–1159. [Google Scholar]
  40. Ullrich, A.; Miletich, R.; Balic-Zunic, T.; Olsen, L.; Nestola, F.; Wildner, M.; Ohashi, H. (Na, Ca)(Ti3+, Mg) Si2O6-clinopyroxenes at high pressure: Influence of cation substitution on elastic behavior and phase transition. Phys. Chem. Miner. 2010, 37, 25–43. [Google Scholar] [CrossRef]
  41. Taylor, L.A.; Neal, C.R. Eclogites with oceanic crustal and mantle signatures from the Bellsbank kimberlite, South Africa, Part I: Mineralogy, petrography, and whole rock chemistry. J. Geol. 1989, 97, 551–567. [Google Scholar] [CrossRef]
  42. Coleman, R.G.; Lee, D.E.; Beatty, L.B.; Brannock, W.W. Eclogites and eclogites: Their differences and similarities. Geol. Soc. Am. Bull. 1965, 76, 483–508. [Google Scholar] [CrossRef]
  43. Pabst, A. Synthesis, properties, and structure of K2Ca(CO3)2, buetschliite. Am. Mineral. 1974, 59, 353–358. [Google Scholar]
  44. Arefiev, A.V.; Shatskiy, A.; Podborodnikov, I.V.; Rashchenko, S.V.; Chanyshev, A.D.; Litasov, K.D. The system K2CO3-CaCO3 at 3 GPa: Link between phase relations and variety of K-Ca double carbonates at ≤ 0.1 and 6 GPa. Phys. Chem. Miner. 2019, 46, 229–244. [Google Scholar] [CrossRef]
  45. Arefiev, A.V.; Podborodnikov, I.V.; Shatskiy, A.F.; Litasov, K.D. Synthesis and Raman spectra of K-Ca double carbonates: K2Ca(CO3)2 bütschliite, fairchildite and K2Ca2(CO3)3 at 1 atm. Geochem. Int. 2019, 57, 981–987. [Google Scholar] [CrossRef]
  46. Perrin, J.; Vielzeuf, D.; Laporte, D.; Ricolleau, A.; Rossman, G.R.; Floquet, N. Raman characterization of synthetic magnesian calcites. Am. Mineral. 2016, 101, 2525–2538. [Google Scholar] [CrossRef]
  47. Schellart, W.P.; Stegman, D.R.; Farrington, R.J.; Moresi, L. Influence of lateral slab edge distance on plate velocity, trench velocity, and subduction partitioning. J. Geophys. Res. Solid Earth 2011, 116. [Google Scholar] [CrossRef] [Green Version]
  48. Arefiev, A.; Shatskiy, A.; Bekhtenova, A.; Litasov, K. Raman study of quench products of alkaline carbonate melt at 3 and 6 GPa: Link to the pressure of origin. J. Raman Spectrosc. 2022, 53, 2110–2122. [Google Scholar] [CrossRef]
  49. Buzgar, N.; Apopei, A.I. The Raman study of certain carbonates. An. Stiintifice Univ. AI Cuza Din Iasi. Sect. 2 Geol. 2009, 55, 97. [Google Scholar]
  50. Arefiev, A.V.; Shatskiy, A.; Podborodnikov, I.V.; Litasov, K.D. Melting and subsolidus phase relations in the system K2CO3-MgCO3 at 3 GPa. High Press. Res. 2018, 38, 422–439. [Google Scholar] [CrossRef]
  51. Le Bas, M.J.; Le Maitre, R.W.; Streckeisen, A.; Zanettin, B. A chemical classification of volcanic rocks based on the total alkali-silica diagram. J. Petrol. 1986, 27, 745–750. [Google Scholar] [CrossRef] [Green Version]
  52. Bulanova, G.P.; Pavlova, L.P. Magnesite peridotite assemblage in diamond from the Mir pipe. Dokl. Akad. Nauk SSSR 1987, 295, 1452–1456. [Google Scholar]
  53. Bulanova, G.P.; Argunov, K.P. K-feldspar inclusions in diamond crystal from the Mir kimberlite pipe. Dokl. Akad. Nauk SSSR 1985, 284, 953–956. [Google Scholar]
  54. Novgorodov, P.G.; Bulanova, G.P.; Pavlova, L.A.; Mikhailov, V.N.; Ugarov, V.V.; Shebanin, A.P.; Argunov, K.P. Inclusions of potassic phases, coesite and omphacite in the coated diamond crystal from the “Mir” pipe. In Doklady Earth Sciences; USSR Academy of Sciences: Moscow, Russian, 1990; pp. 439–443. [Google Scholar]
  55. Prinz, M.; Hlava, P.F.; Keil, K. Inclusions in diamonds: Garnet lherzolite and eclogite assemblages. In Physics and Chemistry of the Earth; Elsevier: Amsterdam, The Netherlands, 1975; Volume 9, pp. 797–815. [Google Scholar]
  56. Shatsky, V.; Zedgenizov, D.; Ragozin, A.; Kalinina, V. Silicate melt Inclusions in diamonds of eclogite paragenesis from placers on the Northeastern Siberian craton. Minerals 2019, 9, 412. [Google Scholar] [CrossRef] [Green Version]
  57. Loges, A.; Schultze, D.; Klügel, A.; Lucassen, F. Phonolitic melt production by carbonatite Mantle metasomatism: Evidence from Eger Graben xenoliths. Contrib. Mineral. Petrol. 2019, 174, 1–24. [Google Scholar] [CrossRef]
  58. Yaxley, G.M.; Kamenetsky, V.; Green, D.H.; Falloon, T.J. Glasses in mantle xenoliths from western Victoria, Australia, and their relevance to mantle processes. Earth Planet. Sci. Lett. 1997, 148, 433–446. [Google Scholar] [CrossRef]
  59. Berndt, J.; Klemme, S. Origin of carbonatites—Liquid immiscibility caught in the act. Nat. Commun. 2022, 13, 2892. [Google Scholar] [CrossRef]
  60. Panina, L.I.; Rokosova, E.Y.; Isakova, A.T.; Tolstov, A.V. Lamprophyres of the Tomtor Massif: A result of mixing between potassic and sodic alkaline mafic magmas. Petrology 2016, 24, 608–625. [Google Scholar] [CrossRef]
  61. Andreeva, I.A.; Kovalenko, V.I.; Naumov, V.B. Silicate-salt (sulfate) liquid immiscibility: A study of melt inclusions in minerals of the Mushugai-Khuduk carbonatite-bearing complex (southern Mongolia). Acta Petrol. Sin. 2007, 23, 73–82. [Google Scholar]
  62. Matson, D.W.; Sharma, S.K.; Philpotts, J.A. Raman spectra of some tectosilicates and of glasses along the orthoclase-anorthite and nepheline-anorthite joins. Am. Mineral. 1986, 71, 694–704. [Google Scholar]
  63. White, W.B. The carbonate minerals. In The Infrared Spectra of the Minerals, Mineralogical Society Monograph; Farmer, V.C., Ed.; Mineralogical Society: London, UK, 1974; pp. 227–284. [Google Scholar]
  64. Mysen, B.O.; Virgo, D. The solubility behavior of CO2 in melts on the join NaAlSi3O8-CaAl2Si2O8-CO2 at high pressure and temperature: A Raman spectroscopic study. Am. Mineral. 1980, 65, 1166–1175. [Google Scholar]
  65. Mysen, B.O.; Virgo, D. Solubility mechanisms of carbon-dioxide in silicate metals-a Raman-spectroscopic study. Am. Mineral. 1980, 65, 885–899. [Google Scholar]
  66. Fedoraeva, A.S.; Shatskiy, A.; Litasov, K.D. The join CaCO3-CaSiO3 at 6 GPa with implication to Ca-rich lithologies trapped by kimberlitic diamonds. High Press. Res. 2019, 39, 547–560. [Google Scholar] [CrossRef]
  67. Shatskiy, A.; Litasov, K.D.; Borzdov, Y.M.; Katsura, T.; Yamazaki, D.; Ohtani, E. Silicate diffusion in alkali-carbonatite and hydrous melts at 16.5 and 24 GPa: Implication for the melt transport by dissolution-precipitation in the transition zone and uppermost lower mantle. Phys. Earth Planet. Inter. 2013, 225, 1–11. [Google Scholar] [CrossRef]
  68. Hammouda, T.; Laporte, D. Ultrafast mantle impregnation by carbonatite melts. Geology 2000, 28, 283–285. [Google Scholar] [CrossRef]
  69. Ellis, D.J.; Green, D.H. An experimental study of the effect of Ca upon garnet-clinopyroxene Fe-Mg exchange equilibria. Contrib. Mineral. Petrol. 1979, 71, 13–22. [Google Scholar] [CrossRef]
  70. Krogh, E.J. The garnet-clinopyroxene Fe-Mg geothermometer-a reinterpretation of existing experimental data. Contrib. Mineral. Petrol. 1988, 99, 44–48. [Google Scholar] [CrossRef]
  71. Powell, R. Regression diagnostics and robust regression in geothermometer/geobarometer calibration: The garnet-clinopyroxene geothermometer revisited. J. Metamorph. Geol. 1985, 3, 231–243. [Google Scholar] [CrossRef]
  72. Krogh Ravna, E. The garnet–clinopyroxene Fe2+–Mg geothermometer: An updated calibration. J. Metamorph. Geol. 2000, 18, 211–219. [Google Scholar] [CrossRef] [Green Version]
  73. Arefiev, A.V.; Shatskiy, A.; Podborodnikov, I.V.; Litasov, K.D. The K2CO3–CaCO3–MgCO3 system at 6 GPa: Implications for diamond forming carbonatitic melts. Minerals 2019, 9, 558. [Google Scholar] [CrossRef] [Green Version]
  74. Arefiev, A.V.; Shatskiy, A.; Podborodnikov, I.V.; Behtenova, A.; Litasov, K.D. The system K2CO3–CaCO3–MgCO3 at 3 GPa: Implications for carbonatite melt compositions in the subcontinental lithospheric mantle. Minerals 2019, 9, 296. [Google Scholar] [CrossRef] [Green Version]
  75. Shatskiy, A.; Litasov, K.D.; Palyanov, Y.N.; Ohtani, E. Phase relations on the K2CO3-CaCO3-MgCO3 join at 6 GPa and 900–1400 ° C: Implications for incipient melting in carbonated mantle domains. Am. Mineral. 2016, 101, 437–447. [Google Scholar] [CrossRef]
  76. Hasterok, D.; Chapman, D.S. Heat production and geotherms for the continental lithosphere. Earth Planet. Sci. Lett. 2011, 307, 59–70. [Google Scholar] [CrossRef]
  77. Tappe, S.; Foley, S.F.; Stracke, A.; Romer, R.L.; Kjarsgaard, B.A.; Heaman, L.M.; Joyce, N. Craton reactivation on the Labrador Sea margins: 40Ar/39Ar age and Sr–Nd–Hf–Pb isotope constraints from alkaline and carbonatite intrusives. Earth Planet. Sci. Lett. 2007, 256, 433–454. [Google Scholar] [CrossRef]
  78. Bekhtenova, A.; Shatskiy, A.; Podborodnikov, I.V.; Arefiev, A.V.; Litasov, K.D. Phase relations in carbonate component of carbonatized eclogite and peridotite along subduction and continental geotherms. Gondwana Res. 2021, 94, 186–200. [Google Scholar] [CrossRef]
  79. Yaxley, G.M.; Green, D.H.; Kamenetsky, V. Carbonatite metasomatism in the southeastern Australian lithosphere. J. Petrol. 1998, 39, 1917–1930. [Google Scholar] [CrossRef]
  80. Katsura, T. A revised adiabatic temperature profile for the mantle. J. Geophys. Res. Solid Earth 2022, 127, e2021JB023562. [Google Scholar] [CrossRef]
  81. Vladykin, N.V. Potassium alkaline lamproite-carbonatite complexes: Petrology, genesis, and ore reserves. Russ. Geol. Geophys. 2009, 50, 1119–1128. [Google Scholar] [CrossRef]
  82. Doroshkevich, A.G.; Ripp, G.S.; Moore, K.R. Genesis of the Khaluta alkaline-basic Ba-Sr carbonatite complex (west Transbaikala, Russia). Mineral. Petrol. 2010, 98, 245–268. [Google Scholar] [CrossRef]
  83. Prokopyev, I.R.; Borisenko, A.S.; Borovikov, A.A.; Pavlova, G.G. Origin of REE-rich ferrocarbonatites in southern Siberia (Russia): Implications based on melt and fluid inclusions. Mineral. Petrol. 2016, 110, 845–859. [Google Scholar] [CrossRef]
  84. Nosova, A.A.; Sazonova, L.V.; Kargin, A.V.; Dubinina, E.O.; Minervina, E.A. Mineralogy and geochemistry of ocelli in the damtjernite dykes and sills, Chadobets Uplift, Siberian Craton: Evidence of the fluid–lamprophyric magma interaction. Minerals 2021, 11, 724. [Google Scholar] [CrossRef]
  85. Doroshkevich, A.G.; Sharygin, V.V.; Belousova, E.A.; Izbrodin, I.A.; Prokopyev, I.R. Zircon from the Chuktukon alkaline ultramafic carbonatite complex (Chadobets uplift, Siberian craton) as evidence of source heterogeneity. Lithos 2021, 382, 105957. [Google Scholar] [CrossRef]
  86. Doroshkevich, A.; Prokopyev, I.; Kruk, M.; Sharygin, V.; Izbrodin, I.; Starikova, A.; Ponomarchuk, A.; Izokh, A.; Nugumanova, Y. Age and petrogenesis of ultramafic lamprophyres of the Arbarastakh alkaline-carbonatite complex, Aldan-Stanovoy shield, South of Siberian Craton (Russia): Evidence for ultramafic lamprophyre-carbonatite link. J. Petrol. 2022, 63, egac073. [Google Scholar] [CrossRef]
  87. Nosova, A.A.; Kargin, A.V.; Sazonova, L.V.; Dubinina, E.O.; Chugaev, A.V.; Lebedeva, N.M.; Yudin, D.S.; Larionova, Y.O.; Abersteiner, A.; Gareev, B.I. Sr-Nd-Pb isotopic systematic and geochronology of ultramafic alkaline magmatism of the southwestern margin of the Siberian Craton: Metasomatism of the sub-continental lithospheric mantle related to subduction and plume events. Lithos 2020, 364, 105509. [Google Scholar] [CrossRef]
  88. Nosova, A.A.; Kopylova, M.G.; Sazonova, L.V.; Vozniak, A.A.; Kargin, A.V.; Lebedeva, N.M.; Volkova, G.D.; Peresetskaya, E.V. Petrology of lamprophyre dykes in the Kola Alkaline Carbonatite Province (N Europe). Lithos 2021, 398, 106277. [Google Scholar] [CrossRef]
  89. Prokopyev, I.R.; Doroshkevich, A.G.; Starikova, A.E.; Yang, Y.; Goryunova, V.O.; Tomoshevich, N.A.; Proskurnin, V.F.; Saltanov, V.A.; Kukharenko, E.A. Geochronological and petrogenetical constraints on F-Ba-REE carbonatites of the Central Taimyr Region, Russia (Arctica): Connections with the Siberian large Igneous Province (LIP). Lithos 2023, 440–441, 107045. [Google Scholar] [CrossRef]
  90. Vichi, G.; Perna, M.G.; Ambrosio, F.; Rosatelli, G.; Cirillo, D.; Broom-Fendley, S.; Vladykin, N.V.; Zaccaria, D.; Stoppa, F. La Queglia carbonatitic melnöite: A notable example of an ultra-alkaline rock variant in Italy. Mineral. Petrol. 2022. [Google Scholar] [CrossRef]
  91. Elliott, H.A.L.; Wall, F.; Chakhmouradian, A.R.; Siegfried, P.R.; Dahlgren, S.; Weatherley, S.; Finch, A.A.; Marks, M.A.W.; Dowman, E.; Deady, E. Fenites associated with carbonatite complexes: A review. Ore Geol. Rev. 2018, 93, 38–59. [Google Scholar] [CrossRef]
  92. Gittins, J.; Allen, C.R.; Cooper, A.F. Phlogopitization of pyroxenite; its bearing on the composition of carbonatite magmas. Geol. Mag. 1975, 112, 503–507. [Google Scholar] [CrossRef]
  93. Cooper, A.F. Petrology and petrogenesis of an intraplate alkaline lamprophyre-phonolite-carbonatite association in the Alpine Dyke Swarm, New Zealand. N. Z. J. Geol. Geophys. 2020, 63, 469–488. [Google Scholar] [CrossRef]
  94. Dobretsov, N.L.; Lazareva, E.V.; Zhmodik, S.M.; Ponomarchuk, V.A.; Travin, A.V.; Myagkaya, I.N.; Tolstov, A.V.; Karmanov, N.S. Ultrapotassic Rock from the Tomtor Complex of Ultrabasic Alkaline Rocks and Carbonatites (Arctic Siberia). In Doklady Earth Sciences; Pleiades Publishing: New York, NY, USA, 2021; pp. 884–887. [Google Scholar]
  95. Kozlov, E.N.; Arzamastsev, A.A. Petrogenesis of metasomatic rocks in the fenitized zones of the Ozernaya Varaka alkaline ultrabasic complex, Kola Peninsula. Petrology 2015, 23, 45–67. [Google Scholar] [CrossRef]
  96. Lazareva, E.V.; Zhmodik, S.M.; Dobretsov, N.L.; Tolstov, A.V.; Shcherbov, B.L.; Karmanov, N.S.; Gerasimov, E.Y.; Bryanskaya, A.V. Main minerals of abnormally high-grade ores of the Tomtor deposit (Arctic Siberia). Russ. Geol. Geophys. 2015, 56, 844–873. [Google Scholar] [CrossRef]
  97. Entin, A.R.; Zaitsev, A.I.; Nenashev, N.I.; Vasilenko, V.B.; Orlov, A.N.; Tyan, O.A.; Ol’khovik, Y.A.; Ol’shtynskii, S.P.; Tolstov, A.V. Sequence of geological events related to the intrusion of the Tomtor massif of ultrabasic alkaline rocks and carbonatites (northwestern Yakutia). Geol. I Geofiz. (Sov. Geol. Geophys.) 1990, 31, 42–50. [Google Scholar]
  98. Kiselev, A.I.; Ernst, R.E.; Yarmolyuk, V.V.; Egorov, K.N. Radiating rifts and dyke swarms of the middle Paleozoic Yakutsk plume of eastern Siberian craton. J. Asian Earth Sci. 2012, 45, 1–16. [Google Scholar] [CrossRef]
  99. Bulanova, G.P.; Novgorodov, P.G.; Pavlova, L.A. The first find of a melt inclusion in diamond from the Mir pipe. Geokhimia 1988, 756–765. (In Russian) [Google Scholar]
  100. Borzdov, Y.M.; Sokol, A.G.; Pal’yanov, Y.N.; Kalinin, A.A.; Sobolev, N.V. Studies of diamond crystallization in alkaline silicate, carbonate and carbonate-silicate melts. Dokl. Akad. Nauk 1999, 366, 530–533. (In Russian) [Google Scholar]
  101. Navon, O.; Hutcheon, I.; Rossman, G.; Wasserburg, G. Mantle-derived fluids in diamond micro-inclusions. Nature 1988, 335, 784–789. [Google Scholar] [CrossRef]
  102. Zedgenizov, D.A.; Ragozin, A.L.; Shatsky, V.S.; Araujo, D.; Griffin, W.L.; Kagi, H. Mg and Fe-rich carbonate-silicate high-density fluids in cuboid diamonds from the Internationalnaya kimberlite pipe (Yakutia). Lithos 2009, 112, 638–647. [Google Scholar] [CrossRef]
  103. Schrauder, M.; Navon, O. Hydrous and carbonatitic mantle fluids in fibrous diamonds from Jwaneng, Botswana. Geochim. Cosmochim. Acta 1994, 58, 761–771. [Google Scholar] [CrossRef]
  104. Zedgenizov, D.A.; Ragozin, A.L.; Shatsky, V.S.; Griffin, W.L. Diamond formation during metasomatism of mantle eclogite by chloride-carbonate melt. Contrib. Mineral. Petrol. 2018, 173, 84. [Google Scholar] [CrossRef]
  105. Jablon, B.M.; Navon, O. Most diamonds were created equal. Earth Planet. Sci. Lett. 2016, 443, 41–47. [Google Scholar] [CrossRef]
  106. Klein-BenDavid, O.; Logvinova, A.M.; Schrauder, M.; Spetius, Z.V.; Weiss, Y.; Hauri, E.H.; Kaminsky, F.V.; Sobolev, N.V.; Navon, O. High-Mg carbonatitic microinclusions in some Yakutian diamonds-a new type of diamond-forming fluid. Lithos 2009, 112, 648–659. [Google Scholar] [CrossRef]
  107. Izraeli, E.S.; Harris, J.W.; Navon, O. Brine inclusions in diamonds: A new upper mantle fluid. Earth Planet. Sci. Lett. 2001, 187, 323–332. [Google Scholar] [CrossRef]
  108. Weiss, Y.; Czas, J.; Navon, O. Fluid inclusions in fibrous diamonds. Rev. Mineral. Geochem. 2022, 88, 475–532. [Google Scholar] [CrossRef]
  109. Sokol, A.G.; Borzdov, Y.M.; Khokhryakov, A.F.; Pal’yanov, Y.N.; Sobolev, N.V. Crystallization of diamond from silicate-fluid systems at P=7.0 GPa and T=1700-1750 degrees C. Dokl. Akad. Nauk 1999, 368, 99–102. [Google Scholar]
  110. Pal’yanov, Y.N.; Sokol, A.G.; Borzdov, Y.M.; Khokhryakov, A.F. Fluid-bearing alkaline carbonate melts as the medium for the formation of diamonds in the Earth’s mantle: An experimental study. Lithos 2002, 60, 145–159. [Google Scholar] [CrossRef]
  111. Palyanov, Y.N.; Sokol, A.G. The effect of composition of mantle fluids/melts on diamond formation processes. Lithos 2009, 112, 690–700. [Google Scholar] [CrossRef]
  112. Luth, R.W.; Palyanov, Y.N.; Bureau, H. Experimental petrology applied to natural diamond growth. Rev. Mineral. Geochem. 2022, 88, 755–808. [Google Scholar] [CrossRef]
  113. Lee, W.J.; Wyllie, P.J. Processes of crustal carbonatite formation by liquid immiscibility and differentiation, elucidated by model systems. J. Petrol. 1998, 39, 2005–2013. [Google Scholar] [CrossRef]
  114. Lee, W.J.; Wyllie, P.J. Petrogenesis of carbonatite magmas from mantle to crust, constrained by the system CaO-(MgO+FeO*)(Na2O+K2O)-(SiO2+Al2O3+TiO2)-CO2. J. Petrol. 1998, 39, 495–517. [Google Scholar] [CrossRef]
  115. Shatskiy, A.; Bekhtenova, A.; Arefiev, A.V.; Podborodnikov, I.V.; Litasov, K.D. Slab-derived melts interacting with peridotite: Toward the origin of diamond-forming melts. Lithos 2022, 412-413, 106615. [Google Scholar] [CrossRef]
  116. Kiseeva, E.S.; Yaxley, G.M.; Hermann, J.; Litasov, K.D.; Rosenthal, A.; Kamenetsky, V.S. An experimental study of carbonated eclogite at 3.5-5.5 GPa–implications for silicate and carbonate metasomatism in the cratonic mantle. J. Petrol. 2012, 53, 727–759. [Google Scholar] [CrossRef] [Green Version]
Figure 1. P-T plot illustrating phase relationships in anhydrous carbonated pelite systems. GS11a—[22], GS11b—[21], TD11—[23]. Ecl—eclogitic assemblage: Cpx + Grt + Ky + Coe + Rt. Dol-in—Dol = Arg + Mgs [24]. Kfs-in—2Kfs = Wad + Ky + Coe [25,26,27,28]. Dol-out/Kfs-in—The upper-temperature stability limit of Dol+Kfs in pelite under nominally anhydrous conditions. See the Abbreviations section for mineral and phase symbols.
Minerals 13 00443 g001
Figure 16. Representative Raman spectra of silicate glass in the system L(S) + L(C). (a) run D211 at 6 GPa and 1300 °C, (b) run D255 at 4.5 GPa and 1200 °C, and (c) run D260 at 3 GPa and 1200 °C.
Minerals 13 00443 g016
Figure 17. Phase relations in the systems L(S) + L(C) (a) and L(S) (b). The KCM-CO2 solidus after [73,74,75]. The shield geotherms with a surface heat flow of 37, 40, and 43 mW/m2 after [76]. Rift margin geotherm with the heat flow of 60 mW/m2 after [77].
Minerals 13 00443 g017
Figure 18. Carbonate melt compositions plotted on the liquidus projections of the K2CO3-MgCO3-CaCO3 system at 3 GPa [74] (a) and 6 GPa [73] (b).
Minerals 13 00443 g018
Figure 19. K2O/Na2O weight ratio in carbonate (a) and silicate (b) melts versus pressure. The gray numbers are temperatures in °C.
Minerals 13 00443 g019
Figure 20. Pseudo-ternary projection of conjugate carbonatite and phonolite melts obtained in our experiments was compared with inclusions of melt or high-density fluids (HDFs) in diamonds, phonolite glasses in diamonds from Mir pipes [54], silicate glasses in spinel peridotite xenoliths from Spitzberg, Germany [57] and Victoria, Australia [58], as well as alkaline carbonatite-bearing complexes from Eifel, Germany [59], Tomtor, Russia [60], and Mushugai-Khuduk, Mongolia [61]. The compositions of melt/fluid diamond inclusions and corresponding references are summarized in Tables S8–S10 from [16].
Minerals 13 00443 g020
Table 1. Compositions (wt%) of starting mixtures normalized to 100%.
SystemSiO2TiO2Al2O3FeOMgOCaONa2OK2OCO2
L(S) + L(C)27.82.207.955.653.5612.92.7615.821.4
L(S)52.42.1413.31.571.193.232.9915.28.0
Table 2. Summary of run conditions and calculated phase proportions (mol%) in the system L(S) + L(C).
Run#P, GPaT, °Ct, h#Run Products
L(C)L(S)KfsWadPhlCoeGrtCpxRtSum r2
D3283.01050983-24153430.71
D2603.01200204-337377200.50
D2554.51200201-2, 2-255324180.04
D2616.011001134-1, 4-3573810220.44
D2106.01200724-1, 4-4589224tr.0.04
D2116.01300641-444267230.11
D2146.01400254-249391120.10
D2176.0150054-426740.94
Notes: t—duration; L(C)—carbonate melt; L(S)—phonolitic melt; Kfs—potassium feldspar; Wad—K2TiSi3O9 wadeite; Coe—coesite; Cpx—clinopyroxene; Rt—rutile; #—sample number; tr.—trace amount. Modal abundance (mol%) is determined by mass balance calculations using all the oxide concentrations of constituent phases; “Sum r2” is the sum of squares of residuals obtained by using mineral modes, phase compositions, and the composition of the starting materials. The mass balance calculations in both mol% and wt% are given in Tables S1–S3.
Table 9. Temperature estimates using Cpx-Grt geothermometers in the system L(S) + L(C).
Run#P, GPaT, °CEG79P85K88K00
D2554.512001290128913281323
D210612001215120712231285
D211613001318131613301394
D214614001367136713941444
Notes: EG79—[69], K88—[70], P85—[71], K00—[72].
Disclaimer/Publisher’s Note: The statements, opinions and data contained in all publications are solely those of the individual author(s) and contributor(s) and not of MDPI and/or the editor(s). MDPI and/or the editor(s) disclaim responsibility for any injury to people or property resulting from any ideas, methods, instructions or products referred to in the content.

