Article

Coal-Based Activated Carbon via Microwave-Assisted ZnCl2 Activation for Methyl Violet 2B Dye Removal: Optimization, Desirability Function, and Adsorption Mechanism

1
Faculty of Applied Sciences, Universiti Teknologi MARA, Shah Alam 40450, Selangor, Malaysia
2
Department of Medical Instrumentation Engineering, Al-Mansour University College, Baghdad 10086, Iraq
3
College of Engineering, University of Warith Al-Anbiyaa, Karbala 56001, Iraq
4
Faculty of Applied Sciences, Universiti Teknologi MARA Cawangan Negeri Sembilan Kampus Kuala Pilah, Kuala Pilah 72000, Negeri Sembilan, Malaysia
5
Chemistry Department, College of Science, King Saud University, Riyadh 11451, Saudi Arabia
6
Department of Chemistry, University of Saskatchewan, Saskatoon, SK S7N 5C9, Canada
*
Author to whom correspondence should be addressed.
Minerals 2023, 13(3), 438; https://doi.org/10.3390/min13030438
Submission received: 29 December 2022 / Revised: 14 March 2023 / Accepted: 16 March 2023 / Published: 19 March 2023
(This article belongs to the Special Issue Characterization, Processing and Utilization of Coal)

Abstract

:
In this work, activated carbon (referred to as MCAC) was produced by microwave radiation assisted ZnCl2 activation using Malaysian coal (MC) as a precursor. The Brunauer–Emmett–Teller findings indicate that the MCAC has a relatively large surface area (798.18 m2/g) and a mesoporous structure (average pore diameter of 3.67 nm). The removal of Methylene Violet (MV 2B) a cationic dye model, was employed to investigate the adsorption properties of MCAC. A numerical desirability function in the Box–Behnken design (BBD) was employed to optimize the independent crucial adsorption variables as follows: A: MCAC dose (0.02–0.1 g); B: pH (4–10); and C: time (5–25 min). The results of equilibrium and dynamic adsorption showed that the adsorption of MV 2B followed Freundlich and pseudo-second order models, respectively. The maximum amount of MV 2B dye that the MCAC could adsorb (qmax) was 134.1 mg/g. Electrostatic interactions, π-π stacking, H-bonding, and pore diffusion contribute to the adsorption of MV 2B dye onto the MCAC surface. This study demonstrates the potential to utilize MC as a low-cost precursor for the efficient synthesis of MAC and its utility for the removal of pollutants.

1. Introduction

Organic dyes such as methyl violet 2B (MV 2B) represent toxic molecules to aquatic life when they are released (untreated effluents) into the environment, where they can also cause dermatologic, carcinogenic, and mutagenic effects in humans [1]. Thus, organic dyes (e.g., MV 2B dye) should be removed from industrial effluents before they are discharged into freshwater ecosystems to protect the environment and human health. Consequently, a variety of treatment techniques have been used to remove organic dyes from polluted water, including adsorption [2], Fenton oxidation [3], biological degradation [4], photocatalysis [5], and filtration [6]. The adsorption process has emerged as an effective treatment technique among these approaches due to several characteristics such as effectiveness, easy operation, and specificity toward target analytes [7].
Activated carbon (AC) is a potential multifunctional adsorbent with a unique pore structure and a large surface area with a diversity of functional groups [8]. As a result, it is frequently used as an efficient adsorbent for the removal of contaminants [9]. The efficiency of AC is influenced by a number of parameters, including the precursor supply, activation technique, activation chemical, surface characteristics, and functional groups of surfaces [10]. Thus, a variety of precursor materials, such as para chestnut husk, pecan nutshell, araucaria bark, and palm cactus [11], Guhanshan coal [12], biomass wastes [13], and scrap tires [14] can be utilized to prepare AC.
Low-grade coals, such as Malaysian coal (Merit Kapit), are unattractive for use in the generation of energy because they have low calorific values and large levels of water, oxygen, ash, and hetero-atoms [15]. Nevertheless, by lowering the mineral matter concentration and raising the porosity and carbon content, low-grade coals can be transformed into valuable materials such as activated carbon with potential utility in many fields. The microwave activation process has several desired characteristics over other conventional heating techniques to create AC, including a short activation period, low energy usage, and a high yield of AC [16].
Chemical activators such as phosphoric acid, sodium carbonate, potassium hydroxide, zinc chloride, and others have a significant impact on the adsorption efficiency of AC [17]. Zinc chloride (ZnCl2) is one of these regents that has the benefit of producing AC materials with a distinct porosity structure, excellent carbon yield, and considerable surface area [18]. In recent years, ZnCl2 has been used as one of the chemical activators for the production of AC from various sources and the resultant AC has been applied to the removal of pollutants such as cadmium ion (Cd2+) [19], phenol [20], Cl Acid Blue 193 and Cl Basic Blue 9 dyes [21], methylene blue [22], and rhodamine B dye [23]. In the same regard, 1712 million tons of various forms of coal, with diverse organic and inorganic components, are produced in Malaysia at various sites [24]. This makes it a suitable precursor for the production of this carbonaceous adsorbent (AC), which is often used for water purification.
Hence, the purpose of this research is to prepare and characterize activated carbon (hereinafter referred to as MCAC) generated from Malaysian coal by employing microwave radiation assisted ZnCl2. The properties of adsorption of MCAC were investigated by studying how cationic dye (MV 2B) was removed using adsorption from aqueous solutions. A numerical desirability function in the Box–Behnken design (BBD) was employed to optimize the independent crucial adsorption variables (MCAC dosage, pH, and duration). The kinetic and isothermal properties of MV 2B adsorption on MCAC were also critically analyzed. The MCAC surface interaction with the MV dye system was explained by a plausible mechanism.

2. Materials and Methods

2.1. Materials

Malaysian coal (MC) was collected from the Batu Arang coal field (Sarawak state, Malaysia). To eliminate the adherents, this MC was washed a total of five times with hot distilled water and then put in the oven to dry at 100 °C for 24 h. The MC was finally pulverized into tiny particles (0.5–0.85 mm). MV 2B dye (λmax: 584 nm; MW: 393.95 g/mol; chemical formula: C24H28N3Cl) was obtained from Kermel (Colmar, France), China. R&M Chemicals (KSFE, Petaling Jaya, Malaysia) supplied all the analytical grade chemicals and reagents.

2.2. MCAC’s Preparation

Initially, water was added to the beaker with 1 g of MC and 2 g of ZnCl2 (1:2 wt. ratio) to enable the metal ion impregnation process. The combination was oven dried at 100 °C for 24 h. The materials (MC/ZnCl2) were transferred to a microwave oven (SAMSUNG ME711K, 20 L) and subjected to microwave power of 600 W for 15 min while N2 gas (99.99%) flowed at a rate of 150 mL/min. Distilled water was directly used to neutralize the pH of the mixture and the final (MCAC) product was dried for 24 h at 100 °C. MCAC was sieved to a consistent particle diameter (250 µm) for characterization of other materials.

2.3. Characterization

A device (Micromeritics ASAP 2060) was utilized to gather data on the surface area and pore size analysis of the MCAC. Scanning electron microscopy (SEM) was used for the identification of the product morphology before and after the dye adsorption process. An X-ray diffractometer (XRD, PANalytical X’Pert PRO) was employed to characterize the crystalline phase of MC and MCAC. The essential functional groups of the MCAC and MCAC-dye were distinguished using a Perkin–Elmer, Spectrum RX I Fourier-transform infrared (FTIR) spectroscopy. The MCAC surface has a charge which was defined using a point of zero charge (pHpzc) analysis method [25].

2.4. Statistical Optimization Methodology

For an efficient and comprehensive evaluation of the intended response, the BBD approach was applied, which is frequently used in the design of experiments. In turn, it develops the mathematical model that fits the data and provides information on the independent factors (MCAC dosage, pH, and time) that achieve the highest response value (MV 2B removal). The adsorption studies were built up with BBD by utilizing the Design-Expert software (Stat-Ease, Version 13). Table 1 includes the studied factor levels along with their codes. A second polynomial model was employed in Equation (1) to represent the relationship between dependent outcome and independent components:
Y = β 0 + β i X i + β i i X i 2 + β i j X i X j
where Y is the intended response (MV 2B), Xi and Xj are the studied factors, while β0, βi, βij, and βii are coefficients of the developed model. Table 2 shows the matching removal results for 17 tests that were produced by the developed model. At the initial state, 100 mL of the MV 2B solution was homogenized with a specified amount of MCAC prior to starting the MV 2B removal tests. A water bath thermostatic oscillator was used for shaking the mixture, where they were gently stirred for a specified amount of time at a constant rate (90 strokes/min). To produce fluids that were devoid of MCAC, the mixtures were filtered with a syringe filter (0.45 μm). The concentration of MV 2B in the aqueous solution was detected using a UV-Vis spectrometer (HACH DR 2800) at λmax of 584 nm. The following mathematical Formula (2) was applied to determine the MV 2B dye’s removal efficacy (R, %):
R % = C o C e C o × 100
where the concentrations of MV 2B in the beginning and equilibrium phases are represented by the abbreviations Co (mg/L) and Ce (mg/L), respectively.

2.5. Adsorption Study of MV 2B on MCAC

The computation of the quantity of dye absorbed on the MCAC was established using batch equilibration tests. The largest level of MV 2B removal (72.6%) occurred with an MCAC dosage of 0.097 g, pH of 9.12, and time of 24.4 min as per the desirability function. Adsorption equilibrium studies were carried out using these ideal variables and a variety of initial MV 2B concentrations (20–200 mg/L). Then, the same approach as mentioned in Section 2.3 was used to generate batch adsorption tests for MV 2B. The next mathematical Formula (3) was adopted to calculate the adsorption capacity (qe, mg/g) of MCAC:
q e = C o C e V m
where m (g) represents the MCAC’s mass and V (L) represents the volume of the MV 2B solution.

3. Results and Discussion

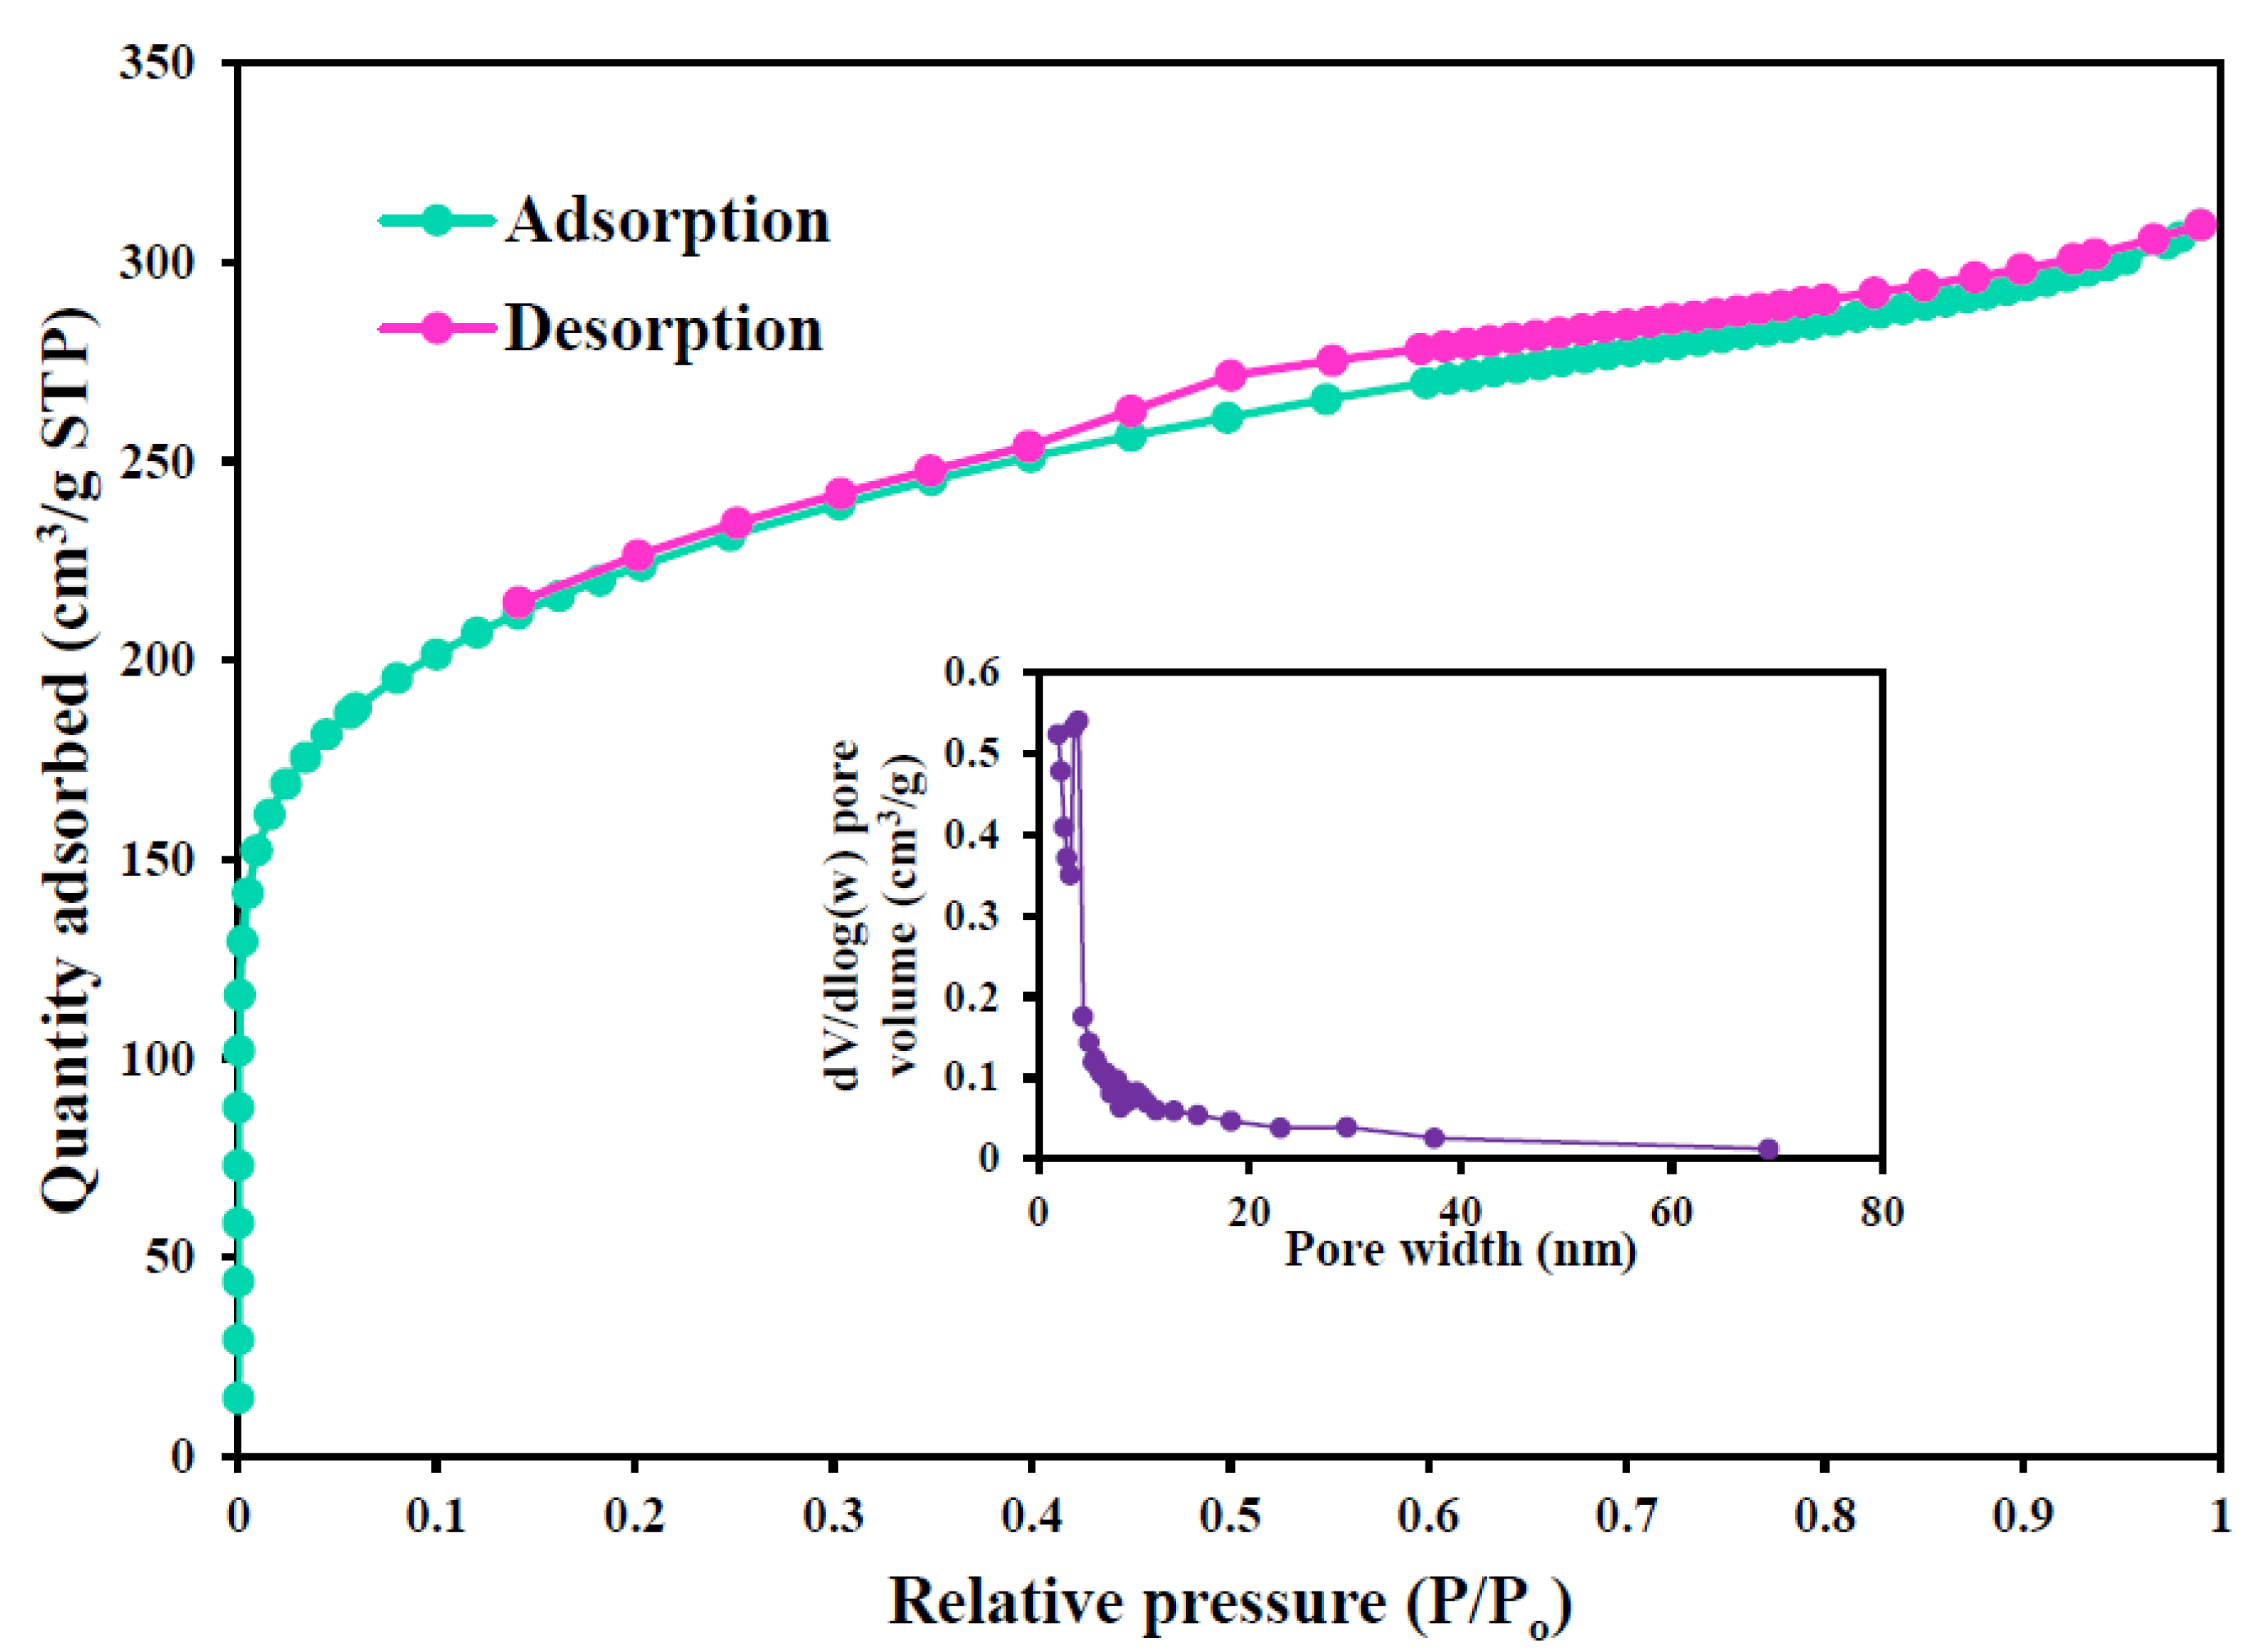
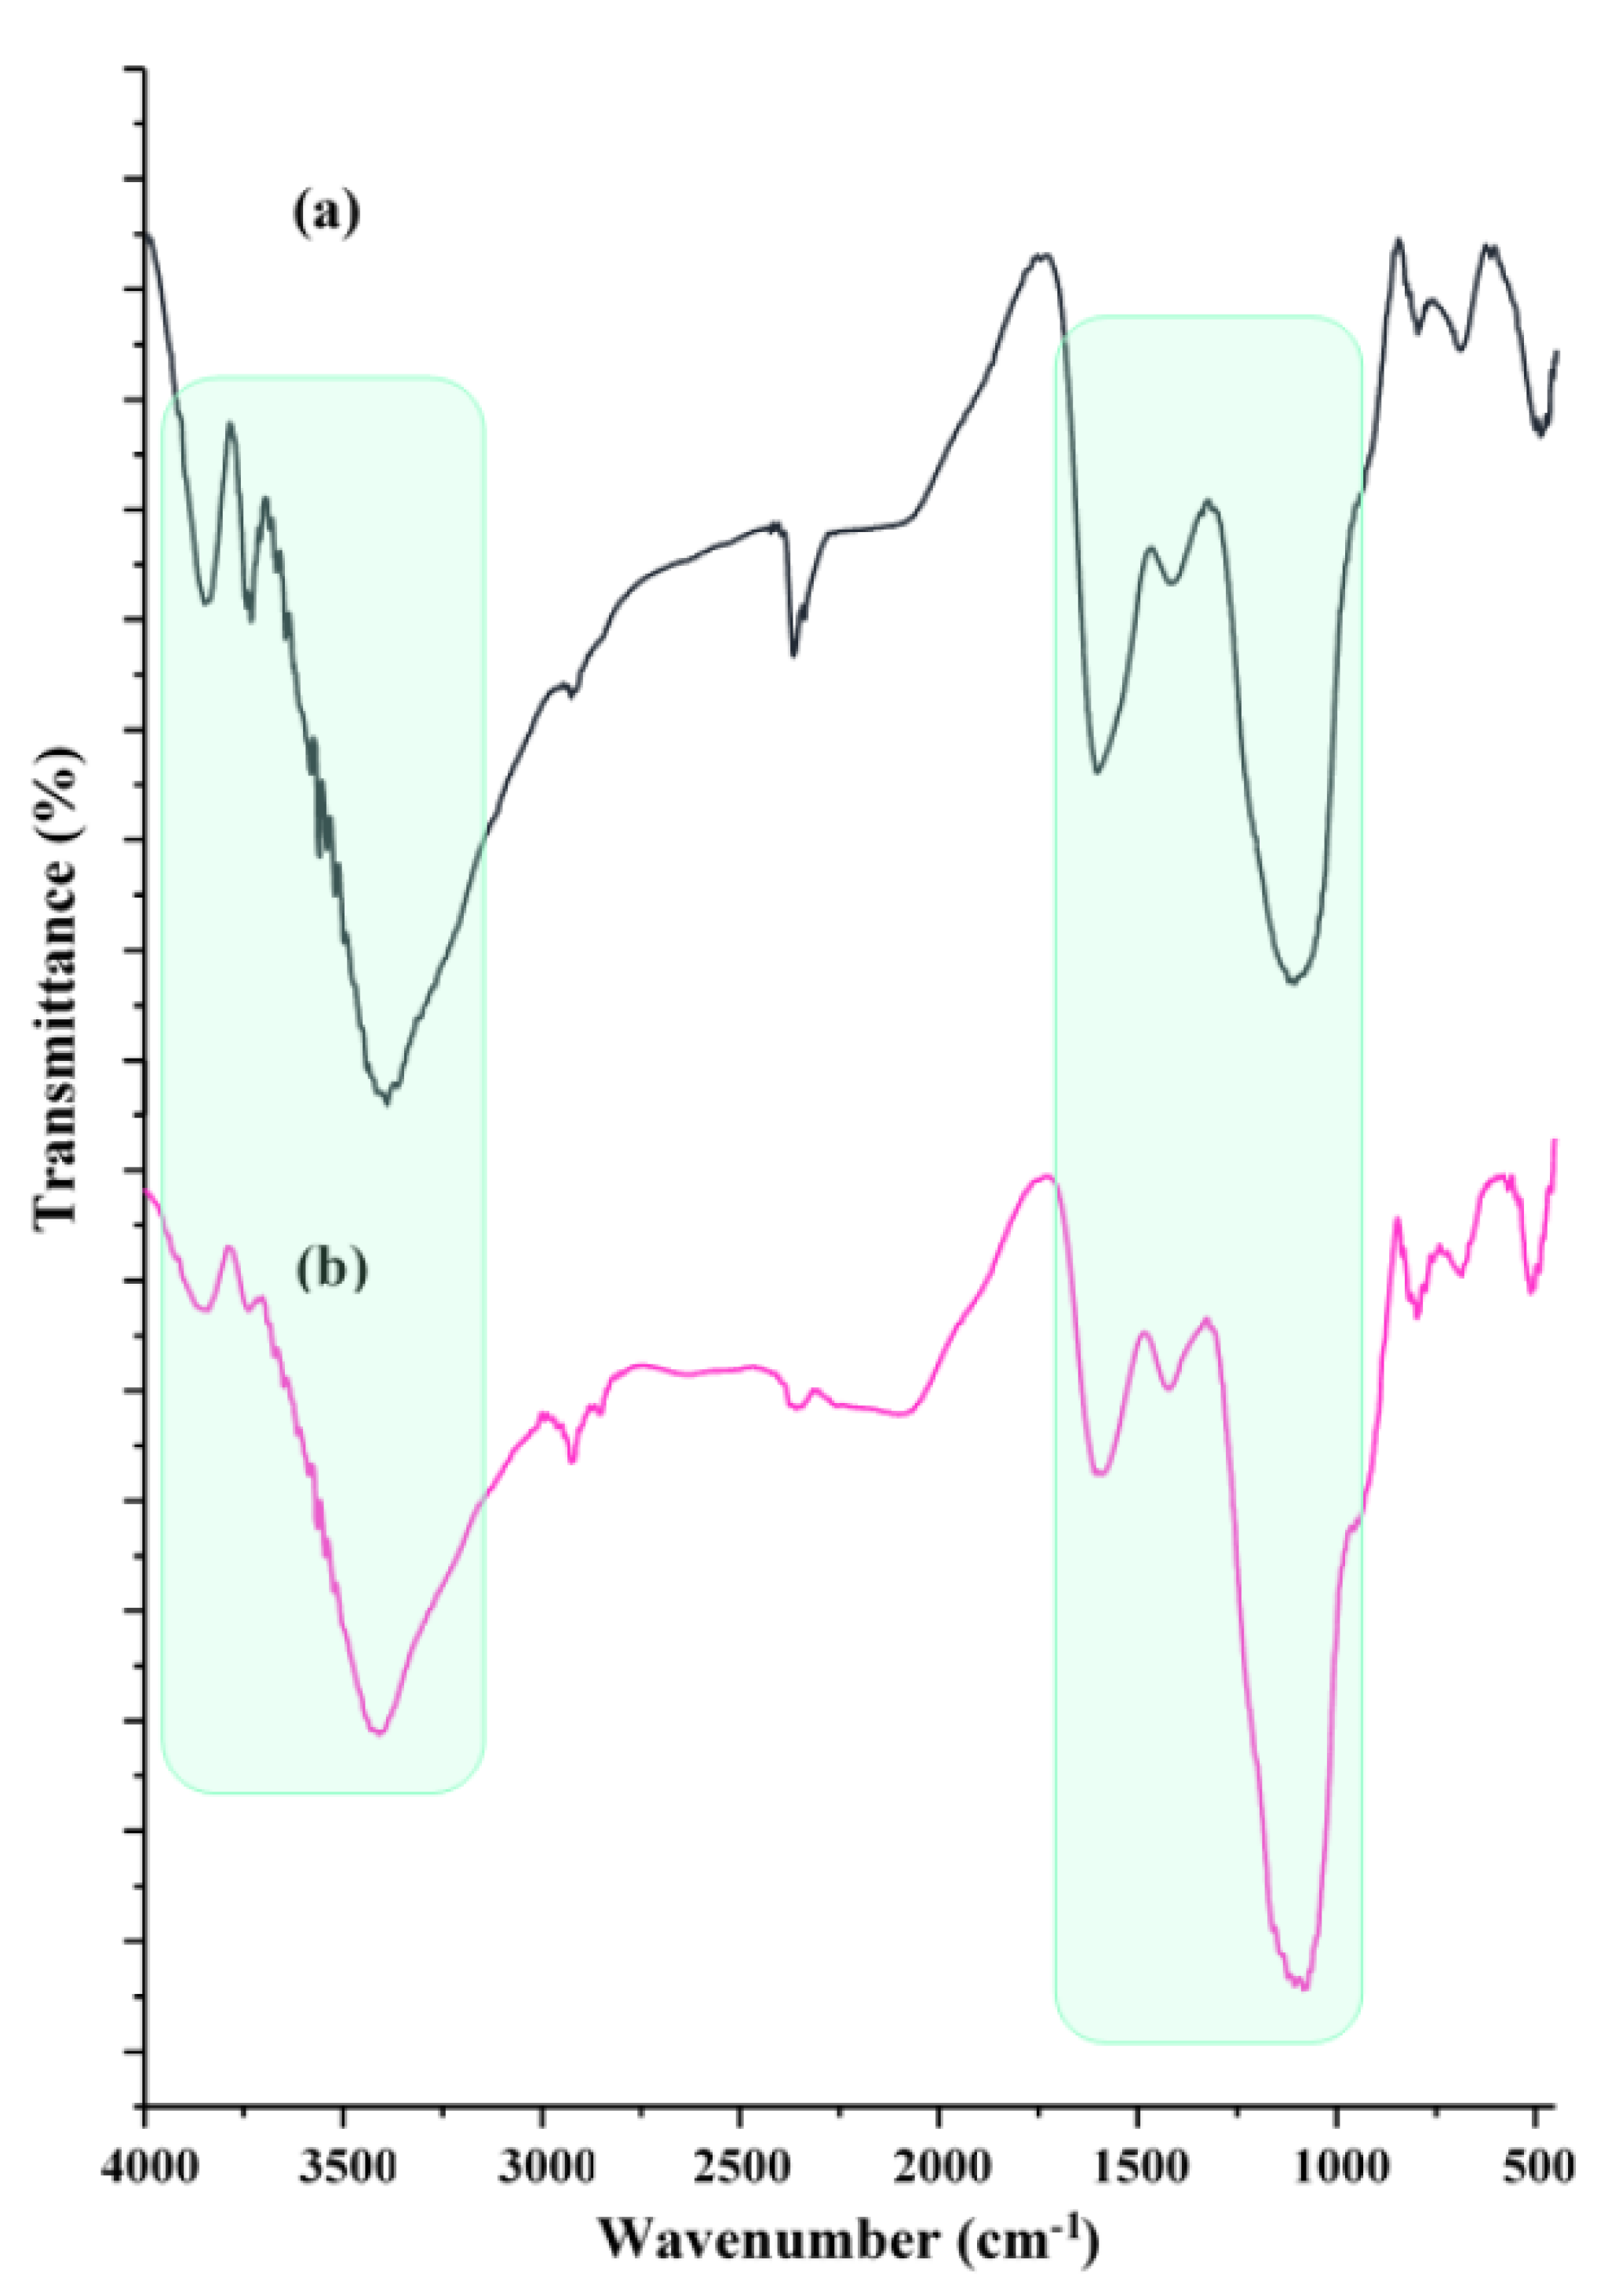
3.1. Characterization of MCAC

The MCAC’s surface area and porosity play a key role in the adsorption of the MV 2B dye [26]. The specific surface area and pore structure characteristics of MCAC are summarized in Table 3. The estimated pore volume and specific surface area of MCAC were 0.440 cm3/g and 798.18 m2/g, respectively. As per IUPAC [27], MCAC has a mesoporous structure (pores ranging in size from 2.0 nm to 50 nm), as evidenced by the mean pore diameter result (3.67 nm). Figure 1 shows the nitrogen adsorption/adsorption curves of MCAC, along with the BJH pore width distributions (inset). Figure 1 of the MCAC illustrates a Type-IV isotherm, which denotes the existence of mesopores in the structure [27]. Additionally, the H4 hysteresis loop’s occurrence over the relative pressure (P/Po) range studied demonstrates that the MCAC contains slit-like pores [28]. In general, the high porosity, increased pore size, and high specific surface area of the MCAC product affords many binding sites that may efficiently react with MV 2B organic dye molecules. The specific surface area of MCAC was also compared with other adsorbent materials and listed in Table 4.
FTIR spectroscopy was used to obtain data on the properties of the MCAC surface chemistry as well as the interactions between the MCAC and MV 2B. The FTIR spectra of MCAC and MCAC-MV 2B are illustrated in Figure 2a,b, respectively. The broad band at 4000 cm−1 in the MCAC spectra (Figure 2a) is a result of the –OH group stretching found in MCAC compounds. Furthermore, distinguished peaks were found at 2340 cm−1 (C≡C stretching of alkyne group), 1660 cm−1 (C=O stretching of carboxylic acids, aldehydes, ketones, etc.), 1400 cm−1 (C=C of benzene rings), 1033 cm−1 (C-O stretching), and 680 cm−1 (C-H asymmetric stretching) [15,35]. The FTIR spectra of MCAC following MV 2B adsorption (Figure 2b) reveal a decrease and/or increase in the strength of specific peaks compared to MCAC, inferring that the primary functional groups of MCAC were included in MV 2B adsorption.
SEM-EDX analysis was used to explore the morphological changes and chemical nature of MC and MCAC before and after the adsorption of MV 2B. Figure 3 presents SEM images of MC and MCAC before and after the adsorption of MV 2B. In Figure 3a, it can be seen that MC has a homogeneous surface. According to Figure 3b, the morphological characteristics of MCAC were obviously changed to be more diverse, with the obvious occurrence of porosity and cracks, which indicated the successful conversion of MC to MCAC. The morphological properties of MCAC were altered to be more compact following the adsorption of MV 2B (Figure 3c), with a clear reduction in porosity and fractures, which revealed MV 2B dye loading on the surface of MCAC. The major elements of MC, MCAC, and MCAC-dye are carbon, oxygen, and nitrogen, as shown by their EDX spectra.

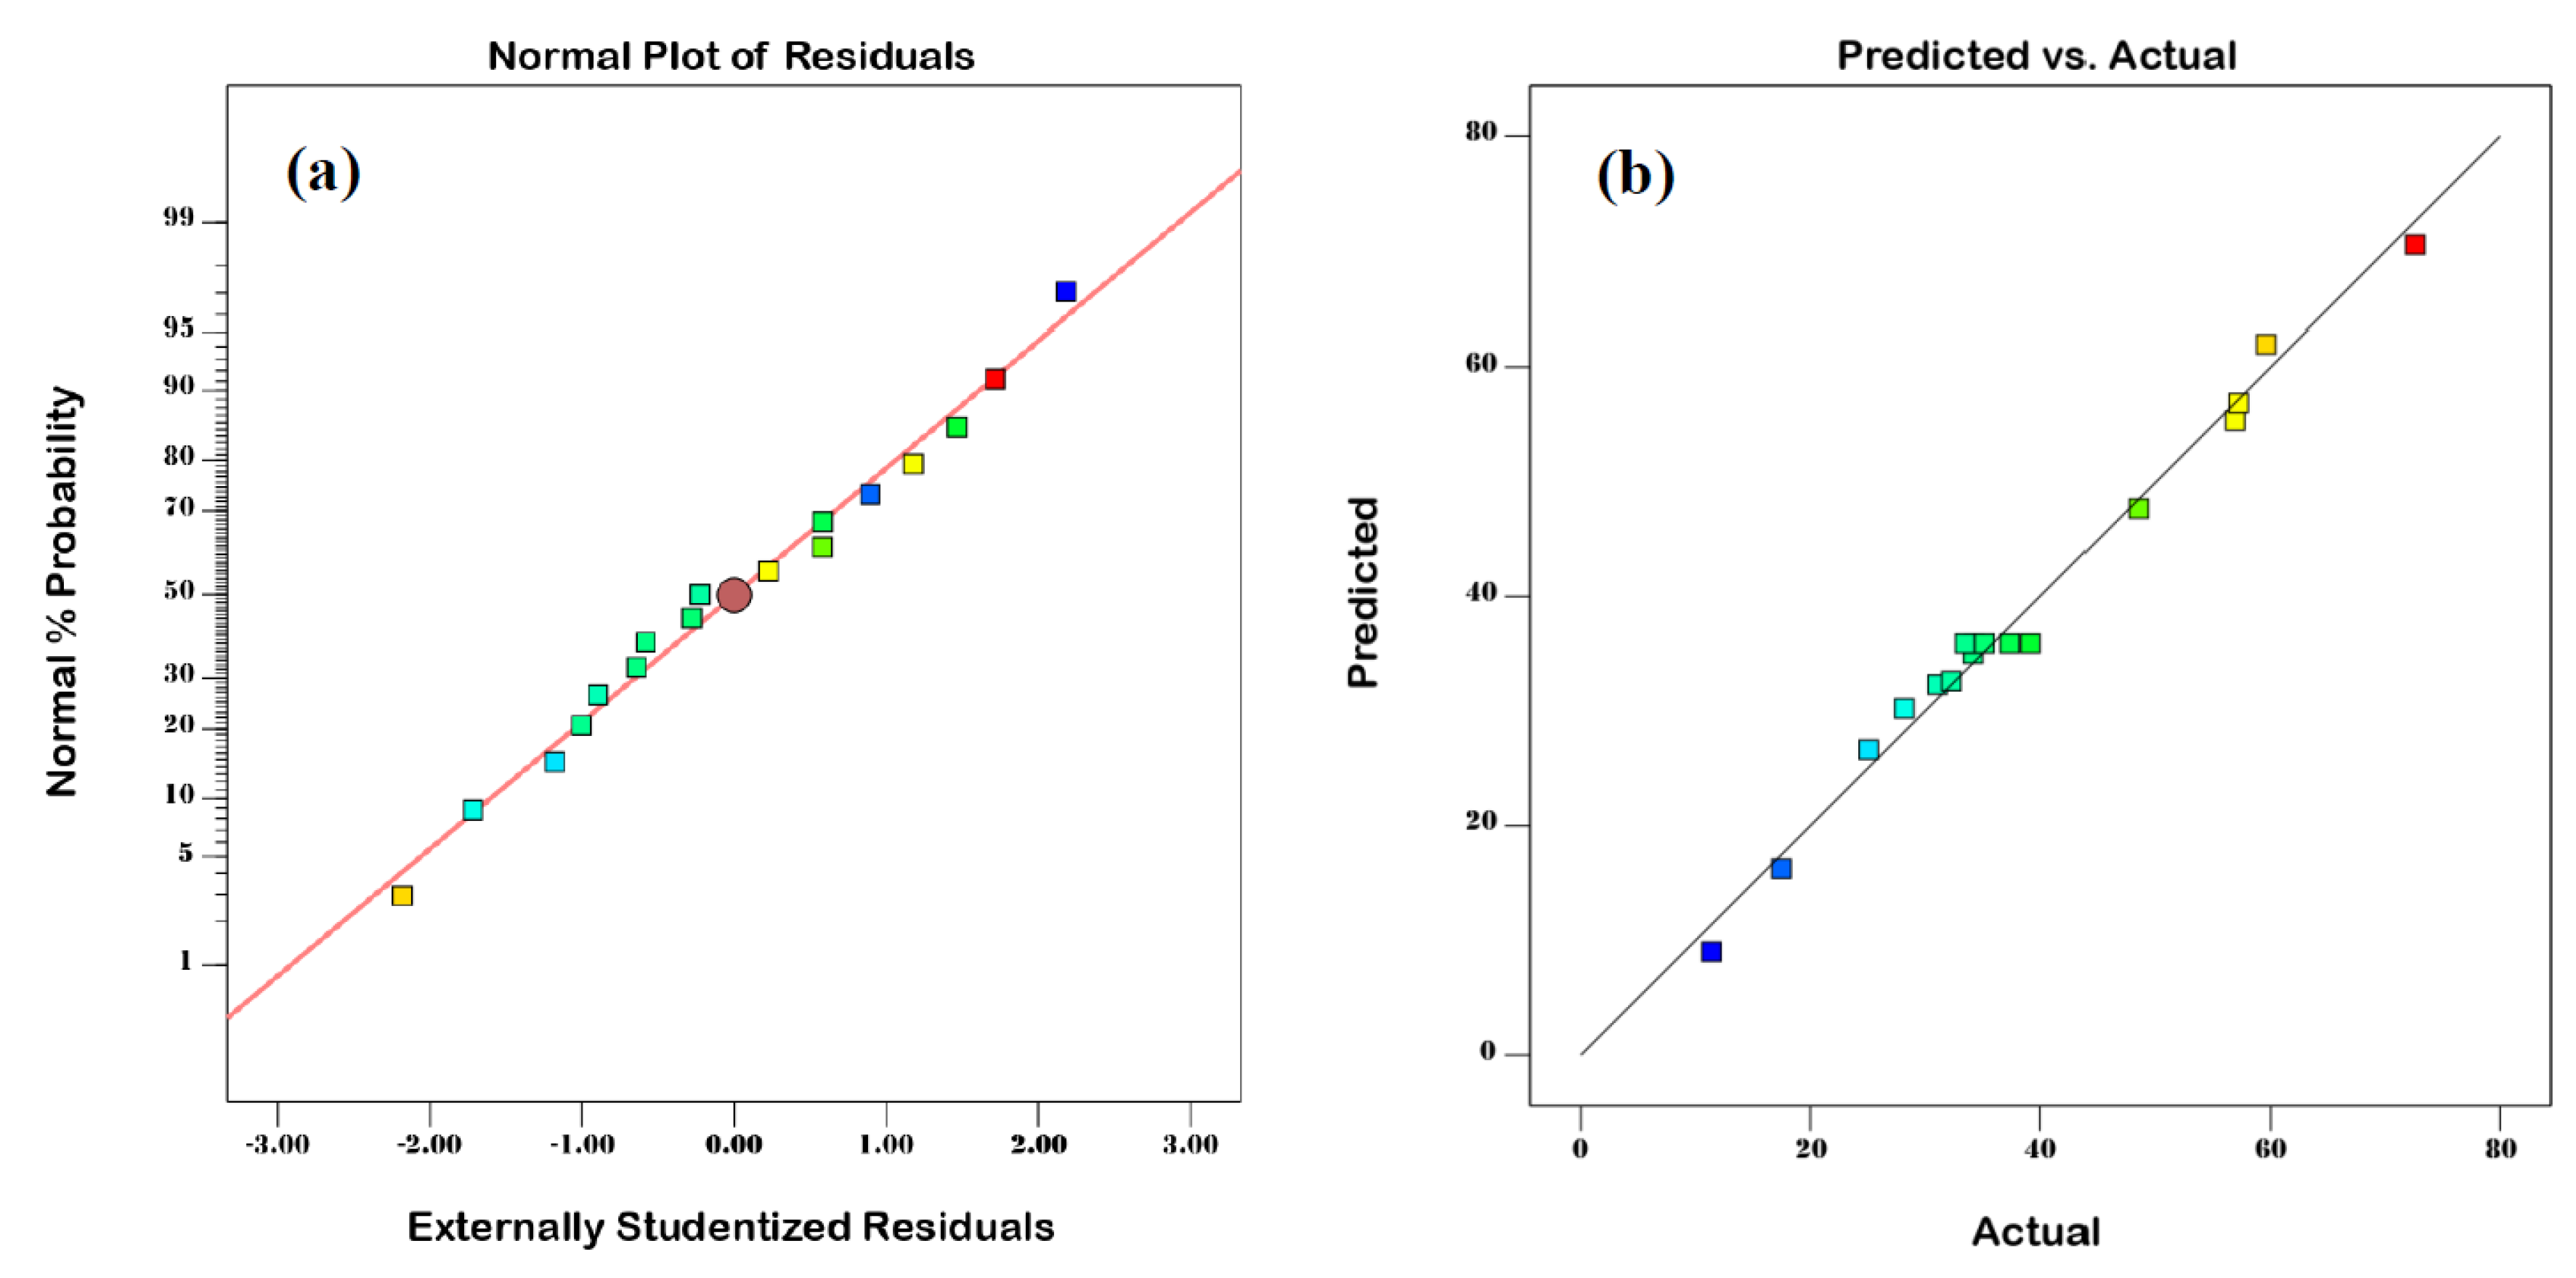
3.2. Model Validation

The ANOVA approach was effectively used to test the proposed quadratic model for the elimination of MV 2B, where it was also used to evaluate the effectiveness of the evaluated parameters. Table 5 gives the MV 2B removal ANOVA findings. Due to its F-value of 129.14, the data in Table 4 confirm the model’s reliability (MV 2B elimination) (p-value 0.0001) [36]. The R2 (0.99) value of the quadratic model confirms that the calculated and real MV 2B removal levels are reasonably consistent. Lack of fit (LOF) p-values that were not statistically significant (0.905) supported the model’s potential [37]. Generally, variables with p-values higher than 0.05 are regarded as non-statistically meaningful although they impact the performance of MV 2B removal. The statistical significance of the MV 2B decolorization model parameters A, B, C, AB, AC, B2, and C2 was determined. The model’s inputs and output (MV 2B elimination) resulted in the following final quadratic function, represented by Equation (4):
M V   2 B   r e m o v a l ( % ) = + 35.92 + 17.25 A + 2.90 B + 9.23 C + 4.70 A B + 5.60 A C + 11.46 B 2 4.33 C 2
The model created must be further assessed by looking at the normal probability plot (Figure 4a) to make sure the residues are approximately normally distributed. The normal distribution of the values in Figure 4a along a straight path shows that the model building and the ANOVA findings are adequate and plausible [38]. Another feature to evaluate the efficacy of the developed model is the expected versus the actual plot, as illustrated in Figure 4b. The plot, which has good linearity as depicted in Figure 4b, reveals that the experimentally obtained data are in excellent agreement with the calculated data by the BBD model.

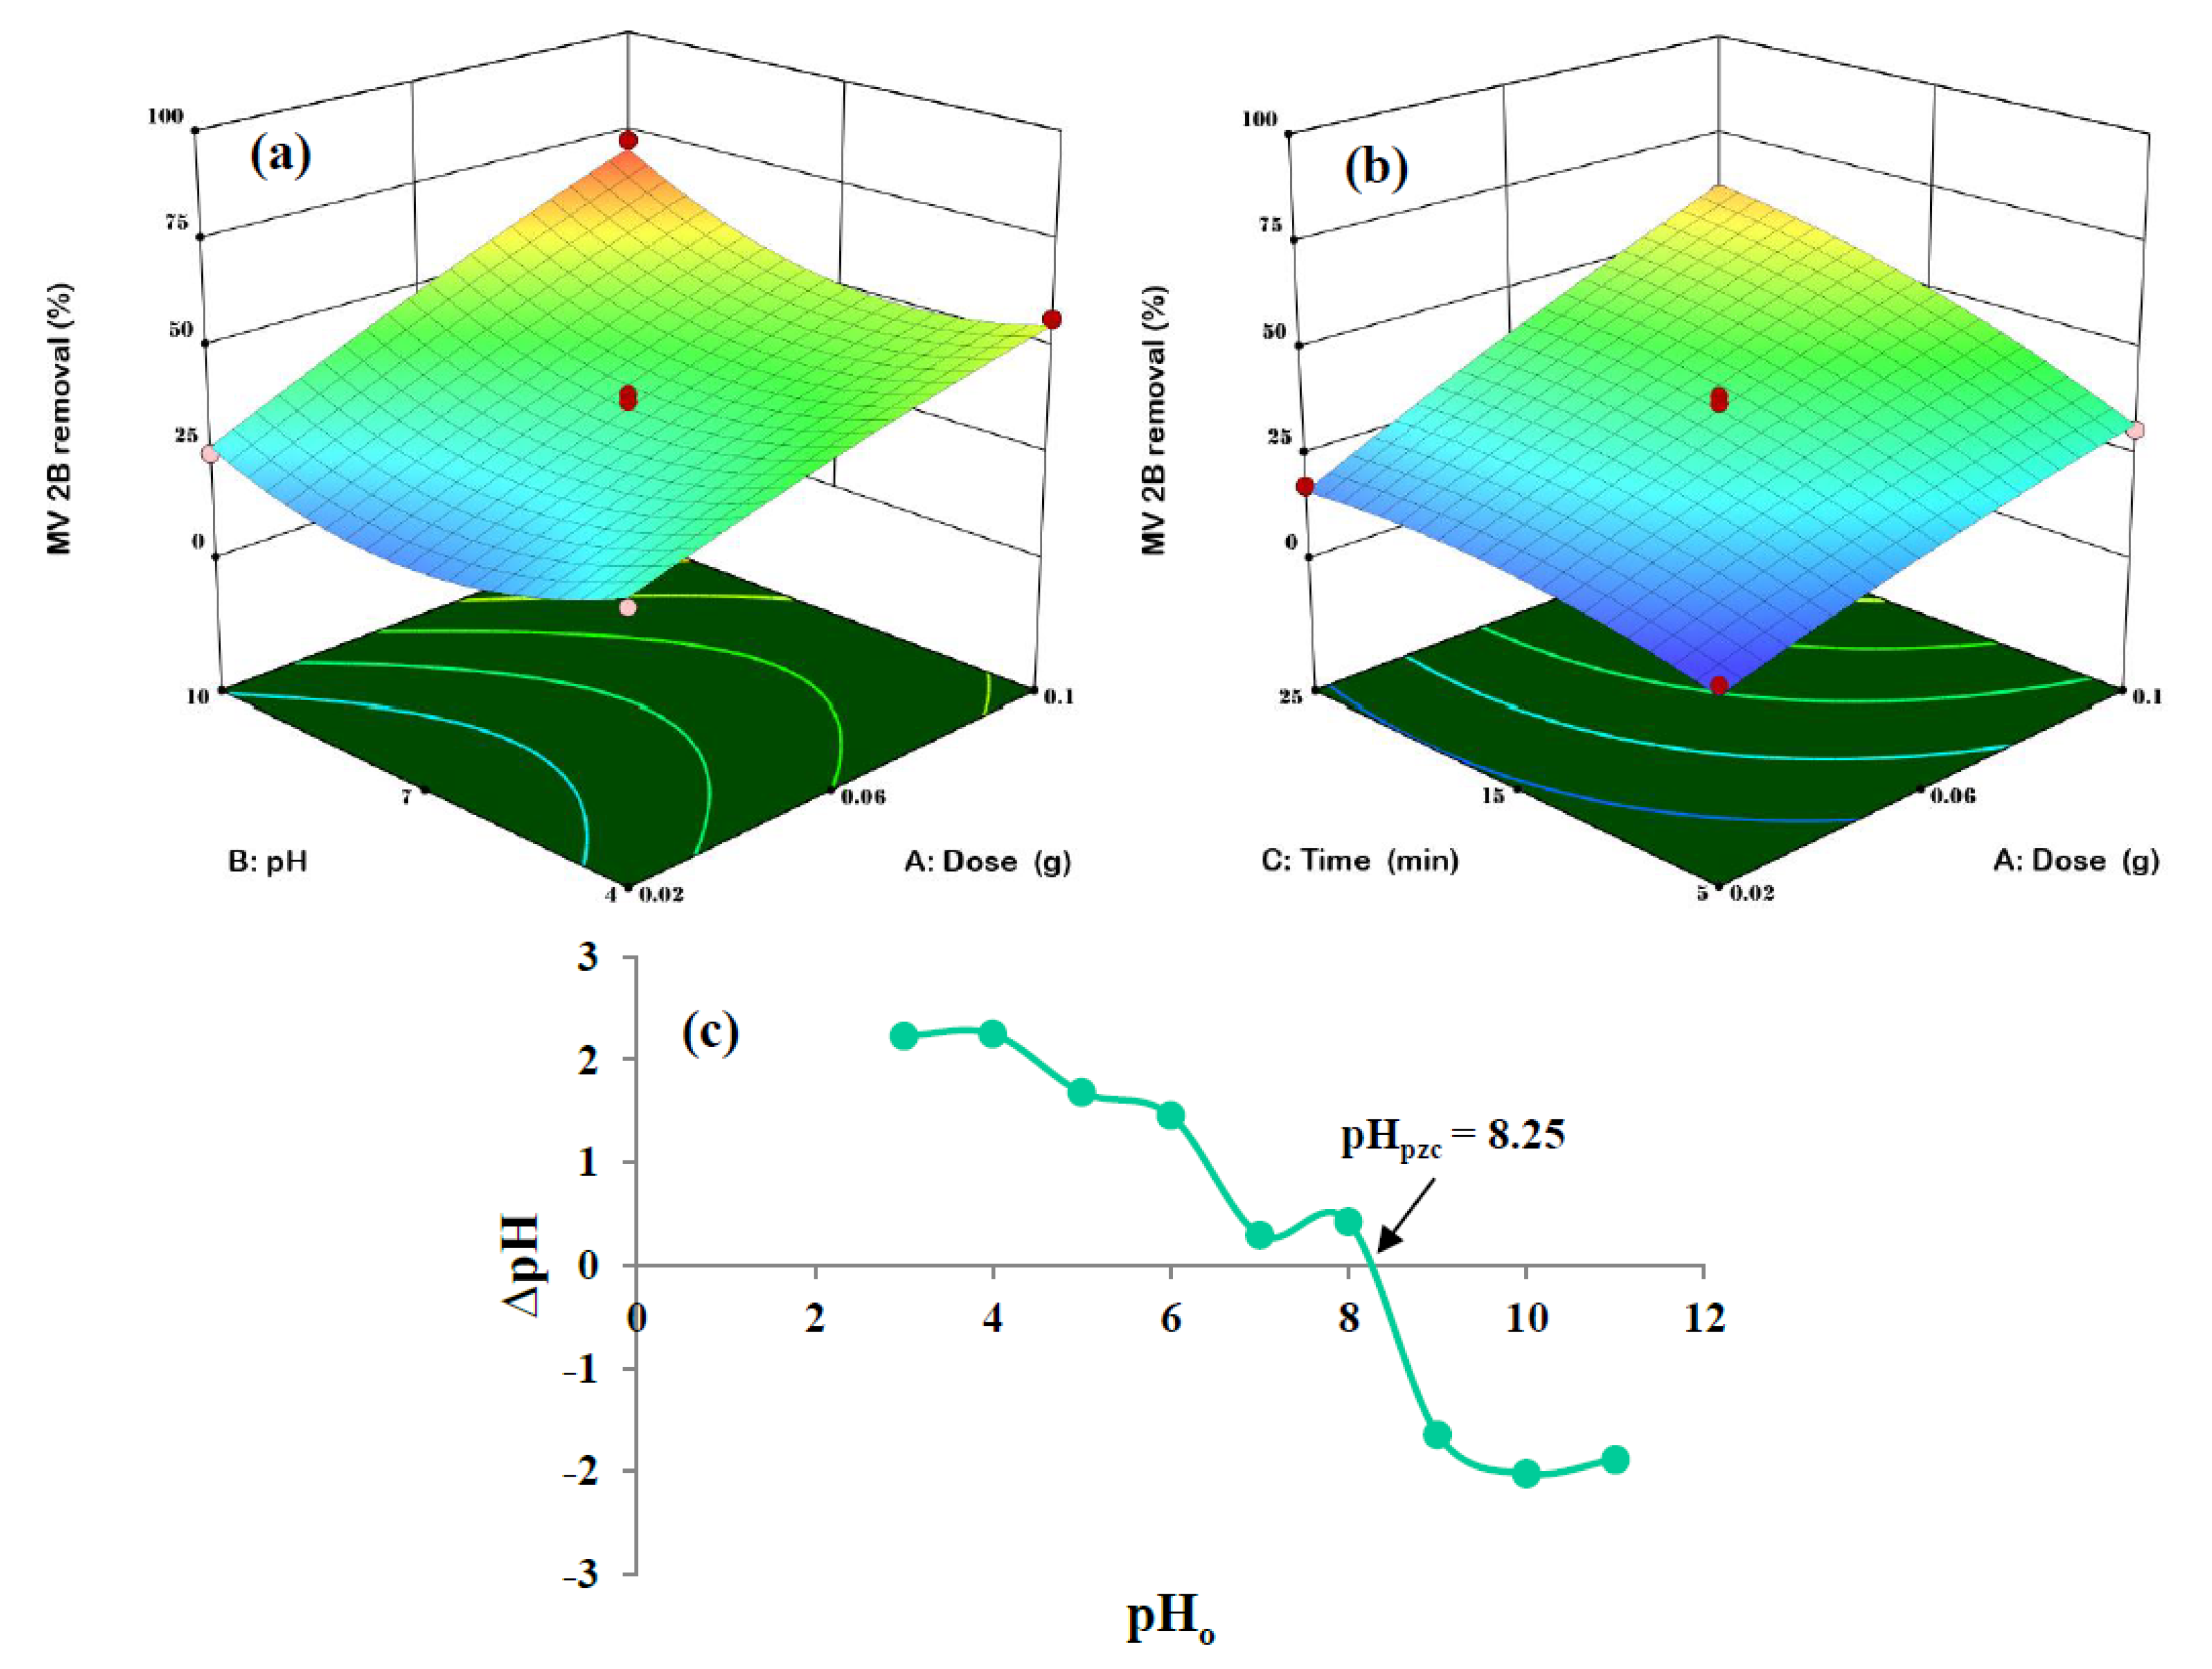
3.3. Dual Effects of the Variables on MV 2B Removal

Three-dimensional (3D) response surface diagrams were created to better understand how the parameters under examination impact MV 2B removal and to find significant relationships between the variables under examination. In the 3D graph of Figure 5a, the simultaneous impact of the MCAC dosage and pH on the rate of MV 2B removal is depicted while the duration (15 min) was maintained constant. Figure 5a demonstrates that eliminating MV 2B from a basic solution with a pH of 10 causes a greater adsorption capacity for MV 2B. According to Figure 5c, which shows that the pHpzc of MCAC is 8.25, for pH values greater than 8.25, the surface of the MCAC is occupied with negative charges and tends to adsorb positive MV 2B molecules. These findings demonstrate that the electrostatic interaction when the pHpzc of MCAC is lower than the pH, as described in Equation (5), and this contributes considerably to the adsorption process.
M C A C O + M V 2 B + M C A C O M V   2 B +
Figure 5a demonstrates that MV 2B dye’s MCAC adsorption efficiency was substantial at high dosages of MCAC (0.08 g). This effect is induced by the rise in the surface area and potential MCAC adsorption sites with rising MCAC dosage. Figure 5b depicts the combined impact of MCAC dosage and duration on the rate of MV 2B removal while maintaining a constant pH of 7. According to the findings shown in Figure 5b, the removal effectiveness of MV 2B is slightly improved when the duration is increased from 5 to 25 min. This was accounted for by the fact that MV 2B dye molecules are transported from the surface of MCAC to its pores upon adsorption. To put it another way, MCAC may quickly absorb pollutants similar to MV 2B.

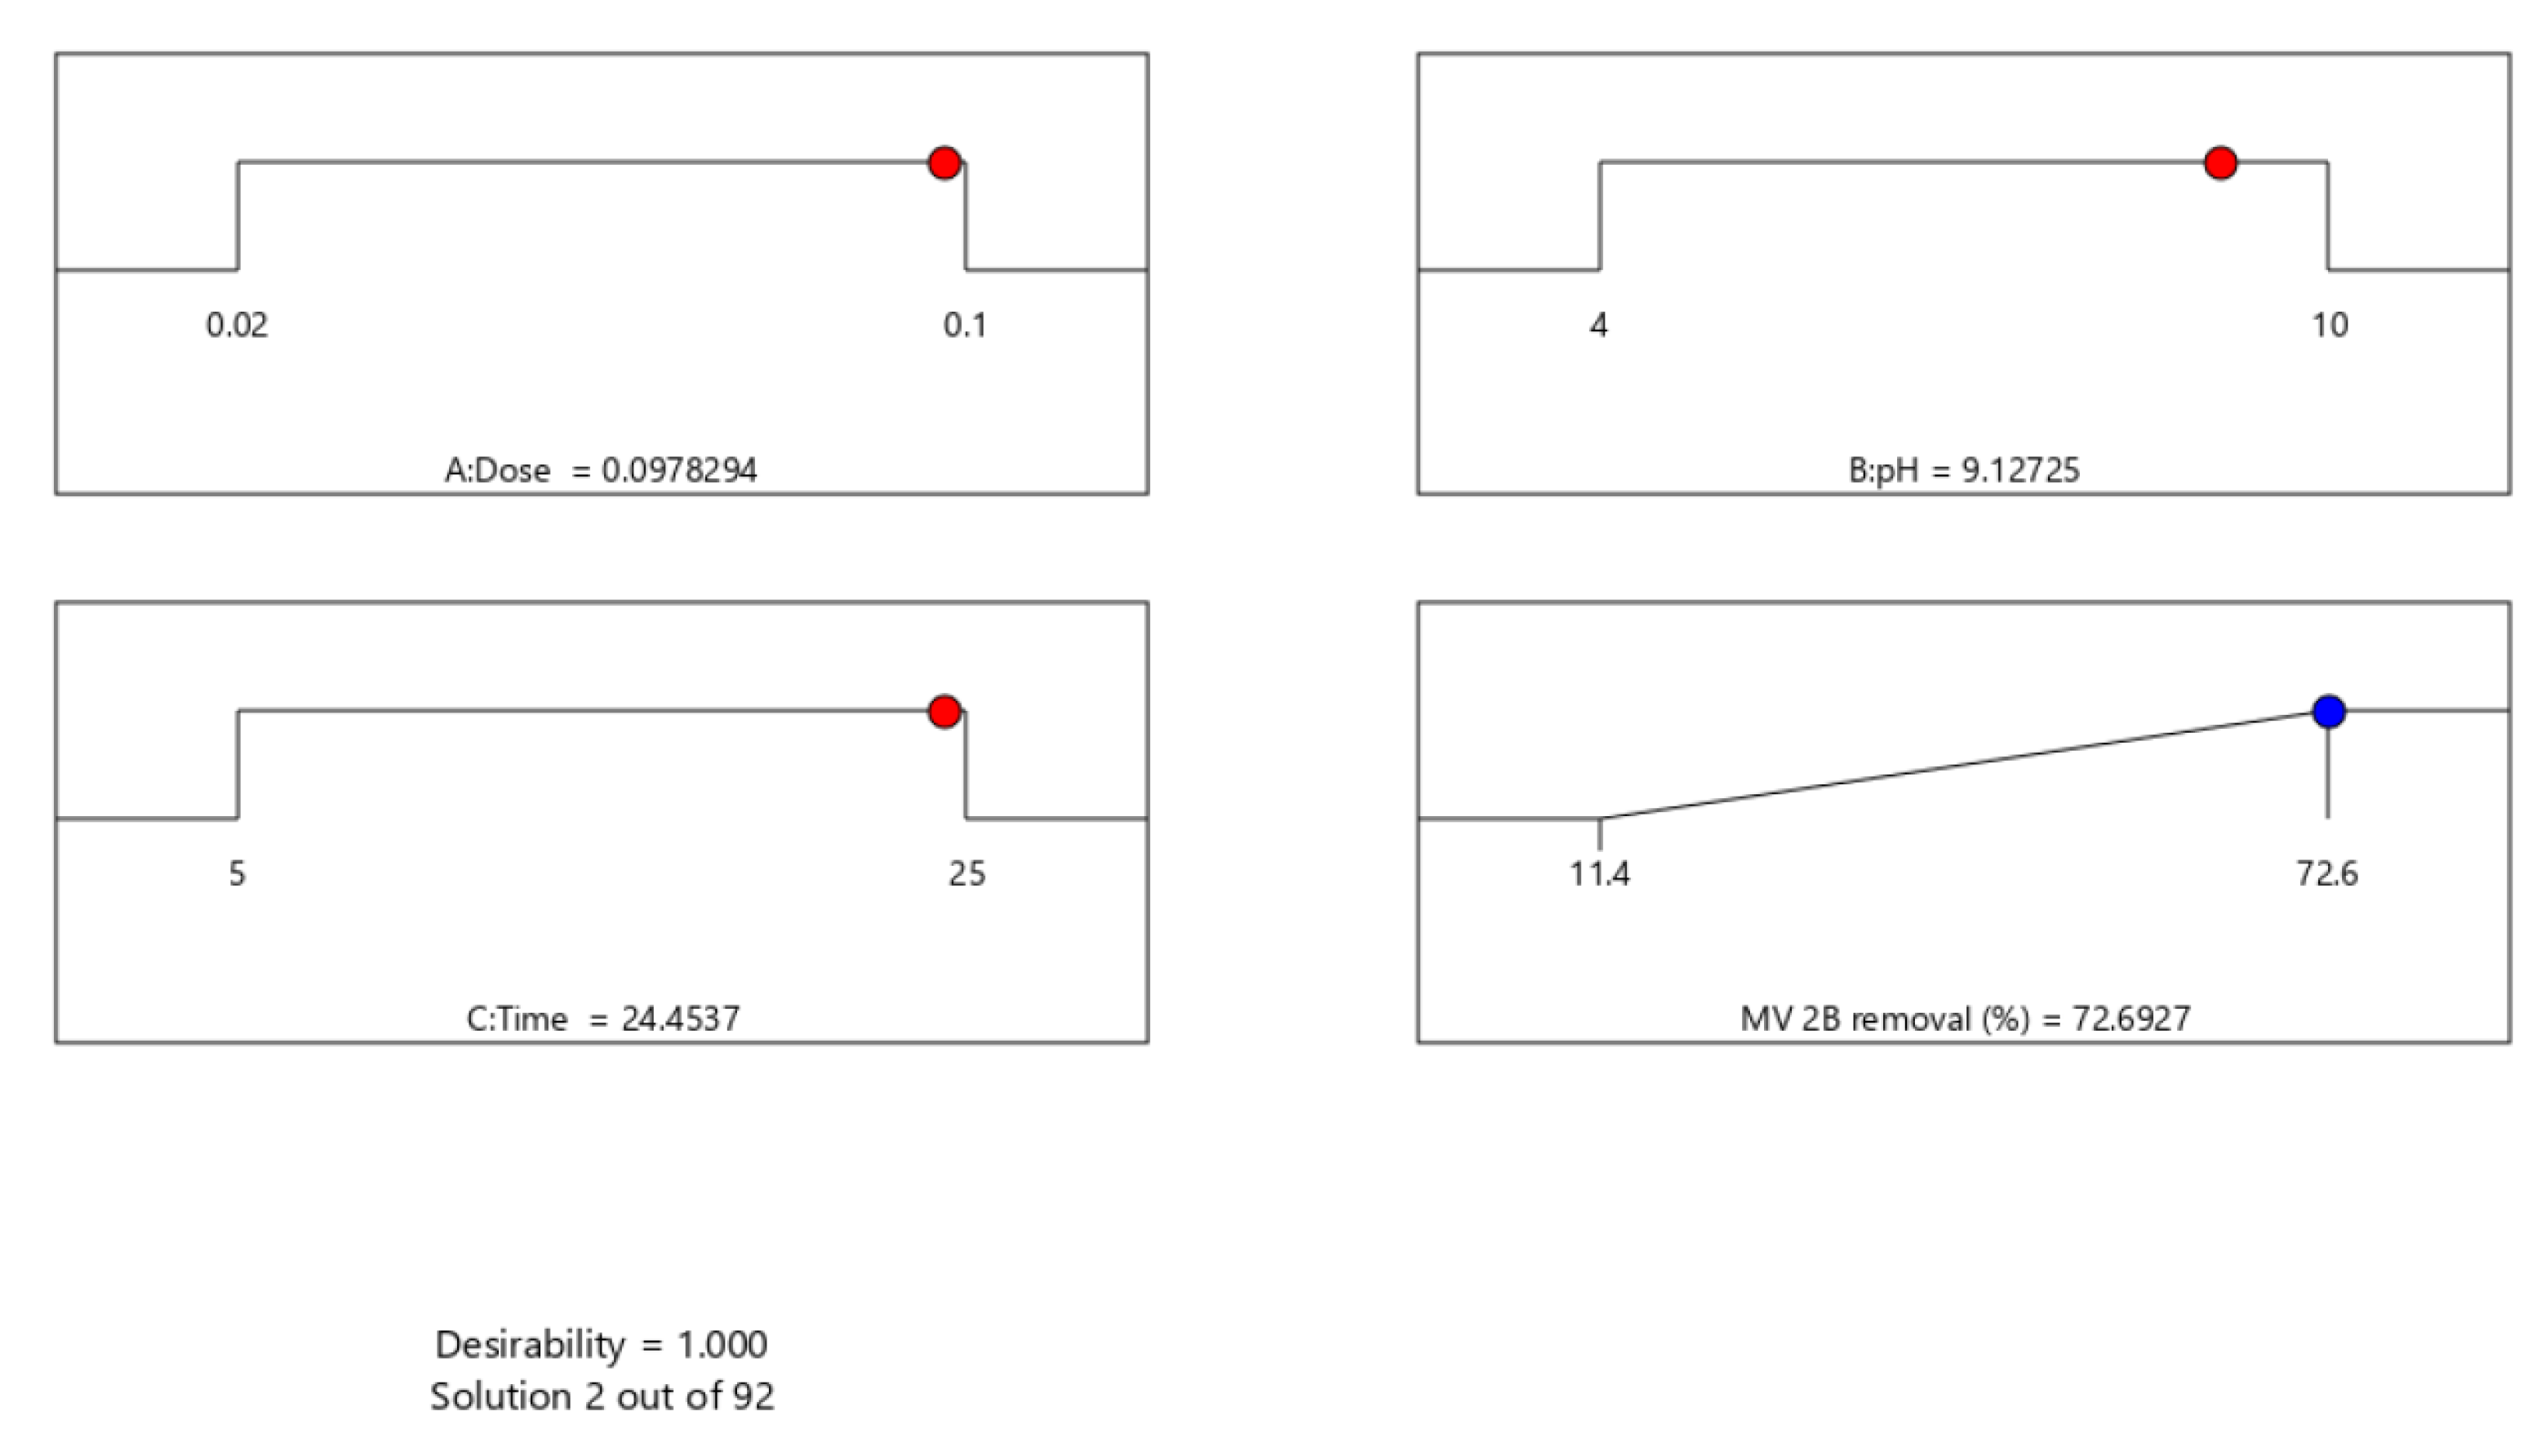
3.4. Optimization by the Desirability Functions

Derringer and Suich invented the desirability function, often known as Derringer’s desirability function, in 1980 [39] as a method for multivariate regression optimization. In this method, each independent output is converted into a desirability (di) value between 0 and 1. A desirability value of 1 indicates that the desired level of response was achieved, whereas a desirability value of 0 indicates that the desired level of response exceeded what was permitted [40]. Using Equation (6), the total desirability function is calculated.
D = d 1 × d 2 × × d n 1 n = Π i = 1 n d 1 1 n
where D indicates general desirability, n indicates response count, and di indicates independent desirability. The objective is to identify when desirability is most significant. The most efficient response for the reaction known as MV 2B removal (%) is produced by continuously optimizing inputs. A detailed description of this strategy was provided in prior research [39]. According to the numerical desirability function of the BBD model, the MCAC dosage (0.097 g), pH (9.12), and duration (24.4 min) were the circumstances that resulted in the best decolorization of MV 2B (90.0%) where the desirability value equals 1 (see Figure 6). In general, the data that were obtained by numerical optimization applying desirability functions concur with the results of empirical measurements. These results indicate that combined with the desirability function, the BBD model could optimize MV 2B adsorption via MCAC. Consequently, the optimum input parameters for MV 2B adsorption were utilized in the adsorption studies.

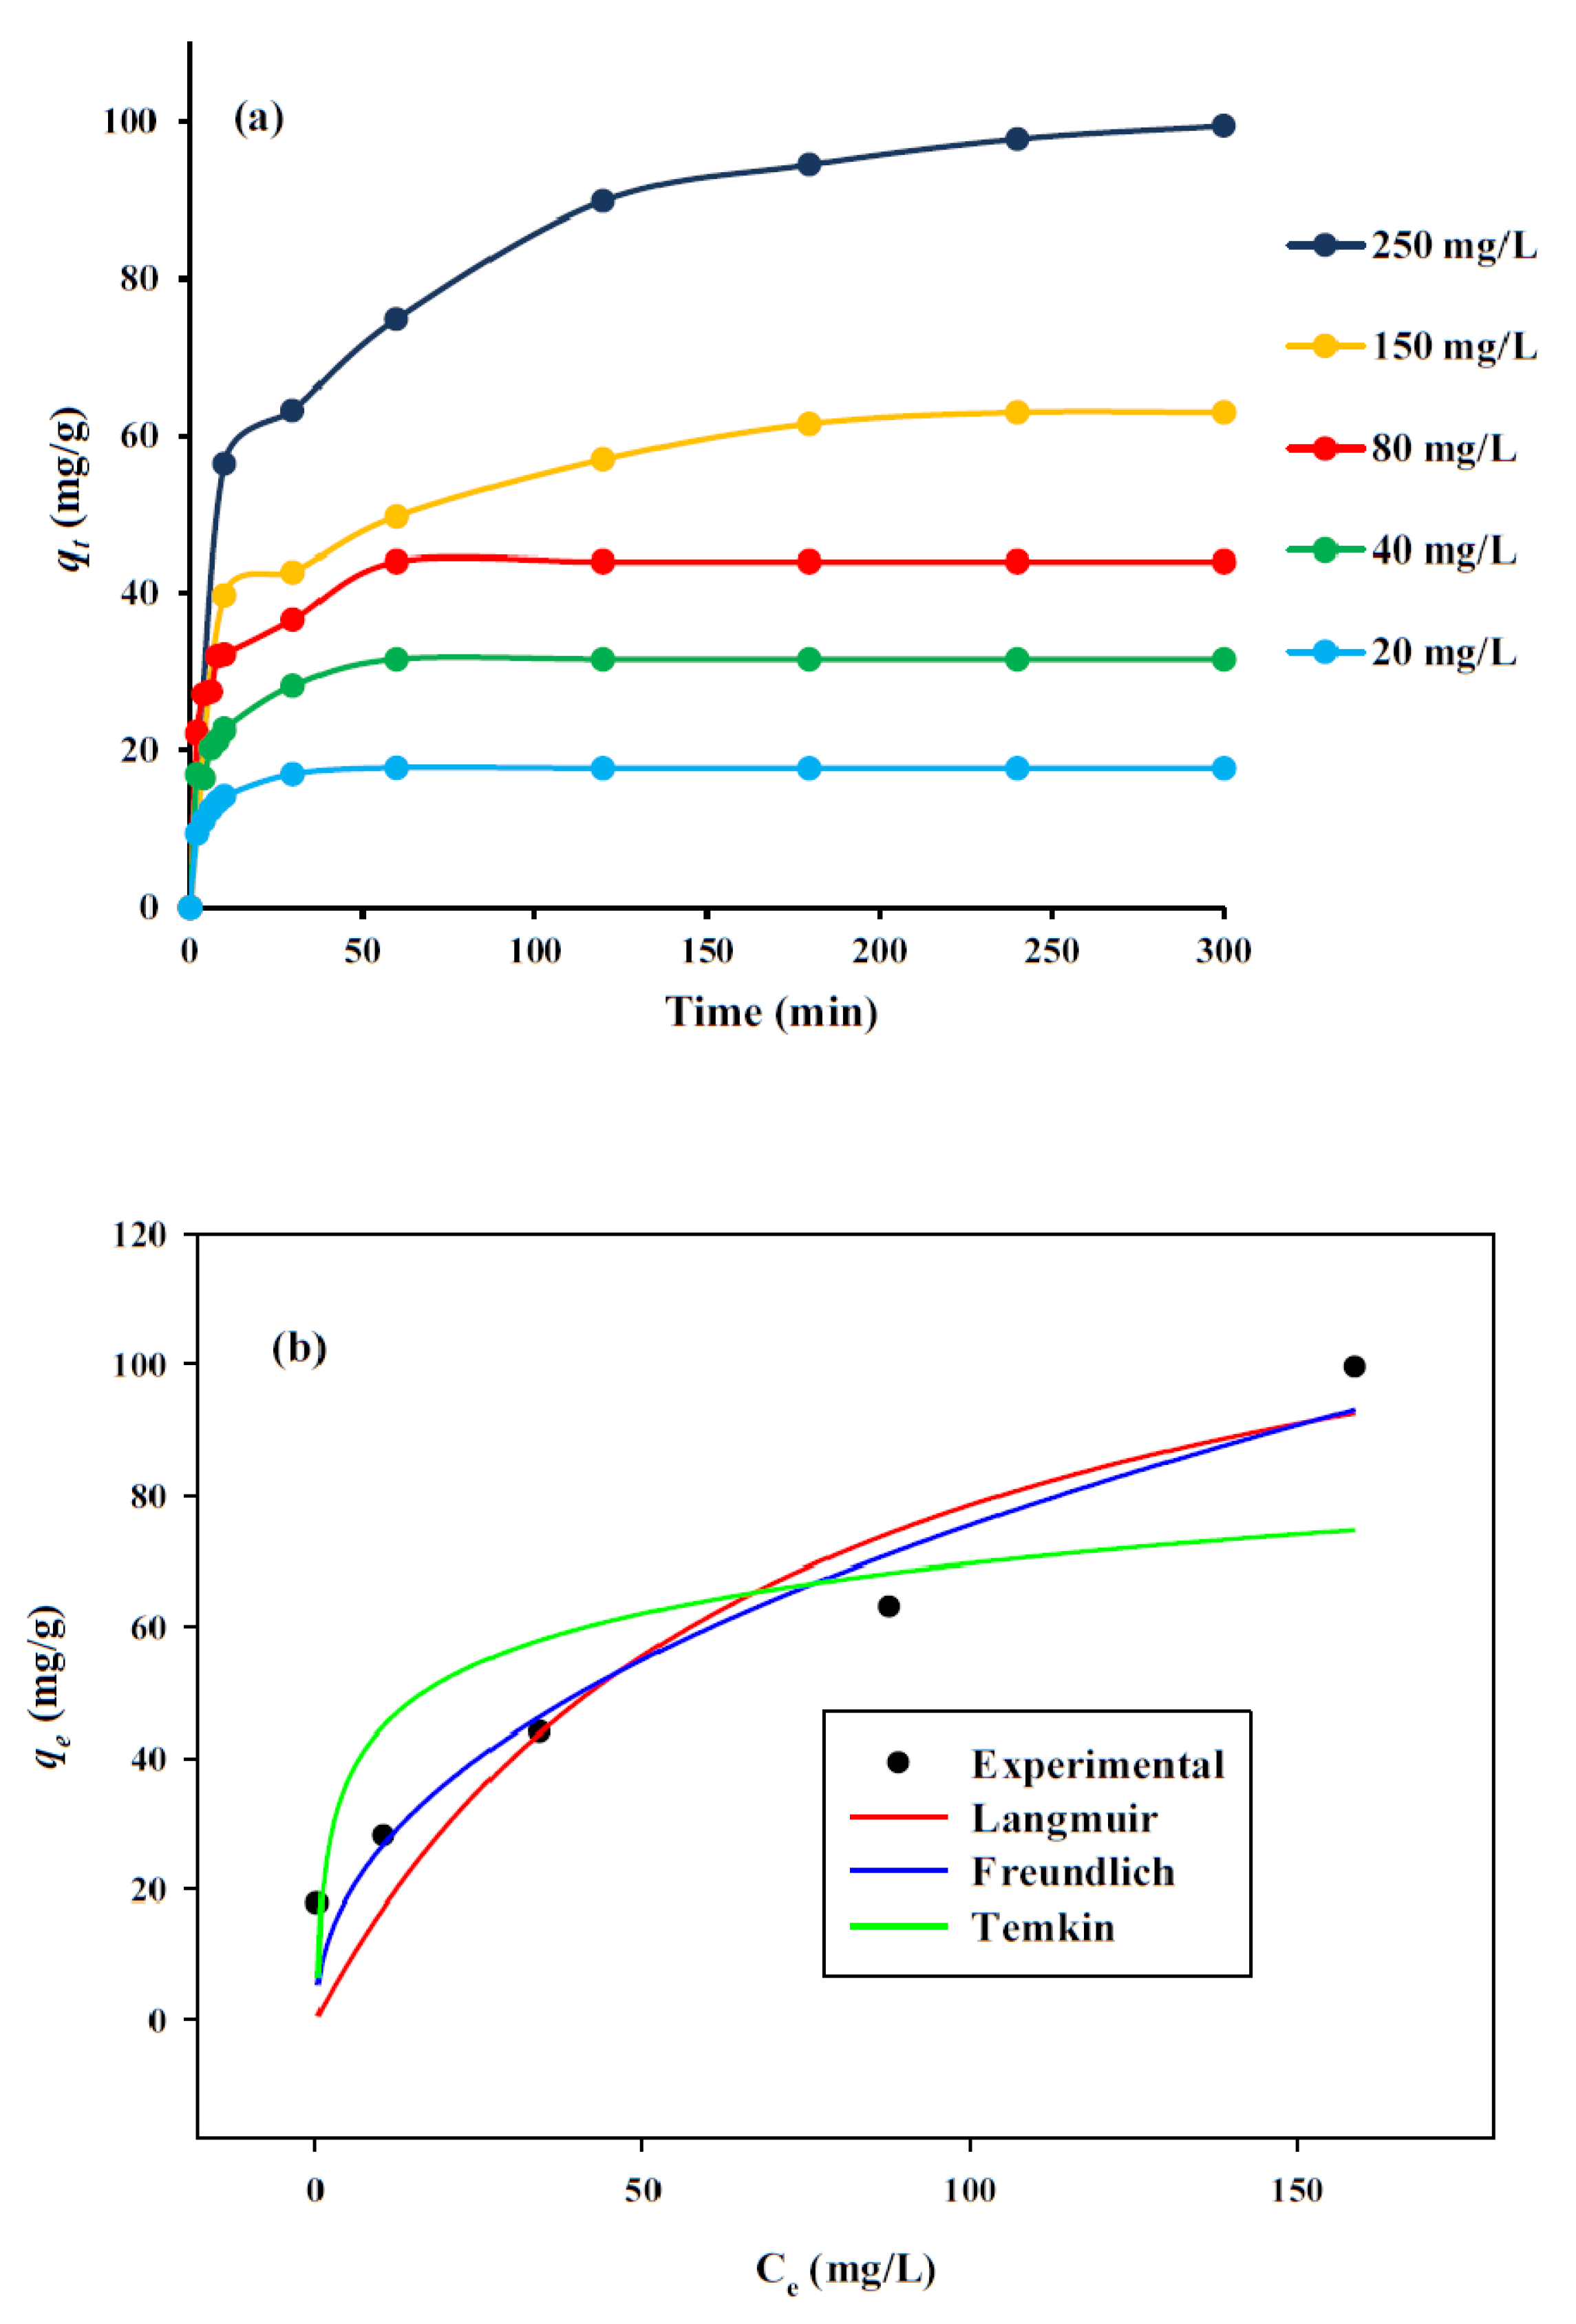
3.5. Adsorption Study

The influence of contact time and the initial concentration of MV 2B on the adsorption capabilities of MCAC dye to MV 2B was comprehensively investigated using a specified amount of MCAC (0.097/100 mL), a basic pH (9.12), and the varied concentration levels (20–250 mg/L). Profiles of MCAC uptake capabilities (qt, mg/g) for MV 2B dye absorption at various MV 2B concentrations are presented in Figure 7a. Figure 7a exhibits that the number of MV 2B dye molecules that were adsorbed on the MCAC surface extends from 17.77 to 99.47 mg/g as the MV 2B dye concentration is changed from 20 to 250 mg/L. The greater concentration gradient, which functions as a promoter to move MV 2B molecules to effective adsorption sites in MCAC, can be employed to interpret this adsorption process [41].

3.6. Adsorption Kinetics

The variables influencing the adsorption rate and the interactions between MCAC and MV 2B are exposed by the kinetics data. To assess the pathway of the MV 2B adsorption process via MCAC, two kinetic models were studied: pseudo-first order [42] and pseudo-second order [43] models. The mathematical formulae for both models are shown in Table 6, and the kinetic findings are presented in Table 7. The significant R2 values for PSO (see Table 6) in contrast to PFO indicate that it is appropriate for assessing the adsorption performance of MV 2B over MCAC. Furthermore, given the significant agreement between qe(cal) obtained by the PSO model and qe(cal), the PSO model is presumably acceptable to represent the adsorption rate of MV (exp). This implies that chemisorption is the rate limiting step in MV 2B adsorption onto MCAC [44].

3.7. Adsorption Isotherms

For determining the maximum adsorption capacity of MCAC and outlining the relationships between MCAC and MV 2B, adsorption isotherms are essential. To gain insight on the equilibrium adsorption data, adsorption isotherms such as the Freundlich, Langmuir, and Temkin models have been employed [45,46,47], as outlined in Table 6. Table 8 provides the calculated parameters that relate to the nonlinear curves of MV 2B adsorption profiles shown in Figure 7b. The adsorption of the MV 2B onto MCAC is consistent with the Freundlich model, according to the obtained R2 values that are listed in Table 7. This result demonstrates that multilayer adsorption takes place on a structurally heterogeneous MCAC [48]. The maximal adsorption of MCAC in this study was 134.1 mg/g. For the various materials that were employed for MV 2B uptake, the qmax achieved in this study was compared with the qmax value of them, as indicated in Table 9. MCAC’s high adsorption rate, as seen in Table 8, makes it a useful adsorbent for removing organic dyes from contaminated water.

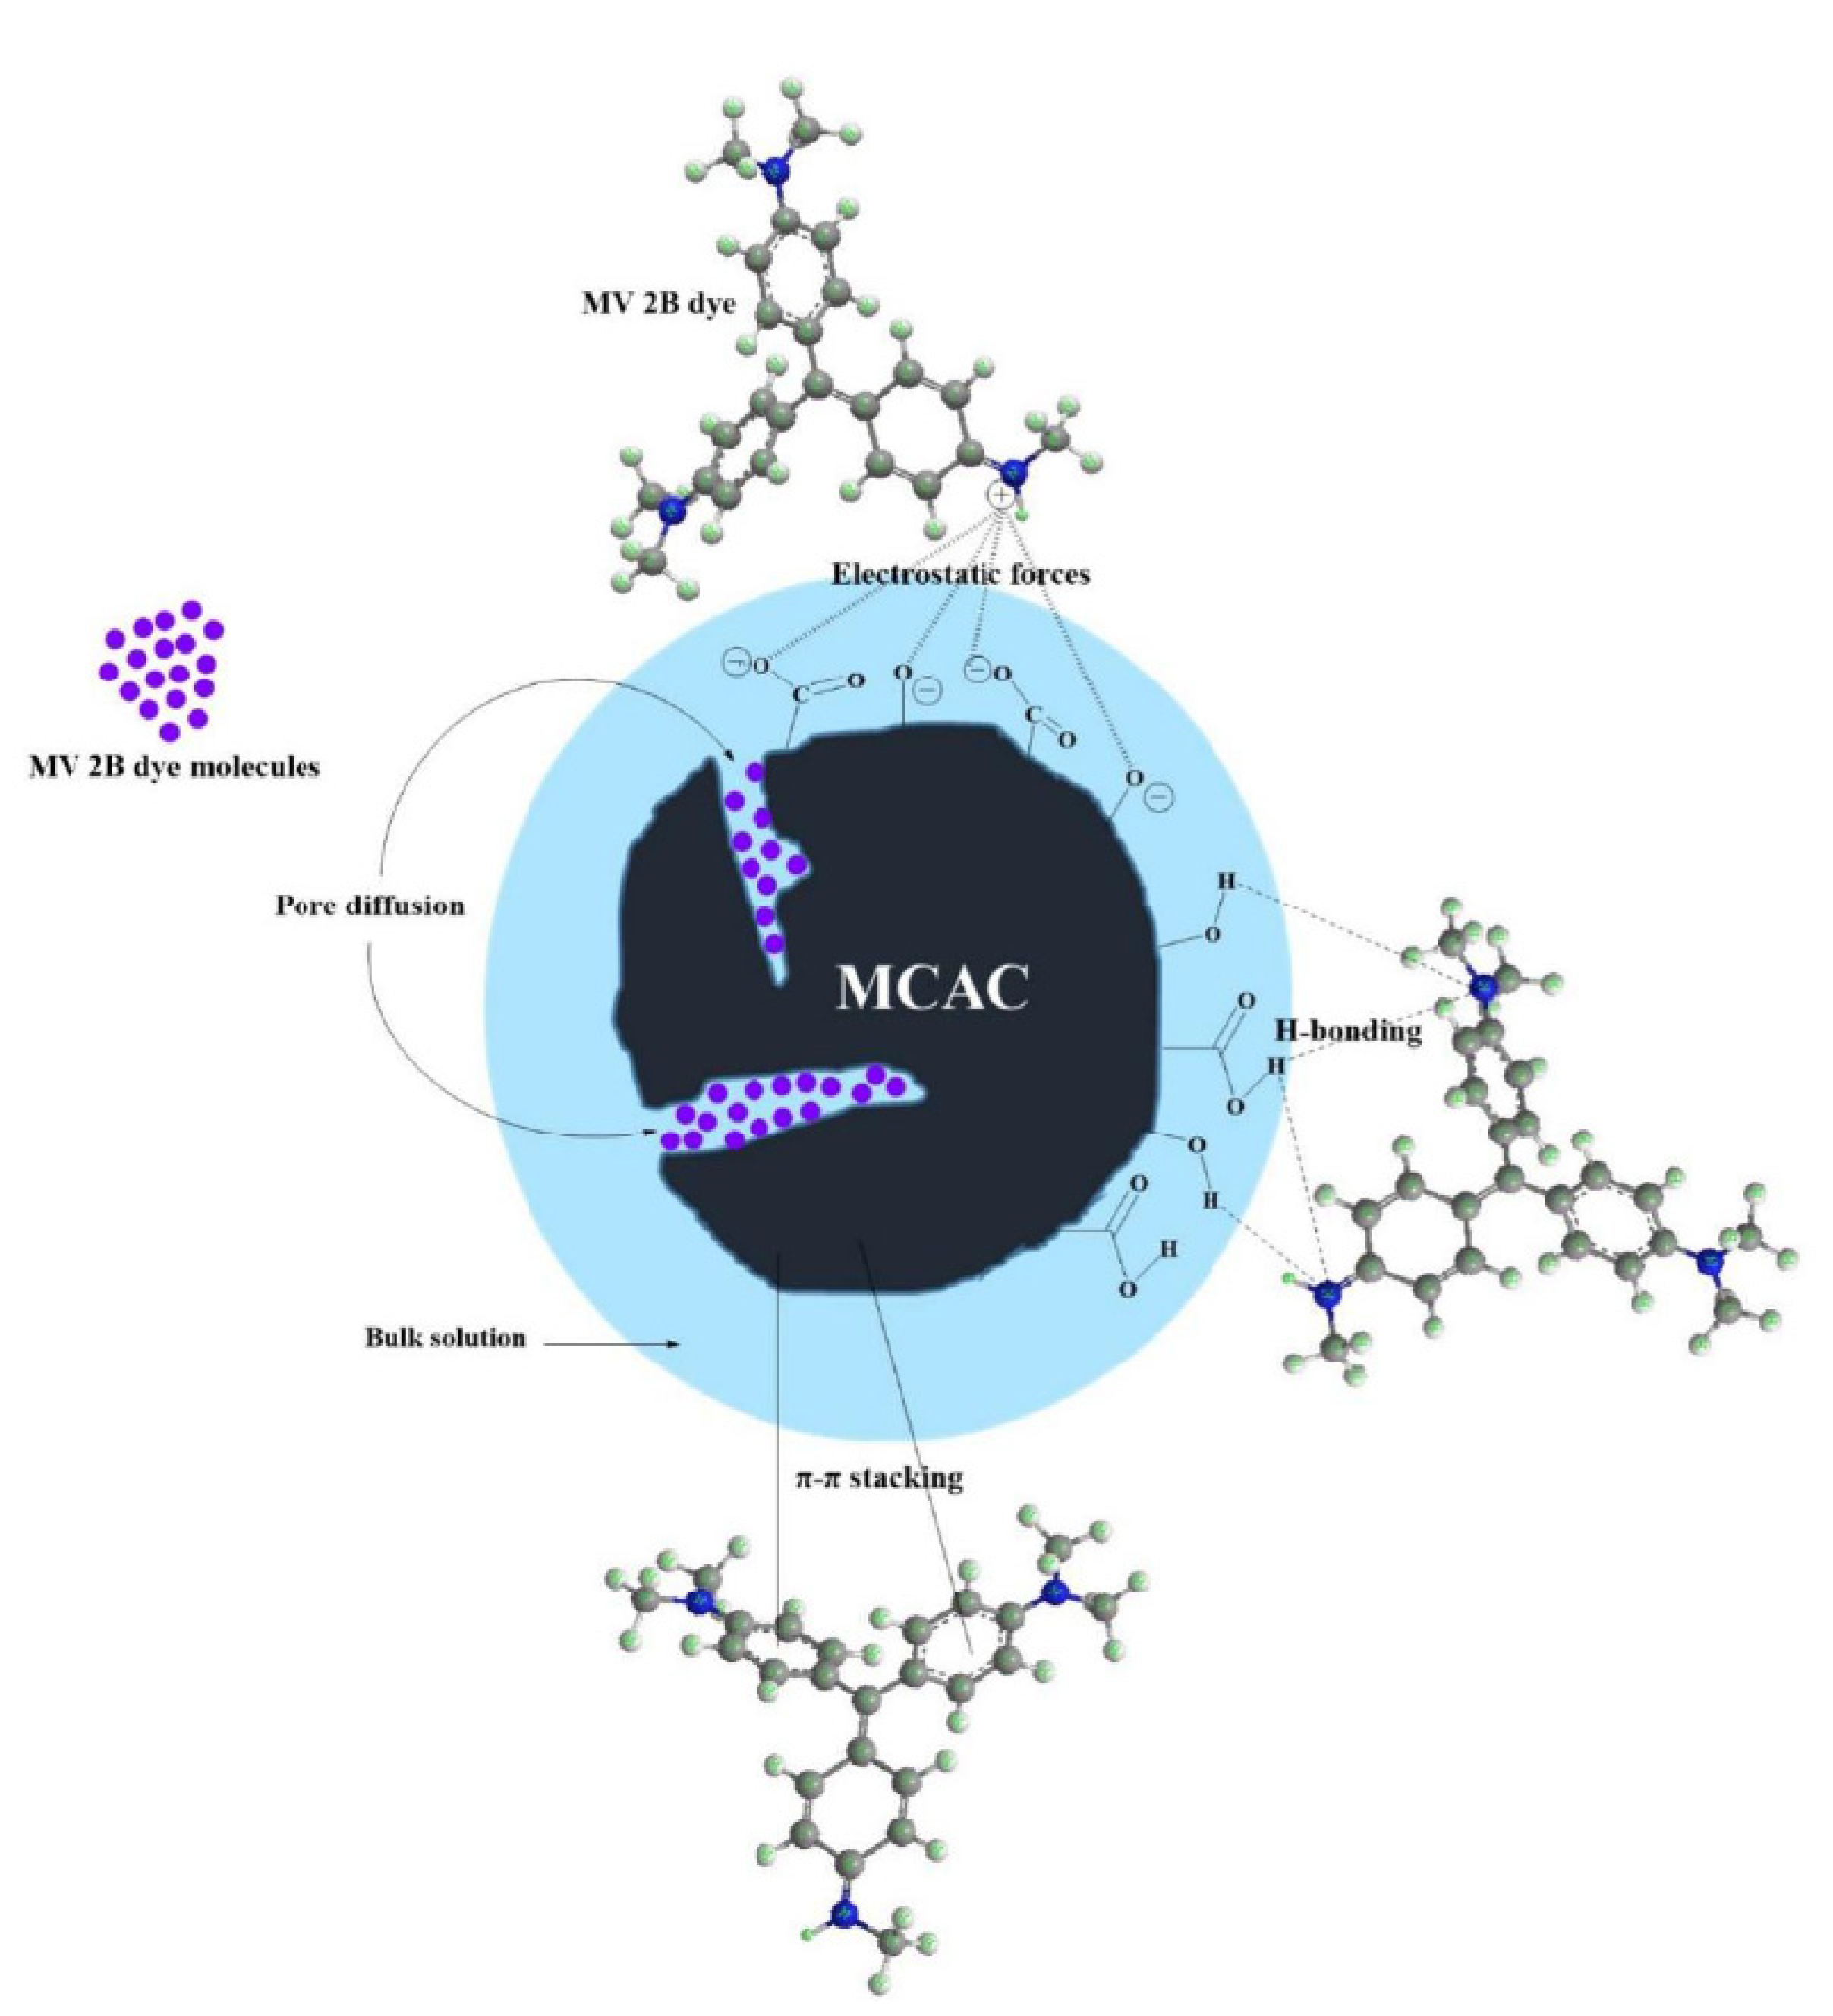
3.8. Adsorption Mechanism of MV 2B

Organic dyes (such as MV 2B dye) are typically adsorbed onto porous ACs through a variety of important interactions, such as electrostatic attraction, π-π stacking, hydrogen bonds, and pore diffusion [54]. Figure 8 shows the important interactions that are involved in the MV 2B adsorption. The molecular diameter of MV 2B is 1.24 nm, while the MCAC has a porous structure (mean pore width = 3.67 nm). As a consequence, MV 2B molecules can readily occupy the mesopores in the MCAC. According to the MV 2B adsorption results, the adsorption process took place in a basic environment (pH ˃ pHpzc). Electrostatic interactions make a significant contribution to the process that occurs in this medium and are critical for MV 2B adsorption. The adsorption sites (functional groups) of MCAC will adopt negatively charged (e.g., –O– and –COO–) sites in this environment, whereas MV 2B exists as a cation. On the surface of MCAC, functional groups possessing the H atom can establish hydrogen bonds with the N atoms of the MV 2B dye molecule. MCAC’s hexagonal structure and the benzene rings of the dye interact as donors and acceptors of electrons in a π-π stacking arrangement which aids in improving the affinity of the adsorption of MV 2B [15].

4. Conclusions

MCAC was successfully prepared from MC using microwave radiation assisted ZnCl2 activation at 600 W for 15 min with a constant mass ratio (1 g MC:2 g ZnCl2). According to the numerical desirability function of the BBD model, where the MCAC dosage (0.097 g), pH (9.12), and duration (24.4 min) were the variables that resulted in the best decolorization of MV 2B (90.0%). The dynamic and equilibrium findings for MV 2B adsorption demonstrate that the MV 2B adsorption process is distinguished by chemisorption and multilayer adsorption, with a qmax of MCAC equal to 134.1 mg/g. Electrostatic forces, π-π stacking, pore diffusion, and H-bonding all contribute to the adsorption of MV 2B dye onto the MCAC surface. This study demonstrates the potential to utilize MC as a low-cost precursor for the efficient synthesis of MAC and its use in the effective removal of cationic pollutants.

Author Contributions

S.A.M.: Conceptualization, data curation, formal analysis, investigation, methodology. A.S.A.: Validation, visualization, writing—original draft. S.N.A.B.: Supervision, Z.A.A.: Validation, resources, funding acquisition. L.D.W.: Writing—review and editing. A.H.J.: Supervision, conceptualization, data curation, investigation, methodology, writing—review and editing, Software. All authors have read and agreed to the published version of the manuscript.

Funding

The Researchers Supporting Project No. (RSP2023R1), King Saud University, Riyadh, Saudi Arabia.

Data Availability Statement

The datasets used and/or analyzed during the current study are available from the corresponding author on reasonable request.

Acknowledgments

The authors are thankful to the Faculty of Applied Sciences, Universiti Teknologi MARA (UiTM) Shah Alam, Malaysia for the research facilities. The first author (Salis A. Musa) is thankful to the Malaysian Technical Cooperation Programme for the Scholarship for postgraduate studies. The author (Zeid A. ALOthman) is grateful to the Researchers Supporting Project No. (RSP2023R1), King Saud University, Riyadh, Saudi Arabia.

Conflicts of Interest

The authors declare no conflict of interest.

References

  1. Yamil, L.D.O.; Georgin, J.; Franco, D.S.; Netto, M.S.; Grassi, P.; Piccilli, D.G.; Dotto, G.L. Powdered biosorbent from pecan pericarp (Carya illinoensis) as an efficient material to uptake methyl violet 2B from effluents in batch and column operations. Adv. Powder Technol. 2020, 31, 2843–2852. [Google Scholar]
  2. Wang, X.; Xu, Q.; Zhang, L.; Pei, L.; Xue, H.; Li, Z. Adsorption of methylene blue and Congo red from aqueous solution on 3D MXene/carbon foam hybrid aerogels: A study by experimental and statistical physics modeling. J. Environ. Chem. Eng. 2023, 11, 109206. [Google Scholar] [CrossRef]
  3. Arslan, H.; Bouchareb, R.; Arikan, E.B.; Dizge, N. Iron-loaded leonardite powder for Fenton oxidation of Reactive Red 180 dye removal. Environ. Sci. Pollut. Res. 2022, 29, 77071–77080. [Google Scholar] [CrossRef] [PubMed]
  4. Ikram, M.; Naeem, M.; Zahoor, M.; Hanafiah, M.M.; Oyekanmi, A.A.; Ullah, R.; Gulfam, N. Biological degradation of the azo dye basic orange 2 by Escherichia coli: A sustainable and ecofriendly approach for the treatment of textile wastewater. Water 2022, 14, 2063. [Google Scholar] [CrossRef]
  5. Mohammadhosseini, S.; Al-Musawi, T.J.; Romero Parra, R.M.; Qutob, M.; Gatea, M.A.; Ganji, F.; Balarak, D. UV and Visible Light Induced Photodegradation of Reactive Red 198 Dye and Textile Factory Wastewater on Fe2O3/Bentonite/TiO2 Nanocomposite. Minerals 2022, 12, 1417. [Google Scholar] [CrossRef]
  6. Pasichnyk, M.; Gaálová, J.; Minarik, P.; Václavíková, M.; Melnyk, I. Development of polyester filters with polymer nanocomposite active layer for effective dye filtration. Sci. Rep. 2022, 12, 973. [Google Scholar] [CrossRef]
  7. Saghir, S.; Pu, C.; Fu, E.; Wang, Y.; Xiao, Z. Synthesis of high surface area porous biochar obtained from pistachio shells for the efficient adsorption of organic dyes from polluted water. Surf. Interface 2022, 34, 102357. [Google Scholar] [CrossRef]
  8. Zhang, G.; Yang, H.; Jiang, M.; Zhang, Q. Preparation and characterization of activated carbon derived from deashing coal slime with ZnCl2 activation. Colloids Surf. A Physicochem. Eng. Asp. 2022, 641, 128124. [Google Scholar] [CrossRef]
  9. Husien, S.; El-taweel, R.M.; Salim, A.I.; Fahim, I.S.; Said, L.A.; Radwan, A.G. Review of activated carbon adsorbent material for textile dyes removal: Preparation, and modelling. Curr. Res. Green Sustain. Chem. 2022, 5, 100325. [Google Scholar] [CrossRef]
  10. Jasri, K.; Abdulhameed, A.S.; Jawad, A.H.; ALOthman, Z.A.; Yousef, T.A.; Al Duaij, O.K. Mesoporous activated carbon produced from mixed wastes of oil palm frond and palm kernel shell using microwave radiation-assisted K2CO3 activation for toxic dye removal: Optimization by response surface methodology. Diamond Relat. Mater. 2022, 131, 109581. [Google Scholar] [CrossRef]
  11. Pang, X.; Sellaoui, L.; Franco, D.; Dotto, G.L.; Georgin, J.; Bajahzar, A.; Li, Z. Adsorption of crystal violet on biomasses from pecan nutshell, para chestnut husk, araucaria bark and palm cactus: Experimental study and theoretical modeling via monolayer and double layer statistical physics models. Chem. Eng. J. 2019, 378, 122101. [Google Scholar] [CrossRef]
  12. Liu, X.; Li, Q.; Zhang, G.; Zheng, Y.; Zhao, Y. Preparation of activated carbon from Guhanshan coal and its effect on methane adsorption thermodynamics at different temperatures. Powder Technol. 2022, 395, 424–442. [Google Scholar] [CrossRef]
  13. Xue, H.; Gao, X.; Seliem, M.K.; Mobarak, M.; Dong, R.; Wang, X.; Li, Z. Efficient adsorption of anionic azo dyes on porous heterostructured MXene/biomass activated carbon composites: Experiments, characterization, and theoretical analysis via advanced statistical physics models. Chem. Eng. J. 2023, 451, 138735. [Google Scholar] [CrossRef]
  14. Abdollahzadeh, H.; Fazlzadeh, M.; Afshin, S.; Arfaeinia, H.; Feizizadeh, A.; Poureshgh, Y.; Rashtbari, Y. Efficiency of activated carbon prepared from scrap tires magnetized by Fe3O4 nanoparticles: Characterisation and its application for removal of reactive blue19 from aquatic solutions. Int. J. Environ. Anal. Chem. 2022, 102, 1911–1925. [Google Scholar] [CrossRef]
  15. Jawad, A.H.; Surip, S.N. Upgrading low rank coal into mesoporous activated carbon via microwave process for methylene blue dye adsorption: Box Behnken Design and mechanism study. Diamond Relat. Mater. 2022, 127, 109199. [Google Scholar] [CrossRef]
  16. Thi, V.H.T.; Lee, B.K. Great improvement on tetracycline removal using ZnO rod-activated carbon fiber composite prepared with a facile microwave method. J. hazard. Mater. 2017, 324, 329–339. [Google Scholar]
  17. Yağmur, H.K.; Kaya, İ. Synthesis and characterization of magnetic ZnCl2-activated carbon produced from coconut shell for the adsorption of methylene blue. J. Mol. Struct. 2021, 1232, 130071. [Google Scholar] [CrossRef]
  18. Pezoti, O., Jr.; Cazetta, A.L.; Souza, I.P.; Bedin, K.C.; Martins, A.C.; Silva, T.L.; Almeida, V.C. Adsorption studies of methylene blue onto ZnCl2-activated carbon produced from buriti shells (Mauritia flexuosa L.). J. Ind. Eng. Chem. 2014, 20, 4401–4407. [Google Scholar] [CrossRef]
  19. Madankar, C.S.; Bhagwat, S.S.; Meshram, P.D. Cd2+ removal from synthetic waters by ZnCl2-activated carbon. Mater. Today Proceed. 2021, 45, 4684–4688. [Google Scholar] [CrossRef]
  20. Mu’azu, N.D.; Zubair, M.; Jarrah, N.; Alagha, O.; Al-Harthi, M.A.; Essa, M.H. Sewage sludge ZnCl2-activated carbon intercalated MgFe—LDH nanocomposites: Insight of the sorption mechanism of improved removal of phenol from water. Int. J. Mol. Sci. 2020, 21, 1563. [Google Scholar] [CrossRef] [Green Version]
  21. Cifci, D.İ.; Aydin, N.; Atav, R.; Gunes, Y.; Gunes, E. Synthesis of ZnCl2 Activated Raising Powder of Cotton Fabrics for Acid and Basic Dye Adsorption: A Way to Reuse Cellulosic Wastes for Sustainable Production. J. Nat. Fib. 2022, 19, 14299–14317. [Google Scholar] [CrossRef]
  22. Zhao, H.; Zhong, H.; Jiang, Y.; Li, H.; Tang, P.; Li, D.; Feng, Y. Porous ZnCl2-activated carbon from shaddock peel: Methylene blue adsorption behavior. Materials 2022, 15, 895. [Google Scholar] [CrossRef] [PubMed]
  23. Lee, L.Z.; Ahmad Zaini, M.A. One-step ZnCl2/FeCl3 composites preparation of magnetic activated carbon for effective adsorption of rhodamine B dye. Toxin Rev. 2022, 41, 64–81. [Google Scholar] [CrossRef]
  24. Azmi, A.S.; Yusup, S.; Muhamad, S. The influence of temperature on adsorption capacity of Malaysian coal. Chem. Eng. Process. Process Intensif. 2006, 45, 392–396. [Google Scholar] [CrossRef]
  25. Dalvand, A.; Nabizadeh, R.; Ganjali, M.R.; Khoobi, M.; Nazmara, S.; Mahvi, A.H. Modeling of Reactive Blue 19 azo dye removal from colored textile wastewater using L-arginine-functionalized Fe3O4 nanoparticles: Optimization, reusability, kinetic and equilibrium studies. J. Magnet. Magnet. Mater. 2016, 404, 179–189. [Google Scholar] [CrossRef]
  26. Hanafi, N.A.M.; Abdulhameed, A.S.; Jawad, A.H.; ALOthman, Z.A.; Yousef, T.A.; Al Duaij, O.K.; Alsaiari, N.S. Optimized removal process and tailored adsorption mechanism of crystal violet and methylene blue dyes by activated carbon derived from mixed orange peel and watermelon rind using microwave-induced ZnCl2 activation. Biomass Conver. Bioref. 2022. [Google Scholar] [CrossRef]
  27. Sing, K.S. Reporting physisorption data for gas/solid systems with special reference to the determination of surface area and porosity (Recommendations 1984). Pure Appl. Chem. 1985, 57, 603–619. [Google Scholar] [CrossRef]
  28. Kaur, B.R.K.; Gupta, H. Bhunia, Chemically activated nanoporous carbon adsorbents from waste plastic for CO2 capture: Breakthrough adsorption study. Micropor. Mesopor. Mater. 2019, 282, 146–158. [Google Scholar] [CrossRef]
  29. Niu, J.; Miao, J.; Zhang, H.; Guo, Y.; Li, L.; Cheng, F. Focusing on the impact of inherent minerals in coal on activated carbon production and its performance: The role of trace sodium on SO2 and/or NO removal. Energy 2023, 263, 125638. [Google Scholar] [CrossRef]
  30. Oguz Erdogan, F.; Kopac, T. Comparison of activated carbons produced from Zonguldak Kozlu and Zonguldak Karadon hard coals for hydrogen sorption. Energy Sources Part A Recovery Util. Environ. Eff. 2020. [Google Scholar] [CrossRef]
  31. Ge, X.; Ma, X.; Wu, Z.; Xiao, X.; Yan, Y. Modification of coal-based activated carbon with nitric acid using microwave radiation for adsorption of phenanthrene and naphthalene. Res. Chem. Intermed. 2015, 41, 7327–7347. [Google Scholar] [CrossRef]
  32. Yuan, J.; Wang, Y.; Tang, M.; Hao, X.; Liu, J.; Zhang, G.; Zhang, Y. Effect of the pore structure of coal-based activated carbon and hydrogen addition on methane decomposition for the preparation of carbon nanotubes. Vacuum 2023, 207, 111584. [Google Scholar] [CrossRef]
  33. Wang, R.; Rish, S.K.; Lee, J.M.; Bahadur, R.; Vinu, A.; Tahmasebi, A.; Yu, J. N-doped porous carbon from direct KOH activation of Victorian brown coal for high-rate energy storage performance. J. Anal. Appl. Pyrol. 2022, 168, 105785. [Google Scholar] [CrossRef]
  34. Tamarkina, Y.V.; Kucherenko, V.A.; Shendrik, T.G. Nanoporous brown coal adsorbents prepared by alkaline activation with thermal shock. Solid Fuel Chem. 2012, 46, 289–294. [Google Scholar] [CrossRef]
  35. Hassani, A.; Alidokht, L.; Khataee, A.R.; Karaca, S. Optimization of comparative removal of two structurally different basic dyes using coal as a low-cost and available adsorbent. J. Taiwan Inst. Chem. Eng. 2014, 45, 1597–1607. [Google Scholar] [CrossRef]
  36. Zain, Z.M.; Abdulhameed, A.S.; Jawad, A.H.; ALOthman, Z.A.; Yaseen, Z.M. A pH-Sensitive Surface of Chitosan/Sepiolite Clay/Algae Biocomposite for the Removal of Malachite Green and Remazol Brilliant Blue R Dyes: Optimization and Adsorption Mechanism Study. J. Polym. Environ. 2022, 31, 501–518. [Google Scholar] [CrossRef]
  37. Ahmad, M.A.; Puad, N.A.A.; Bello, O.S. Kinetic, equilibrium and thermodynamic studies of synthetic dye removal using pomegranate peel activated carbon prepared by microwave-induced KOH activation. Water Resour. Ind. 2014, 6, 18–35. [Google Scholar] [CrossRef] [Green Version]
  38. Ahmad, M.A.; Eusoff, M.A.; Oladoye, P.O.; Adegoke, K.A.; Bello, O.S. Statistical optimization of Remazol Brilliant Blue R dye adsorption onto activated carbon prepared from pomegranate fruit peel. Chem. Data Collect. 2020, 28, 100426. [Google Scholar] [CrossRef]
  39. Shengli, S.; Junping, L.; Qi, L.; Fangru, N.; Jia, F.; Shulian, X. Optimized preparation of Phragmites australis activated carbon using the Box-Behnken method and desirability function to remove hydroquinone. Ecotoxicol. Environ. Saf. 2018, 165, 411–422. [Google Scholar] [CrossRef]
  40. Abdulhameed, A.S.; Jawad, A.H.; Kashi, E.; Radzun, K.A.; ALOthman, Z.A.; Wilson, L.D. Insight into adsorption mechanism, modeling, and desirability function of crystal violet and methylene blue dyes by microalgae: Box-Behnken design application. Algal Res. 2022, 67, 102864. [Google Scholar] [CrossRef]
  41. Baig, U.; Uddin, M.K.; Gondal, M.A. Removal of hazardous azo dye from water using synthetic nano adsorbent: Facile synthesis, characterization, adsorption, regeneration and design of experiments. Colloids Surf. A Physicochem. Eng. Asp. 2020, 584, 124031. [Google Scholar] [CrossRef]
  42. Lagergren, S. Zur theorie der sogenannten adsorption geloster stoffe. Vet. Akad. Handl. 1898, 24, 1–39. [Google Scholar]
  43. Ho, Y.S.; McKay, G. Sorption of dye from aqueous solution by peat. Chem. Eng. J. 1998, 70, 115–124. [Google Scholar] [CrossRef]
  44. Theamwong, N.; Intarabumrung, W.; Sangon, S.; Aintharabunya, S.; Ngernyen, Y.; Hunt, A.J.; Supanchaiyamat, N. Activated carbons from waste Cassia bakeriana seed pods as high-performance adsorbents for toxic anionic dye and ciprofloxacin antibiotic remediation. Bioresour. Technol. 2021, 341, 125832. [Google Scholar] [CrossRef]
  45. Langmuir, I. The adsorption of gases on plane surfaces of glass, mica and platinum. J. Am. Chem. Soc. 1918, 40, 1361–1403. [Google Scholar] [CrossRef] [Green Version]
  46. Frenudlich, H.M.F. Over the adsorption in solution. J. Phys. Chem. 1906, 57, 385–471. [Google Scholar]
  47. Temkin, M.I. Kinetics of ammonia synthesis on promoted iron catalysts. Acta Physiochim. URSS 1940, 12, 327–356. [Google Scholar]
  48. Khan, T.A.; Nouman, M.; Dua, D.; Khan, S.A.; Alharthi, S.S. Adsorptive scavenging of cationic dyes from aquatic phase by H3PO4 activated Indian jujube (Ziziphus mauritiana) seeds based activated carbon: Isotherm, kinetics, and thermodynamic study. J. Saudi Chem. Soc. 2022, 26, 101417. [Google Scholar] [CrossRef]
  49. Kooh, M.R.R.; Lim, L.B.; Dahri, M.K.; Lim, L.H.; Sarath Bandara, J.M.R. Azolla pinnata: An efficient low cost material for removal of methyl violet 2B by using adsorption method. Waste Biomass Valori. 2015, 6, 547–559. [Google Scholar] [CrossRef]
  50. Kooh, M.R.R.; Dahri, M.K.; Lim, L.B.; Lim, L.H.; Malik, O.A. Batch adsorption studies of the removal of methyl violet 2B by soya bean waste: Isotherm, kinetics and artificial neural network modelling. Environ. Earth Sci. 2016, 75, 1–14. [Google Scholar] [CrossRef]
  51. Lim, L.B.; Priyantha, N.; Hei Ing, C.; Khairud Dahri, M.; Tennakoon, D.T.B.; Zehra, T.; Suklueng, M. Artocarpus odoratissimus skin as a potential low-cost biosorbent for the removal of methylene blue and methyl violet 2B. Desalin. Water Treat. 2015, 53, 964–975. [Google Scholar]
  52. Mehr, H.V.; Saffari, J.; Mohammadi, S.Z.; Shojaei, S. The removal of methyl violet 2B dye using palm kernel activated carbon: Thermodynamic and kinetics model. Int. J. Environ. Sci. Technol. 2020, 17, 1773–1782. [Google Scholar] [CrossRef]
  53. Foroutan, R.; Mohammadi, R.; Ahmadi, A.; Bikhabar, G.; Babaei, F.; Ramavandi, B. Impact of ZnO and Fe3O4 magnetic nanoscale on the methyl violet 2B removal efficiency of the activated carbon oak wood. Chemosphere 2022, 286, 131632. [Google Scholar] [CrossRef]
  54. Wathukarage, A.; Herath, I.; Iqbal, M.C.M.; Vithanage, M. Mechanistic understanding of crystal violet dye sorption by woody biochar: Implications for wastewater treatment. Environ. Geochem. Health 2019, 41, 1647–1661. [Google Scholar] [CrossRef] [PubMed]
Figure 1. The N2 adsorption-desorption isotherms and pore size distribution (inset) of MCAC.
Minerals 13 00438 g001
Figure 2. FTIR spectra of (a) MCAC and (b) MCAC after MV 2B adsorption.
Minerals 13 00438 g002
Figure 3. SEM images and EDX spectra of (a) MC, (b) MCAC, and (c) MCAC after MV 2B adsorption.
Minerals 13 00438 g003
Figure 4. (a) Normal probability plot of residuals for MV 2B removal and (b) the plot of the relationship between the predicted and actual values of MV 2B removal.
Minerals 13 00438 g004
Figure 5. 3D plots of MV 2B removal showing (a) AB and (b) AC interactions, while (c) pHpzc of MCAC.
Minerals 13 00438 g005
Figure 6. Desirability ramps for optimizing essential adsorption inputs for MV 2B removal (%) using MCAC.
Minerals 13 00438 g006
Figure 7. (a) Effect of MV 2B initial concentrations on adsorption ability of MCAC and (b) adsorption isotherms (Langmuir, Freundlich, and Temkin models) of MV 2B onto MCAC (dosage = 0.097 g, solution pH = 9.12, temperature = 25 °C, agitation speed = 90 rpm, and volume of solution = 100 mL).
Minerals 13 00438 g007
Figure 8. Illustration of the possible interaction that occur between the MCAC surface and MV 2B including electrostatic interactions, hydrogen bonding, pore diffusion, π-π stacking along with pore diffusion.
Minerals 13 00438 g008
Table 1. Codes and actual variables and their levels in BBD.
CodesVariablesLevel 1 (−1)Level 2 (0)Level 3 (+1)
AMCAC dose (g)0.020.060.1
BpH4710
CTime (min)51525
Table 2. Experimental matrix of BBD approach and corresponding response (MV 2B removal (%)).
RunA: Dose (g)B: pHC: Time (Min) MV 2B Removal (%)
10.0241528.2
20.141556.9
30.02101525.1
40.1101572.6
50.027511.4
60.17531.1
70.0272517.5
80.172559.6
90.064532.3
100.0610534.2
110.0642548.5
120.06102557.2
130.0671539.2
140.0671534.3
150.0671535.2
160.0671533.5
170.0671537.4
Table 3. BET analysis results of MCAC adsorbent.
CharacteristicsMCAC
Surface area (m2/g)798.18
Langmuir surface area (m2/g)1011
Pore volume (cm3/g)0.440
Pore diameter (nm)3.67
Table 4. Comparison of the surface area of coal from different sources.
CoalActivatorSurface Area (m2/g)Ref.
MCACZnCl2798.18 Present study
Hongshaquan coalNaCl686 [29]
Zonguldak Kozlu coalH3PO4636 [30]
Anthracite coalHNO3677.73[31]
Shaanxi coalKOH411–1733[32]
Victorian brown coalKOH687[33]
Brown coalNaOH585[34]
Table 5. Analysis of variance (ANOVA) for MV 2B removal.
SourceSum of SquaresdfMean SquareF-Valuep-Value
Model3973.239441.4760.58<0.0001
A-Dose2380.5012380.50326.65<0.0001
B-pH67.28167.289.230.0189
C-Time680.811680.8193.42<0.0001
AB88.36188.3612.120.0102
AC125.441125.4417.210.0043
BC11.56111.561.590.2482
11.95111.951.640.2411
553.461553.4675.95<0.0001
79.13179.1310.860.0132
Residual51.0177.29
Lack of Fit29.0639.691.770.2924
Pure Error21.9545.49
Cor Total4024.2416
Table 6. Adsorption kinetics and non-linear isotherm models.
ModelsEquationsParameters
Pseudo-first order
(PFO)
q t = q e 1 e k 1 t k 1 : pseudo-first-order rate constant (1 min)
Pseudo-second order (PSO) q t = q e 2 k 2 t 1 + q e K 2 t k 2 : pseudo-second-order rate constant (g/mg min)
Langmuir q e = q m K L C e 1 + K L C e q m : monolayer capacity (mg/g)
KL: Langmuir constant (L/mg)
Freundlich q e = K F C e 1 n KF: Freundlich constant (mg/g) (L/mg)1/n
n: adsorption intensity
Temkin q e = R T b T l n K T C e K T : Temkin constant (L/mg)
b T : heat of adsorption (J/mol)
Table 7. PFO and PSO kinetic parameters for MV 2B adsorption onto MCAC.
Concentration
(mg/L)
qe exp. (mg/g)PFOPSO
qe cal (mg/g) k1 (1/min)R2R2k2 × 10−2
(g/mg min)
qe cal (mg/g)
2017.7717.290.23650.950.992.355017.94
4028.0830.510.18890.920.971.013531.73
8043.9742.030.21350.920.970.821343.84
15063.0455.440.17330.810.900.449458.54
25099.4791.260.05890.910.960.090698.68
Table 8. The parameters of isotherm models for MV 2B adsorption onto MCAC.
Adsorption IsothermParameterValue
Langmuirqmax (mg/g)134.1
Ka (L/mg)0.014
R20.90
FreundlichKf (mg/g) (L/mg)1/n9.21
n2.18
R20.96
TemkinKT (L/mg)1.77
bT (J/mol)227.01
R20.78
Table 9. A comparison of MV 2B adsorption capacities by various adsorbents.
Adsorbentsqmax (mg/g)References
MCAC134.1Present study
Azolla pinnata 194.2 [49]
Soya bean waste 180.7 [50]
Artocarpus odoratissimus (Tarap) skin 137.3 [51]
Palm kernel activated carbon 107.3 [52]
Activated carbon oak wood/ZnO/Fe3O4 48.59 [53]
Disclaimer/Publisher’s Note: The statements, opinions and data contained in all publications are solely those of the individual author(s) and contributor(s) and not of MDPI and/or the editor(s). MDPI and/or the editor(s) disclaim responsibility for any injury to people or property resulting from any ideas, methods, instructions or products referred to in the content.

