1. Introduction
The most important feature of coal seam occurrence in the Shendong coal field in Northern China is shallow burial. The movement and stress distribution characteristics of overlying strata in shallow coal seam stopes are quite different from those in non-shallow coal seams [
1,
2,
3,
4]. Practice has proved that the ground pressure in shallow coal seam is not reduced due to shallow mining depth; rather, abnormally strong ground pressure develops [
5,
6,
7]. Under the condition of large-scale and high-rate mining, the shallow coal seam has the characteristics of large mining space, strong mining disturbance, evident dynamic load impact, and overlying rock cutting and sinking. All these factors cause the sudden release and transfer of energy in a large-scale system. The dynamic process of transmission is intense and complex, and shield crushing disasters such as shield impact load occur from time to time [
8,
9,
10,
11,
12]. Assessment of longwall working stability can be determined by analyzing the pressure in the shield legs and the analysis of roof capacity [
13,
14]. Some mines in the Shendong coal field have one-sided pursuits of large resistance supports in shield selection due to the lack of selection criteria, and this practice results in high shield cost and difficulty in withdrawal. Therefore, it is necessary to study the characteristics of the shield resistance scientifically to reasonably determine the shield resistance in shallow mining working face.
In this study, comprehensive research by means of theoretical analysis, numerical simulation, and field measurement is conducted. Based on the movement law of the overlying strata and the working characteristics of the shield in the 12311-longwall panel of the Huojitu Coal Mine in the Shendong coal field, eight numerical simulation experiments are designed to analyze the movement laws of the overlying strata and the resistance of the shield under different mining height conditions. By means of dimensional analysis, an explicit relation between the shield resistance and mining height is derived and fitted, which provides a reference for the shield selection under the condition of shallow buried coal seam mining.
2. Numerical Simulation Model
Generally, when the working face mining height is 1.3–3.5 m, it is considered a conventional longwall panel, and when it is 3.5–5.0 m, it is called a large longwall panel. When the mining height is more than 5.0 m, it is called a super-large longwall panel. The coal seam height in the Shendong coal field is mostly 2.5–7.0 m, involving three types of longwall mining conditions.
Eight numerical simulation experiments were designed to simulate the shield resistance variation for the aforementioned three types of mining height conditions. When the mining height is greater than 5.0 m, the shield resistance is more sensitive to change. Therefore, a mining height interval of 0.5 m is selected in this case. Thus, the eight simulated mining heights are 2.5 m, 3.5 m, 4.5 m, 5.0 m, 5.5 m, 6.0 m, 6.5 m, and 7.0 m. The software Continuum-based Distinct Element Method, or CDEM, is used for all numerical simulations. CDEM simulates the coupling between the shield and surrounding rock during the mining process and monitors the shield resistance under different mining height conditions.
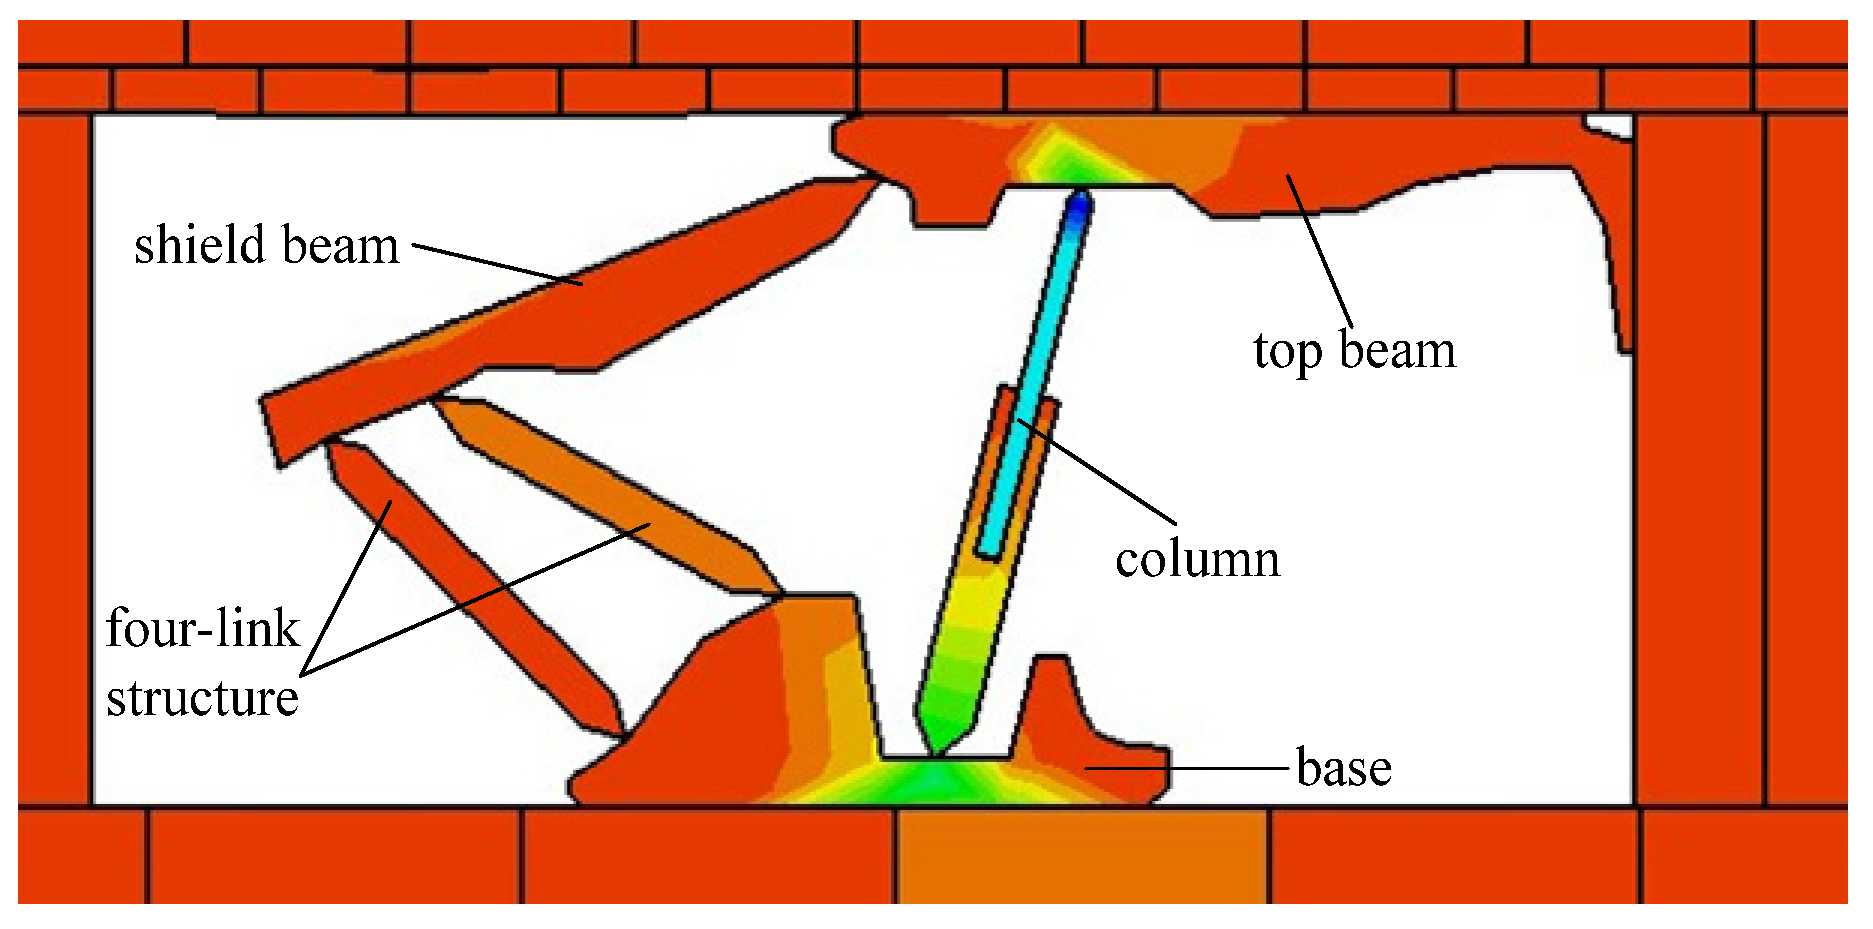
2.1. Shield Model
Based on the actual working characteristics and size of the shield, a two-dimensional numerical model of the shield is established in the CDEM simulation software, as shown in
Figure 1. The top beam, column, base, shield beam, and four-link structure of the shield can be linked with the lifting of the column. In the numerical simulation, the shield parameters refer to steel. The main parameters are the elastic modulus of 200 GPa, tensile strength of 1.23 GPa, and cohesion of 2.24 GPa. The setting and yield load are set on the shield column, and the direction of the force is along the column axis, which is consistent with the actual working characteristics of the shield [
15,
16].
In the simulation, the shield column first rises under the action of the setting load, which drives the shield top beam to rise and contact with the coal seam roof. The computer program compares the setting load of the shield with the weight of the overlying strata on the top beam. When the weight of the overlying strata acting on the shield top beam is less than the setting load, the shield column continues to rise, and the top beam moves upward to support the roof until the setting load is equal to the weight of the overlying strata acting on the top beam. When the weight of the overlying strata acting on the shield is greater than the shield setting load and less than the yield load, the shield column shrinks, and the resistance of the shield increases (the reduction in the shield column is proportional to the shield resistance). The shield column is lowered to yield pressure, and the numerical software program compares the shield resistance with the weight of the overlying strata acting on the top beam again, until the shield column stops shrinking when the resistance of the shield is equal to the weight of the overlying strata acting on it. When the weight of the overlying strata acting on the shield top beam exceeds the shield yield load, the shield column shrinks, and the shield maintains the yield load. Meanwhile, the shield column drops to yield pressure until the weight of the overlying strata is equal to or less than the yield load, and the shield column stops falling. During the whole mining simulation process, the shield resistance and the weight of the overlying strata acting on it are calculated and judged simultaneously. According to the judgment of results, the shield column makes corresponding lifting and lowering actions, thus realizing the numerical simulation of the coupling between the shield and the surrounding rock.
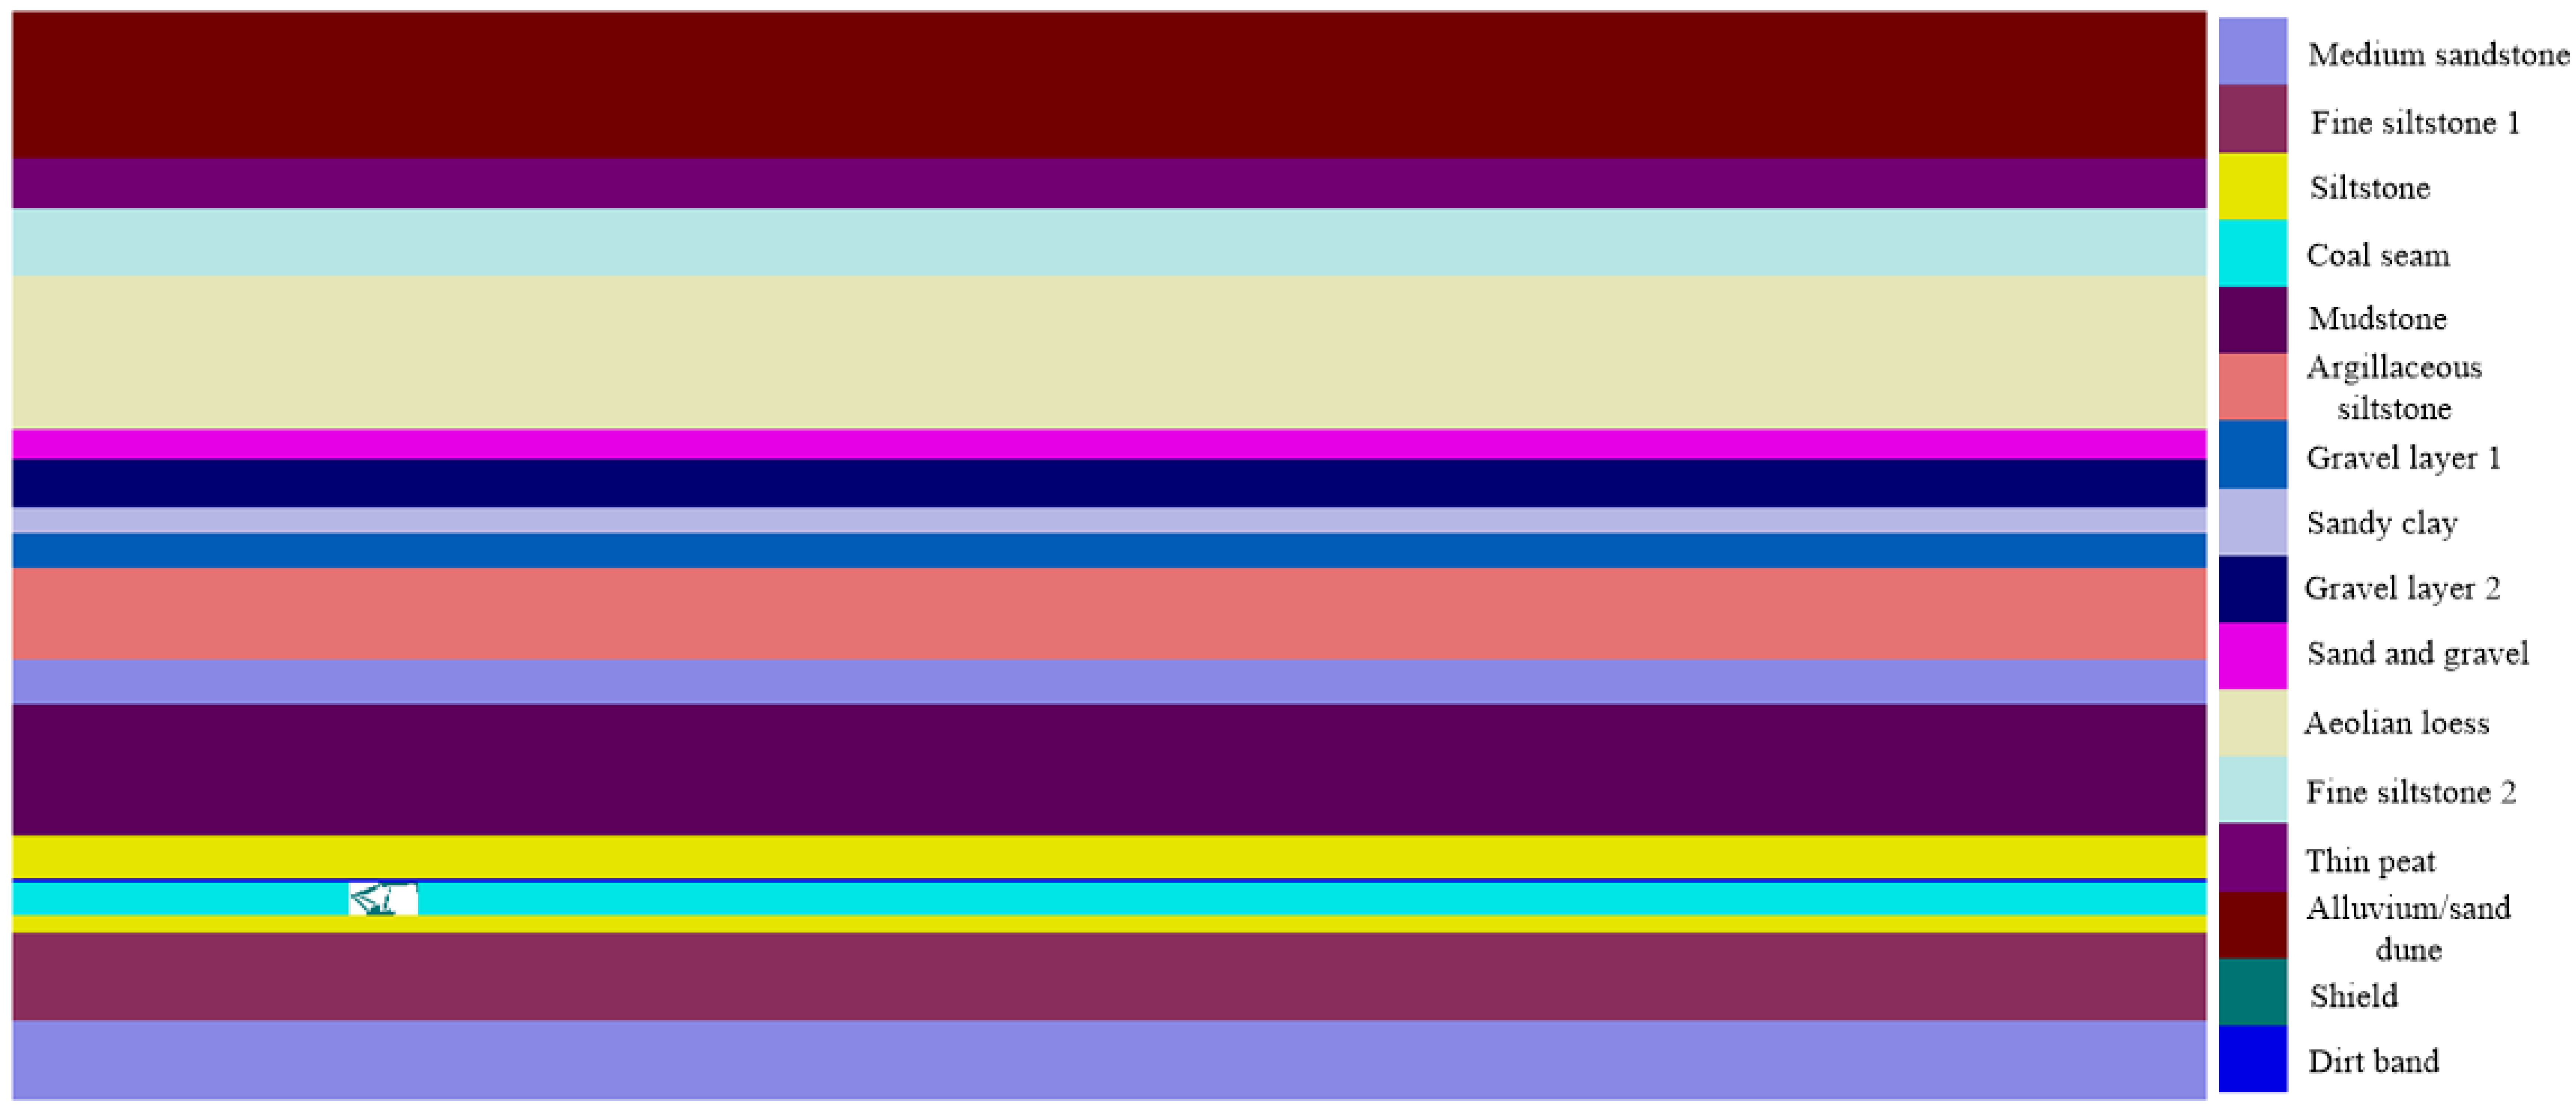
2.2. Stratum Model
The mining face is a complex three-dimensional space. In order to simplify the model and improve the calculation speed, the working face is moderately simplified. The strike profile of 12311-longwall working face in Huojitu Coal Mine is selected as the simulation model, which only changes the thickness of coal seam to realize a simulation under different mining height conditions. The numerical model is 300 m long, 146.7–151.2 m high, and the dip angle of coal and rock strata is horizontal, as shown in
Figure 2. In the simulation, the grid of the shield is not cut, and the continuity calculation is carried out. The grid outside the shield is cut and the discrete element calculation is used. The Mohr–Coulomb strength criterion is adopted as the yield criterion for coal and rock mass materials during simulation. According to the field application, the setting and yield load of the shield under each mining height condition are 28.2 MPa and 52.8 MPa, respectively. This meets the roof support requirements for the mining working face.
The upper strata of the numerical model extend to the ground surface without applying the top boundary forces. Only gravity load is applied in the vertical direction. The bottom and side boundaries of the model are restrained. The measuring point is fixed on the support cell. As the support moves, the data is recorded when the support column reaches relative balance after excavating a step distance. The recording content of the data is the shield resistance and relative expansion of its column (elongation is positive and contraction is negative). The monitored shield resistance Syy is the force component in the vertical direction of the column, which is equal to the product of the axial force of the shield column and the sine value of the column inclination angle.
2.3. Mechanical and Physical Properties of Strata and Joints
The values of mechanical parameters such as elastic modulus, tensile strength, and cohesion of coal seam and rock strata are usually 1/5–1/3 of the main parameters of coal and rock specimens tested in a laboratory, sometimes with large differences, and the ratio could reach 1/20~1/10. In general, the Poisson’s ratio of coal seam and rock strata is 1.2–1.4 times that of coal and rock specimens [
17,
18], and the joint stiffness is 0.1–0.9 times that of normal rock strata [
19], wherein the elastic modulus of alluvium/sand dune can be regarded as 0 [
20]. The physical and mechanical parameters of coal and rock mass used in the model are shown in
Table 1 and
Table 2.
3. Analysis of Numerical Simulation Results
3.1. Numerical Simulation Results of Overlying Strata Movement
To reduce model boundary effects, the distance from the left boundary to the initial coal face was set at 50 m, and the cutting depth of the shearer was 0.865 m each time. A total of 230 excavation steps were about 200 m away to achieve full mining of the overlying strata of the coal seam. The simulation results intuitively reflected the movement and deformation law of coal and rock strata and can clearly observe the collapse range of the overlying strata and the development height of fractures.
The aforementioned eight numerical models were carried out; the simulation results for 4.5 m mining height are presented as an example.
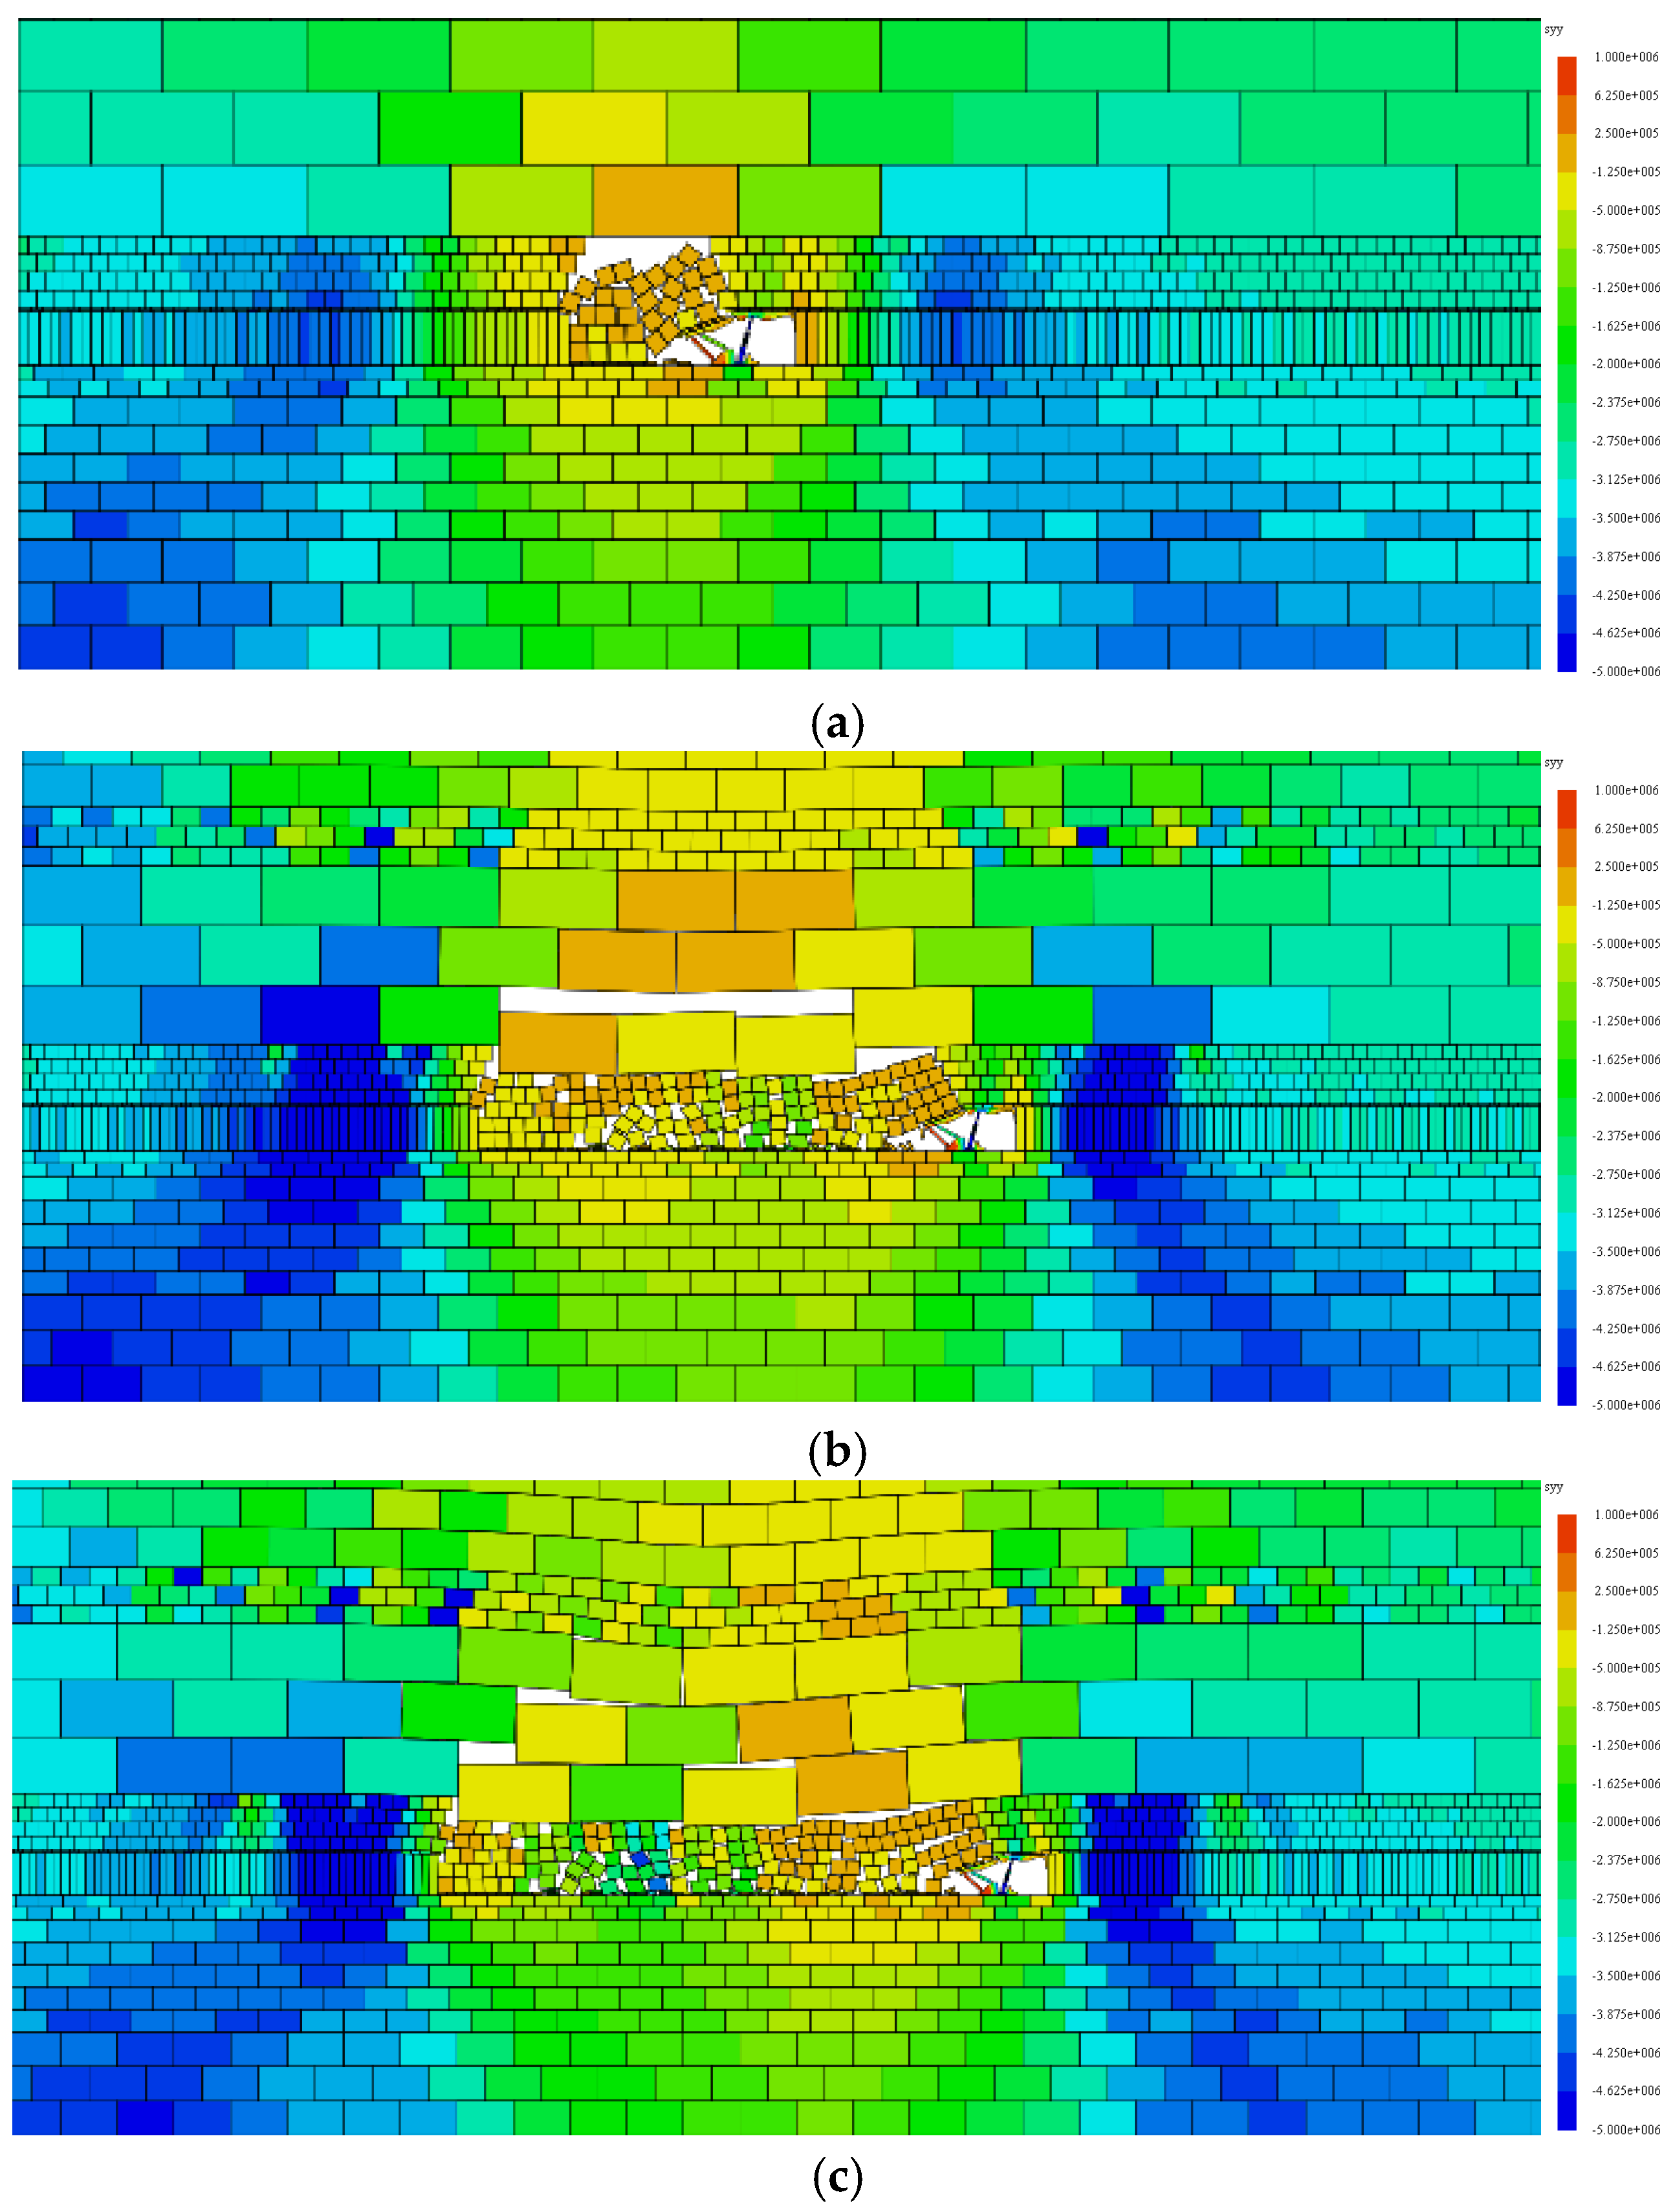
Figure 3 is a partially enlarged view of the surrounding rock structure failure when the numerical model was excavated at different advance distances. When the working face advanced to 10.38 m, as shown in
Figure 3a, the immediate roof collapsed; when the deformation of the basic roof was not large, no collapse occurs. When the working face was excavated at 37.195 m, as shown in
Figure 3b, the basic roof was broken for the first time, the shield column shrank significantly, and the shield resistance was large, which was called the first weighting of the working face. When the working face was excavated for 49.305 m, as shown in
Figure 3c, the basic roof was broken for the second time, and the first periodic weighting of the working face was carried out.
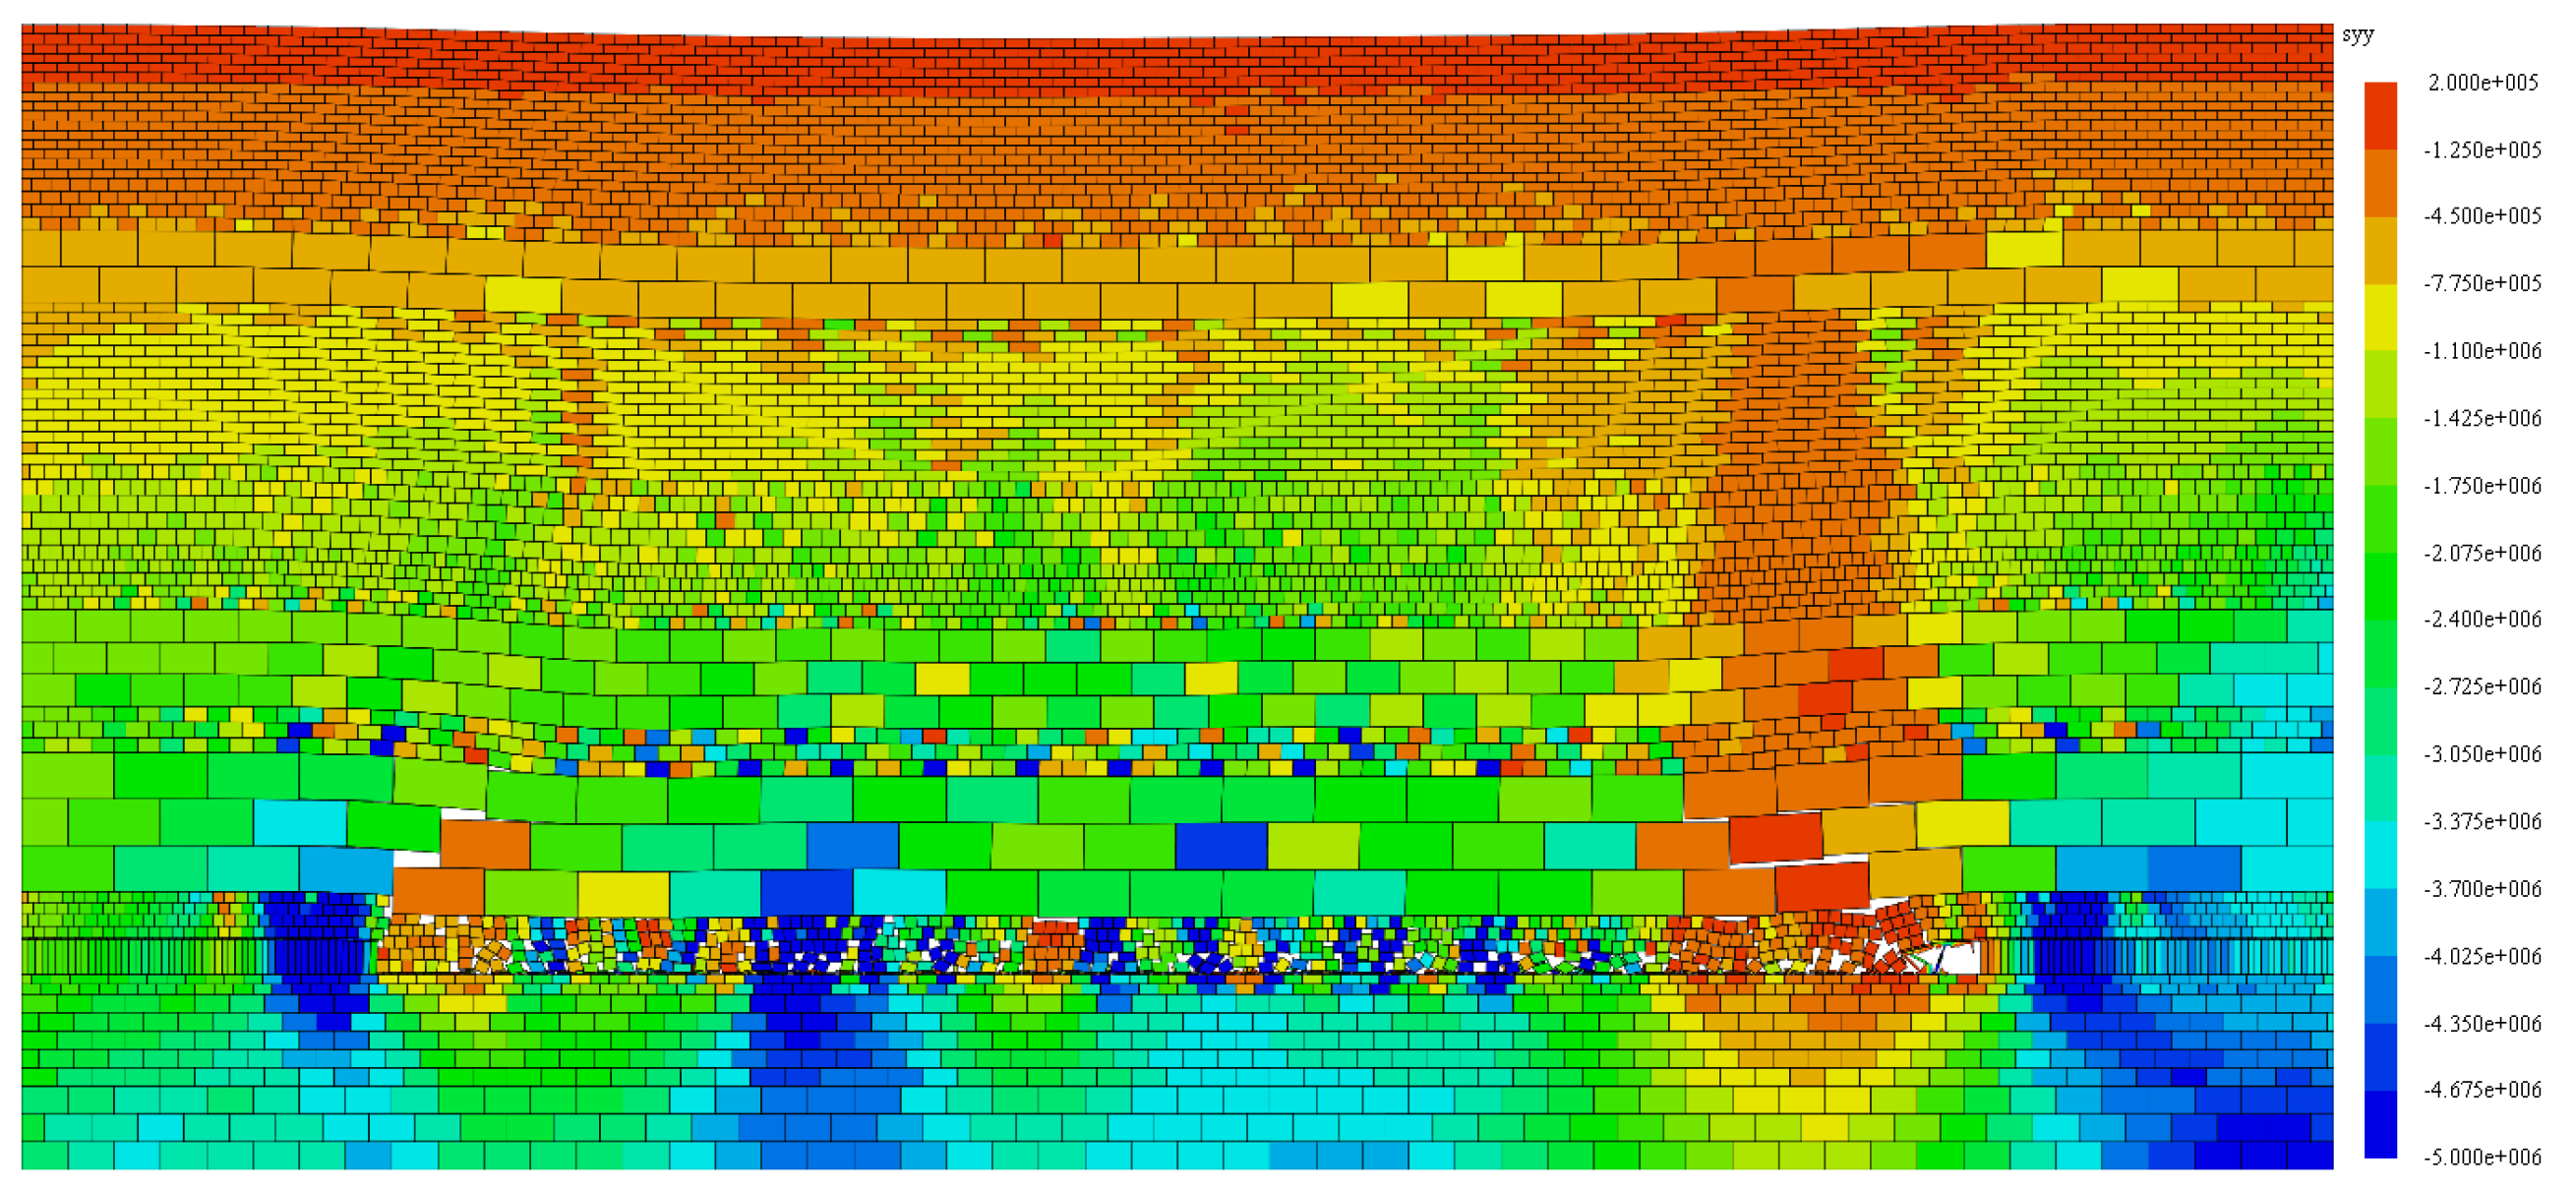
Figure 4 shows the movement and collapse of overlying strata when the working face was excavated for 200 m. There were 14 periodic weighting intervals in the working face, and the basic roof collapsed periodically. The collapse step was about 12.0 m, and the collapse impact directly reached the surface.
3.2. Numerical Simulation Results of Shield Resistance
A measuring point was fixed on the column cell of the shield model. As the shield moved, the stress and relative displacement of the shield column during the simulated excavation process were recorded. The monitored shield resistance Syy was the force in the vertical direction of the column, and the setting shield support direction was along the column axis. Therefore, the monitored Syy was equal to the product of the axial force of the shield column and the sine value of the column inclination angle. When the mining height was less than 5.0 m, the inclination angle of the shield was small, and the monitored Syy value was less than the shield setting load.
To reduce the amount of data analysis, the data were recorded only when the shield column reached a relative balance after excavating for one step (0.865 m), and then each group of simulation experiments recorded 230 data. The recorded content of the data was the resistance and relative expansion of the shield column (elongation is positive, contraction is negative).
In the following data analysis, according to the inclination angle of the shield model column under different mining height conditions in the simulation, the shield setting and yield load along the direction of the column was multiplied by the sine value of the inclination angle of the column, which was converted into the resistance in the vertical direction, as to be consistent with the direction of the shield resistance value monitored in the numerical simulation.
3.2.1. Small Mining Height Simulation Data Analysis
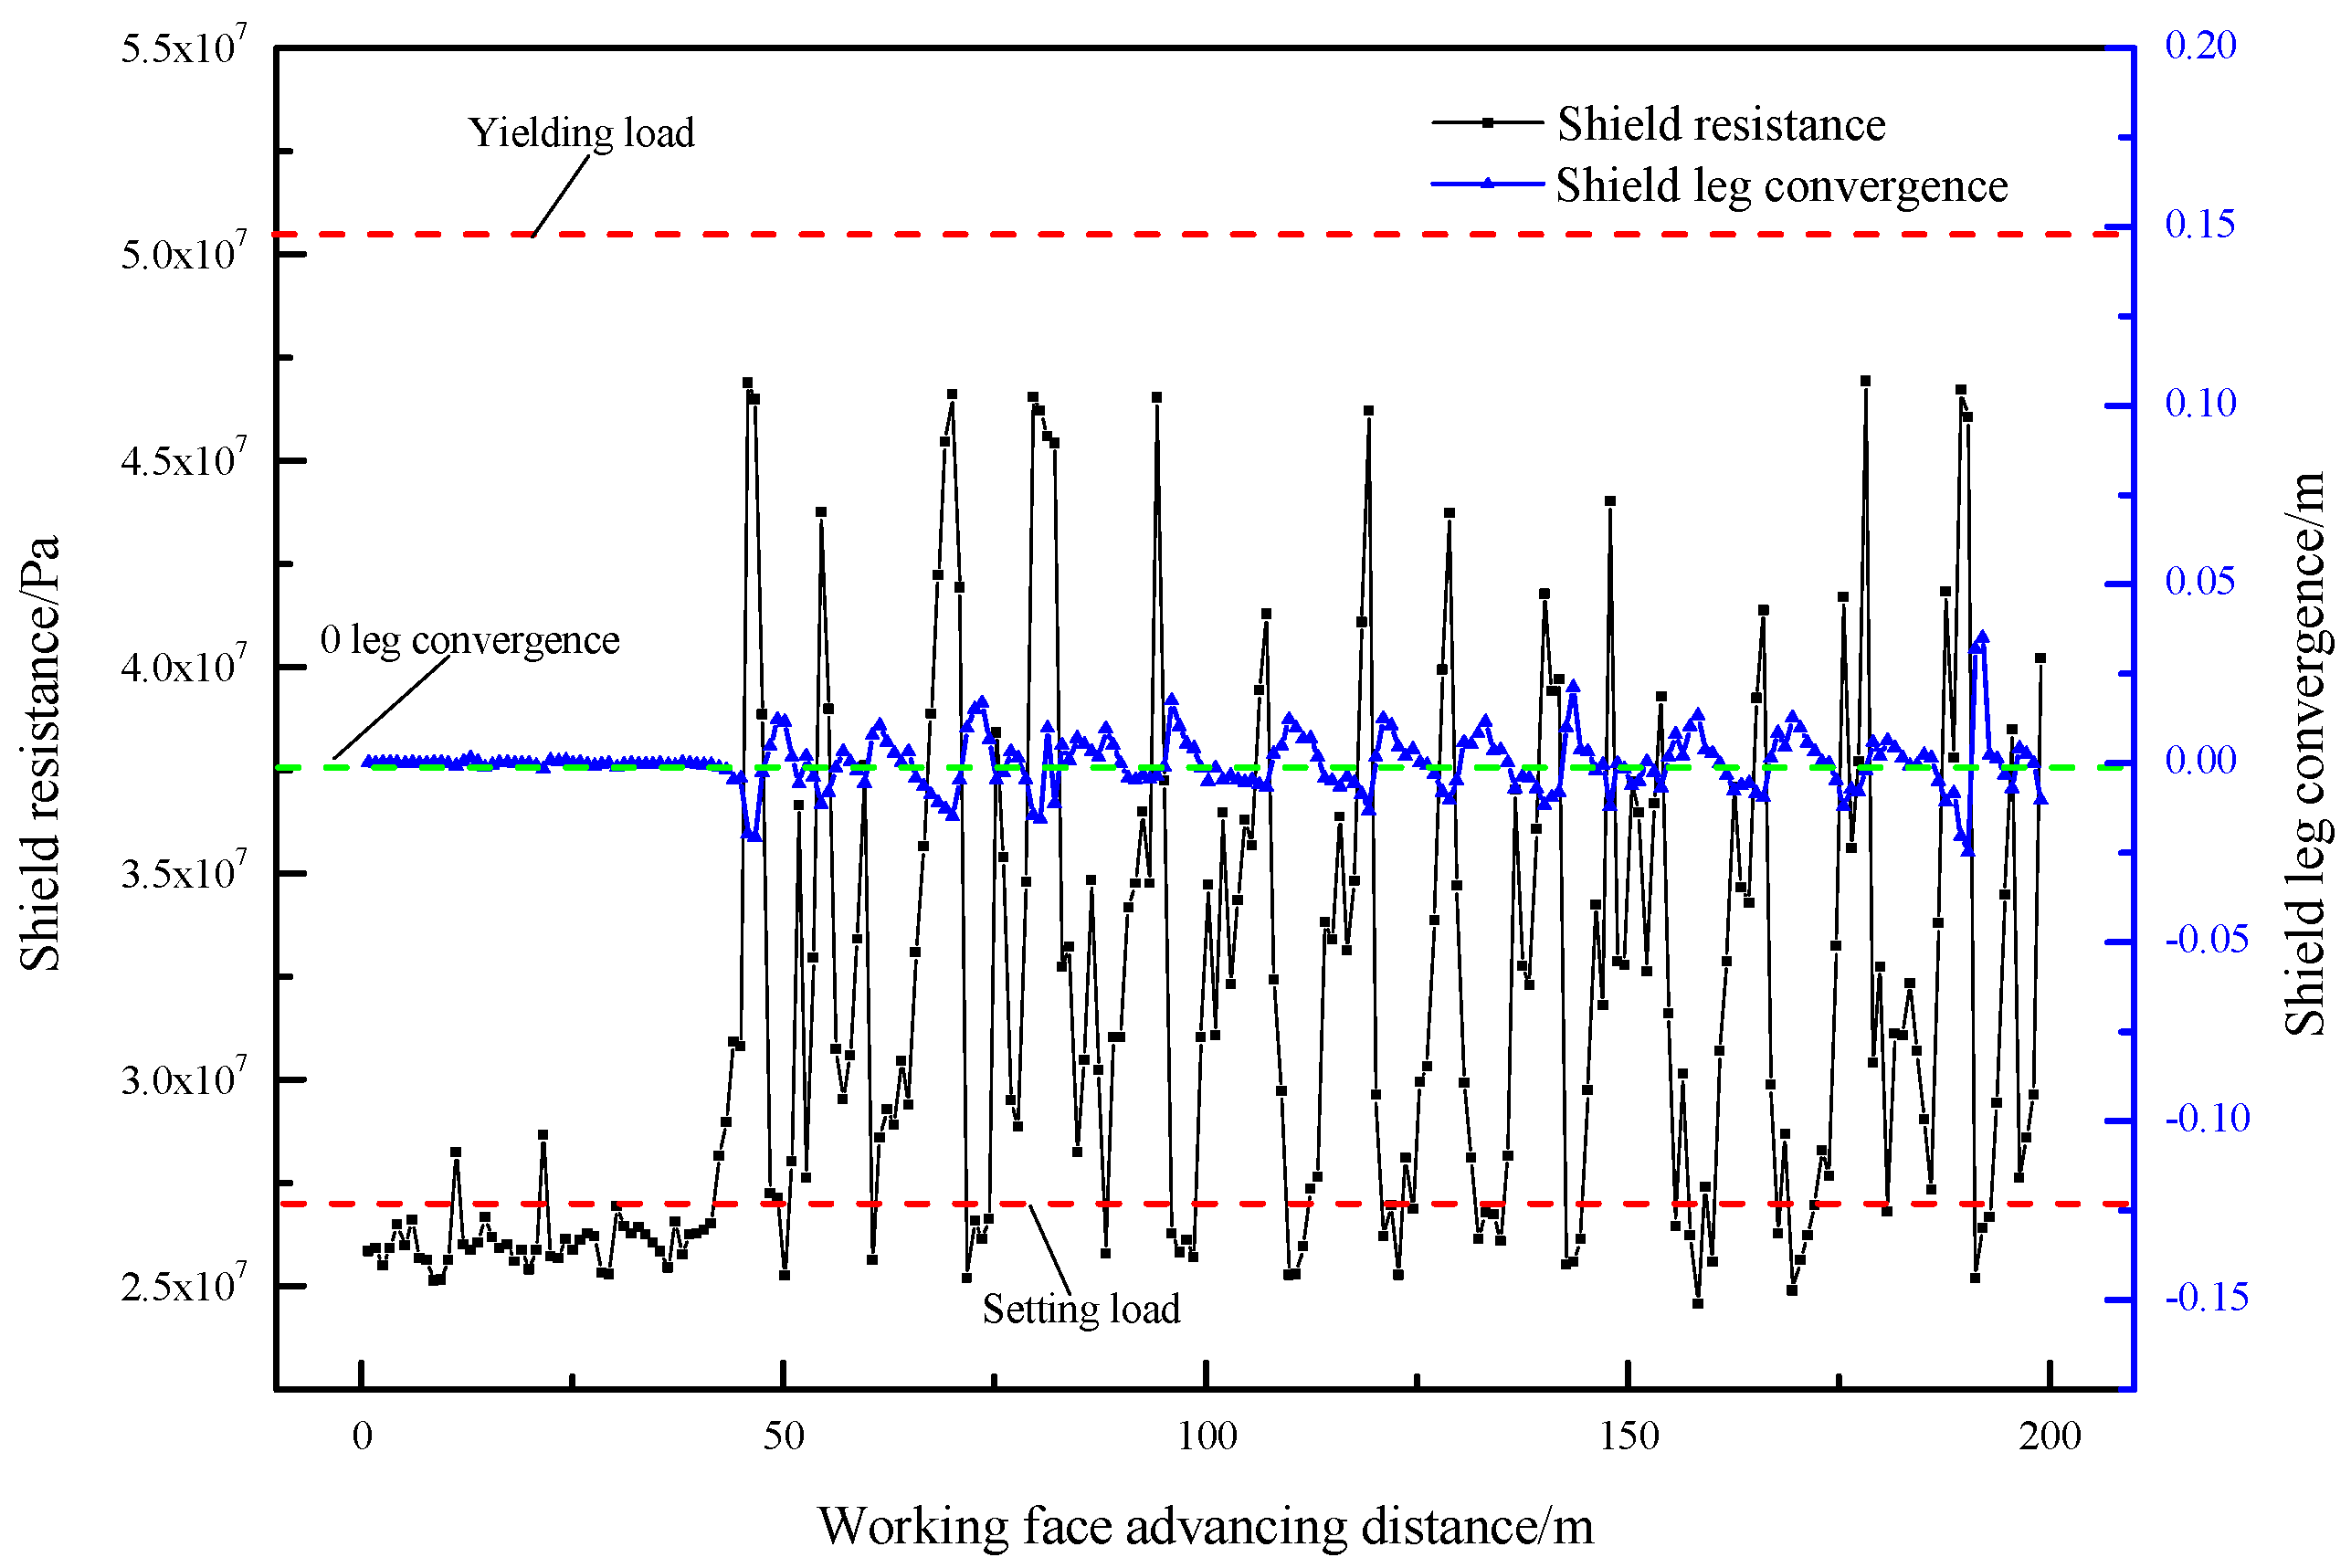
When the mining height was 2.5 m, the shield resistance was below the yield load, and the shield working resistance showed a periodic change. The maximum resistance of the shield was 46.9 MPa, the average shield resistance was 31.4 MPa, and the single maximum shrinkage of the shield column was 24.8 mm. The first weighting interval of the basic roof was 38.9 m, the periodic weighting interval of the basic roof was 10.0–13.0 m, and the average periodic weighting interval was about 12.0 m, as shown in
Figure 5.
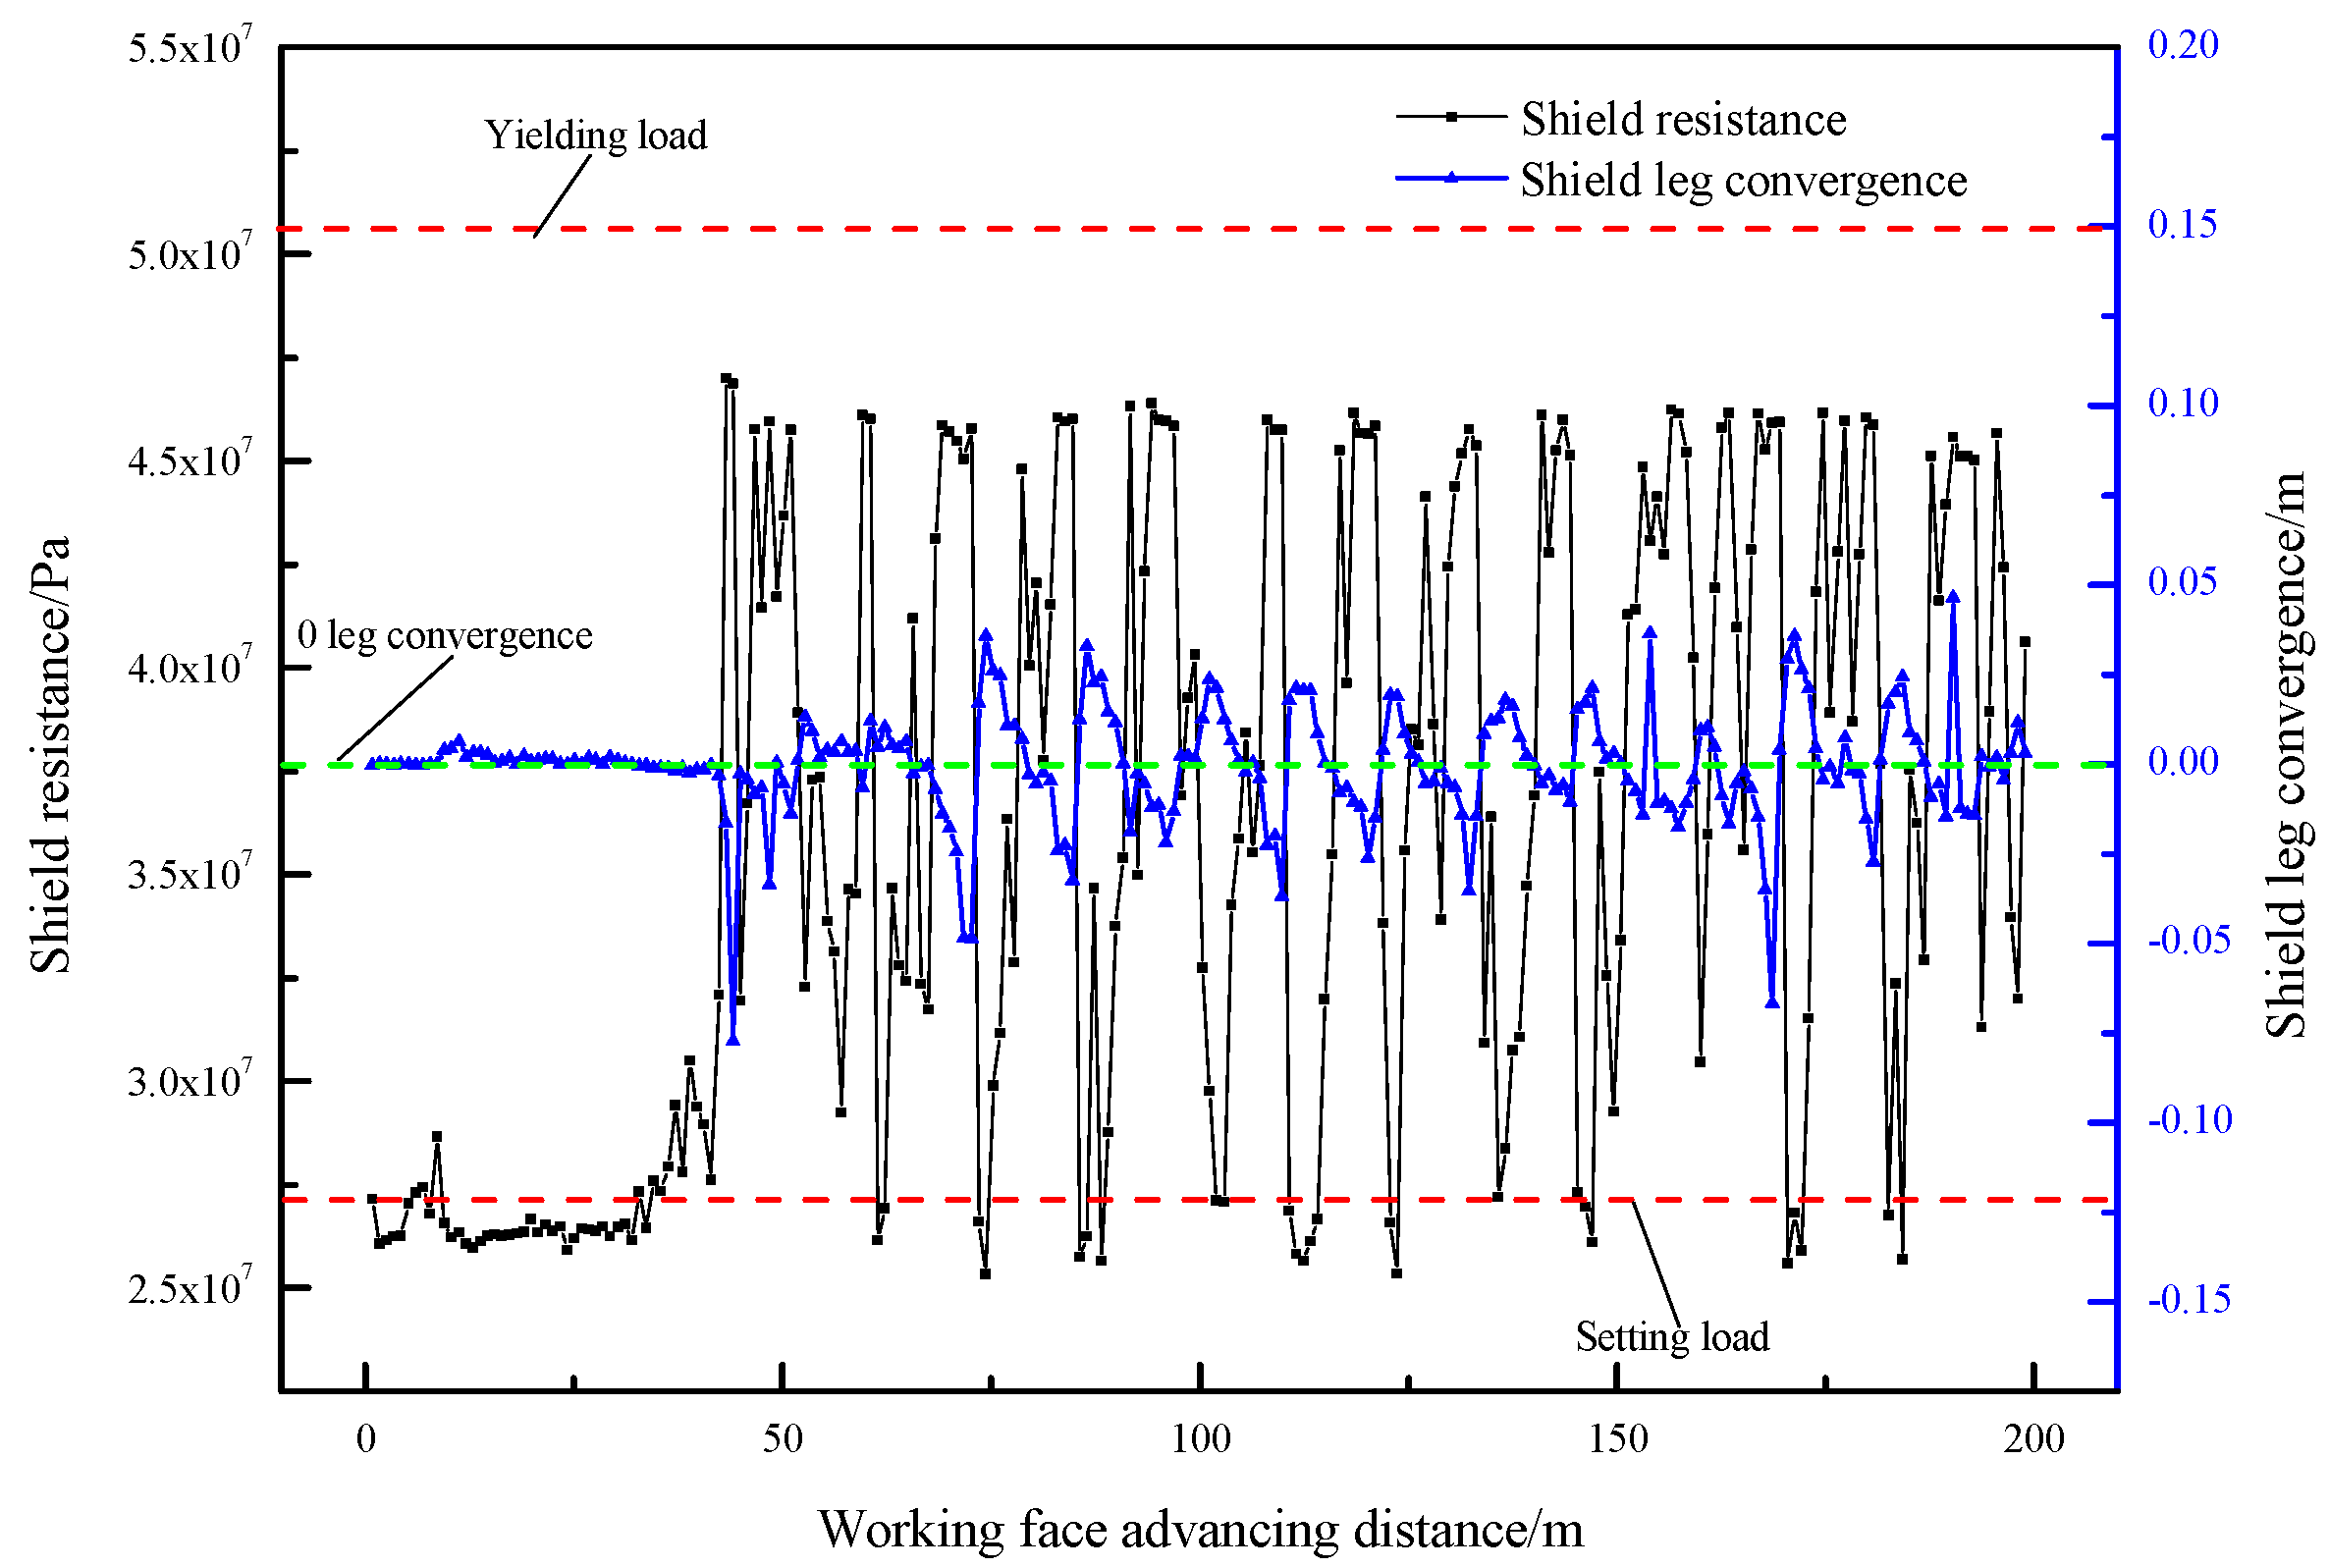
Figure 6 shows that the resistance of the shield was below the yield load under 3.5 m mining height. The maximum shield resistance was 47.0 MPa, the average resistance of the shield was 35.7 MPa, and the single maximum shrinkage of the shield column was 77.1 mm. The first weighting interval of the basic roof was 38.0 m, the periodic weighting interval of the basic roof was 9.5–12.0 m, and the average periodic weighting interval was about 11.0 m.
3.2.2. Medium Mining Height Simulation Data Analysis
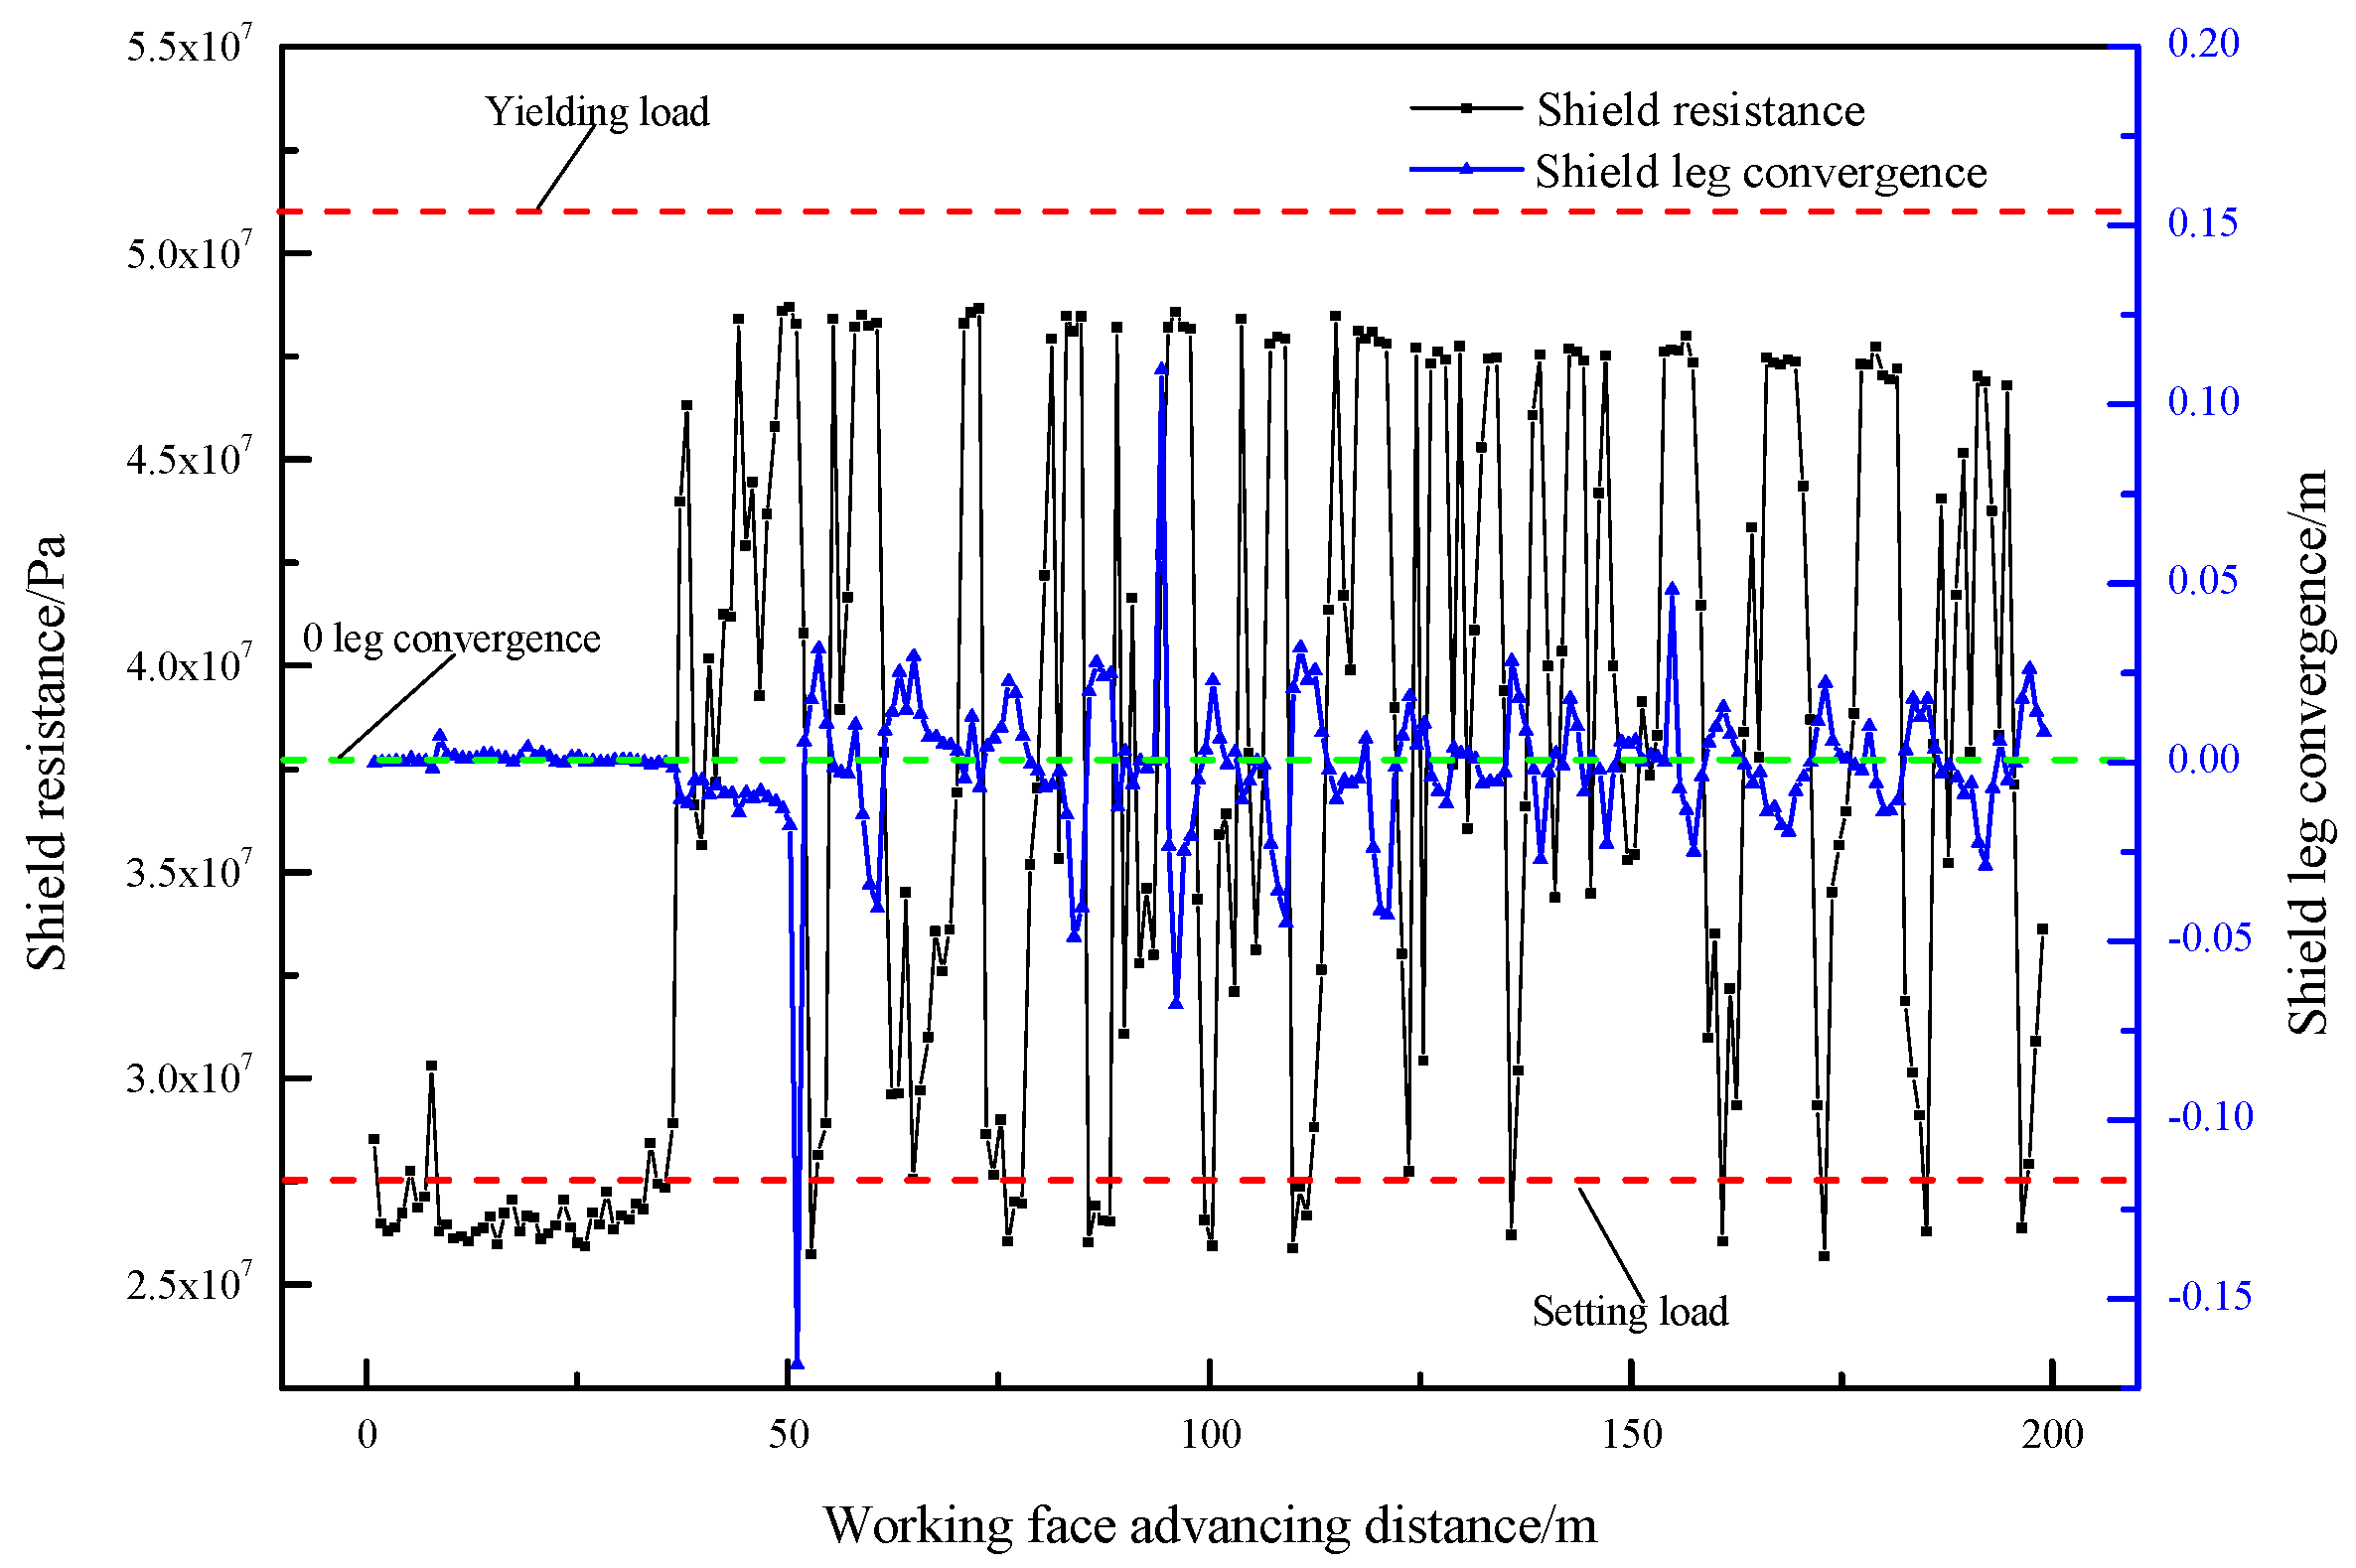
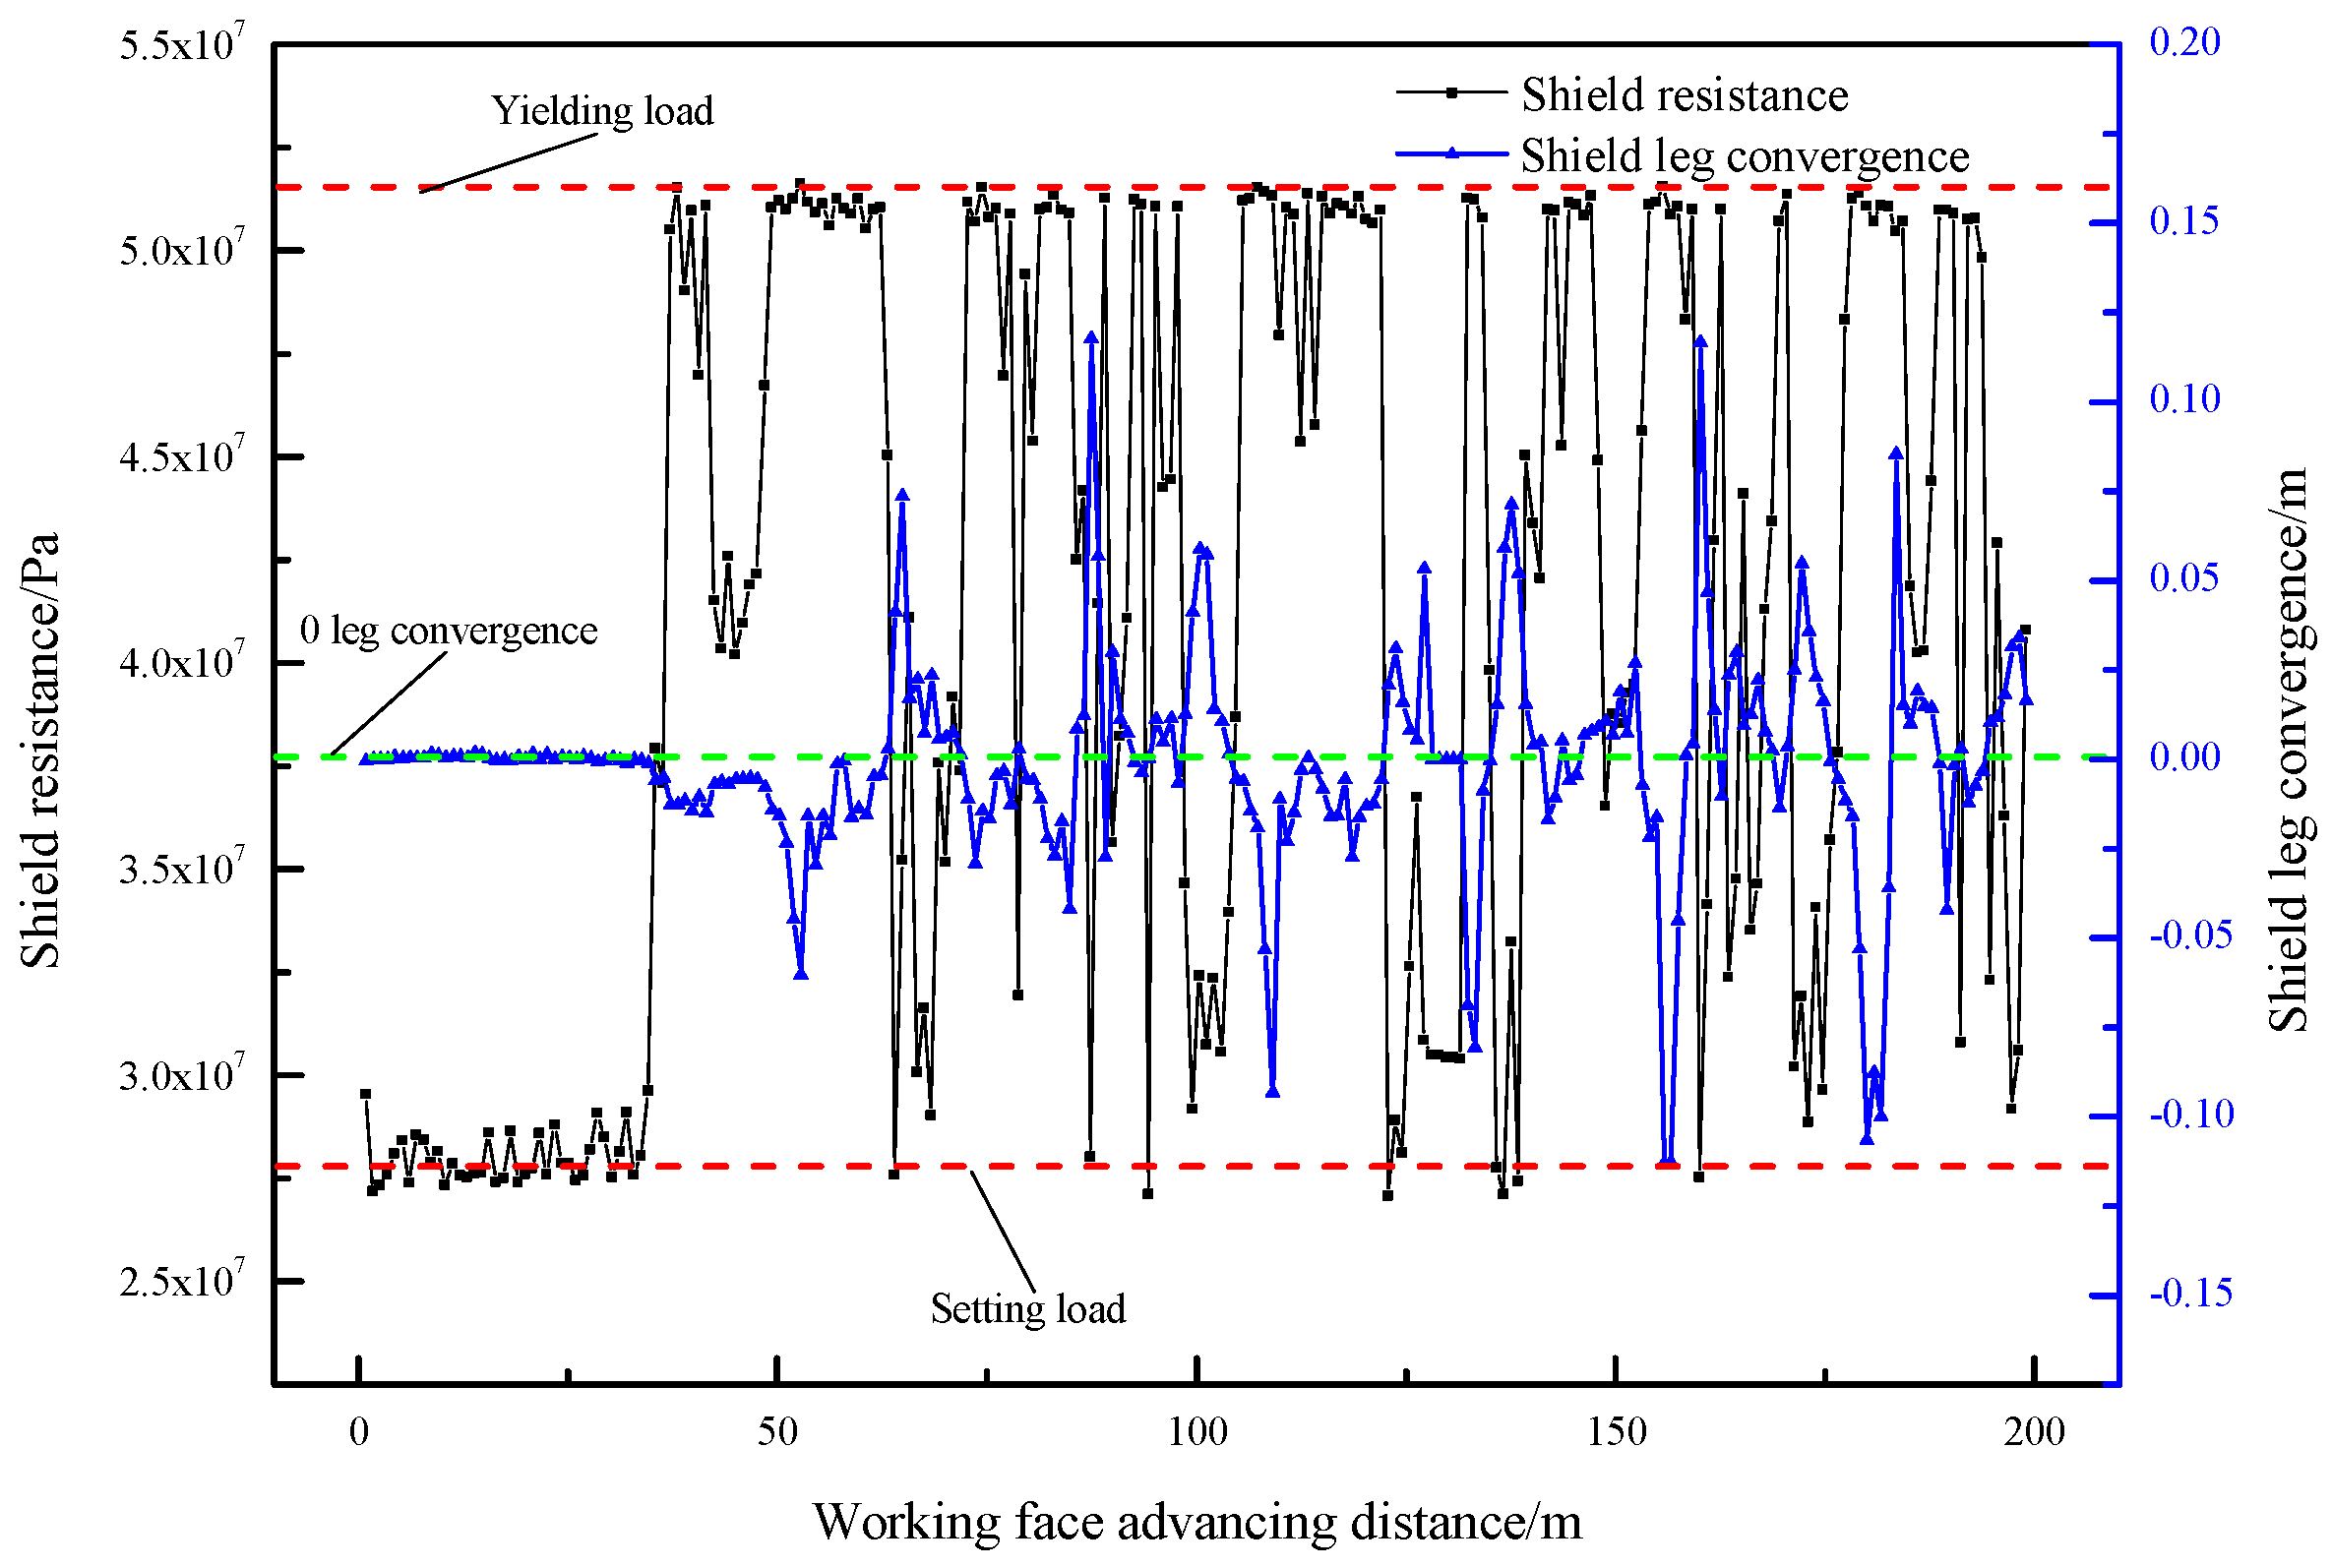
For a 4.5 m mining height, the shield resistance was below the yield load. The maximum shield resistance was 48.7 MPa, the average shield resistance was 37.0 MPa, and the single maximum shrinkage of the shield column was 168.0 mm. The first weighting interval of the basic roof was 37.2 m, the periodic weighting interval of the basic roof was 9.5–13.5 m, and the average periodic weighting interval was about 11.5 m, as shown in
Figure 7.
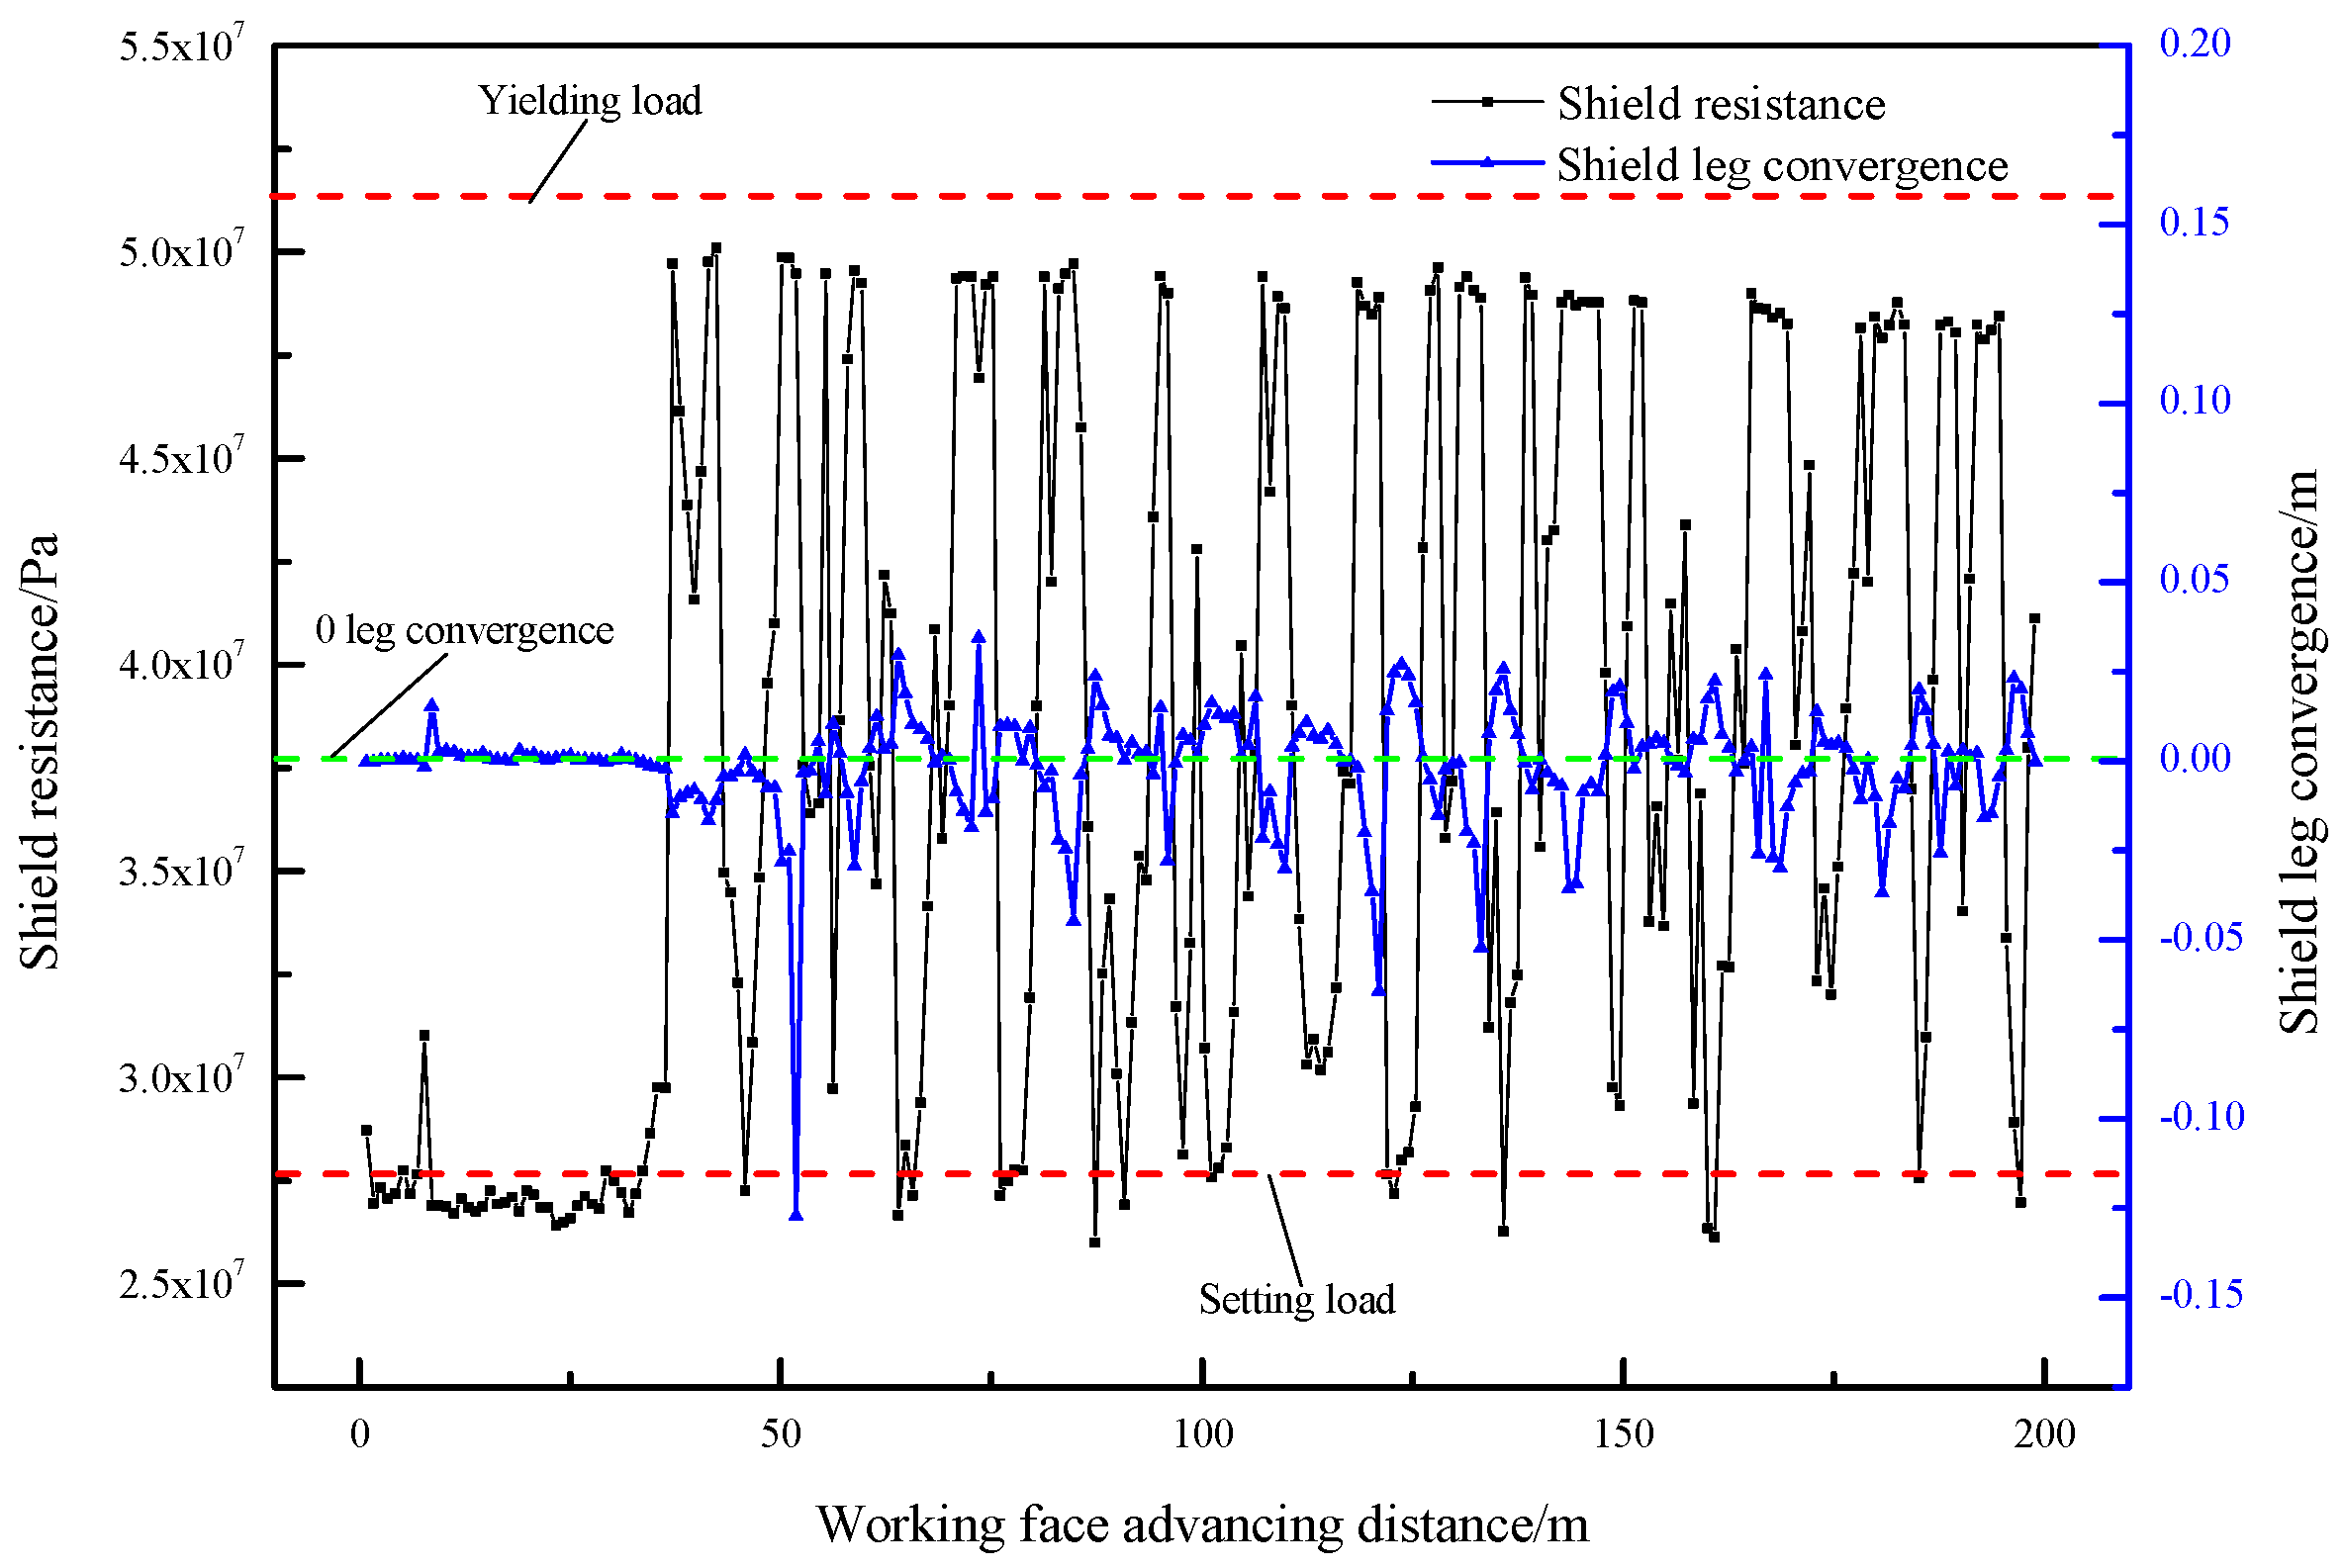
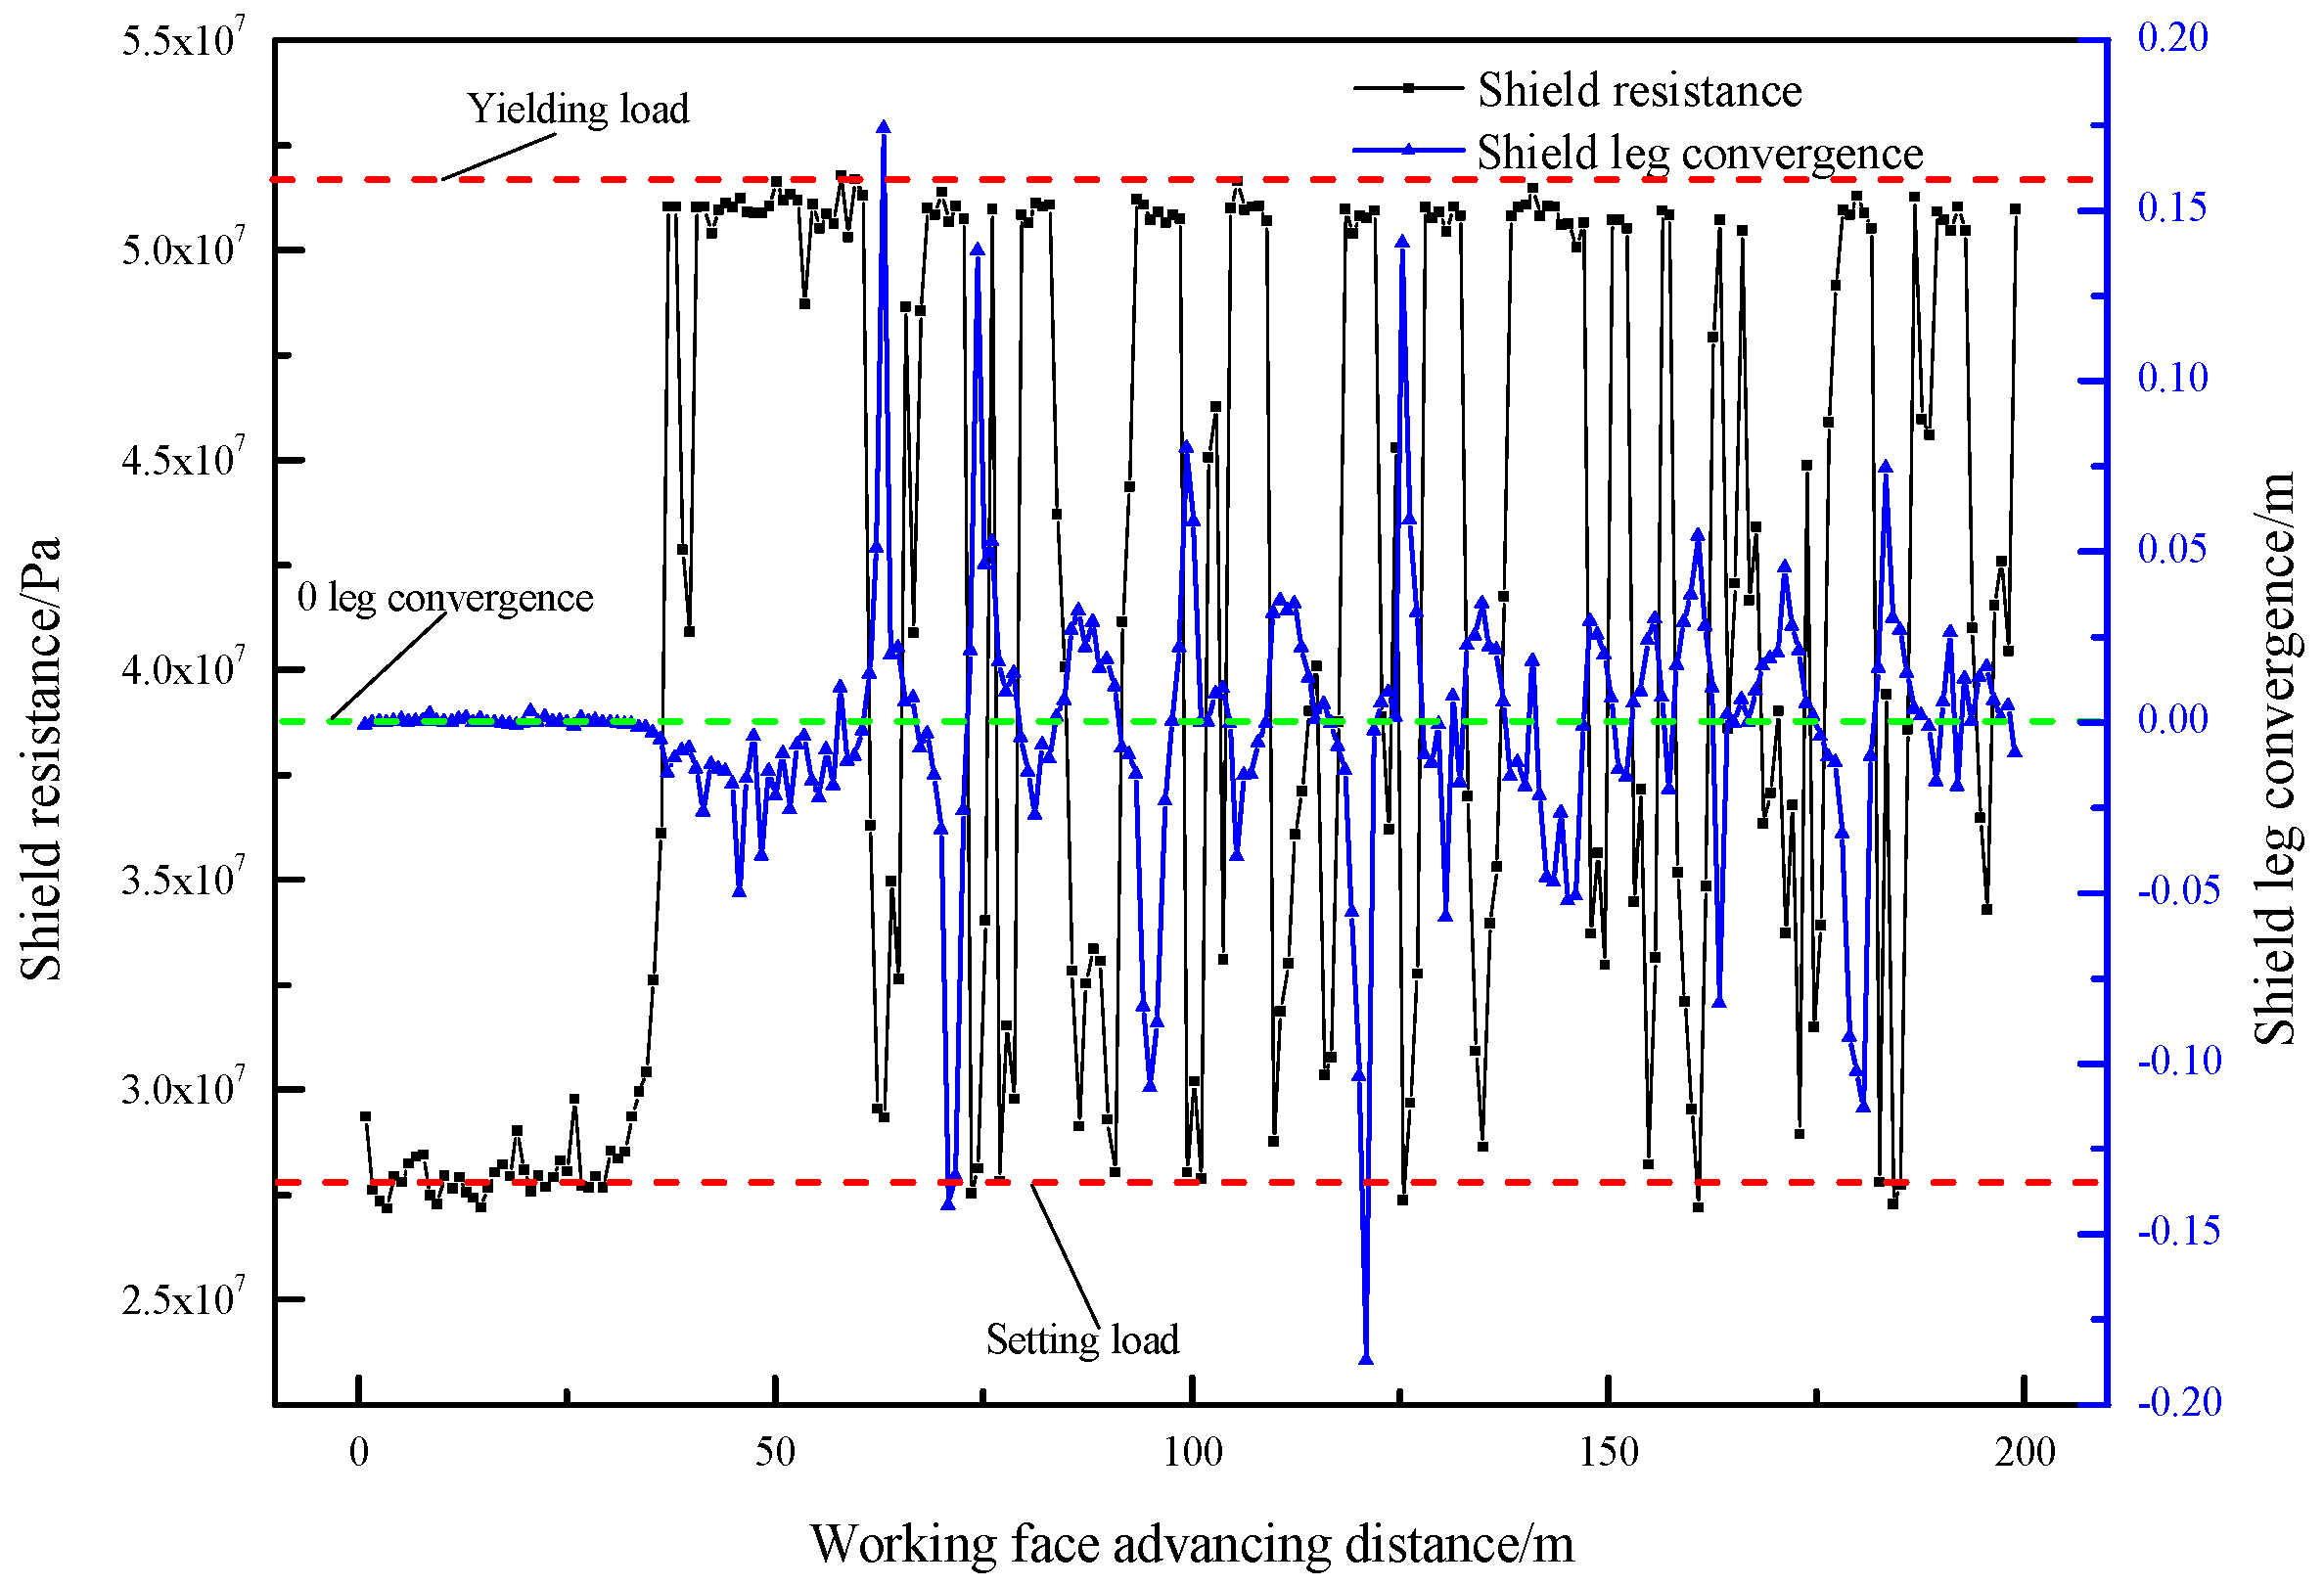
For a 5.0 m mining height, the shield resistance was also below the yield load. The maximum shield resistance was 50.1 MPa, the average resistance of the shield was 37.3 MPa, and the single maximum shrinkage of the shield column was 127.0 mm. The first weighting interval of the basic roof was 36.3 m, the periodic weighting interval of the basic roof was 8.8–12.5 m, and the average periodic weighting interval was about 11.5 m, as shown in
Figure 8.
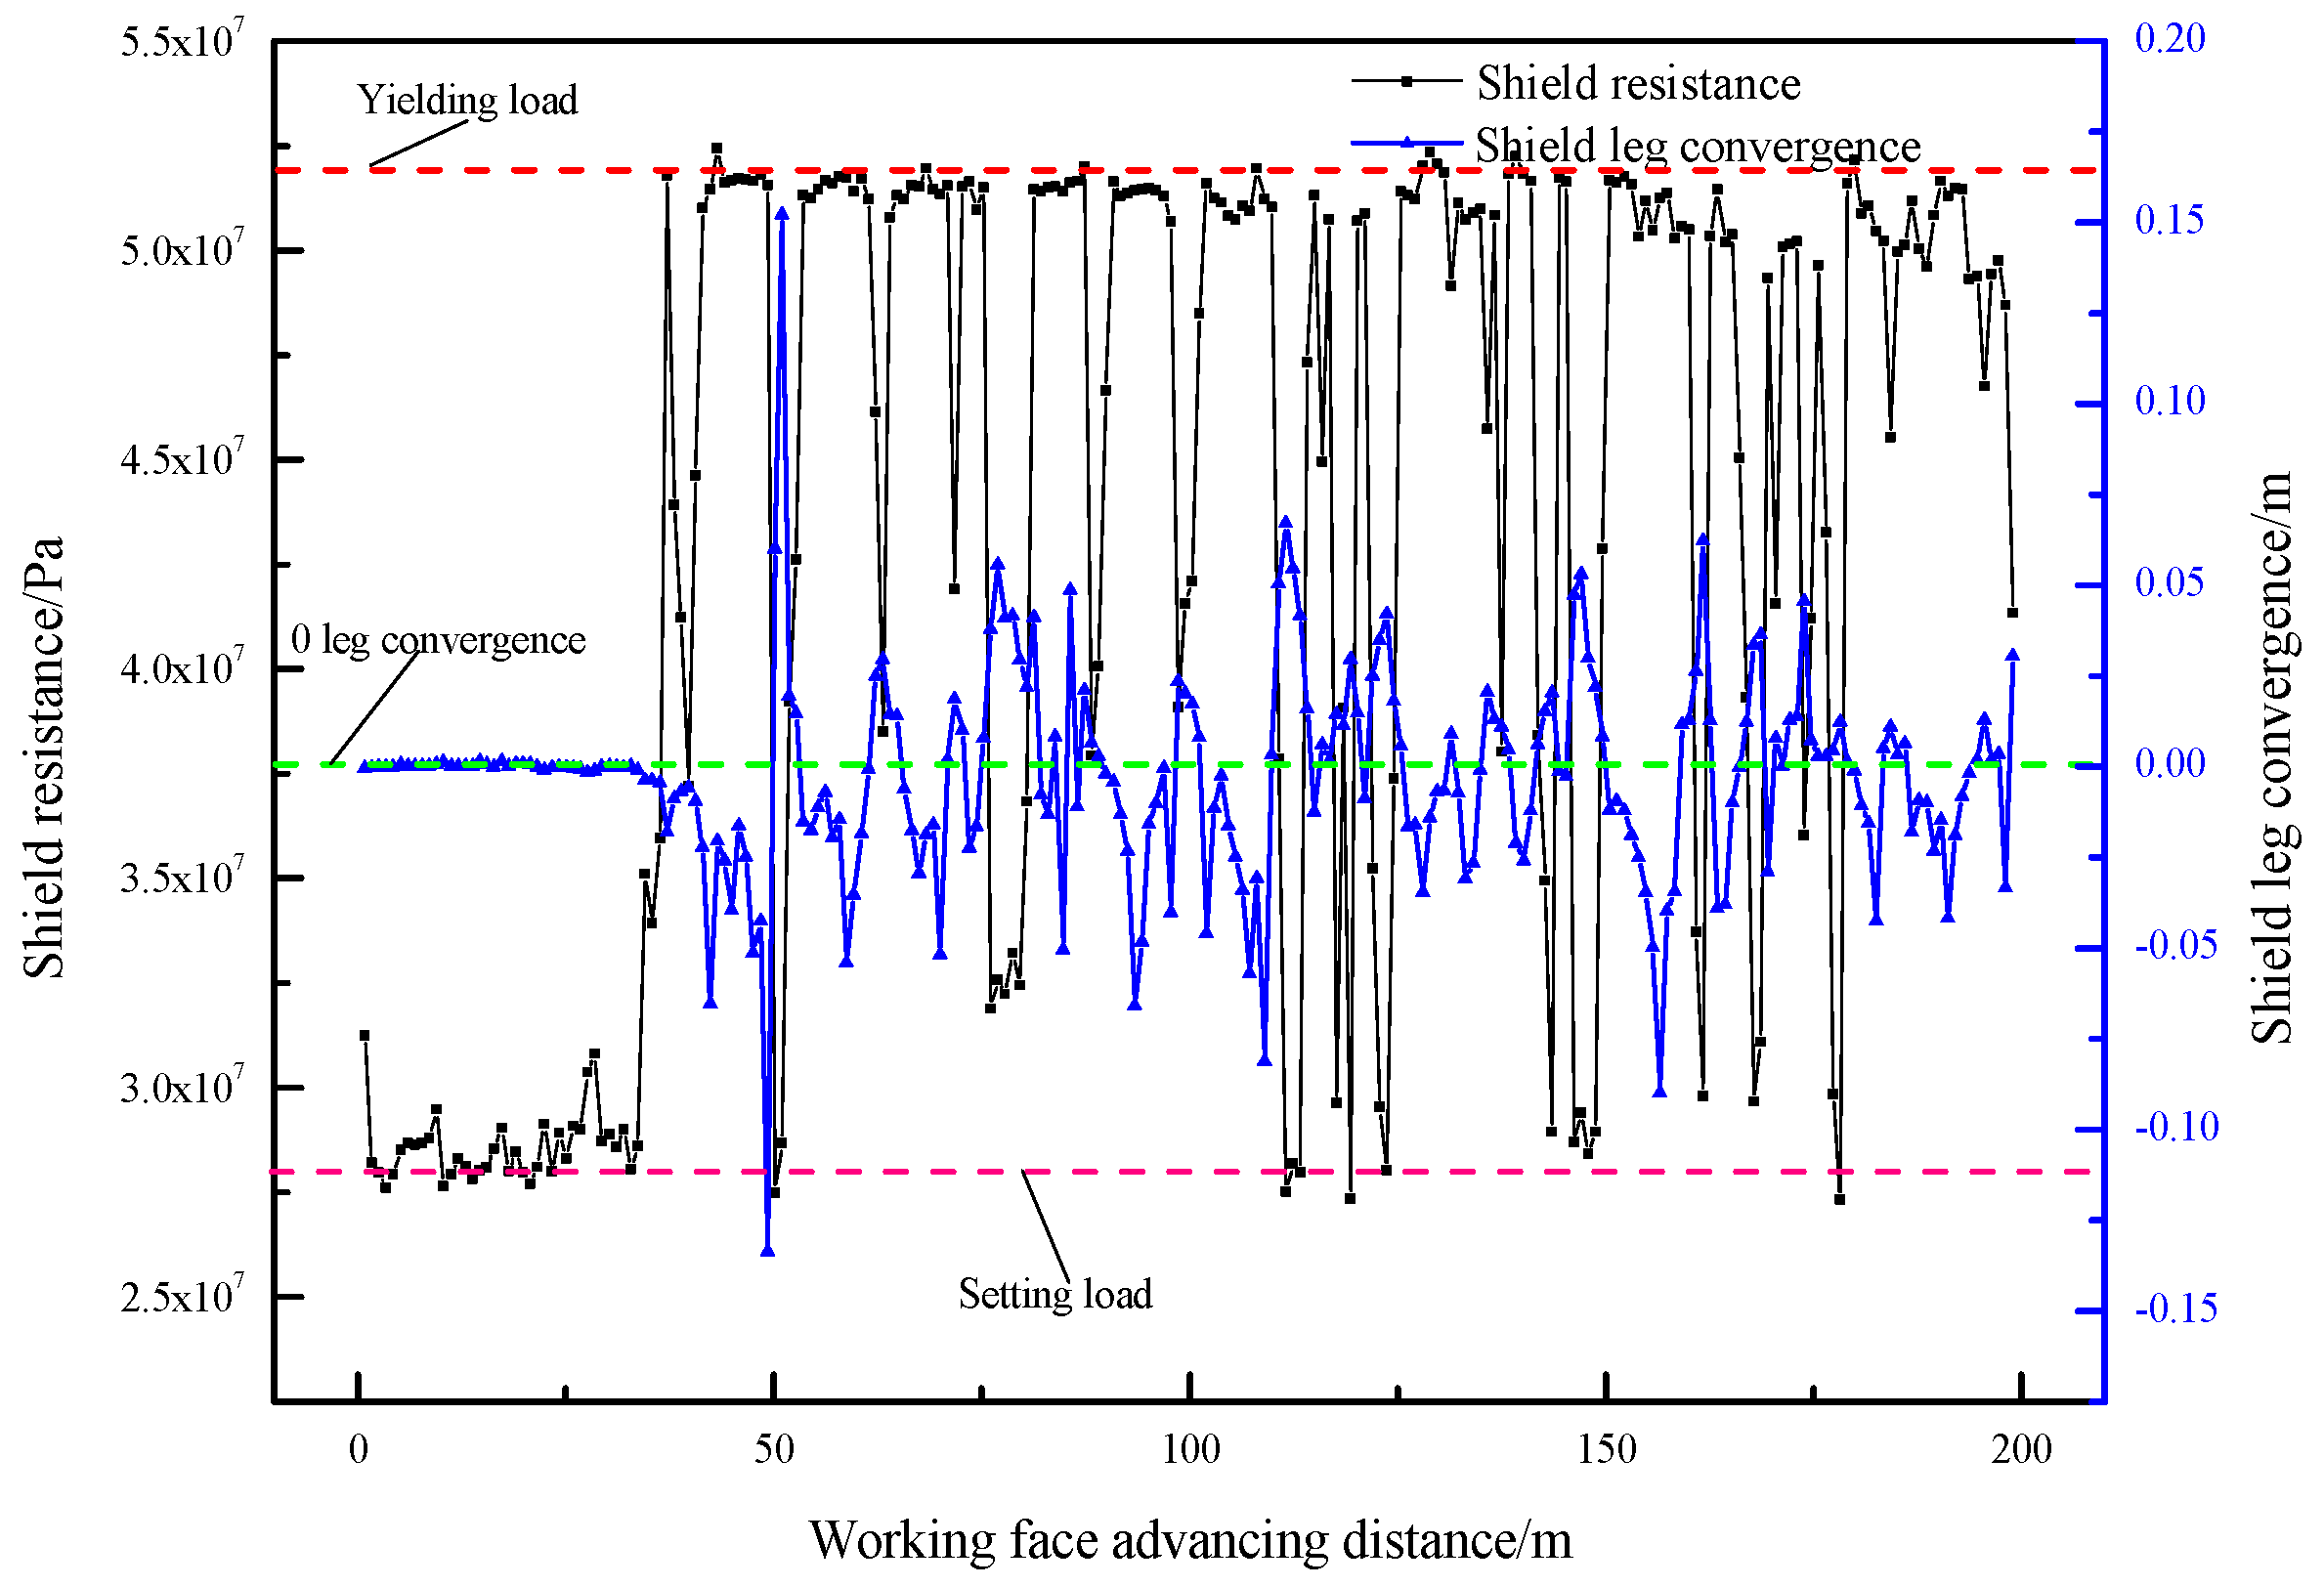
As shown in
Figure 9, the shield resistance was also below the yield load under a 5.5 m mining height, but close to the yield load. The maximum resistance of the shield was 50.5 MPa, the average shield resistance was 39.9 MPa, and the single maximum shrinkage of the shield column was 159.0 mm. The first weighting interval of the basic roof was 38.0 m, the periodic weighting interval of the basic roof was 10.5–12.0 m, and the average periodic weighting interval was about 11.0 m.
3.2.3. Large Mining Height Simulation Data Analysis
At 6.0 m mining height, the maximum shield resistance reached the yield load 52.8 MPa, the average resistance of the shield was 40.8 MPa, and the single maximum shrinkage of the shield column was 113.0 mm. The first weighting interval of the basic roof was 37.2 m, the periodic weighting interval of the basic roof was 10.5–11.0 m, and the average periodic weighting interval was about 10.5 m, as shown in
Figure 10.
For a 6.5 m mining height, the maximum shield resistance reached the yield load 52.8 MPa, the average resistance of the shield was 40.5 MPa, and the single maximum shrinkage of the shield column was 187.0 mm. The first weighting interval of the basic roof was 37.2 m, the periodic weighting interval of the basic roof was 9.5–10.5 m, and the average periodic weighting interval was about 10.0 m, as shown in
Figure 11.
As shown in
Figure 12, under 7.0 m mining height, the maximum shield resistance reached the yield load 52.8 MPa, the average shield resistance was 42.7 MPa, and the single maximum shrinkage of the shield column was 133.7 mm. The first weighting interval of the basic roof was 37.2 m, the periodic weighting interval of the basic roof was 8.5–11.5 m, and the average periodic weighting interval was about 9.5 m.
3.3. Comparative Analysis of Shield Resistance under Different Mining Height Conditions
By comparing the shield resistance in the above eight numerical simulation results, the average shield resistance in the whole mining process and the relation between the shield resistance and the mining height when the basic roof is weighting were analyzed.
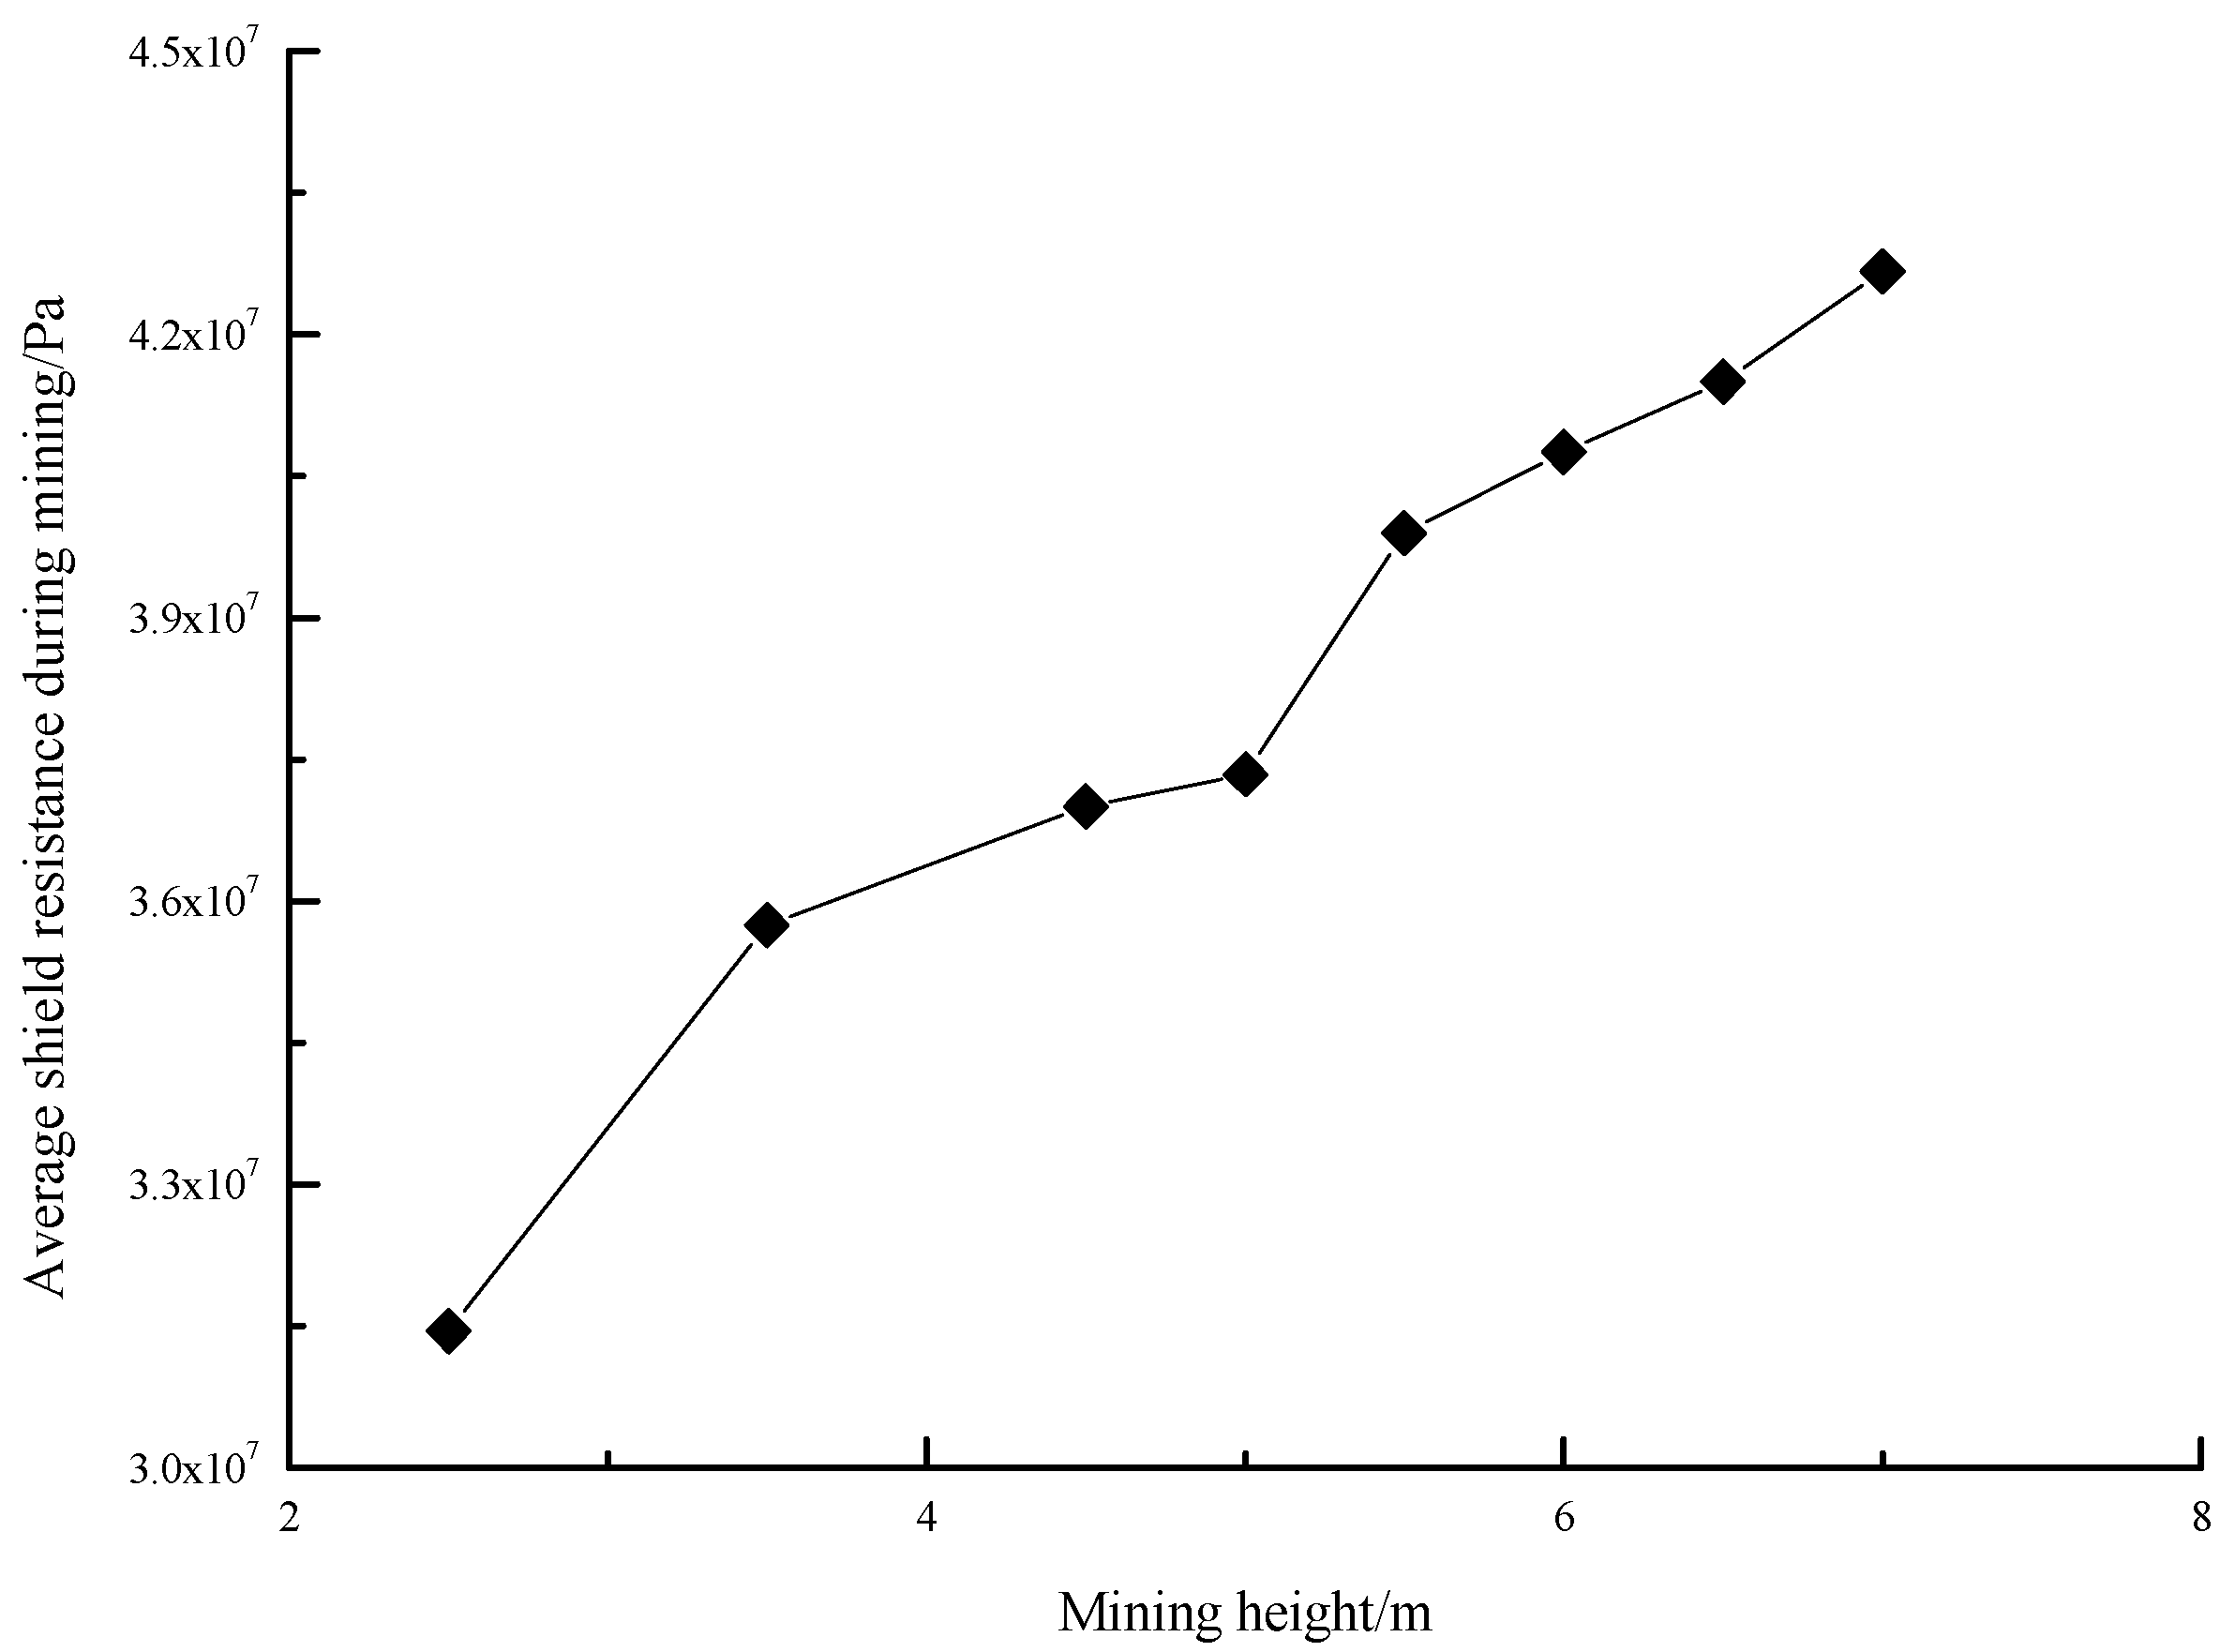
Figure 13 shows the average shield resistance during 200 m excavation under different mining height conditions. It can be seen from the figure that the average shield resistance increased with the increase in mining height.
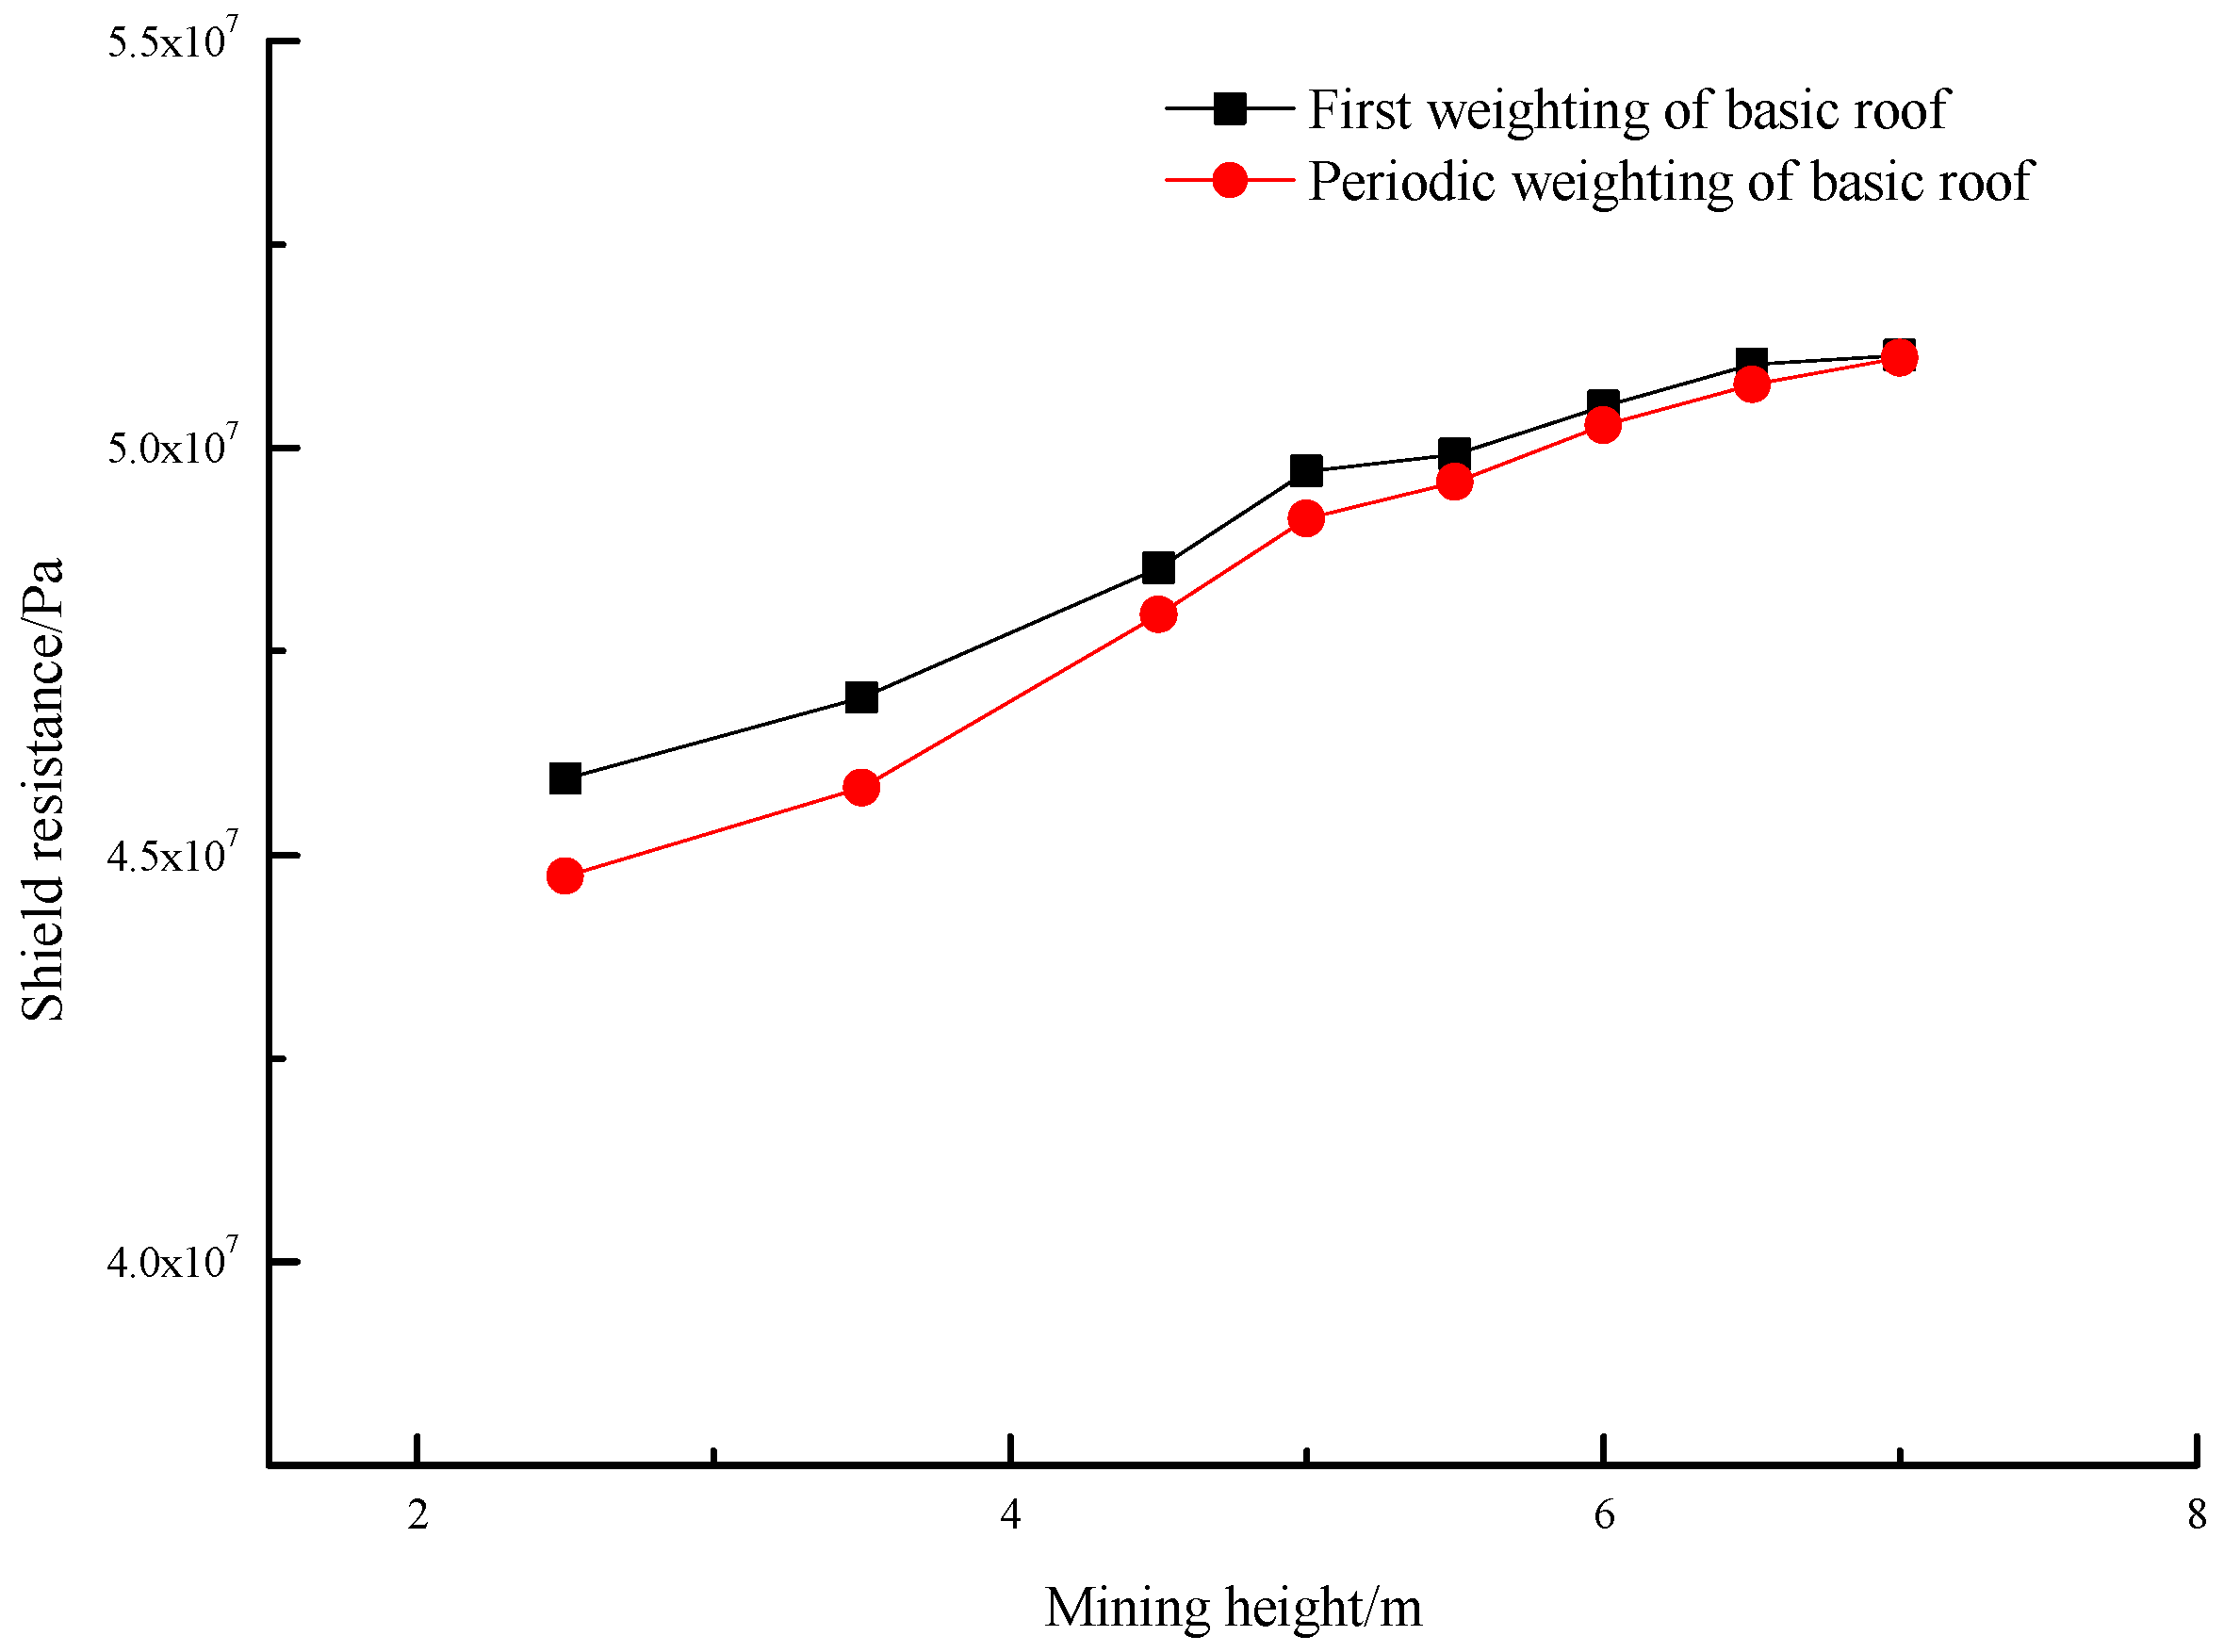
When the coal mining working face was under the basic roof weighting, the shield resistance was relatively large, thus the shield type selection was generally carried out according to the maximum strength of the shield during the basic roof weighting stage, which had a guiding significance for field engineering applications.
Figure 14 shows the comparison of the shield resistance at the first and periodic weighting of the basic roof under different mining height conditions. It can be seen from the figure that the resistance of the shield at the first weighting of the basic roof was greater than that of the periodic weighting, but the difference between the two was not significant.
4. Analysis of Relation between Mining Height and Shield Resistance
The shield resistance in coal mining working face is related to many factors such as mining geological conditions and parameters. To reduce the amount of derivation and calculation of the relation between shield resistance and mining height, firstly, dimensional analysis was carried out to find out an explicit relation between mining height and shield resistance. Then, according to the numerical simulation data, the unknown quantity in the explicit relation was calculated.
4.1. Dimensional Analysis of the Relation between Shield Resistance and Mining Height
The main parameters affecting the shield resistance
P were mining height
M, immediate roof thickness
∑h1, basic roof thickness
∑h2, unit weight of rock
γ, mining speed
v, and basic roof load
P1. There was a relation between the mining speed of the working face and the resistance of the shield. Generally speaking, when the advancing speed was fast, the shield resistance was relatively small, and vice versa [
21,
22]. This study was carried out under the same geological and mining conditions. Therefore, the
∑h1,
∑h2,
v,
P1,
γ, and
g were all fixed values. According to practice, the ratio of mining height to the immediate roof thickness had a great influence on the shield resistance, thus,
∑h1,
γ and
g were selected as the basic quantities.
M,
∑h2,
v,
P1, and
P were the derived quantities, and the dimensionless results of each parameter are shown in
Table 3.
According to the above analysis, the nondimensional value expression of shield resistance can be obtained as Equation (1).
Since the numerical simulations were carried out under the same geological and mining conditions,
∑h1,
∑h2,
v,
P1, γ, and
g were all fixed values, thus, in Equation (1),
∑h2/
∑h1,
V/(
∑h11/2g1/2) and
P1/(γ
∑h1) were all constants. Therefore, the above Equation (1) can be simplified to Equation (2) as
The above Equation (2) can be converted to
Equation (3) shows that under the same geological and mining conditions, the shield resistance has a direct relation with the mining height.
4.2. Formula Fitting of the Relation between Mining Height and Shield Resistance
It can be seen from Equation (3) that the ratio of M and ∑
h1 had a great influence on the shield resistance. Therefore, the direct fitting method was used to establish the functional relation between (
P/(
γ∑
h1)) and (
M/∑
h1), and the relation between the mining height and the shield resistance was determined. The shield resistance of the first and periodic weighting of the basic roof was expressed by
Pf and
Pp, respectively. The calculation results of formula fitting data are shown in
Table 4.
The relation between mining height and shield resistance was fitted by the software Origin 8.0 for the resistance data of the shield during the first and periodic weighting of the basic roof. Pearson’s correlation coefficient Pearson’s r (used to measure the linear correlation between variables, the value range was −1–+1, the closer the absolute value was to 1, the stronger the correlation) and the correlation coefficient square Adj. R-Square (indicated the similarity between the data and the fitted expression equation; the closer to 1, the more similar the expression was to the data, and the more the expression could reflect the data law) were used to evaluate the quality of formula fitting. From the data in
Table 4, it can be seen that the relation between the shield resistance and the mining height was generally increasing. Therefore, in the formula fitting, in order to reduce the fitting difficulty, the univariate linear equation was used as the basic equation for fitting. In the following formula fitting,
Y =
P/(γ
∑h1),
x =
M/
∑h1.
a. Formula fitting results of shield resistance during basic roof first weighting.
Pearson’s r = 0.986
Adj. R-Square = 0.967
The fitting results show that Y and x linearly increase when the main roof is first weighted, and the fitting formula has a high correlation.
b. Formula fitting results of shield resistance during basic roof periodic weighting.
Pearson’s r = 0.988
Adj. R-Square = 0.972
When the basic roof is periodically weighting, Y and x in the fitting formula also show a linear increasing relation, and the correlation of the fitting formula is also high.
To facilitate the intuitive study of the relation between the shield resistance and the mining height, it was directly solved according to the data in
Table 4. The shield prototype top beam in the simulation was 4.8 m in length and 1.75 m in width. The yield capacity of the top beam
Fy was 12,000 kN, and the corresponding column yield load
Py was 52.8 MPa. The area of the top beam of the shield was expressed by
S, and the supporting force on the unit area of the shield top beam was expressed in
qf and
qp, respectively, when the basic roof was first and periodically weighted, and the weight load of the rock layer with equal mining height was expressed in
qm (value of γ is 25 kN/m
3). According to the above data, the shield resistance data monitored in the simulation could be converted into field data, as shown in
Table 5.
According to Equations (6), (7), and (8), the calculation results are shown in
Table 5.
From the calculation results in
Table 5, it can be seen that during the first and periodic weighting of the basic roof, the average shield resistance was 7–20 times the weight load of the mining height. In the simulation process, the setting of the shield resistance was the same when the mining height was 2.5 m and 3.5 m, and the resistance setting of the shield was evidently larger, thus the ratio of the shield resistance to the weight load of the rock stratum with the same mining height was significantly higher than that of other groups. When the mining height was greater than 3.5 m, the maximum shield resistance was generally 7–12 times the weight load of the mining height.
4.3. Engineering Verification
Taking the calculation of shield resistance in the 12311 longwall panel as an example, the accuracy of the fitting formula was verified. In the actual mining process of the 12311 longwall panel, the shield worked well. During the first and periodic weighting of the basic roof, the measured shield resistance was above 45.09 MPa, the maximum resistance was 48.24 MPa, and the average was 46.57 MPa.
According to Equation (4), Y = 323.45 (where M/∑h1 = 4.5/6.0 = 0.75), and shield resistance P = Y × γ × ∑h1 = 323.45 × 2.5 × 6.0 = 48.52 MPa.
From
Table 5, the supporting force on the unit area of the shield top beam can be obtained,
qf = 11.6 × 4.5 × 25 = 1.31 MPa. According to the conversion of Equation (8), the shield resistance was 48.42 MPa when the basic roof of the working face was first weighted.
The maximum shield resistance calculated by Equation (4) and
Table 5 at the first weighting of the basic roof was 0.58% and 0.38% larger than the maximum resistance in the field data. It showed that the accuracy of the fitted relation between mining height and shield resistance was quite high, hence, it could be used to provide guidance on the calculation of shield resistance in coal mine working faces.
5. Conclusions
(1) For the same mining height in a shallow coal seam, the shield resistance of the first weighting on the basic roof of the longwall panel was greater than that of the periodic weighting; however, the difference between the two is small.
(2) By means of dimensional analysis, a linear relation between the shield resistance and mining height, under the same shallow coal seam conditions, was fitted.
(3) When the mining height of the longwall panel in a shallow coal seam was greater than 3.5 m, the average shield resistance during the basic roof first and periodic weighting was 7–12 times the weight load of the mining height. Meanwhile, when the mining height was 2.5 m and 3.5 m, the maximum shield resistance was about 14.3 and 19.5 times the weight load of the mining height.
(4) Shield selection—based on yield capacity—should consider the influence of mining height in combination with mining conditions such as mining rate. The yield capacity of the selected shield should not be much higher than the calculated one, resulting in economic loss.
Author Contributions
Conceptualization, C.L.; methodology, C.L. and H.L.; validation, C.L. and H.L.; formal analysis, C.L.; resources, H.L. and H.S.M.; data curation, C.L.; writing—original draft preparation, C.L. and H.L.; writing—review and editing, C.L. and H.S.M.; visualization, H.S.M.; supervision, H.S.M. and H.L.; project administration, H.L. All authors have read and agreed to the published version of the manuscript.
Funding
This research was funded by Key Scientific Research Projects of Colleges and Universities in Henan Province: Project No. 22A440001; Henan Science and Technology Department: Project No. 222102220062; Ph.D. Fund of Henan University of Engineering: Grant No. DKJ2019001; Youth Program of Henan Natural Science Foundation - Project No. 232300420334. The authors are grateful for their support.
Data Availability Statement
Not applicable.
Acknowledgments
The authors wish to acknowledge the support of the Huojitu Coal Mine in Northern China.
Conflicts of Interest
The authors declare no conflict of interest.
References
- Xiao, G.G.; Yao, W.B. Mining-induced pressures caused by mining shallow buried coal seam in the gully terrain of Madiliang Coal Mine. J. Min. Strata Control Eng. 2021, 3, 96–103. [Google Scholar] [CrossRef]
- Ren, Y.F. Analysis of dynamic stress characteristics and surrounding rock structure in shallow buried longwall mining face. Coal Sci. Technol. 2020, 48, 50–56. [Google Scholar] [CrossRef]
- Wang, Y.; Zhao, B.; Deng, Z.G.; Lv, K.; Wang, H. Research on behavior of underground pressure in shallow coal seam with three-face goaf working face. Front. Energy Res. 2022, 10, 975602. [Google Scholar] [CrossRef]
- Wang, S.M.; Wei, J.B.; Song, S.J.; Hou, E.; Sun, T. Study on overburden and surface damage characteristics of shallow buried coal seam mining in loess gully area. Coal Sci. Technol. 2022, 50, 1–9. [Google Scholar] [CrossRef]
- Qiu, F.Q.; Zhu, L.; Gu, W.Z.; Liu, Z.; Zhang, X.; Pan, H.; Song, T. Mining pressure law and working resistance of support in face with large mining height in shallow seam. Saf. Coal Mines 2020, 51, 243–247. [Google Scholar] [CrossRef]
- Yang, D.F. Analysis of fracture mechanics theory of the first fracture mechanism of main roof and support resistance with large mining height in a shallow coal seam. Sustainability 2021, 13, 1678. [Google Scholar] [CrossRef]
- Sun, M.; Ye, Z.; Zhang, X.; Guo, C.; Zheng, W.; Qian, L. Roof weighting and support of a largely mined shallow coal seam. SN Appl. Sci. 2022, 4, 119. [Google Scholar] [CrossRef]
- Zhang, J.; He, Y.F. Research on the evolution of mining fissures in shallow coal seam groups and the fracture support load of combined bearing structures. Coal Sci. Technol. 2023, 1–14. [Google Scholar] [CrossRef]
- Li, G.D.; Cao, Q.Z.; Song, S.S. Determination of support resistance of working face with double key stratums in nearly shallow coal seam. J. Xinjiang Uni. 2021, 38, 715–721. [Google Scholar] [CrossRef]
- Ren, Y.F. Spatiotemporal evolution process of full thickness cutting of roof bedrock layer in shallow buried working face. J. China Coal Soc. 2020, 45 (Suppl. S2), 561–570. [Google Scholar] [CrossRef]
- Zhao, S.Y. Evolution law and influencing factors of overburden cutting subsidence disasters in high-intensity shallow seam mining. Coal Eng. 2020, 52, 126–132. [Google Scholar]
- Cui, X.J.; Gou, Q.Q. Study on overburden strata movement in the mining of shallow buried coal seam with gully topography. Min. Res. Dev. 2020, 40, 108–112. [Google Scholar] [CrossRef]
- Młynarek, Z.; Wierzbicki, J.; Wołyński, W. Use of functional cluster analysis of CPTU data for assessment of a subsoil rigidity. Stu. Geotech. Mech. 2018, 40, 117–124. [Google Scholar] [CrossRef] [Green Version]
- Skrzypkowski, K.; Korzeniowski, W.; Duc, T.N. Choice of powered roof support FAZOS-15/31-POz for Vang Danh hard coal mine. Inżynieria Mineralna 2019, 2, 175–182. [Google Scholar] [CrossRef]
- Liu, C.; Li, H.M.; Jiang, D.J. Numerical simulation study on the relationship between mining heights and shield resistance in longwall panel. Int. J. Min. Sci. Technol. 2017, 27, 293–297. [Google Scholar] [CrossRef]
- Liu, C.; Li, H.M.; Zhang, Q.L. Research on reasonable ratio of setting load and yield load of shield in large mining height coal mine. J. Min. Saf. Eng. 2018, 35, 725–733. [Google Scholar] [CrossRef]
- Wang, Y.X.; Mao, D.B.; Qi, Q.X. Study on determining of the mechanical parameters of rock mass used in numerical simulation. J. China Coal Soc. 2003, 6, 593–597. [Google Scholar] [CrossRef]
- Su, G.W.; Nimmo, J.R.; Dragila, M.I. Effect of isolated fractures on accelerated flow in unsaturated porous rock. Water Res. Res. 2003, 39, 11–19. [Google Scholar] [CrossRef] [Green Version]
- Lei, W.D.; Teng, J.; Hefny, A.; Zhao, J.; Guan, J. Numerical study on maximum rebound ratio in blasting wave propagation along radian direction normal to joints. J. Cent. South Uni. Technol. 2006, 6, 743–748. [Google Scholar] [CrossRef]
- Qian, M.G.; Xu, J.L.; Wang, J.C.; Shi, P.W. Ground Pressure and Strata Control, 2nd ed.; China University of Mining and Technology Press: Xuzhou, China, 2010; p. 179. [Google Scholar]
- Wang, C.Y. Effect of mining speed on bump manifestation of fully—Mechanized mining face in deep and thick coal seam. Coal Sci. Technol. 2019, 47, 96–101. [Google Scholar] [CrossRef]
- Feng, L.F.; Dou, L.M.; Wang, X.D.; Jin, D.; Cai, W.; Xu, J.; Jiao, B. Mechanism of mining advance speed on energy release from hard roof movement. J. China Coal Soc. 2019, 44, 3329–3339. [Google Scholar] [CrossRef]
Figure 1.
Shield model in numerical simulation.
Figure 1.
Shield model in numerical simulation.
Figure 2.
Numerical simulation model.
Figure 2.
Numerical simulation model.
Figure 3.
Overlying strata movement and deformation of different excavation distance. (a) Immediate roof collapse, (b) First collapse of basic roof, (c) Second collapse of basic roof.
Figure 3.
Overlying strata movement and deformation of different excavation distance. (a) Immediate roof collapse, (b) First collapse of basic roof, (c) Second collapse of basic roof.
Figure 4.
Basic roof caving form in excavation 200 m distance.
Figure 4.
Basic roof caving form in excavation 200 m distance.
Figure 5.
Changes of shield resistance and leg convergence under 2.5 m mining height.
Figure 5.
Changes of shield resistance and leg convergence under 2.5 m mining height.
Figure 6.
Changes of shield resistance and leg convergence under 3.5 m mining height.
Figure 6.
Changes of shield resistance and leg convergence under 3.5 m mining height.
Figure 7.
Changes of shield resistance and leg convergence under 4.5 m mining height.
Figure 7.
Changes of shield resistance and leg convergence under 4.5 m mining height.
Figure 8.
Changes of shield resistance and leg convergence under 5.0 m mining height.
Figure 8.
Changes of shield resistance and leg convergence under 5.0 m mining height.
Figure 9.
Changes of shield resistance and leg convergence under 5.5 m mining height.
Figure 9.
Changes of shield resistance and leg convergence under 5.5 m mining height.
Figure 10.
Changes of shield resistance and leg convergence under 6.0 m mining height.
Figure 10.
Changes of shield resistance and leg convergence under 6.0 m mining height.
Figure 11.
Changes of shield resistance and leg convergence under 6.5 m mining height.
Figure 11.
Changes of shield resistance and leg convergence under 6.5 m mining height.
Figure 12.
Changes of shield resistance and leg convergence under 7.0 m mining height.
Figure 12.
Changes of shield resistance and leg convergence under 7.0 m mining height.
Figure 13.
Average shield resistance for different mining heights after 200 m excavation.
Figure 13.
Average shield resistance for different mining heights after 200 m excavation.
Figure 14.
Average shield resistance for different mining heights during the first and periodic weighting of basic roof.
Figure 14.
Average shield resistance for different mining heights during the first and periodic weighting of basic roof.
Table 1.
Mechanical and physical properties of the simulated blocks of 12311 longwall panel overlying coal rock.
Table 1.
Mechanical and physical properties of the simulated blocks of 12311 longwall panel overlying coal rock.
| No. | Lithology | Average Thickness/m | Unit Weight
(kN/m3) | Elasticity Modulus (GPa) | Friction Angle
(°) | Poisson’s Ratio | Tensile Strength (MPa) | Cohesion
(kPa) |
|---|
| 17 | Alluvium/Sand dune | 20.0 | 17.0 | 0.12 | 18 | 0.42 | 0 | 0 |
| 16 | Thin peat | 6.8 | 24.3 | 18 | 18 | 0.26 | 1.53 | 23 |
| 15 | Fine siltstone 2 | 9.3 | 26.3 | 40 | 31.02 | 0.29 | 3.83 | 45.2 |
| 14 | Aeolian loess | 21.0 | 18.0 | 0 | 33 | 0.23 | 0 | 65 |
| 13 | Sand and gravel | 4.0 | 26.7 | 49 | 35.76 | 0.24 | 2.48 | 53.01 |
| 12 | Gravel layer 2 | 6.6 | 26.0 | 44 | 32.76 | 0.23 | 2.3 | 50.26 |
| 11 | Sandy clay | 3.5 | 15.5 | 35 | 19.15 | 0.24 | 1.36 | 78.83 |
| 10 | Gravel layer 1 | 4.8 | 26.0 | 44 | 32.76 | 0.25 | 2.3 | 50.26 |
| 9 | Argillaceous siltstone | 12.6 | 24.5 | 31 | 25.24 | 0.3 | 2.68 | 68.7 |
| 8 | Medium sandstone | 6.0 | 25.2 | 30.7 | 32.36 | 0.29 | 3.03 | 35.55 |
| 7 | Mudstone | 18.0 | 25.9 | 12.1 | 22.51 | 0.3 | 1.7 | 77.18 |
| 6 | Siltstone | 6.0 | 25.0 | 40 | 31.5 | 0.29 | 3.83 | 55.07 |
| 5 | Dirt band | 0.3 | 15.8 | 12.6 | 32 | 0.28 | 0.6 | 28 |
| 4 | 1-2 Coal seam | 4.5 | 12.9 | 8.3 | 36 | 0.28 | 0.4 | 22 |
| 3 | Siltstone | 2.5 | 26.6 | 40 | 31.5 | 0.29 | 3.83 | 55.07 |
| 2 | Fine siltstone 1 | 12.0 | 26.2 | 38 | 32.08 | 0.3 | 2.7 | 40 |
| 1 | Medium sandstone | 10.8 | 26.5 | 33.6 | 32.36 | 0.29 | 2.8 | 35.55 |
Table 2.
Mechanical and physical properties of the joints.
Table 2.
Mechanical and physical properties of the joints.
| No. | Lithology | Normal Stiffness
(1010 N/m) | Shear Stiffness
(1010 N/m) | Friction Angle
(°) | Cohesion
(kPa) | Tensile Strength
(MPa) |
|---|
| 17 | Alluvium/Sand dune | 0 | 0 | 30.2 | 0 | 0 |
| 16 | Thin peat | 3.0 | 3.0 | 29.8 | 2.8 | 0.1 |
| 15 | Fine siltstone 2 | 4.0 | 4.0 | 31.2 | 7.0 | 0.12 |
| 14 | Aeolian loess | 0 | 0 | 26.0 | 5.0 | 0 |
| 13 | Sand and gravel | 3.0 | 3.0 | 30.0 | 5.0 | 0.25 |
| 12 | Gravel layer 2 | 2.5 | 2.5 | 32.6 | 7.0 | 0.25 |
| 11 | Sandy clay | 3.0 | 3.0 | 28.6 | 8.0 | 0.12 |
| 10 | Gravel layer 1 | 3.0 | 3.0 | 32.7 | 7.0 | 0.23 |
| 9 | Argillaceous siltstone | 8.2 | 8.2 | 36.0 | 7.0 | 0.26 |
| 8 | Medium sandstone | 8.0 | 8.0 | 30.0 | 4.0 | 0.30 |
| 7 | Mudstone | 3.0 | 3.0 | 26.8 | 7.0 | 0.18 |
| 6 | Siltstone | 2.0 | 2.0 | 31.5 | 3.0 | 0.38 |
| 5 | Dirt band | 2.0 | 2.0 | 30.0 | 3.0 | 0.12 |
| 4 | 1-2 Coal seam | 1.5 | 1.5 | 28.6 | 2.0 | 0.04 |
| 3 | Siltstone | 2.0 | 2.0 | 31.5 | 3.0 | 0.38 |
| 2 | Fine siltstone 1 | 5.0 | 5.0 | 32.0 | 4.0 | 0.27 |
| 1 | Medium sandstone | 8.0 | 8.0 | 30.0 | 4.0 | 0.30 |
Table 3.
Non-dimensional results of each derived quantity.
Table 3.
Non-dimensional results of each derived quantity.
| Physical Quantity | Parameter | Symbol | Nondimensional Value |
|---|
| Basic quantity | immediate roof thickness | ∑h1 | -- |
| unit weight of rock | γ | -- |
| gravity | g | -- |
| Derived quantity | mining height | M | M/∑h1 |
| basic roof thickness | ∑h2 | ∑h2/∑h1 |
| mining speed | v | v /(∑h11/2g1/2) |
| shield resistance | P | P/(γ∑h1) |
| basic roof load | P1 | P1/(γ∑h1) |
Table 4.
Formula fitting data.
Table 4.
Formula fitting data.
| Mining Height M (m) | 2.5 | 3.5 | 4.5 | 5.0 | 5.5 | 6.0 | 6.5 | 7.0 |
|---|
| Immediate roof thickness ∑h1 (m) | 6.0 | 6.0 | 6.0 | 6.0 | 6.0 | 6.0 | 6.0 | 6.0 |
| Unit weight of rock γ (kN/m3) | 25 | 25 | 25 | 25 | 25 | 25 | 25 | 25 |
| M/∑h1 | 0.417 | 0.583 | 0.750 | 0.833 | 0.917 | 1.000 | 1.083 | 1.167 |
| Pf /(γ∑h1) | 306.27 | 312.89 | 323.52 | 331.47 | 332.84 | 336.75 | 340.19 | 340.95 |
| Pp/(γ∑h1) | 298.25 | 305.53 | 319.68 | 327.56 | 330.55 | 335.23 | 338.53 | 340.73 |
Table 5.
Relation between shield resistance and mining height.
Table 5.
Relation between shield resistance and mining height.
| Mining Height (m) | 2.5 | 3.5 | 4.5 | 5.0 | 5.5 | 6.0 | 6.5 | 7.0 |
|---|
| qm (MPa) | 0.063 | 0.088 | 0.113 | 0.125 | 0.138 | 0.150 | 0.163 | 0.175 |
| qf (MPa) | 1.243 | 1.270 | 1.313 | 1.345 | 1.351 | 1.367 | 1.381 | 1.384 |
| qp (MPa) | 1.210 | 1.240 | 1.297 | 1.329 | 1.342 | 1.361 | 1.374 | 1.383 |
| qf / qm | 19.7 | 14.4 | 11.6 | 10.8 | 9.8 | 9.1 | 8.5 | 7.9 |
| qp / qm | 19.2 | 14.1 | 11.5 | 10.6 | 9.7 | 9.1 | 8.4 | 7.9 |
| Disclaimer/Publisher’s Note: The statements, opinions and data contained in all publications are solely those of the individual author(s) and contributor(s) and not of MDPI and/or the editor(s). MDPI and/or the editor(s) disclaim responsibility for any injury to people or property resulting from any ideas, methods, instructions or products referred to in the content. |
© 2023 by the authors. Licensee MDPI, Basel, Switzerland. This article is an open access article distributed under the terms and conditions of the Creative Commons Attribution (CC BY) license (https://creativecommons.org/licenses/by/4.0/).


