Article

Study on the Characteristics of Damaged Sandstone in the Longshan Grottoes Using Water Chemistry and Freeze–Thaw Cycling

1
Key Laboratory of Disaster Prevention and Mitigation, Department of Civil Engineering, Lanzhou University of Technology, Lanzhou 730050, China
2
Northwest Research Institute Limited Company of China Railway Engineering Corporation, Lanzhou 730000, China
3
Faculty of Architecture and Civil Engineering, Huaiyin Institute of Technology, Huaian 223001, China
4
Institute for Conservation of Cultural Heritage, Shanghai University, Shanghai 200444, China
5
Taiyuan Cultural Relics Protection and Research Institute, Taiyuan 030012, China
*
Author to whom correspondence should be addressed.
Minerals 2023, 13(3), 430; https://doi.org/10.3390/min13030430
Submission received: 27 January 2023 / Revised: 11 March 2023 / Accepted: 15 March 2023 / Published: 17 March 2023

Abstract

:
Sandstone from the Longshan Grottoes in Taiyuan, China, was the research object of this paper. The sandstone samples were soaked in distilled water, Na2SO4 solution, and NaCl solution and subjected to freeze–thaw testing. Sandstone specimens were treated with 0, 5, 10, 15, 20, 25, and 30 freeze–thaw cycles. The mass ratio, P-wave velocity, surface hardness, uniaxial compressive strength, and other physical-mechanical features of rock samples were measured after different numbers of cycles. The results of mercury injection, scanning electron microscopy, and X-ray diffraction were combined to explore the damage mechanisms and characteristics of the rock samples under the combined action of chemicals and freeze–thaw cycles. It was found that the damage degree of sandstone increased logarithmically with the number of cycles, with Na2SO4 solution causing the most damage. Damage variables D of the samples soaked in distilled water, Na2SO4 solution, and NaCl solution after 30 freeze–thaw cycles were 3.89%, 6.51%, and 4.74%, respectively. The difference in damage between the solutions is caused by the combination of frost heave, dissolution, and salt crystallization, and the damage process generally occurs from the inside and the outside and is manifested as an increase in the number of macropores and the appearance of new pores. Freezing–thawing and salt action are important causes of the powdering and detachment of sandstone in the Longshan Grottoes.

1. Introduction

The Longshan Grottoes, the largest pure Taoist grottoes in China, date back to the Tang Dynasty. The Longshan Grottoes have been exposed to air for a long time. Under the influence of the natural environment and human factors, the surface sandstone of the grottoes has become powdery, flaky, and layered. Therefore, it has become an urgent problem to study the damage mechanism of the sandstone in the Longshan Grottoes and formulate scientific protection countermeasures from the perspective of a cultural relics occurrence environment. The Longshan Grottoes are located on an isolated cliff in Longshan, Taiyuan, China. Atmospheric precipitation is the main source of water supply, which makes freezing–thawing and chemical erosion become important factors in the weathering process of sandstone in the Longshan Grottoes. To verify this, laboratory accelerated deterioration tests need to be conducted.
Rock freeze–thaw cycle tests have been standardized in both domestic [1] and international [2] test codes. In general, the freezing temperature is −20 °C, while the thawing temperature is 20 °C. EN12371 [3], a commonly used European standard test method for evaluating natural stone, is widely applied [4,5,6,7,8] and has been further improved with the development of automated control procedures [5,8]. Many studies have been conducted to explore the impacts of the freezing temperature [7,9,10], rock type [8,11,12], water content [13], and porosity [5] on the freeze–thaw cycle of rocks. It was found that an increase in the freezing temperature can lead to the generation and expansion of rock cracks [7]. On the contrary, the influence of the freezing temperature on the mechanical properties of rock samples is much lower than that of water content [9]. To assess the level of damage inflicted on rocks after a freeze–thaw cycle, researchers have been using several indices, such as compressive strength, hardness, dry density, water absorption, and porosity, and they have studied the relationship between destructive and non-destructive indices [12]. In addition, the required number of freeze–thaw cycles varies significantly for different kinds of rocks [6,7,14]. Therefore, the selection of the freezing temperature and cycle period should be based on research objectives and the region of research [6,15].
When it comes to freeze–thaw methods, two main approaches are typically used. The first involves filling the sample with water and then conducting the freeze–thaw cycle [16,17], while the second entails immersing the rock sample in water for the freeze–thaw cycle [13]. Immersion freezing–thawing is known to have a much greater deteriorating effect on rock samples than saturated freezing–thawing [18], making it essential to choose the correct freeze–thaw method based on the rock type. In the natural environment, the influence of salt weathering on stone cultural relics cannot be ignored, and scholars have conducted a lot of studies on it [19,20,21,22,23,24]. However, there is still a lack of research into the interaction between freezing–thawing and chemical erosion caused by snowfall in the winter.
This paper provides a method for establishing indoor accelerated test conditions based on environmental data, such as temperature, humidity, and rainfall, in combination with conditions needed for the storage of cultural relics. In other words, precipitation is taken as an accidental factor to carry out a freeze–thaw cycle for rock samples. To the best of our knowledge, this is the first paper to discuss the weathering characteristics and mechanism of the sandstone in the Longshan Grottoes. Through the optimization of previous research methods, the environment of the tests was made to resemble the field environment more closely. The mass, wave velocity, surface hardness, and compressive strength of the sandstone samples before and after cycling were measured using freeze–thaw tests with different immersion solutions and different cycles. The damage characteristics and damage mechanism were analyzed using scanning electron microscopy (SEM), X-ray diffraction (XRD), and mercury injection (MIP) tests. This paper provides a useful reference for the treatment of weathering diseases in the Longshan Grottoes.

2. Research Methods

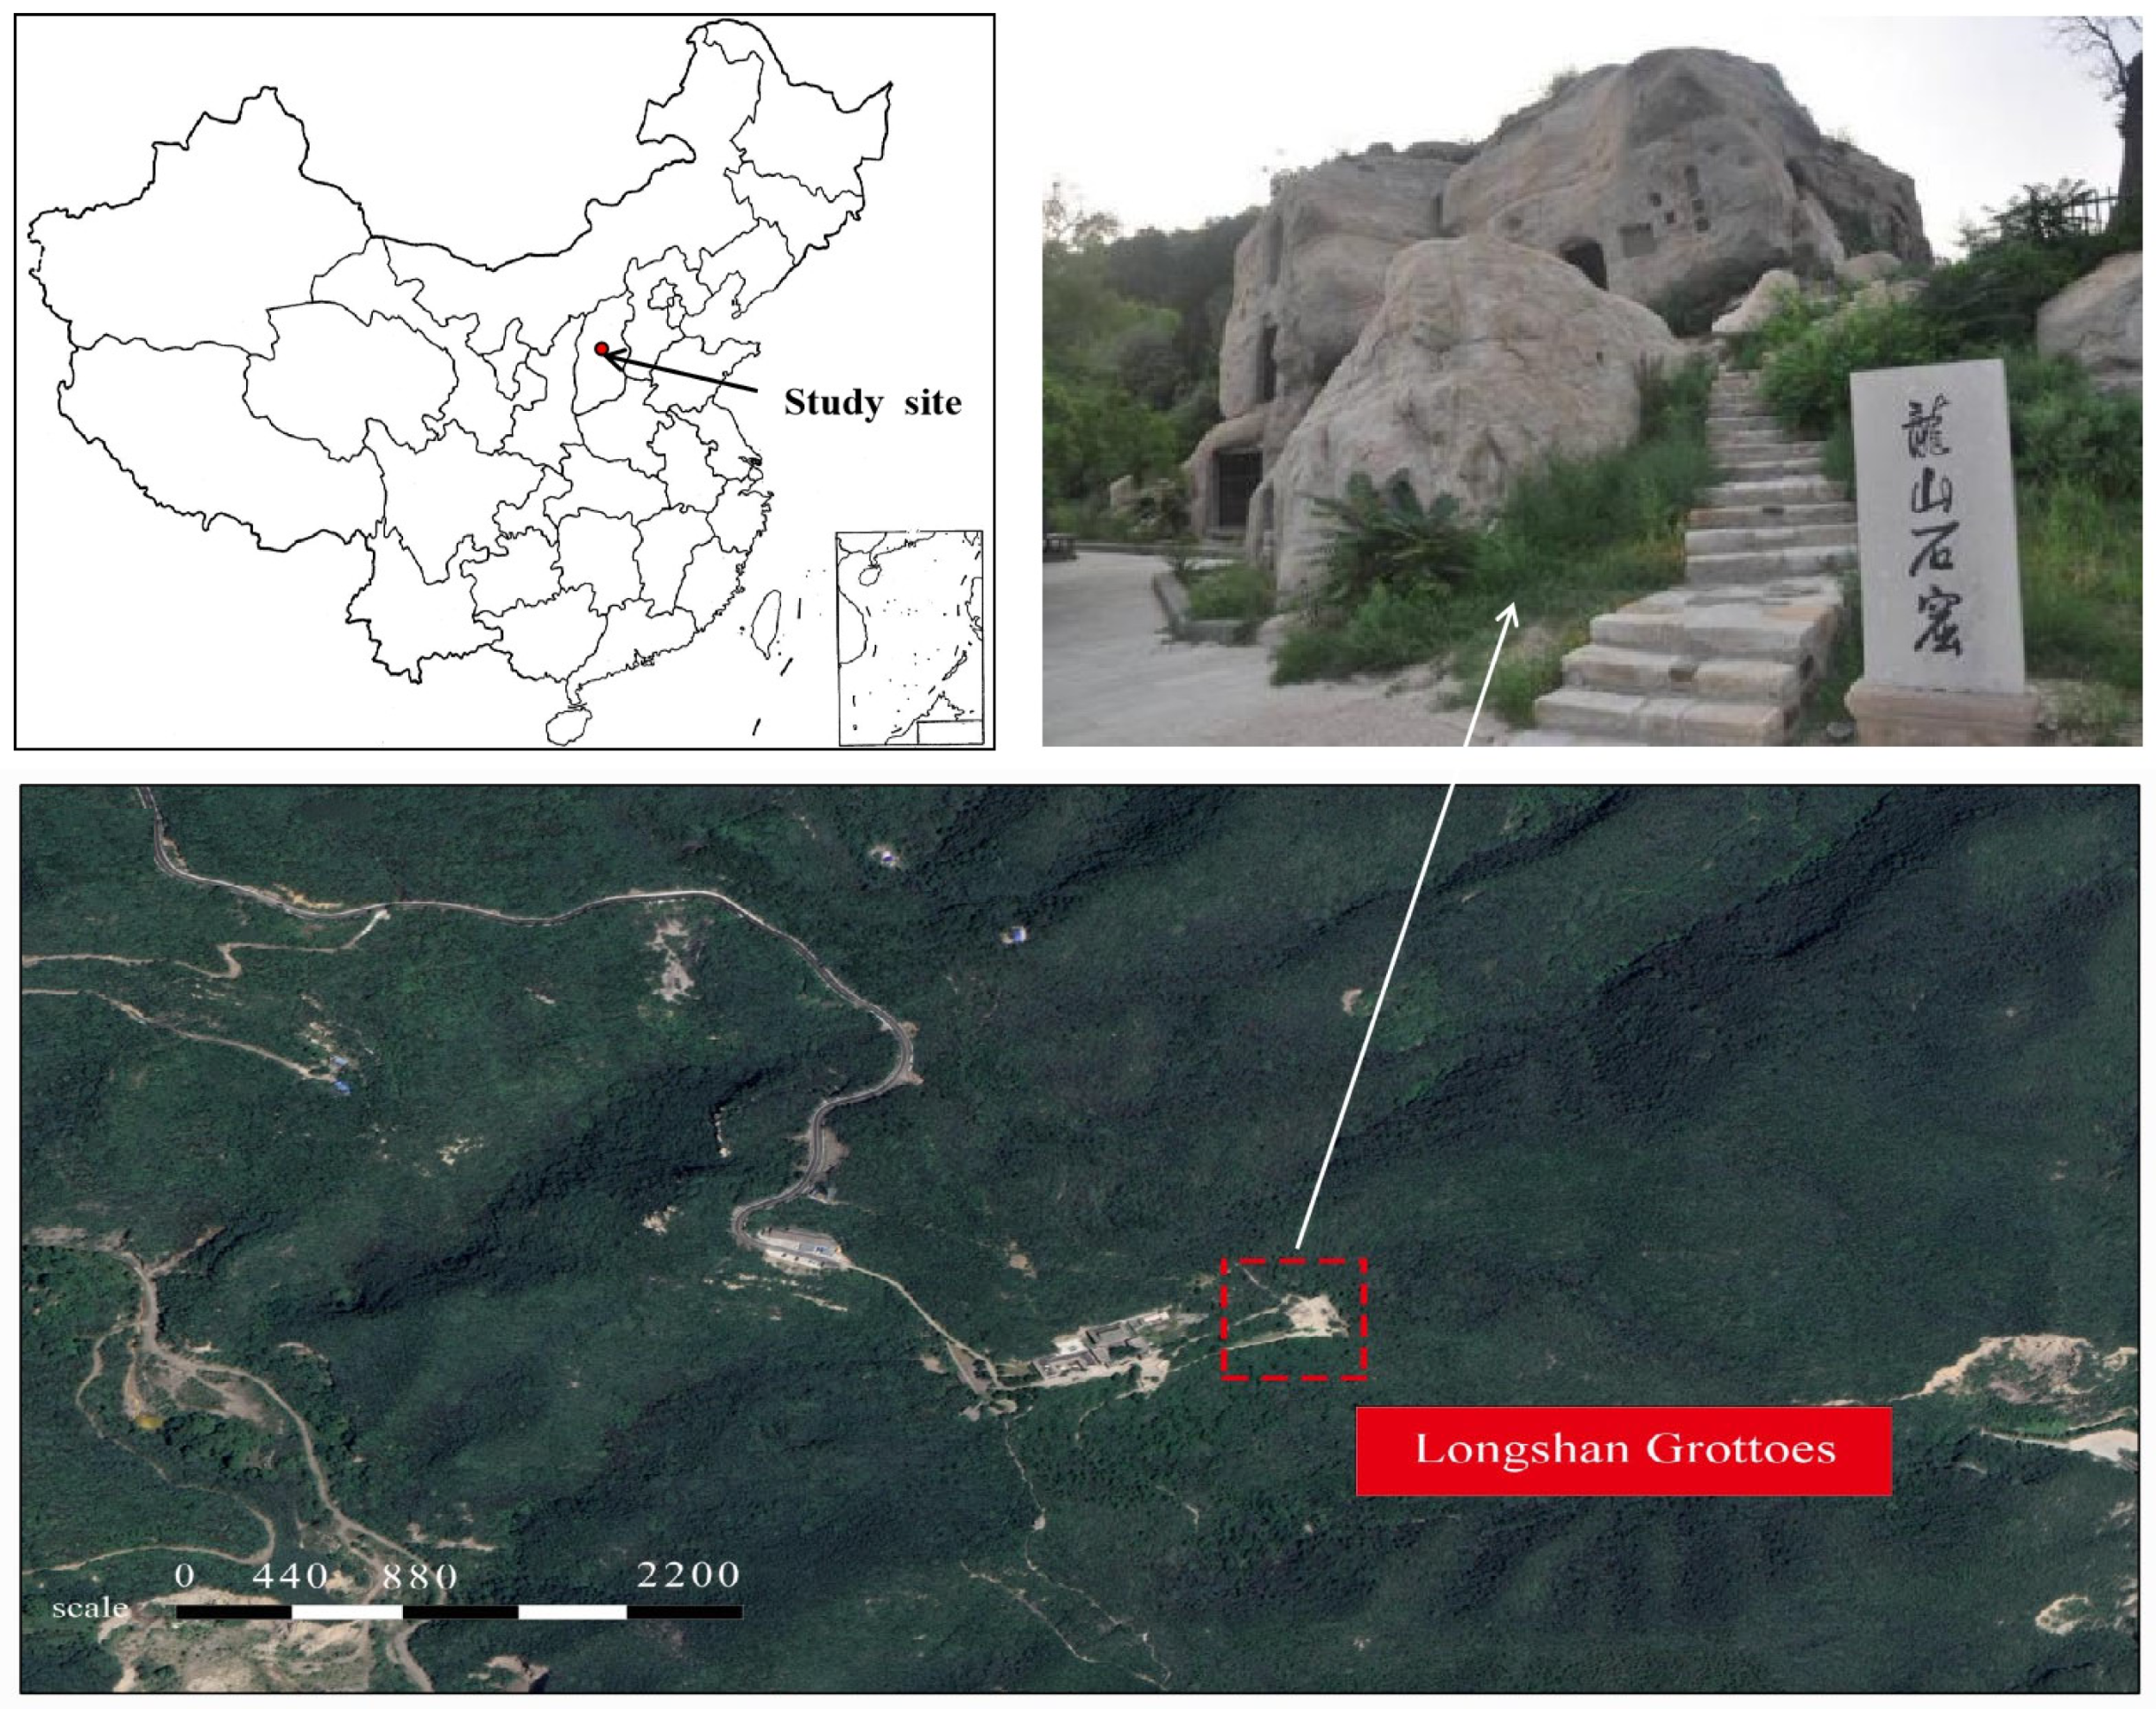
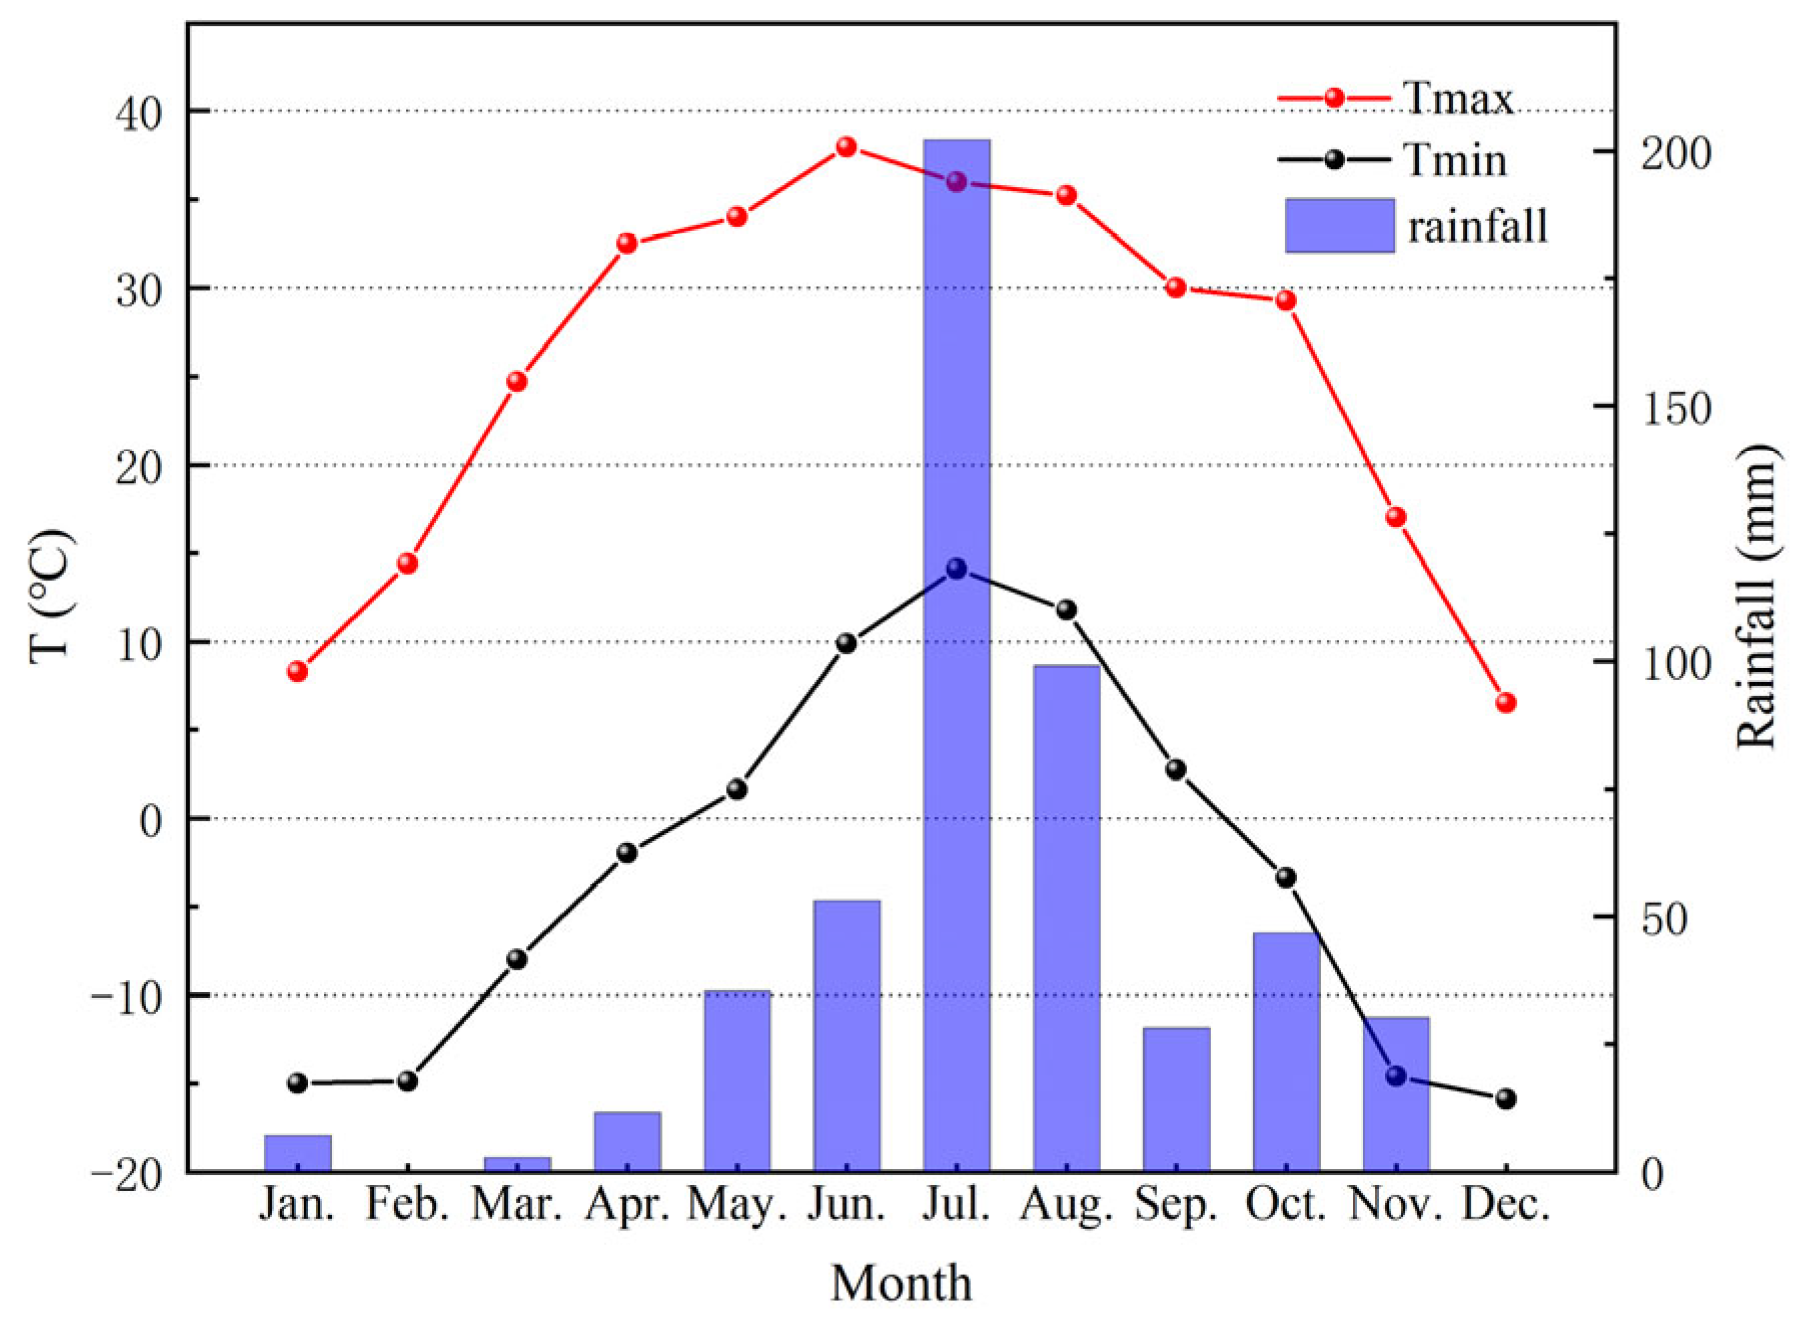
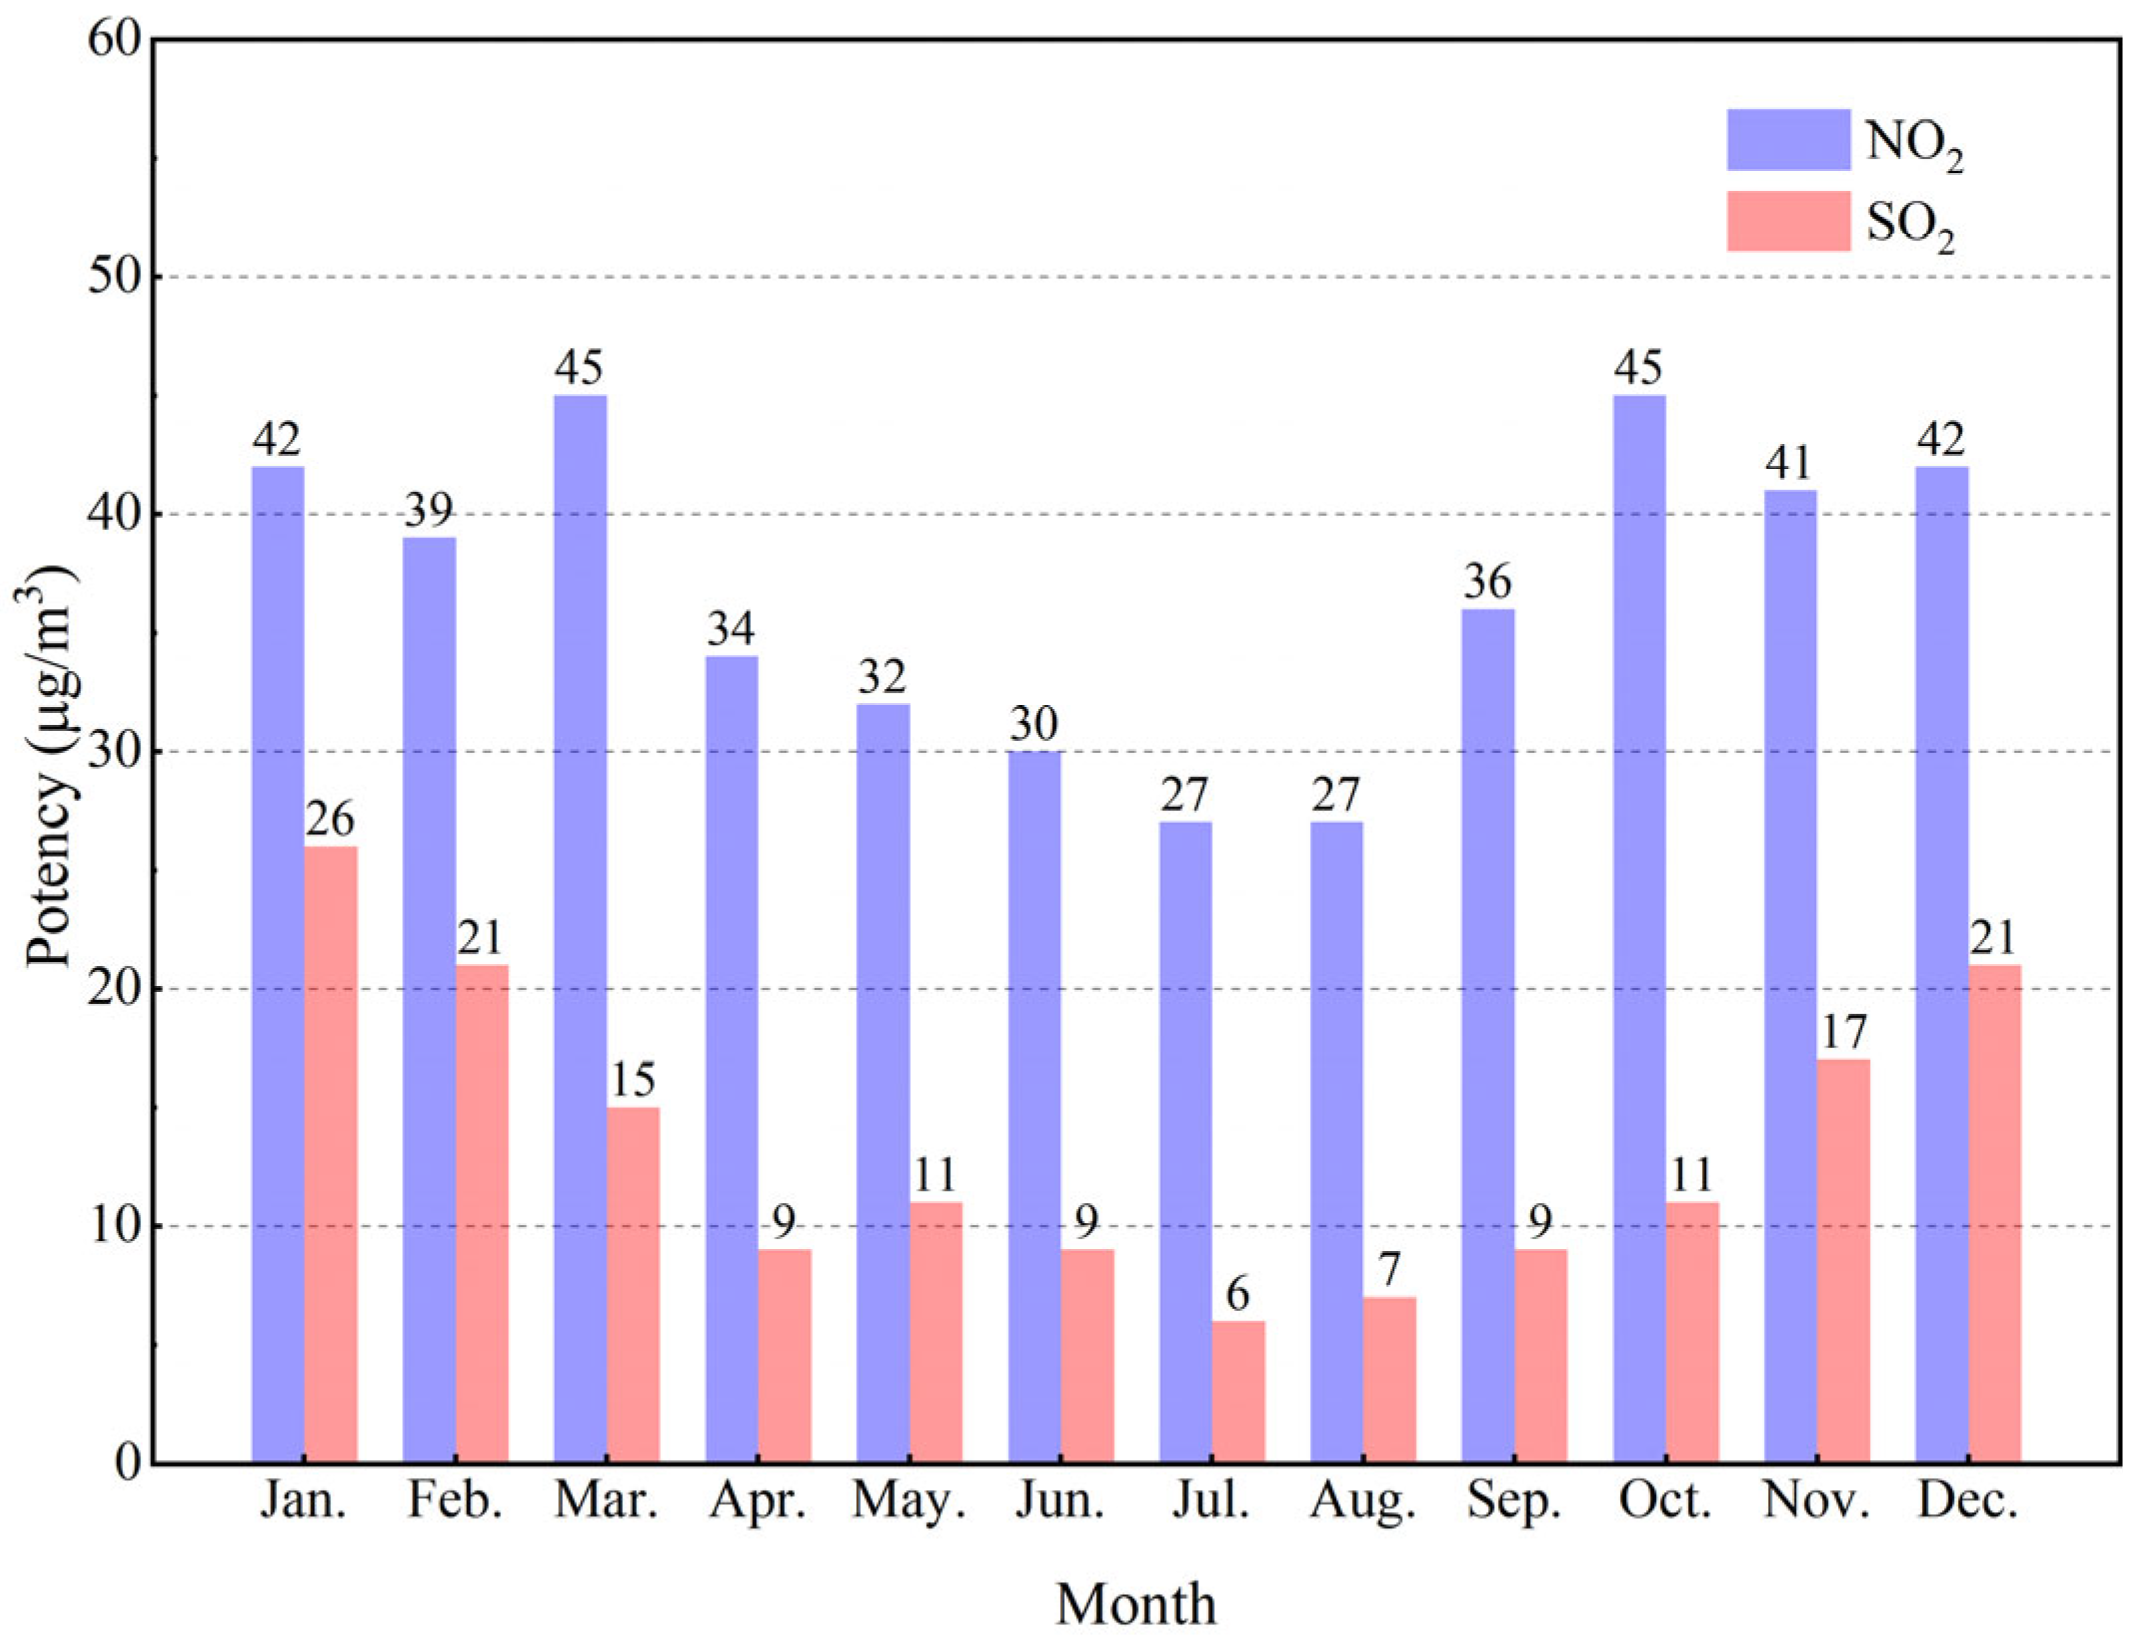
2.1. Research Background

The Longshan Grottoes are located at the top of Longshan Mountain in Jinyuan District, Taiyuan City, with the geographical coordinates of 112°25′ E, 37°43′ N (Figure 1). According to the China Meteorological Science Data Center, the area experiences an average annual temperature of 10.9 °C, with the lowest winter temperature being −22 °C and the highest temperature reaching 19.7 °C. Relative humidity levels average out to 56%, and the average rainfall is 759 mm; the number of days with temperatures below 0 °C amounts to 205, and freezing–thawing can occur during this period. Based on the data collected from the Longshan weather station, the temperature and precipitation in 2022 are shown in Figure 2.
The weathering of the Longshan Grottoes is serious. After investigation, the weathering form in the cave is more complex, the weathering surface of the lower wall is generally pulverized and falls off (Figure 3a), the seriously weathered parts are often weathered into irregular holes, the surface color of the cave falls off, and the statue has been blurred (Figure 3b). The weathering form outside the cave is relatively single. Due to the influence of rain erosion and temperature difference, the weathering surface is usually relatively gentle, mostly layered (Figure 3c,d), and the thickness of the peeling layer is about 2~4 cm.
The weathering degree of the rock mass outside the cave is higher than that of the rock mass inside the cave, which is caused by the larger temperature and humidity variation range of the environment outside the cave and the direct exposure of the rock mass outside the cave to the natural environment. The rock mass outside the cave, however, is a kind of protection for the statues inside. Despite their differences in the degree of weathering, the rocks inside and outside the cave are similar in lithology, so studying the weathering mechanism of sandstone is of great significance for the protection of the rock mass outside the cave.
In the winter of 2021, three snow water samples (1#, 2#, and 3#) were collected in the Longshan area for ion identification. An inductively coupled plasma emission spectrometer was used for the cation test and an ion chromatograph for the anion test, and the results are shown in Table 1. The cations were mainly Na+ and Ca2+, and the SO42− content was the highest among the anions, with a maximum concentration of 17.31 mg/L (0.18 mmol/L), which may be related to the high concentration of NO2 and SO2 in the atmosphere. These pollutants eventually change to the water-soluble ions SO42− and NO3. This can be attributed to the high levels of NO2 and SO2 in the Taiyuan atmosphere, as shown in Figure 4 (data from the Shanxi Provincial Department of Ecology and Environment). Therefore, under the influence of a prolonged frost period and atmospheric precipitation, freezing–thawing and chemical damage are the important causes of the weathering of sandstone in the Longshan Grottoes.
Samples at different depths in the surface of the cave body were collected for the XRD test, and the relative mineral content was obtained using semi-quantitative analysis, as shown in Figure 5. The main components of the sample were quartz, illite, albite, and a small amount of epidote at a depth of 8 cm.

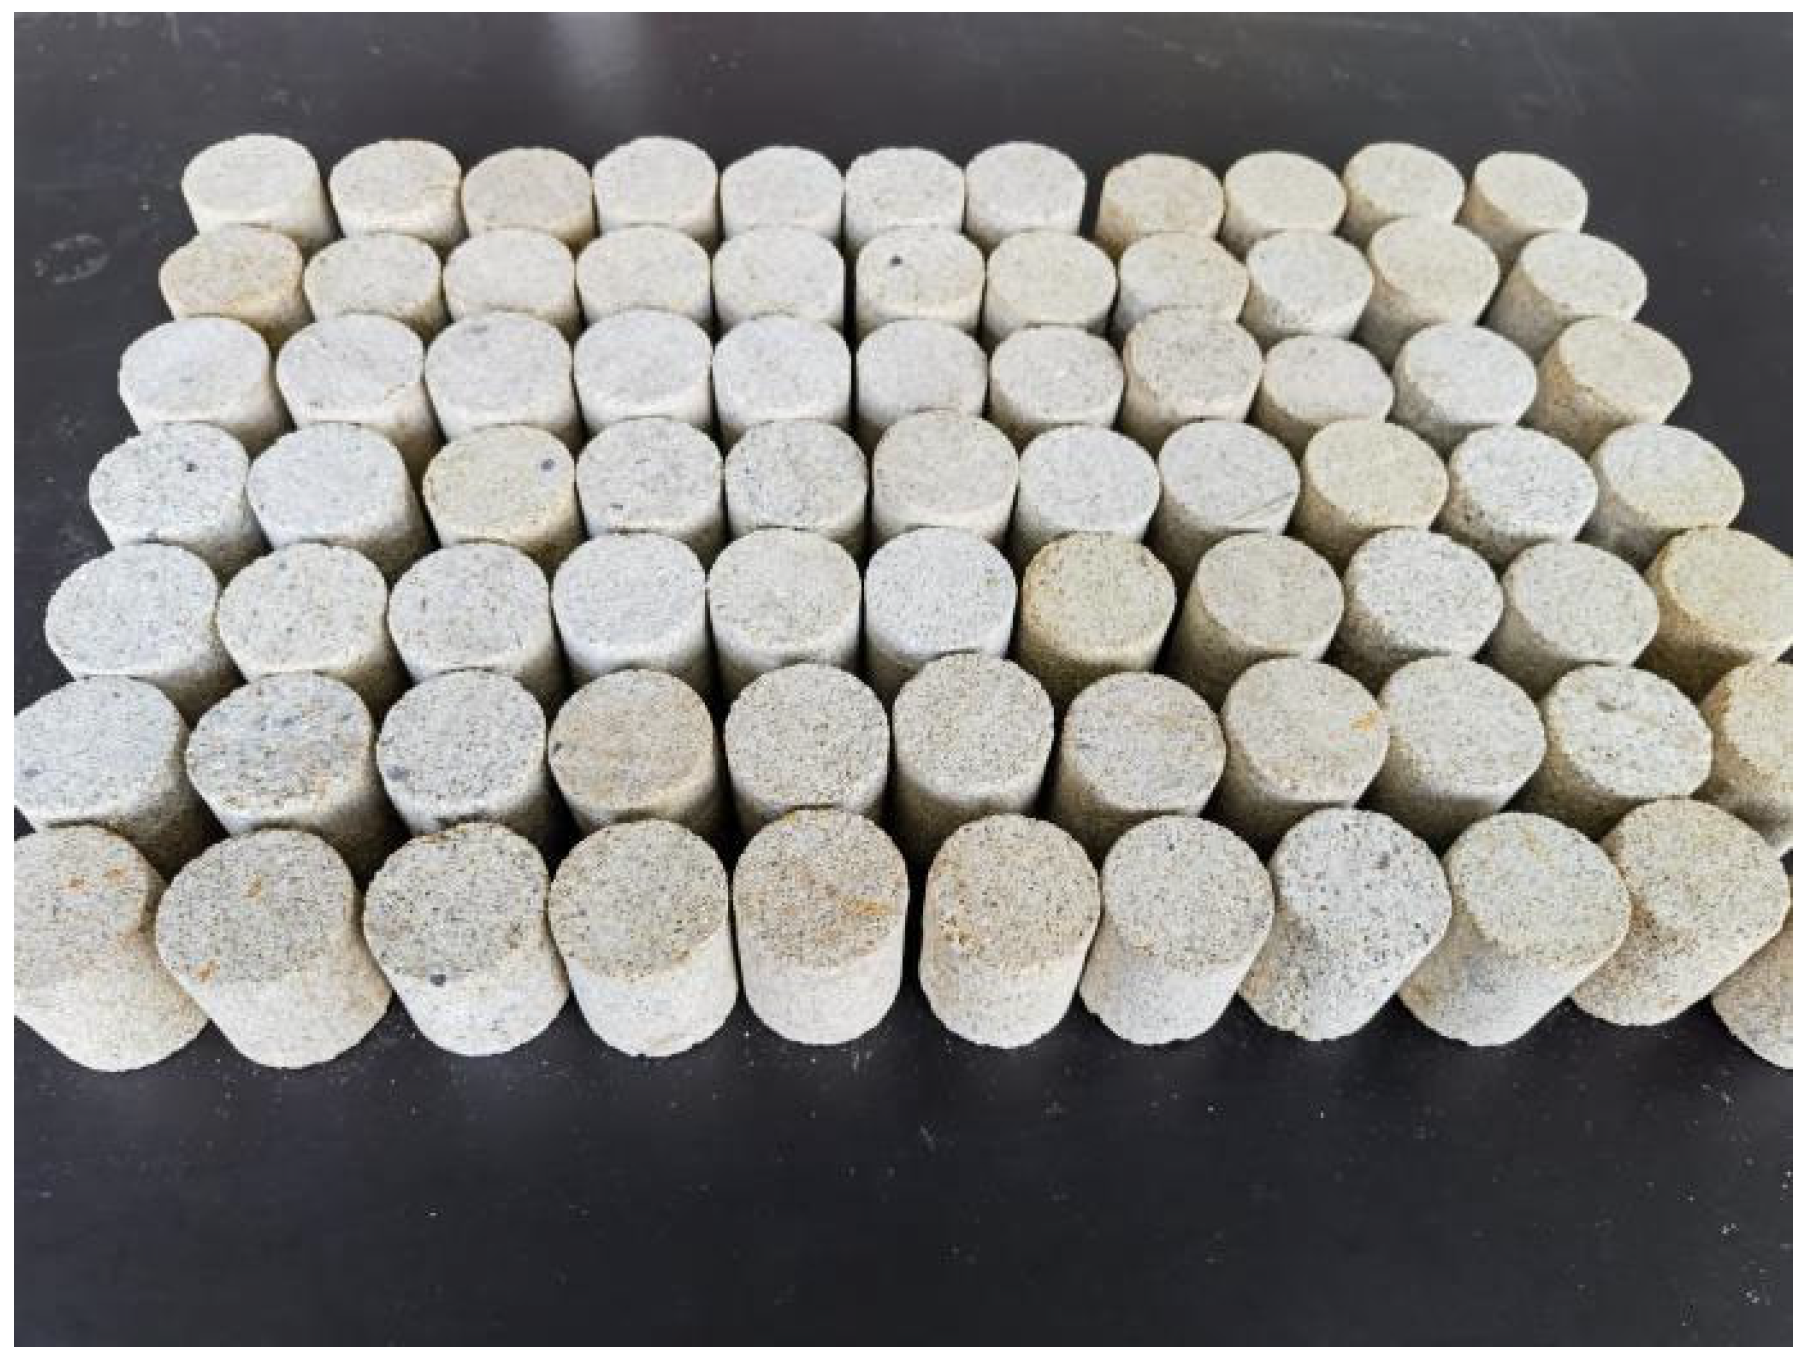
2.2. Sample Preparation and Testing

The rock sample was taken from the same rock mass as the Longshan Grottoes, which experienced the same lithology and weathering conditions. According to the standard for the test method of engineering rock mass [1], the drill core was processed into cylindrical samples with a diameter of 50 mm and a height of 50 mm. Some samples are shown in Figure 6. Any samples with obvious exterior defects were discarded, and the ones with a similar wave speed were then selected for freeze-thaw testing.
The samples were all from the same rock and drilled in the same direction. Therefore, the rock sample was isotropic. In addition, the number of samples in each group was 5 in the freeze-thaw cycle. The test was conducted according to the standard for the test method of engineering rock mass [1]. The measurement of physical indices before and after the cycle was carried out under the condition of drying the samples. The samples were placed into an electric thermostatic drying oven at 105 °C for 48 h to determine the drying mass. After saturation for 48 h, the natural saturation mass of the samples was determined. The mass of the samples was measured using a hydrostatic balance (model: JA5003, manufacturer, city, state abbreviation if USA or Canada, country), while their wave velocity was detected using a non-metallic ultrasonic detector (the transducer was a P-wave transducer with a frequency of 250 kHz, model: NM-4B, manufacturer, city, state abbreviation if USA or Canada, country). A Riehl hardness tester (model: BH200C, probe type D, manufacturer, city, state abbreviation if USA or Canada, country) was used to test the surface hardness of the rock samples. The uniaxial compressive strength was measured using an electro-hydraulic universal testing machine (model: CSS-WAW 1000DL, manufacturer, city, state abbreviation if USA or Canada, country). The initial physical parameters of the sandstone are shown in Table 2.
A powder crystal X-ray diffractometer (model: Dmax2600, manufacturer, city, state abbreviation if USA or Canada, country) was used to conduct the XRD test and whole-rock analysis. The test voltage was 40 kV, the scanning range was 5°~60°, and the scanning speed was 5°/min. Using Rietveld finishing software Jade 9 (version****, manufacturer, city, state abbreviation if USA or Canada, country), the mineral composition and content of sandstone were analyzed. Whole-rock analysis was conducted with reference to the “Analysis method for clay minerals and ordinary non-clay minerals in sedimentary rocks by the X-ray diffraction”, and the results are shown in Table 3 and Table 4. The non-clay minerals were mainly quartz and a small amount of albite and calcite. The mineral content of clay minerals was relatively high, and all the clay minerals measured in this experiment were illite.
An automatic mercury injection instrument (model: PoreMaster GT-60) was used to determine the pore distribution of the original rock, and the results are shown in Figure 7.

2.3. Freeze–Thaw Test Scheme

In the ion identification results of atmospheric precipitation, SO42− and Cl are the main anions and Na+ is the main cation. At the same time, NaCl is the most common soluble salt threatening stone relics, while Na2SO4 is the most destructive soluble salt. Therefore, in this experiment, Na2SO4 solution and NaCl solution were selected as rock-sample-infiltrating solutions, both with concentrations of 0.5 mol/L, and distilled water was selected as the control group.
In recent years, the lowest monthly temperature in the area of the Longshan Grottoes is −15 °C and the highest monthly temperature is 17 °C. The historical low temperature is −22 °C, and the historical high temperature is 20 °C. At the same time, the temperature variation range of the grottoes’ surface is slightly higher than the temperature variation range, which is larger. To better simulate the deterioration of sandstone in the grottoes, the accelerated deterioration test was carried out in the laboratory, so the temperature range of the freeze–thaw test was selected as −20~25 °C.
Freeze–thaw tests were conducted in a rapid-temperature-change humid heat test chamber (model: RHPS-408BT, manufacturer, city, state abbreviation if USA or Canada, country), and the setting of the test box is shown in Figure 8. Taiyuan has a temperate continental monsoon climate. As the precipitation frequency is low, the rock mass does not undergo only a single freeze–thaw process following a precipitation event. Therefore, in this paper, the method of multiple freeze–thaw cycles with one soak was adopted. Sandstone specimens were treated with 0, 5, 10, 15, 20, 25, and 30 freeze–thaw cycles.
The samples were grouped so that no fewer than 5 samples were immersed in any solution for each freeze–thaw cycle. The test was carried out in reverse sequence, that is, 30 freeze–thaw cycles were carried out first, followed by 25, 20, 15, 10, and 5 freeze–thaw cycles. After drying the samples with 30 freeze–thaw cycles for 48 h, the mass, p-wave velocity, and hardness of the samples were measured, and then the samples were soaked in the corresponding solution for 48 h and finally placed into the test chamber for 5 cycles. This process was repeated for samples with 25, 20, 15, 10, and 5 freeze–thaw cycles to ensure that the test of the number of freeze–thaw cycles used was completed at the same time. All samples after freeze–thaw cycles were dried to measure the mass, p-wave velocity, Reichle hardness, and uniaxial compressive strength. MIP, SEM, and XRD were conducted on the surface of the samples after freeze–thaw cycles. Mercury injection was determined using an automatic mercury injection instrument (model: PoreMaster GT-60, manufacturer, city, state abbreviation if USA or Canada, country), and the micro-morphology was observed using Hitachi’s new field emission scanning electron microscope (model: Regulus 8230, manufacturer, city, state abbreviation if USA or Canada, country).

3. Damage Features

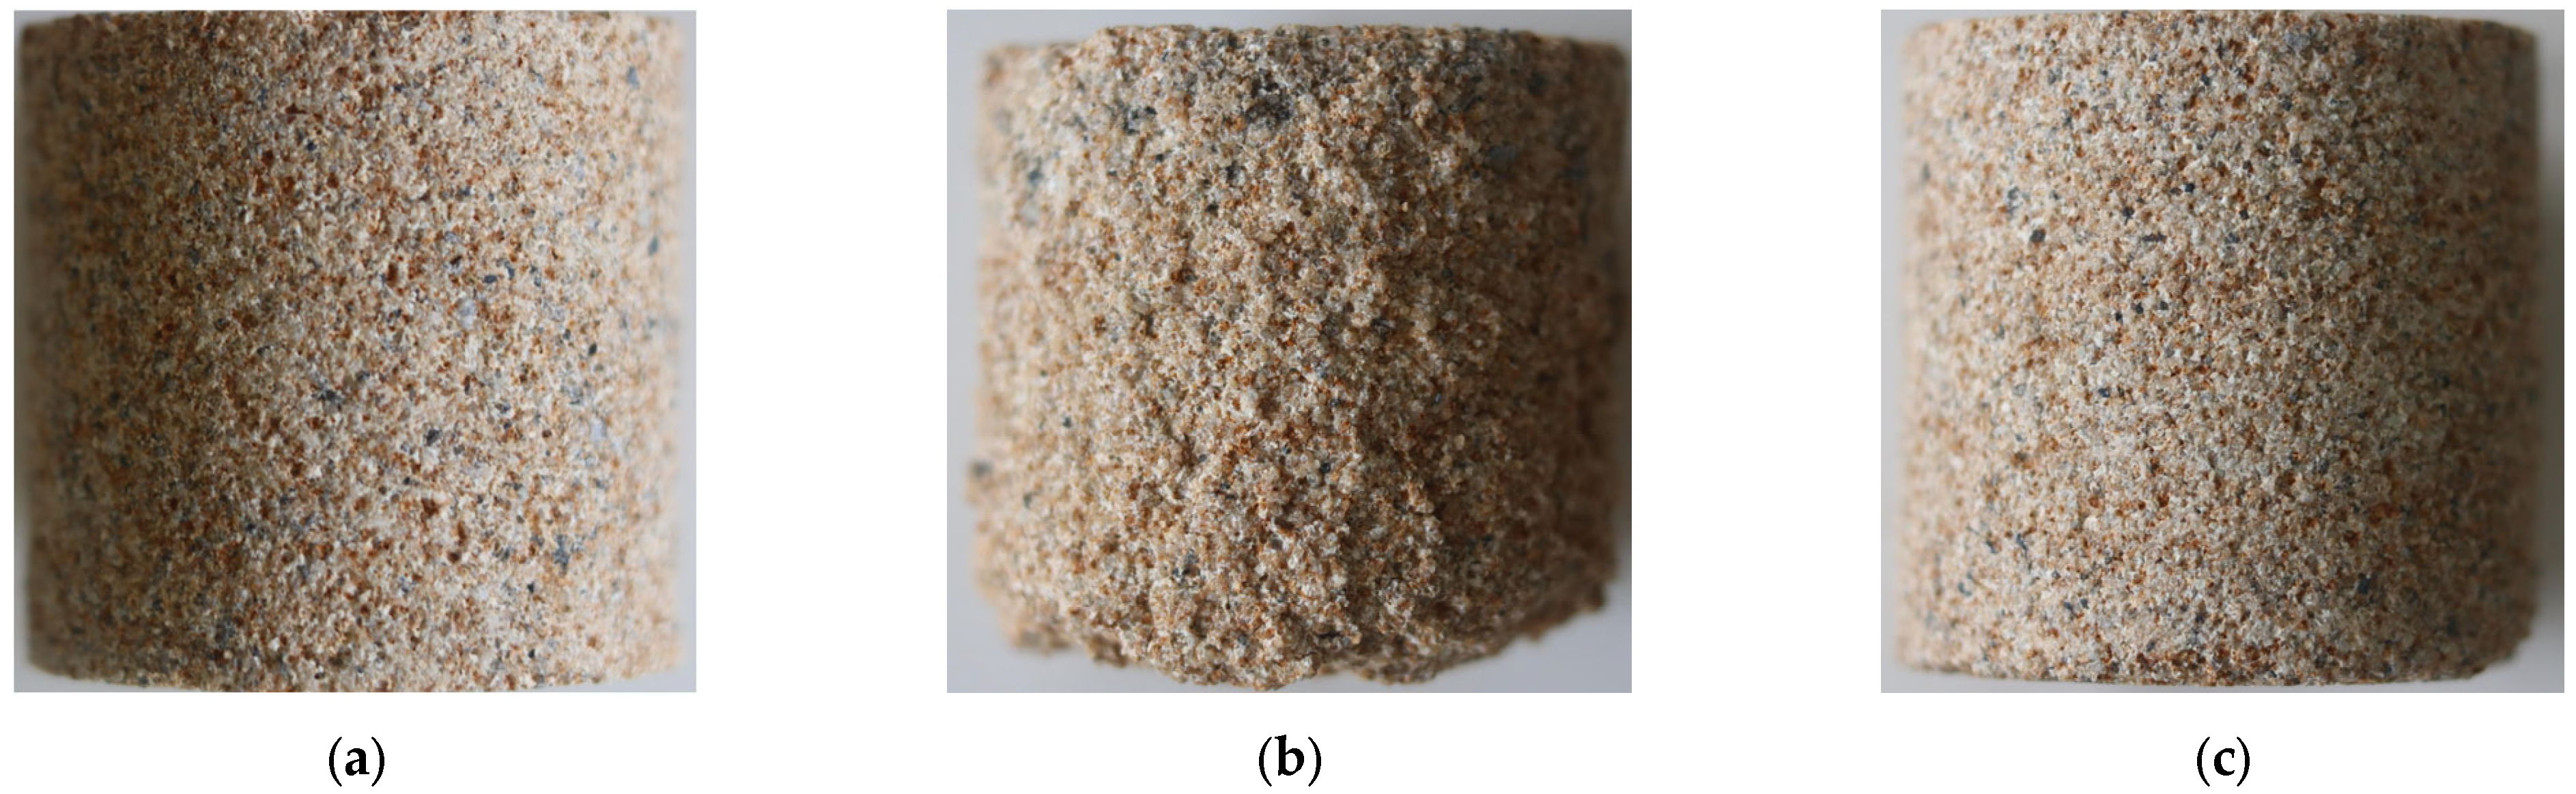
3.1. Apparent Morphology

The apparent morphologies of samples in different solution environments after 30 freeze–thaw cycles are shown in Figure 9. The rock sample in Na2SO4 solution had the most serious failure form. After 15 cycles, the surface of the sample became rough and broke down from the edge, with particle shedding and gradual pulverization. After 30 cycles, the powder condition of the sample was serious, as shown in Figure 1b. In NaCl solution, the edge of the rock samples also fell off after 30 cycles but the situation was significantly better than that in Na2SO4 solution. In distilled water, the change in the apparent morphology of the sample after circulation was not obvious.

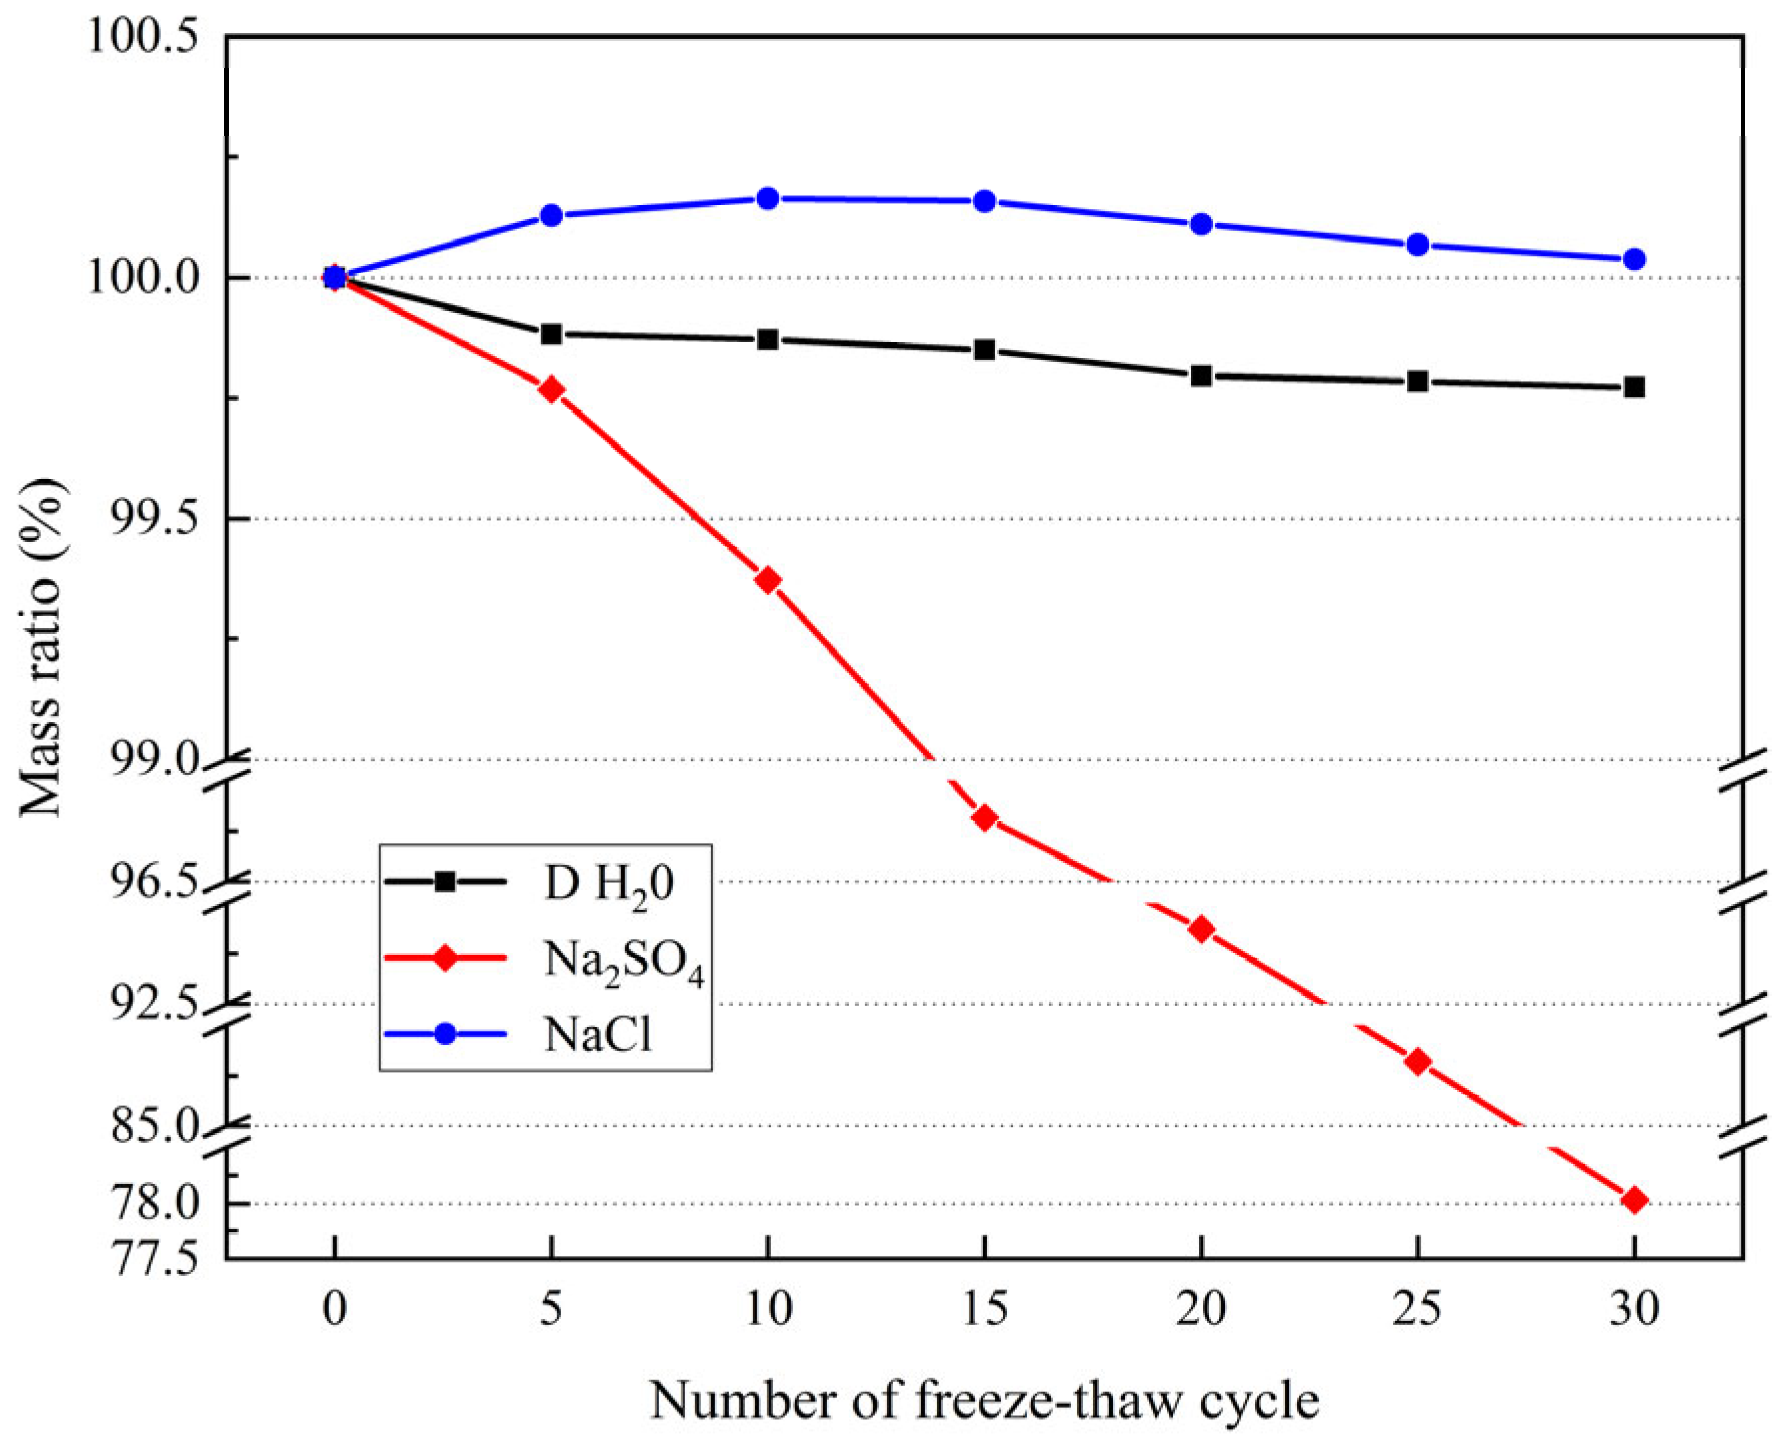
3.2. Changes in Mass Ratio

Changes in the mass ratio (the ratio of mass after a cycle to mass before a cycle) are shown in Figure 10. The results showed the following: (1) The sample mass in Na2SO4 solution decreased the most, the decline rate gradually increased, and the mass ratio reached 78.03% after 30 cycles. The sample mass in water showed a trend of rapid change followed by slow change, and the sample mass loss was only 0.23% after 30 cycles. In NaCl solution, the quality of the rock samples increased at first and then started to decrease after 15 cycles. (2) Within the same cycle, the mass loss of samples soaked in Na2SO4 solution was much greater than that of samples soaked in the other solutions.

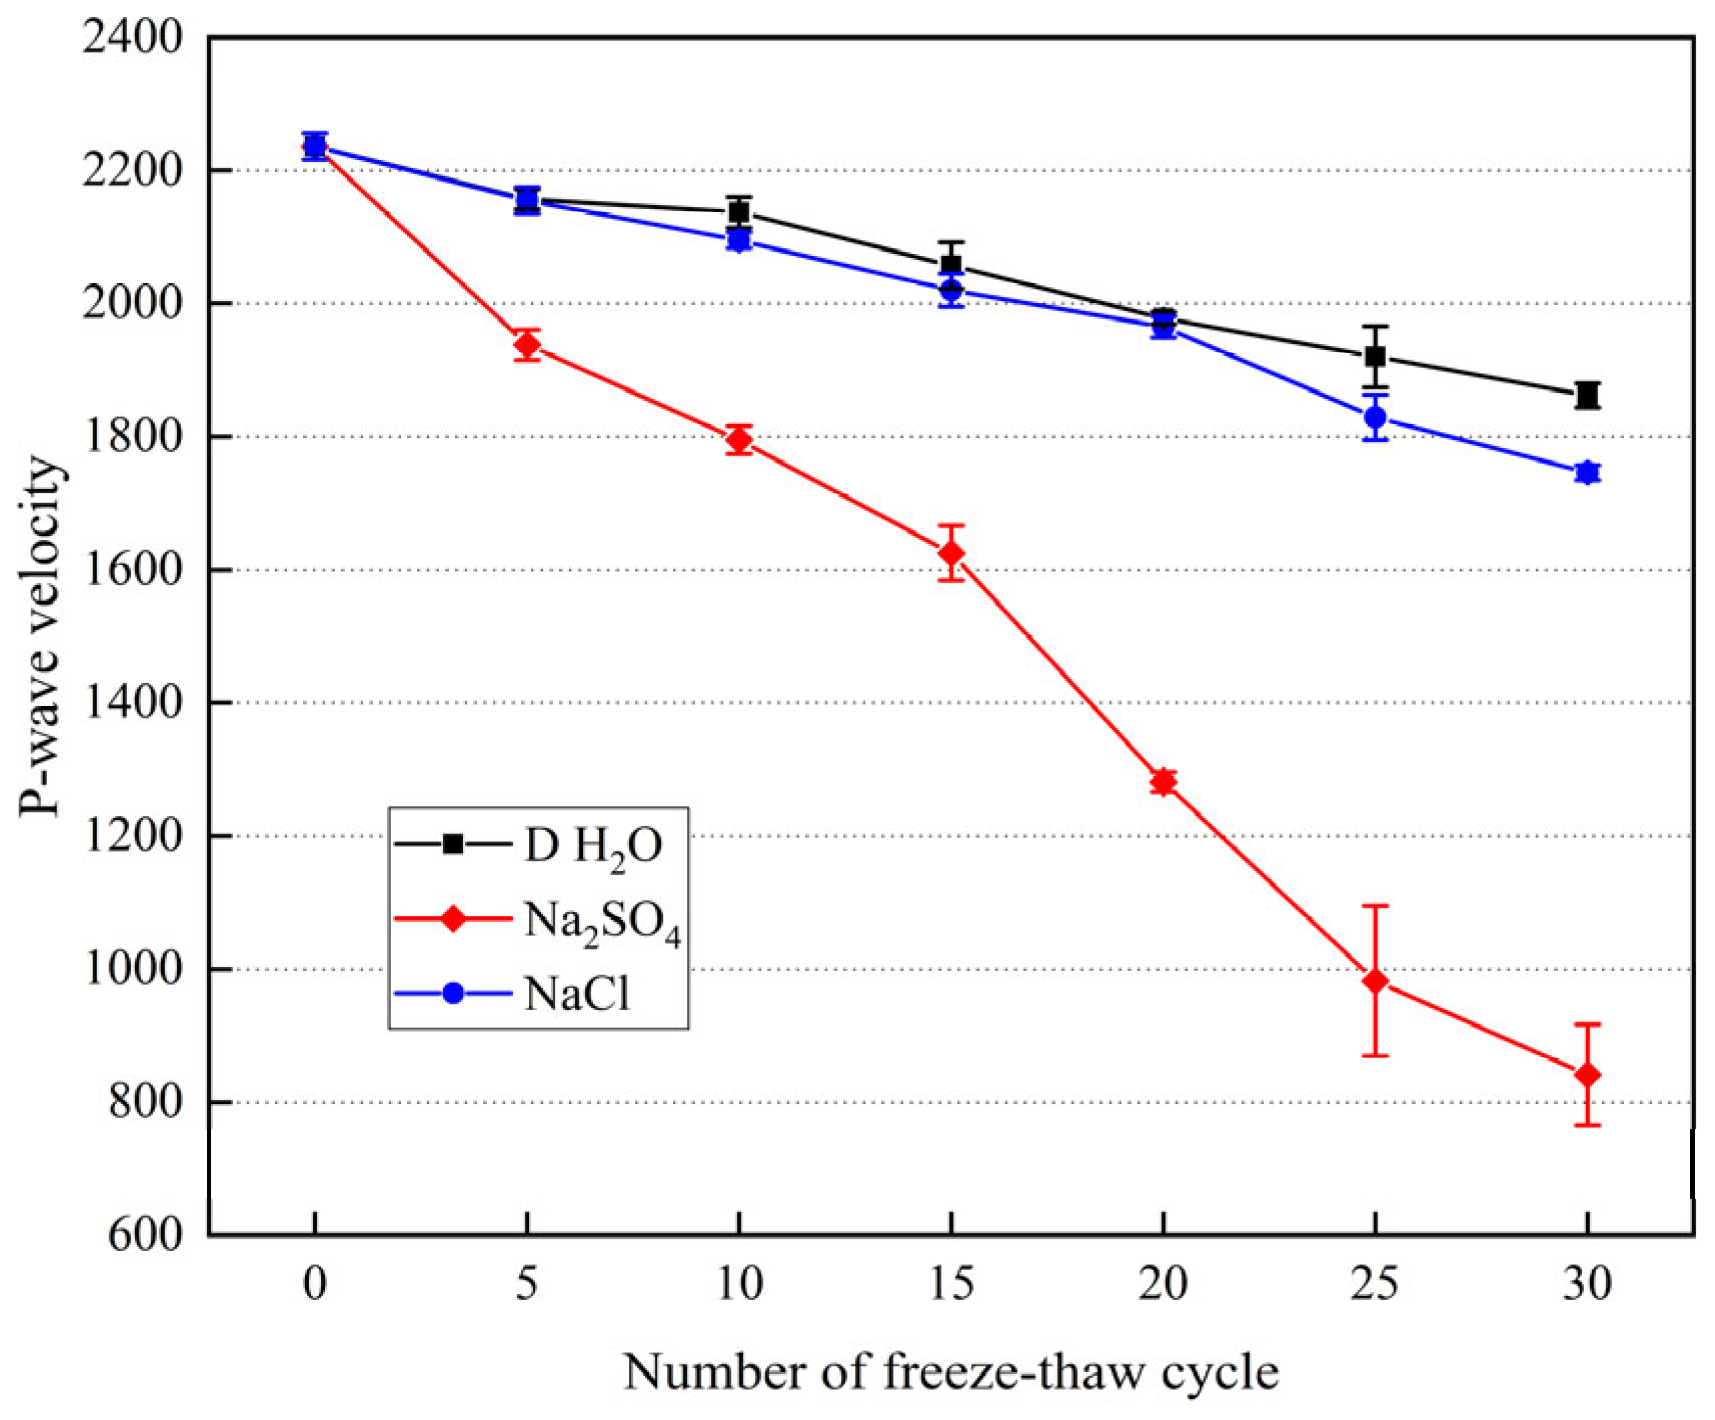
3.3. Changes in Wave Velocity

Changes in the longitudinal wave velocity of samples under different freeze–thaw conditions are shown in Figure 11. The results showed the following: (1) The P-wave velocity of the three groups of samples decreased with an increase in the number of cycles. (2) Throughout the whole cycle, the change in the longitudinal wave velocity of the samples after immersion in different solutions varied from large to small in the order of Na2SO4 solution, NaCl solution, and distilled water. (3) The wave velocity of the rock samples in Na2SO4 solution showed a decreasing trend of fast–slow–fast–slow. The variation in the wave velocity of the samples in distilled water and NaCl solution was similar, and the trend was linear.

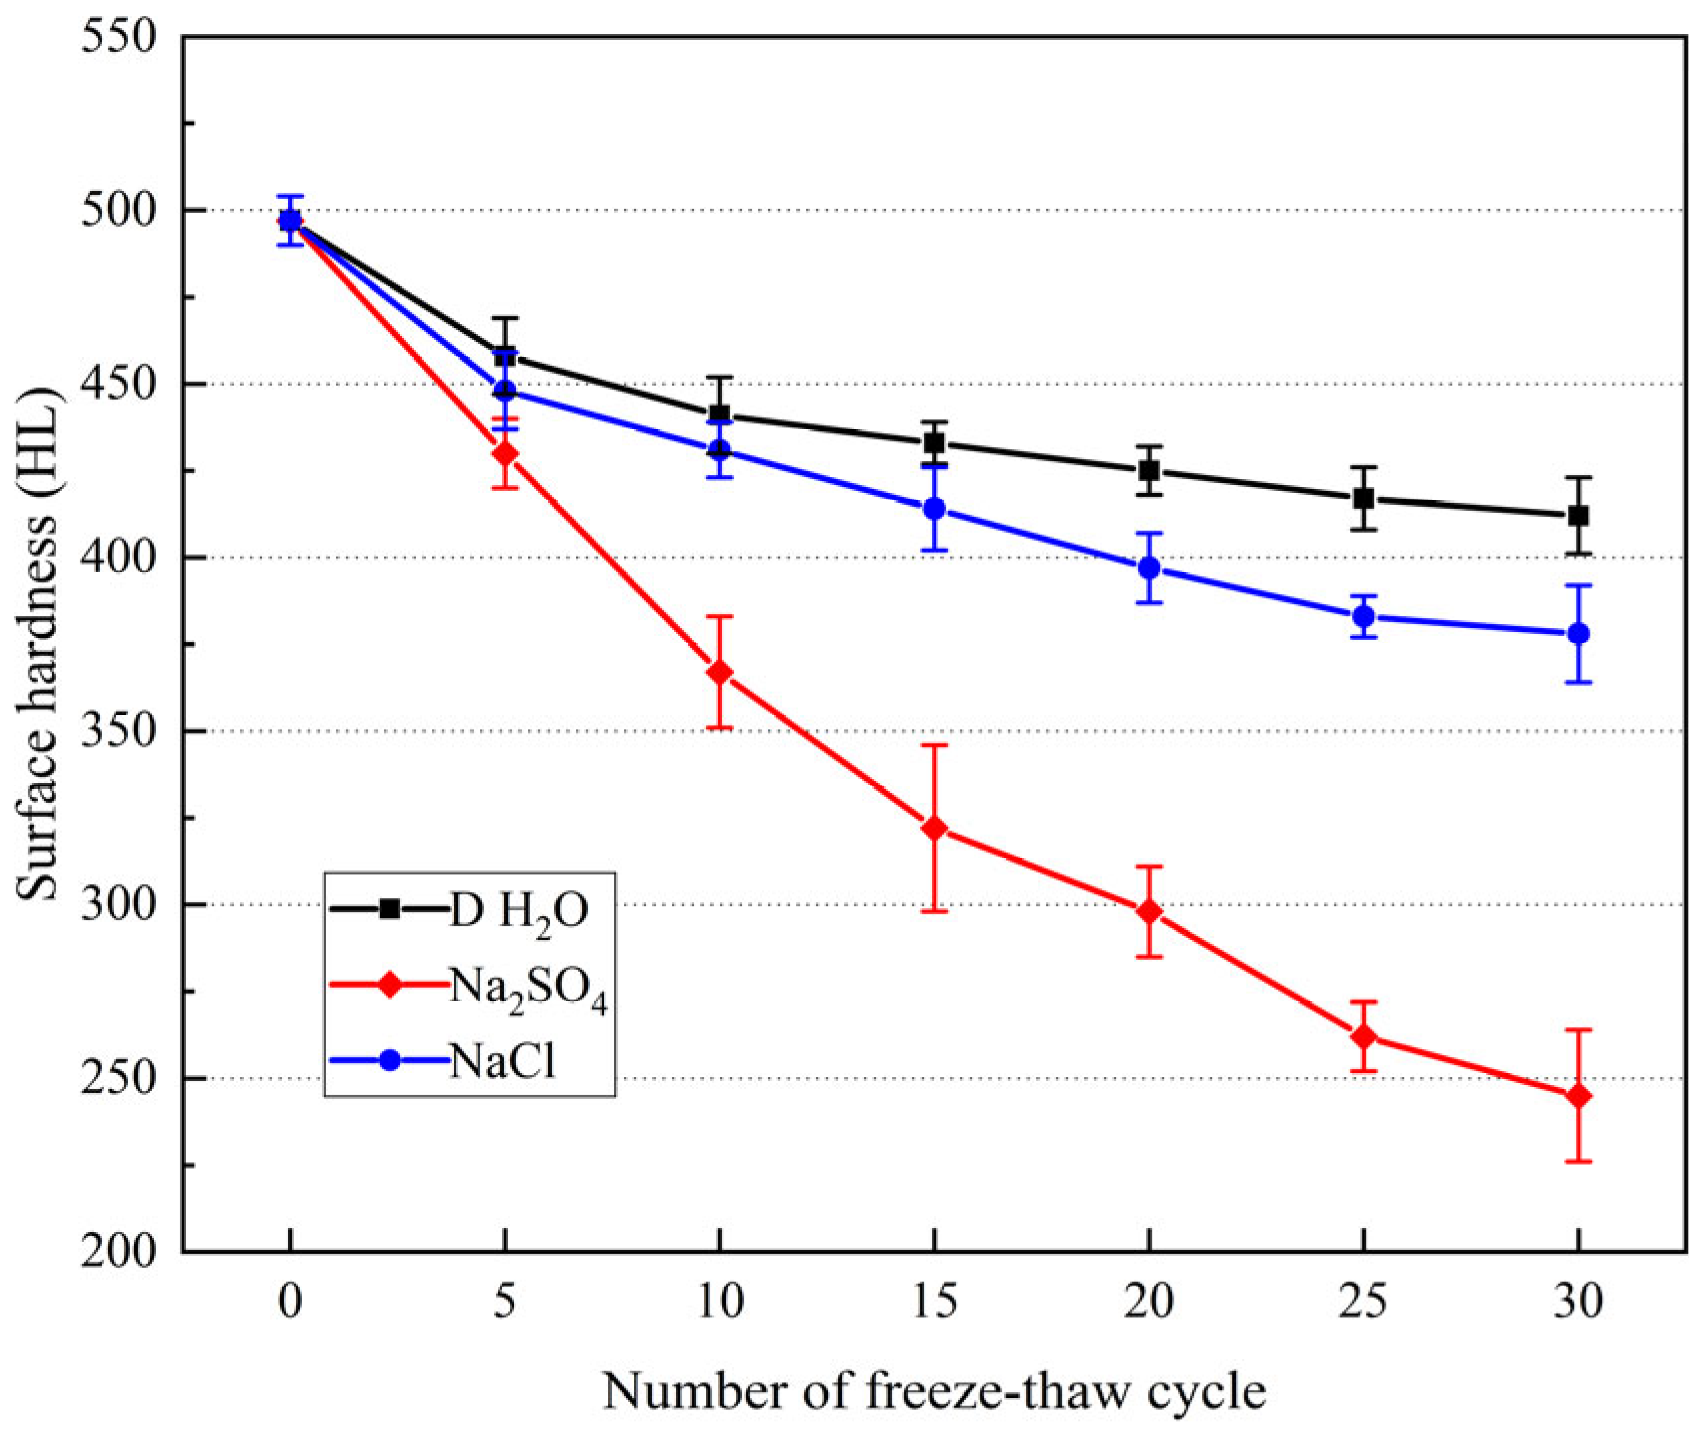
3.4. Changes in Surface Hardness

Changes in the surface hardness of each group of samples under different conditions are shown in Figure 12. The results showed the following: (1) The surface hardness values of the three groups of the rock samples changed to different extents after different cycles, and the trend was an exponential decline. (2) Throughout the whole cycle, the change in the surface hardness values of the samples after wetting with different solutions varied from large to small in the order of Na2SO4 solution, NaCl solution, and distilled water. (3) Under the same number of freeze–thaw cycles, the hardness values of the samples in different solutions varied from small to large in the order of distilled water, NaCl solution, and Na2SO4 solution.

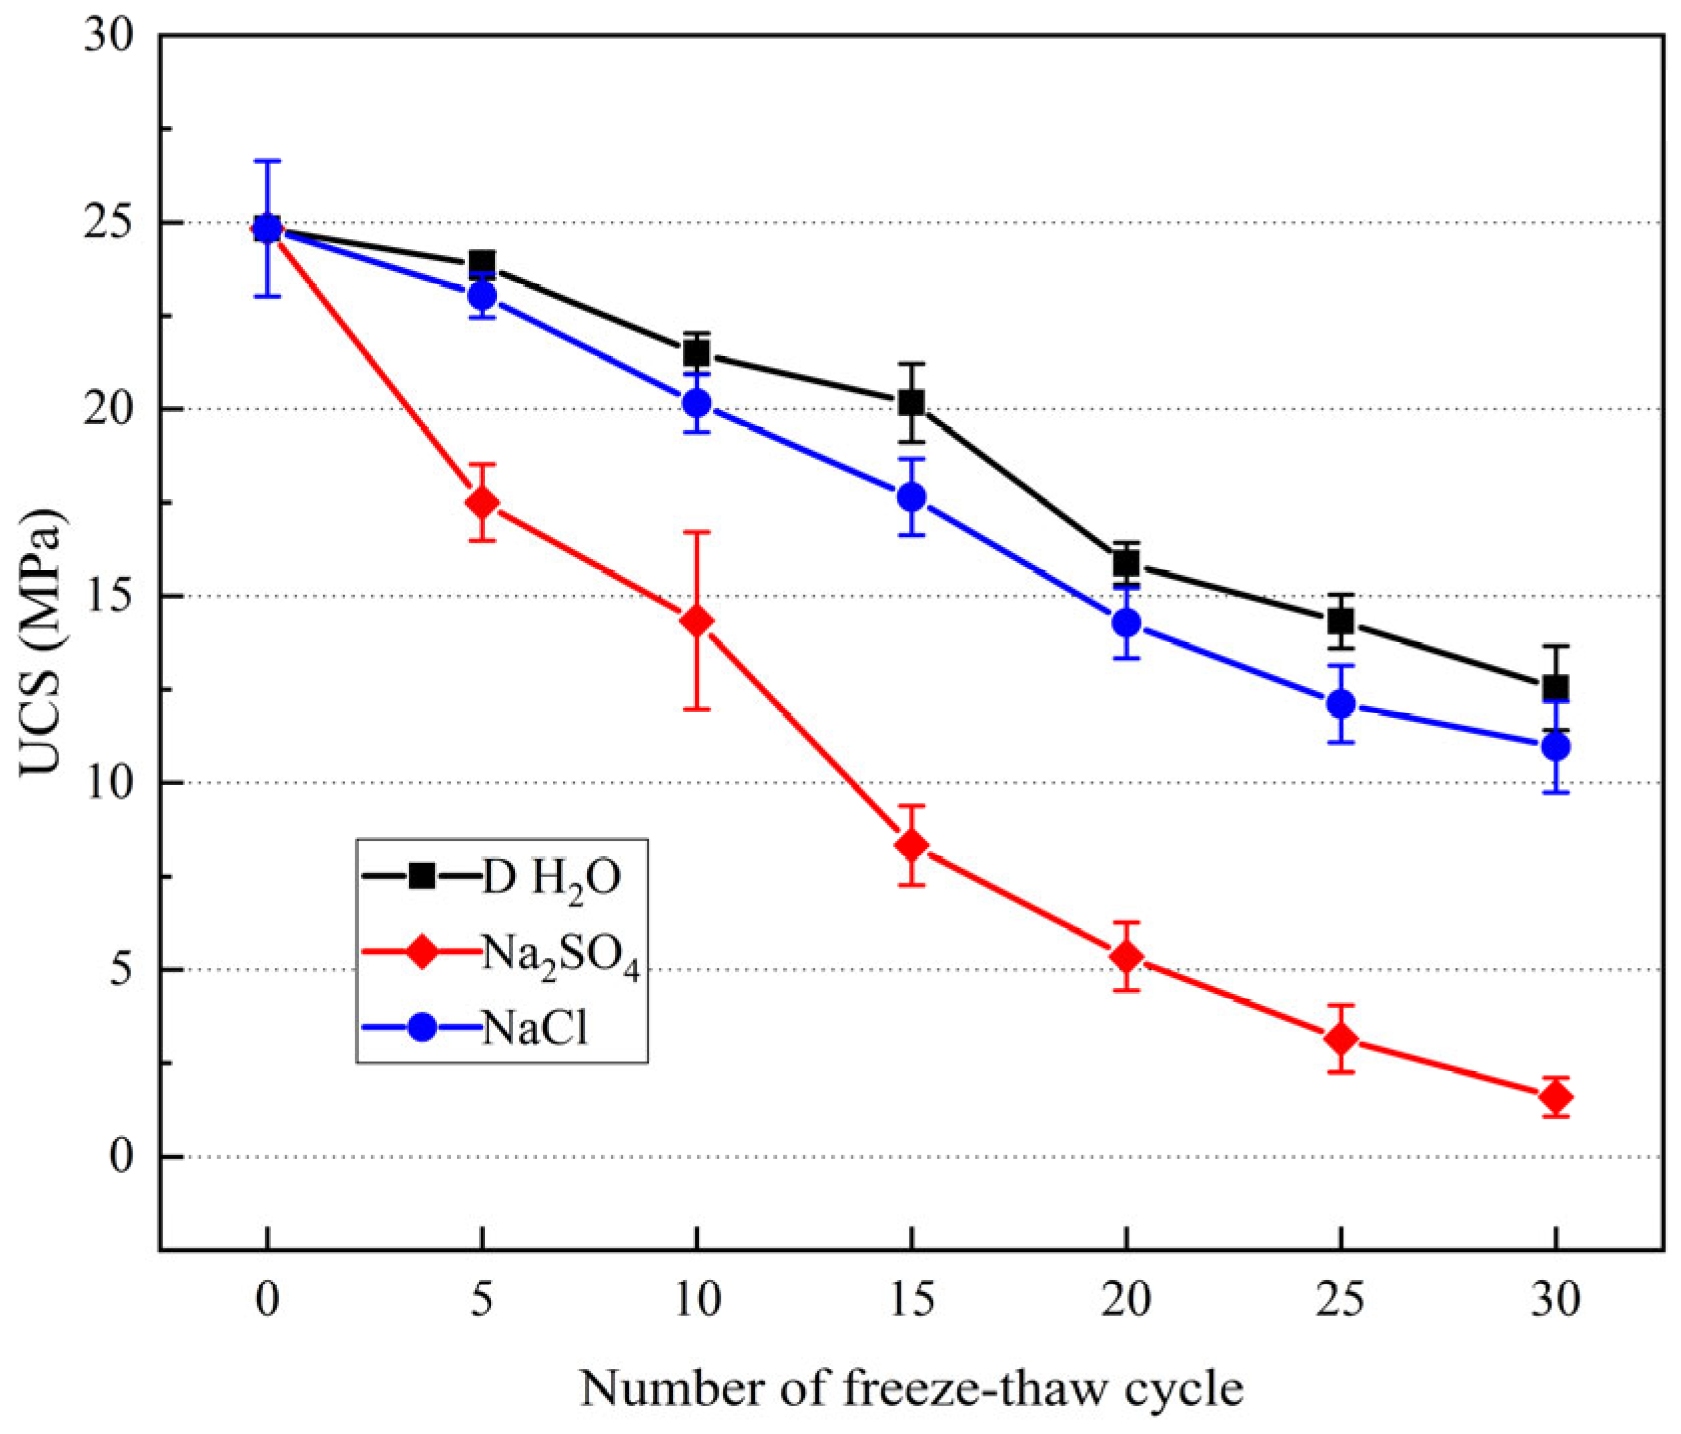
3.5. Changes in Uniaxial Compressive Strength

The relationship between the number of cycles and uniaxial compressive strength under different freeze–thaw conditions is shown in Figure 13. The changes were as follows: (1) The uniaxial compressive strength of the three groups of samples decreased to different extents, the compressive strength of the samples in Na2SO4 solution decreased exponentially, and that in distilled water and NaCl solution showed a linear downward trend. (2) Within the same cycle period, the change in the uniaxial compressive strength of samples after freezing and thawing in different solutions was the greatest for Na2SO4 solution, followed by NaCl solution and then distilled water. (3) Under the same number of cycles, the degree of damage caused by freezing–thawing to samples after soaking in different solutions increased from low to high in the order of distilled water, NaCl solution, and Na2SO4 solution.

3.6. Pore Variation

3.6.1. Porosity Change

The change in sandstone porosity was obtained using the MIP test (Figure 14). The experimental results showed the following: (1) With an increase in the number of cycles, there was an obvious increase in the porosity obtained using mercury injection, which showed a logarithmic trend. (2) During the cycle, the porosity of sandstone subjected to Na2SO4 solution exhibited the greatest increase, followed by NaCl solution and then distilled water. After 30 cycles, the sample porosity in Na2SO4 solution increased from 11.07% to 16.86%, and the porosity in distilled water and NaCl solution increased to 14.52% and 15.29%, respectively.

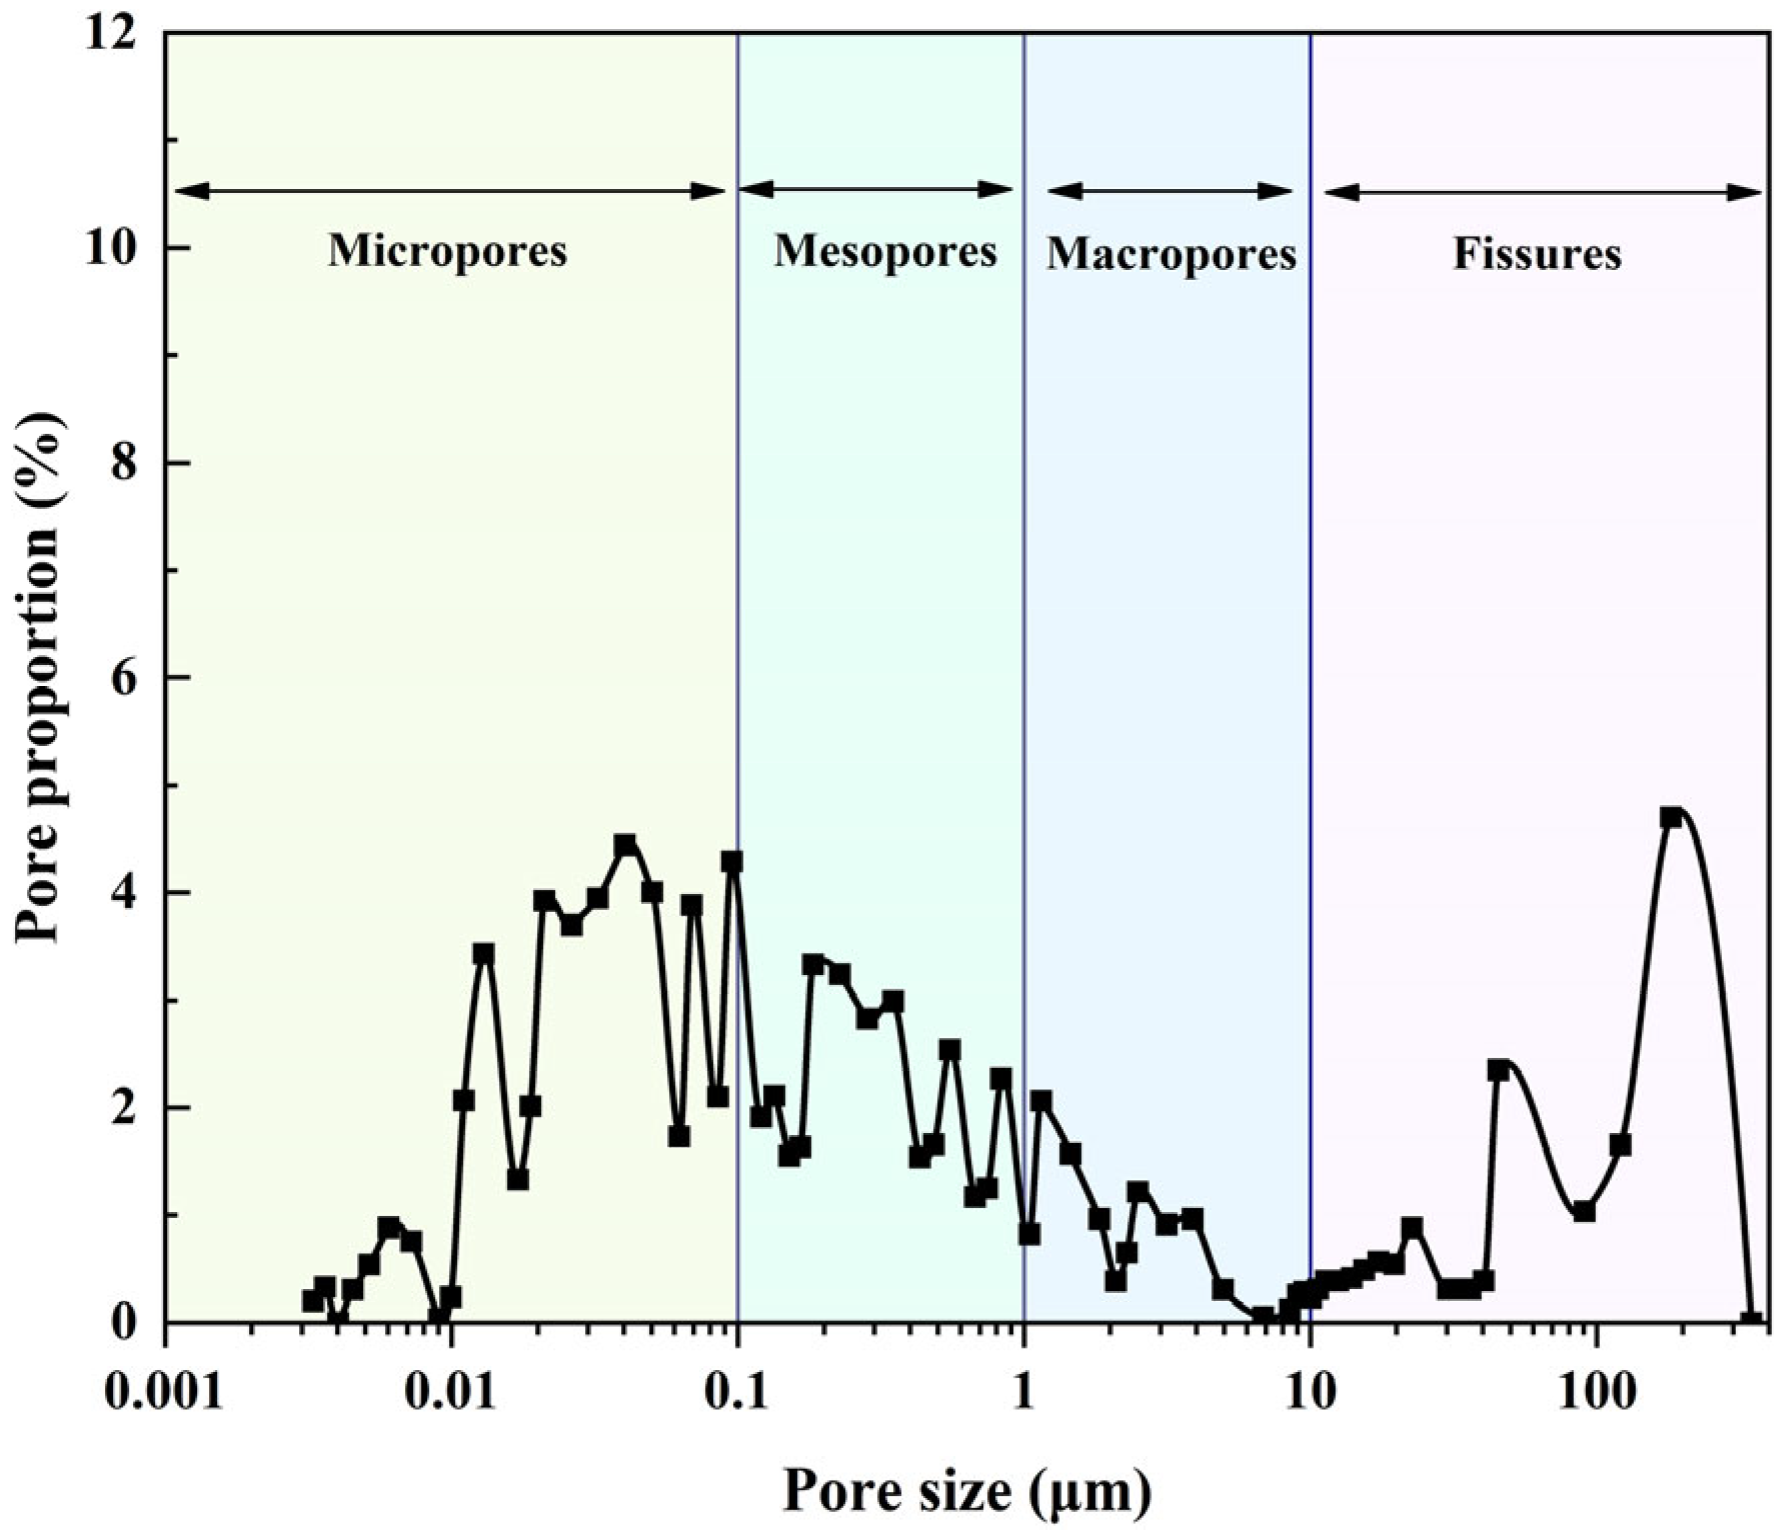
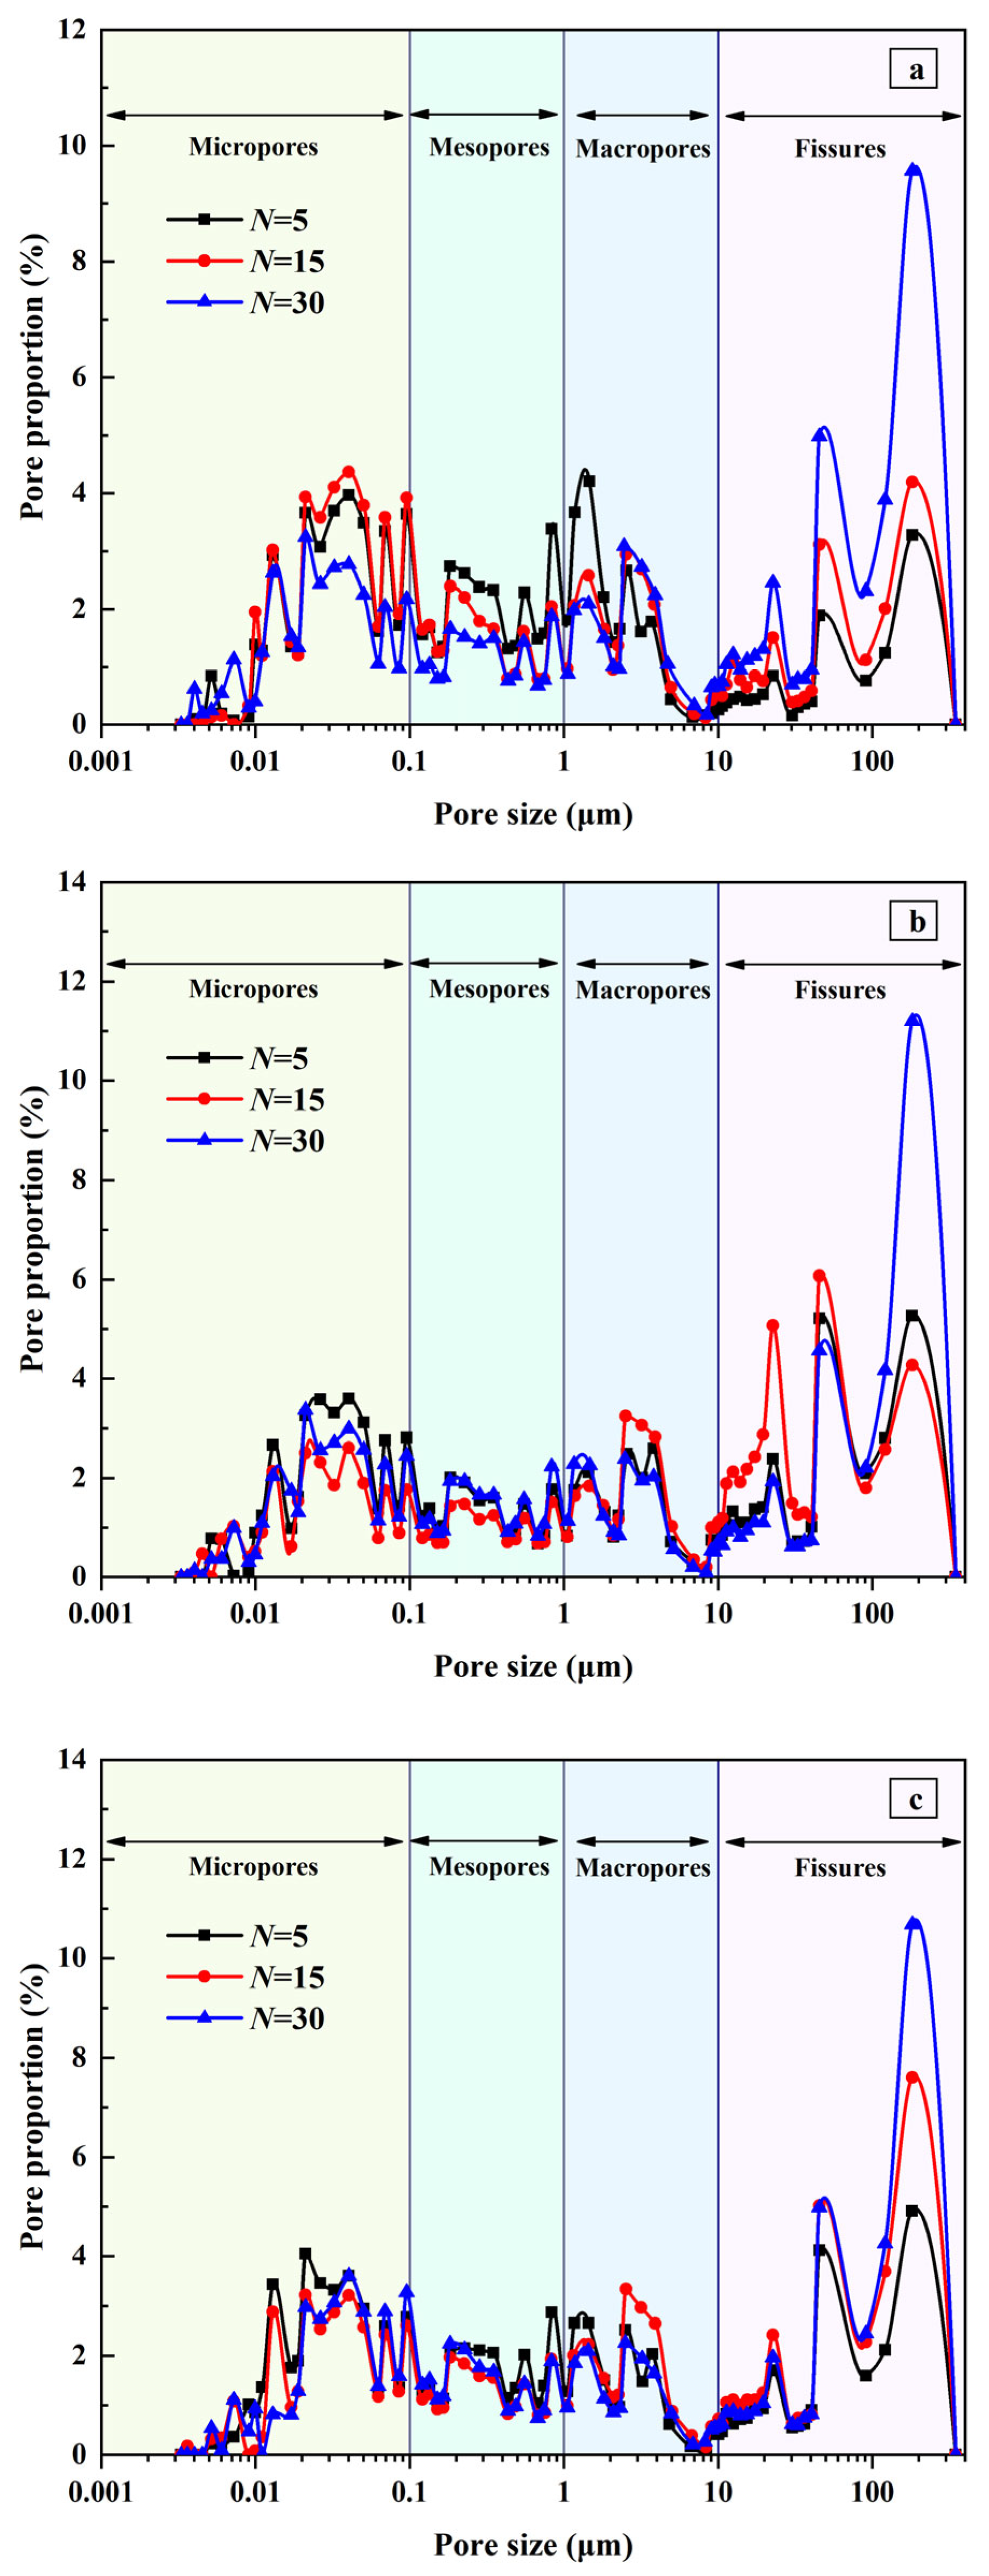
3.6.2. Pore Radius Distribution

After the freeze–thaw cycle was completed, a uniaxial compression experiment was carried out and the samples tested using mercury injection were taken from the surface part of the sample edge. The pore size distribution curve obtained from the mercury injection test is shown in Figure 15. Using the mercury injection test results of Xiaobo [25] on tight sandstone, the pores were divided into micropores (0.1 μm), mesopores (0.1–1.0 μm), macropores (1–10 μm), and cracks (10 μm) according to their pore size.
The results showed the following: (1) With an increase in the number of cycles, the number of pores and cracks with a pore size greater than 10 µm increased significantly in different solutions, while the proportion of mesopores and micropores remained unchanged. This shows that under the action of freezing–thawing, pores in the rock expand to form larger pores, they connect to develop into cracks, and, at the same time, new pores are generated. (2) In different solutions, the greatest number of cracks was observed for Na2SO4 solution, followed by NaCl solution and distilled water. (3) Damage from the freeze–thaw cycle was manifested in the rock samples as an increase in the number of macropores, the development of medium and small pores, and the “birth” of new pores.

4. Damage Mechanism

4.1. Qualitative Injury Analysis

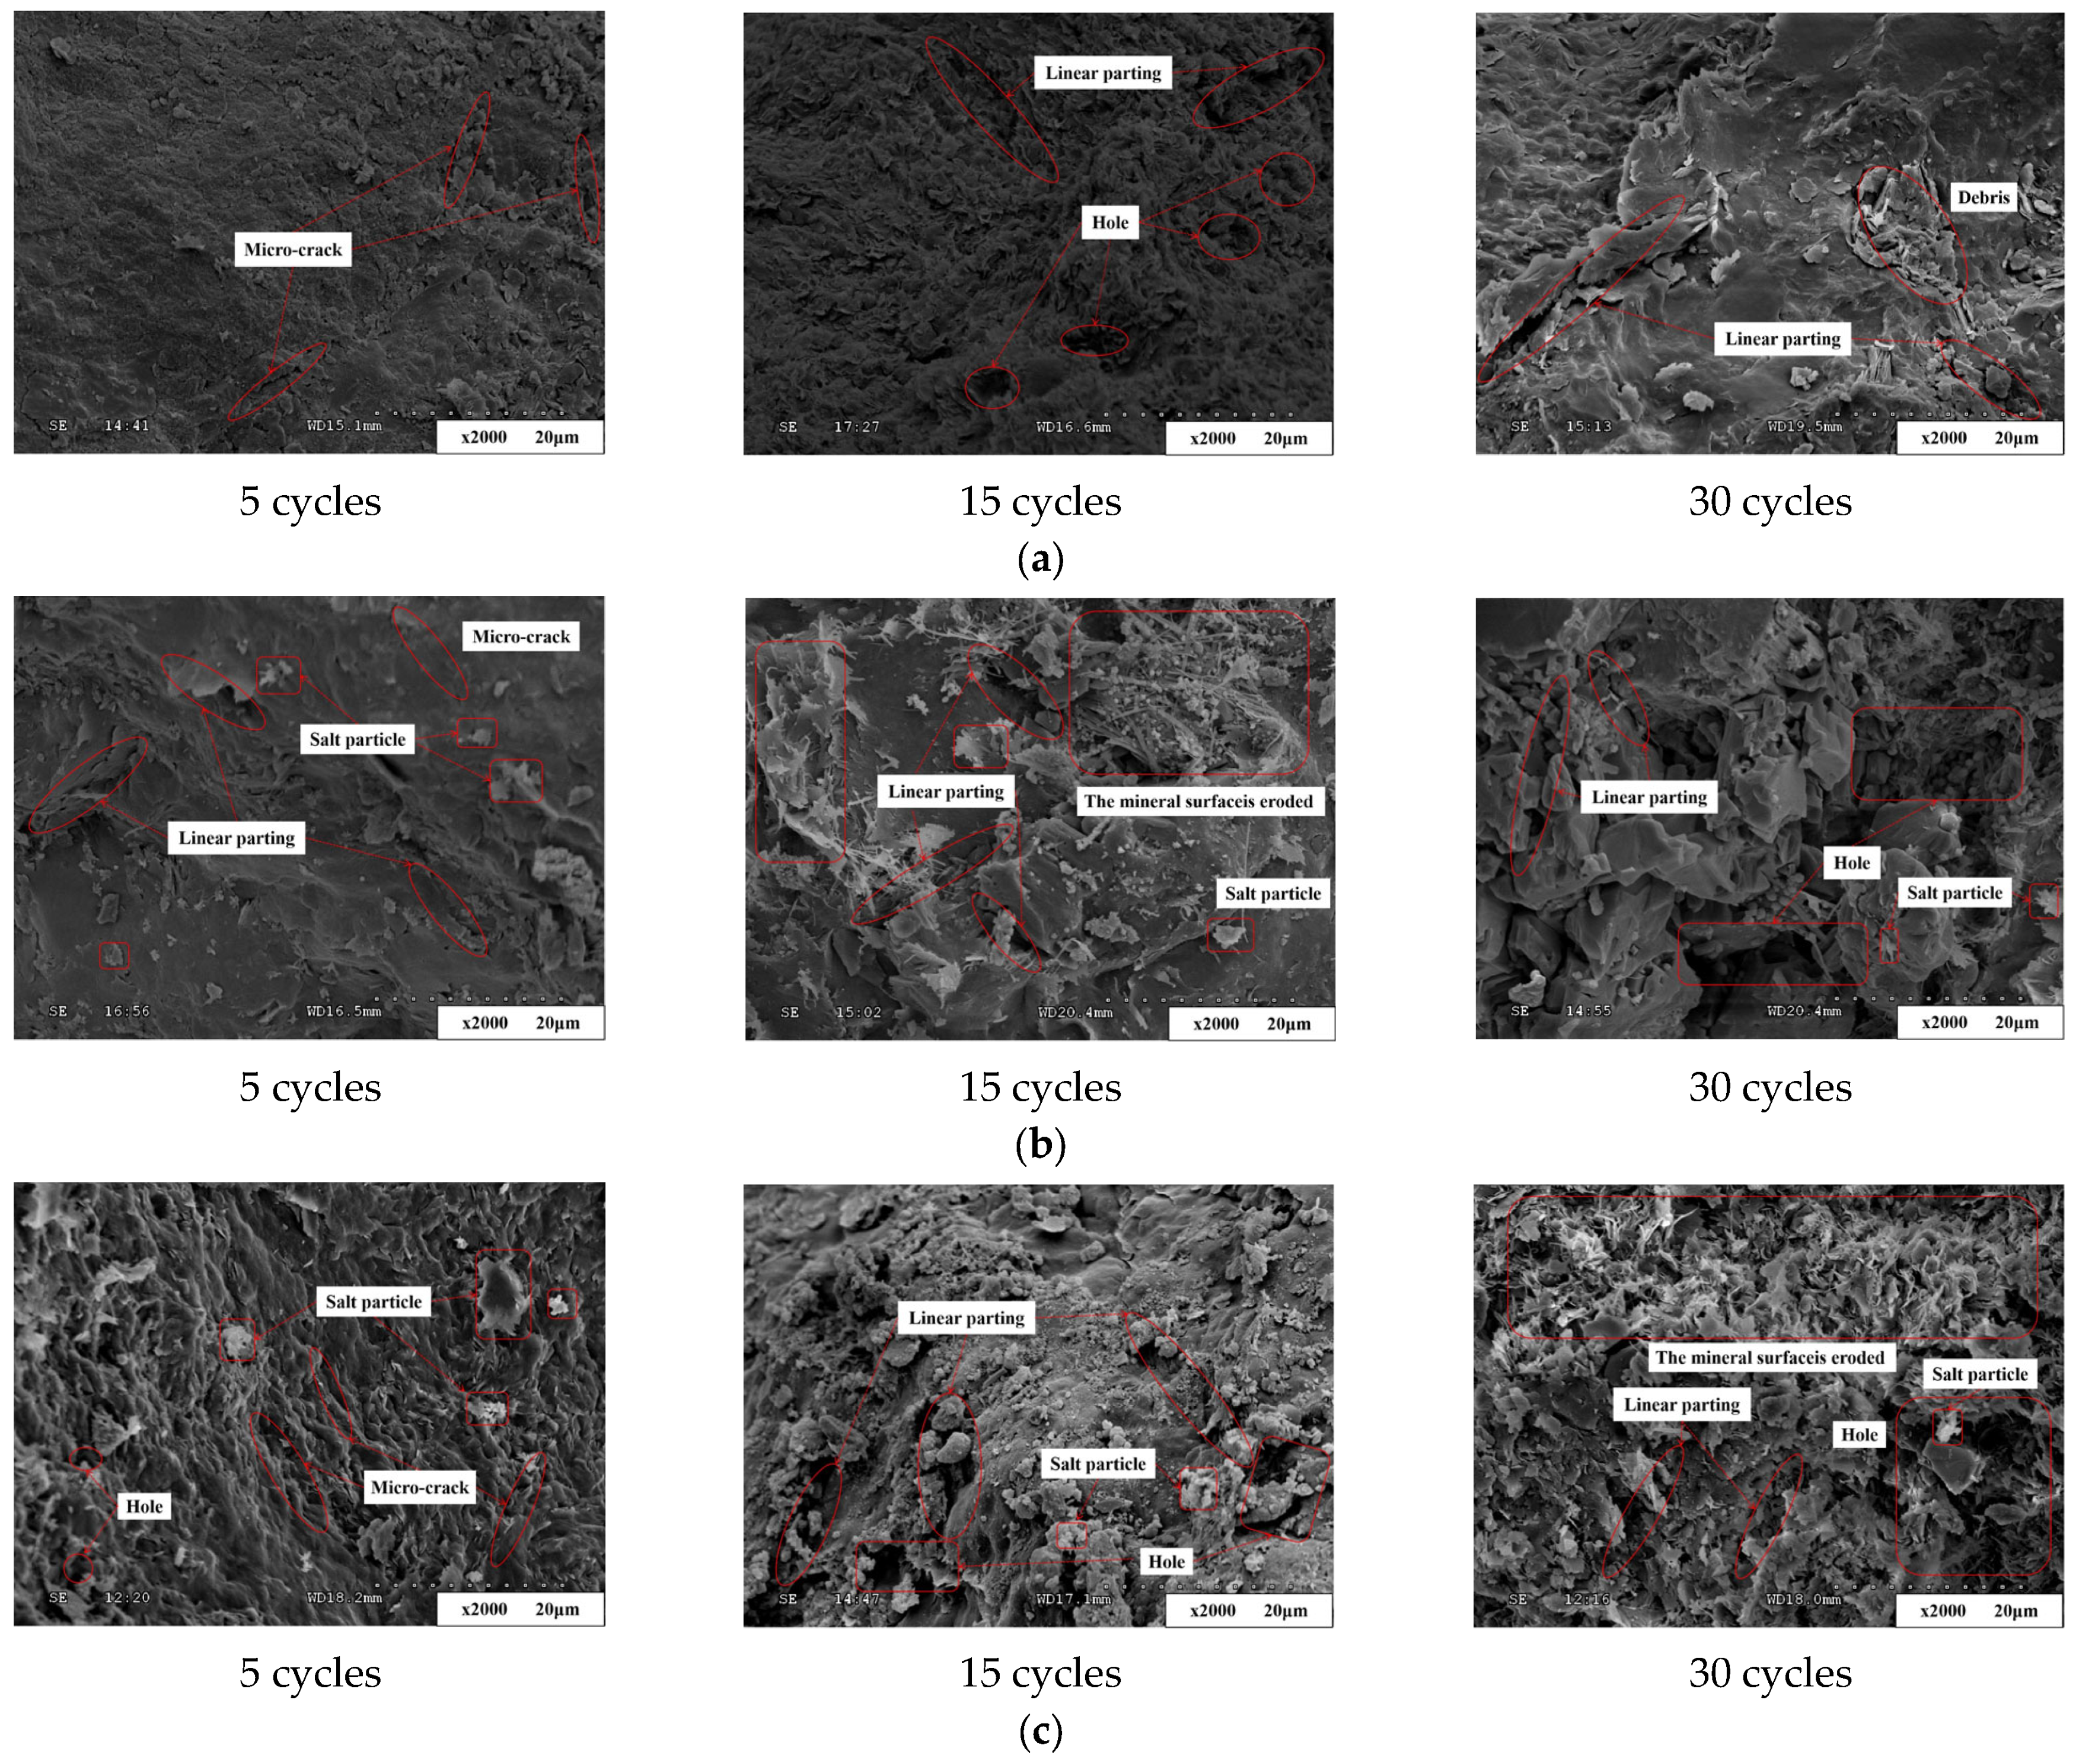
4.1.1. Microstructural Changes

To reveal the changes in the microstructure of the Longshan Grottoes sandstone following 5, 15, and 30 freeze–thaw cycles while immersed in three different solutions, 2000× SEM was performed on the surface of the sandstone samples, and the results are shown in Figure 16.
Figure 16 shows the following: (1) Under the freeze–thaw condition of the rock samples soaked in distilled water, the initial change in the sample was small and only a few microcracks could be observed. Later, with an increase in the number of freeze–thaw cycles, microcracks gradually developed after 15 cycles and the holes increased in size, forming linear cracks. Finally, after 30 cycles of freezing–thawing, the linear cracks expanded and the holes connected. (2) Under the freeze–thaw condition of the rock samples soaked in Na2SO4 solution, linear cracks and salt particles were observed on the surface of the samples. After 15 freeze–thaw cycles, erosion on the mineral surface occurred and the pores connected and formed a large number of linear fissures. Finally, after 30 freeze–thaw cycles, the linear fissures continue to widen and pores connected and fused. (3) In NaCl solution, holes appeared on the sample surface after 5 cycles, linear cracks formed after 15 cycles, and cracks expanded after 30 cycles. However, the extent was smaller than that observed with Na2SO4 solution. The presence of salt particles could be observed during the freeze–thaw cycle.

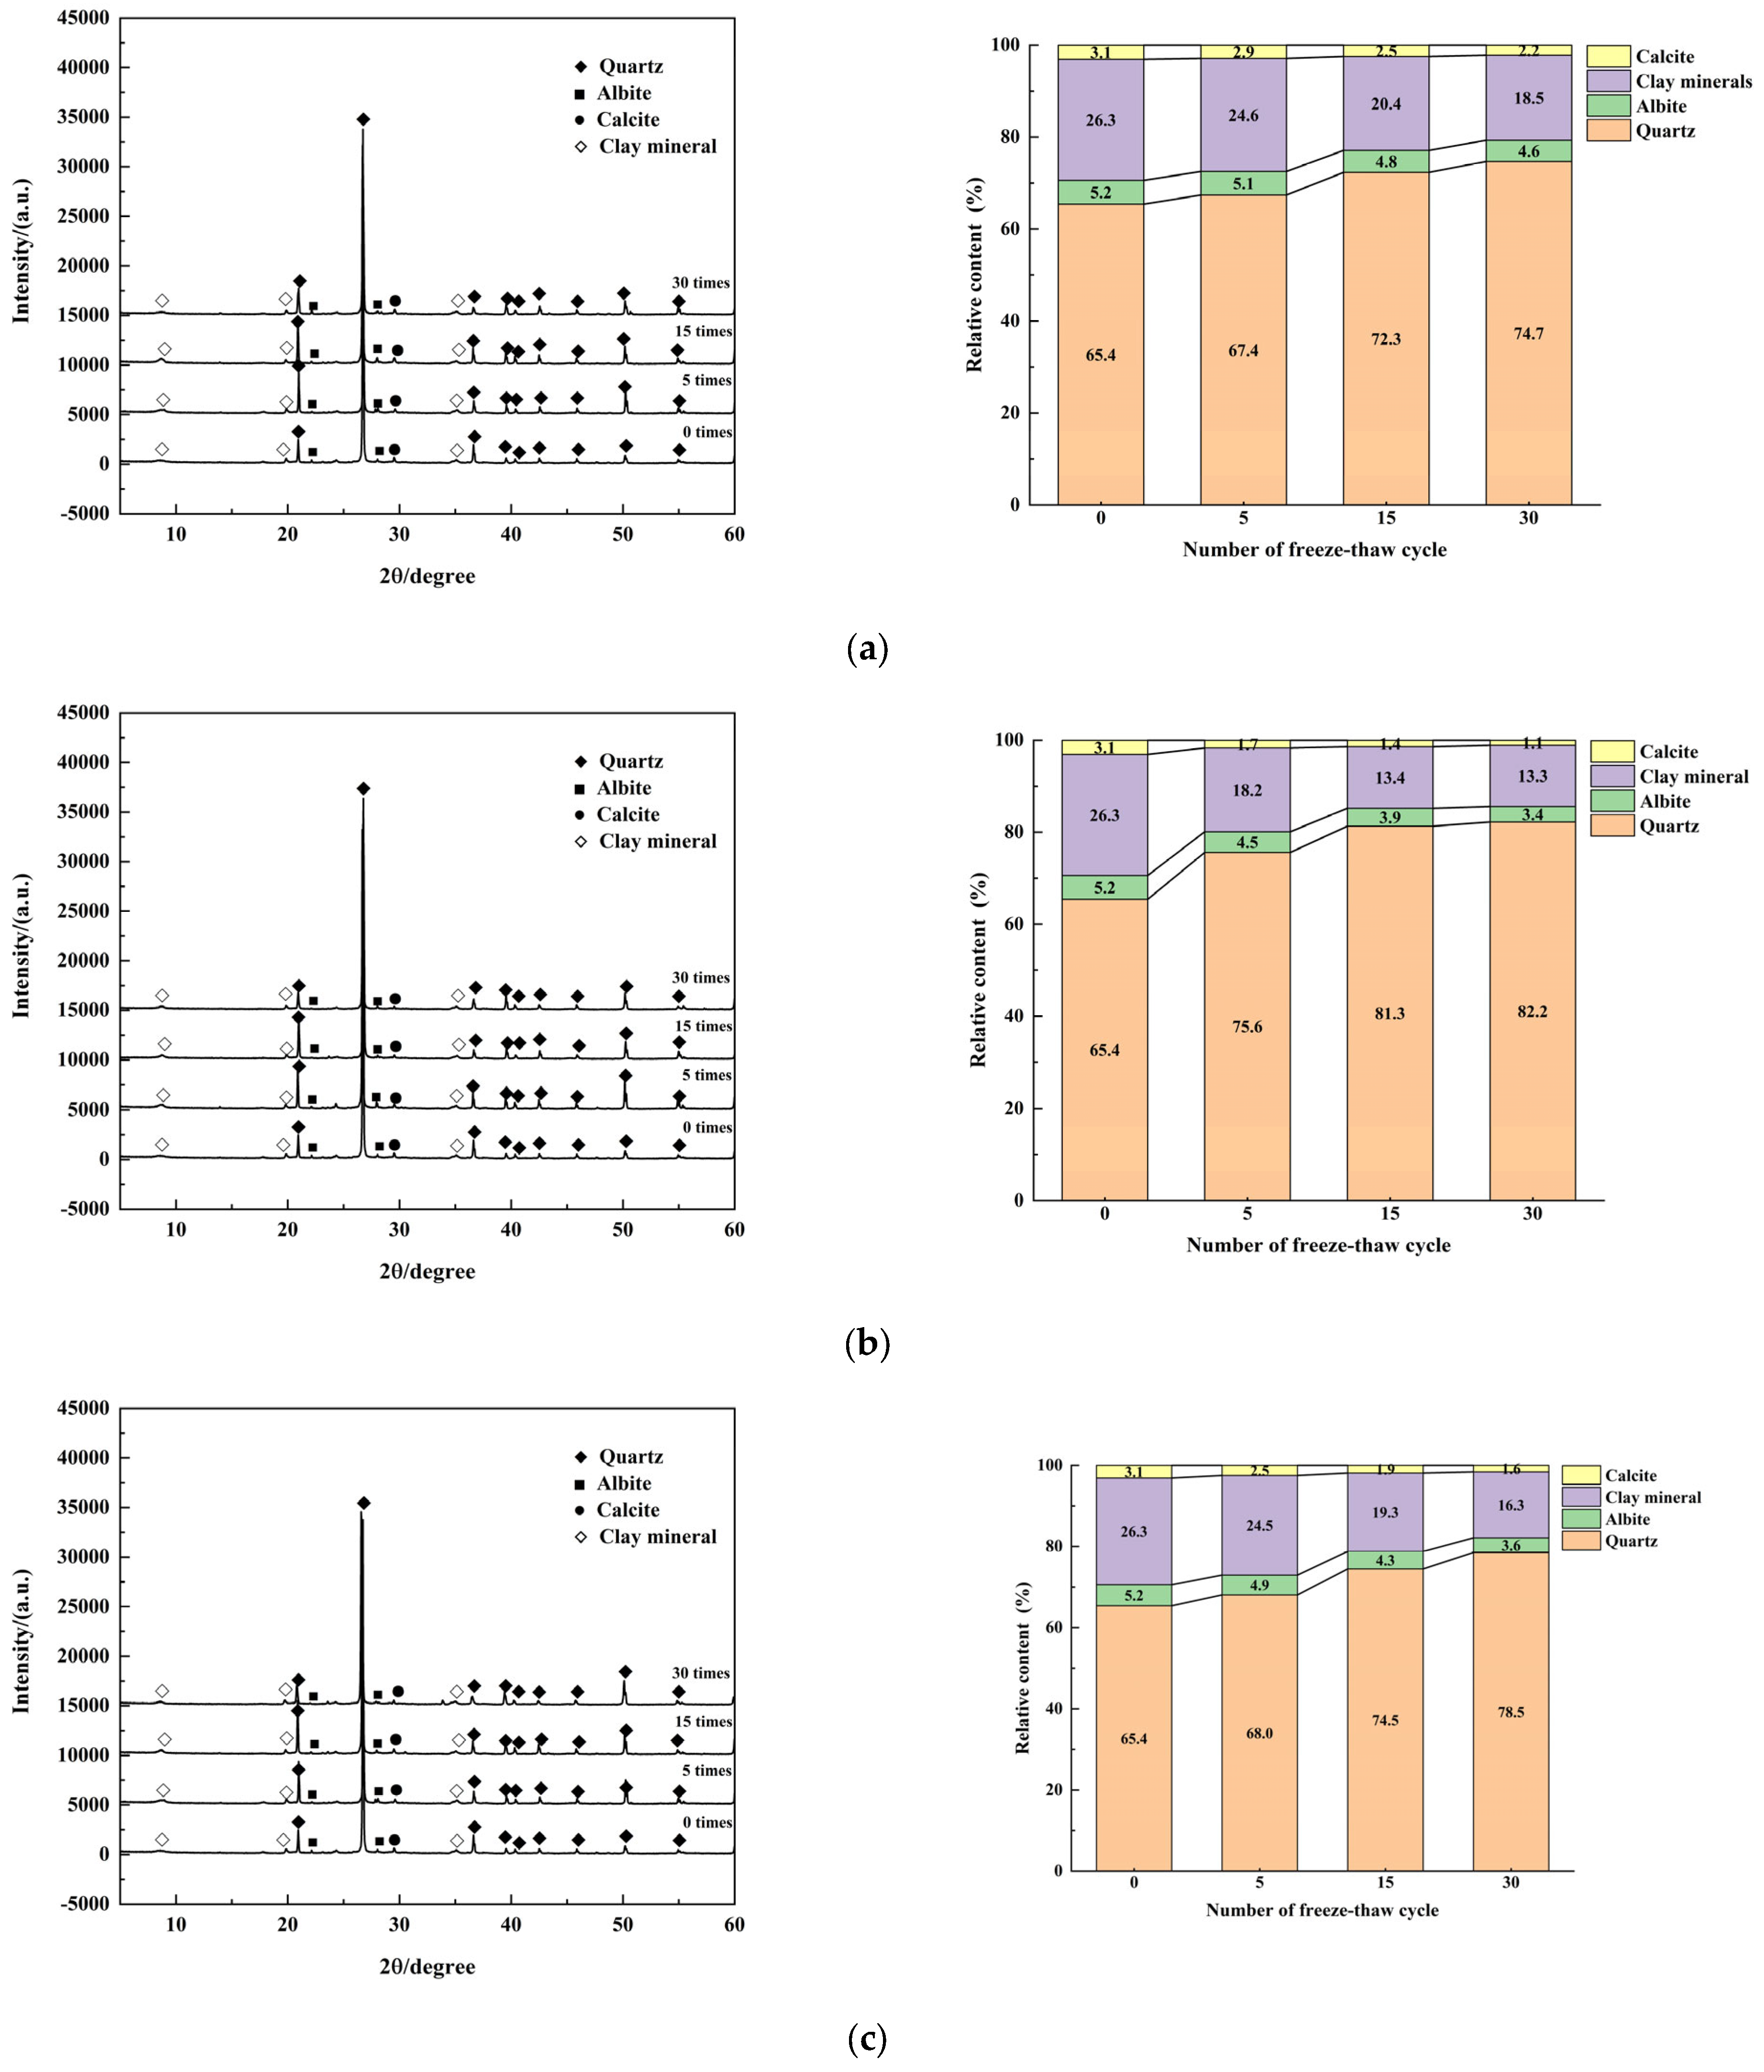
4.1.2. Changes in Mineral Composition

After the freeze–thaw cycle was completed, a uniaxial compression experiment was carried out and the surface part of the rock sample was taken and tested using XRD after grinding. Qualitative analysis of the mineral composition and its relative content was performed using XRD data. The test was conducted while keeping the total amount constant, allowing for comparison of the relative content change in the mineral composition, without any alteration of the total mineral amount.
Figure 17 shows the relative content analysis results of mineral components in the rock samples after freeze–thaw cycles in different solution environments. The results showed the following: (1) Under the freeze–thaw effect of distilled water, the content of both feldspar and calcite in the samples decreased. The quartz content increased, and clay minerals were lost. (2) Under the condition of freezing–thawing while immersed in Na2SO4 solution, the relative content of feldspar decreased more significantly than in distilled water. The relative content of quartz increased more than in distilled water, and the loss of clay minerals also occurred. (3) In NaCl solution, the trend in the relative content of each mineral was similar to that in the other two solutions and the degree of change was between them.
In summary, after 90 freeze–thaw cycles, the relationship between the relative content reduction in feldspar, calcite, and clay minerals and the relative content increase in quartz was as follows: Na2SO4 > NaCl > D H2O.

4.2. Quantitative Analysis of Damage Based on Porosity

According to the results of the microstructure and mineral composition analysis, the damage of the samples under the action of freezing–thawing and chemical erosion was related to the increase in the number of pores and the connectivity of the pores. This is consistent with the findings of other scholars [26,27]. The change in porosity reflects the deterioration in the sample. The damage variable D [26] was established based on the change in porosity, and the degree of damage to rocks under different chemical solutions and freeze–thaw action was quantitatively evaluated. The relationship between the damage variable and porosity is as follows:
D = n t n 0 1 n 0 = 1 1 n t 1 n 0
In this formula, n0 is the porosity of the original rock and nt is the porosity of the sample after n cycles. The damage variables of cycles under different freeze–thaw conditions were calculated using this formula and porosity, as shown in Figure 18.
To clarify the relationship between the damage variables and other physical indicators, the damage variable D and the change in the wave velocity, surface hardness, and uniaxial compressive strength were fitted using a function. As can be seen from the regression results (Figure 19), the fitting curves were all linear functions with correlation coefficients above 0.917 under the three freeze–thaw conditions. The results showed that there is a significant quantitative relationship between the macroscopic damage index and the porosity of the microstructure under different freeze–thaw conditions.

4.3. Discussion

4.3.1. Freeze–Thaw Cycle Test Method

Based on the research methods of other scholars, the freeze–thaw test scheme for sandstone in the Longshan Grottoes was put forward in this paper. The test scheme was to fill the rock sample once and carry out multiple cycles.
It is necessary to consider several factors when selecting the freezing temperature and cycle times for research purposes. This paper focused on sandstone from the Longshan Grottoes in Taiyuan, China, and took into account the lowest temperature in recent years, the lowest temperature in history, and the local test standard. Since the sandstone features large pores, more cycles were not necessary. Additionally, the immersion freeze–thaw method does not accurately reflect the deterioration of cultural relics on-site due to the sandstone’s poor frost resistance. Furthermore, the erosion of the grottoes’ site is caused by other factors in addition to freezing–thawing. Consequently, this paper examined the influence of salt on the sandstone in the Longshan Grottoes. Since the structure of the grottoes is situated on a cliff, atmospheric precipitation is the primary source of water. Through ion detection of the precipitation, two soluble salts, Na2SO4 and NaCl, were identified. As the frequency of atmospheric precipitation in Taiyuan, Shanxi Province, is relatively low, freeze–thaw tests were conducted on rock samples with the method of sequential soaking and multiple cycles.
This paper’s chosen testing method takes into account the natural environment more closely, resulting in a testing environment that is more closely aligned with real-world conditions. Unfortunately, this method is not suitable for denser rocks, such as granite and limestone. In these instances, testing needs to take place over a longer period in order to properly assess freeze–thaw effects.

4.3.2. Mineral Relative Content Change

XRD data have shown that the relative amounts of calcite and feldspar have decreased drastically, even becoming undetectable. This paper delved into the implications of this observation. The authors believe that the XRD results only reflect a relative decrease in these minerals, indicating that calcite and feldspar are still present, albeit in lower amounts.
The authors offer several explanations for why the results were so. It is possible that the samples tested before and after the freeze–thaw cycle were different rock samples, leading to a deviation in the test results. Additionally, the sample used for the post-cycle test was taken from the surface edge, which is more prone to freeze–thaw action and the loss of calcite, a cementing material. This is evidenced by the fact that calcite was not present in some of the samples. Furthermore, the XRD detection of the fresh rock sample showed a low peak value of calcite and a relative content of only 3%. Because the peak was too low, its result was displayed as 0 in the relative mineral content analysis.
In conclusion, the authors suggest that XRD semi-quantitative analysis may present some challenges in accurately characterizing the quantitative changes in mineral composition, yet it is still a viable option for assessing the trend in the mineral relative content change.

4.3.3. Weathering Mechanism

The test results show that freeze–thaw cycles under different solution conditions cause cumulative damage to the macroscopic properties, microscopic results, and composition of the samples, which increases with an increase in the number of freeze–thaw cycles. Differences between the solutions are caused by the different combinations of frost heave, dissolution, and salt crystallization, which result in the different number and connectivity of internal pores and pores.
The damage to sandstone in distilled water is mainly caused by frost heave and dissolution. After 30 cycles, no visible change occurred in the rock sample, with a 0.23% decrease in the mass loss rate and a drop in surface hardness by 85 HL. The wave velocity and uniaxial compressive strength decreased significantly, the wave velocity dropped by 374 m/s, and the compressive strength decreased by up to 50%. This indicates that the water had a more internal effect on the rock. As the mineral particles in rock contract when frozen, different minerals shrink and expand at different rates, resulting in an uneven change in the rock. Additionally, the water–ice phase transition creates a 9% volume expansion [28]. The water–ice phase transition generates an upward pressure on the crack wall, and the tension generated at the crack end exceeds its tensile strength, resulting in microscopic fissures, the expansion of existing pores, and an increase in large pores [16], as evident in SEM and MIP tests. Furthermore, the sandstone’s feldspar minerals, such as albite, are hydrolyzed when in contact with water, with the reaction being as follows:
2 NaAl S i 3 O 8 + 2 H + + H 2 O = A l 2 S i O 5 ( O H ) 4 ( Kaolinite ) + 2 Na + + 4 SiO 2
Al 2 S i 2 O 5 ( O H ) 4 + 2 K + = 2 K A l 3 S i 3 O 10 ( O H ) 2 ( illite ) + 2 H + + 3 H 2 O
The calcite in sandstone also chemically dissolves:
CaCO 3 ( Calcite ) + 2 H + = Ca 2 + + H 2 O + CO 2
After several cycles, the relative content of calcite and albite in the rock decreases and the clay minerals are lost to some extent. Consequently, new pores and fractures begin to form inside the rock, which are connected to form cavities, causing erosion on the surface. This is consistent with the results of X-ray diffraction (XRD) analysis of samples after freeze–thaw cycles.
The damage to rocks caused by NaCl solution was also small and only slightly greater than that caused by distilled water, which is mainly due to frost heave and dissolution. The frost heave and dissolution mechanisms are described before. At the beginning of the freeze–thaw cycle, the mass of rock samples soaked in NaCl solution improved, likely due to salt adhering to the samples’ surface or even entering the inside. Mass change is not the only indicator of rock sample damage, though [19]; a decrease in hardness and wave velocity suggests damage both on the surface and inside the sample. The presence of chloride in pores accelerated the damage caused by freeze–thaw action: after 30 cycles, particles began to shed from the sample’s surface and the number of pores and cracks seen in electron microscope images was greater than in samples in distilled water. The semi-quantitative analysis of minerals revealed that the relative content of feldspar reduced more significantly when dissolved in NaCl solution than in distilled water. These data obtained show that the extent of damage to the rock samples in NaCl solution is more intense than when they are exposed to distilled water.
The cumulative damage of the sandstone samples in Na2SO4 solution is mainly caused by the joint action of frost heave, dissolution, and salt crystallization. The frost heave and dissolution mechanisms are described before. For the porous material sandstone, when the temperature drops, Na2SO4 in the pores of sandstone absorbs water to form Na2SO4·7H2O and Na2SO4·10H2O crystals [29], and the crystal volume increases, leading to the destruction of rock. Furthermore, the dehydration of Na2SO4·10H2O crystals to form anhydrous Na2SO4 causes rock damage when the pressure exceeds the tensile force. The process of delixing crystallization or hydration dehydration is accelerated by unfavorable temperatures and humidity [24], thus increasing the proportion of larger pores. The pressure crystallization mainly depends on the pore size of the rock and the saturation in the saturation process [22]. Under repeated action, the proportion of large pores in the rock gradually increases and the damage degree gradually increases. Therefore, after 30 cycles, the development degree of pores and cracks and the proportion of macro-pores in Na2SO4 were significantly higher than those in the other two solutions. The mass, wave speed, surface hardness, and uniaxial compressive strength decline range were also the largest. With increasing cycles, the internal pores and cracks expanded, causing further damage and making the surface of the rock sample increasingly rough. This is consistent with the observed damage to sandstone in the Longshan Grottoes.

5. Conclusions

(1)
The proposed test method outlined in this paper is applicable for assessing the degree of damage to stone relics. In the Longshan Grottoes, freezing-thawing and chemical erosion are the primary determinants of sandstone weathering due to low winter temperatures and high ion concentrations in precipitation.
(2)
The sandstone samples immersed in various solutions demonstrated varying levels of damage when subjected to freeze–thaw cycles. As the number of cycles increased, the mass, wave velocity, surface hardness, and compressive strength of the sandstone were seen to decrease. In addition, the damage degree decreased in the order of Na2SO4 > NaCl > D H2O. After 30 freeze–thaw cycles, the mass ratio, wave velocity, surface hardness, and compressive strength of the rock samples in Na2SO4 solution decreased by 21.97%, 1395 m/s, 252 HL, and 23.23 MPa, respectively.
(3)
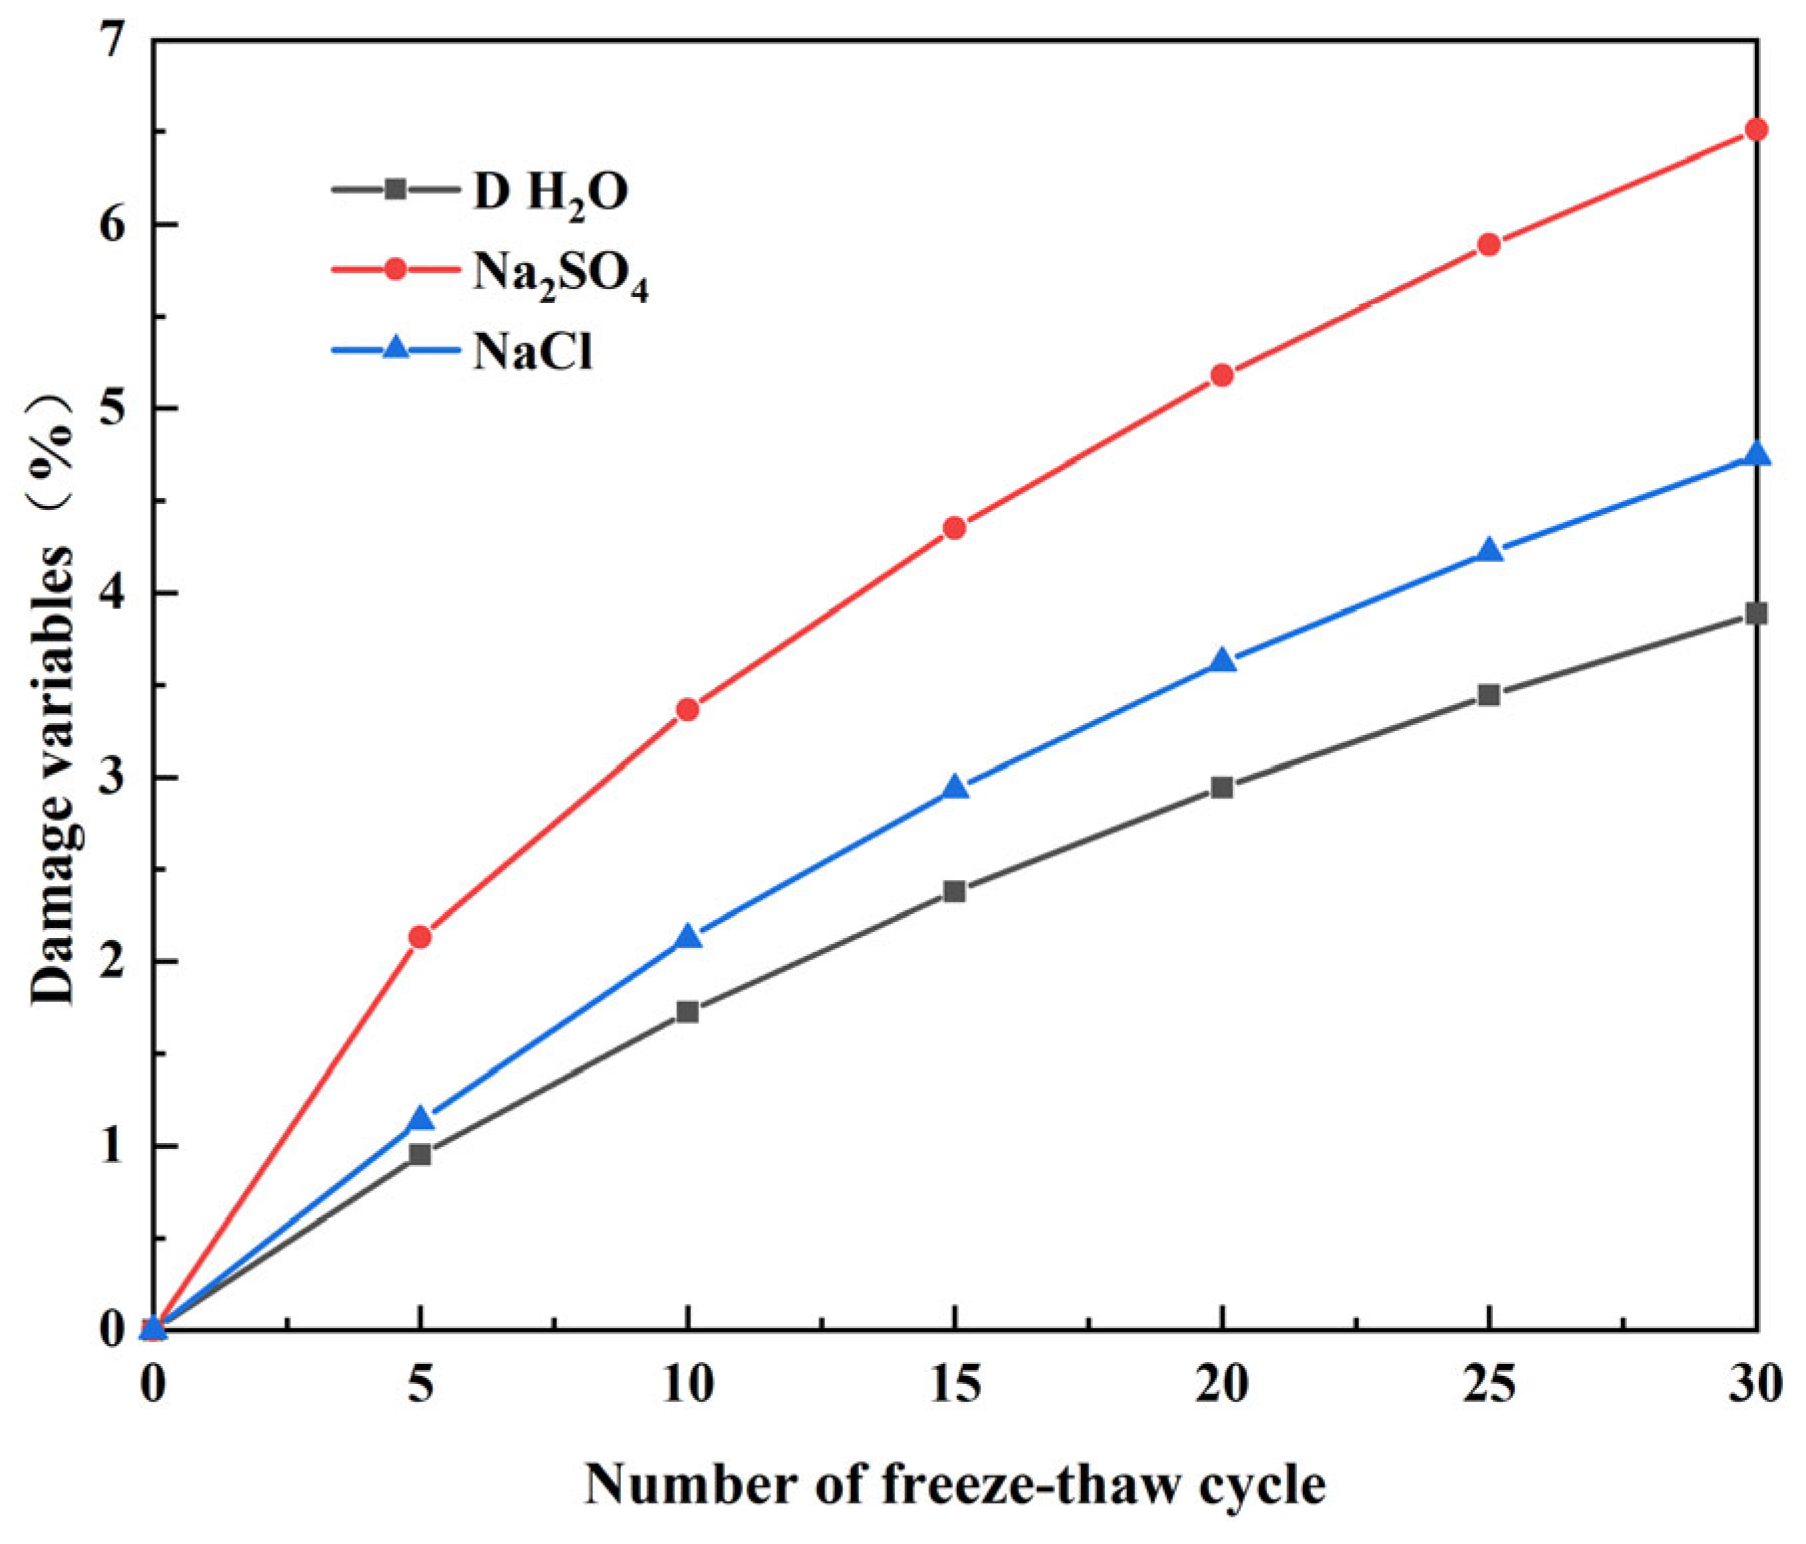
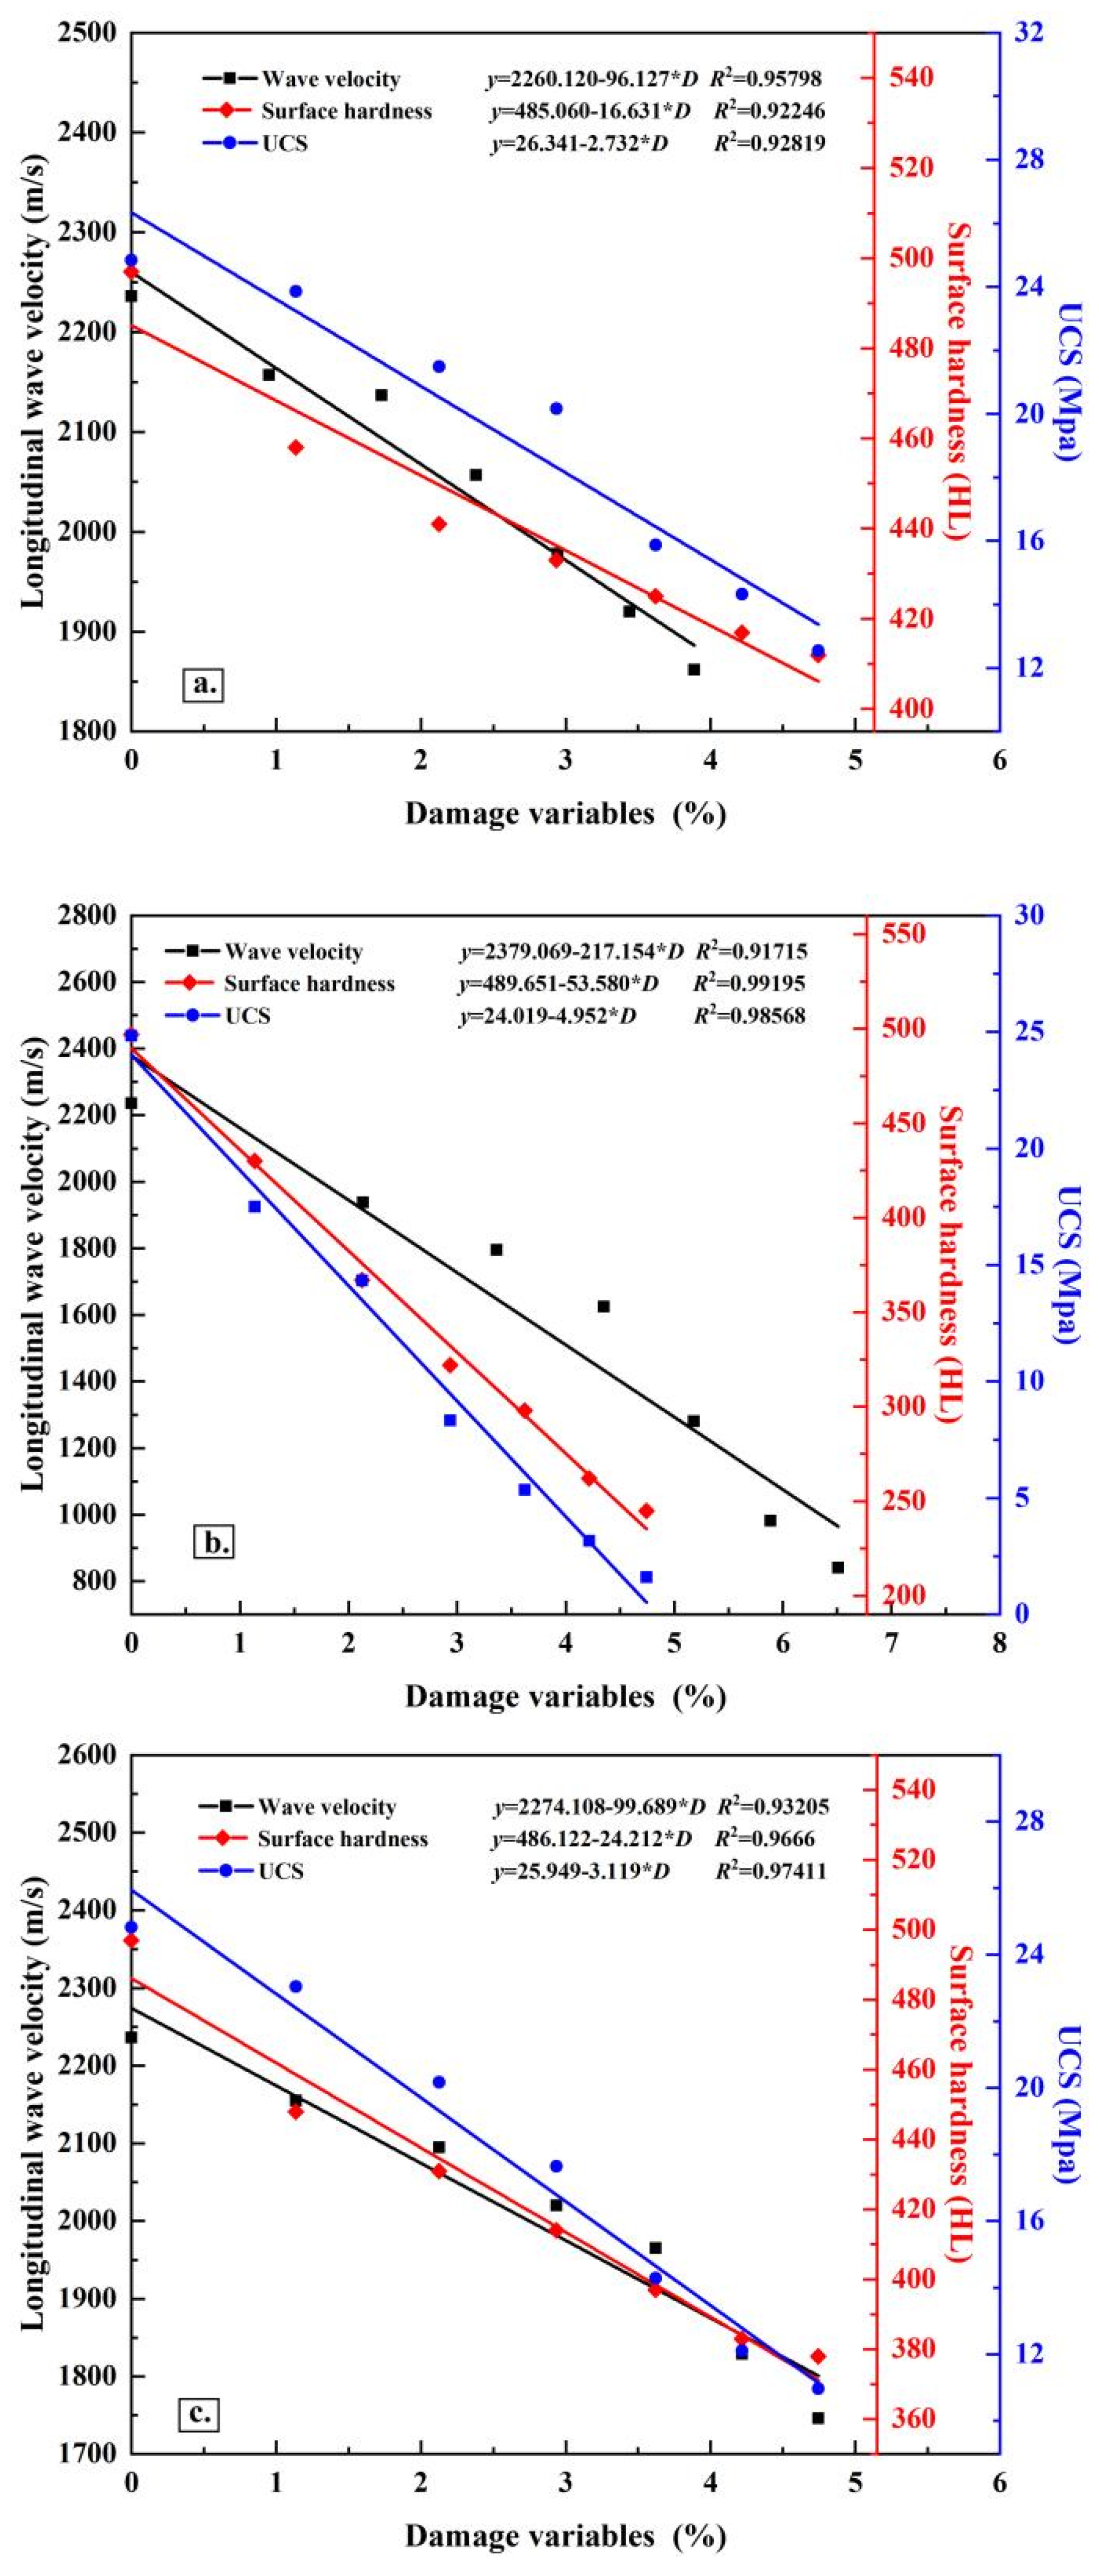
Under different freeze–thaw conditions, the porosity of the rock samples increased with an increase in the number of cycles. After 30 cycles, the porosity of the three solutions was 14.53%, 16.86%, and 15.29%, respectively. The degree of damage imparted to the rock samples was reflected in the development and expansion of existing pores and the formation of new pores. The damage variables established based on porosity in different solutions differed and decreased in the order of Na2SO4 > NaCl > D H2O. The fitting functions of the damage variable and wave velocity, surface hardness, and compressive strength under different freeze–thaw conditions in different solutions were linear, and the R2 values were all greater than 0.917.
(4)
The damage to the sandstone samples soaked in distilled water and NaCl solution was mainly caused by frost heave and dissolution, while the rock samples in Na2SO4 solution were affected by the combined action of frost heave, dissolution, and salt crystallization. The destruction of rock samples by sulfate is a process from inside to outside, which eventually causes the silting and shedding of sandstone.

Author Contributions

Conceptualization, B.S. and K.C.; methodology, X.L. and N.P.; validation, N.P.; formal analysis, X.L., J.H. and R.C.; investigation, C.J.; writing—original draft preparation, X.L.; writing—review and editing, B.S., K.C. and N.P.; funding acquisition, K.C. and N.P. All authors have read and agreed to the published version of the manuscript.

Funding

This work was supported by the National Natural Science Foundation of China (nos. 52068050, 41562015, and 51808246), the Program for Changjiang Scholars and Innovative Research Team in the University of Ministry of Education of China (no. 2017IRT17_51), and the National Key Research and Development Program of China (no. 2019YFC1520500).

Data Availability Statement

Not applicable.

Acknowledgments

Thanks to other colleagues of Northwest Research Institute Limited Company of China Railway Engineering Corporation for their great help in the field work. Thanks to the editors for their patience with our manuscript. All anonymous reviewers are gratefully acknowledged for their careful and insightful reviews.

Conflicts of Interest

The authors declare no conflict of interest.

References

  1. GBT50266—2013; The National Standards Compilation Group of Peoples Republic of China. Standard for Test Method of Engineering Rock Mass. China Planning Publishing House: Beijing, China, 2013. (In Chinese)
  2. Ulusay, R. The ISRM Suggested Methods for Rock Characterization, Testing and Monitoring: 2007–2014; Springer International Publishing: New York, NY, USA, 2015. [Google Scholar]
  3. CEN.UNE-EN 12371; Natural Stone Test Methods—Determination of Frost Resistance. European Committee for Standardization: Brussels, Belgium, 2011.
  4. Martins, L.; Vasconcelos, G.; Lourenço, P.B.; Palha, C. Influence of the Freeze-Thaw Cycles on the Physical and Mechanical Properties of Granites. J. Mater. Civ. Eng. 2016, 28, 04015201. [Google Scholar] [CrossRef] [Green Version]
  5. Thomachot, C.; Jeannette, D. Evolution of the petrophysical properties of two types of Alsatian sandstone subjected to simulated freeze-thaw conditions. Geol. Soc. Lond. Spec. Publ. 2002, 205, 19–32. [Google Scholar] [CrossRef]
  6. Park, K.; Kim, K.; Lee, K.; Kim, D. Analysis of Effects of Rock Physical Properties Changes from Freeze-Thaw Weathering in Ny-Ålesund Region: Part 1—Experimental Study. Appl. Sci. 2020, 10, 1707. [Google Scholar] [CrossRef] [Green Version]
  7. Abdolghanizadeh, K.; Hosseini, M.; Saghafiyazdi, M. Effect of freezing temperature and number of freeze–thaw cycles on mode I and mode II fracture toughness of sandstone. Theor. Appl. Fract. Mech. 2020, 105, 102428. [Google Scholar] [CrossRef]
  8. Weng, L.; Wu, Z.; Taheri, A.; Liu, Q.; Lu, H. Deterioration of dynamic mechanical properties of granite due to freeze-thaw weathering: Considering the effects of moisture conditions. Cold Reg. Sci. Technol. 2020, 176, 103092. [Google Scholar] [CrossRef]
  9. Kodama, J.; Goto, T.; Fujii, Y.; Hagan, P. The effects of water content, temperature and loading rate on strength and failure process of frozen rocks. Int. J. Rock Mech. Min. Sci. 2013, 62, 1–13. [Google Scholar] [CrossRef]
  10. Yang, H.; Liu, P.; Sun, B.; Yi, Z.; Wang, J.; Yue, Y. Study on damage mechanisms of the microstructure of sandy conglomerate at Maijishan grottoes under freeze-thaw cycles. J. Rock Mech. Eng. 2021, 40, 545–555. (In Chinese) [Google Scholar]
  11. Nicholson, D.T.; Nicholson, F.H. Physical deterioration of sedimentary rocks subjected to experimental freeze-thaw weathering. Earth Surf. Process. Landf. 2015, 25, 1295–1307. [Google Scholar] [CrossRef]
  12. Mousavi, S.Z.S.; Rezaei, M. Correlation assessment between degradation ratios of UCS and non-destructive properties of rock under freezing-thawing cycles. Geoderma 2022, 428, 116209. [Google Scholar] [CrossRef]
  13. Huang, S.; He, Y.; Yu, S.; Cai, C. Experimental investigation and prediction model for UCS loss of unsaturated sandstones under freeze-thaw action. Int. J. Min. Sci. Technol. 2021, 32, 41–49. [Google Scholar] [CrossRef]
  14. Ruedrich, J.; Kirchner, D.; Siegesmund, S. Physical Weathering of Building Stones Induced by Freeze–Thaw Action: A Laboratory Long-Term Study. Environ. Earth Sci. 2011, 63, 1573–1586. [Google Scholar] [CrossRef] [Green Version]
  15. Sitzia, F.; Lisci, C.; Pires, V.; Alves, T.; Mirão, J. Laboratorial Simulation for Assessing the Performance of Slates as Construction Materials in Cold Climates. Appl. Sci. 2023, 13, 2761. [Google Scholar] [CrossRef]
  16. Liu, C.; Deng, H.; Chen, X.; Xiao, D.; Li, B. Impact of Rock Samples Size on the Microstructural Changes Induced by Freeze–Thaw Cycles. Rock Mech. Rock Eng. 2020, 53, 5293–5300. [Google Scholar] [CrossRef]
  17. Liu, C.; Deng, H.; Zhao, H.; Zhang, J. Effects of freeze-thaw treatment on the dynamic tensile strength of granite using the Brazilian test. Cold Reg. Sci. Technol. 2018, 155, 327–332. [Google Scholar] [CrossRef]
  18. Peng, N.; Hong, J.; Zhu, Y.; Dong, Y.; Sun, B.; Huang, J. Experimental Investigation of the Influence of Freeze–Thaw Mode on Damage Characteristics of Sandstone. Appl. Sci. 2022, 12, 12395. [Google Scholar] [CrossRef]
  19. Lisci, C.; Pires, V.; Sitzia, F.; Mirão, J. Limestones durability study on salt crystallisation: An integrated approach. Case Stud. Constr. Mater. 2022, 17, e1572. [Google Scholar] [CrossRef]
  20. Sitzia, F.; Lisci, C.; Mirão, J. Building pathology and environment: Weathering and decay of stone construction materials subjected to a Csa mediterranean climate laboratory simulation. Constr. Build. Mater. 2021, 300, 124311. [Google Scholar] [CrossRef]
  21. Sousa, L.; Menningen, J.; López-Doncel, R.; Siegesmund, S. Petrophysical properties of limestones: Influence on behaviour under different environmental conditions and applications. Environ. Earth Sci. 2021, 80, 814. [Google Scholar] [CrossRef]
  22. Benavente, D.; del Cura, M.G.; Bernabéu, A.; Ordóñez, S. Quantification of salt weathering in porous stones using an experimental continous partial immersion method. Eng. Geol. 2001, 59, 313–325. [Google Scholar] [CrossRef]
  23. MacWilliam, K.; Nunes, C. Towards a More Realistic and Effective Use of Sodium Sulfate in Accelerated Ageing of Natural Stone. In RILEM Book Series; Springer International Publishing: New York, NY, USA, 2019. [Google Scholar]
  24. Steiger, M.; Asmussen, S. Crystallization of sodium sulfate phases in porous materials: The phase diagram Na2SO4-H2O and the generation of stress. Geochim. Cosmochim. Acta 2008, 72, 4291–4306. [Google Scholar] [CrossRef]
  25. Ge, X.; Li, J.; Lu, S.; Chen, F.W.; Yang, D.X.; Wang, Q. Fractal characteristics of tight sandstone reservoir using mercury intrusion capillary pressure: A case of tight sandstone reservoir in Jizhong Depression. Lithol. Reserv. 2017, 29, 106–112. (In Chinese) [Google Scholar]
  26. Ding, W.X.; Feng, X.T. Study on chemical damage effect and quantitative analysis method of mesostructure of limestone. Chin. J. Rock Mech. Eng. 2005, 24, 128–1288. (In Chinese) [Google Scholar]
  27. Cui, K.; Liu, G.; Wu, G.; Zhu, P. Study on the characteristics and mechanism of freeze-thaw damage of rock carrier in Helan mouth’s rock paintings under different conditions. J. Rock Mech. Eng. 2019, 38, 1797–1808. (In Chinese) [Google Scholar]
  28. Lozinski, M.W. Über die mechanische Verwitterung der Sandstein im gemsstigen Klima. Academie des sciences de cracovie. Bull. Int. Cl. Sci. Math. Nat. 1909, 1, 1–25. [Google Scholar]
  29. Rodriguez-Navarro, C.; Doehne, E.; Sebastian, E. How does sodium sulfate crystallize? Implications for the decay and testing of building materials. Cem. Concr. Res. 2000, 30, 1527–1534. [Google Scholar] [CrossRef] [Green Version]
Figure 1. Location diagram of the Longshan Grottoes.
Minerals 13 00430 g001
Figure 2. Maximum temperature, minimum temperature, and rainfall in the Longshan Grottoes in 2022.
Minerals 13 00430 g002
Figure 3. Diseases inside (a,b) and outside (c,d) the Longshan Grottoes.
Minerals 13 00430 g003
Figure 4. NO2 and SO2 concentrations in Taiyuan in 2021.
Minerals 13 00430 g004
Figure 5. Semi-quantitative X-ray diffraction analysis results of sandstone at different hole depths.
Minerals 13 00430 g005
Figure 6. Part of the test samples.
Minerals 13 00430 g006
Figure 7. Pore distribution of the fresh rock sample.
Minerals 13 00430 g007
Figure 8. Graph of the primary freeze–thaw cycle.
Minerals 13 00430 g008
Figure 9. Variation characteristics of the apparent morphology of samples after 30 freeze–thaw cycles. (a) D H2O, (b) Na2SO4, and (c) NaCl.
Minerals 13 00430 g009
Figure 10. Number of cycles and mass ratios under different freeze–thaw conditions.
Minerals 13 00430 g010
Figure 11. Relationship between the number of cycles and longitudinal wave velocity under different freeze–thaw conditions.
Minerals 13 00430 g011
Figure 12. Relationship between the number of cycles and surface hardness under different freeze–thaw conditions.
Minerals 13 00430 g012
Figure 13. Relationship between the number of cycles and uniaxial compressive strength under different freeze–thaw conditions.
Minerals 13 00430 g013
Figure 14. The relationship between the number of cycles and porosity under different freeze–thaw conditions.
Minerals 13 00430 g014
Figure 15. Pore distribution curves from the mercury pressure test: (ac) distilled water, Na2SO4 solution, and NaCl solution, respectively.
Minerals 13 00430 g015
Figure 16. Scanning electron microscopy (SEM) images of the samples in different solutions after 5, 15, and 30 freeze–thaw cycles. (a) D H2O, (b) Na2SO4, and (c) NaCl.
Minerals 13 00430 g016
Figure 17. Relative content analysis of mineral components in rock samples after freeze–thaw cycles in different solution environments. (a) D H2O, (b) Na2SO4, and (c) NaCl.
Minerals 13 00430 g017
Figure 18. Relationship between the number of cycles and the damage variable under different freeze–thaw conditions.
Minerals 13 00430 g018
Figure 19. Relationship between macroscopic test indices and damage variables: (ac) distilled water, Na2SO4 solution, and NaCl solution, respectively.
Minerals 13 00430 g019
Table 1. Ion concentration of precipitation in the Longshan Grottoes (unit: mg/L).
NameAnionCation
FClSO42− N O 3 Na+Ca2+Mg2+K+
1#0.10600.82672.72630.58821.3191.6460.29660.3122
2#0.00210.670517.31350.42489.4650.5970.24910.4785
3#0.02070.57579.61460.51234.5931.5380.33220.2511
Table 2. Initial physical parameters of the sandstone.
Dry Density (g·cm−3)Water
Absorption (%)
Porosity (%)Surface Hardness (HL)Wave
Velocity
(km·s−1)
Compression Strength (MPa)
Drying StateNative StateSaturation State
2.28 ± 0.084.65 ± 0.3810.88 ± 0.99506 ± 242.214 ± 0.14224.83 ± 3.557.52 ± 2.185.02 ± 1.44
Table 3. Analysis of whole-rock minerals.
Rock LithologyMineral Composition (%)
QuartzAlbiteCalciteIllite
Sandstone65.45.23.126.3
Table 4. X-ray diffraction analysis results of clay minerals.
Rock
Lithology
Relative Content of Clay Minerals (%)Mixed Layer Ratio (%)
SI/SItKaoChlC/SCorI/SC/S
Sandstone//100.0//////
Note: S—soapstone; I/S—imon mixed layer; It—illite; Kao—kaolinite; Chl—chlorite; C/S—green mixed layer; Cor—chlorite.
Disclaimer/Publisher’s Note: The statements, opinions and data contained in all publications are solely those of the individual author(s) and contributor(s) and not of MDPI and/or the editor(s). MDPI and/or the editor(s) disclaim responsibility for any injury to people or property resulting from any ideas, methods, instructions or products referred to in the content.

