Article

Triaxial Test Study on Energy Evolution of Marble after Thermal Cycle

1
State Key Laboratory of Water Resources and Hydropower Engineering Science, Wuhan University, Wuhan 430072, China
2
Key Laboratory of Rock Mechanics in Hydraulic Structural Engineering, Ministry of Education, Wuhan University, Wuhan 430072, China
3
Survey Wenzhou Branch, Zhejiang Geological and Mineral Exploration Institute, Hangzhou 310012, China
*
Author to whom correspondence should be addressed.
Minerals 2023, 13(3), 428; https://doi.org/10.3390/min13030428
Submission received: 8 February 2023 / Revised: 9 March 2023 / Accepted: 16 March 2023 / Published: 17 March 2023

Abstract

:
With the increasing requirements for the exploitation of underground resources, the subject of the physical and mechanical properties of rocks under high temperature and pressure needs to be studied urgently. In order to analyze the mechanical and energy characteristics of rocks under different thermal damages and confining pressures (c), a triaxial compression test is performed on 35 marble samples. The effects of thermal damage and high pressure are simulated with different thermal cycles and confining pressures. The results show that as the number of thermal cycles increases, the peak strain of marble gradually rises, but the peak stress and the elastic modulus (E) decrease by a degree, reaching 11.19‰, 39.53 MPa, 4.79 GPa, while there is no confining pressure applied at eight thermal cycles. At this point, the failure mode gradually changes from brittle fracture to plastic failure. When confining pressure rises, peak stress, peak strain, and elastic modulus all show an upward trend, reaching a maximum of 189.45 MPa, 13.39‰, 35.41 GPa, while the sample is undamaged at 30 MPa confining pressure. Moreover, peak stress increases linearly with confining pressure increase. The increased rate of the peak value of the total absorbed energy, elastic strain energy, and dissipated energy all show a convex trend. The dissipated energy gradually increases with the axial strain (ε1) during the rock loading process. The elastic strain energy has an energy storage limit, but the rock fails when the value exceeds the limit. The limit increases first and then decreases with the number of thermal cycles. These results can provide important engineering references for mining underground resources.

1. Introduction

With the rapid development of the world economy and the continuous advancement of urbanization, the demand for energy and underground space is increasing quickly. Underground mineral resources are steadily exploited, and this process must be closely related to geotechnical engineering, such as the mining of coal and oil in the deep crust; the treatment of radioactive nuclear waste; the development and utilization of geothermal energy, etc. [1], which are inseparable from geotechnical engineering. Moreover, geotechnical engineering is constantly developing deeper into the Earth’s crust, and the deep part of the crust is under the physical conditions of high temperatures and high pressures, so it is very necessary to conduct experimental research on rocks under high temperatures and high pressures. Moreover, the failure of rock is an instability phenomenon driven ultimately by energy, and the failure of rock is the result of the rapid release of elastic deformation energy accumulated in rock when it reaches the elastic energy limit. Therefore, if the law of energy evolution in the process of rock deformation and failure can be analyzed in detail, plus the theory based on energy change can be established, the law of rock failure can be truly reflected, and the related engineering practice can be better served.
Many scholars have conducted systematic analysis and research on rock mechanical properties under high temperatures or pressures. After high-temperature treatment, the mechanical properties of rock appear to be weakened. The mechanical behavior of different rock types after heat treatment is quite different [2]. Many existing studies have verified this view. The peak stresses of both mudstone and sandstone increase first and then decrease with temperature; before 400 °C, the peak stress is not significantly affected by temperature [3,4,5], but at 600 °C, the peak stress drops rapidly as the temperature rises [6], and the peak stress under a uniaxial compression test and temperature even show a linear trend [7]. When the heat treatment temperature increases, the limestone samples gradually show obvious ductile failure characteristics [8]. The strengths of marble and sandstone depend directly on the confining pressure and are opposite to temperature [9].
In a triaxial compression test, when the temperature of coarse sandstone and the confining pressure are below a certain threshold, rock strength is positively correlated with temperature and confining pressure, and when the value is exceeded, the trend turns negative [10]. As the temperature increases, the peak stress of sandstone gradually decreases. However, as the temperature continues to rise, the strength of rocks under different confining pressures tends to be the same [11]. For slate, a high confining pressure will weaken the thermal effect of the rock’s mechanical properties, while a higher temperature will enhance the effect of confining pressure [12].
When the temperature gradually increases from 20 °C to 600 °C, the mechanical properties of marble decrease significantly, and the critical temperature of marble is 600 °C [13]. Another scholar’s research indicates that the uniaxial compressive strength of marble intermittently increases in the temperature range of 300 °C to 500 °C, and then decreases rapidly from temperatures above 400 °C [14]. Thermal cycling will change the physical properties of rocks and weaken their mechanical properties [15].
When the temperature rises from room temperature to 1000 °C, the failure mode of granite changes from single-crack failure to ideal shear failure and double-shear failure [16]. When the confining pressure is 15–30 MPa, the failure of granite samples is tensile-shear failure, but as the temperature increases, tensile failure will dominate [17]. When mudstone, after being subjected to high temperature, is compressed, its failure type is the same as that at room temperature, and brittle cracks occupy a leading position [18]. The effect of thermal stress caused by temperature increases leads to severe expansion and deformation of granite structures [19]. Under low temperature and confining pressure, multiple vertical cracks will generate along the axial stress (σ1) direction during the failure of granite; with the increase in temperature and confining pressure, the direction of crack propagation gradually changes from a vertical to a tilt direction. After confining pressure increases, marble has a tendency to change from brittleness to ductility, but heating increases the ductility to a certain extent.
Some scholars believe that the failure evolution process and ultimate failure of rocks are driven by energy conversion [20]. Energy evolution reflects the deformation and failure process of rocks, which can further reveal the underlying mechanism of rock failure [21,22]. Both the elastic strain energy and dissipation energy in evolution rise with the increase in stress [23]. Moreover, there is a strong linear relationship between the elastic strain energy, dissipation energy, and total input energy [24]. As the thickness of the coal seam increases, the elastic energy, dissipation energy, and total input energy all decrease first and then rise [25]. When the coal-to-rock ratio is higher, the difference between energy accumulation and dissipation is larger, and the energy dissipation of the crack is smaller [26]. As the depth increases, the elastic energy of coal accumulates faster, and the dissipation energy increases faster too.
However, these studies have only analyzed rock failure from a mechanical point of view, and scholars have rarely been involved in the energy analysis of the failure process of marble. In this study, an analysis of rock deformation and failure is carried out from the perspective of energy evolution. This method can break through the original limitations of stress-strain analysis only and brings a new perspective and analysis method to understand rock’s mechanical behavior. Moreover, marble is often used in underground engineering. Few scholars have analyzed the energy and mechanical evolution process of marble under thermal damage conditions at the same time. This paper can also provide some help for mining and underground engineering safety.
In this paper, a triaxial compression test of marble after thermal cycling is carried out, and stress-strain curves and energy evolution curves are drawn based on the experimental data. Based on the concept of energy change, the reason for the mechanical properties of marble, after different thermal cycles and under different confining pressures, is analyzed. The study of the evolution of mechanical properties of rocks under thermal cycling conditions has a certain reference value in the construction of underground engineering oriented to a situation with high temperatures.

2. Materials and Experimental Methods

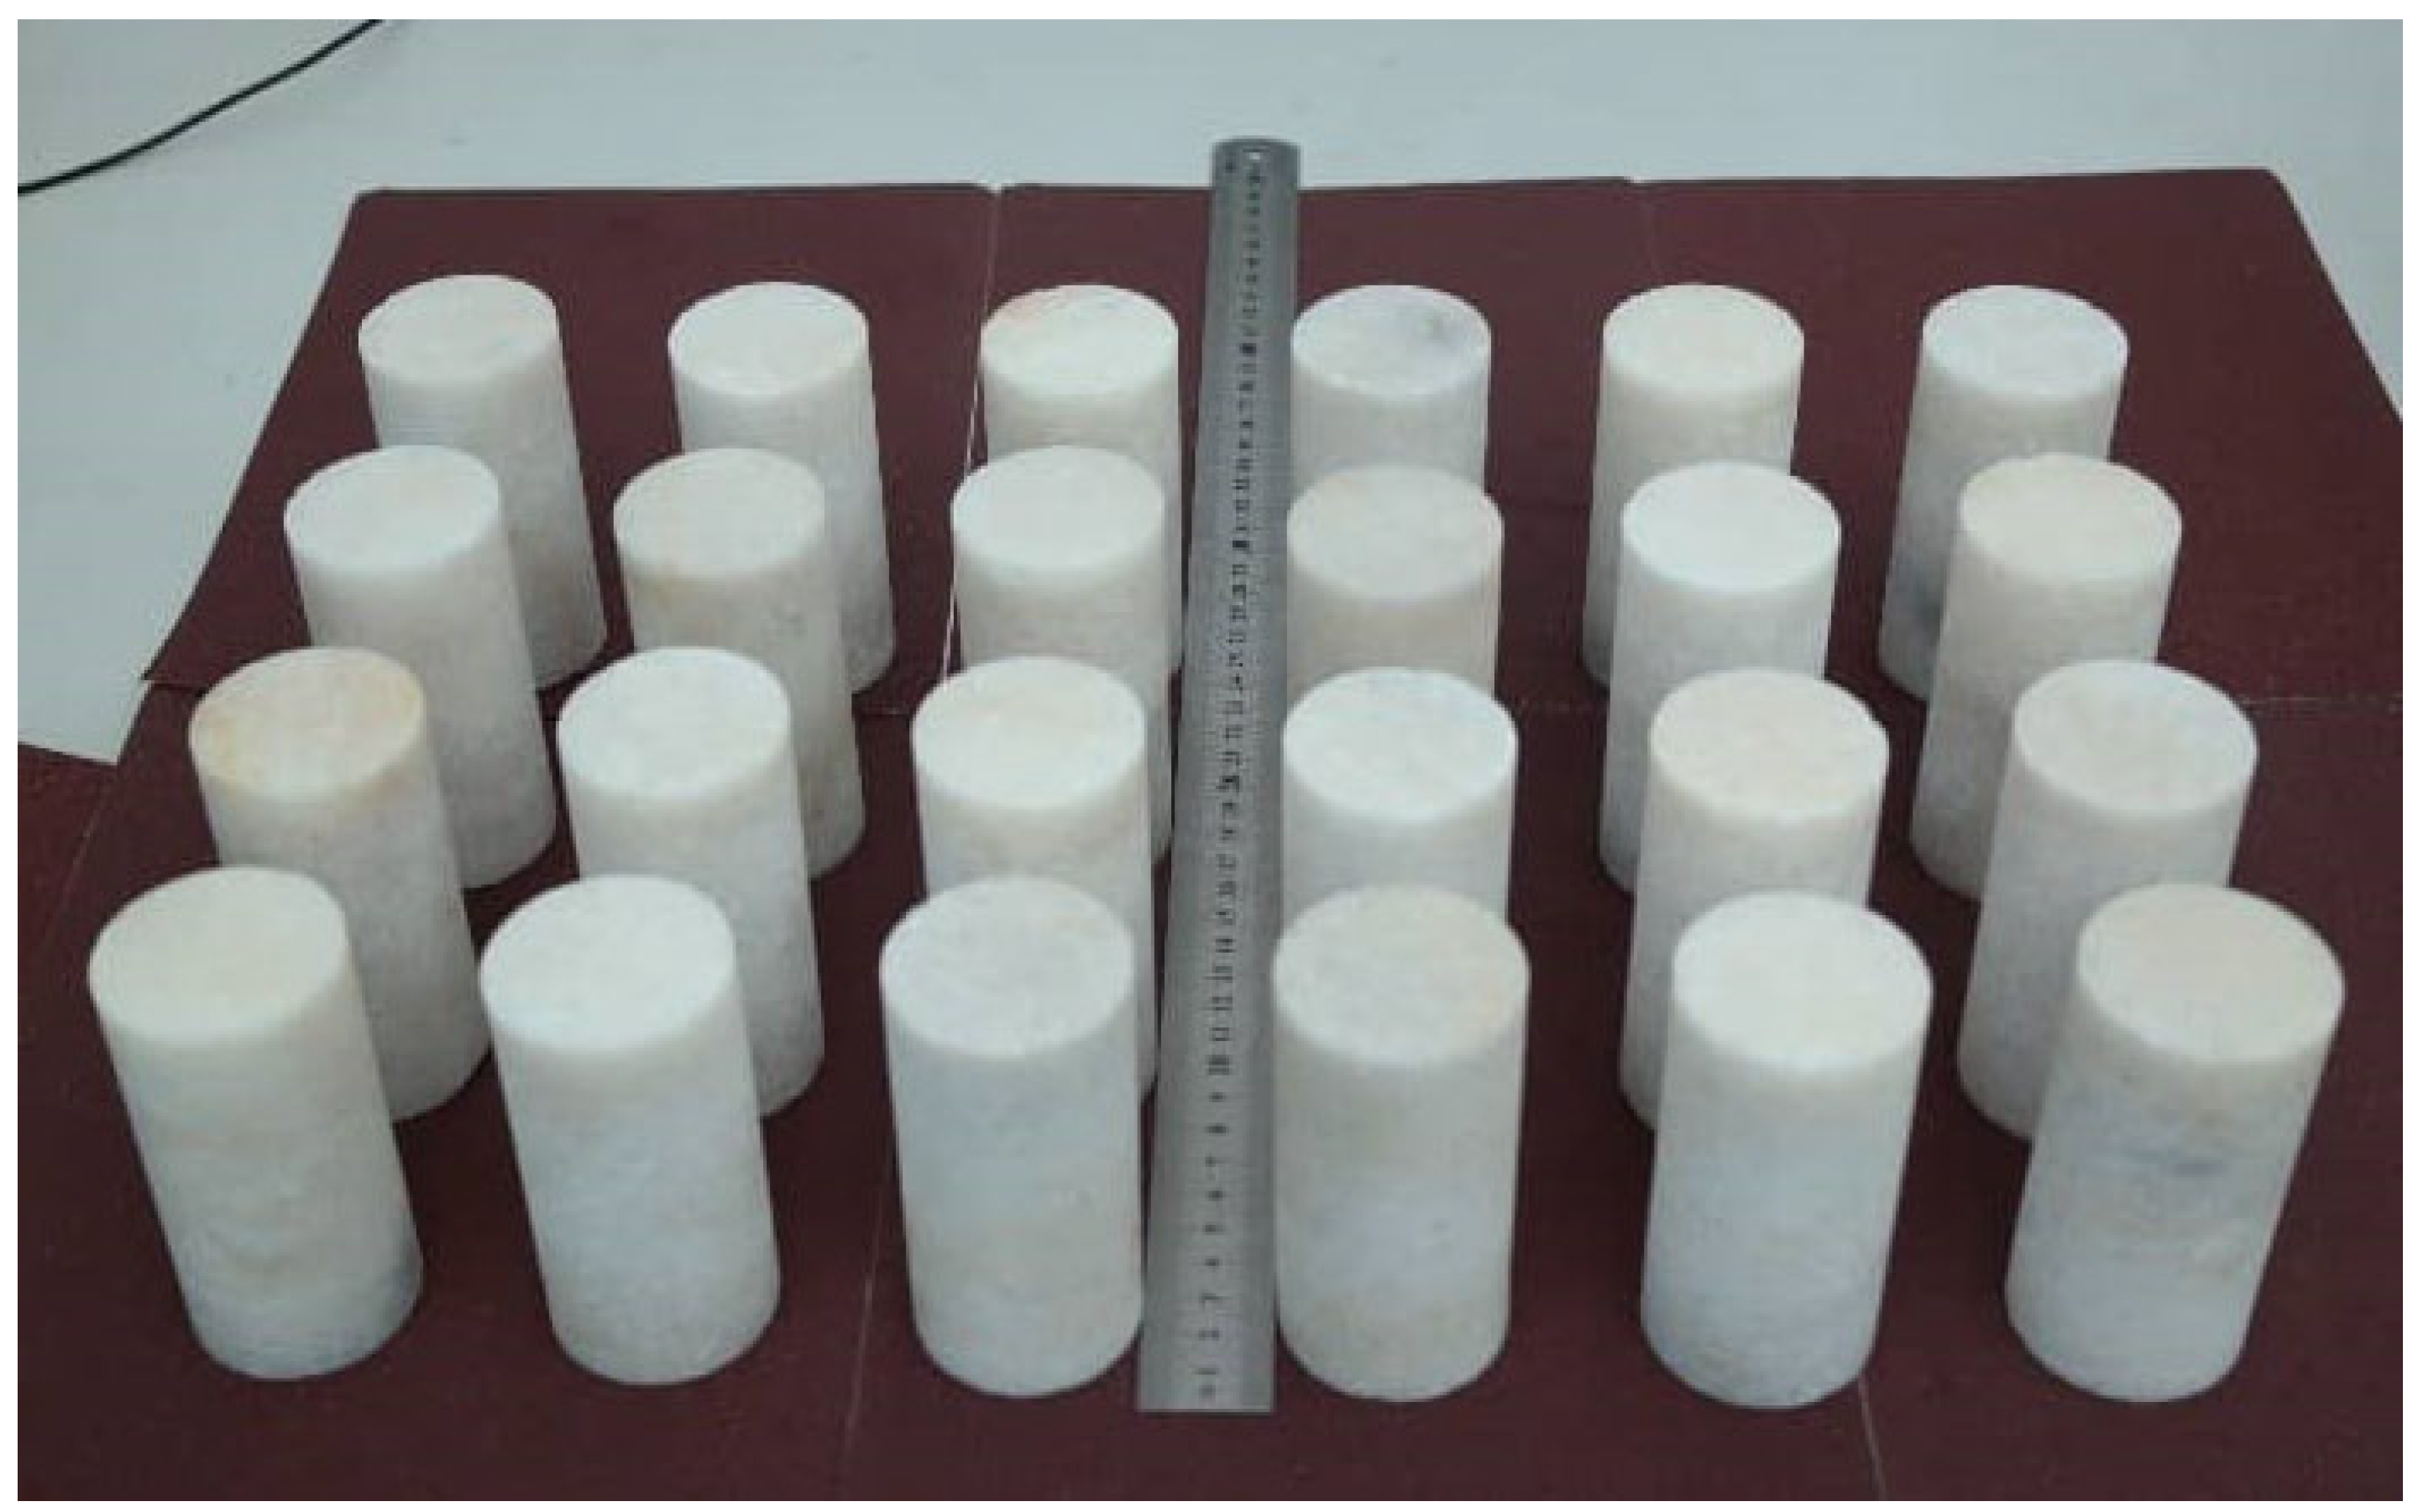
2.1. Rock Sample Preparation

Marble was taken as the research object to conduct mechanical tests under different thermal cycles and confining pressures, and the rocks came from Henan province in China. According to ISRM [27], the marble was processed into a cylindrical sample with a diameter of 50 mm and a height of 100 mm, as shown in Figure 1. The fine-grained marble was milky white and had good homogeneity and massive structure, among which the contents of dolomite, calcite, and albite were 96.04%, 3.58%, and 0.38% under each test condition, and three samples were set to take the average value. The physical and mechanical parameters of marble are shown in Table 1, including the mean value and range of each parameter.

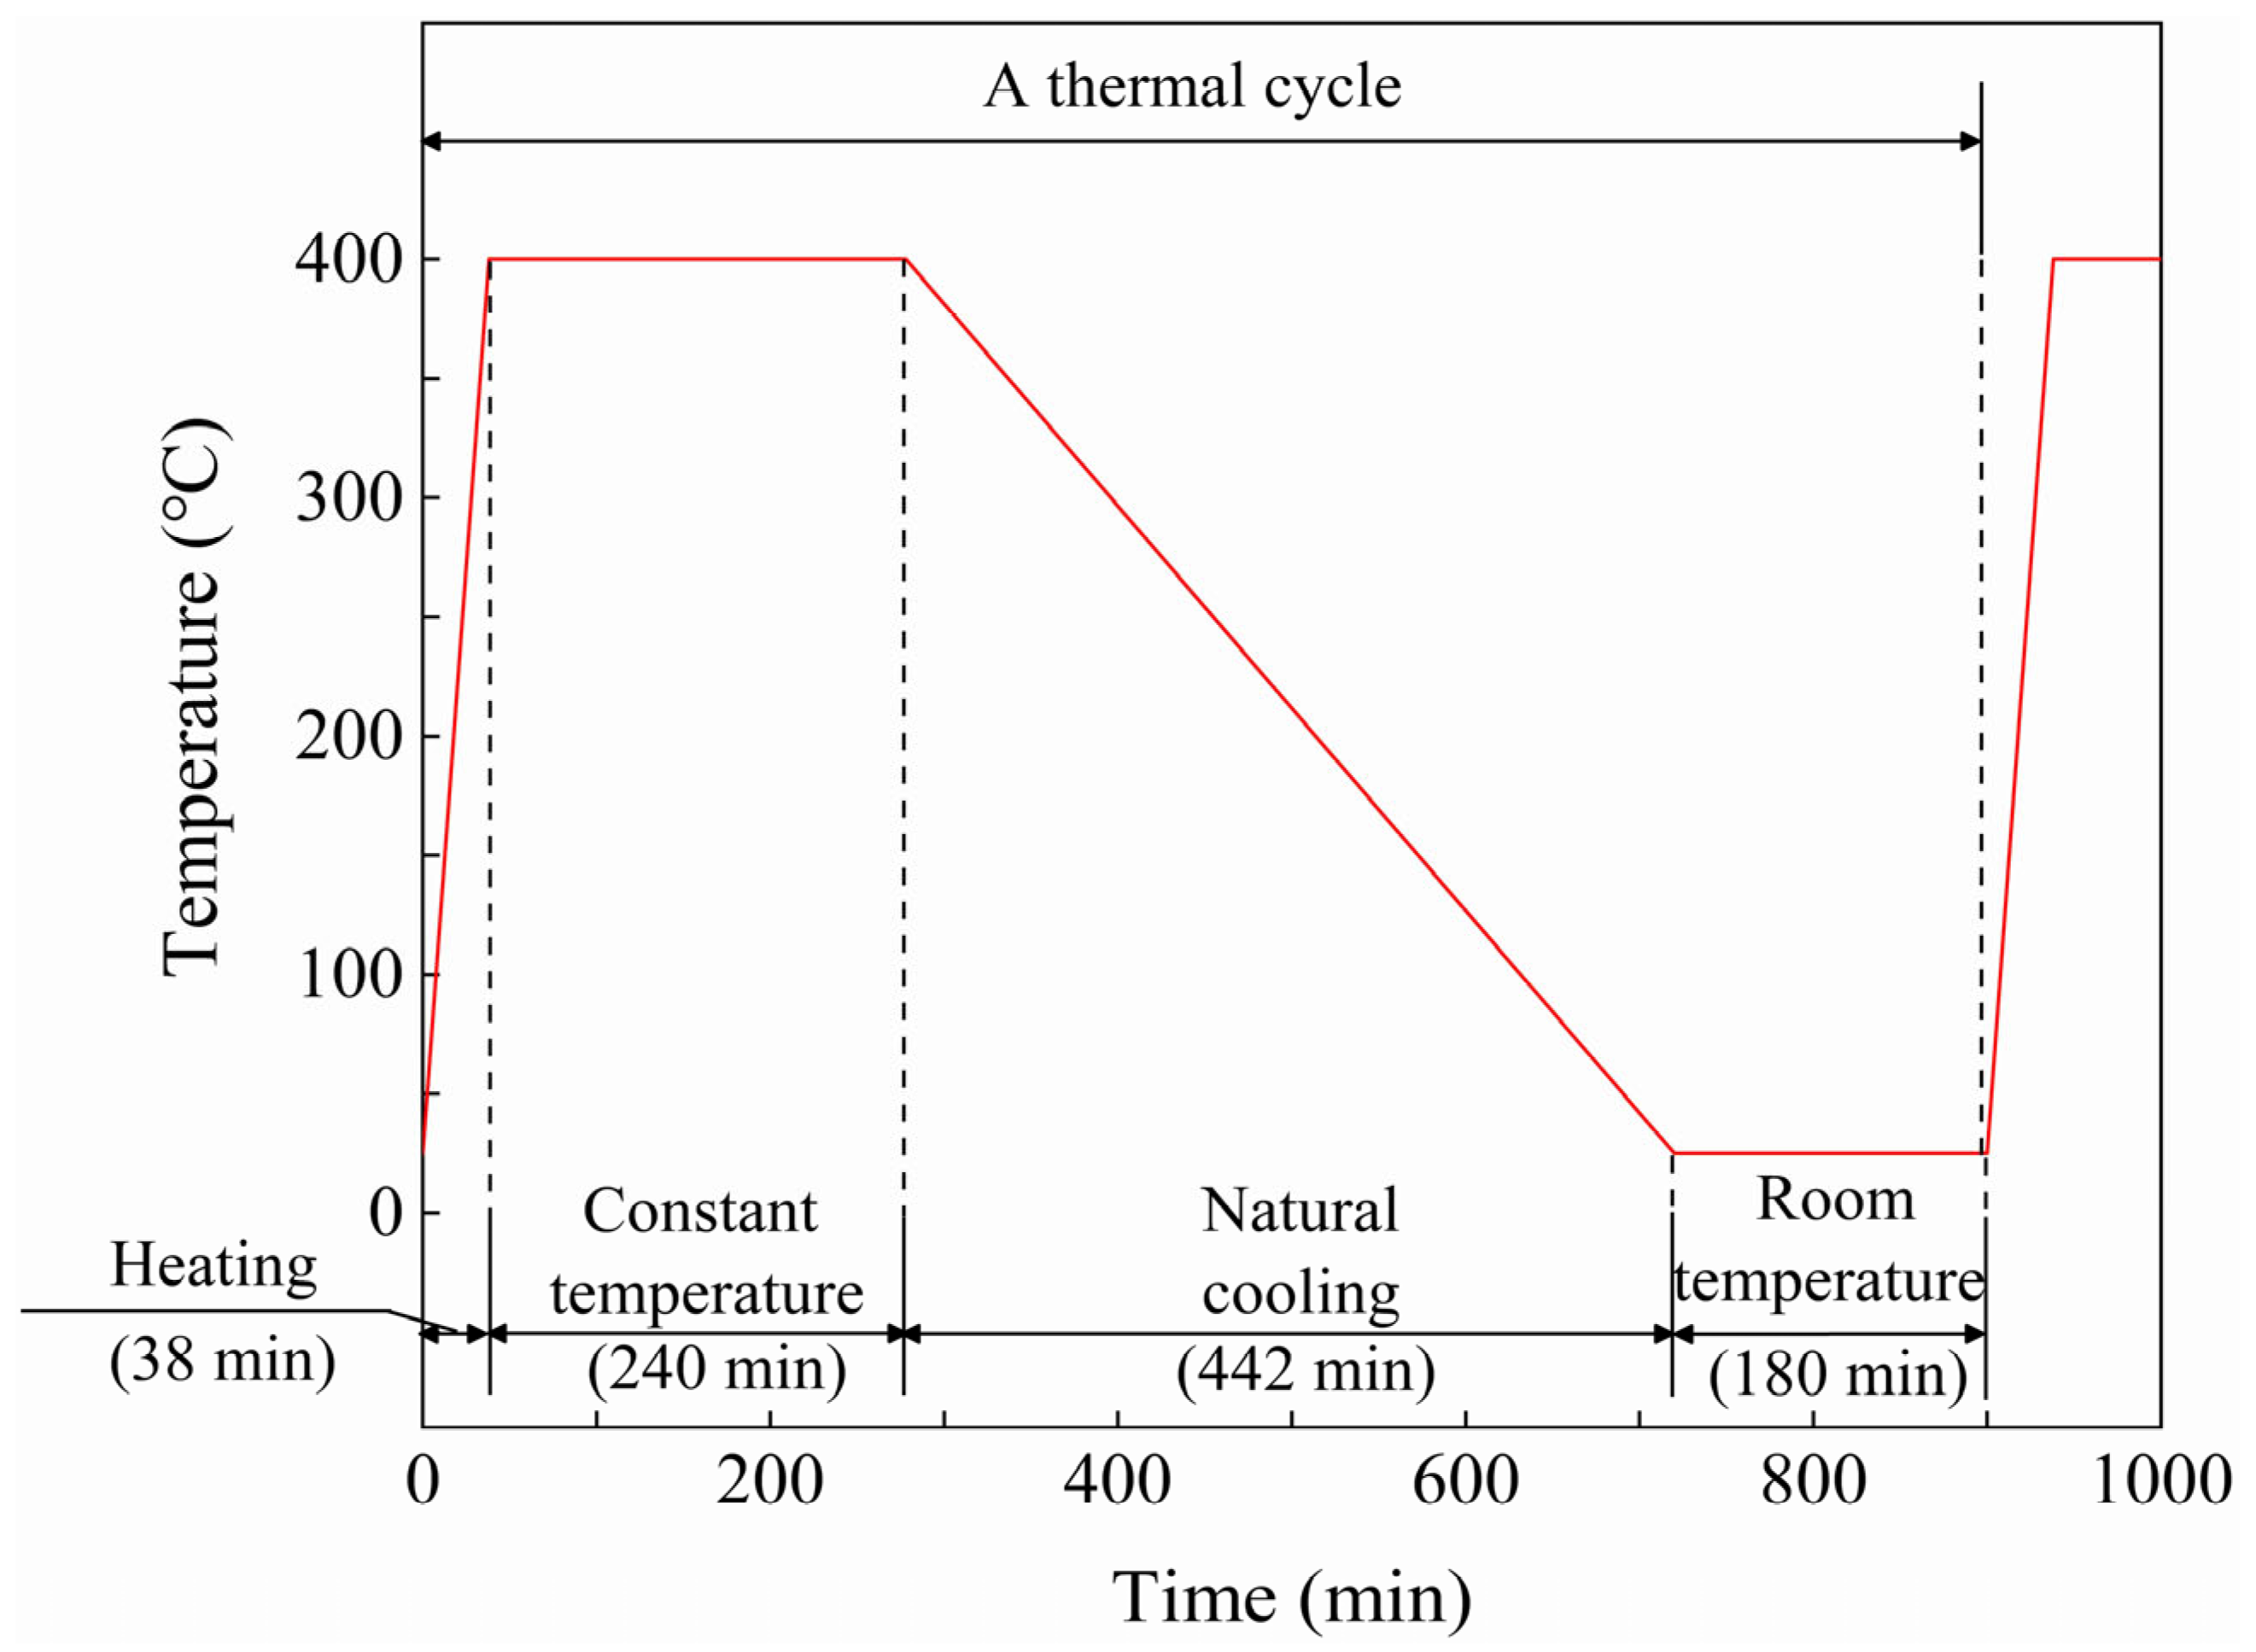
2.2. Thermal Cycle Treatment

The equipment shown in Figure 2 was used for this test. An SX2-10-12 high-temperature box-type resistance furnace (made in Changchun Rising Sun Testing Instruments Co. Ltd, Changchun, China), as shown in Figure 2a, was used as sample heating equipment. The furnace has a rated power and temperature of 10 kW and 1200 °C. All the samples were placed in the furnace and then heated to 400 °C at a rate of 10 °C/min. The temperature of the furnace was kept for 4 h to ensure all the samples were heated completely and uniformly; then, the furnace was opened, and the samples were left to cool naturally to room temperature. The steps above are called a thermal cycle (Figure 3). A cycle went through about 15 h. The number of thermal cycles set in this test was 0, 1, 2, 4, and 8. Three samples were set for each test.

2.3. Triaxial Compression Test

A triaxial compression test was carried out on a TAW-3000 rock servo multi-field coupling test system, as shown in Figure 2b. The maximum axial test force and confining pressure of the system were 3000 kN and 100 MPa.
In this test, 7 confining pressure levels of 0, 5, 10, 15, 20, 25, and 30 MPa were set.

2.4. Microscopic Observation

The rock slices were identified using a polarized light microscope. The microscope shown in Figure 2c can observe transparent minerals under transmitted or reflected light conditions to identify their cleavage, crystal shape, and optical properties, such as pleochroism, refractive index, reflectivity, extinction angle, and so on.
In order to study the influence of thermal cycle on the crack growth law by the equipment shown in Figure 2c, samples experiencing a different number of thermal cycles were made into sections with a thickness of 0.03 mm from the same position.

3. Test Results and Analysis

The data in the following figure and table in Section 3 use the mean value of each group of tests.

3.1. Physical-Mechanical Properties

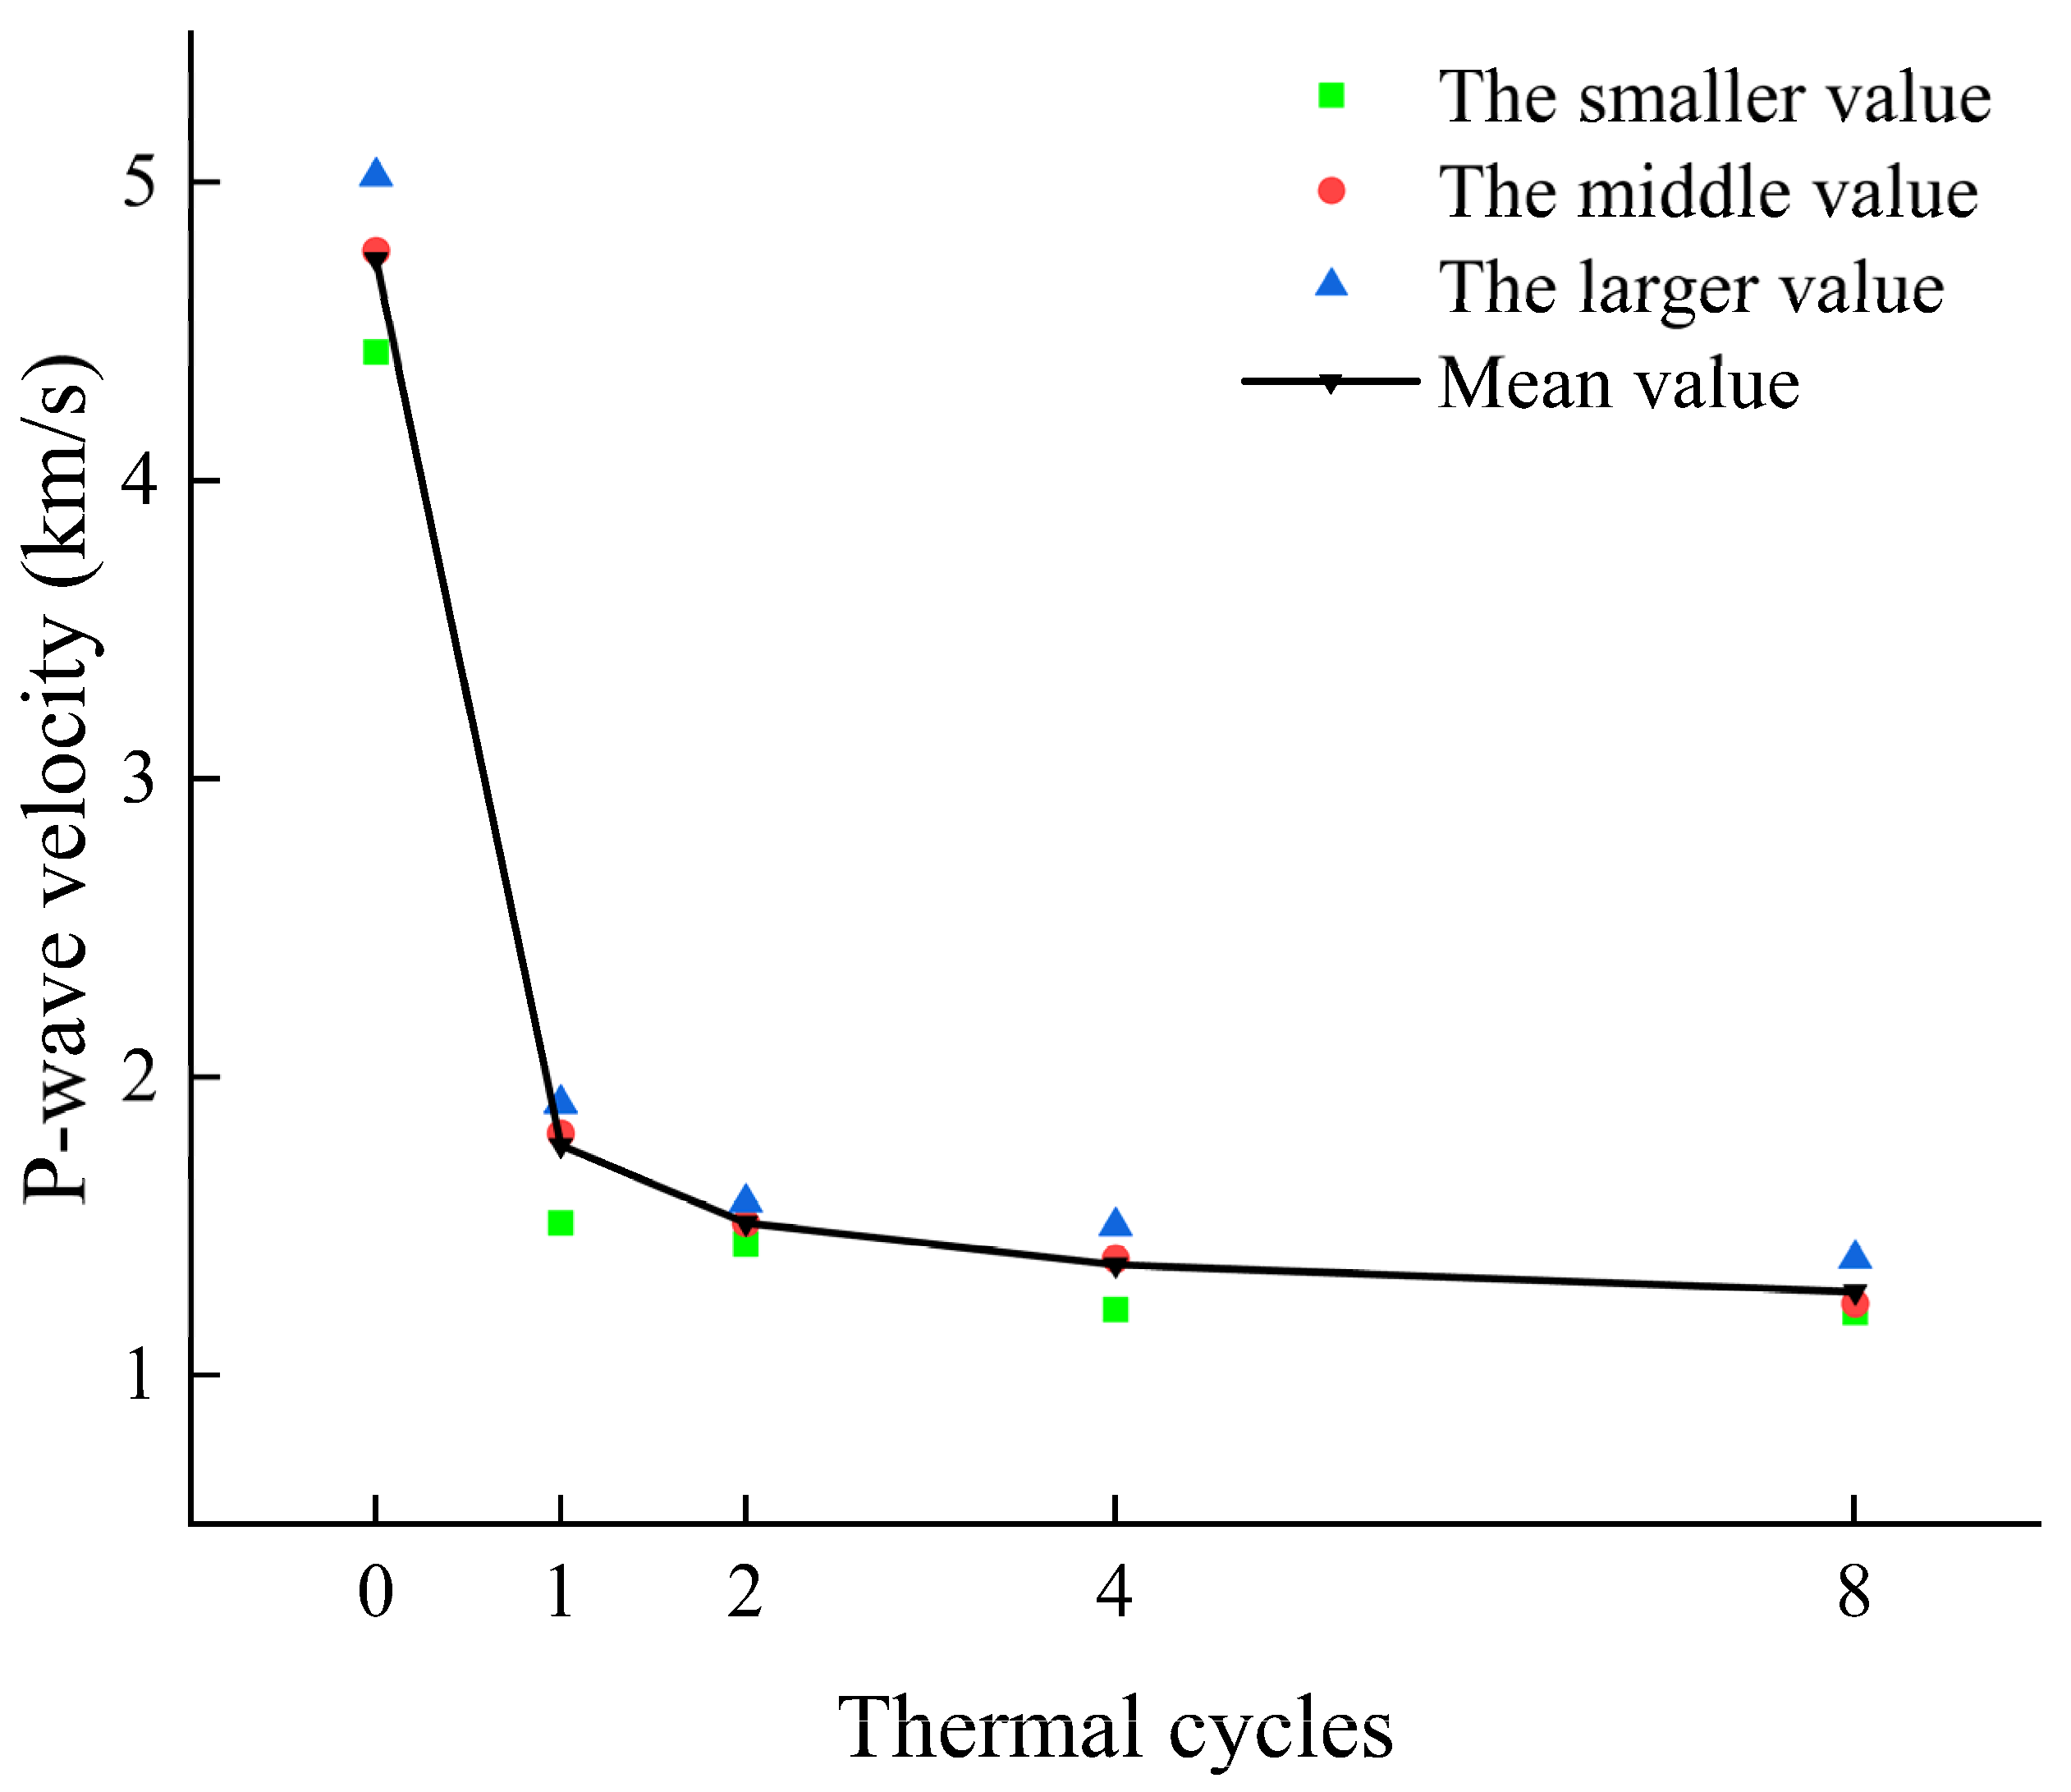
3.1.1. P-Wave Velocity

P-wave velocity is extremely sensitive to microcracks in rock thermal damage, which can be used to quantitatively evaluate the thermal damage degree. The velocities of fine-grained marble after different thermal cycles are shown in Table 2 and Figure 4.
The results show that under the same set of test conditions, the amplitude of wave velocity change was small; moreover, after the effect of the thermal cycle, Vp decreased sharply, then slowly with the increase in thermal cycles. The velocity was 1.77 km/s, which was about 37% of that of the marble without thermal damage. Subsequently, with the increase in the number of thermal cycles, Vp declined slowly, and the velocity of marble after eight thermal cycles decreased to 27% of the undamaged rate.

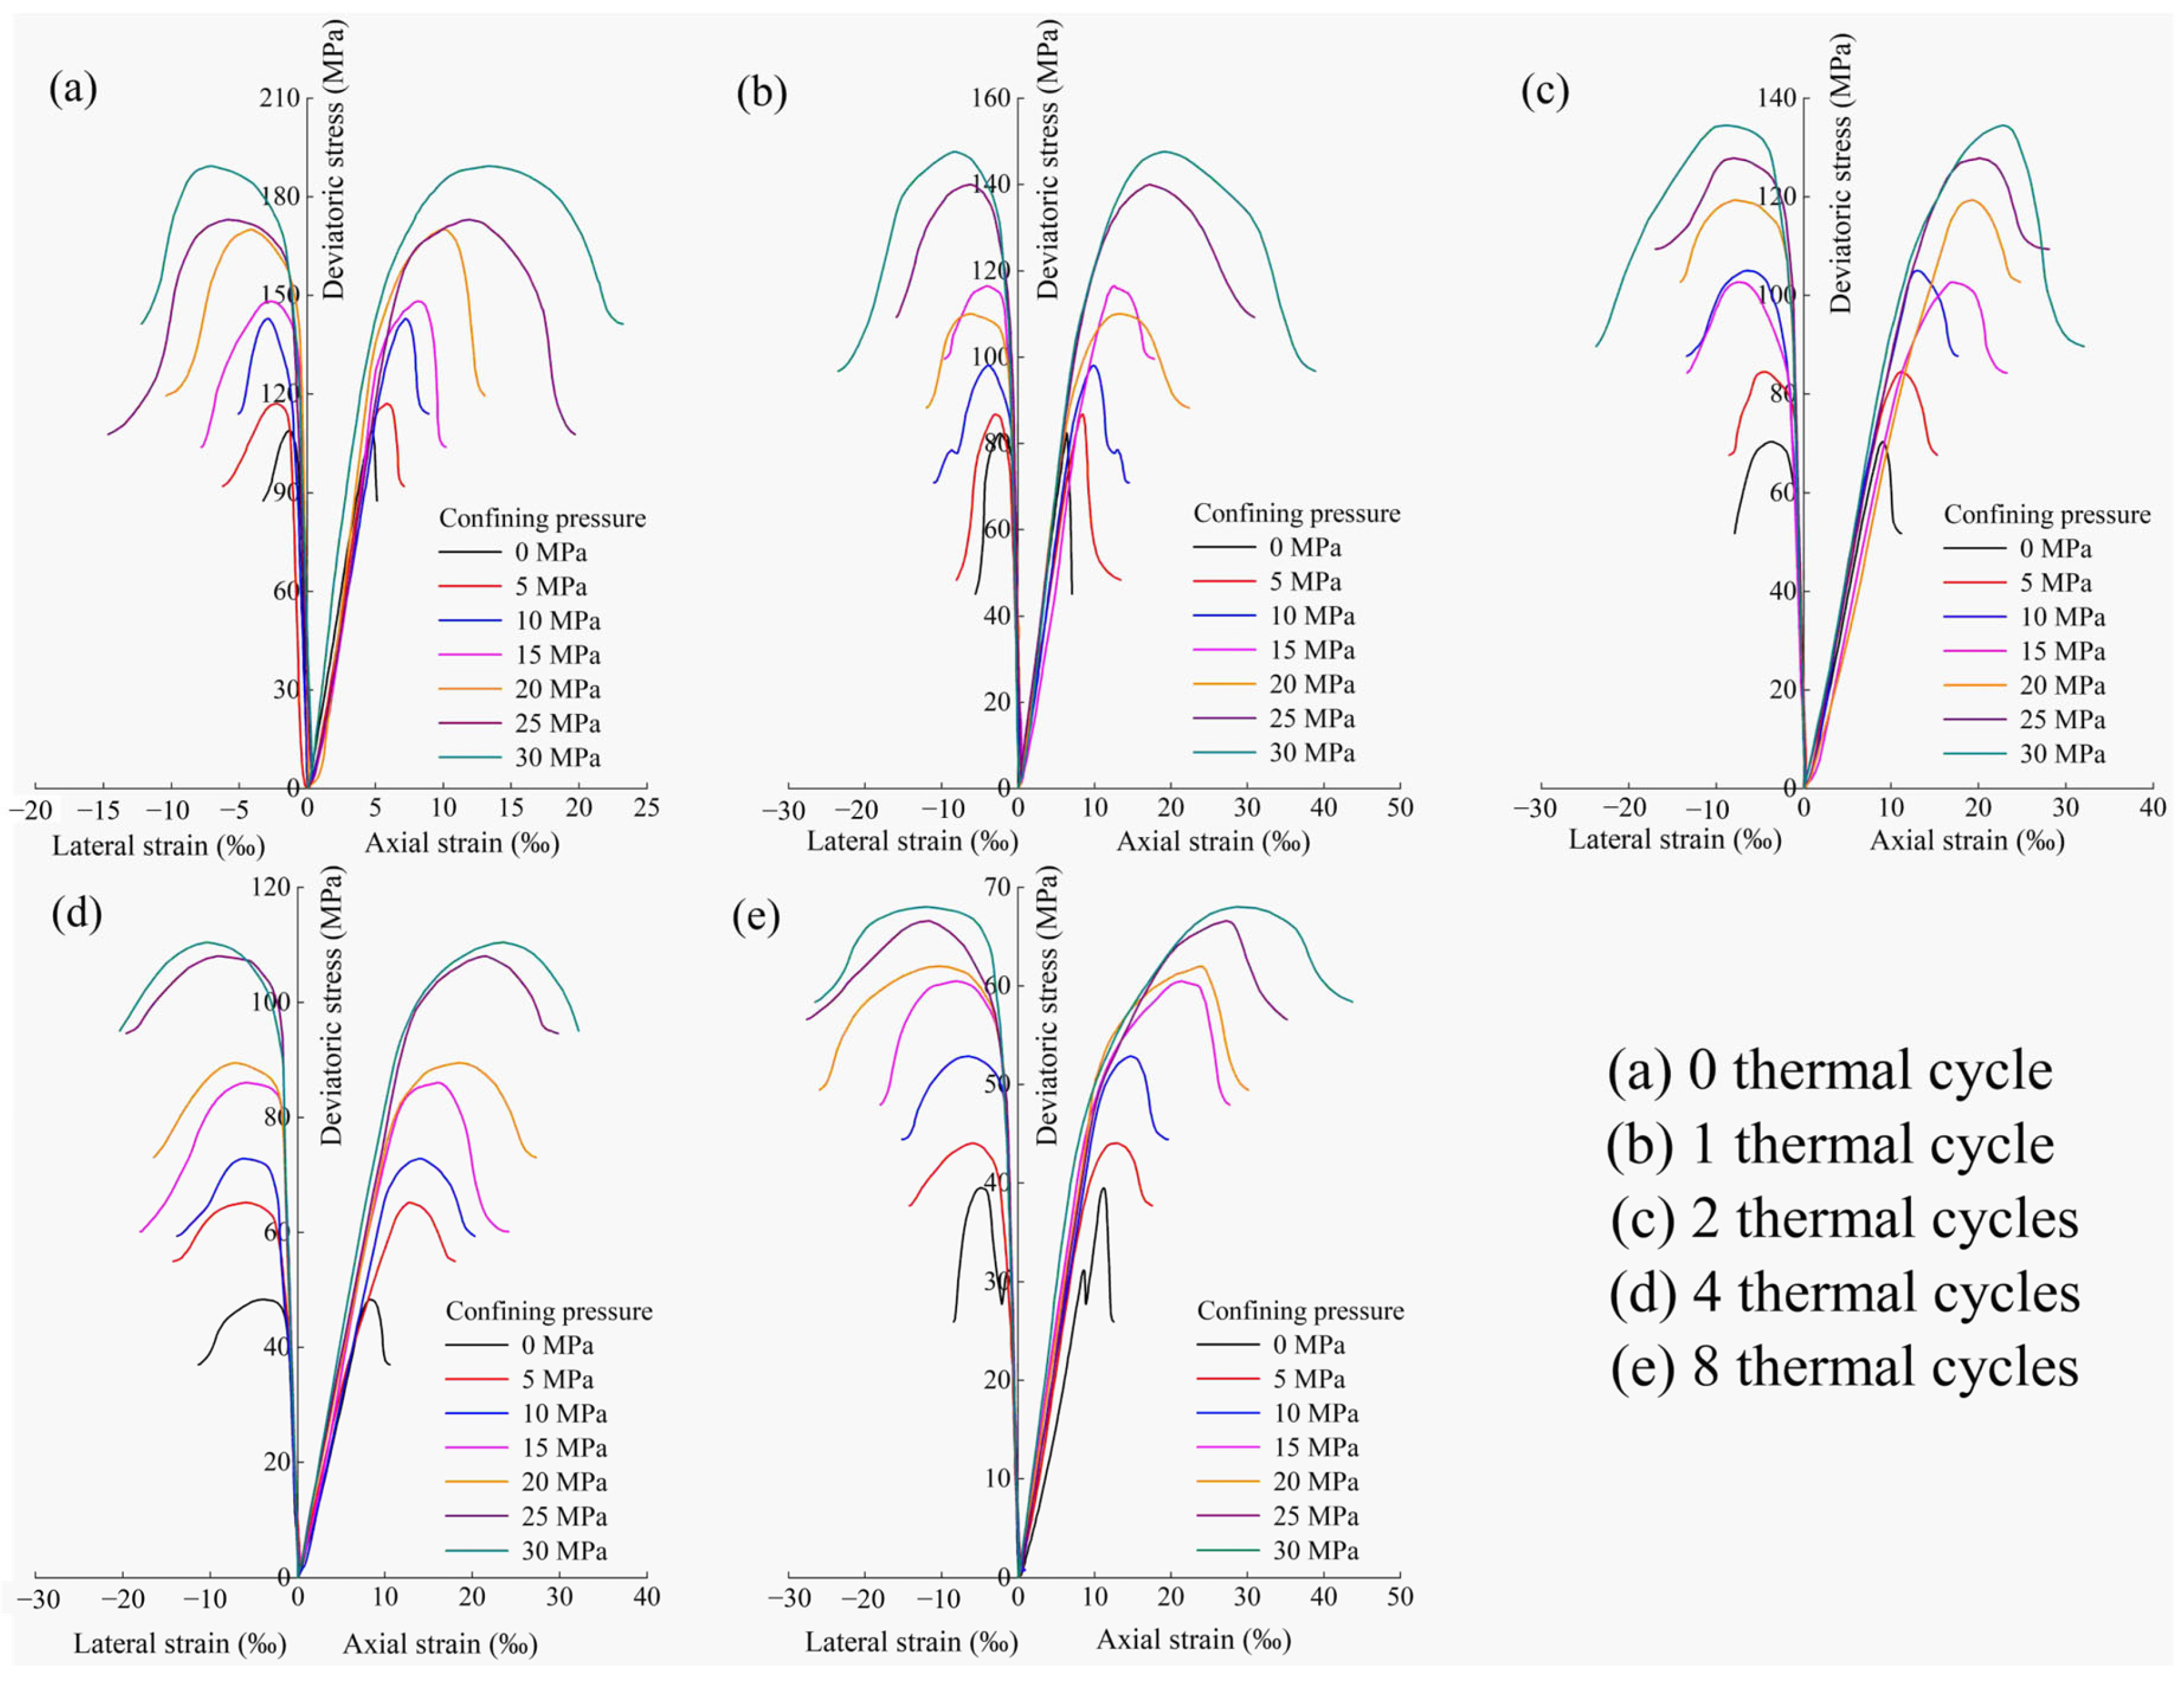
3.1.2. Stress-Strain Curve

Figure 5 shows the stress-strain curves of all tests. It can be seen from the figure that at a constant number of thermal cycles, the triaxial compression stress-strain curves of marble almost all went through four stages: crack closure, linear elastic, nonlinear deformation, and failure [28].
Crack closure stage: The stress rises slowly, while the strain increases rapidly. At this time, the stress-strain curve tends to be concave. However, this trend becomes inconspicuous when confining pressure increases, which can hardly be observed when the confining pressure is very high. Linear elastic stage: after the initial crack closure stage, the stress-strain curve approximates a straight line, showing the elastic characteristics of marble samples. Nonlinear deformation stage: at this stage, the elastic modulus of the rock sample decreases with the increase in strain, which results in the rock yield phenomenon. Failure stage: the internal cracks of the rock sample are connected to form macroscopic cracks, and the ability to bear loads is lost.
It can be seen intuitively from the figure that the peak stress and peak strain of the rock sample increased significantly with the confining pressure. When the number of thermal cycles rose to four, the ductility characteristics of the rock sample began to show more obviously. Moreover, when the number of thermal cycles was low, the curve under high confining pressure also reflects ductility characteristics.
Figure 5. Complete stress-strain curves of marble specimens in triaxial compression under different thermal cycles.
Minerals 13 00428 g005

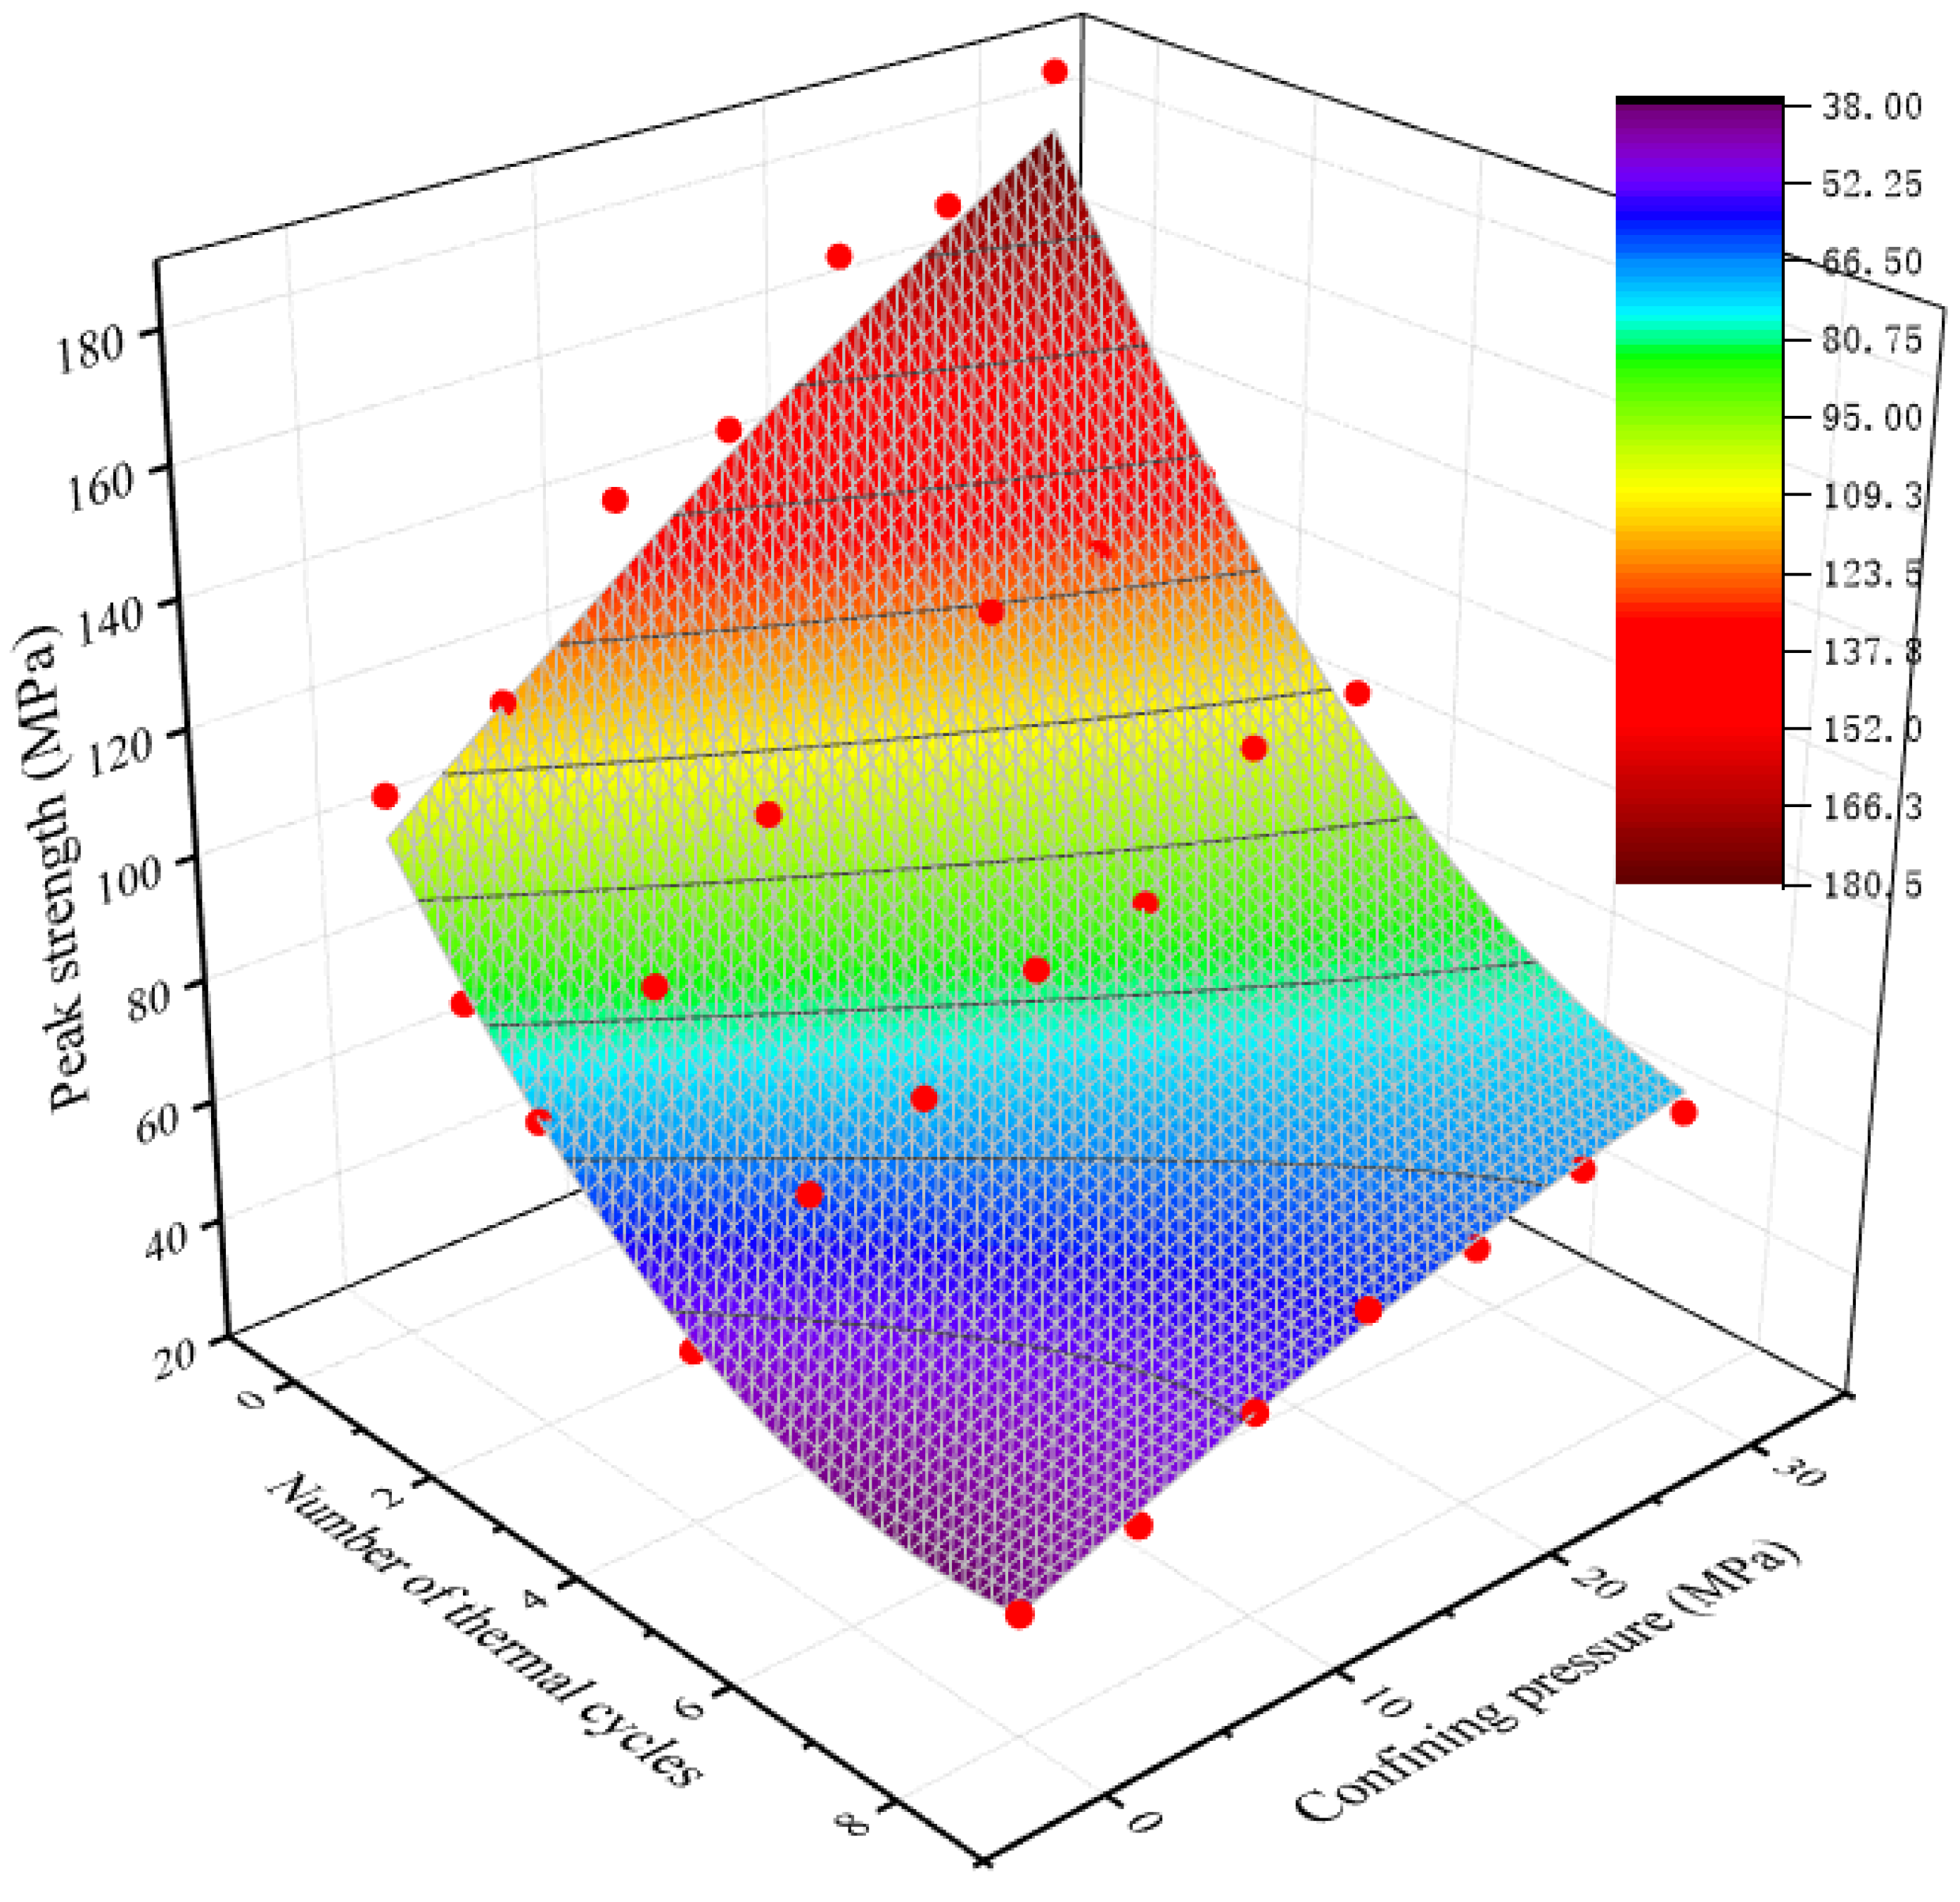
3.1.3. Strength Characteristics

Figure 6 shows the relationship between the peak stress and confining pressure under the same number of thermal cycles. The figure presents a good positive linear relationship, and the phenomenon is consistent with the Coulomb criterion. In summary, peak stress decreases when the number of cycles increases and increases when confining pressure rises. When it comes to the same number of thermal cycles, the peak stress under 30 MPa confining pressure is about 1.74–2.29 times that of UCS.

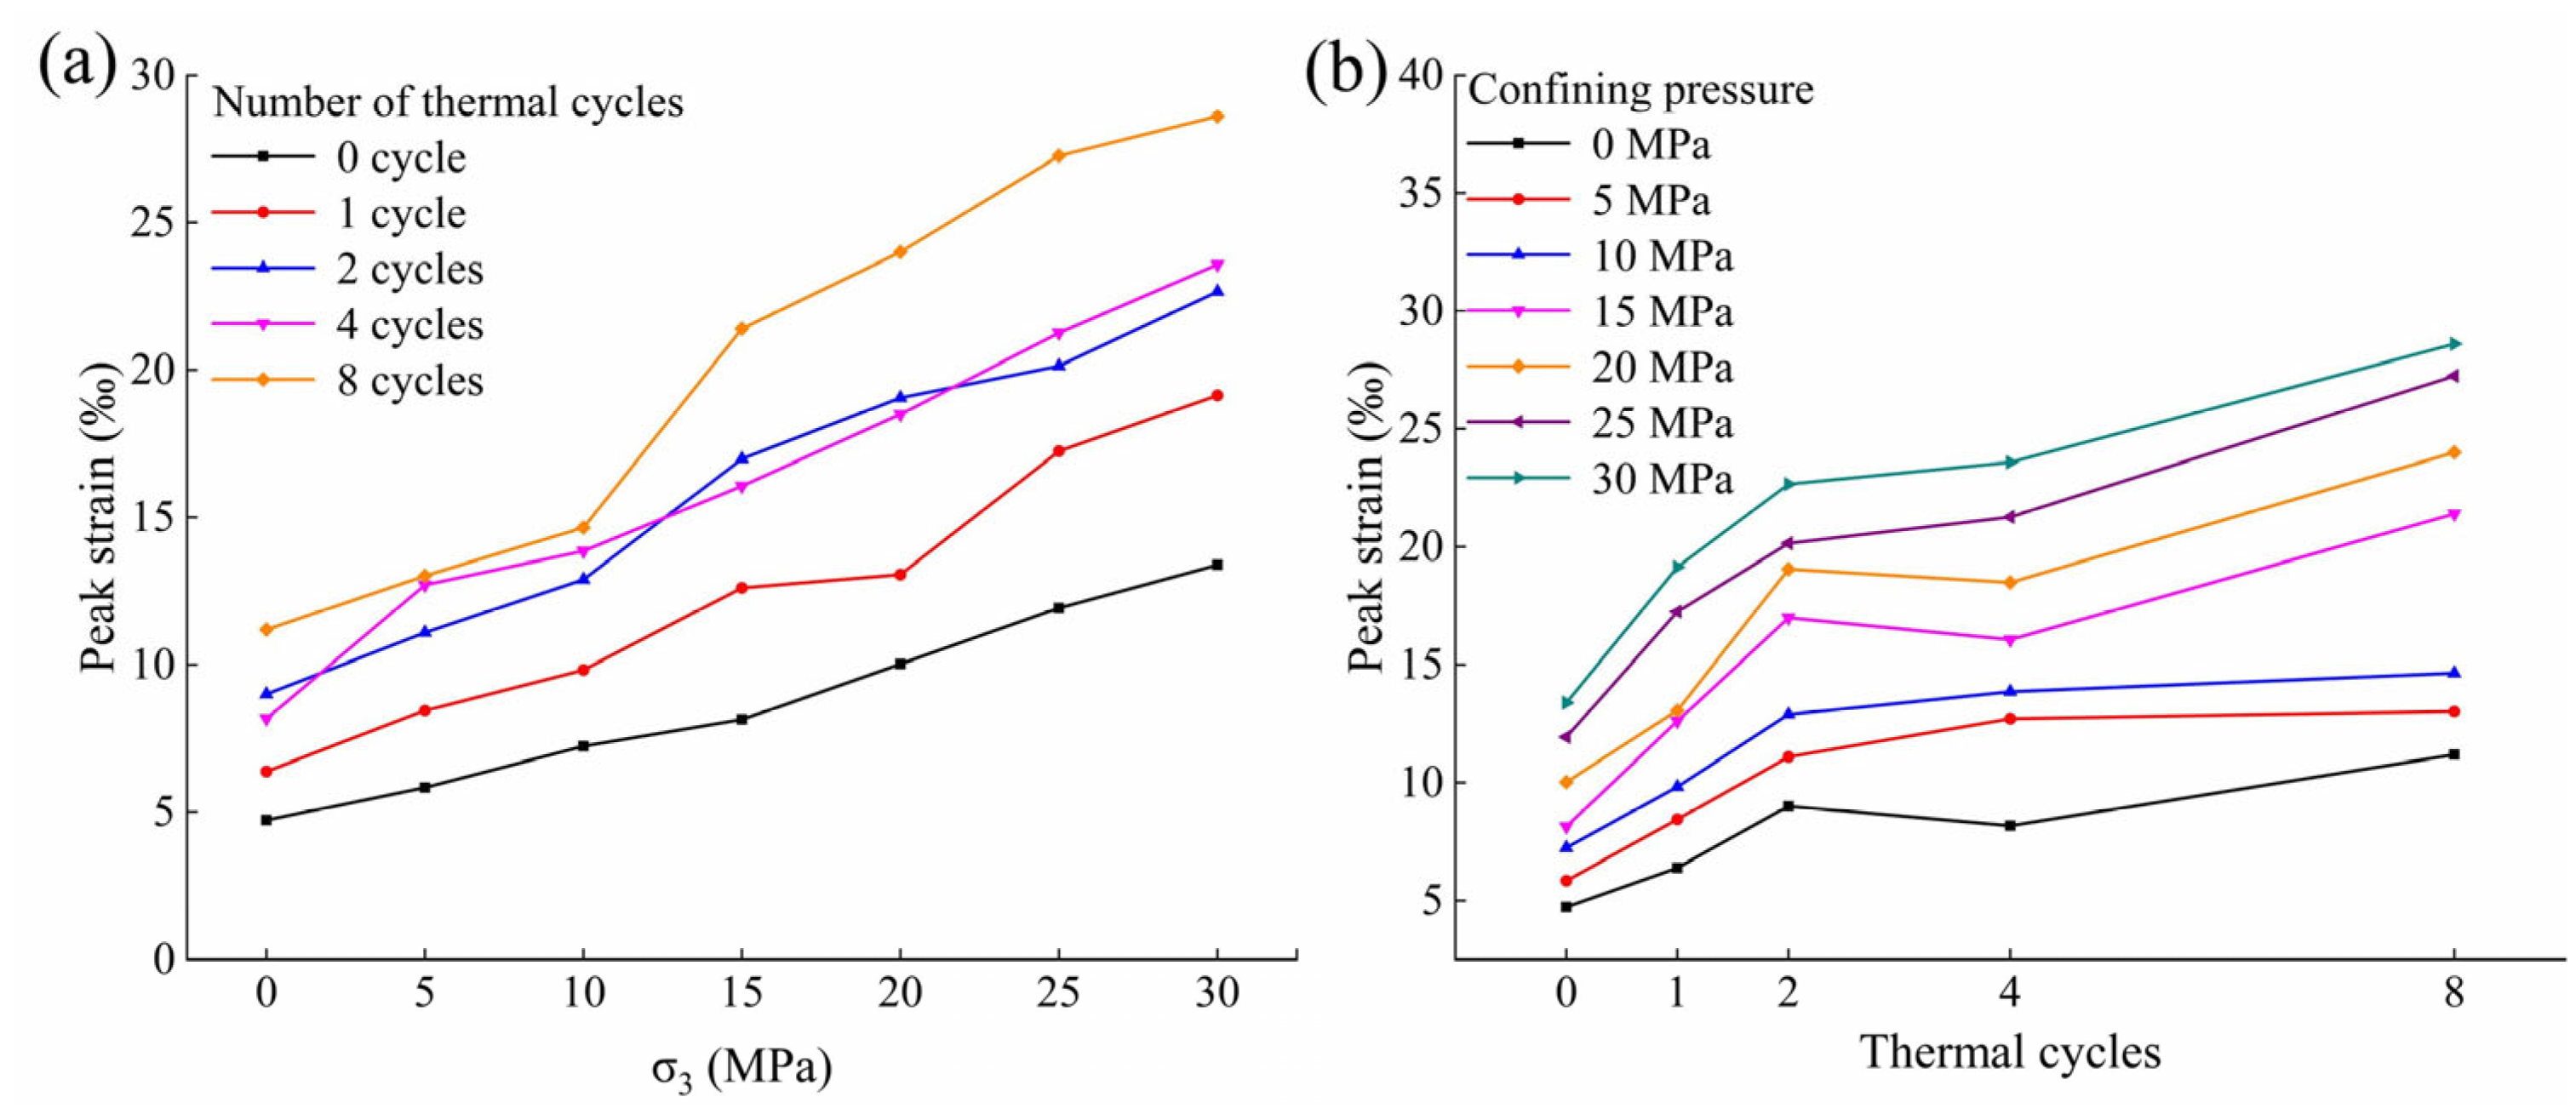
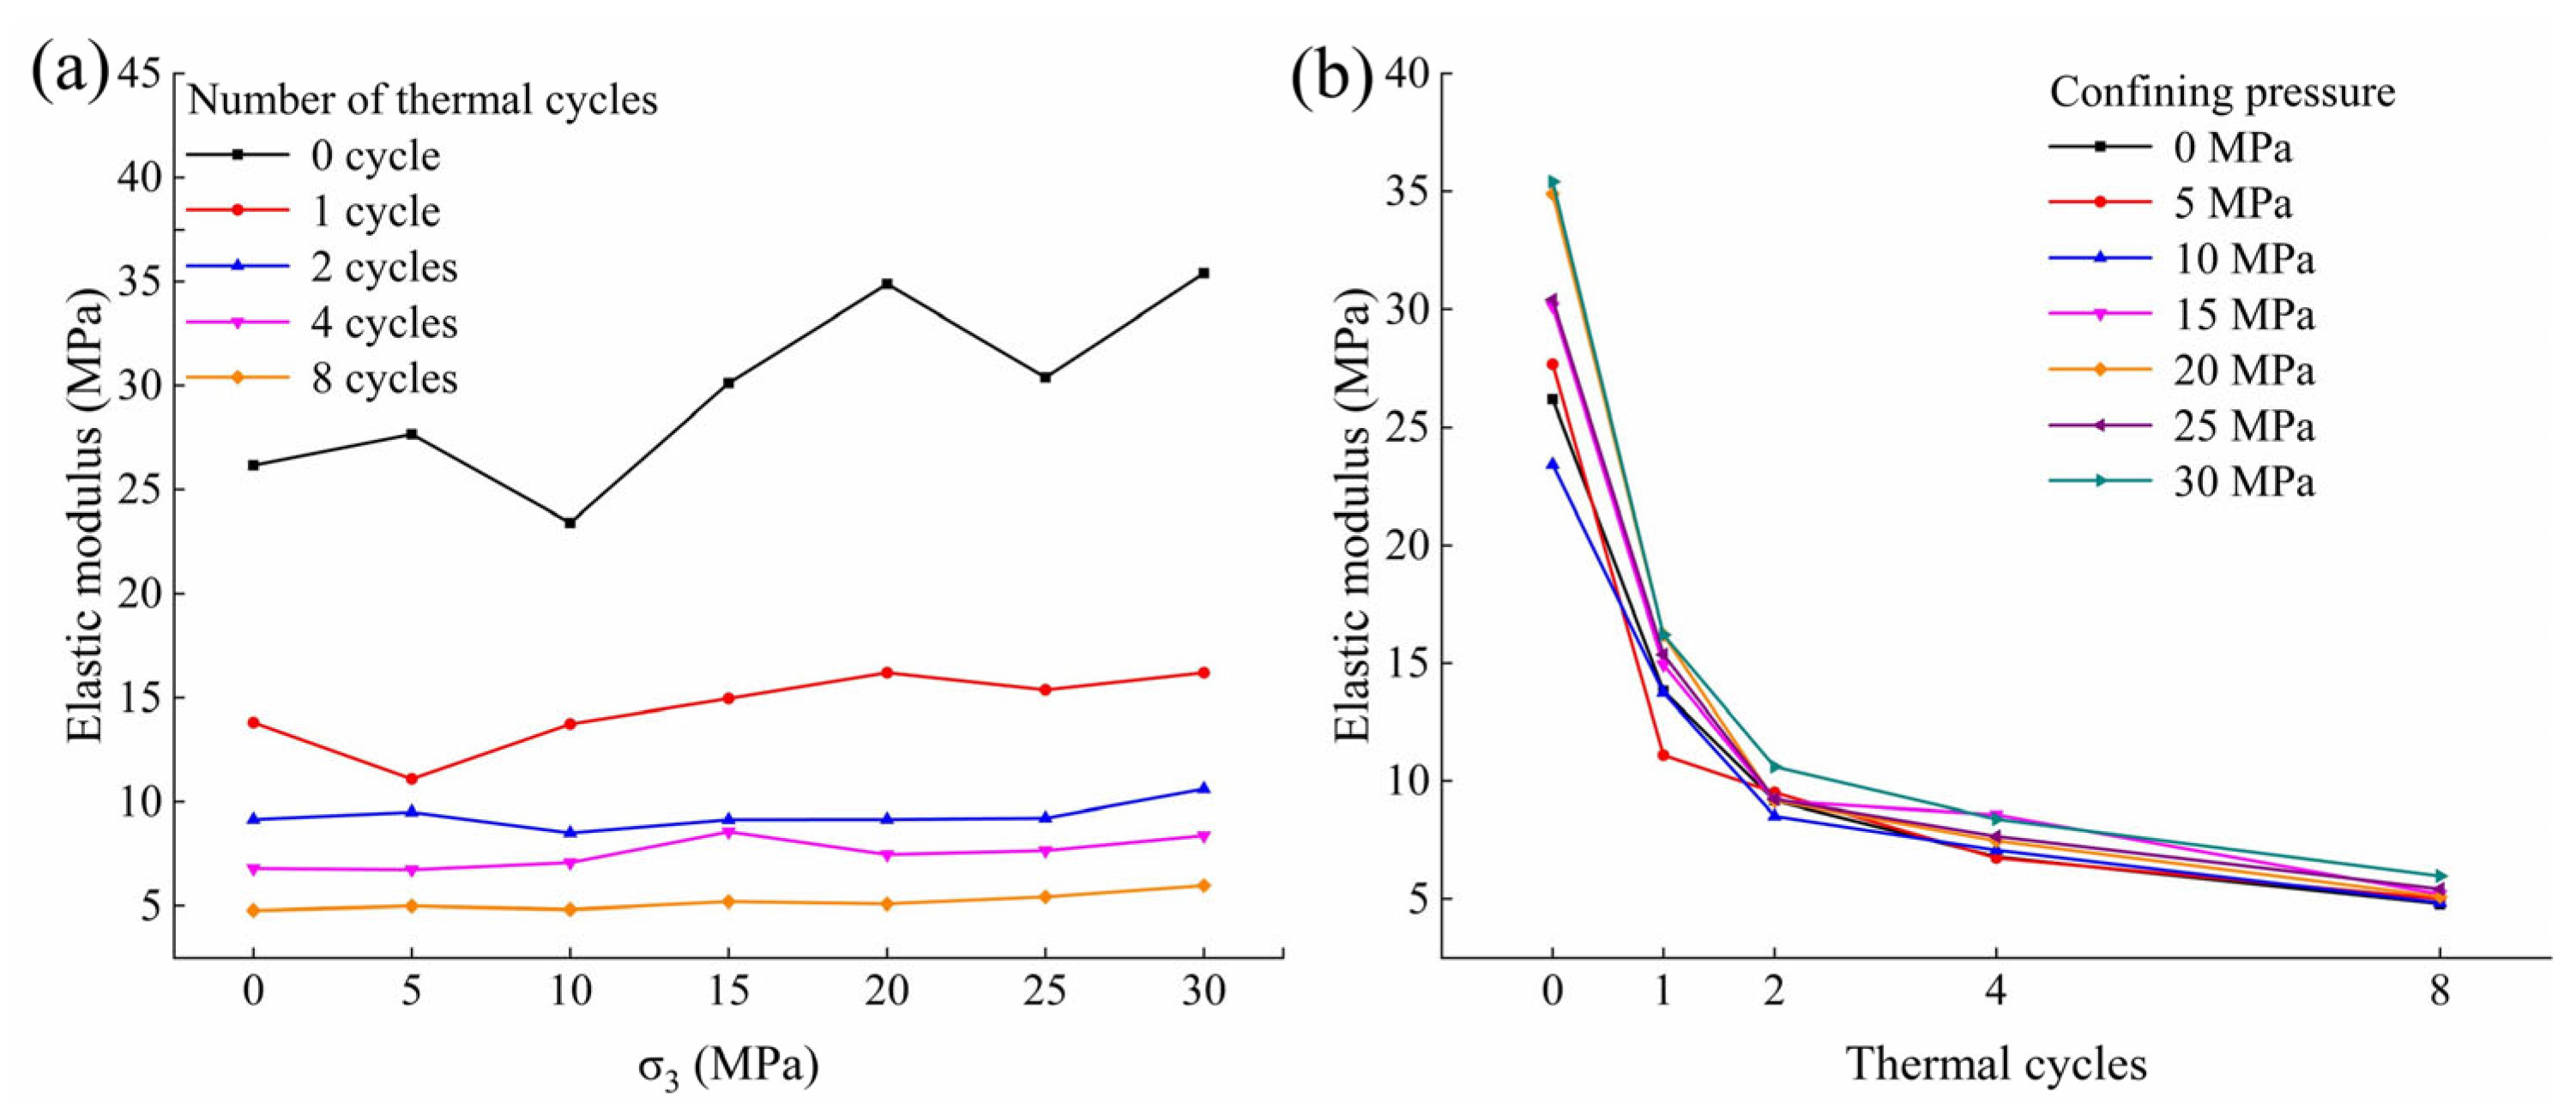
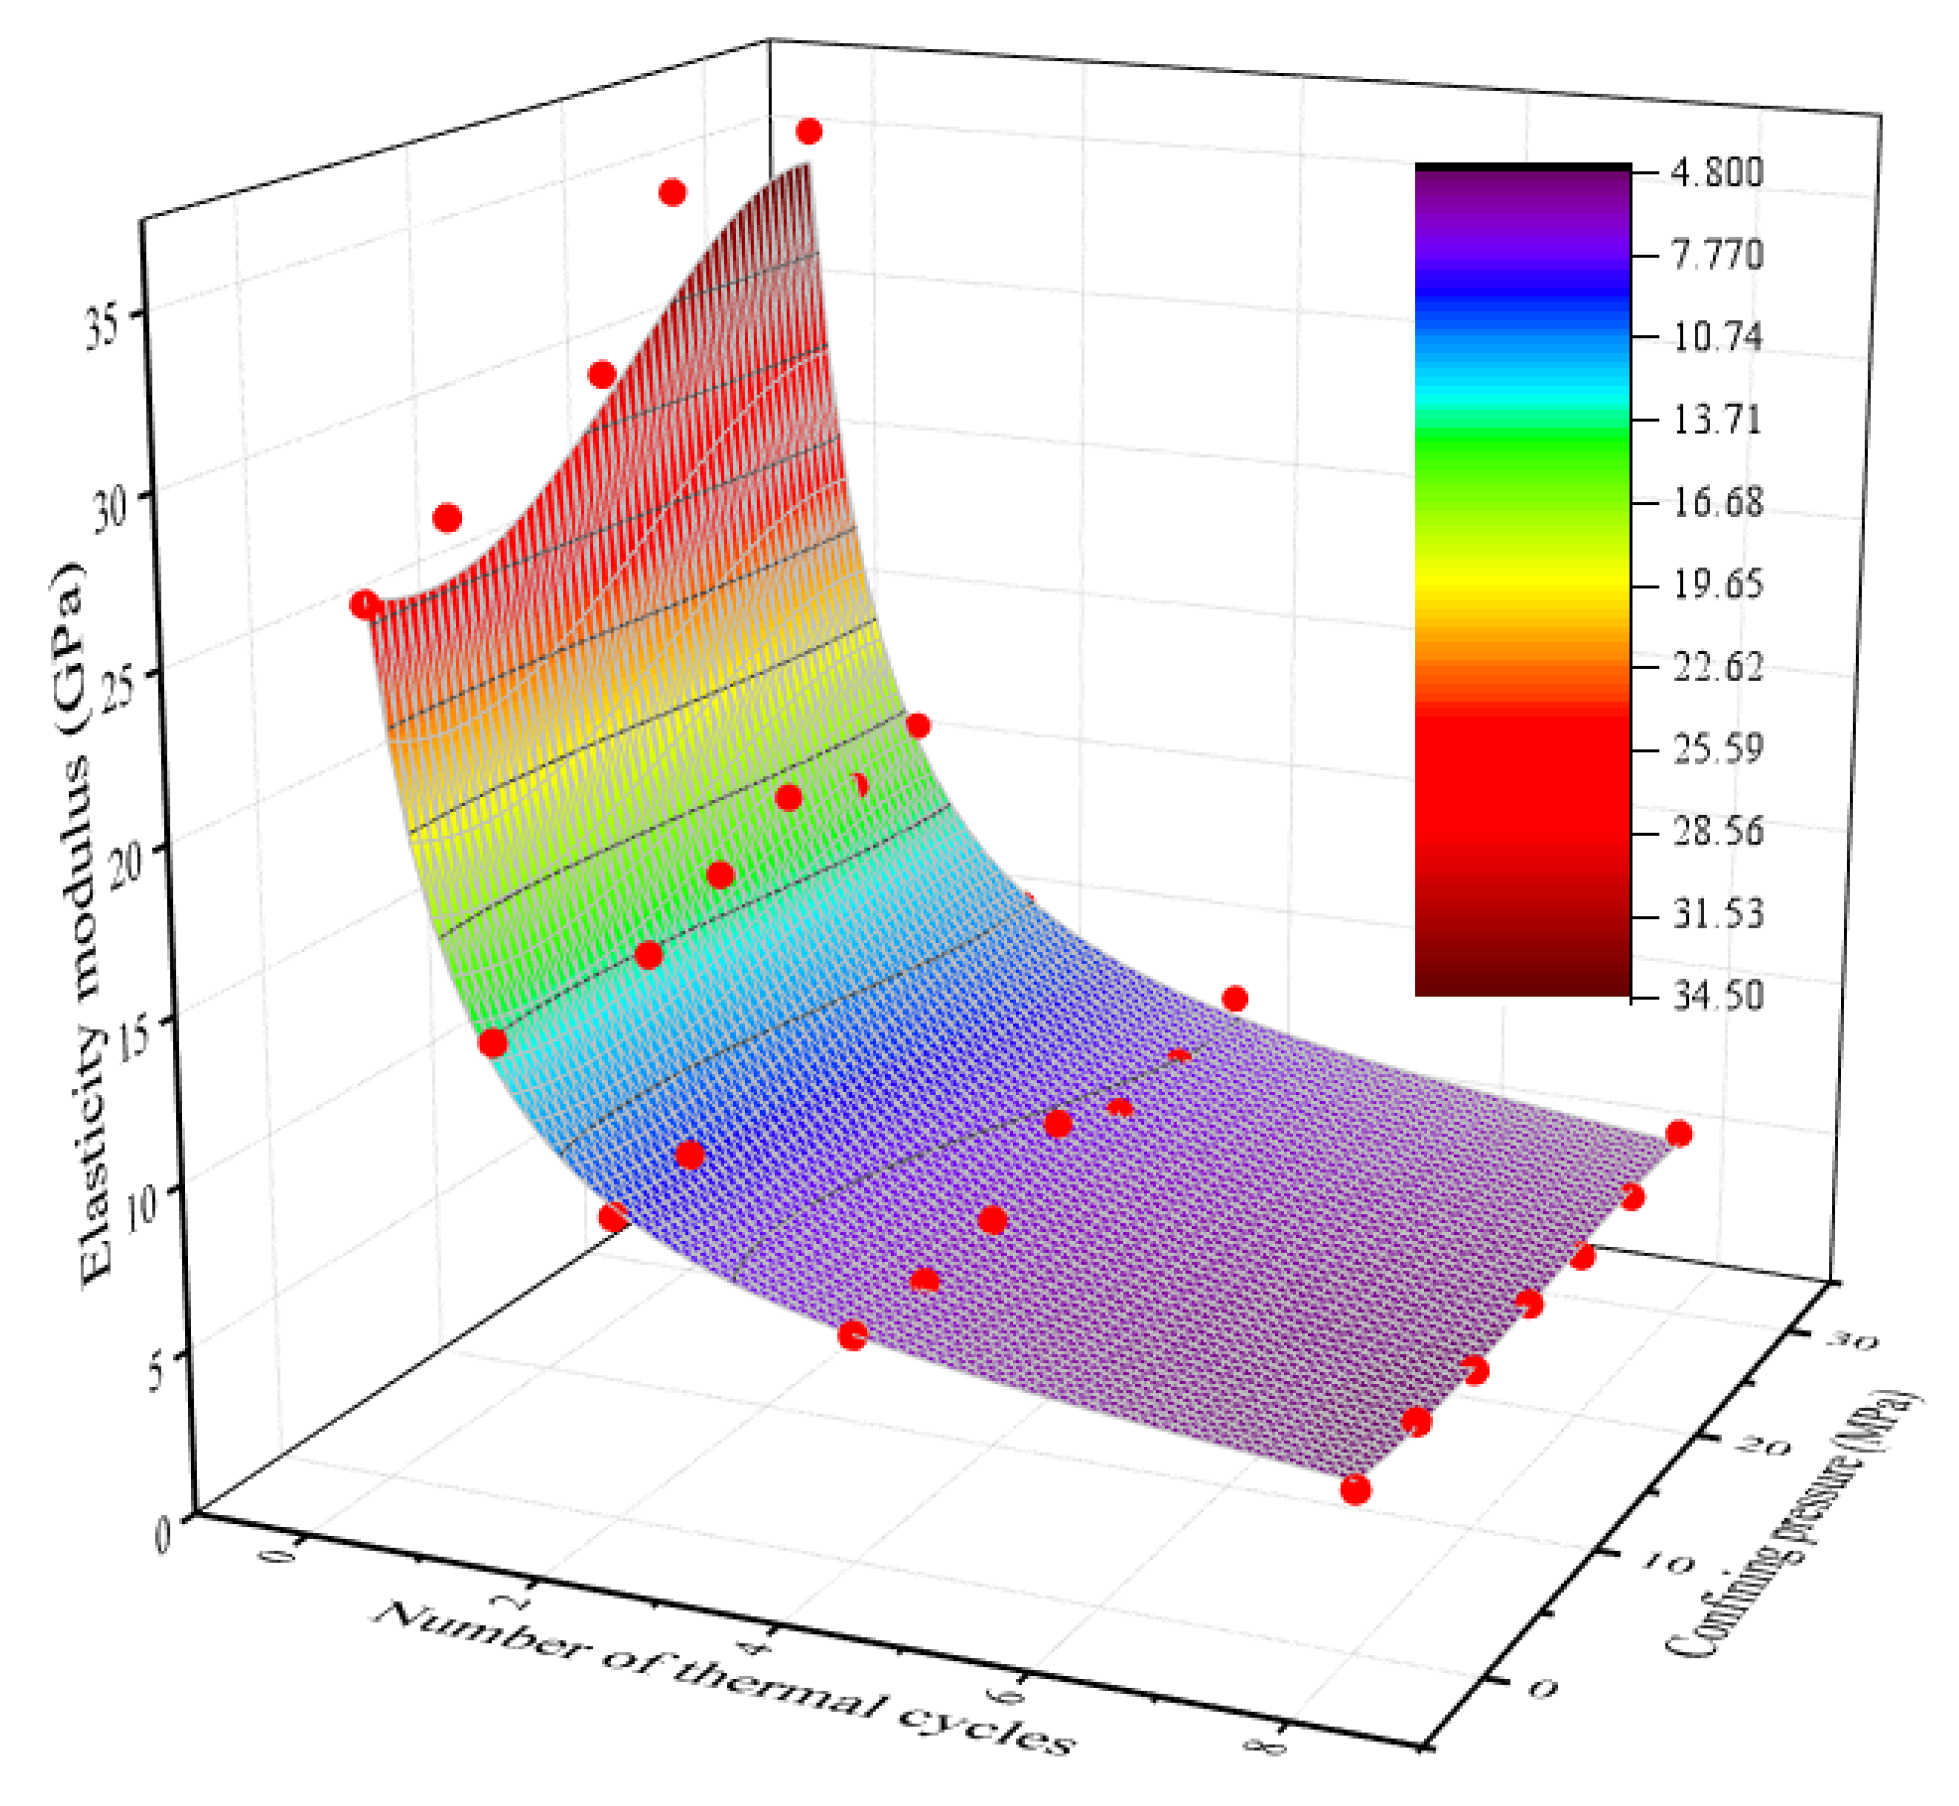
3.1.4. Analysis of Deformation Characteristics
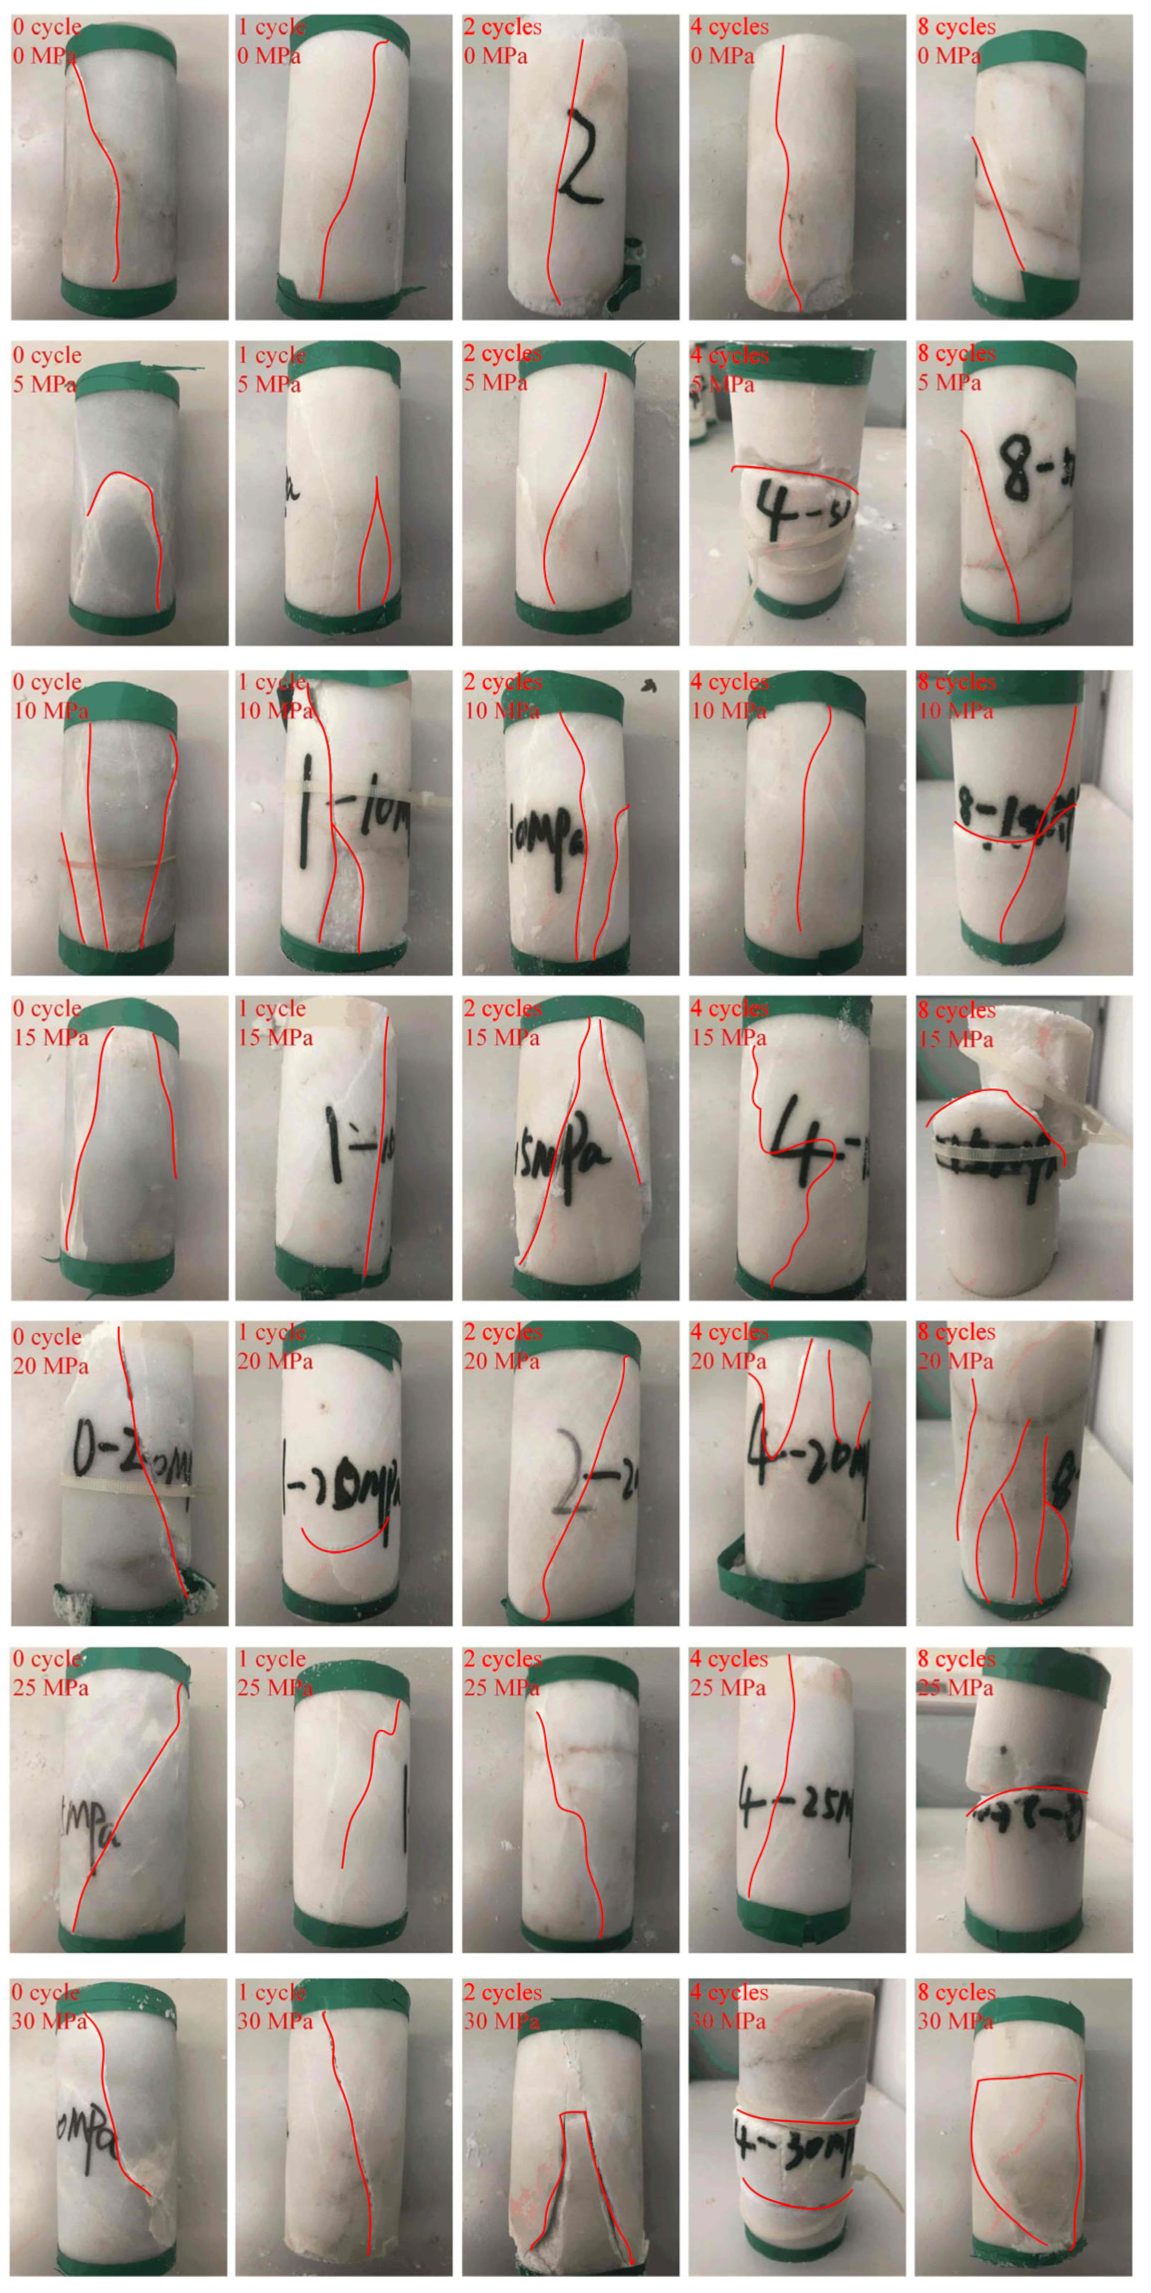
The peak strain under different conditions is shown in Figure 7. Under the same number of thermal cycles, the peak strain rises with the increase in confining pressure. With the increase in the number of thermal cycles, the peak strain of fine-grained marble increases gradually, and the growth rate shows a decreasing trend. The interval of the maximum peak strain growth rate is from zero to one thermal cycle. When the confining pressure is the same, the peak strain of the samples after an increased number of thermal cycles is always greater than a lower number of thermal cycles, except for individual discrete data points. Thermal damage and confining pressure have a great influence on peak strain. For example, the peak strain was 4.72‰ under a uniaxial compression test without thermal damage. However, under 30 MPa confining pressure after eight thermal cycles, the strain reached 30.03‰.
In this paper, the strength evolution model of thermocycling marble was established by statistical analysis of the data based on indoor tests according to Section 3.1.2. The effect of thermal cycling causes the deterioration of the macroscopic mechanical characteristics of the rocks, resulting in a decrease in mechanical property indexes such as strength.
The strength evolution model under different thermal cycling times was constructed considering the influence of the confining pressure. In a three-dimensional cartesian coordinate system, the x-axis is the number of thermal cycles, the y-axis is the confining pressure, and the z-axis is the triaxial compressive strength. By fitting the surface to the test data (Figure 8), the triaxial compressive strength evolution model of marble with different numbers of thermal cycles was obtained as follows with R2 = 0.95815:
σ c = 102.20278 18.41821 n + 3.01708 c + 1.32175 n 2 0.01358 c 2 0.19291 c n
where σc is the triaxial compressive strength (MPa); n is the number of thermal cycles; and c is the confining pressure (MPa).
The elastic modulus of rock is an important index to reflect its properties. The elastic modulus of the samples, after experiencing a different number of thermal cycles and under different confining pressures, is shown in Figure 9. The change rule of the elastic modulus is similar to peak stress. At zero confining pressure, the elastic modulus under eight thermal cycles was 18.30% of the undamaged one. The elastic modulus under 30 MPa confining pressure was 1.35 times that of the uniaxial compression test while there was no heat damage. According to the law of growth rate, it can be roughly divided into two sections; namely, the one with low confining pressure (0–15 MPa) increasing rapidly and the other with medium-high confining pressure (15–30 MPa) increasing slowly, which reflects the strengthening effect of the confining pressure on the elastic modulus of marble. After the first thermal cycle, the elastic modulus of marble decreased significantly, then the rate of decline slowed down.
Considering the influence of confining pressure, the elastic modulus evolution model under different thermal cycles was constructed. In the three-dimensional cartesian coordinate system, the x-axis is the number of thermal cycles, the y-axis is the confining pressure, and the z-axis is the elastic modulus. Through surface fitting to the test data (Figure 10), the triaxial compressive strength evolution model of marble with different thermal cycles was obtained as follows with R2 = 0.98039:
E = 26 . 38718 + 0 . 50408 n 0 . 47751 c + 0 . 04709 c 2 ( 9 . 30699 × 10 4 ) c 3 1 + 1 . 16128 n 0 . 11915 n 2 + 0 . 0066 n 3 0 . 00652 c + ( 5 . 2046 × 10 5 ) c 2
where E is the elastic modulus (GPa); n is the number of thermal cycles; and c is the confining pressure (MPa)

3.1.5. Failure Mode

Figure 11 shows the failure mode of the marble that underwent thermal cycles under different confining pressures, and the red line highlights the surface crack of the rock sample.
The samples showed brittle fracture failure before two thermal cycles, and the surface fractures of the rock samples were not obvious. After two thermal cycles, cracks appeared on the surface of the samples more clearly, indicating that the rock experienced plastic failure.
When confining pressure was applied, the samples that underwent one thermal cycle treatment showed brittle fracture failure. As for the rock samples treated with two or four thermal cycles, they exhibited brittle fracture failure or brittle shear failure under a confining pressure of less than 30 MPa and ductile failure at 30 MPa.

3.2. Energy Evolution Characteristics

Rock loading is a process of energy input, accumulation, dissipation, release, and transformation. Assuming that no heat exchange occurs, then part of the work performed by external forces accumulates in the elastic deformation energy in the rock, and the other part is dissipated in the plastic deformation energy and damage energy.
When the elastic deformation accumulated inside reaches the energy storage limit of the rock, the rock will be damaged and releases energy to the outside. The process from rock deformation to unstable failure is manifested as strain energy generated by the work of external forces, energy conversion, and the balance of the rock interior and external output. It is significant to understand the damage evolution of rock and the change rules of the total input energy, elastic strain energy, and dissipated energy in the deformation and failure process of the rock; their densities are named Ut, Ue, and Ud. At the same time, describing the mechanical properties and damage characteristics of rock from the perspective of energy is necessary.
The rock element deforms under external forces, assuming that there is no heat exchange between the loading process and the outside world [20,21]. According to the first law of thermodynamics:
U t = U d + U e
For the triaxial compression loading test, the above formula can be written as:
U e = 1 2 E t σ 1 2 + 2 σ 3 2 2 ν t 2 σ 1 σ 3 + σ 3 2
The triaxial loading test shows that after reaching the determined hydrostatic stress, σ1 will increase and continuously generate compression deformation and positive work on the rock sample. However, the expansion deformation mainly occurs in the lateral direction, and the work performed by σ3 to the rock sample is negative. Ut converted into rock sample during the test is:
U t = 0 ε 1 t σ 1 d ε 1 + 2 0 ε 3 t σ 3 d ε 3 + 3 1 2 ν 2 E t σ 3 2
It is worth noting that the energy density calculated here is input, accumulated or dissipated in the axial and lateral directions, and is calculated from the hydrostatic stress state. In fact, from the initial state to the hydrostatic stress state, there are also energy evolution processes in the rock samples. Considering that the energies do not directly lead to the failure of rock samples and facilitate analysis, the aspect of energy evolution is not analyzed here. So, Ut can be calculated as follows:
U t = 0 ε 1 t σ 1 d ε 1 + 2 0 ε 3 t σ 3 d ε 3

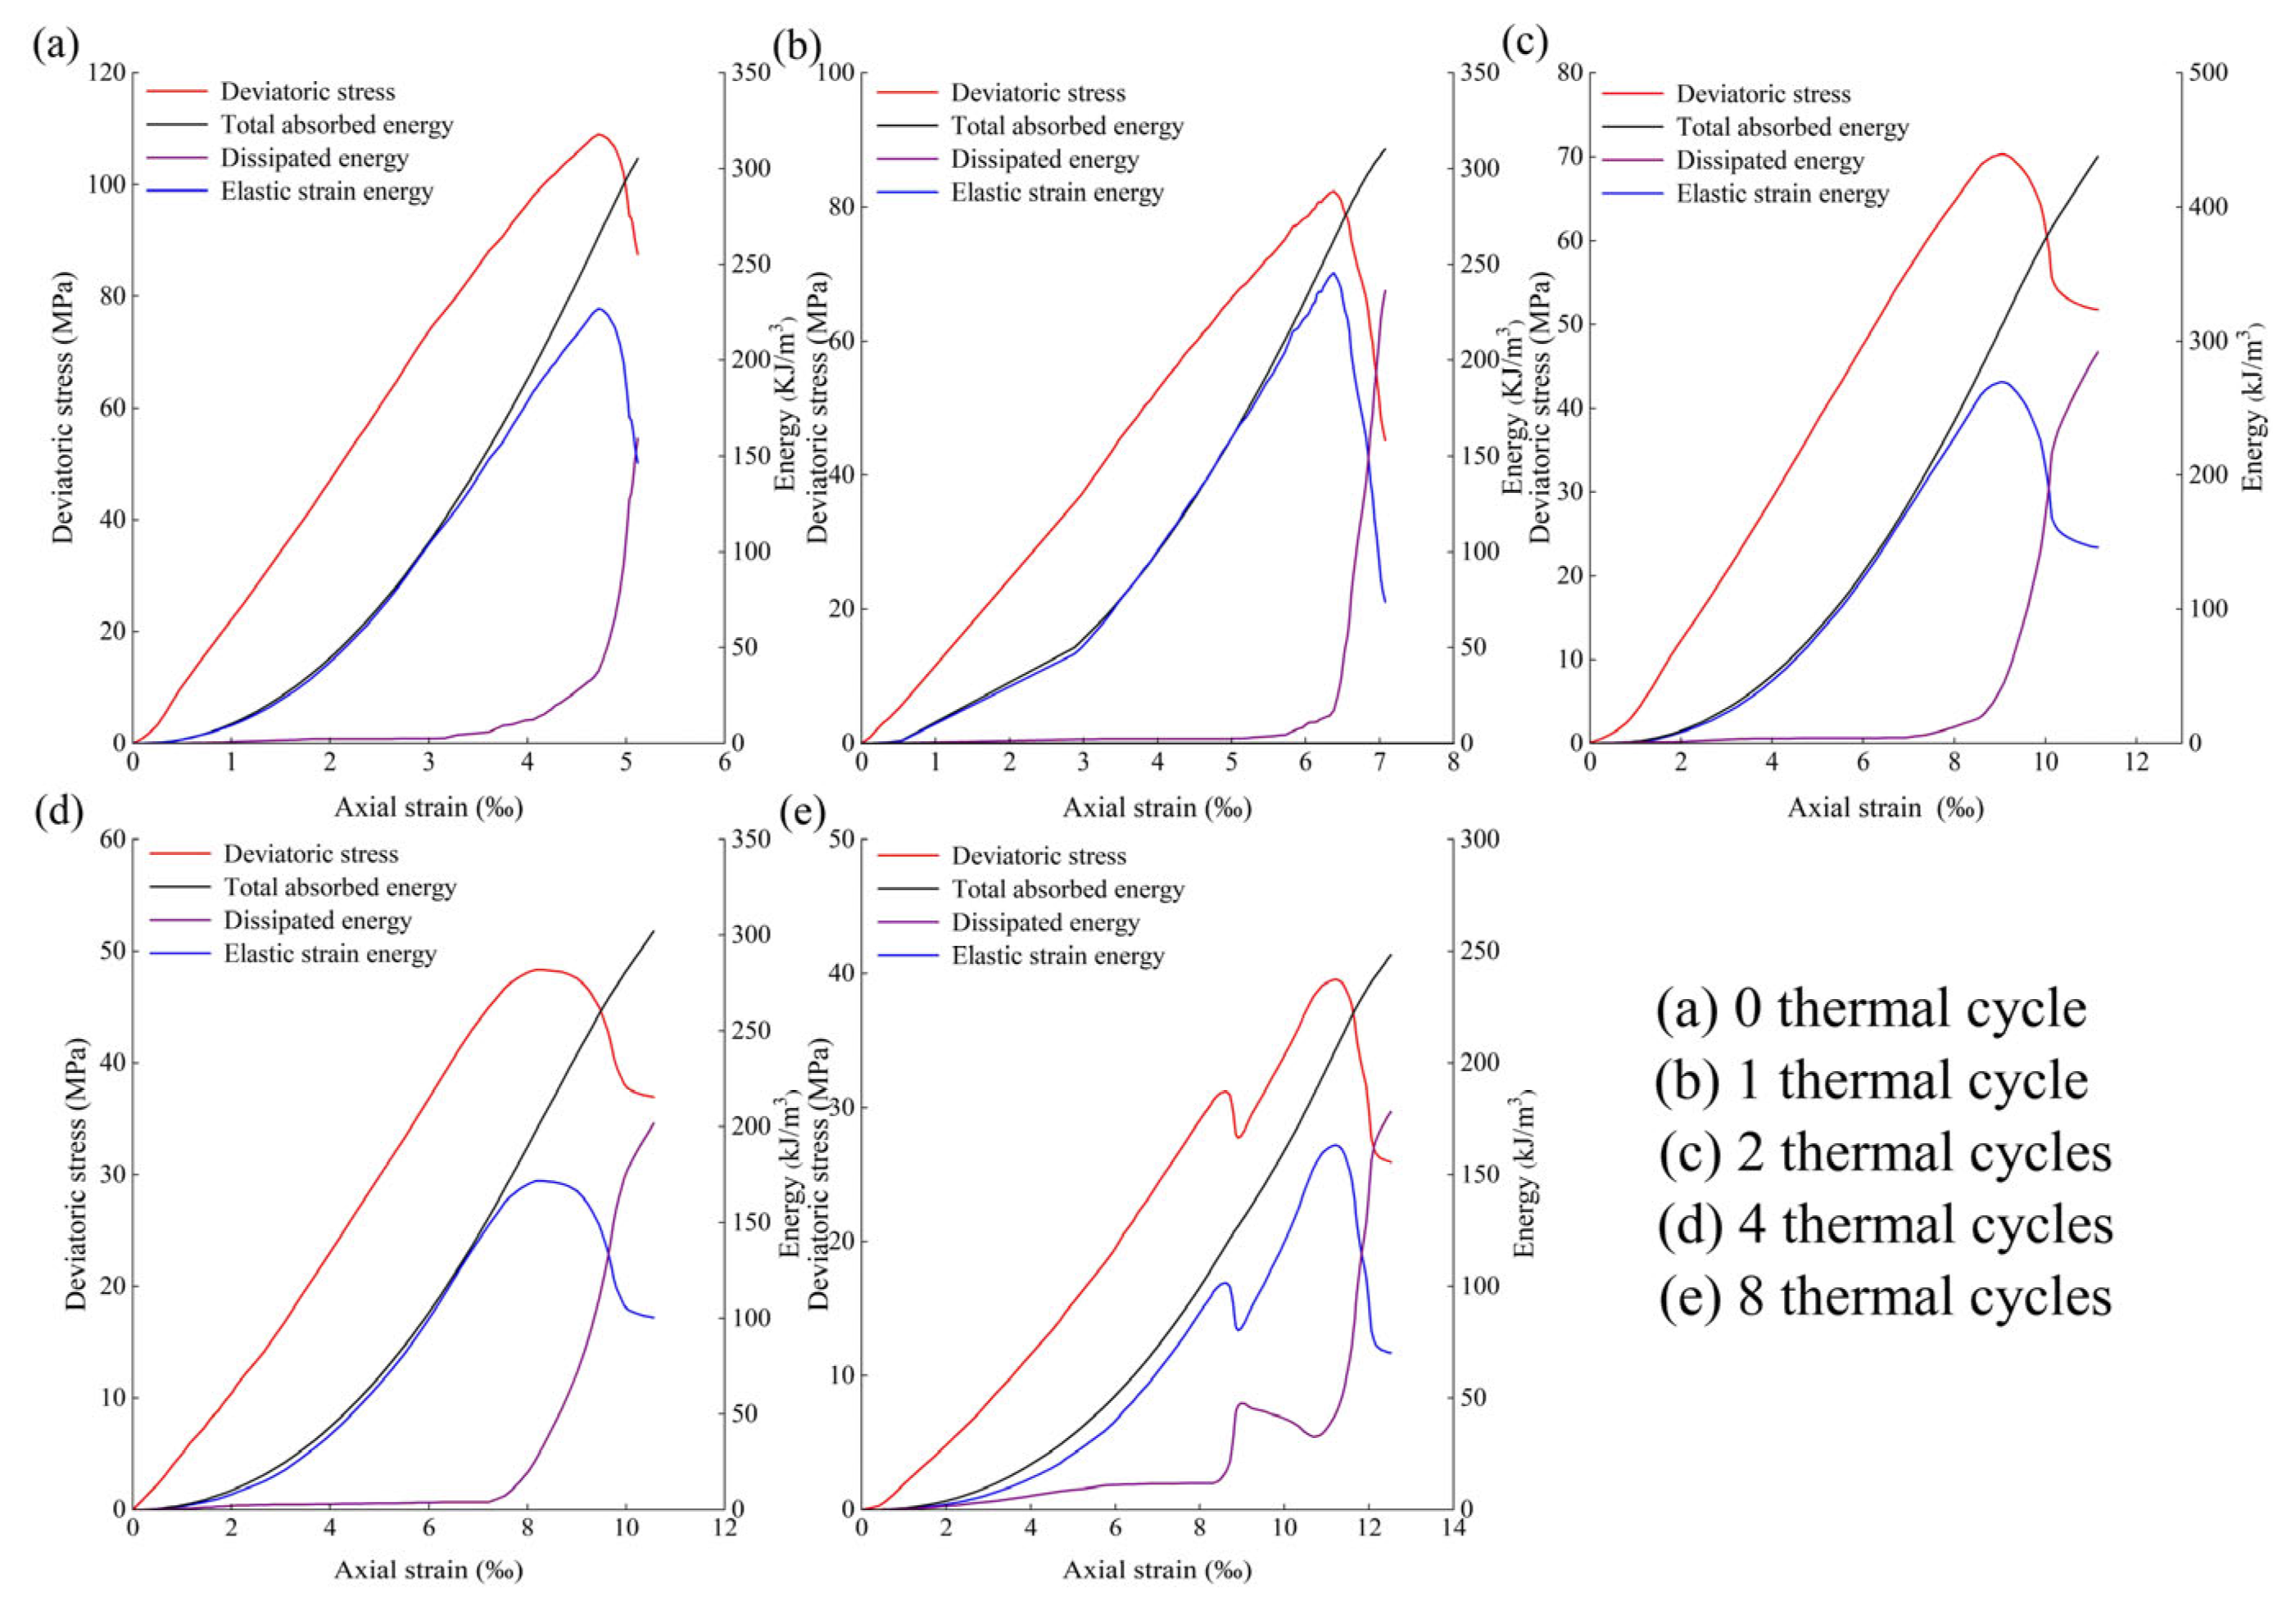
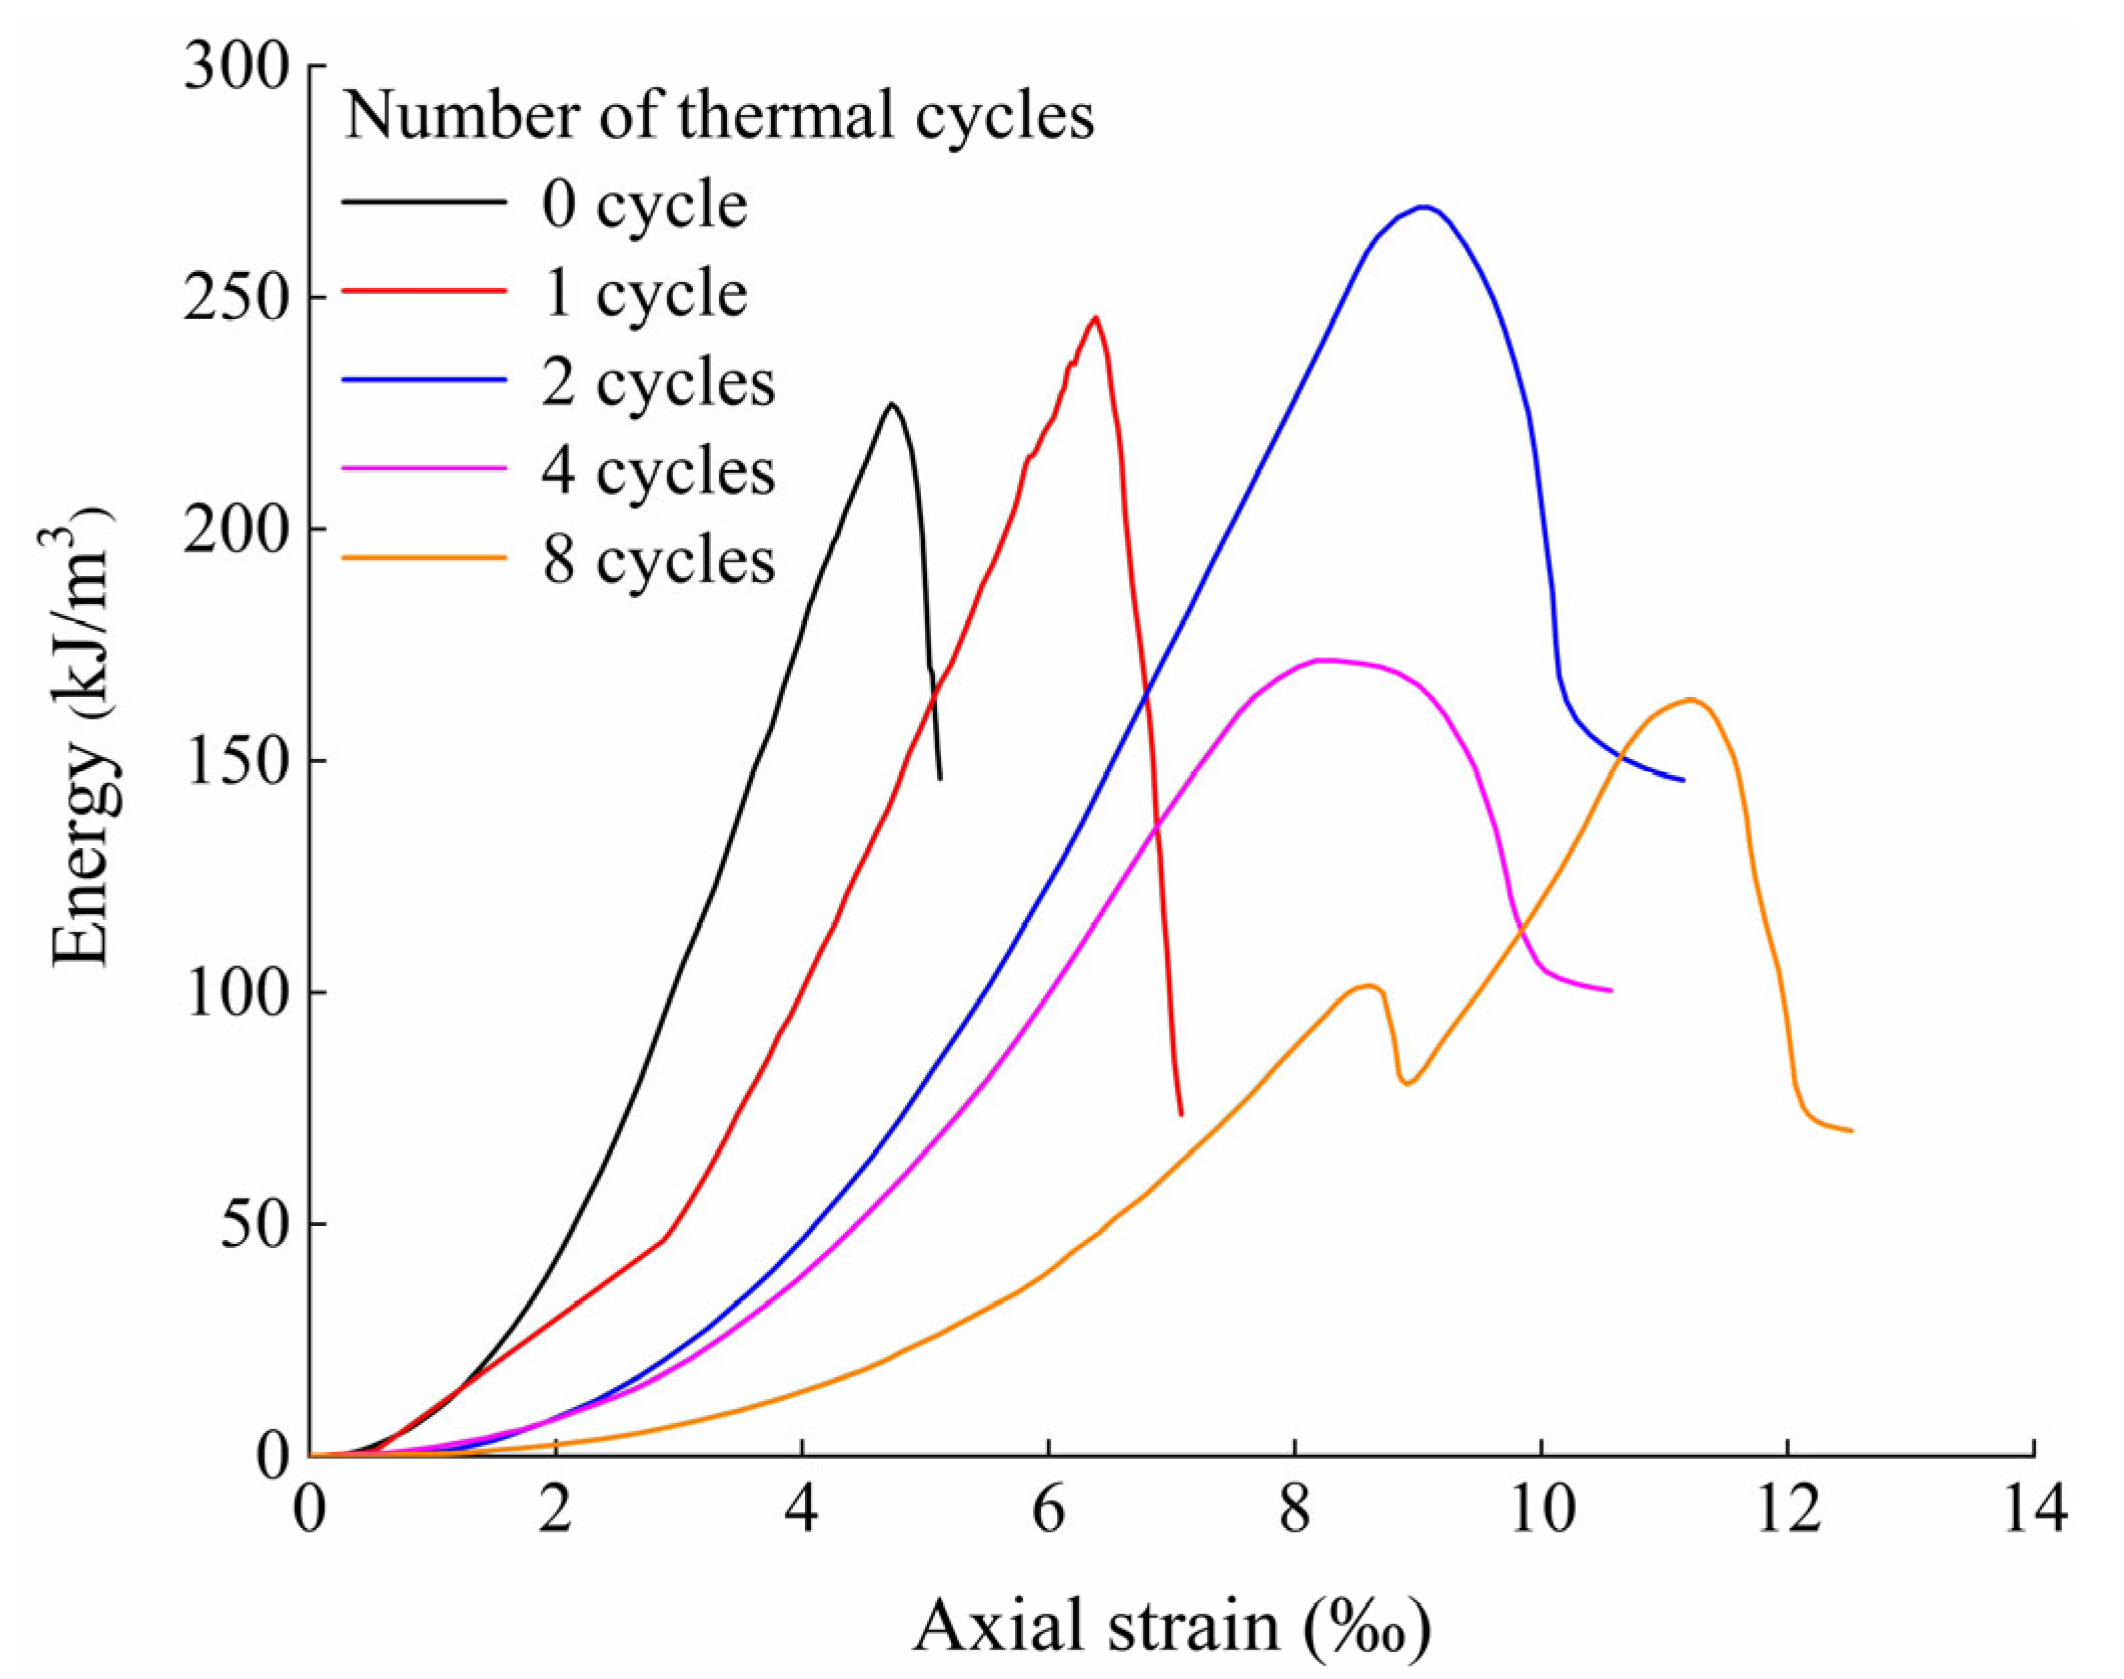
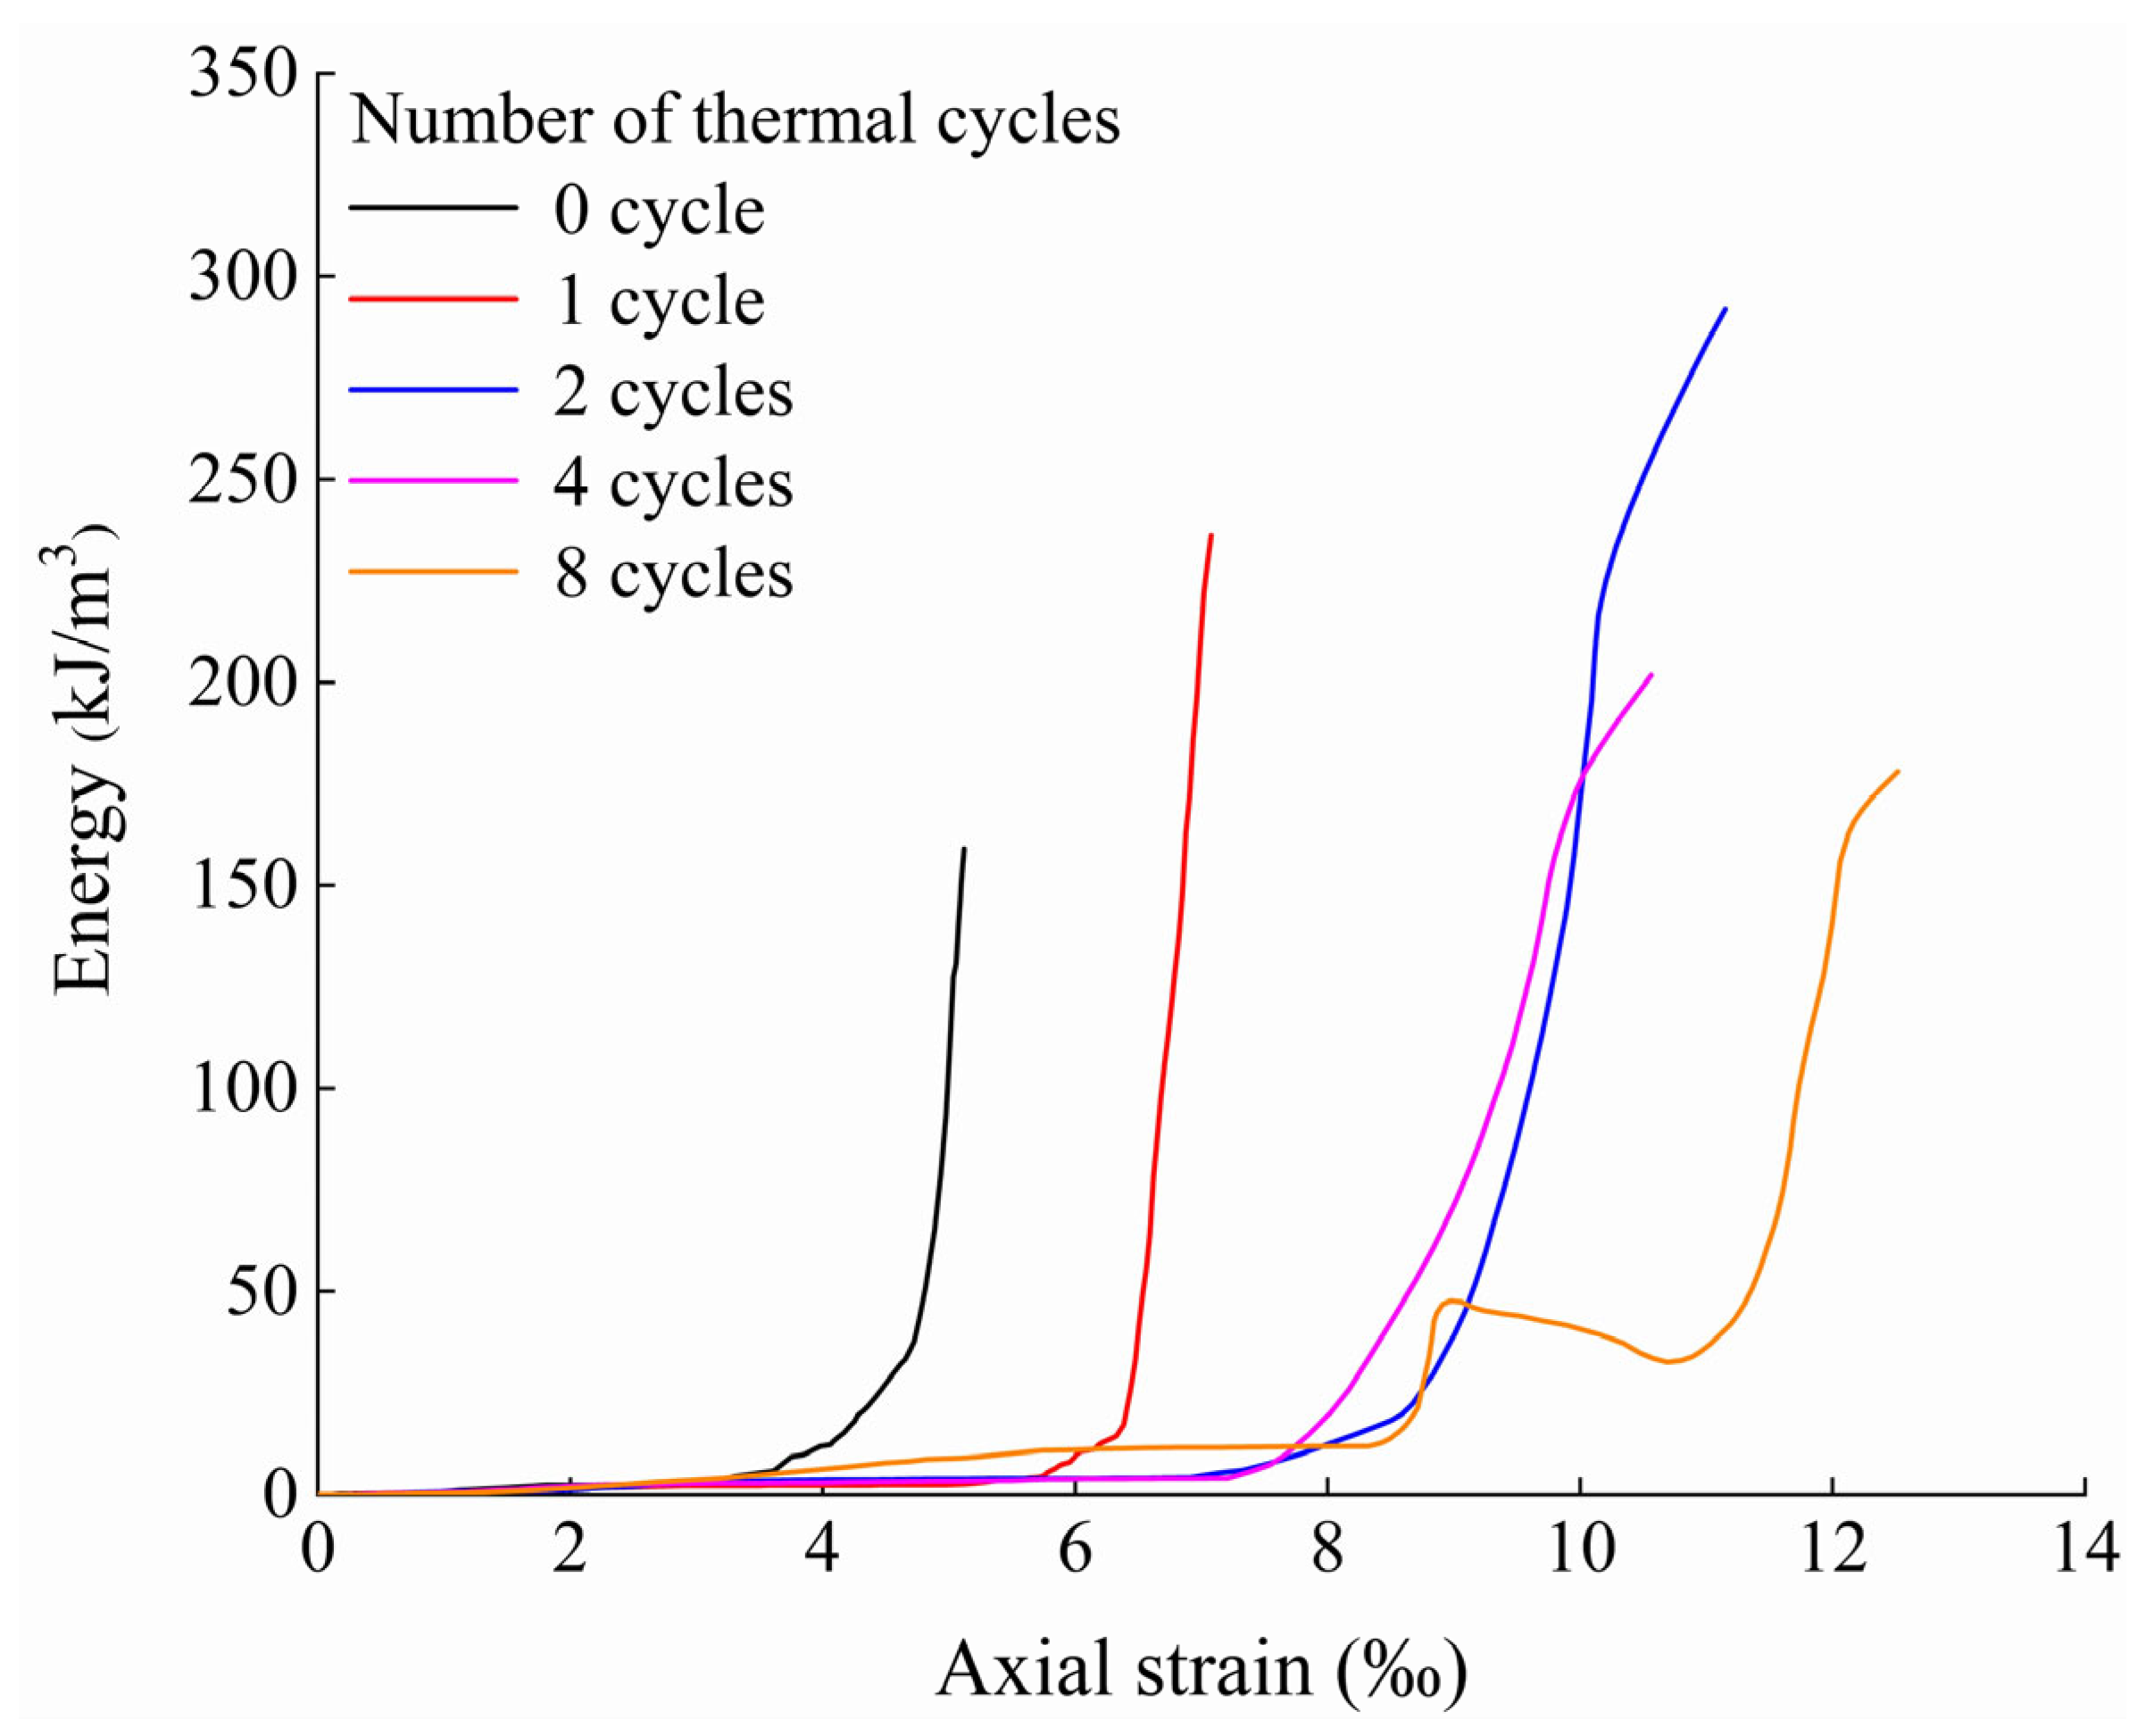
3.2.1. Energy Evolution Characteristics under Thermal Cycles

Because the amount of data is too large (Table 3), a typical example of the uniaxial compression test was used to analyze the energy evolution law under a different number of thermal cycles. Ut, Ue, and Ud under different thermal cycles are calculated according to the stress-strain curve and the formula above. Plotting these data into Figure 12, the evolution law of energy is obtained with the increase in axial strain.
For the pre-peak stage, Ut and Ud increased gradually with the rise in the axial strain at different times during the thermal cycle tests. The TAW-3000 rock test system transmits the mechanical energy to the rock samples continuously. On the one hand, the rock sample accumulates it; on the other hand, it dissipates and causes a change in the sample’s structure. The increase in elastic strain energy was much greater than dissipated, indicating that the energy behavior of the rock in this stage was mainly reflected in energy accumulation. Furthermore, the growth rate of Ue rose slowly in the crack closure stage of loading, which is due to the compression of the original void volume in the rock sample, the small primary stiffness, and the low energy conversion efficiency. When it was about to reach the failure stage, the growth rate of Ud increased suddenly, while the growth rate of Ue decreased, which means that the rock structure changed greatly, and the cracks expanded and converged significantly.
For the post-peak stage, Ue decreased sharply and Ud increased greatly. There was a peak value in both energy curves. The value of Ue corresponds to peak stress of axial stress-strain curve, and Ud increases gradually with axial strain. Therefore, the peak point of Ud corresponds to the maximum axial strain, and Ue in this stage will be converted into energy dissipation and release.
In order to compare the influence of thermal cycles on the energy evolution behavior of the rock more intuitively, the relationship between the change in Ue and Ud with the axial strain under different confining pressures is plotted in Figure 13 and Figure 14.
Ue changes under the influence of Ut and Ud. When the number of thermal cycles was low, there were few cracks in the heat-treated rock sample, so it absorbed little energy in the crack closure stage. However, due to the increase in Ut and the slight growth of damage energy, the energy storage limit presented an increasing trend when the number of thermal cycles was relatively low. When the number was higher, the thermal damage of the rock samples was aggravated, and Ud increased obviously in the crack closure stage and linear elastic stage; moreover, the lateral strain (ε3) increased, so Ut and the peak of Ue showed a downward trend.
Similar to Ue, under different thermal cycles, the curves of Ud almost overlap before reaching their peak value. As the strain grew slowly, Ud increased sharply when the rock approached failure, which indicates the occurrence of macroscopic fracture, and then, it maintained the trend and increased gradually with the strain.
According to Table 2, for marble, its energy evolution parameters (such as peak elastic energy and peak dissipation energy) and physical and mechanical parameters (such as peak strength and elastic modulus) do not follow a strict co-directional relationship. The energy evolution parameters have a good positive correlation with the confining pressure. In particular, the marble samples under different confining pressures all reached the peak elastic energy of the test group when the number of thermal cycles was two.

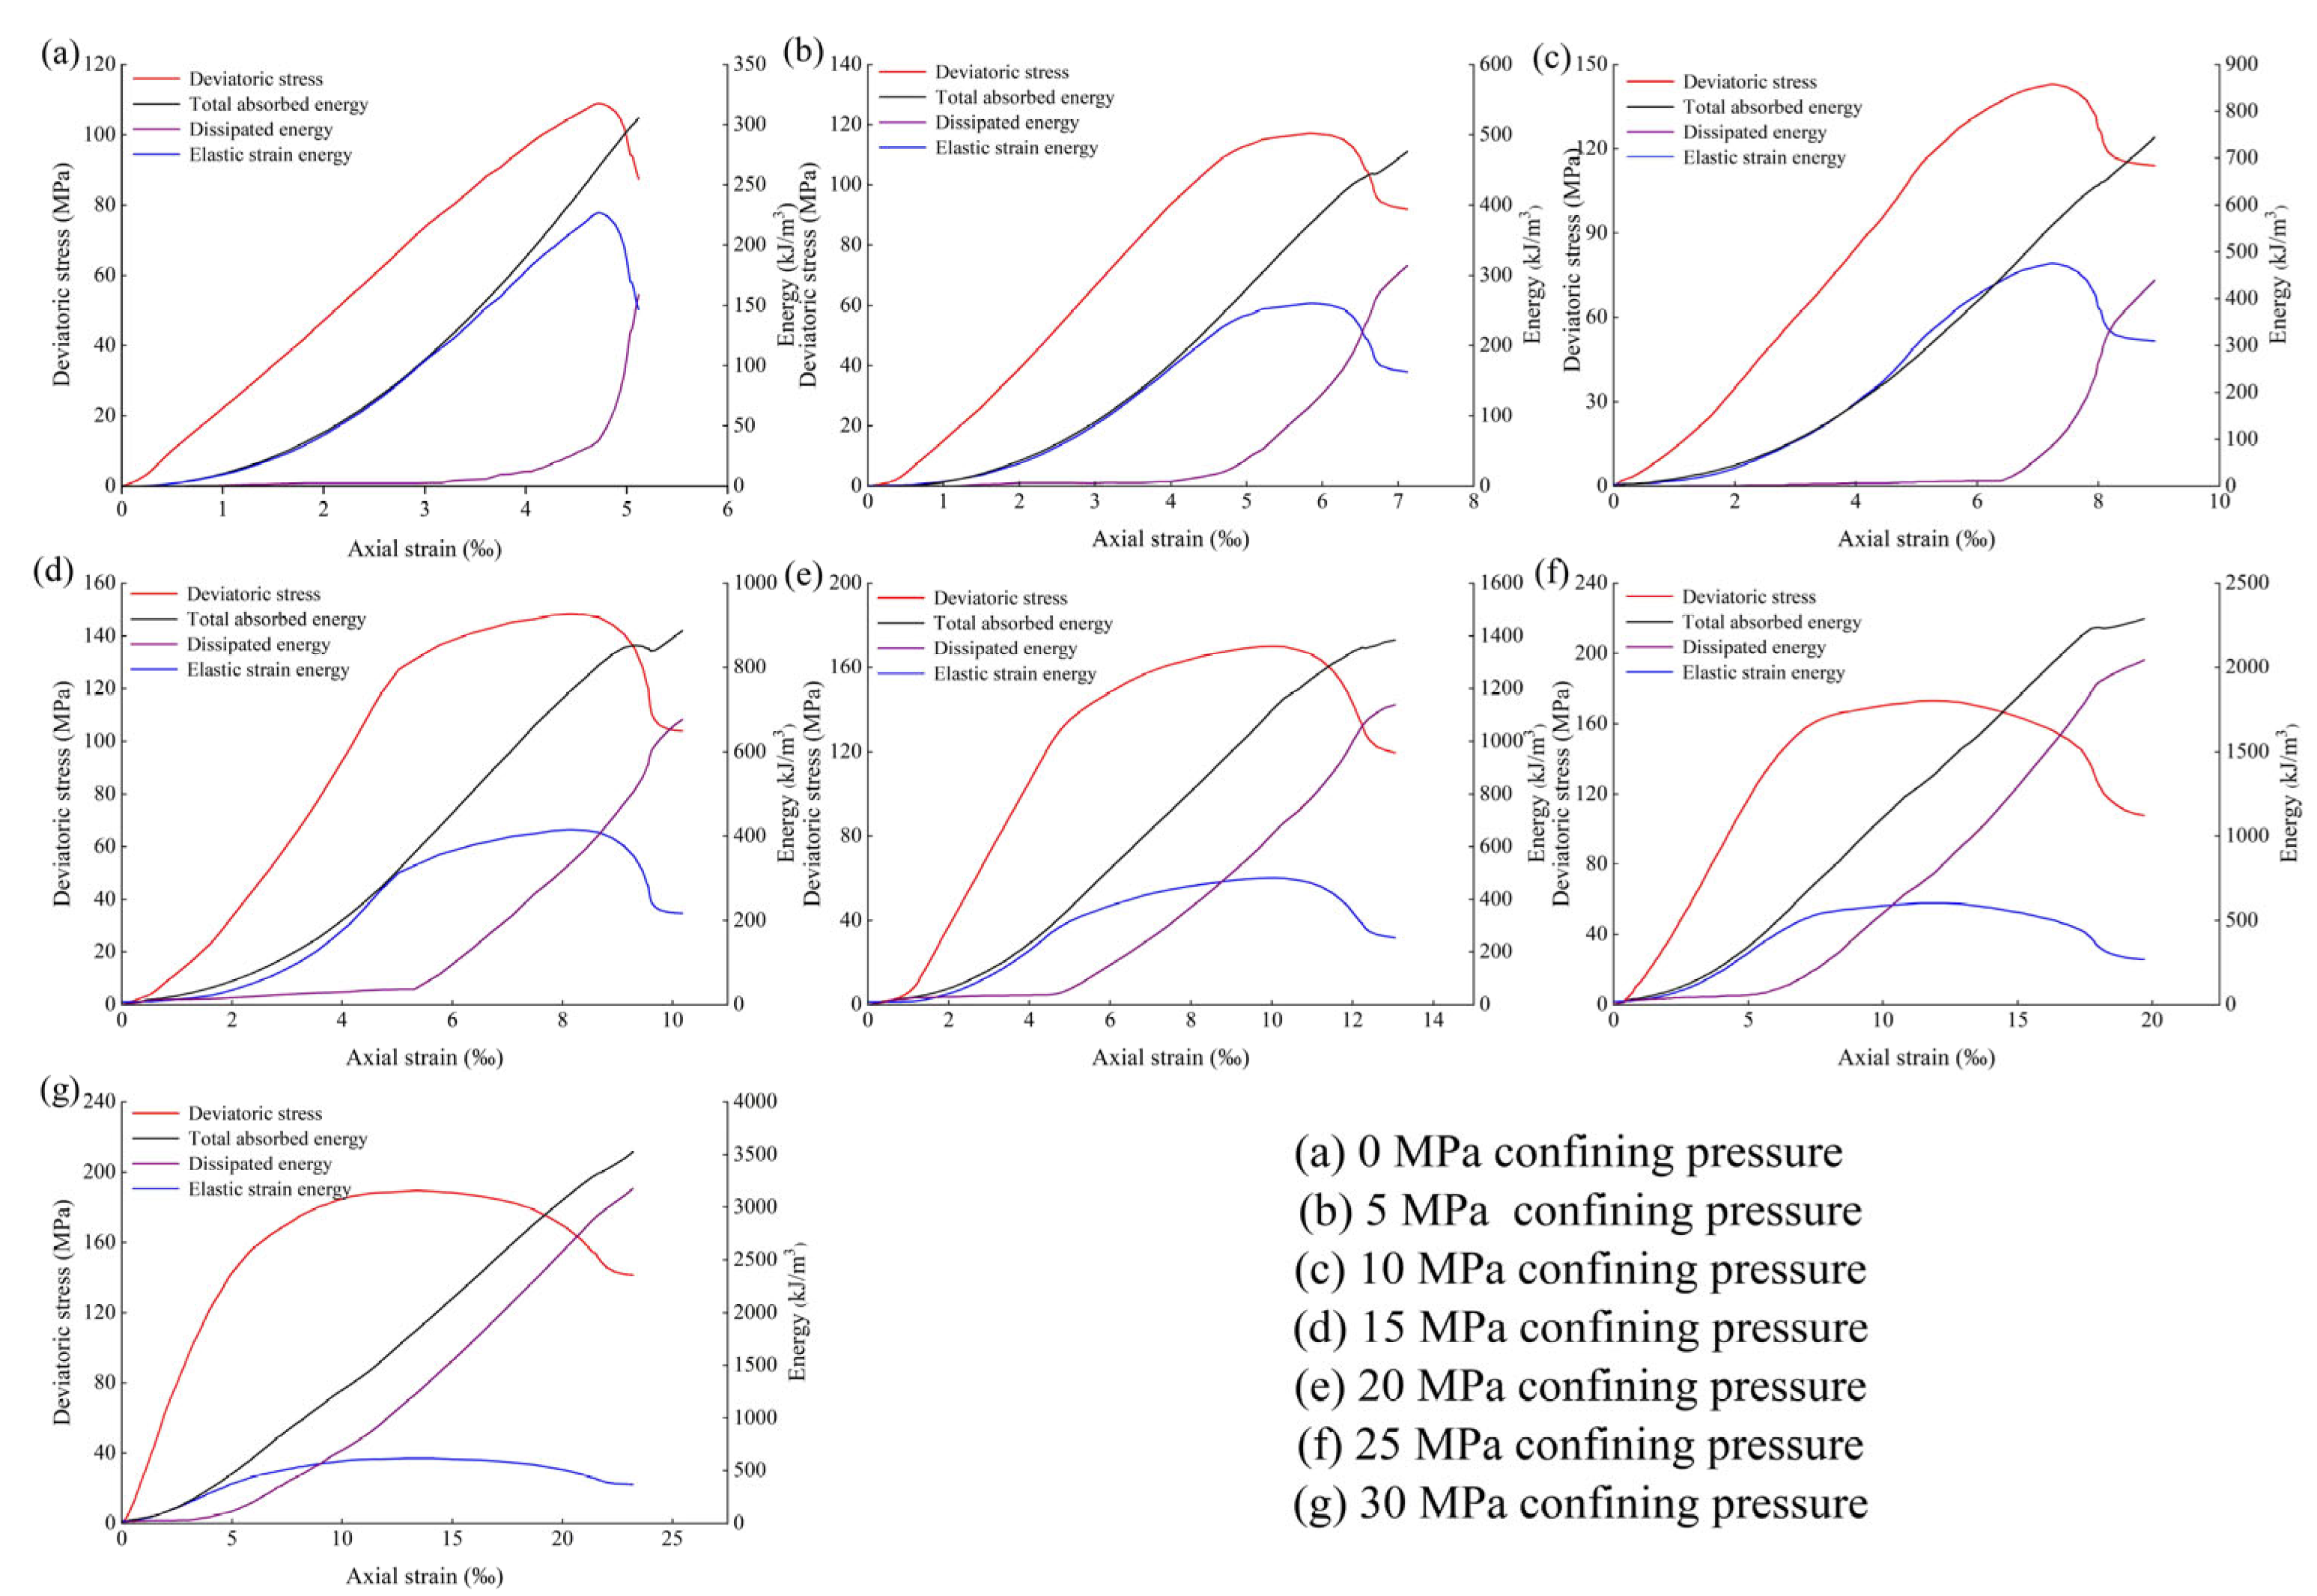
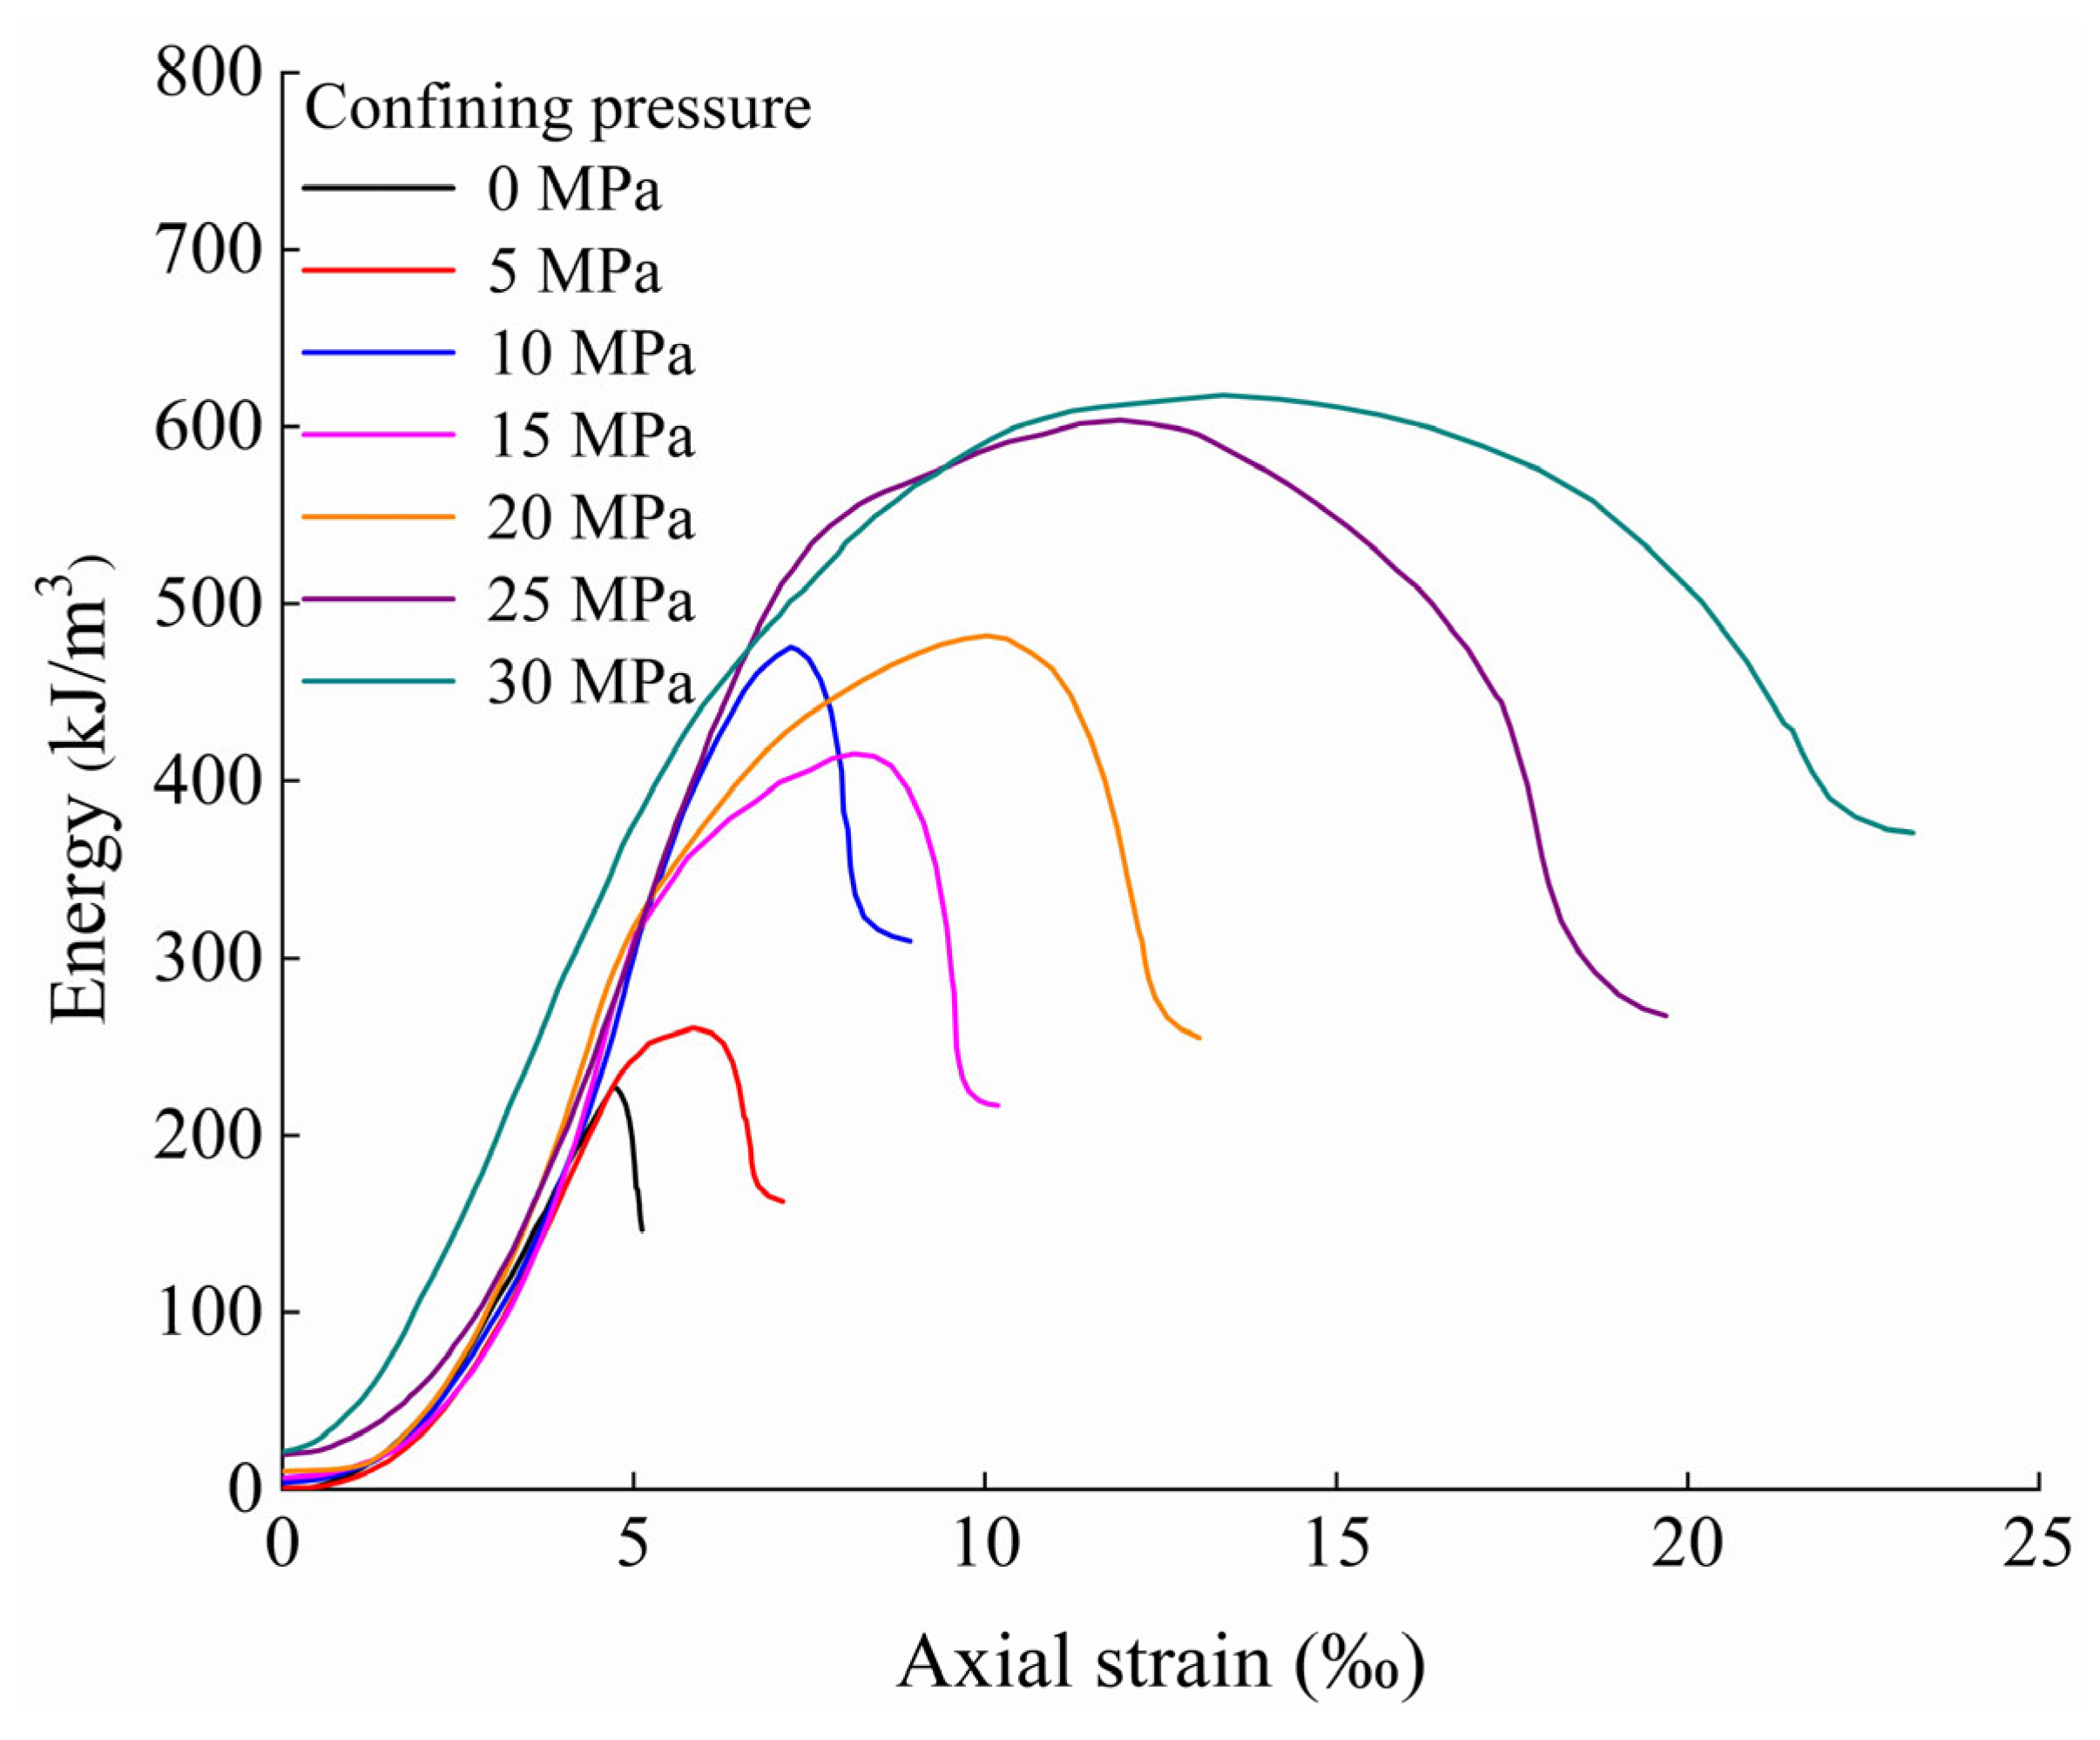
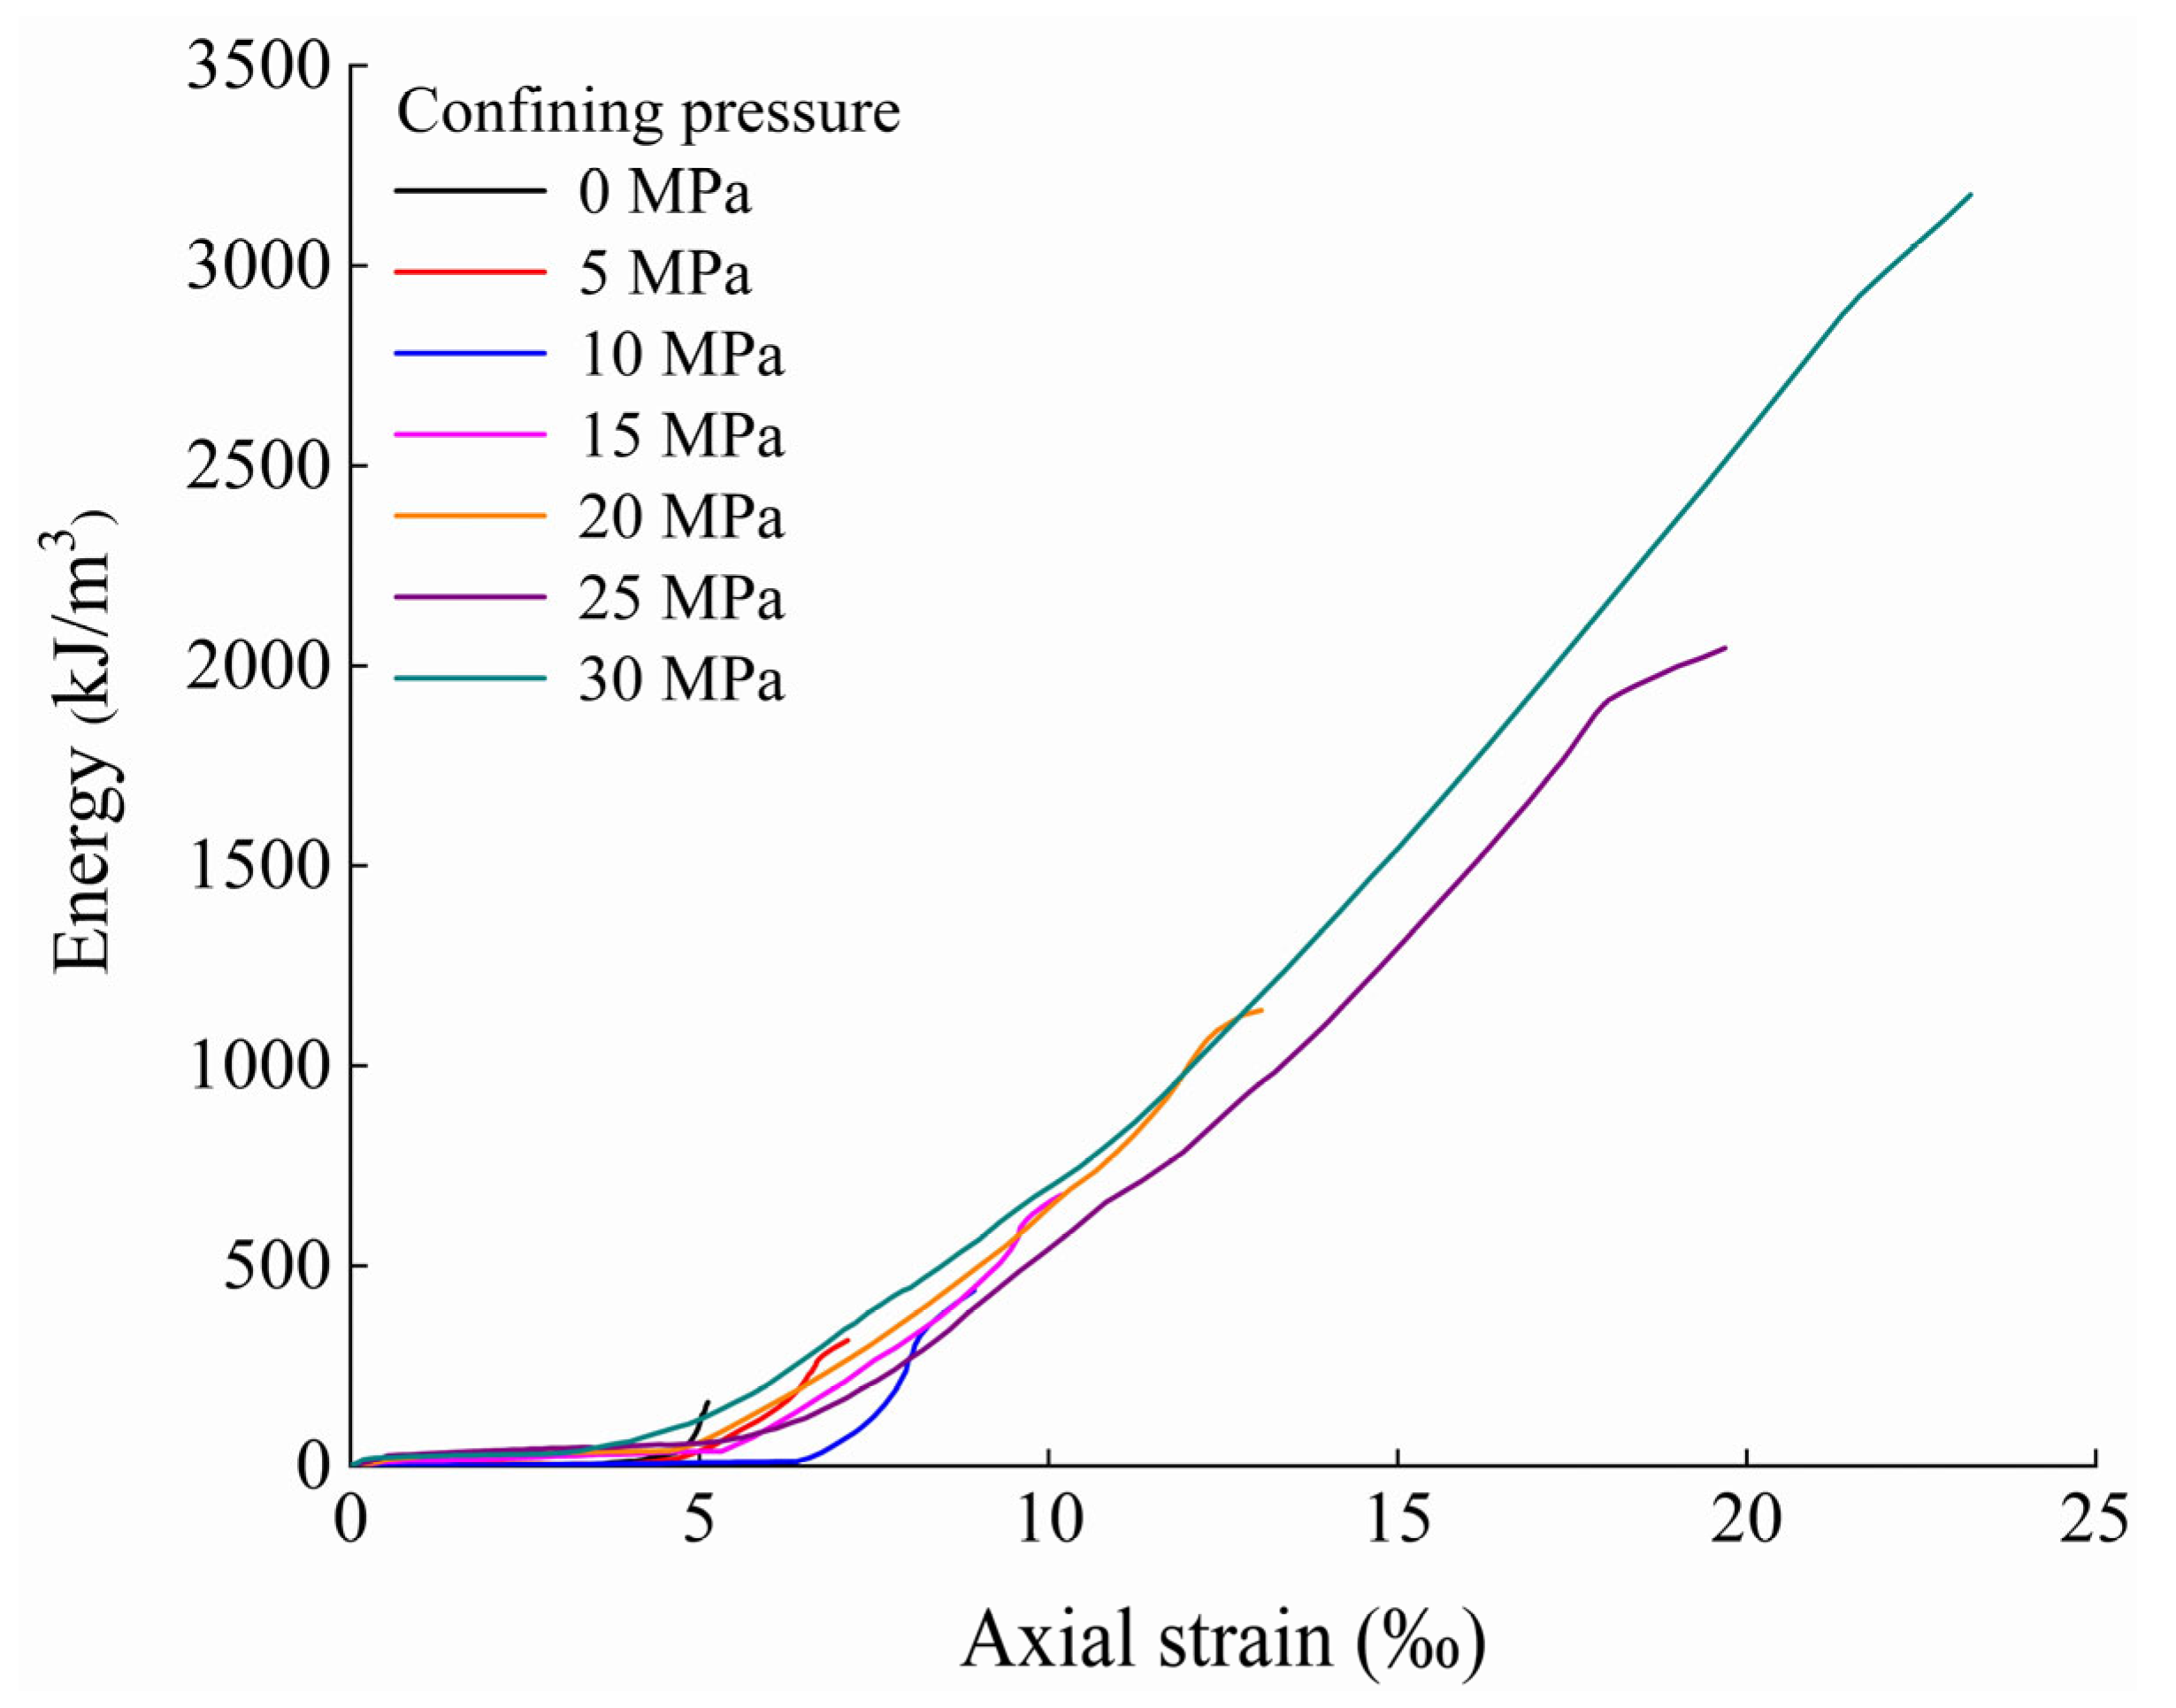
3.2.2. Energy Evolution Characteristics under Different Confining Pressures

According to the data collected during this test, the evolution law of zero thermal cycles is taken as a typical example to analyze the energy evolution law under different confining pressures, as shown in Figure 15.
Crack closure stage: The growth rate of Ue is relatively slow, and Ud almost presents a horizontal trend. This is because the primary crack in the sample is compressed, and the energy conversion efficiency is low.
Linear elastic stage: With the increase in load, Ut and Ue gradually rise. At this stage, damage and plastic deformation inside the rock are small, and Ud is small, so the curve shows a gentle trend. Most of the energy absorbed by the marble from the servo machine is stored as Ue, and the curve’s trend is almost consistent with the stress-strain curve.
Nonlinear deformation stage: At this time, the crack inside the rock becomes larger, Ud increases, and Ue decreases, but the energy inside the rock is still dominated by the stored elastic strain energy. When approaching failure, the rock structure changes greatly and fractures expand significantly, the growth rate of Ud increases obviously, but Ue decreases. Ue reaches the maximum value when axial stress reaches its peak; then, the rock is destroyed. So, Ue is converted into Ud rapidly, and the rock damage process is mainly energy release and dissipation.
Failure stage: The rock still has the capacity to bear a load, and the crack continues to grow with axial stress under the influence of confining pressure. The energy absorbed by the rock sample at this time is mainly used for the energy dissipation of crack propagation. Ue stored in the rock at this stage after rock failure is maintained at a low level, and Ud continues to increase with the extension of the crack.
The relationship between energy density and axial strain is plotted in Figure 16 and Figure 17, respectively, in order to directly compare the effects of different confining pressures on rock energy evolution behavior.
We can infer from the figures that before rock failure, Ue under different confining pressures almost coincides with the changing curve of strain. This shows that the growth law of Ue before the peak does not change with confining pressure and that the limit value of Ue is closely related to the pressure. The peak value is defined as the rock energy storage limit, and the value after the release of elastic strain energy after the peak is the residual elastic energy. With an increase in confining pressure, the energy storage limit of the rock increases greatly. Before 25 MPa, it increases significantly with confining pressure, and when it reaches 25 MPa, it tends to be stable with elastic strain energy.
Figure 16. Variation in the elastic strain energy of marble with axial strain under different confining pressures at 0 thermal cycles.
Minerals 13 00428 g016
Figure 17. Variation law of the dissipated energy of marble with axial strain under different confining pressures at 0 thermal cycles.
Minerals 13 00428 g017
The trend before the peak is very similar under various confining pressures. As the strain grows slowly to the point of approaching failure, Ud increases rapidly; this is because the higher the confining pressure, the smaller the fracture surface forms after rock failure. So, when the confining pressure is high, most of the dissipated energy is used for plastic deformation.

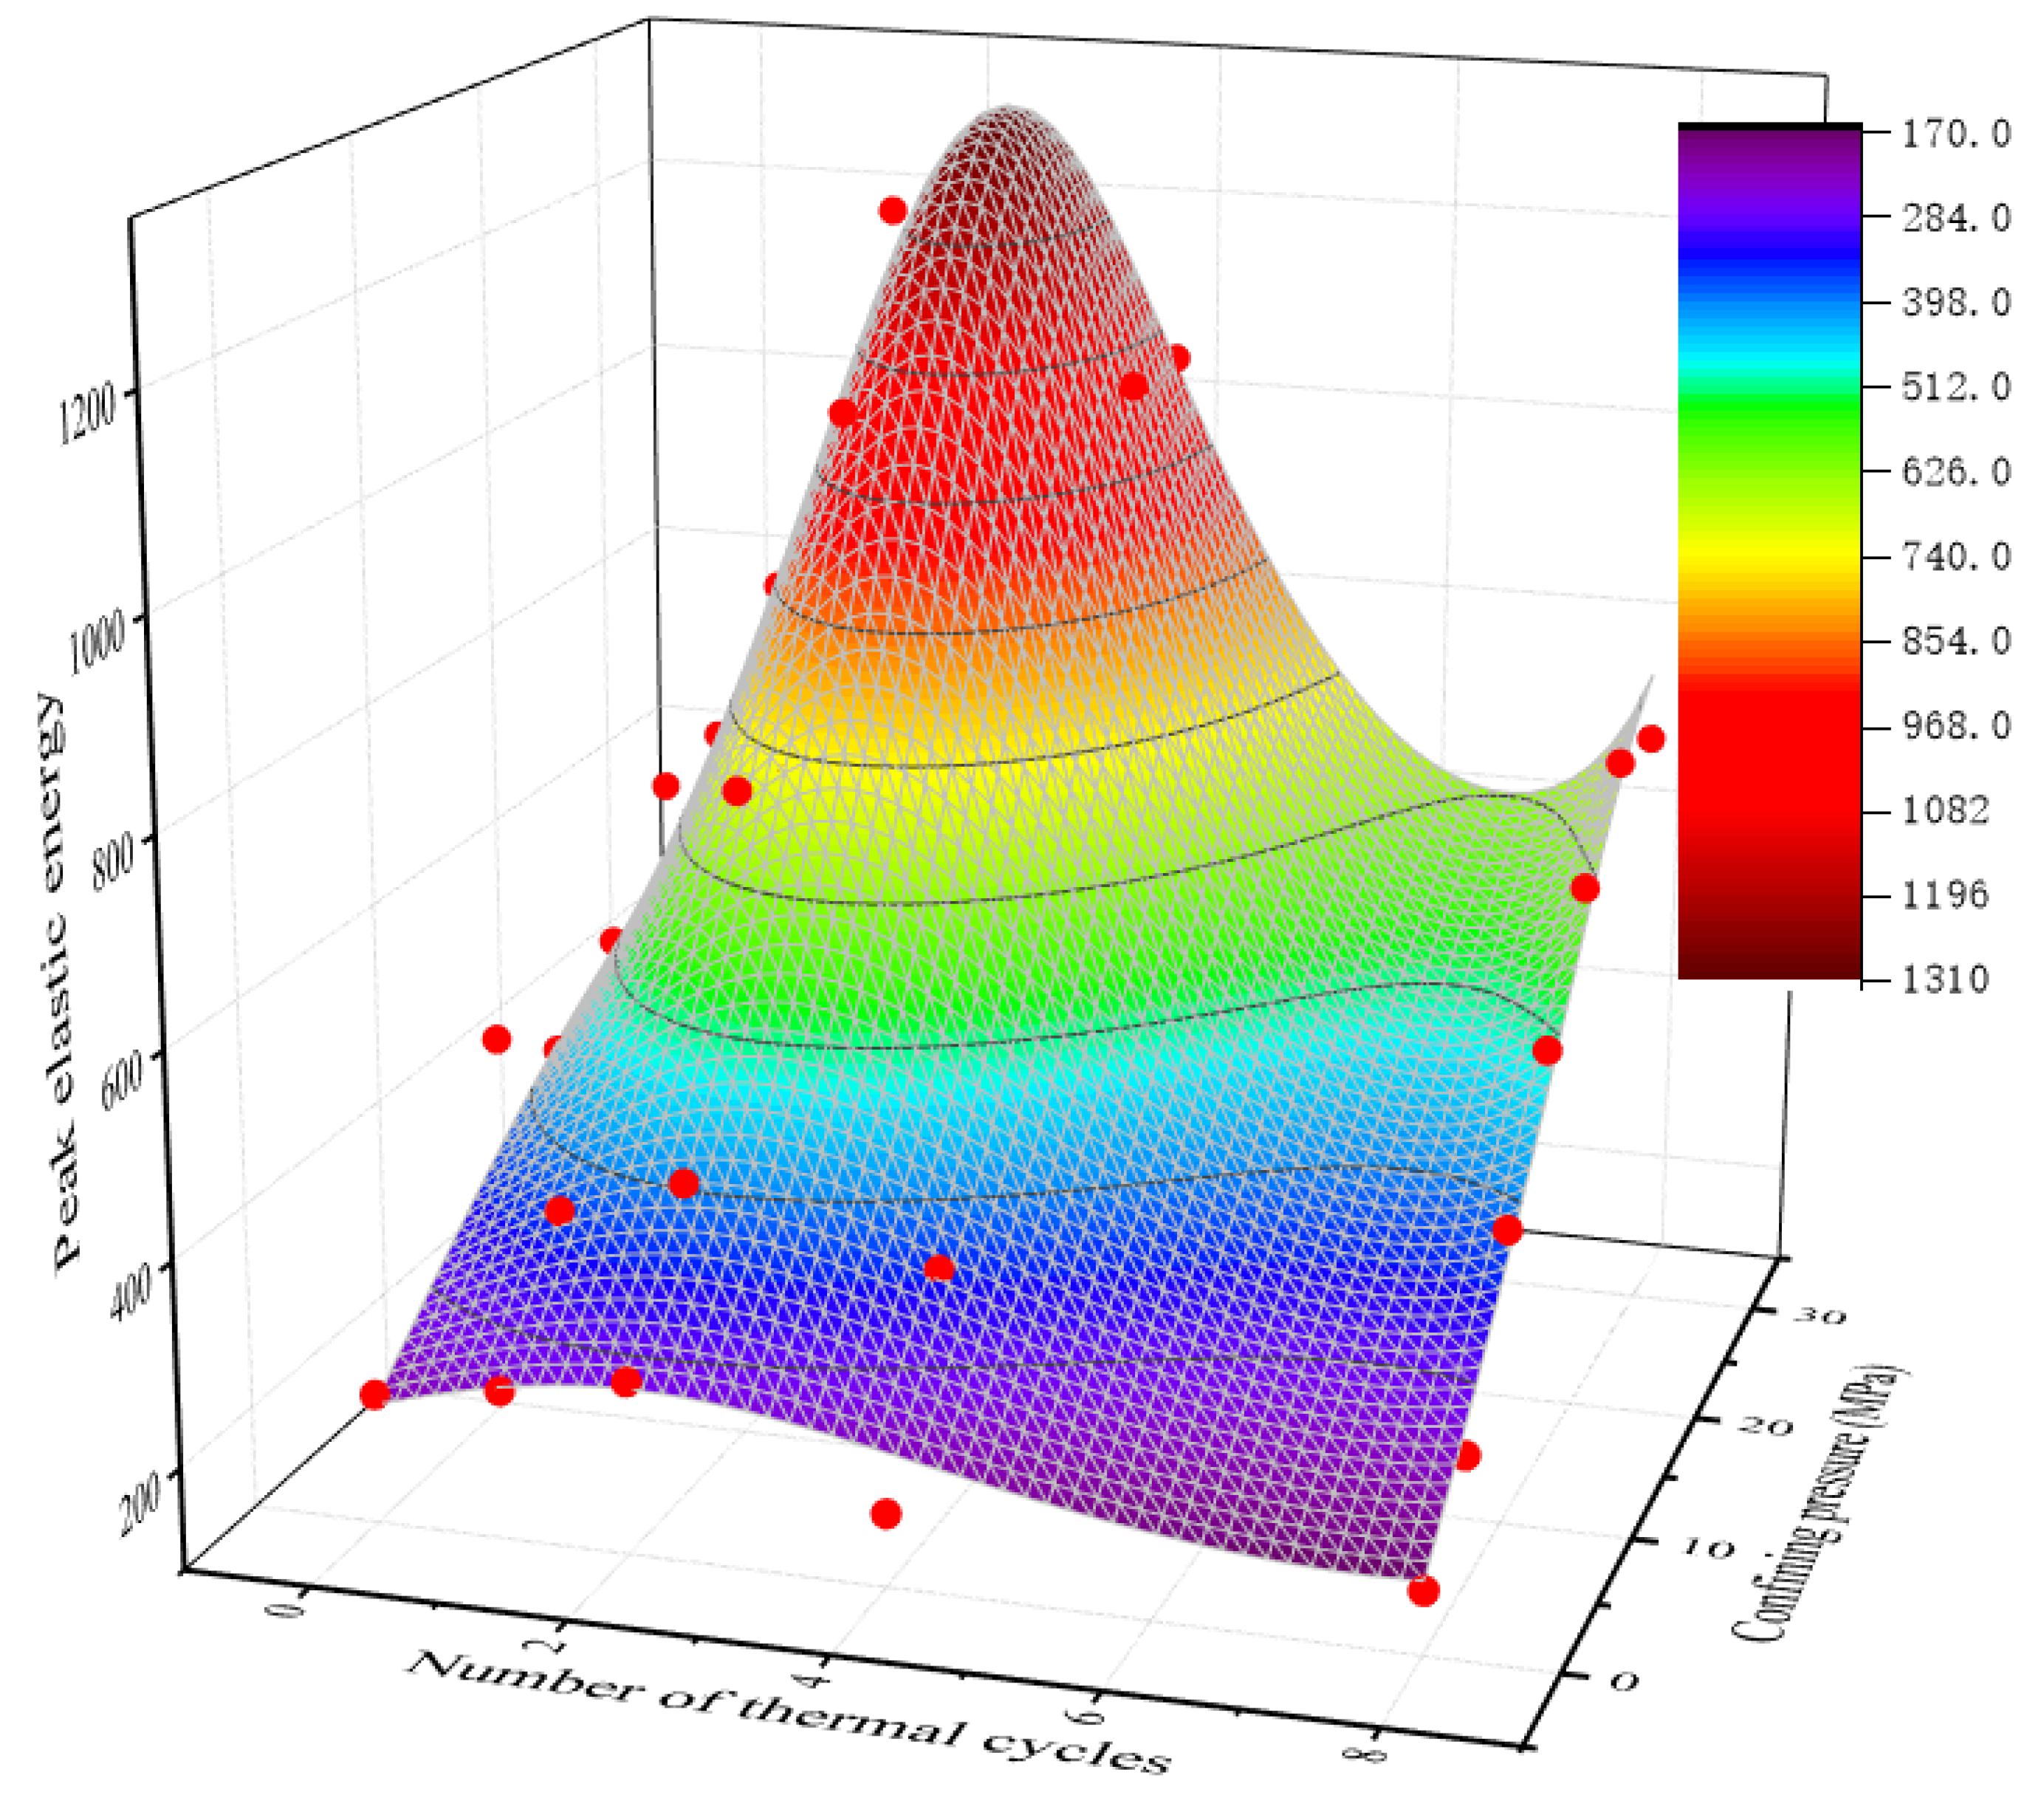
3.2.3. Peak Elastic Energy Evolution of Marble under Triaxial Compression and Thermal Cycling Conditions
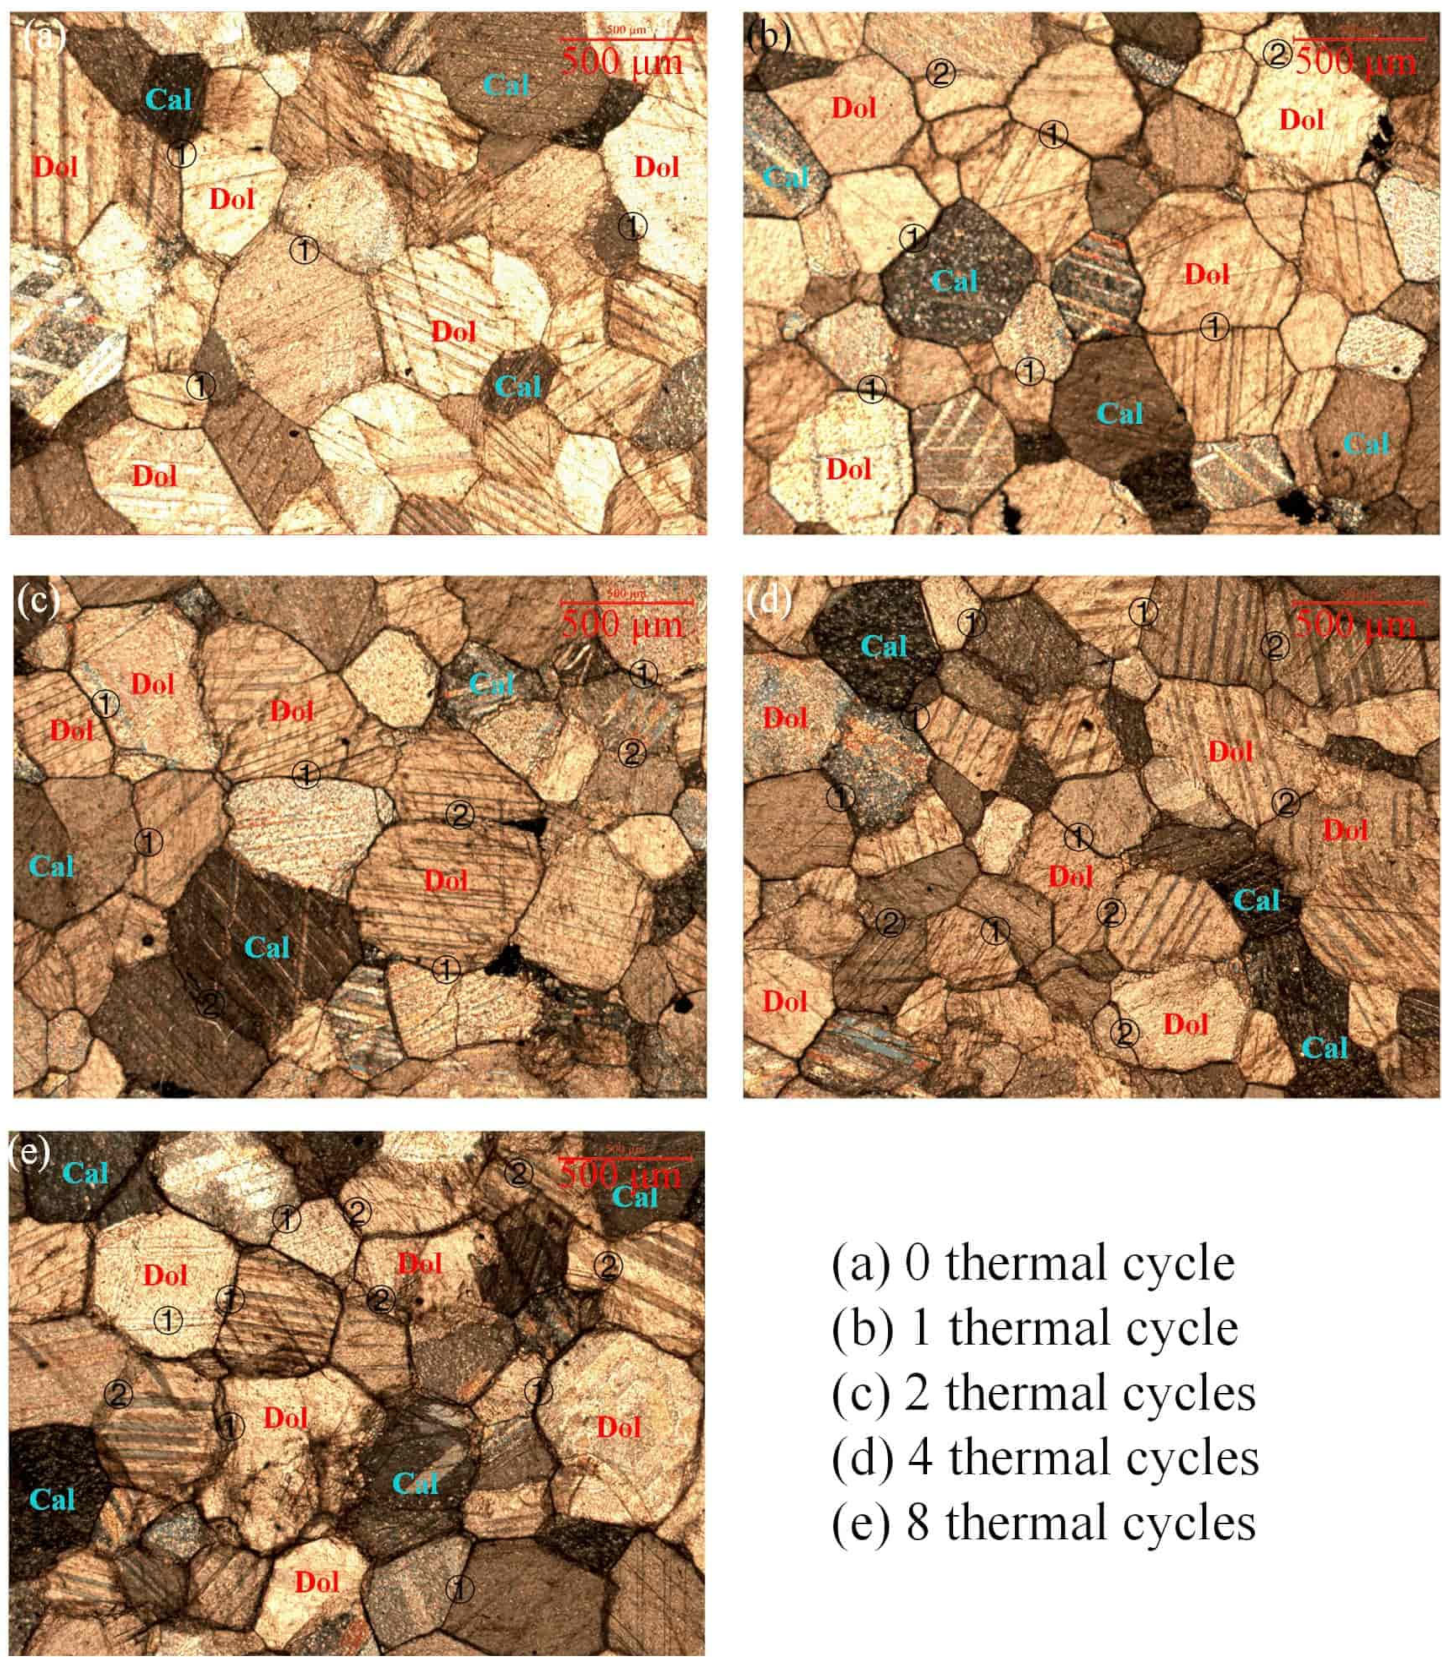
The peak elastic energy evolution model under different thermal cycles was constructed considering the influence of confining pressure [29]. In the three-dimensional cartesian coordinate system, the x-axis is the number of thermal cycles, the y-axis is confining pressure, and the z-axis is the peak elastic energy. Through surface fitting to the test data (Figure 18), the model of the peak elastic energy evolution of marble under triaxial compression with different thermal cycles was obtained as follows with R2 = 0.93805:
U e = 217.39255 10.70847 n + 5.68309 c 0.54128 c 2 + 0.01242 c 3 1 0.22541 n + 0.05745 n 2 0.00411 n 3 0.04425 c + ( 8.4146 e 4 ) c 2
where Ue is the peak elastic energy (kJ/m3); n is the number of thermal cycles; and c is confining pressure (MPa).

3.3. Microstructure

Three types of cracks are induced by temperature: grain boundary crack, intragranular crack, and transgranular crack [30]. Since the distinction between intragranular and transgranular cracks is not obvious in recent research, this paper unifies them as intragranular cracks. The microstructure of rock samples undergoing different thermal cycles is shown in Figure 19. The results indicate that the microscopic morphology and crack development changed significantly after different numbers of thermal cycles, and the color of mineral particles gradually darkened at high temperatures. For samples without heat treatment, the structure was compact, the mineral boundary contact was good, and no obvious microcracks could be observed.
After one thermal cycle, a large number of cracks occurred at the boundary of mineral particles, some of the particles were separated, and the opening of the mineral boundary increased greatly. This is mainly due to the uneven thermal expansion coefficient of different mineral particles, which generates thermal stress at the boundary after heating. Additionally, the stress exceeded the yield strength of the mineral so that microcracks appeared, and the cracks developed randomly and directionless. As the number of cycles continuously rose, the number and opening of cracks continued to develop. The development of grain boundary cracks was the main trend, and cracks began to appear inside the mineral. After four thermal cycles, the crack opening increased significantly, among which the grain boundary cracks reached a maximum of 14 μm. This is because the small cracks at the particle boundary converged to form a crack zone under the influence of high temperature. At the same time, a smooth failure district appeared at the grain boundary, which gradually expanded with the increase in the number of thermal cycles. The location and direction of the damaged district are related to the shape and size of the mineral particles and are also influenced by the dissociation that occurs at the mineral boundary. After eight thermal cycles, cracks continued to increase, and mineral boundary openings continued to expand. The maximum opening of grain boundary cracks reached 29 μm, and the maximum opening of intragranular cracks increased to 9 μm.
The marble used in the experiment was recrystallized by metamorphism, and the grains were densely arranged. Thermal-damaged cracks caused by uneven expansion easily form. The continuous increase in cracks was mainly due to the further development of the original cracks after heat treatment and the formation of new small cracks, which then extended, converged, and transfixed into large cracks.

3.4. Damage Mechanism Analysis

Considering the form of a crack, the difference in the failure mode is mainly determined by the interaction between tensile and shear cracks. When the damage degree is low, the influence of tensile cracks on the rock sample’s fracture is dominant, and the tensile crack formed is parallel to the loading direction, so the type of failure is axial cleavage. With the increase in the thermal damage degree or confining pressure, shear cracks gradually take a dominant position and act together with tensile cracks to form a main shear plane when the rock sample is broken.
Considering the internal structure of the rock, when the degree of thermal damage increases, the mineral composition and crystal structure of the rock sample will change, and the cohesion (C) between the crystals will decrease. Then, a dislocation glide occurs, which will degrade the physical and mechanical properties. Because rock is a heterogeneous and anisotropic material, the strengths of the materials that make up the minerals are different. During the loading process, the different bearing capacities of minerals on the same surface result in different strengths of the materials in the section. When the axial stress increases, the material with low load-bearing strength yields first, causing the loading stress to shift and the actual bearing stress of the unyielding material to increase. Therefore, shear cracks will appear along the yield surface. As the cracks propagate, merge, and transfix, the shear failure mode is formed finally.
Considering the energy, the damage to rock is mainly caused by the release of elastic strain energy, and this can be attributed to loading or high temperature. The greater the release of elastic strain energy, the greater the damage caused. Macroscopically, the rock sample has more fracture surfaces or cracks. Therefore, the fracture surface loading after thermal cycling or confining pressure is higher than those without. However, after a certain degree of thermal damage, the elastic energy storage limit of the rock will rise slightly, and, ultimately, the energy will not be fully released.

4. Conclusions

In order to study the influence of thermal cycles and confining pressures on the mechanical properties and energy characteristics of marble, this study conducted tests on marble after different numbers of thermal cycles of uniaxial compression and triaxial compression. According to the test results, the following conclusions can be drawn:
  • After the same number of thermal cycles, the peak strength, peak strain, and elastic modulus of the marble sample are positively correlated with the confining pressure; under the same confining pressure, the peak strain of marble samples increases with the increase in thermal cycles, while the peak strength and elastic modulus both show a downward trend.
  • Different minerals in the marble sample have different degrees of expansion after being heated, which causes the rock structure to crack. In addition, the microcracks inside the rock develop significantly, so the ductility of the rock sample increases and the mechanical properties deteriorate.
  • When the number of thermal cycles is constant, the samples have different energy evolution trends at each stage under different confining pressures. However, under the influence of different thermal cycles at a set confining pressure, the energy characteristics behaves similarly.
  • The curves of the peaks of the total absorbed energy, dissipated energy, and elastic strain energy all show a convex trend, and the peaks of these three characteristic energy values under different confining pressures all appear at one or two thermal cycles.
  • The energy evolution and the stress-strain curve in the rock loading process show a good corresponding relationship. In the crack closure stage, the energy conversion rate of the original crack compaction process is low; in the linear elastic deformation stage, the total absorbed energy and elastic strain energy increase significantly, the energy dissipated by internal damage and plastic deformation is small, and the energy converted by external force is mainly elastic strain energy storage; in the nonlinear deformation stage, the dissipated energy significantly increases; and in the failure stage, the accumulated elastic strain energy reaches the rock energy storage limit, and then, the macroscopic failure of rock occurs. Moreover, the elastic strain energy is quickly transformed into dissipated energy for rock failure.
  • The dissipated energy in the marble loading process gradually increases with the accumulation of axial strain. In the crack closure and linear elastic stages, dissipated energy increases slowly at a low level as the axial strain increases; in the nonlinear deformation stage, the internal cracks expand and transfix, and the energy dissipation rate increases rapidly as the axial strain increases. The stress limit of the rock in the failure stage is reduced, but the energy dissipation remains at a high level because of continuous crack propagation.
  • The energy evolution parameters (such as the peak elastic energy and peak dissipation energy) have a positive correlation with the confining pressure. In particular, the marble samples under different confining pressures all reach the peak elastic energy of the test group when the number of thermal cycles is two.
The conclusions drawn in this study explain the mechanical properties and energy evolution characteristics of rocks under different confining pressures and after a different number of thermal cycles, which are helpful in providing references for the design and construction of underground rock projects involving high temperatures and high pressures. However, because the number of thermal cycles and confining pressure settings are very few, a corresponding numerical model cannot be established. In the future, more tests will be required at various temperatures and different confining pressures to establish an accurate constitutive model for quantitative calculation and deformation prediction in actual underground engineering.

Author Contributions

Process design, writing, experiment operation, Q.W.; data processing, chart processing, B.L.; test material, X.J. All authors have read and agreed to the published version of the manuscript.

Funding

This research received no external funding.

Data Availability Statement

Not applicable.

Conflicts of Interest

The authors declare no conflict of interest.

References

  1. Majer, E.L.; Baria, R.; Stark, M.; Oates, S.; Bommer, J.; Smith, B.; Asanuma, H. Induced seismicity associated with enhanced geothermal systems. Geothermics 2007, 36, 185–222. [Google Scholar] [CrossRef]
  2. Peng, J.; Yang, S. Comparison of mechanical behavior and acoustic emission characteristics of three thermally-damaged rocks. Energies 2018, 11, 2350. [Google Scholar] [CrossRef] [Green Version]
  3. Su, H.; Jing, H.; Du, M.; Wang, C. Experimental investigation on tensile strength and its loading rate effect of sandstone after high temperature treatment. Arab. J. Geosci. 2016, 9, 616. [Google Scholar] [CrossRef]
  4. An, H.; Zeng, T.; Zhang, Z.; Liu, L. Experimental study of the rock mechanism under coupled high temperatures and dynamic loads. Adv. Civ. Eng. 2020, 2020, 8866621. [Google Scholar] [CrossRef]
  5. Zhang, L.; Mao, X.; Liu, R.; Guo, X.; Ma, D. The mechanical properties of mudstone at high temperatures: An experimental study. Rock Mech. Rock Eng. 2014, 47, 1479–1484. [Google Scholar] [CrossRef]
  6. Liu, S.; Xu, J. Analysis on damage mechanical characteristics of marble exposed to high temperature. Int. J. Damage Mech. 2015, 24, 1180–1193. [Google Scholar] [CrossRef]
  7. Rao, Q.; Wang, Z.; Xie, H.; Xie, Q. Experimental study of mechanical properties of sandstone at high temperature. J. Cent. South Univ. Technol. 2007, 14, 478–483. [Google Scholar] [CrossRef]
  8. Meng, Q.; Qian, W.; Liu, J.; Zhang, M.; Lu, M.; Wu, Y. Analysis of triaxial compression deformation and strength characteristics of limestone after high temperature. Arab. J. Geosci. 2020, 13, 153. [Google Scholar] [CrossRef]
  9. Zhang, P.; Mishra, B.; Heasley, K.A. Experimental investigation on the influence of high pressure and high temperature on the mechanical properties of deep reservoir rocks. Rock Mech. Rock Eng. 2015, 48, 2197–2211. [Google Scholar] [CrossRef]
  10. Wei, S.; Yang, Y.; Su, C.; Cardosh, S.R.; Wang, H. Experimental study of the effect of high temperature on the mechanical properties of coarse sandstone. Appl. Sci. 2019, 9, 2424. [Google Scholar] [CrossRef] [Green Version]
  11. Deng, Y.; Deng, H. Experimental study on failure criterion of deep tight sandstone under coupling effects of temperature and pressure. Arab. J. Geosci. 2019, 12, 575. [Google Scholar] [CrossRef]
  12. Meng, L.; Li, T.; Cai, G. Temperature effects on the mechanical properties of slates in triaxial compression test. J. Mt. Sci-Eng. 2017, 14, 2581–2588. [Google Scholar] [CrossRef]
  13. Su, H.; Jing, H.; Yin, Q.; Yu, L.; Wang, Y.; Wu, X. Strength and deformation behaviors of veined marble specimens after vacuum heat treatment under conventional triaxial compression. Acta Mech. Sinica-Prc. 2017, 33, 886–898. [Google Scholar] [CrossRef]
  14. Idris, M.A. Effects of Elevated Temperature on Physical and Mechanical Properties of Carbonate Rocks in South-Southern Nigeria; Dnipro University of Technology: Dnipropetrovsk Oblast, Ukraine, 2018. [Google Scholar]
  15. Rong, G.; Peng, J.; Cai, M.; Yao, M.; Zhou, C.; Sha, S. Experimental investigation of thermal cycling effect on physical and mechanical properties of bedrocks in geothermal fields. Appl. Therm. Eng. 2018, 141, 174–185. [Google Scholar] [CrossRef]
  16. Xu, X.L.; Zhang, Z.Z. Acoustic Emission and Damage Characteristics of Granite Subjected to High Temperature. Adv. Mater. Sci. Eng. 2018, 2018, 8149870. [Google Scholar] [CrossRef] [Green Version]
  17. Chen, G.; Li, T.; Li, G.; Qin, C.A.; He, Y. Influence of temperature on the brittle failure of granite in deep tunnels determined from triaxial unloading tests. Eur. J. Environ. Civ. Eng. 2018, 22, s269–s285. [Google Scholar] [CrossRef]
  18. Luo, J.A.; Wang, L. High-Temperature Mechanical Properties of Mudstone in the Process of Underground Coal Gasification. Rock Mech. Rock Eng. 2011, 44, 749–754. [Google Scholar] [CrossRef]
  19. Meng, X.; Liu, W.; Meng, T. Experimental Investigation of Thermal Cracking and Permeability Evolution of Granite with Varying Initial Damage under High Temperature and Triaxial Compression. Adv. Mater. Sci. Eng. 2018, 2018, 8149870. [Google Scholar] [CrossRef] [Green Version]
  20. Chen, Z.; He, C.; Ma, G.; Xu, G.; Ma, C. Energy Damage Evolution Mechanism of Rock and Its Application to Brittleness Evaluation. Rock Mech. Rock Eng. 2019, 52, 1265–1274. [Google Scholar] [CrossRef]
  21. Luo, Y.; Wang, G.; Li, X.; Liu, T.; Mandal, A.K.; Xu, M.; Xu, K. Analysis of energy dissipation and crack evolution law of sandstone under impact load. Int. J. Rock Mech. Min. 2020, 132, 104359. [Google Scholar] [CrossRef]
  22. He, M.M.; Pang, F.; Wang, H.T.; Zhu, J.W.; Chen, Y.S. Energy Dissipation-Based Method for Strength Determination of Rock under Uniaxial Compression. Shock Vib. 2020, 2020, 8865958. [Google Scholar] [CrossRef]
  23. Li, M.; Zhang, J.; Zhou, N.; Huang, Y. Effect of Particle Size on the Energy Evolution of Crushed Waste Rock in Coal Mines. Rock Mech. Rock Eng. 2017, 50, 1347–1354. [Google Scholar] [CrossRef]
  24. Gong, F.; Luo, S.; Yan, J. Energy Storage and Dissipation Evolution Process and Characteristics of Marble in Three Tension-Type Failure Tests. Rock Mech. Rock Eng. 2018, 51, 3613–3624. [Google Scholar] [CrossRef]
  25. Ma, Q.; Tan, Y.; Liu, X.; Gu, Q.; Li, X. Effect of coal thicknesses on energy evolution characteristics of roof rock-coal-floor rock sandwich composite structure and its damage constitutive model. Compos. Part B Eng. 2020, 198, 108086. [Google Scholar] [CrossRef]
  26. Zhang, H.; Lu, C.; Liu, B.; Liu, Y.; Zhang, N.; Wang, H.Y. Numerical investigation on crack development and energy evolution of stressed coal-rock combination. Int. J. Rock Mech. Min. 2020, 133, 104417. [Google Scholar] [CrossRef]
  27. Hudson, J.A.; Cornet, F.H.; Christiansson, R. ISRM Suggested Methods for rock stress estimation—Part 1: Strategy for rock stress estimation. Int. J. Rock Mech. Min. 2003, 40, 991–998. [Google Scholar] [CrossRef]
  28. Liu, H. Hydrogen assisted intergranular cracking in steels. Eng. Fract. Mech. 2011, 78, 2563–2571. [Google Scholar] [CrossRef]
  29. Zhao, K.; Yu, X.; Zhou, Y.; Wang, Q.; Wang, J.; Hao, J. Energy evolution of brittle granite under different loading rates. Int. J. Rock Mech. Min. Sci. 2020, 132, 104392. [Google Scholar] [CrossRef]
  30. Xie, S.; Han, Z.; Shu, R.; Chen, Y.; Feng, F. A new method to determine the crack closure stress based on stress difference. Theor. Appl. Fract. Mech. 2022, 119, 103337. [Google Scholar] [CrossRef]
Figure 1. Photograph of the prepared marble specimens.
Minerals 13 00428 g001
Figure 2. Test equipment: (a) SX2-10-12 high-temperature box-type resistance furnace; (b) TAW-3000 rock triaxial servo multi-field coupling test system; (c) photograph of Olympus BX53M polarizing microscope.
Minerals 13 00428 g002
Figure 3. Temperature change curves during thermal cycle process.
Minerals 13 00428 g003
Figure 4. Variation in Vp of marble with the number of thermal cycles.
Minerals 13 00428 g004
Figure 6. Relationship between the triaxial compressive strength of marble and confining pressure and number of thermal cycles. (a) σs (Peak stress)-σ3 under different thermal cycles; (b) σs-thermal cycles under different confining pressure.
Minerals 13 00428 g006
Figure 7. Relationship between peak strain of marble and the confining pressure and the number of thermal cycles. (a) Peak strain-σ3 under different thermal cycles; (b) Peak strain-thermal cycles under different confining pressure.
Minerals 13 00428 g007
Figure 8. Triaxial compressive strength evolution of marble under thermal cycles.
Minerals 13 00428 g008
Figure 9. Relationship between elastic modulus of marble and the confining pressure and the number of thermal cycles. (a) Elastic modulus-σ3 under different thermal cycles; (b) Elastic modulus-thermal cycles under different confining pressure.
Minerals 13 00428 g009
Figure 10. Elastic modulus evolution of marble under triaxial compression under thermal cycles.
Minerals 13 00428 g010
Figure 11. Fracture modes of marble under different confining pressures and different thermal cycles.
Minerals 13 00428 g011
Figure 12. Energy evolution law under different numbers of thermal cycles.
Minerals 13 00428 g012
Figure 13. Variation in the elastic strain energy of marble with axial strain during different numbers of thermal cycles under 0 confining pressure.
Minerals 13 00428 g013
Figure 14. Variation in the dissipated energy of marble with axial strain during different numbers of thermal cycles under 0 confining pressure.
Minerals 13 00428 g014
Figure 15. Energy evolution law under different confining pressures.
Minerals 13 00428 g015
Figure 18. Peak elastic energy evolution of marble under triaxial compression and thermal cycling conditions.
Minerals 13 00428 g018
Figure 19. Microstructure of rock specimens after different cycles of thermal cycle treatment (① grain boundary microcracks, ② intra-granular microcracks).
Minerals 13 00428 g019
Table 1. Physical and mechanical parameters of marble samples.
Marble ParameterDensity (kg/m3)Uniaxial Compressive Strength (MPa)E (GPa)P-Wave Velocity (Vp) (km/s)Poisson’s Ratio
Mean value2714.31109.0426.184.740.18
Value range2472.17~2958.5592.47~120.8823.46~29.014.43~5.020.13~0.24
Table 2. Variation in Vp of marble with the number of thermal cycles.
P-Wave Velocity (km/s)01 Cycle2 Cycles4 Cycles8 Cycles
The small value4.431.511.441.221.21
The middle value4.771.811.511.391.24
The larger value5.021.911.581.51.39
Mean value4.741.771.511.371.28
Table 3. Energy characteristic values of marble triaxial test under different numbers of thermal cycles.
Thermal CyclesConfining
Pressure
UepeakUdpeakUpeakPeak StressElastic
Modulus
00227.06159.10305.37109.0426.18
05260.53313.83475.93117.1527.68
010475.64438.80744.59142.9923.42
015415.47676.96886.87148.3130.12
020482.101139.161384.18170.1534.89
025603.682043.722291.34173.1030.40
030618.053176.893526.32189.4535.41
10245.63236.28310.0282.4013.82
15367.43542.84662.7286.8011.10
110397.451631.47844.0698.0713.75
115537.93939.091331.35116.5014.96
120488.951548.501861.71110.0116.20
125825.942837.103340.77140.0715.37
130871.873843.564232.42147.6316.21
20269.46291.96437.9270.309.17
25408.25560.19825.0684.549.51
210745.93556.461079.80105.058.52
215719.751045.941540.10102.749.16
2201045.471045.051805.11124.519.17
2251218.651508.912376.53127.919.23
2301188.682001.382548.22134.4410.61
40171.62201.75302.2048.316.80
45350.82497.73748.8665.226.74
410462.17637.31945.0872.837.08
415560.91981.791264.0386.088.58
420738.281235.581715.3289.527.48
4251057.051376.602153.06108.027.66
4301055.061727.632466.24110.468.39
80162.12178.08248.3039.534.79
85228.89304.52472.1744.075.01
810390.54324.12594.9152.894.83
815515.27804.831120.3260.505.20
820629.66585.78961.6162.035.09
825712.67792.851253.1966.635.42
830696.741666.302117.0468.045.97
Disclaimer/Publisher’s Note: The statements, opinions and data contained in all publications are solely those of the individual author(s) and contributor(s) and not of MDPI and/or the editor(s). MDPI and/or the editor(s) disclaim responsibility for any injury to people or property resulting from any ideas, methods, instructions or products referred to in the content.

