
Pore Variation Characteristics of Altered Wall Rocks in the Huize Lead–Zinc Deposit, Yunnan, China and Their Geological Significance

 ,
, 

Abstract
:1. Introduction
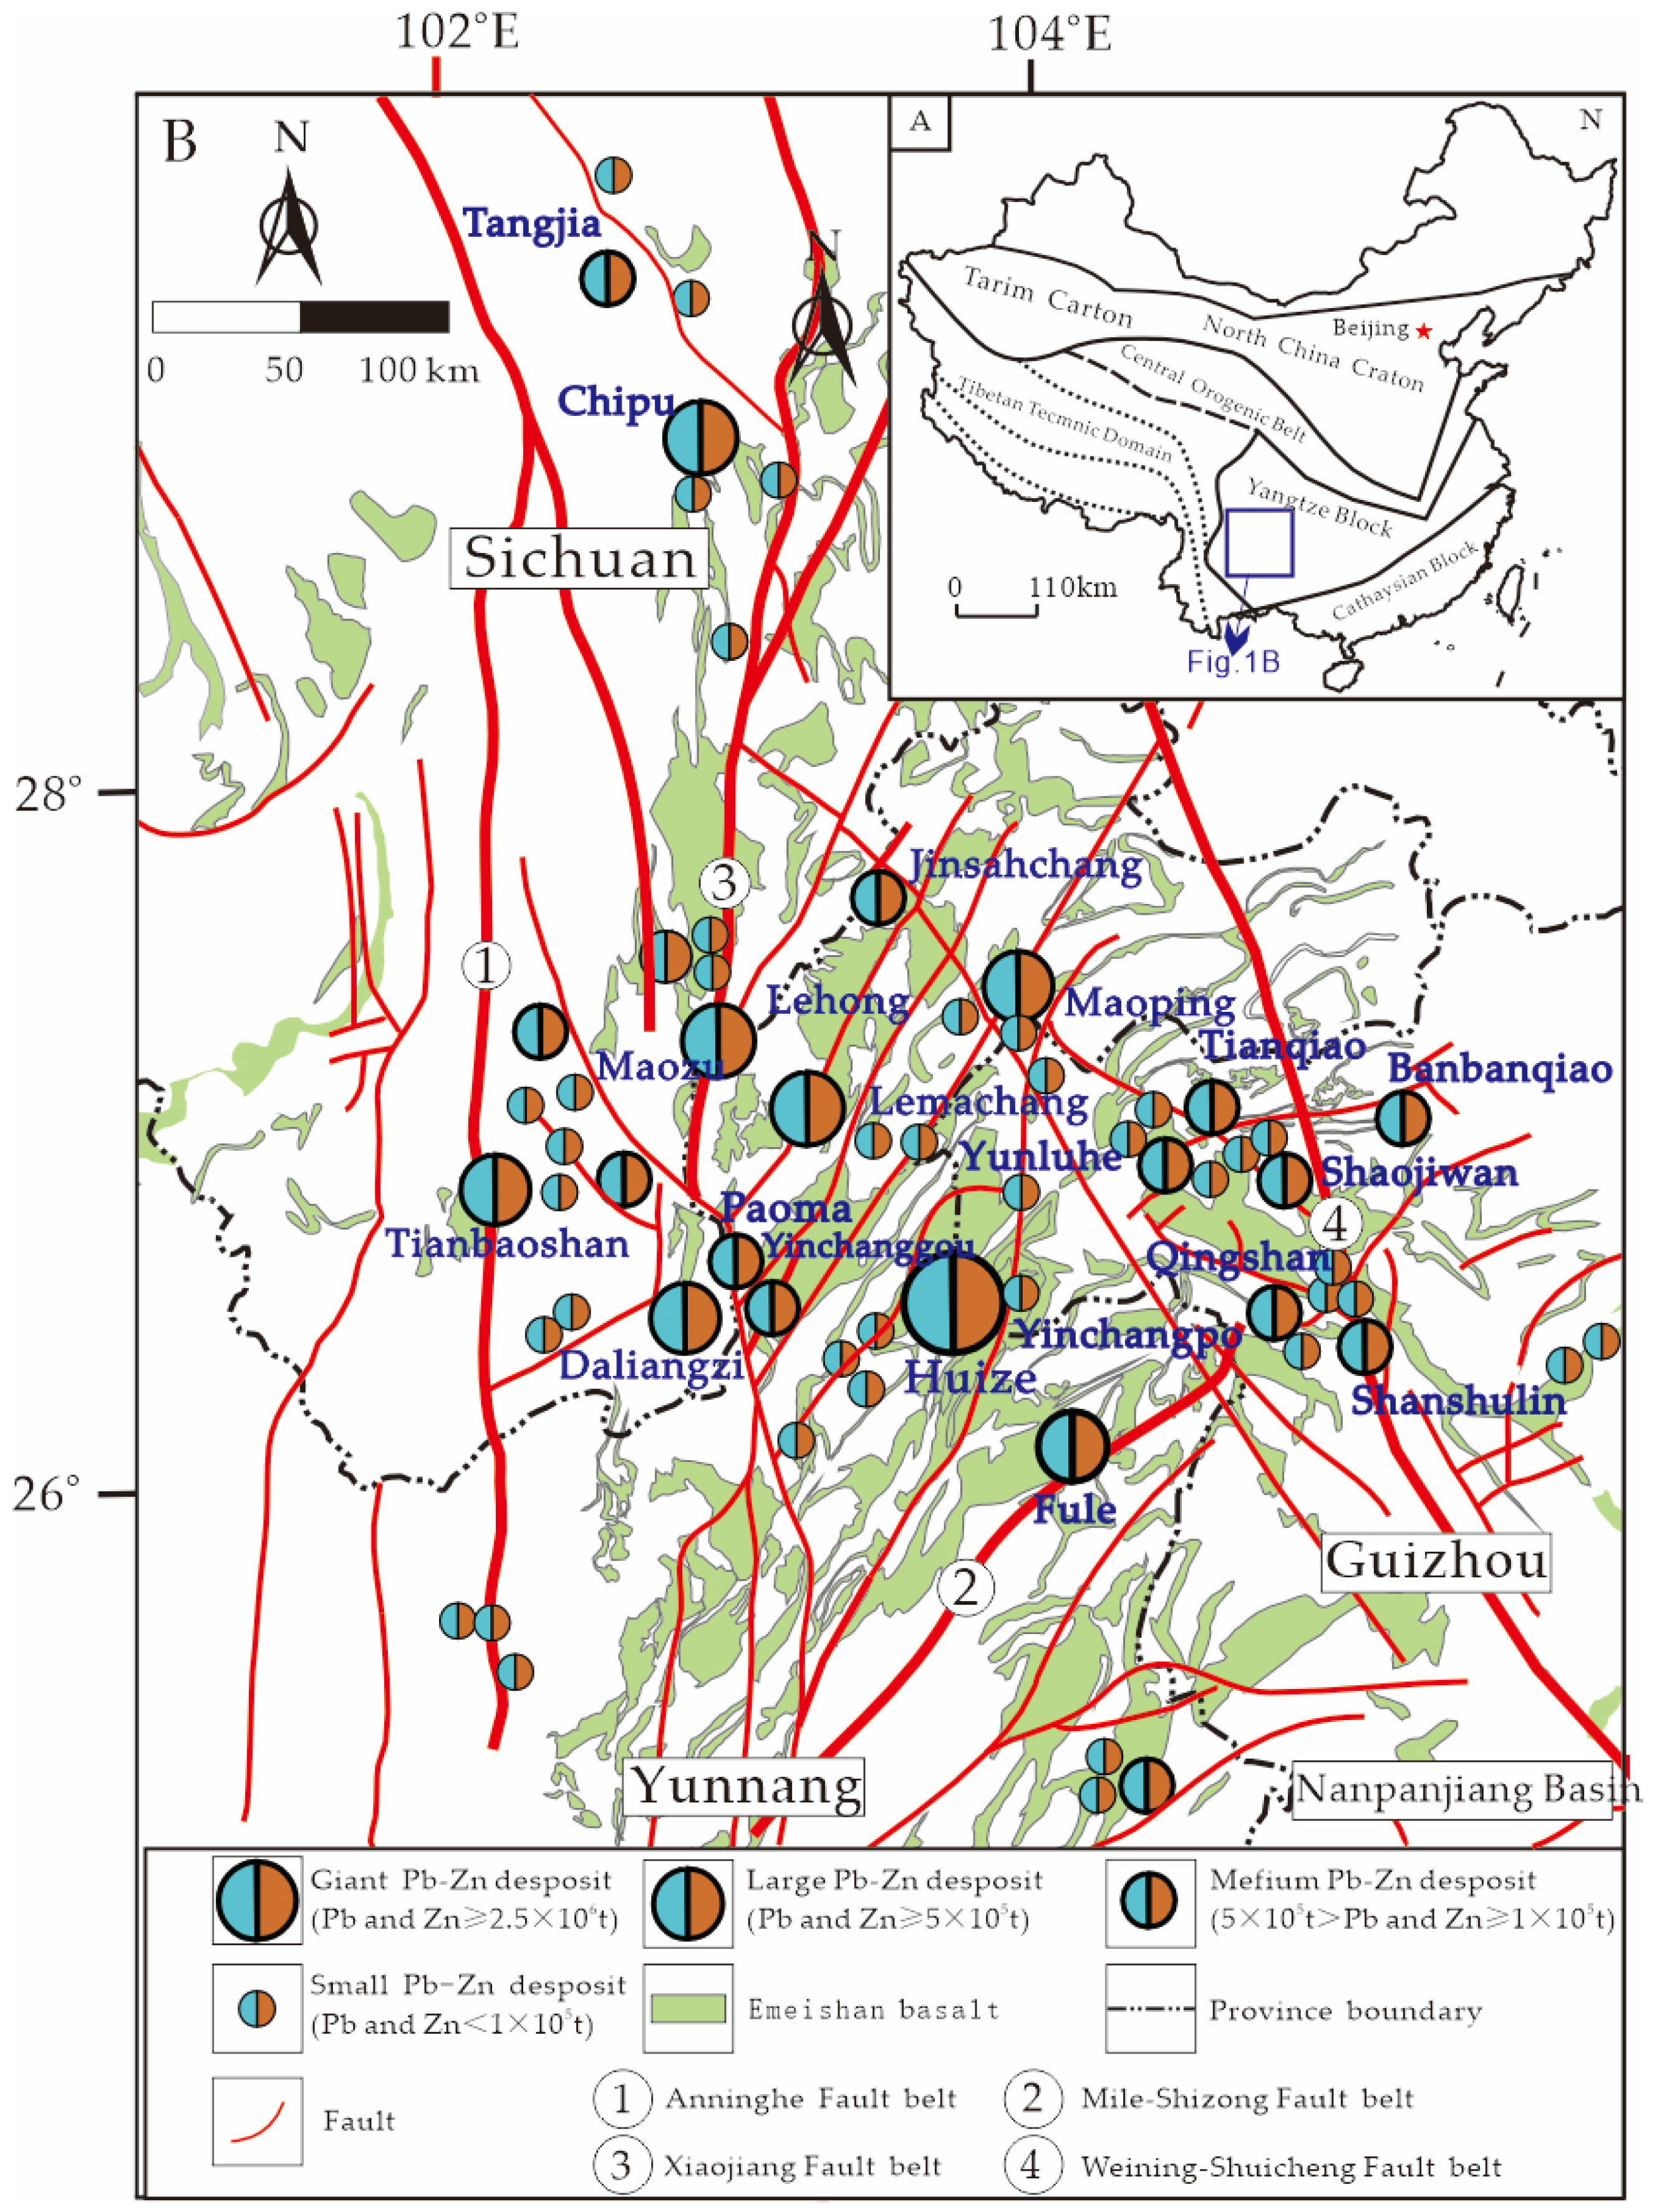
2. Regional Geological Background
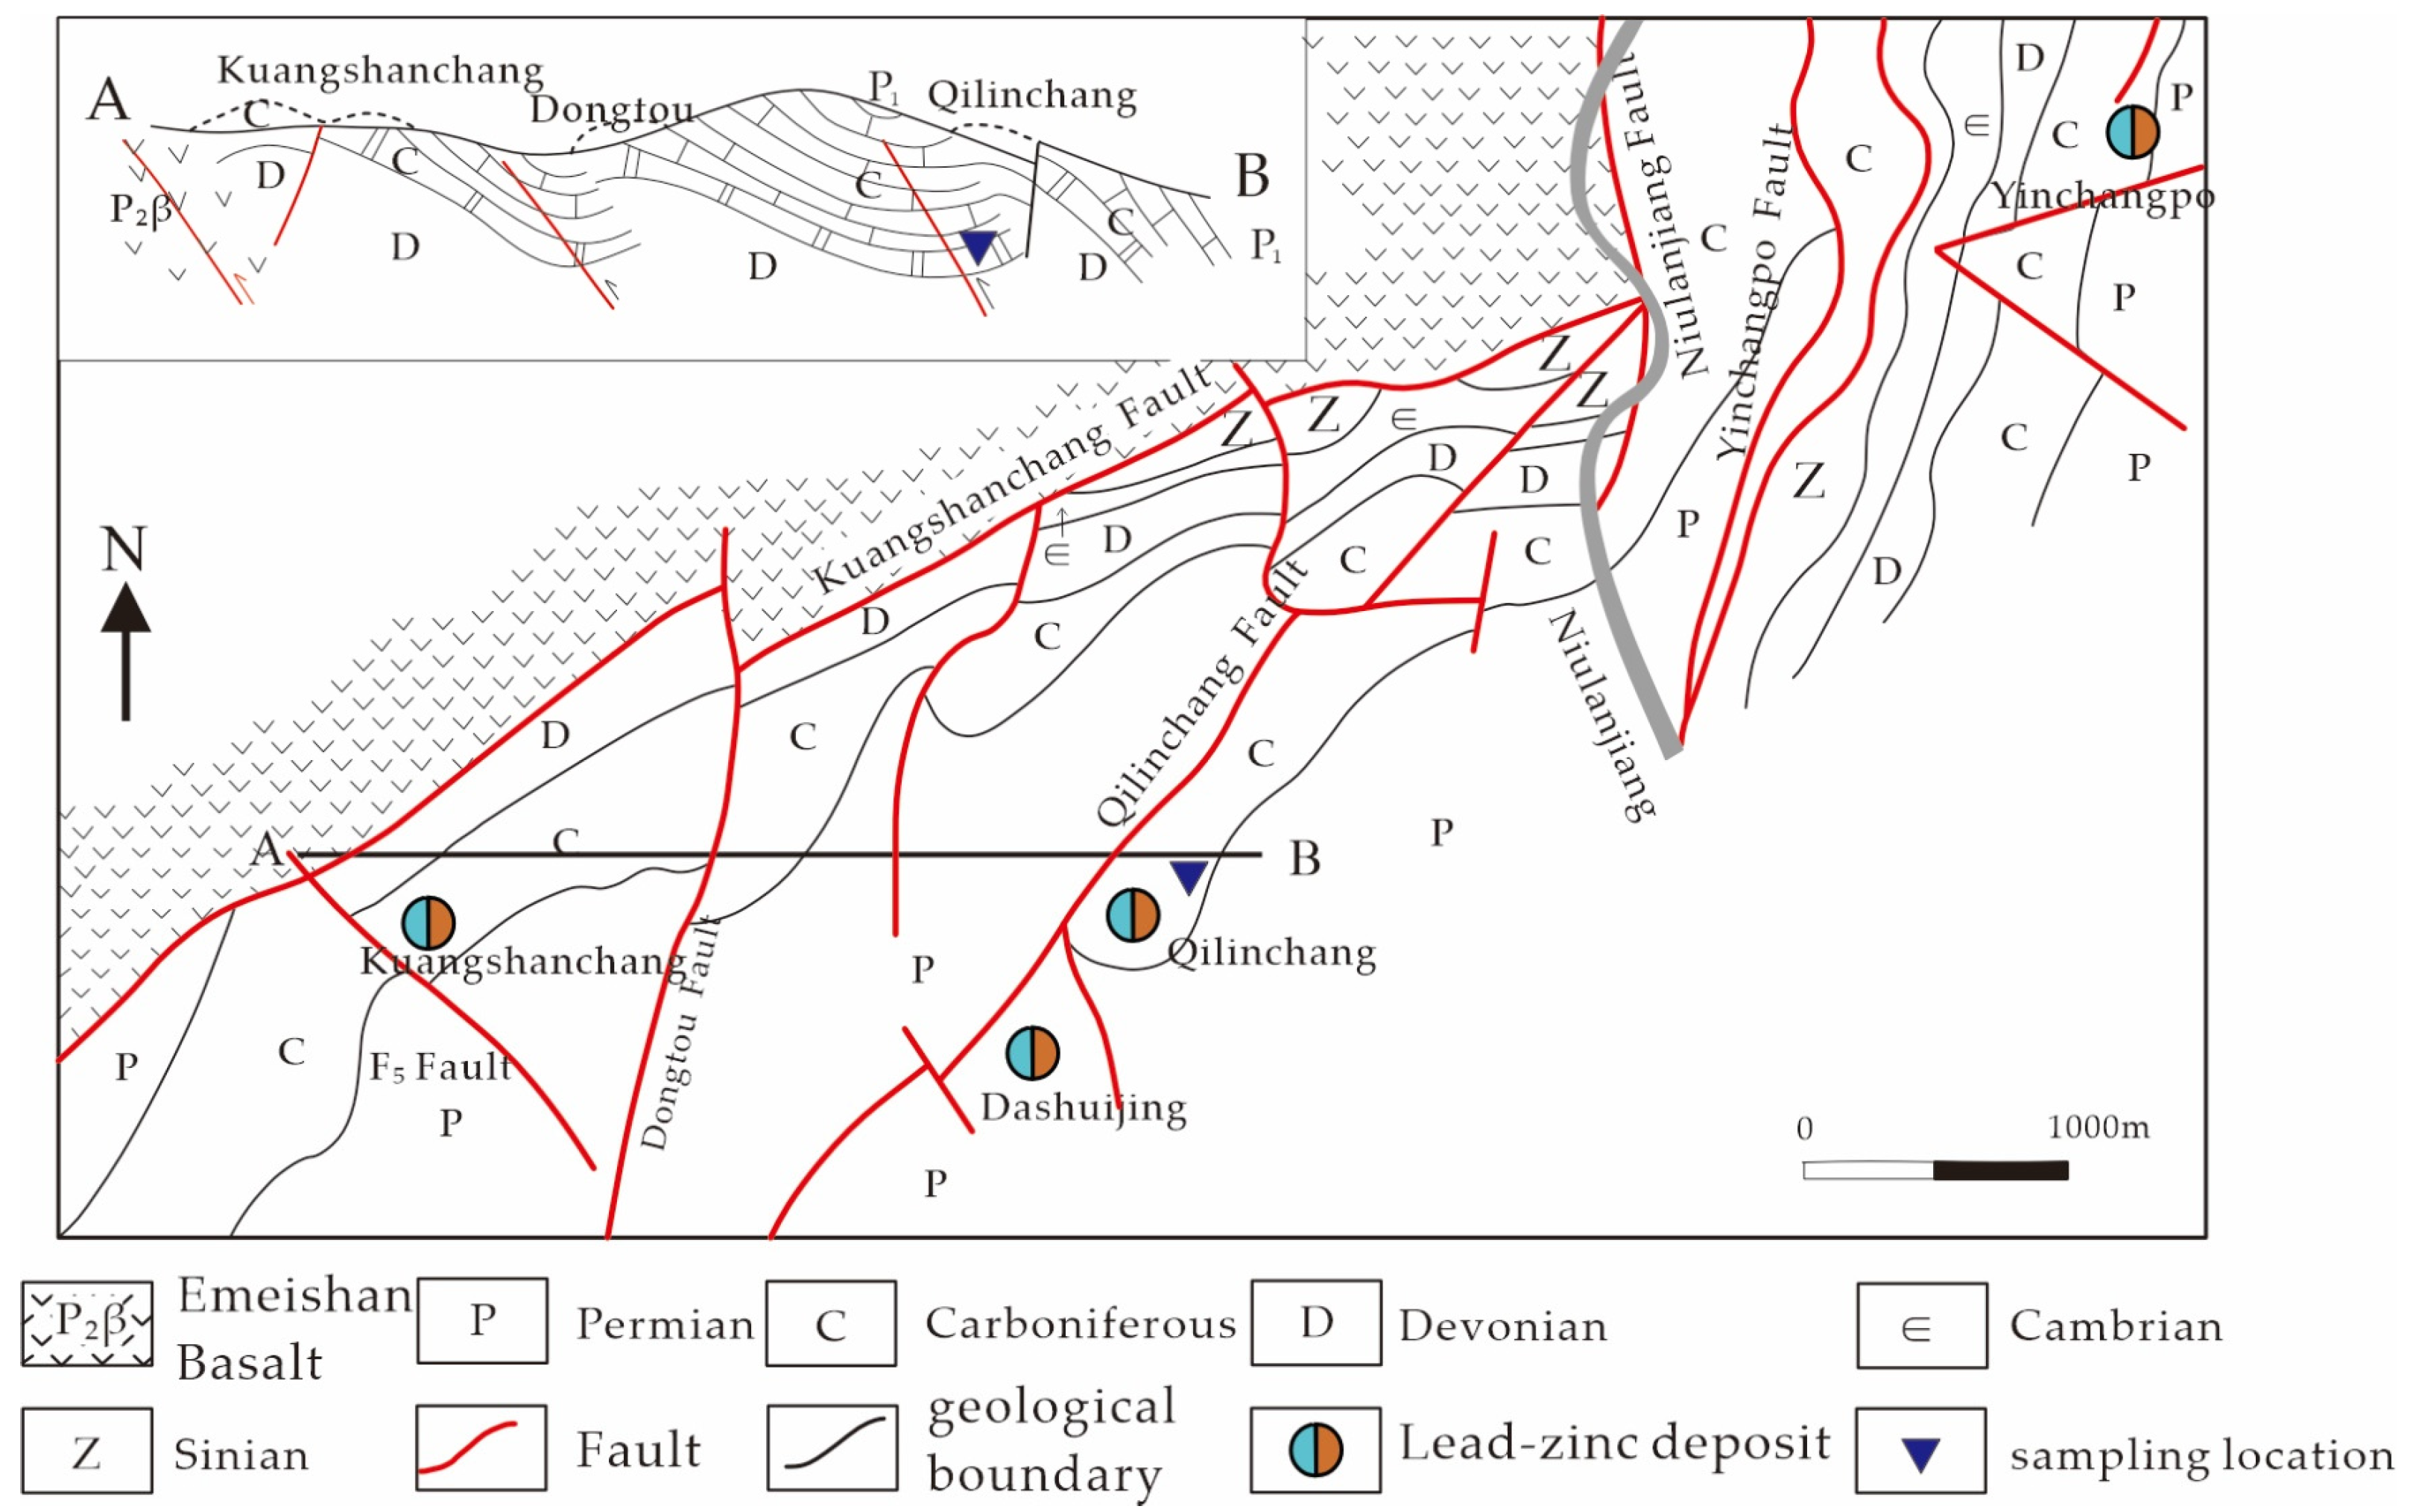
3. Geology of the Huize Lead–Zinc Deposit
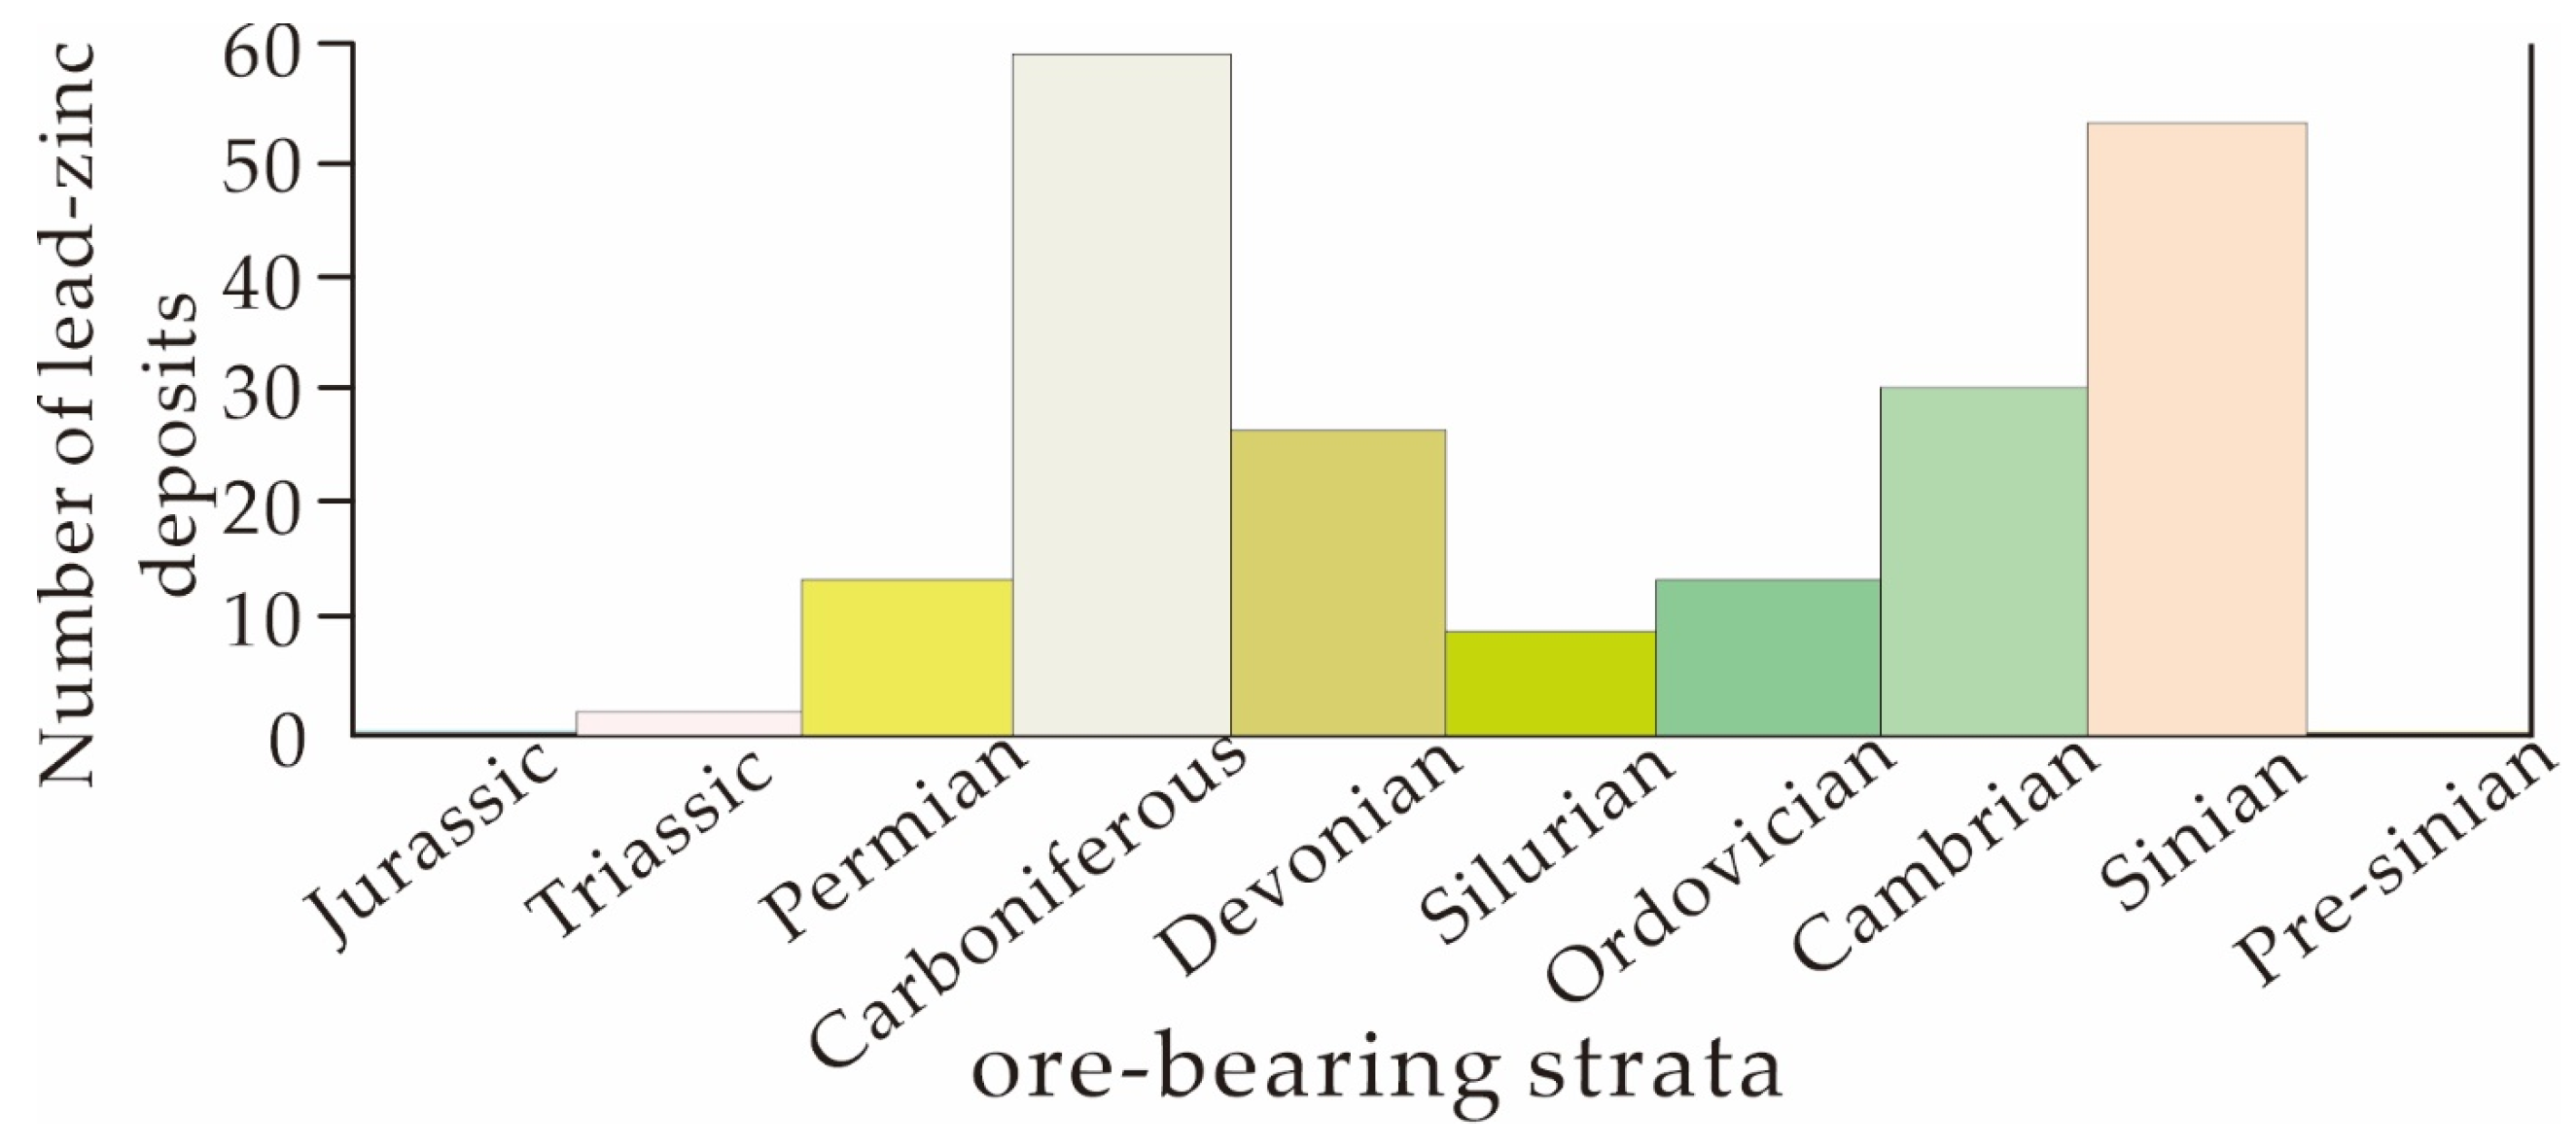
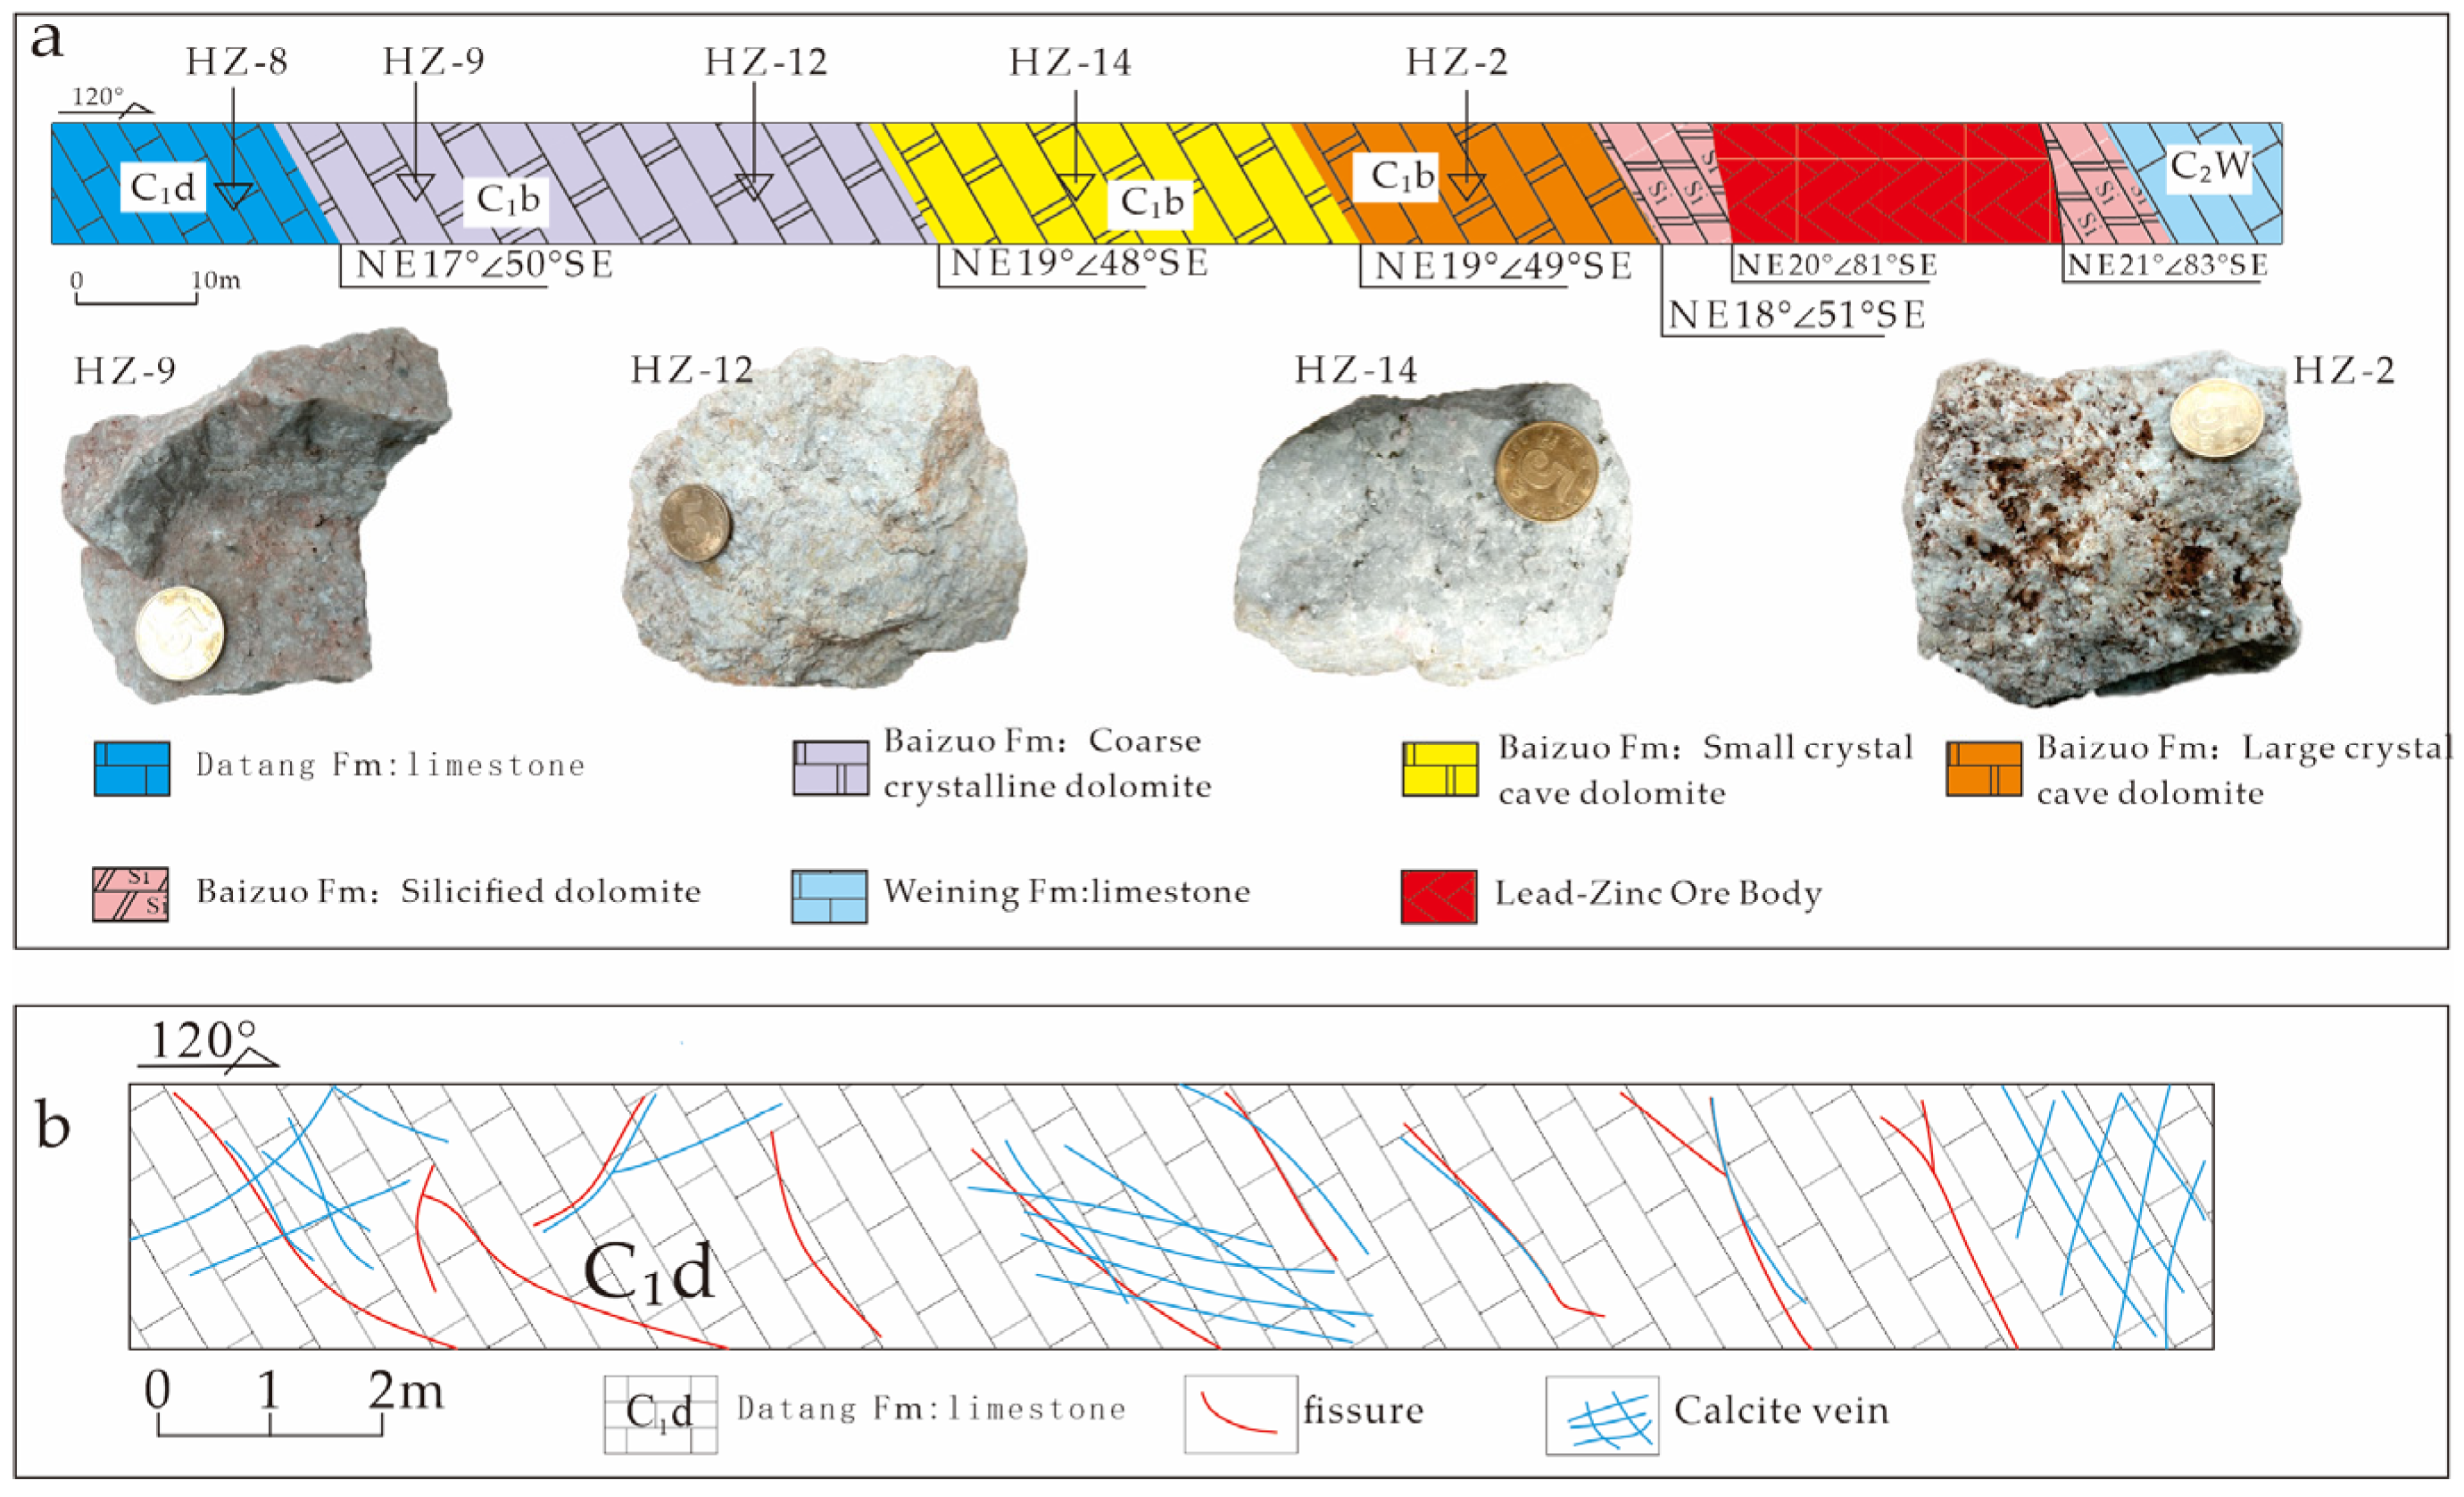
3.1. Strata
3.2. Geological Features of the Ore Bodies
3.3. Mineral Assemblage
3.4. Wall Rock Alteration Characteristics
4. Sampling and Analytical Methods
4.1. Tunnel Geological Information Record and Sample Collection
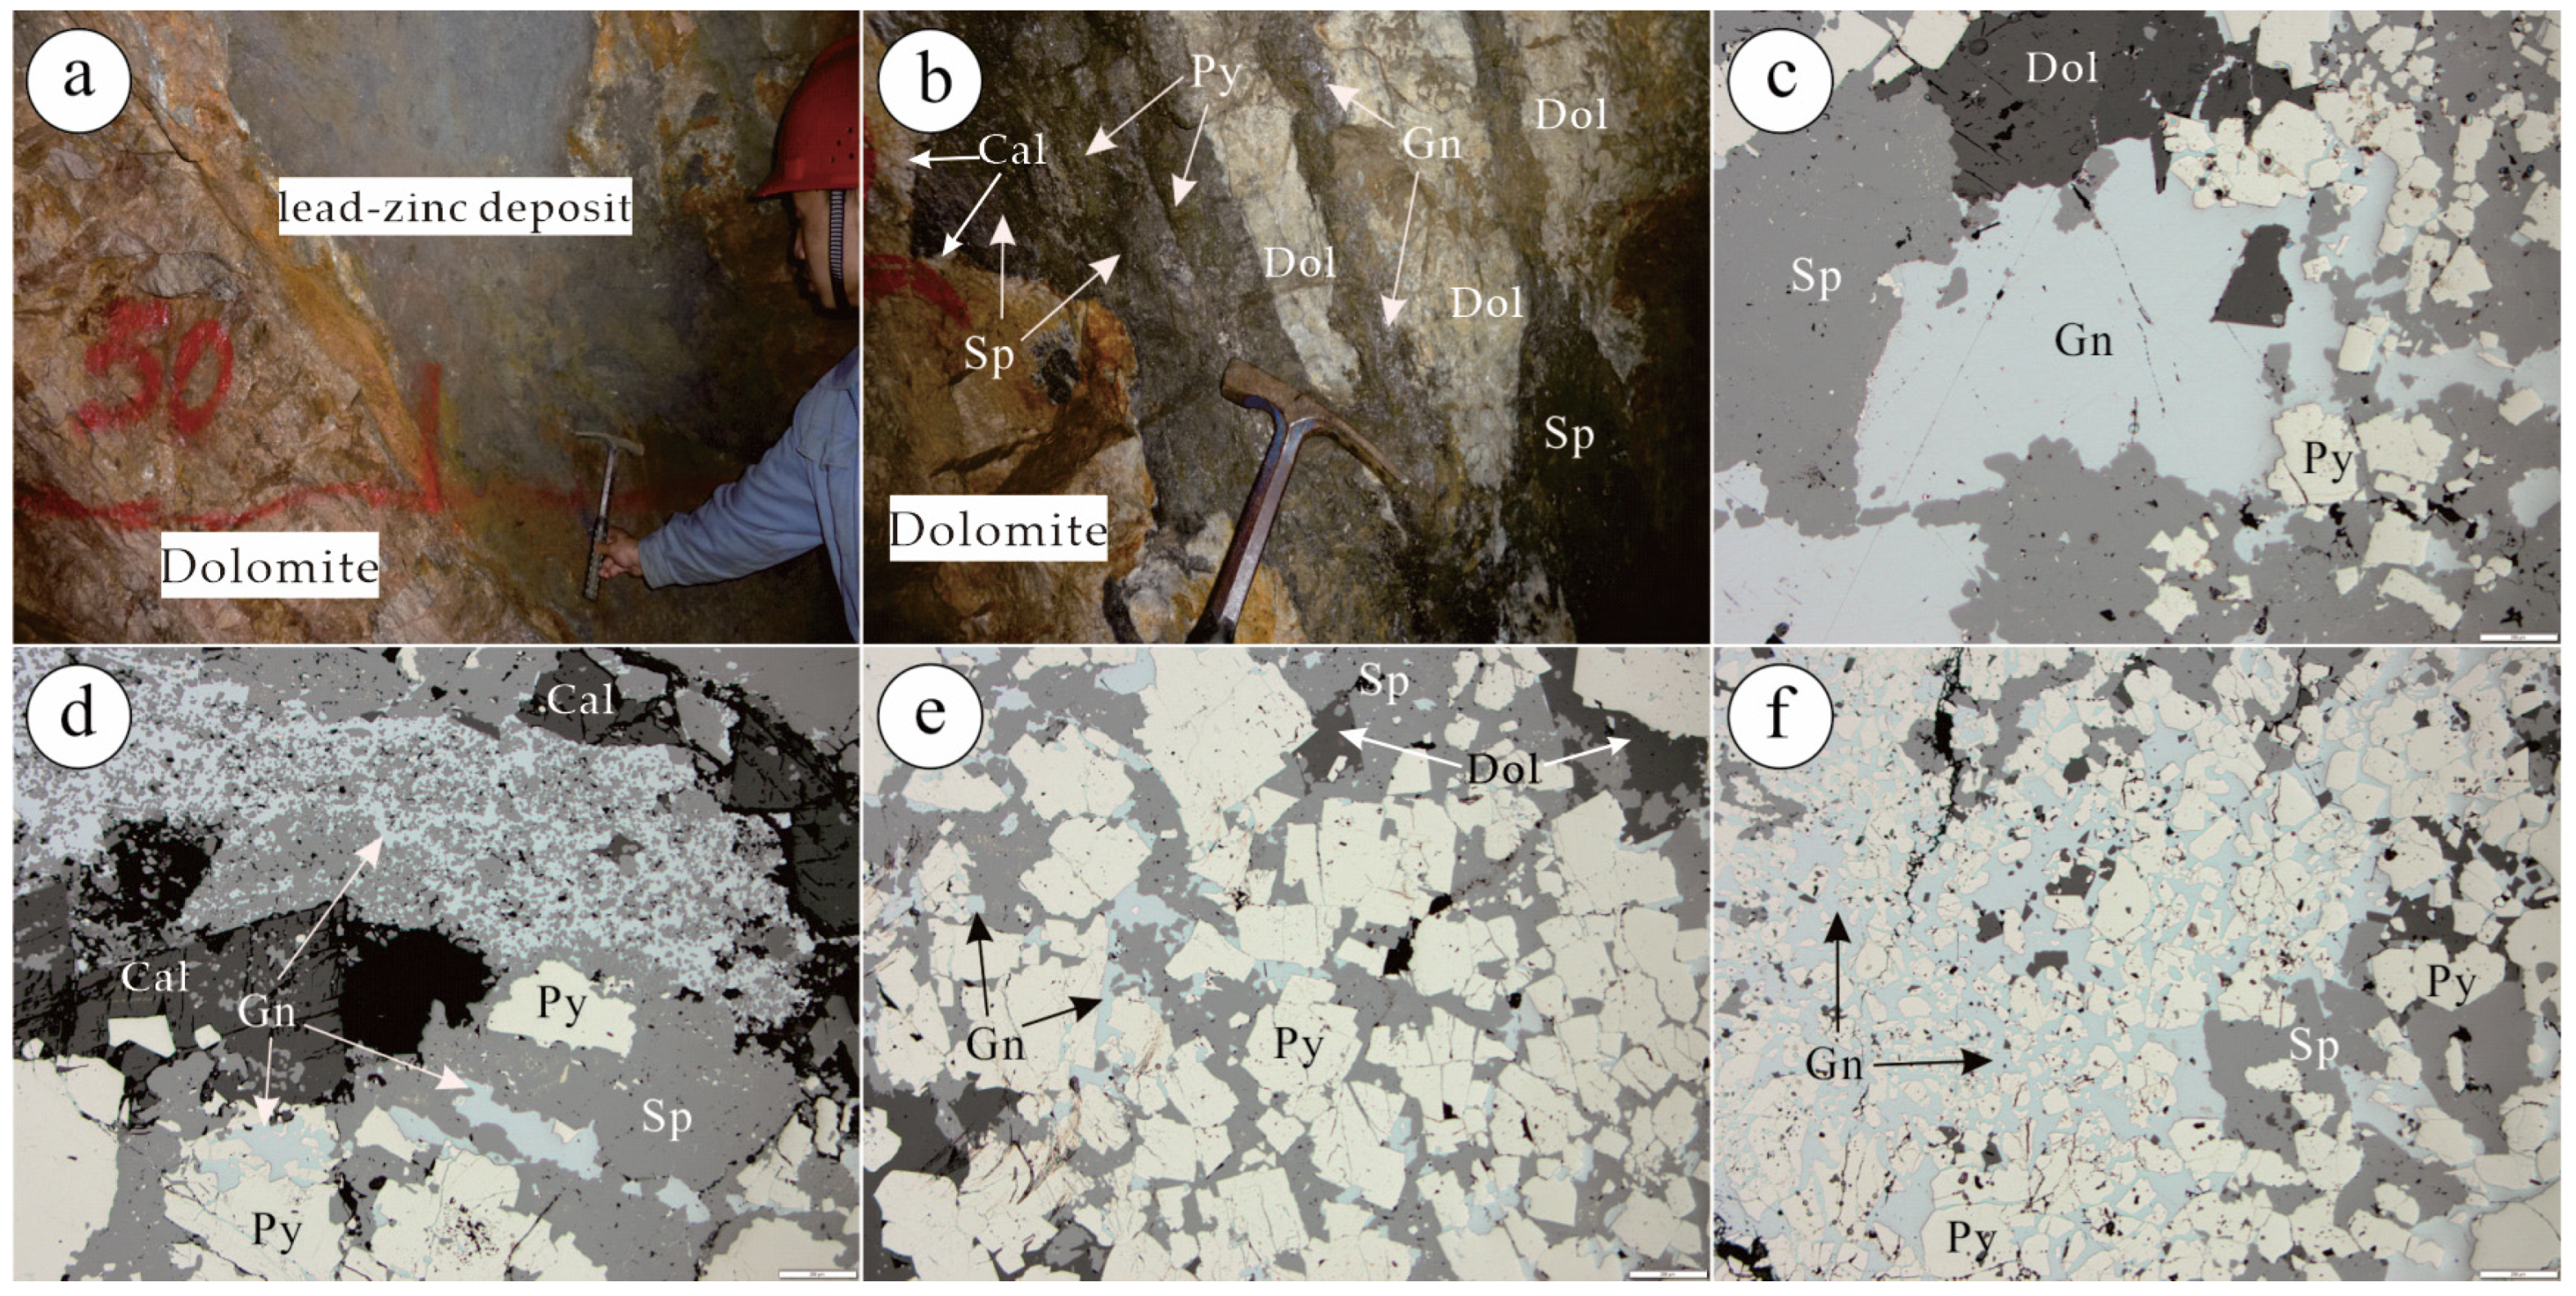
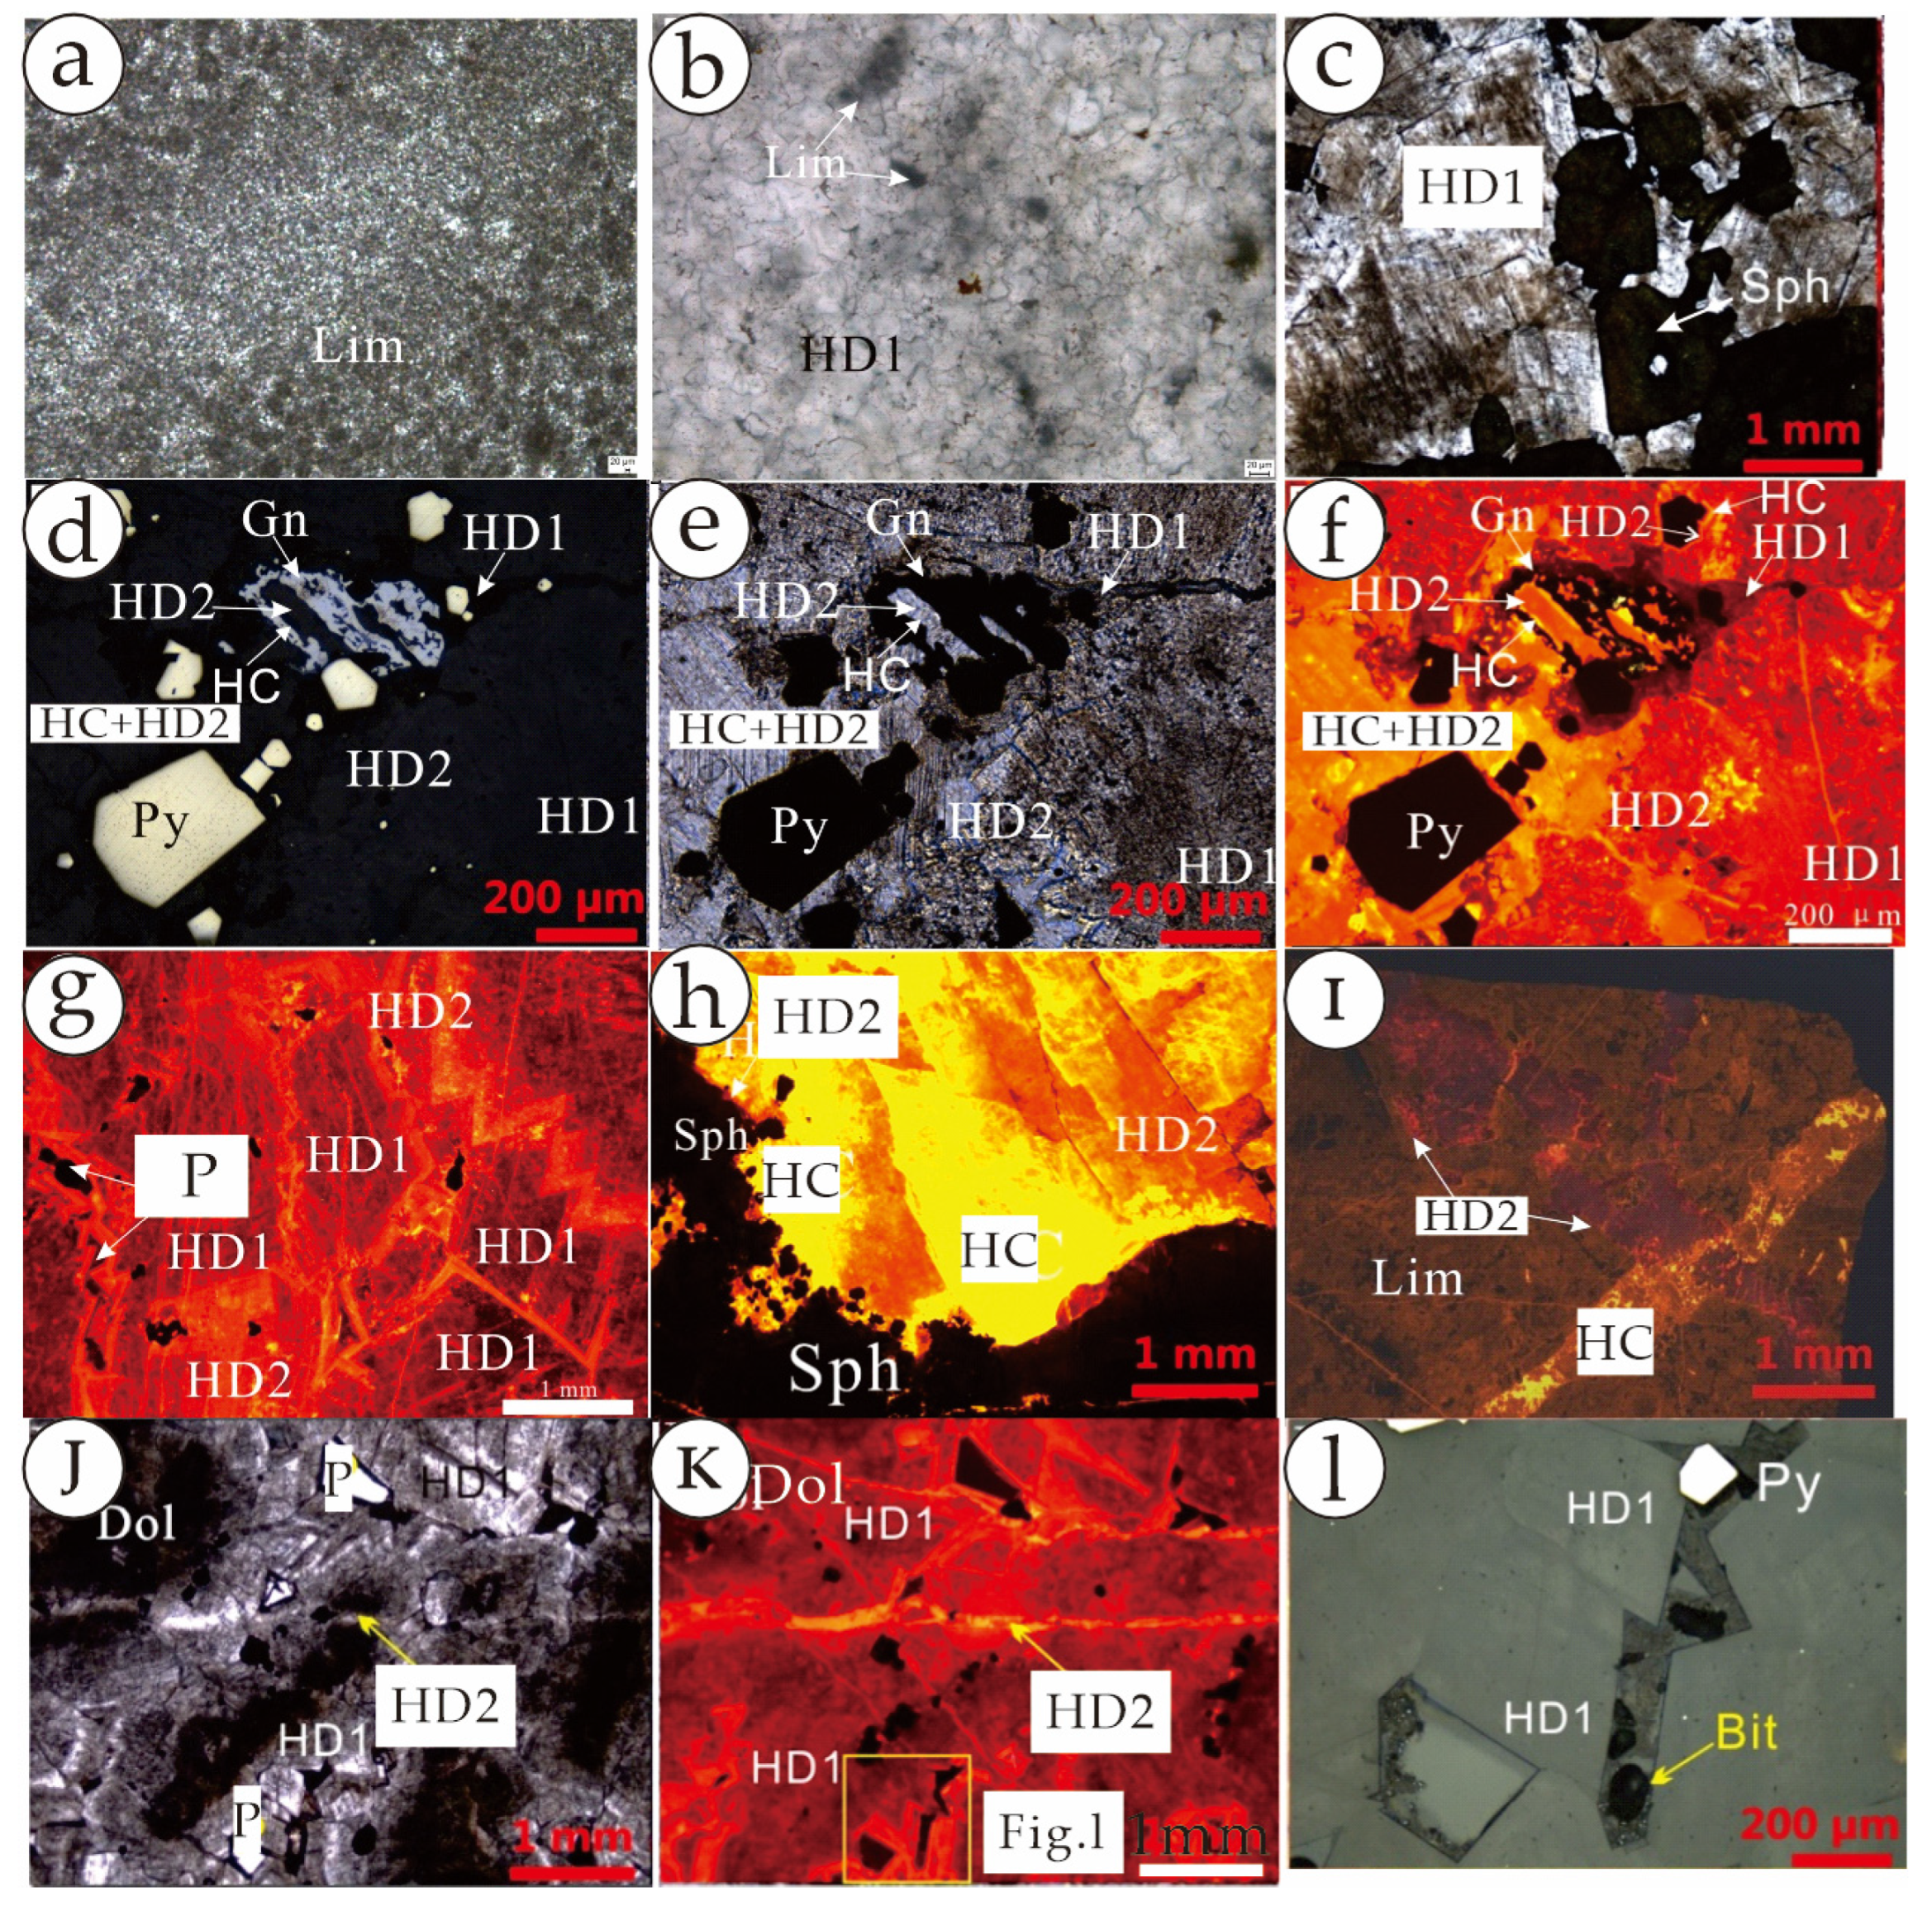
4.2. Microscopic Characteristics of Samples
4.3. Analytical Methods
5. Test Results
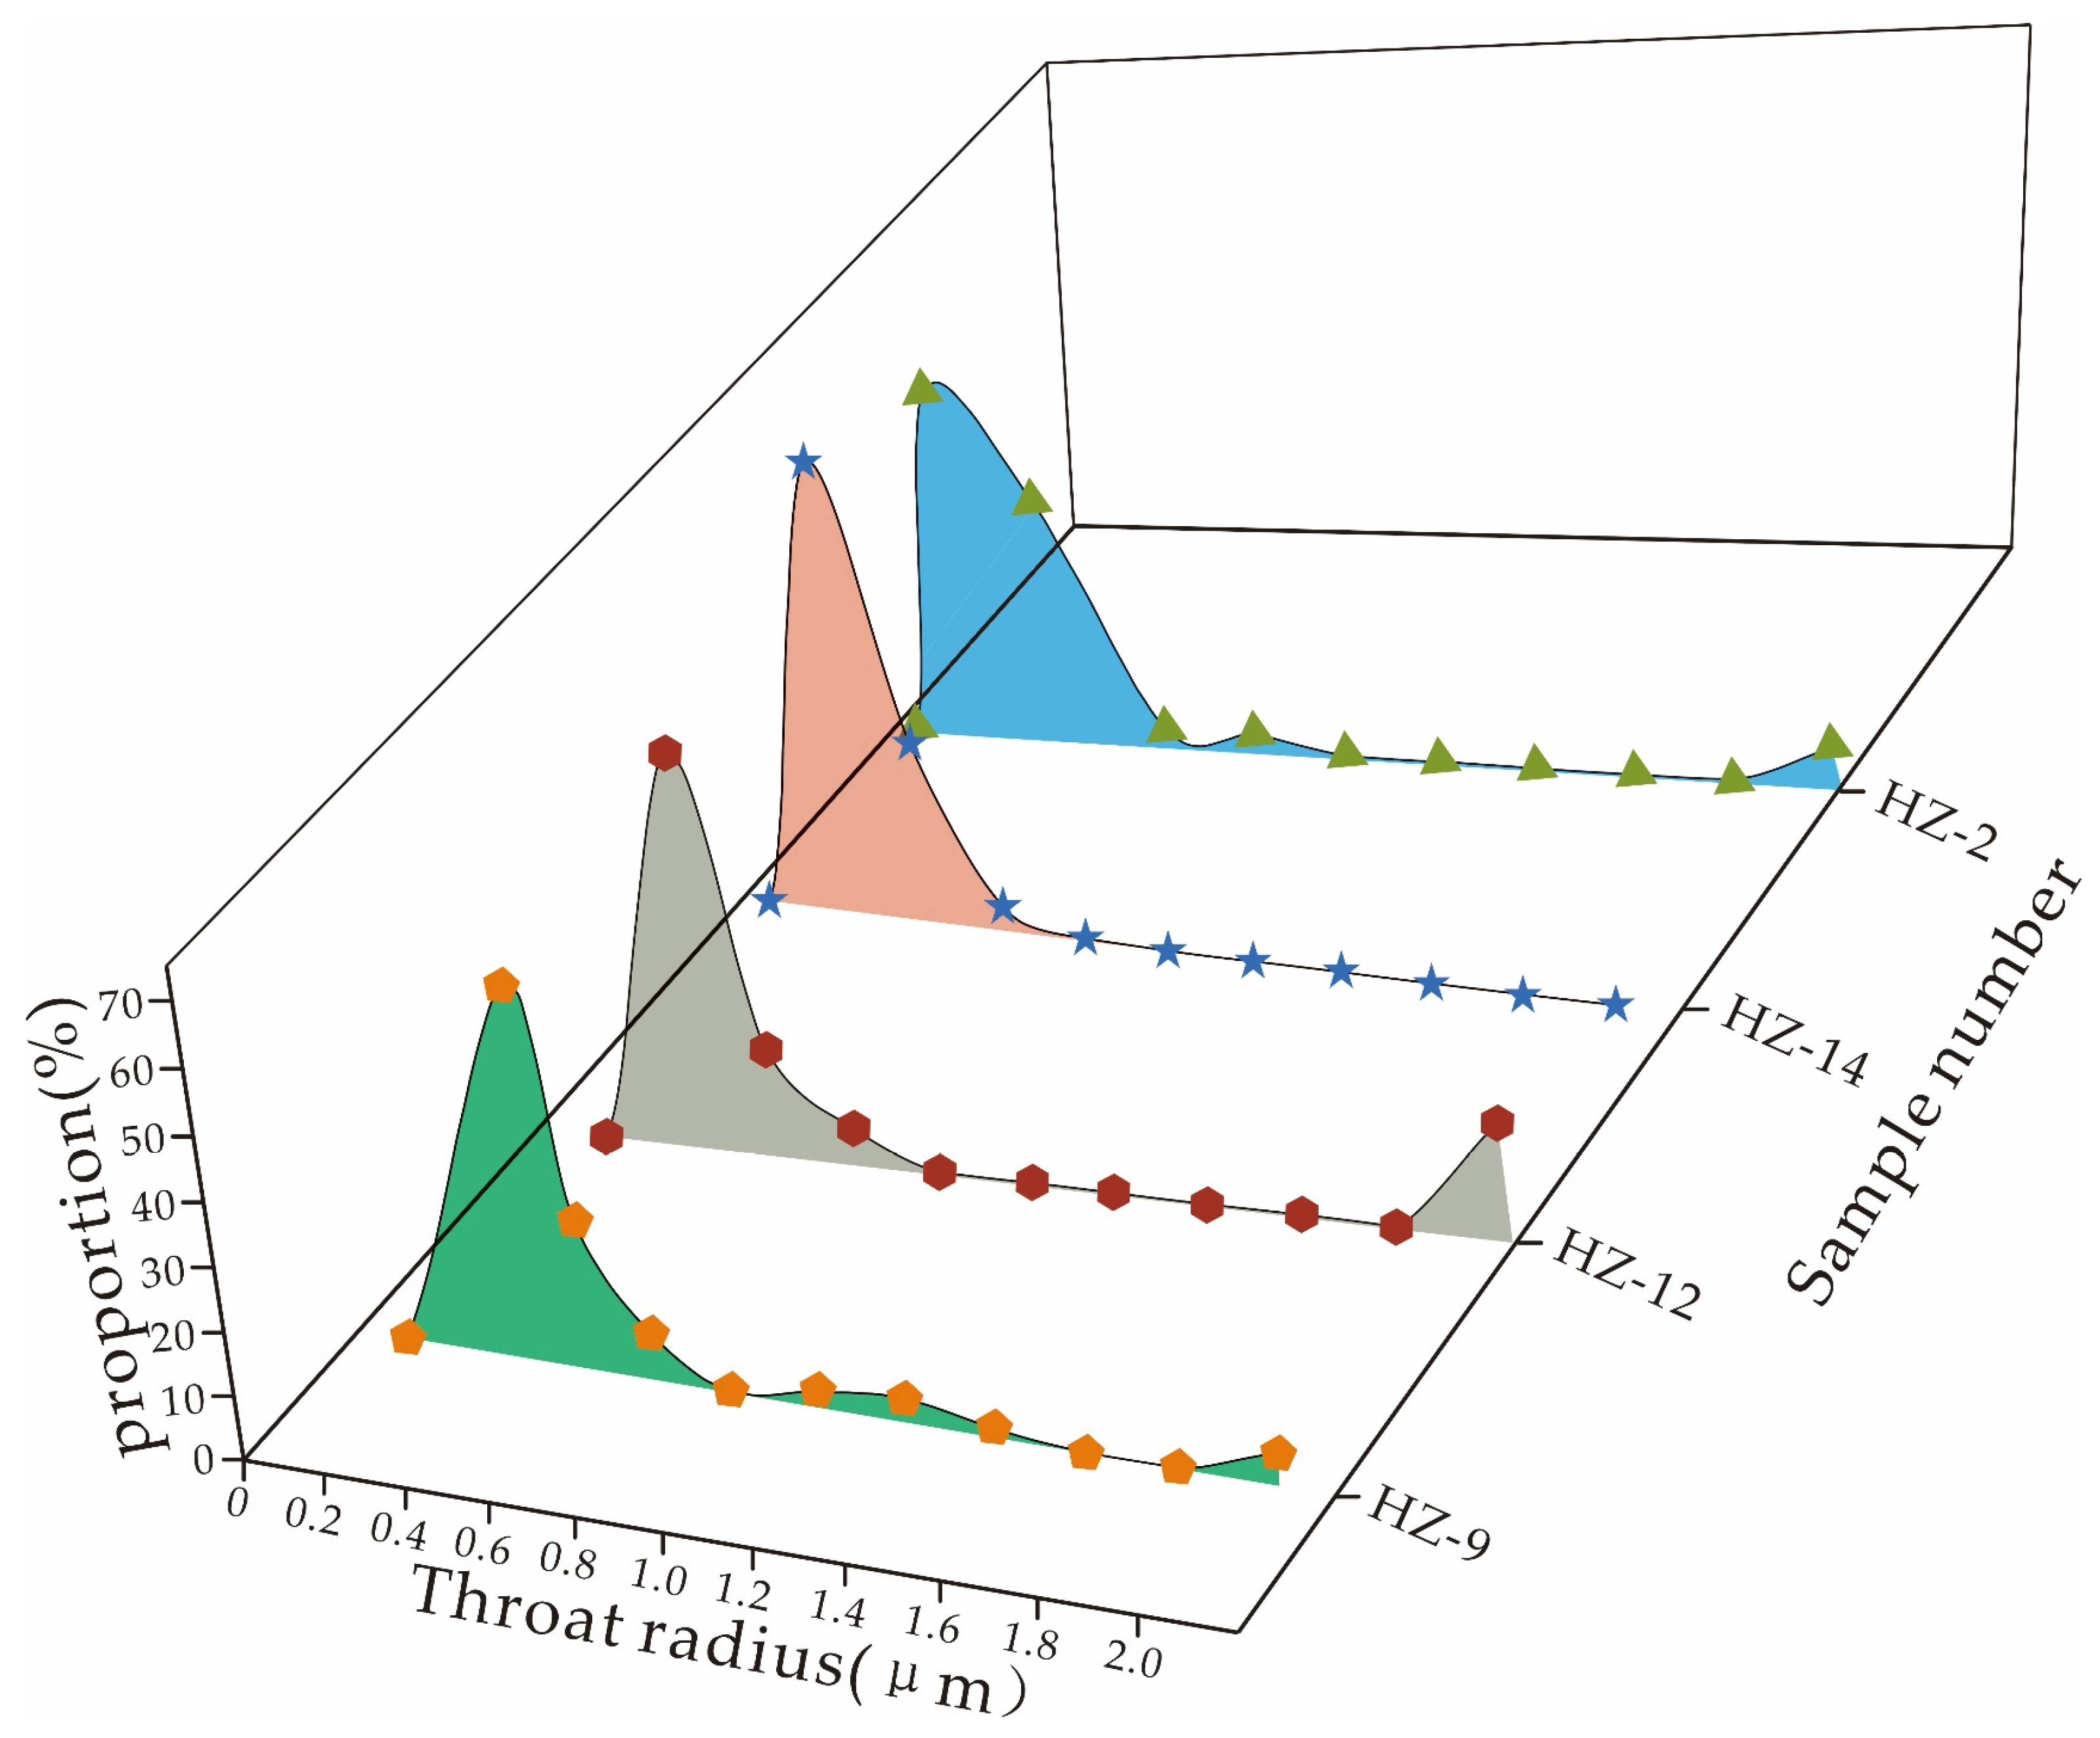
5.1. Radius of the Pore Throat Channel
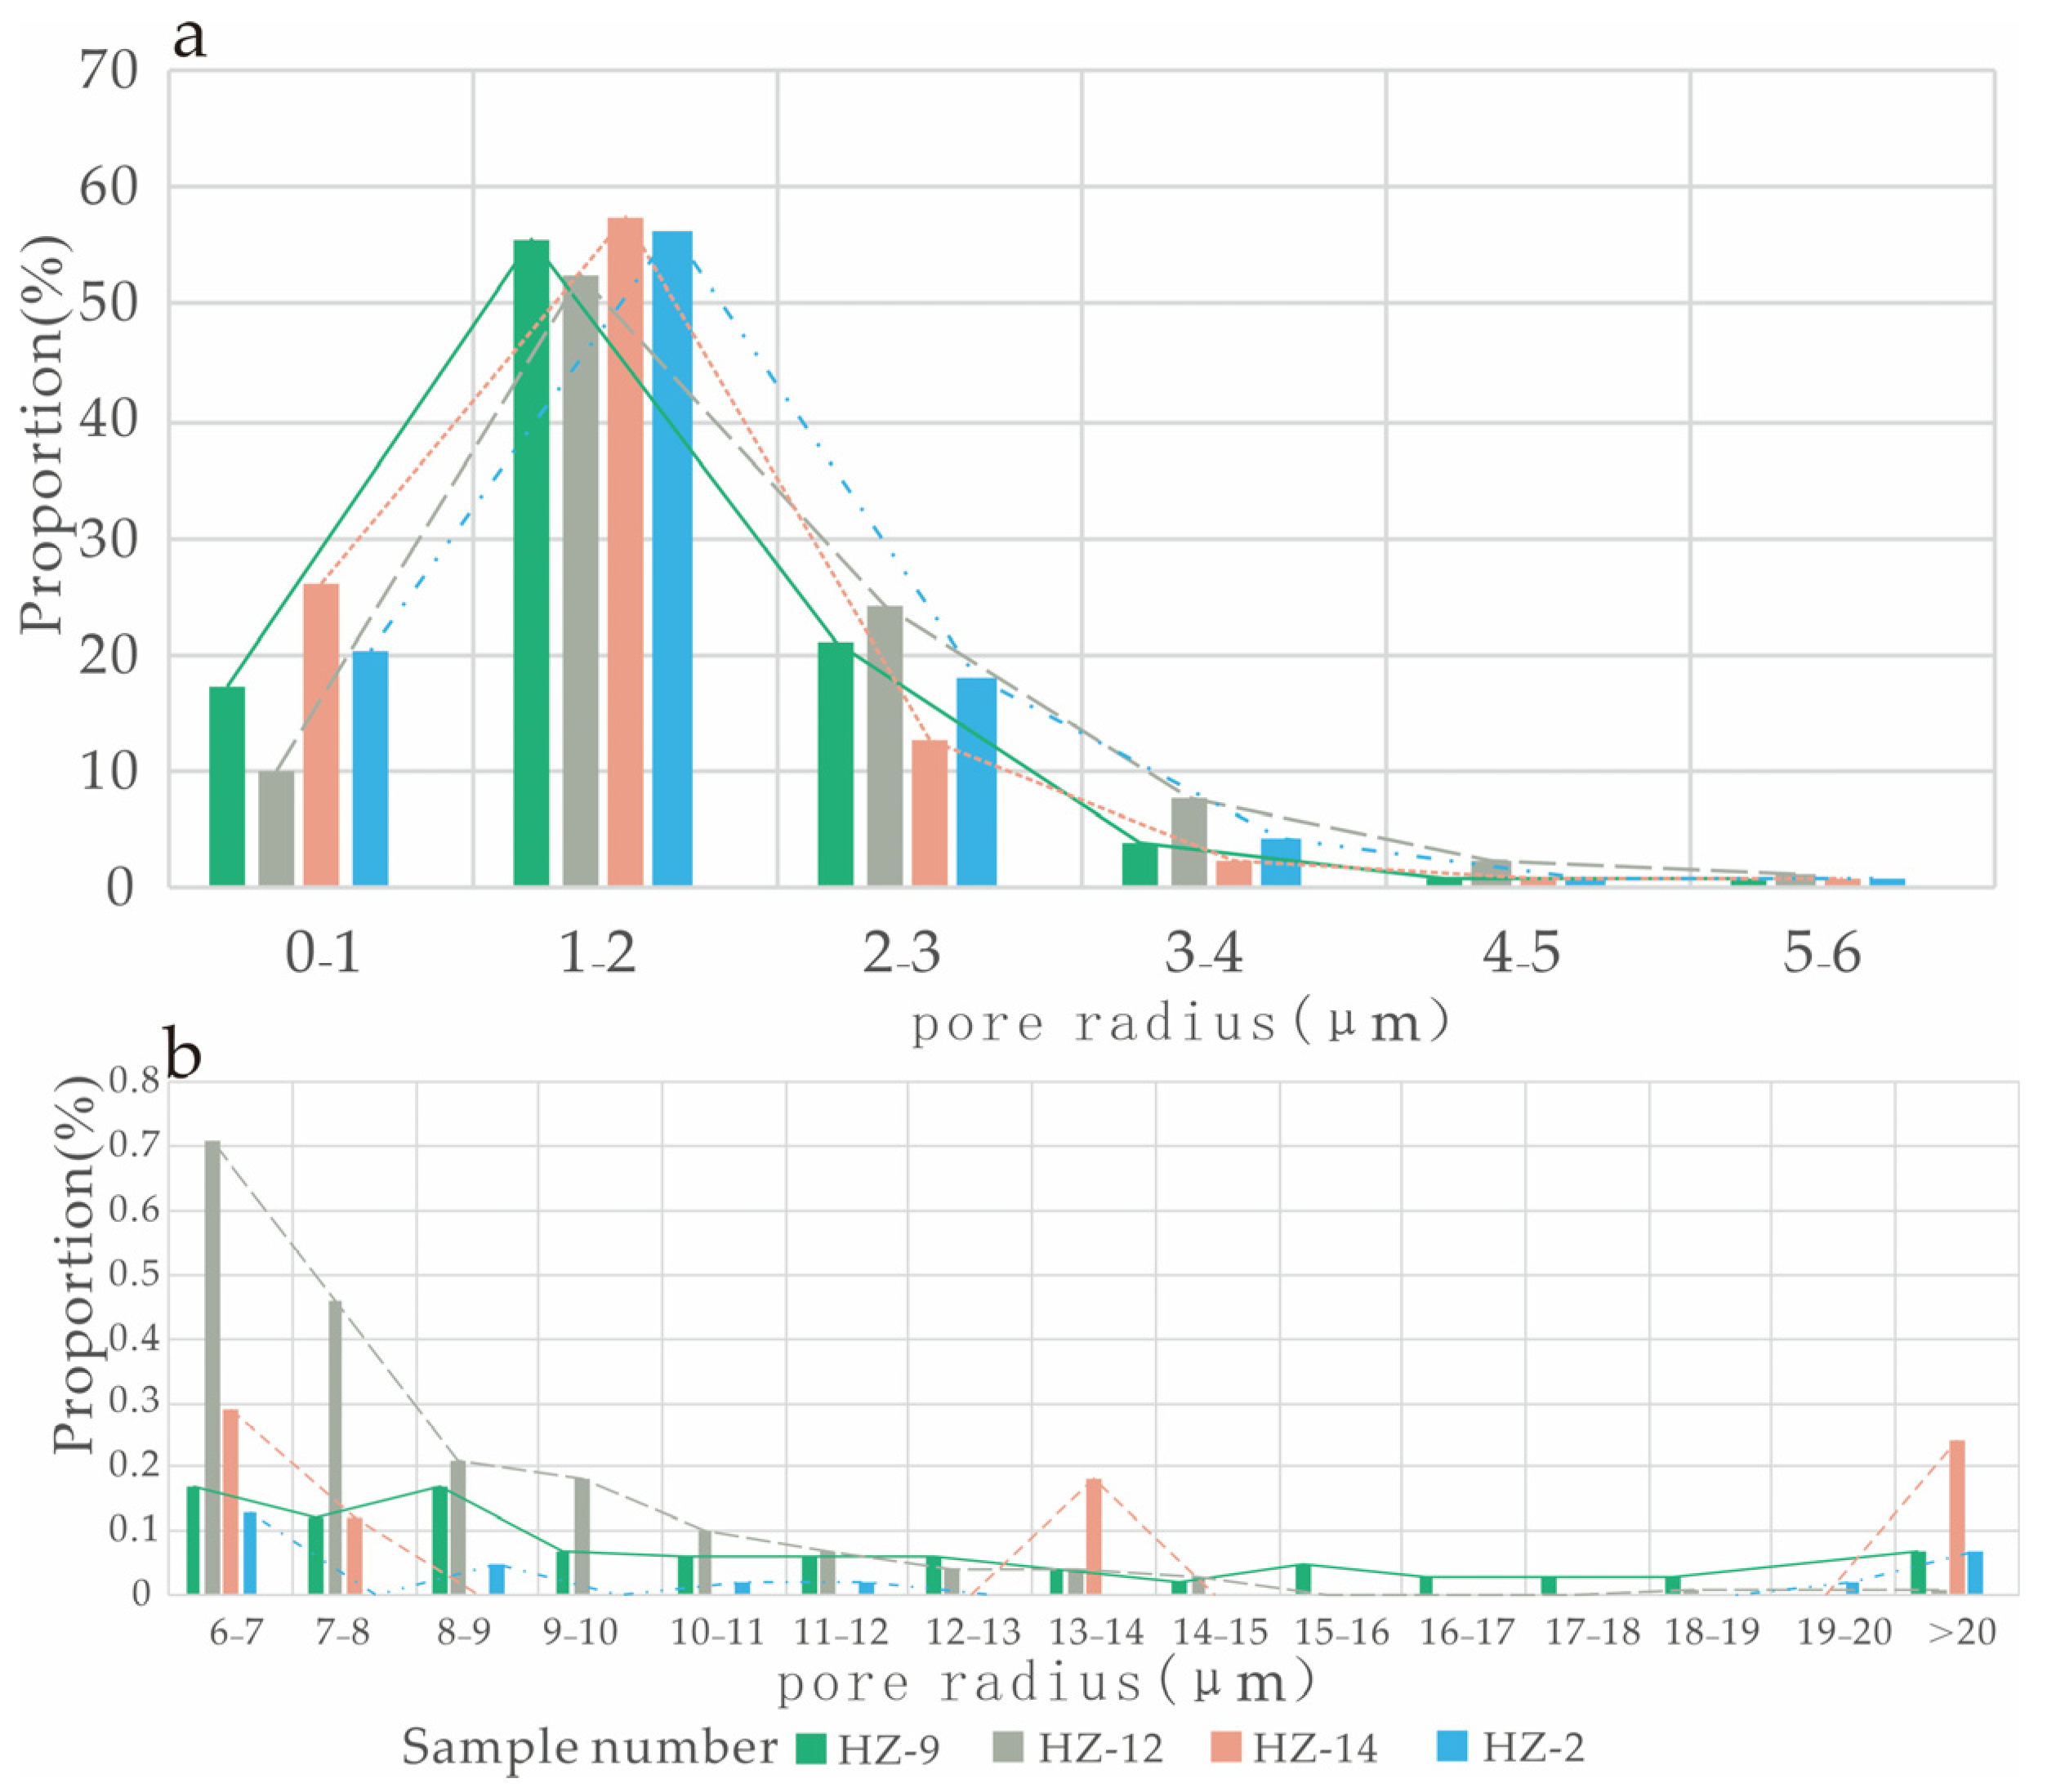
5.2. Pore Radius
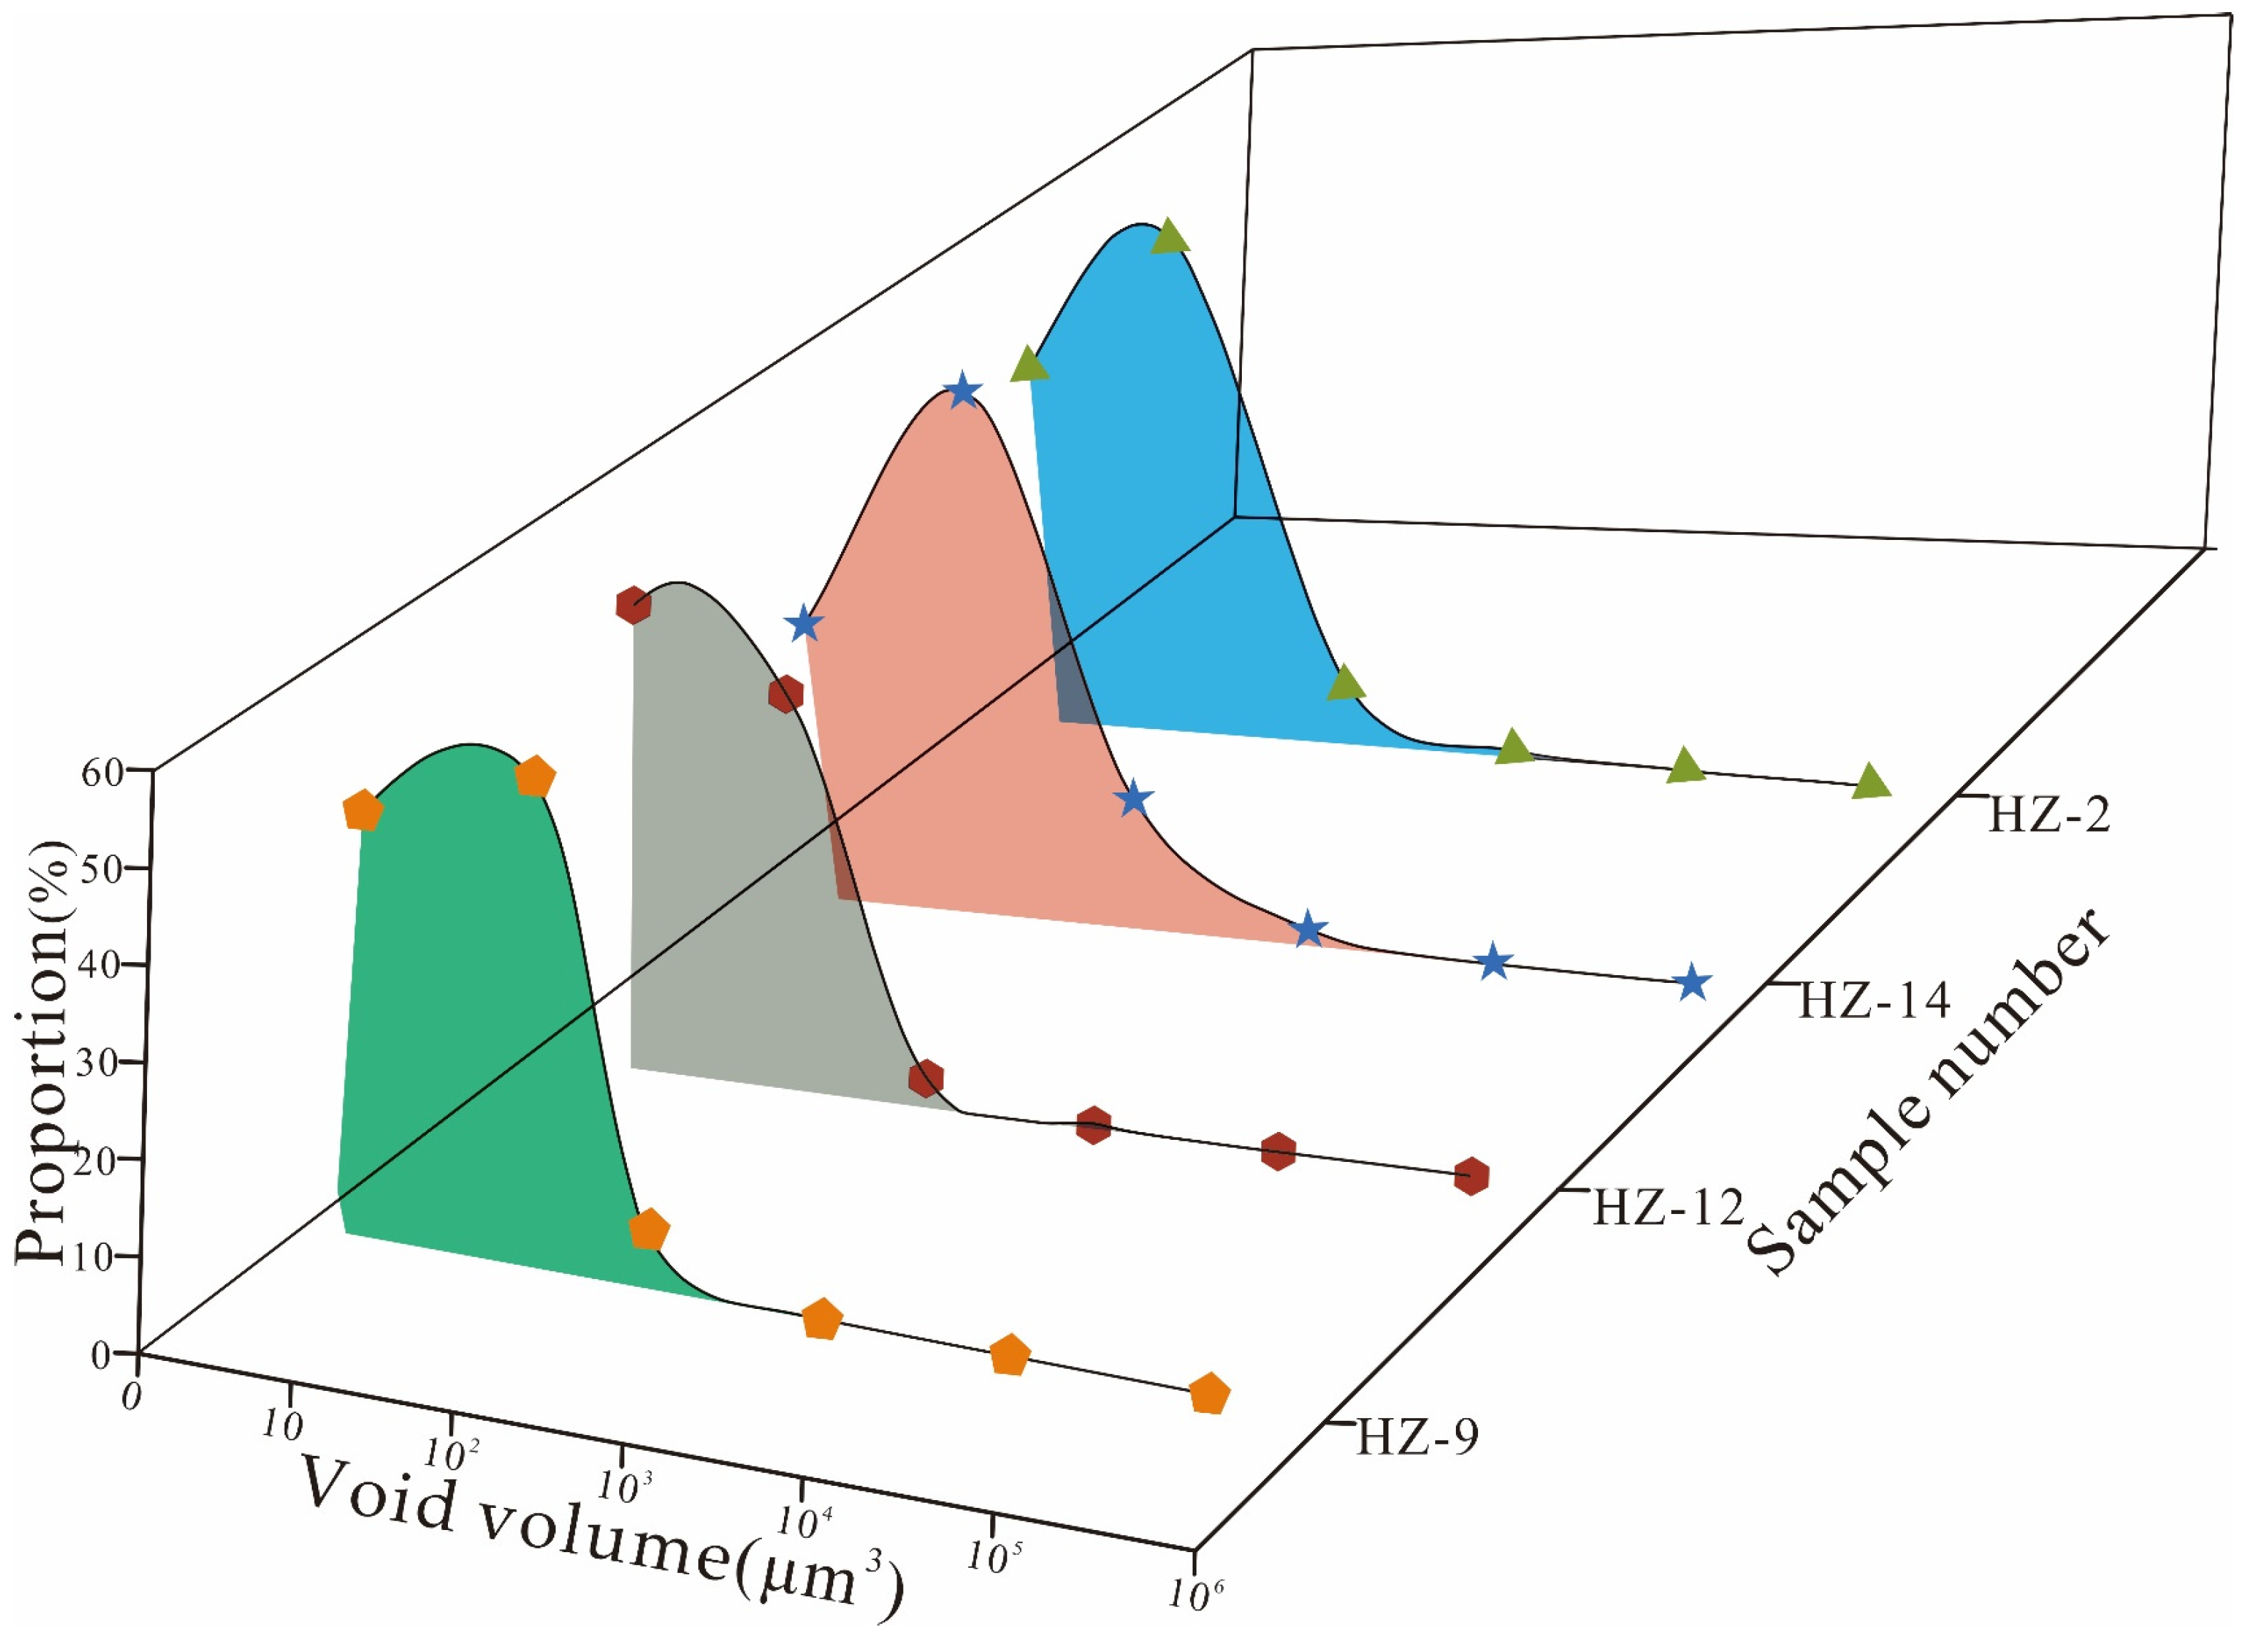
5.3. Pore Volume
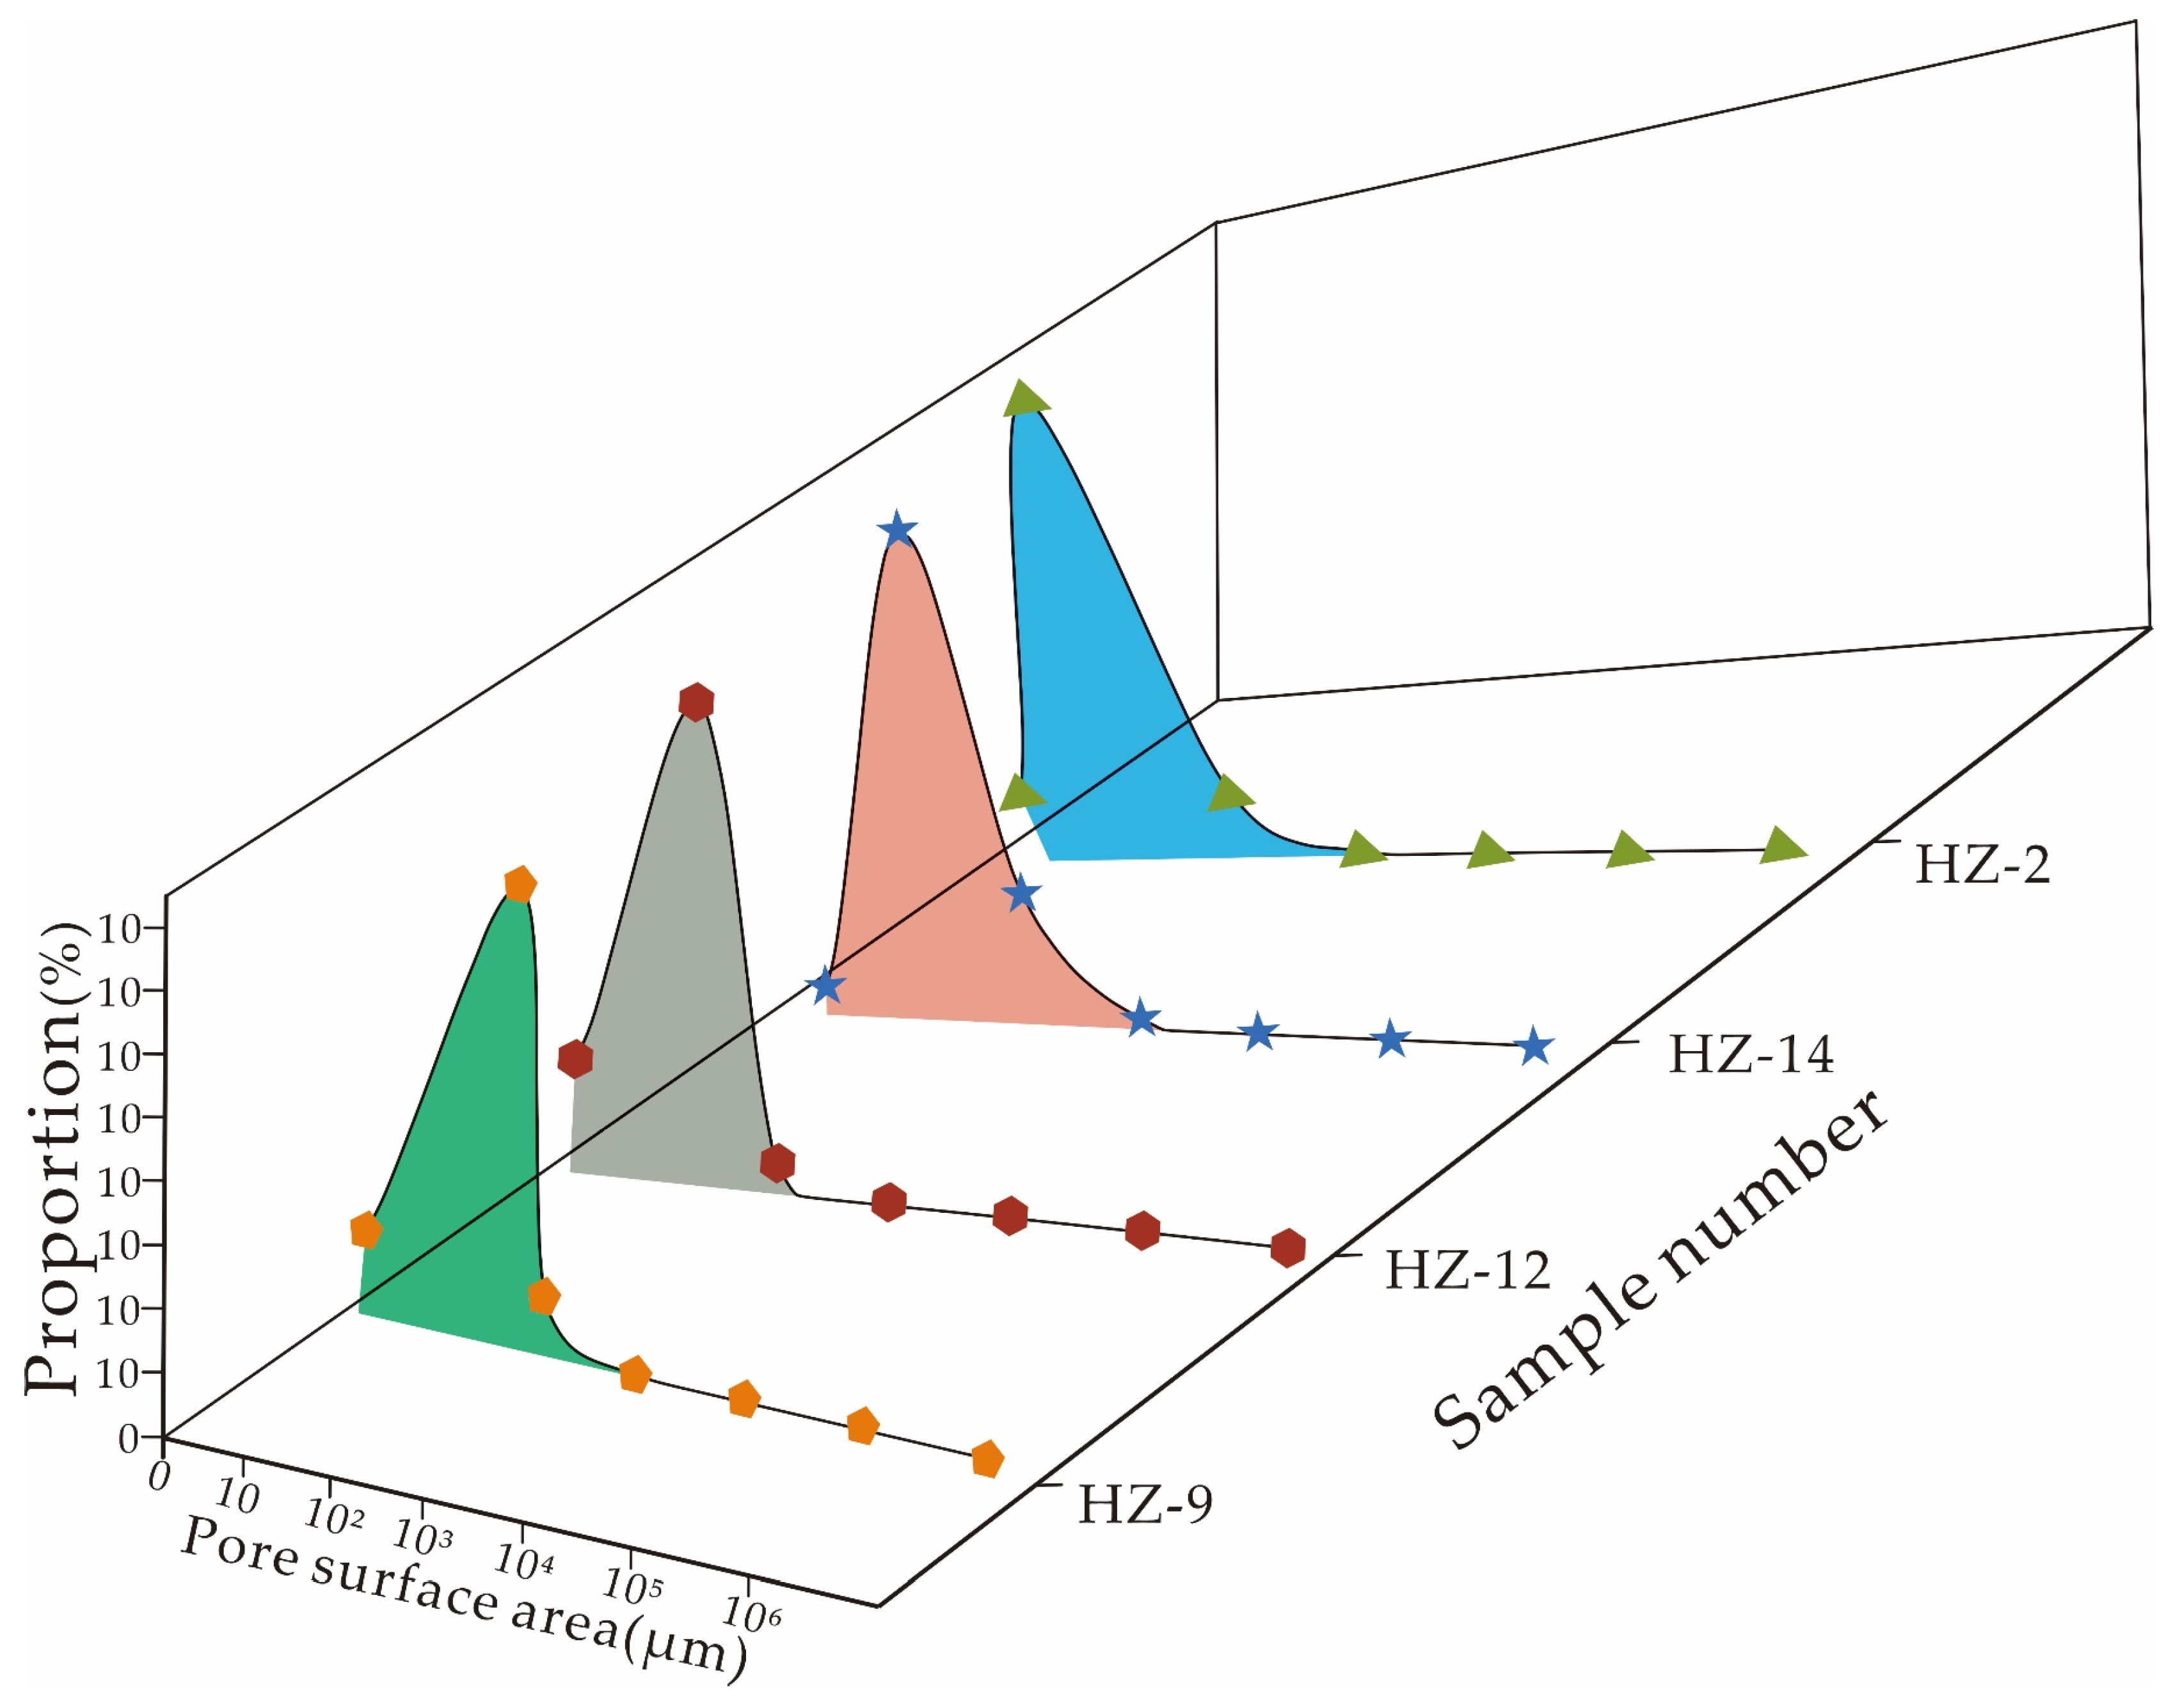
5.4. Pore Surface Area
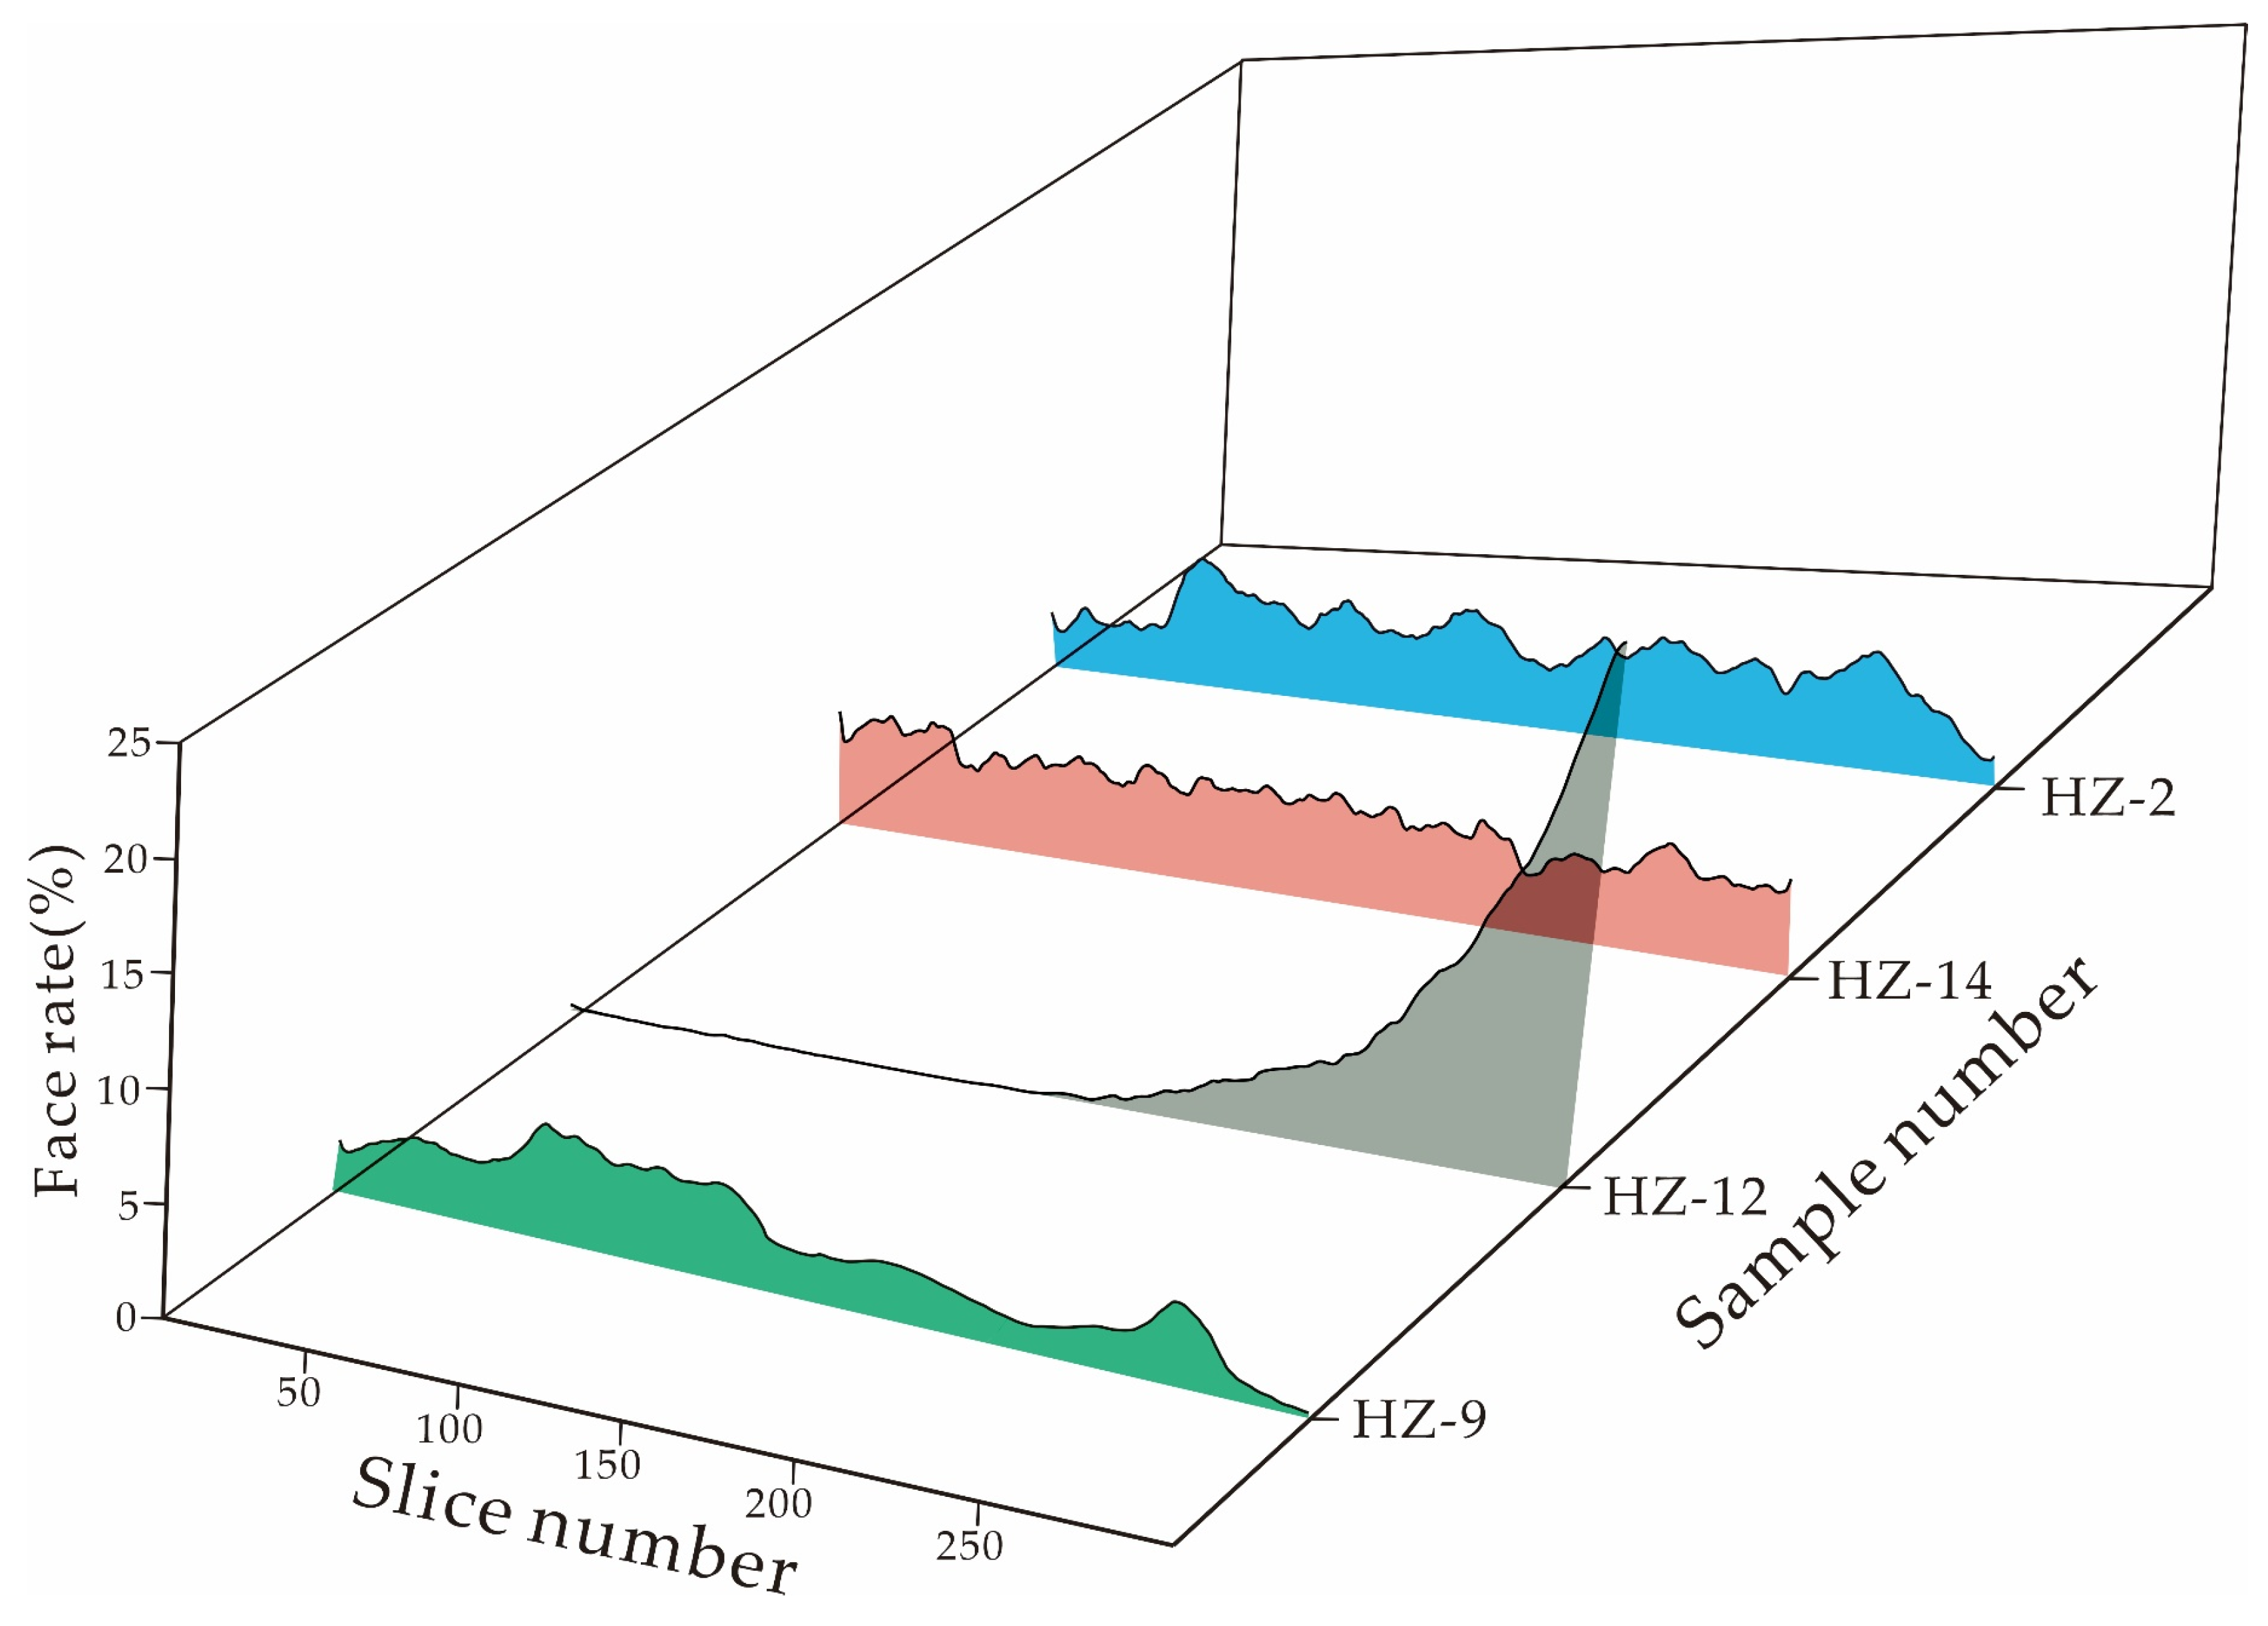
5.5. Face Rate
6. Discussion
6.1. Variation in the Porosity with the Decreasing Distance from Ore Bodies
6.2. Relationship between the Alteration, Porosity and Ore Location
7. Conclusions
- (1)
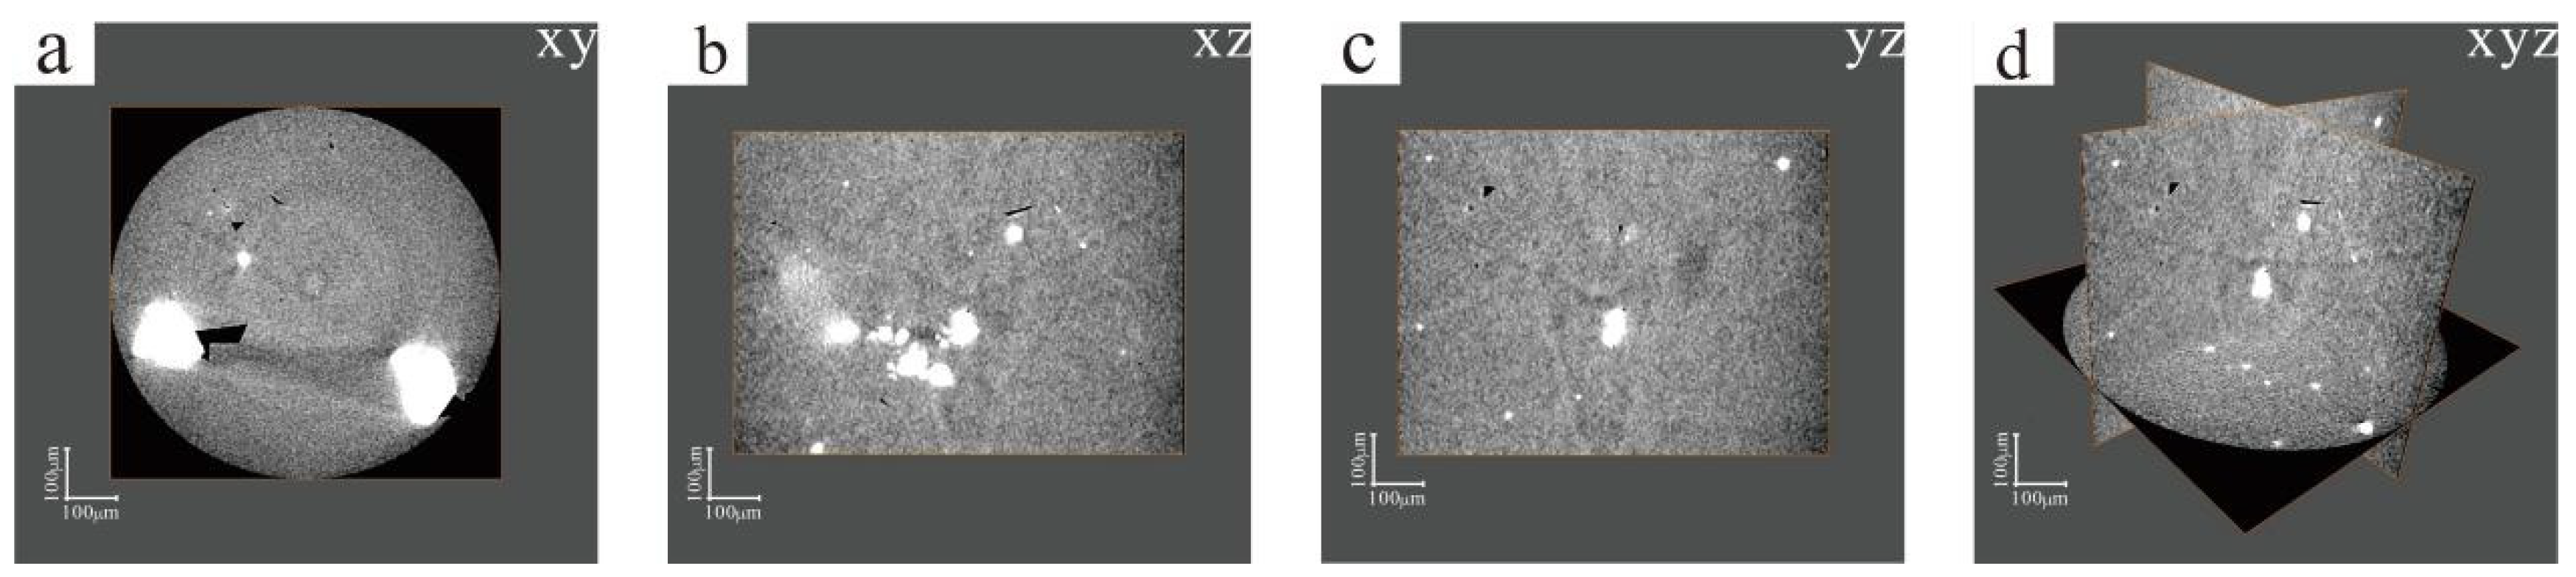
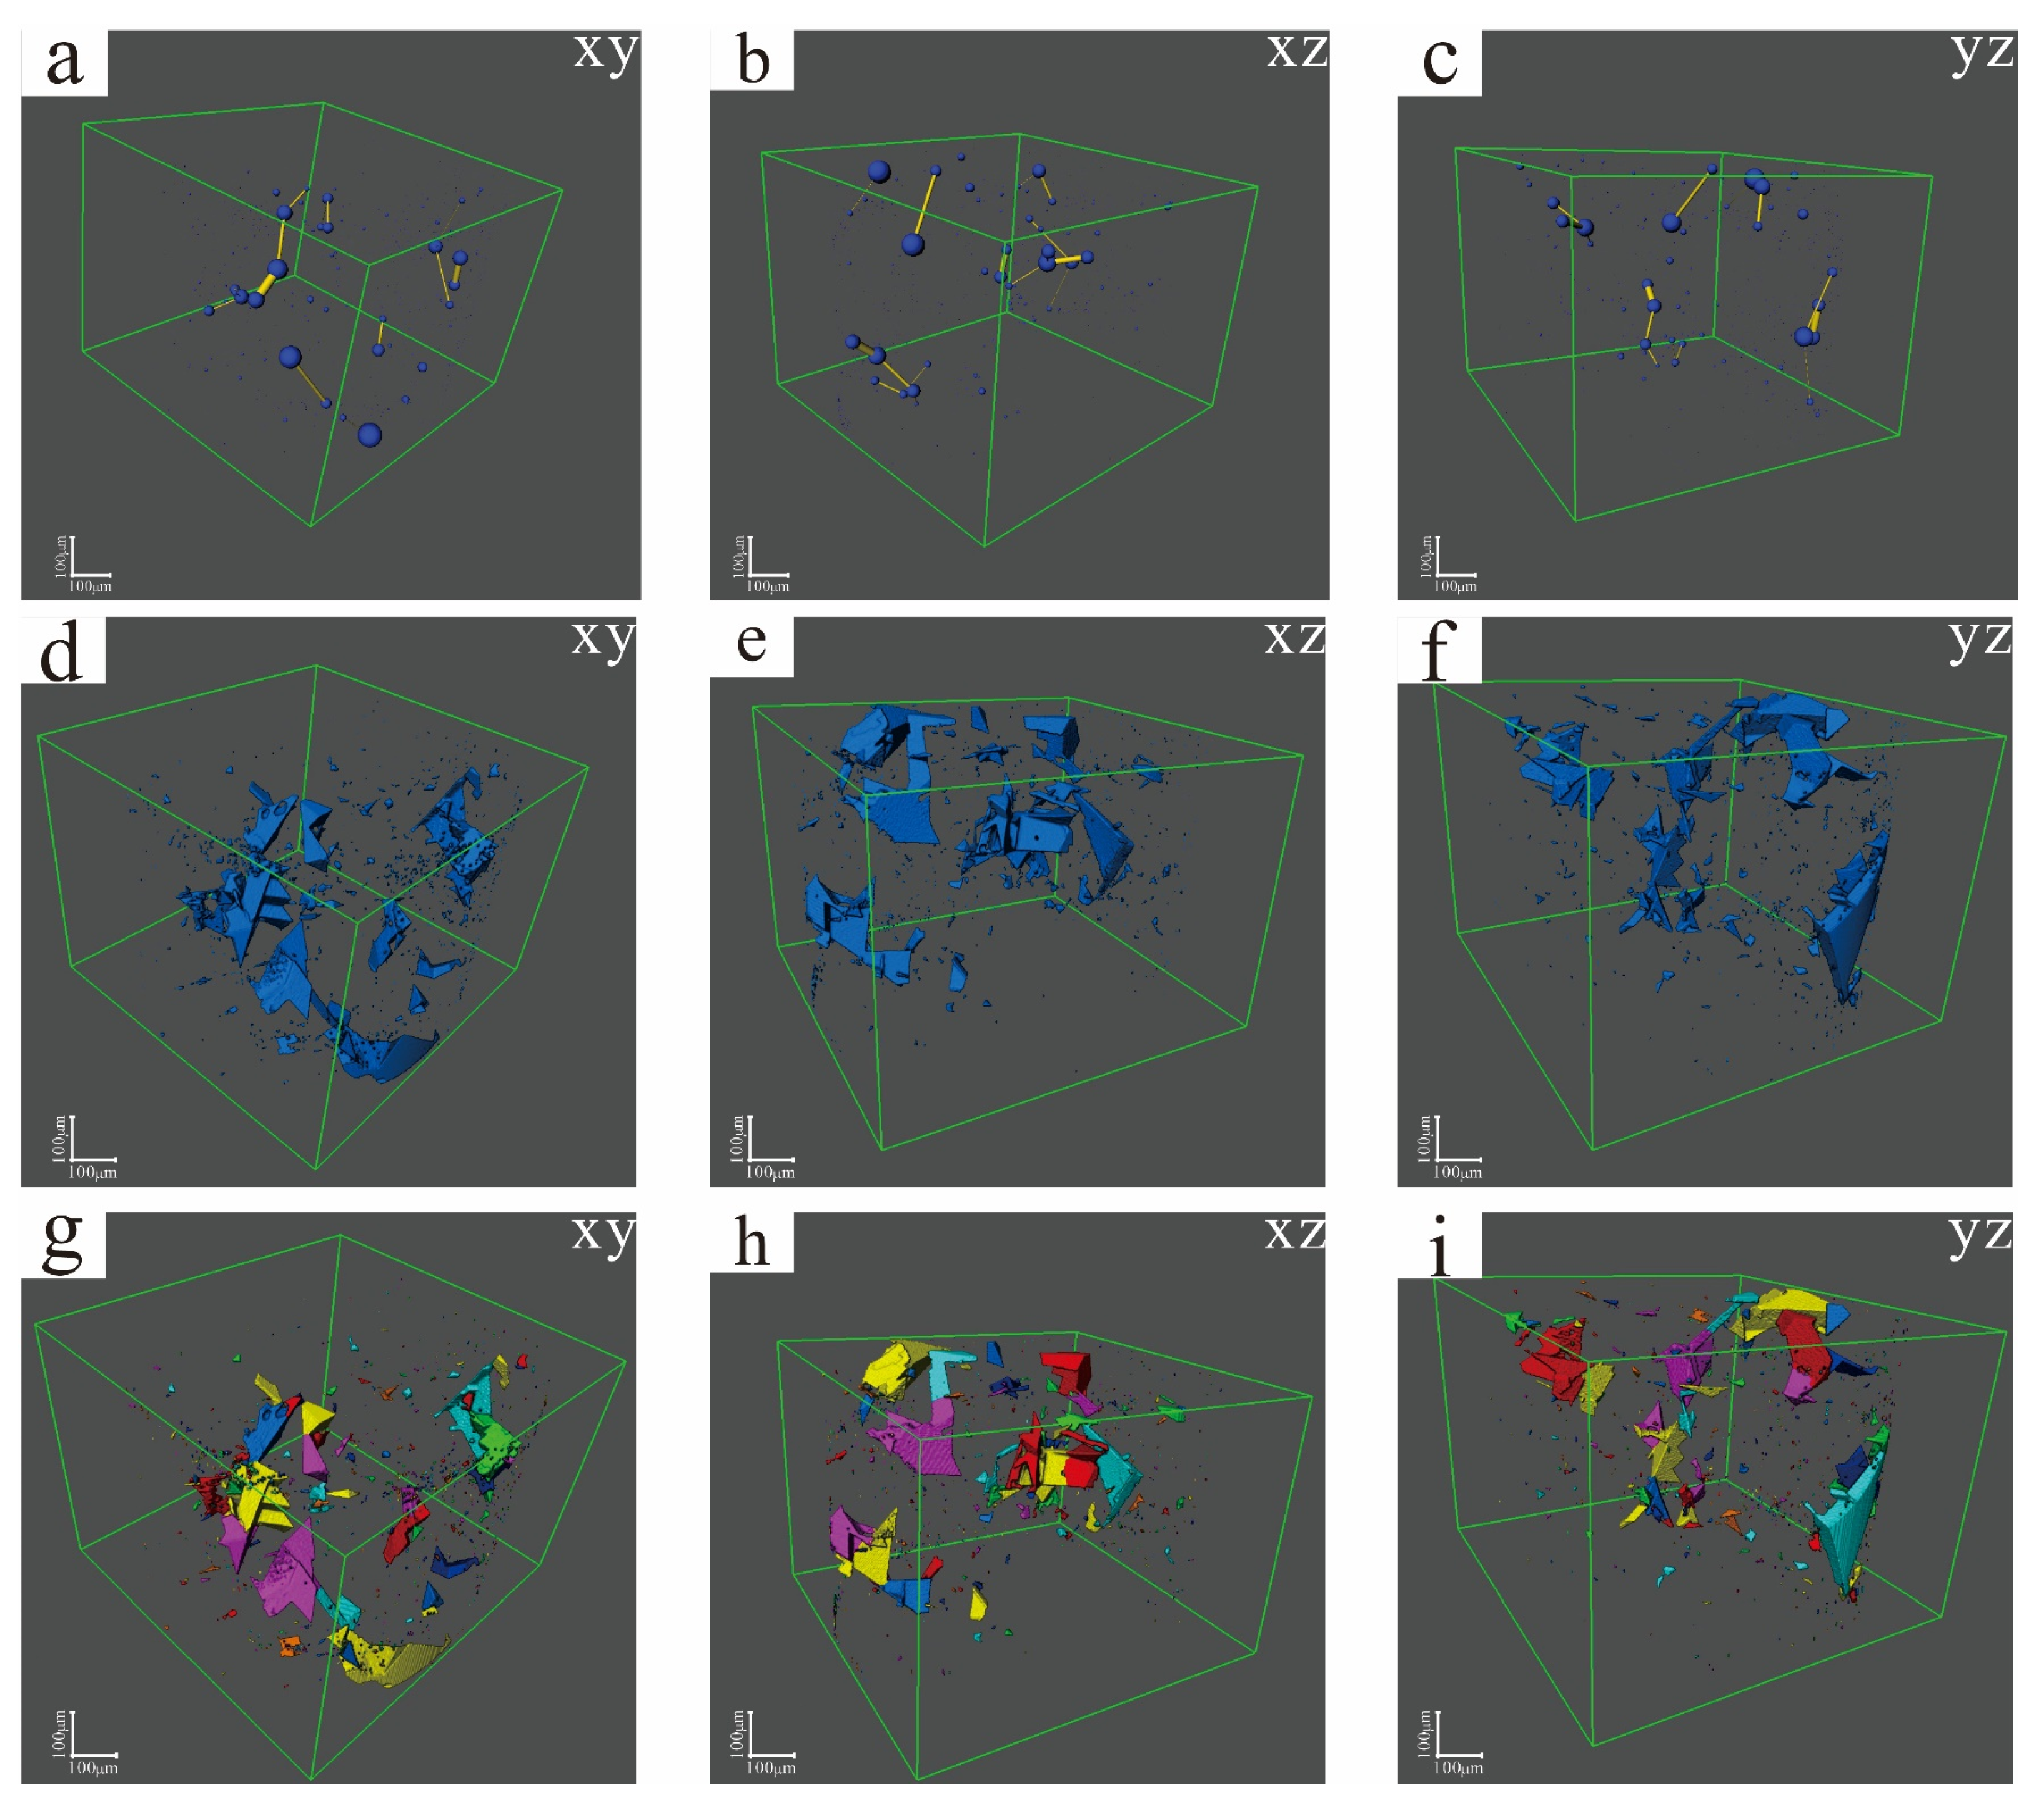
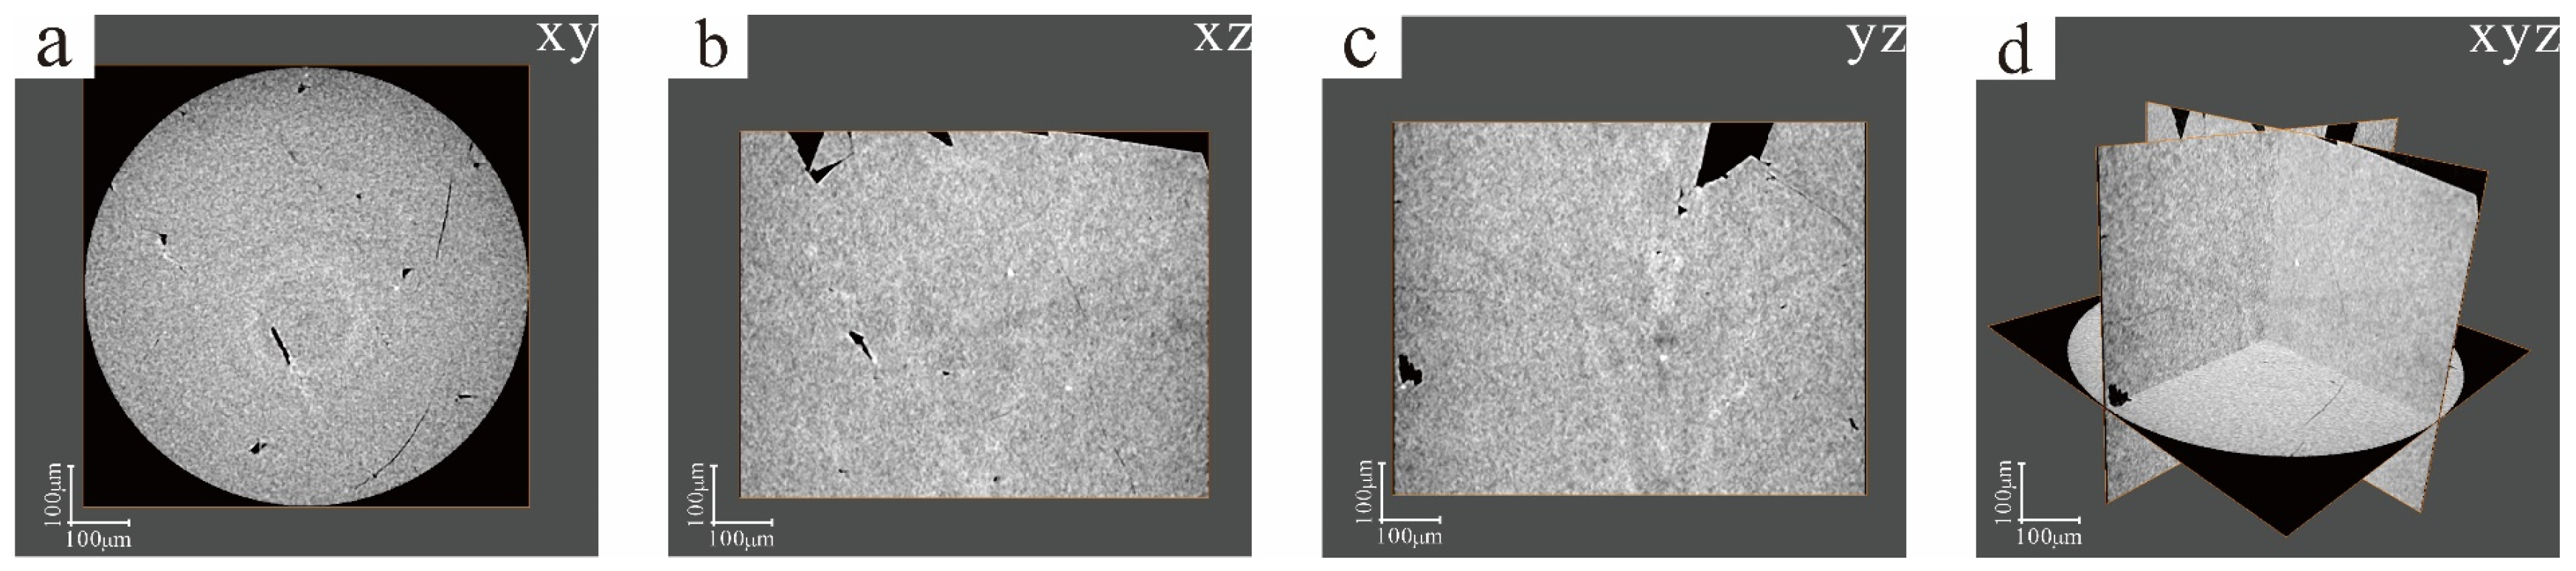
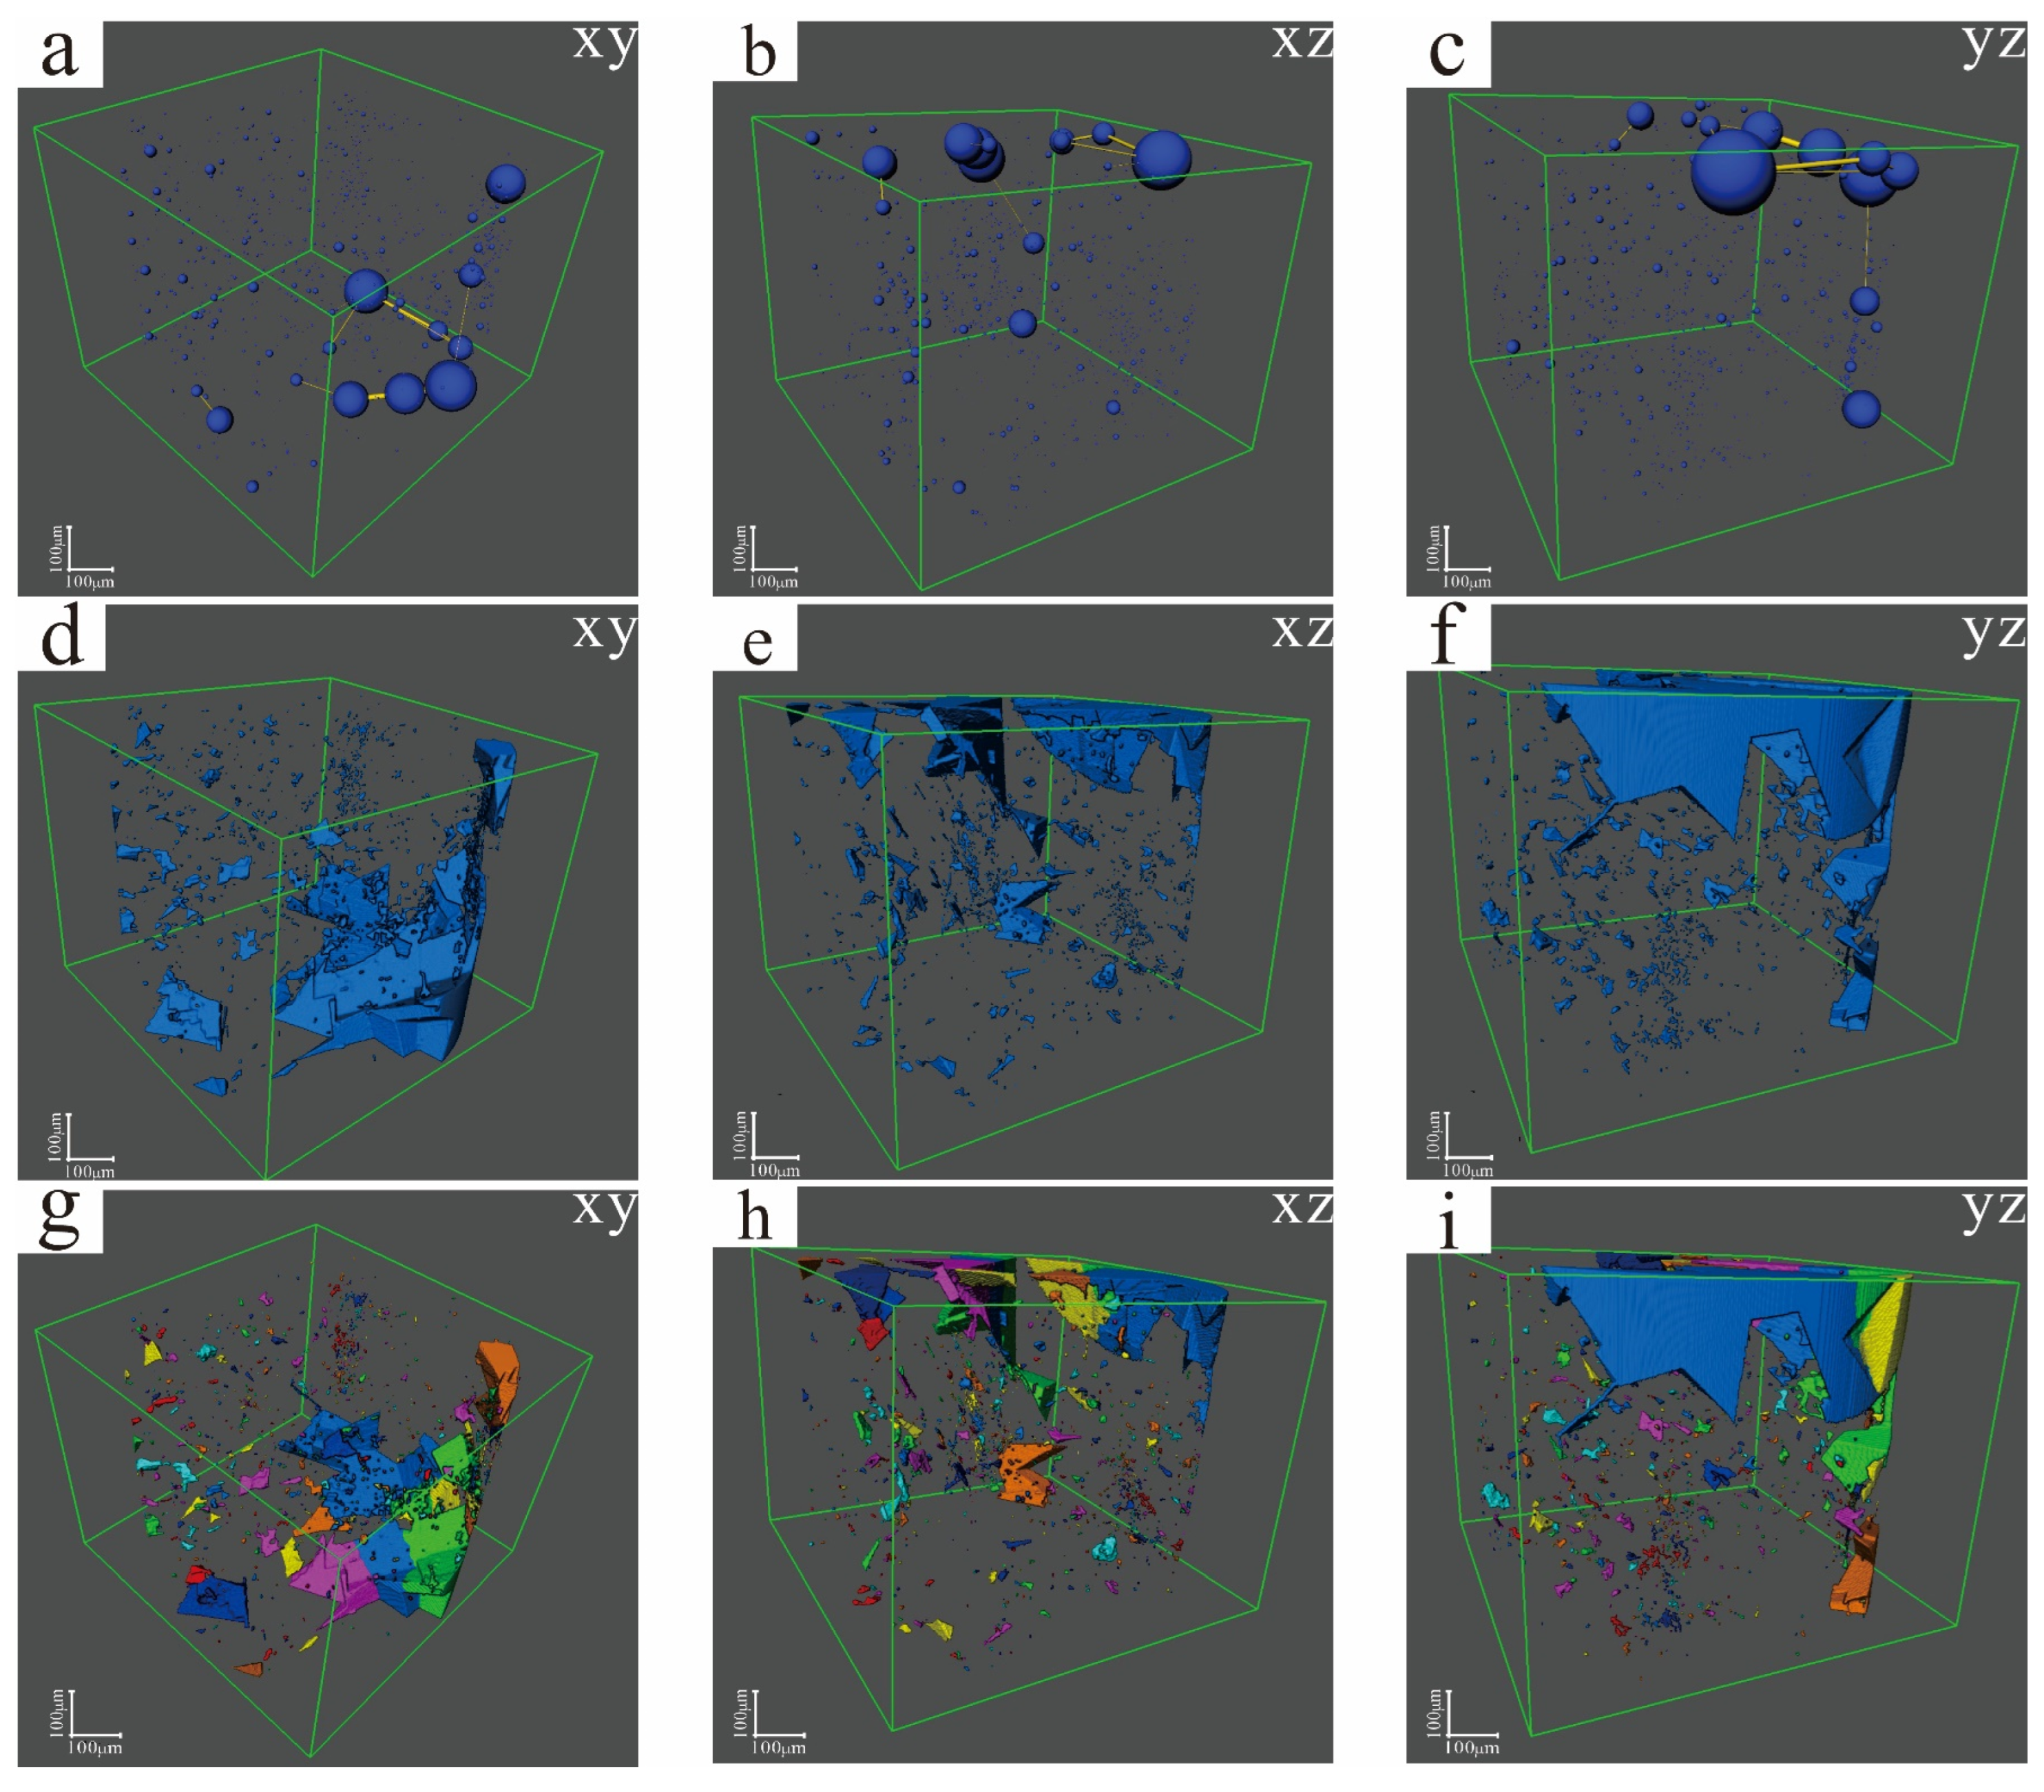
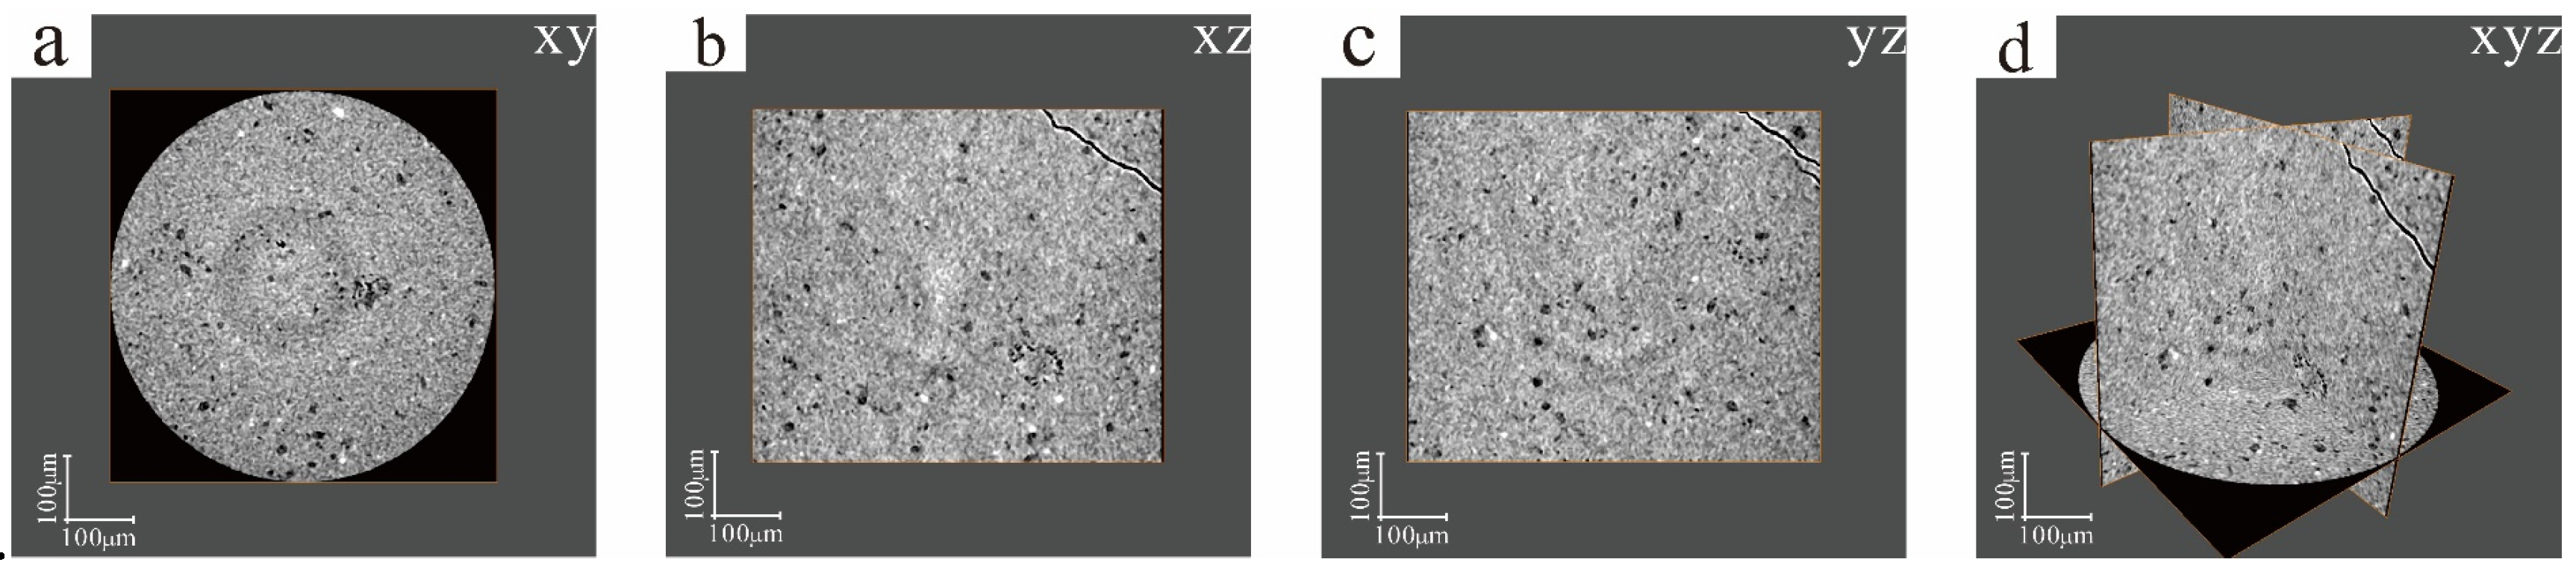
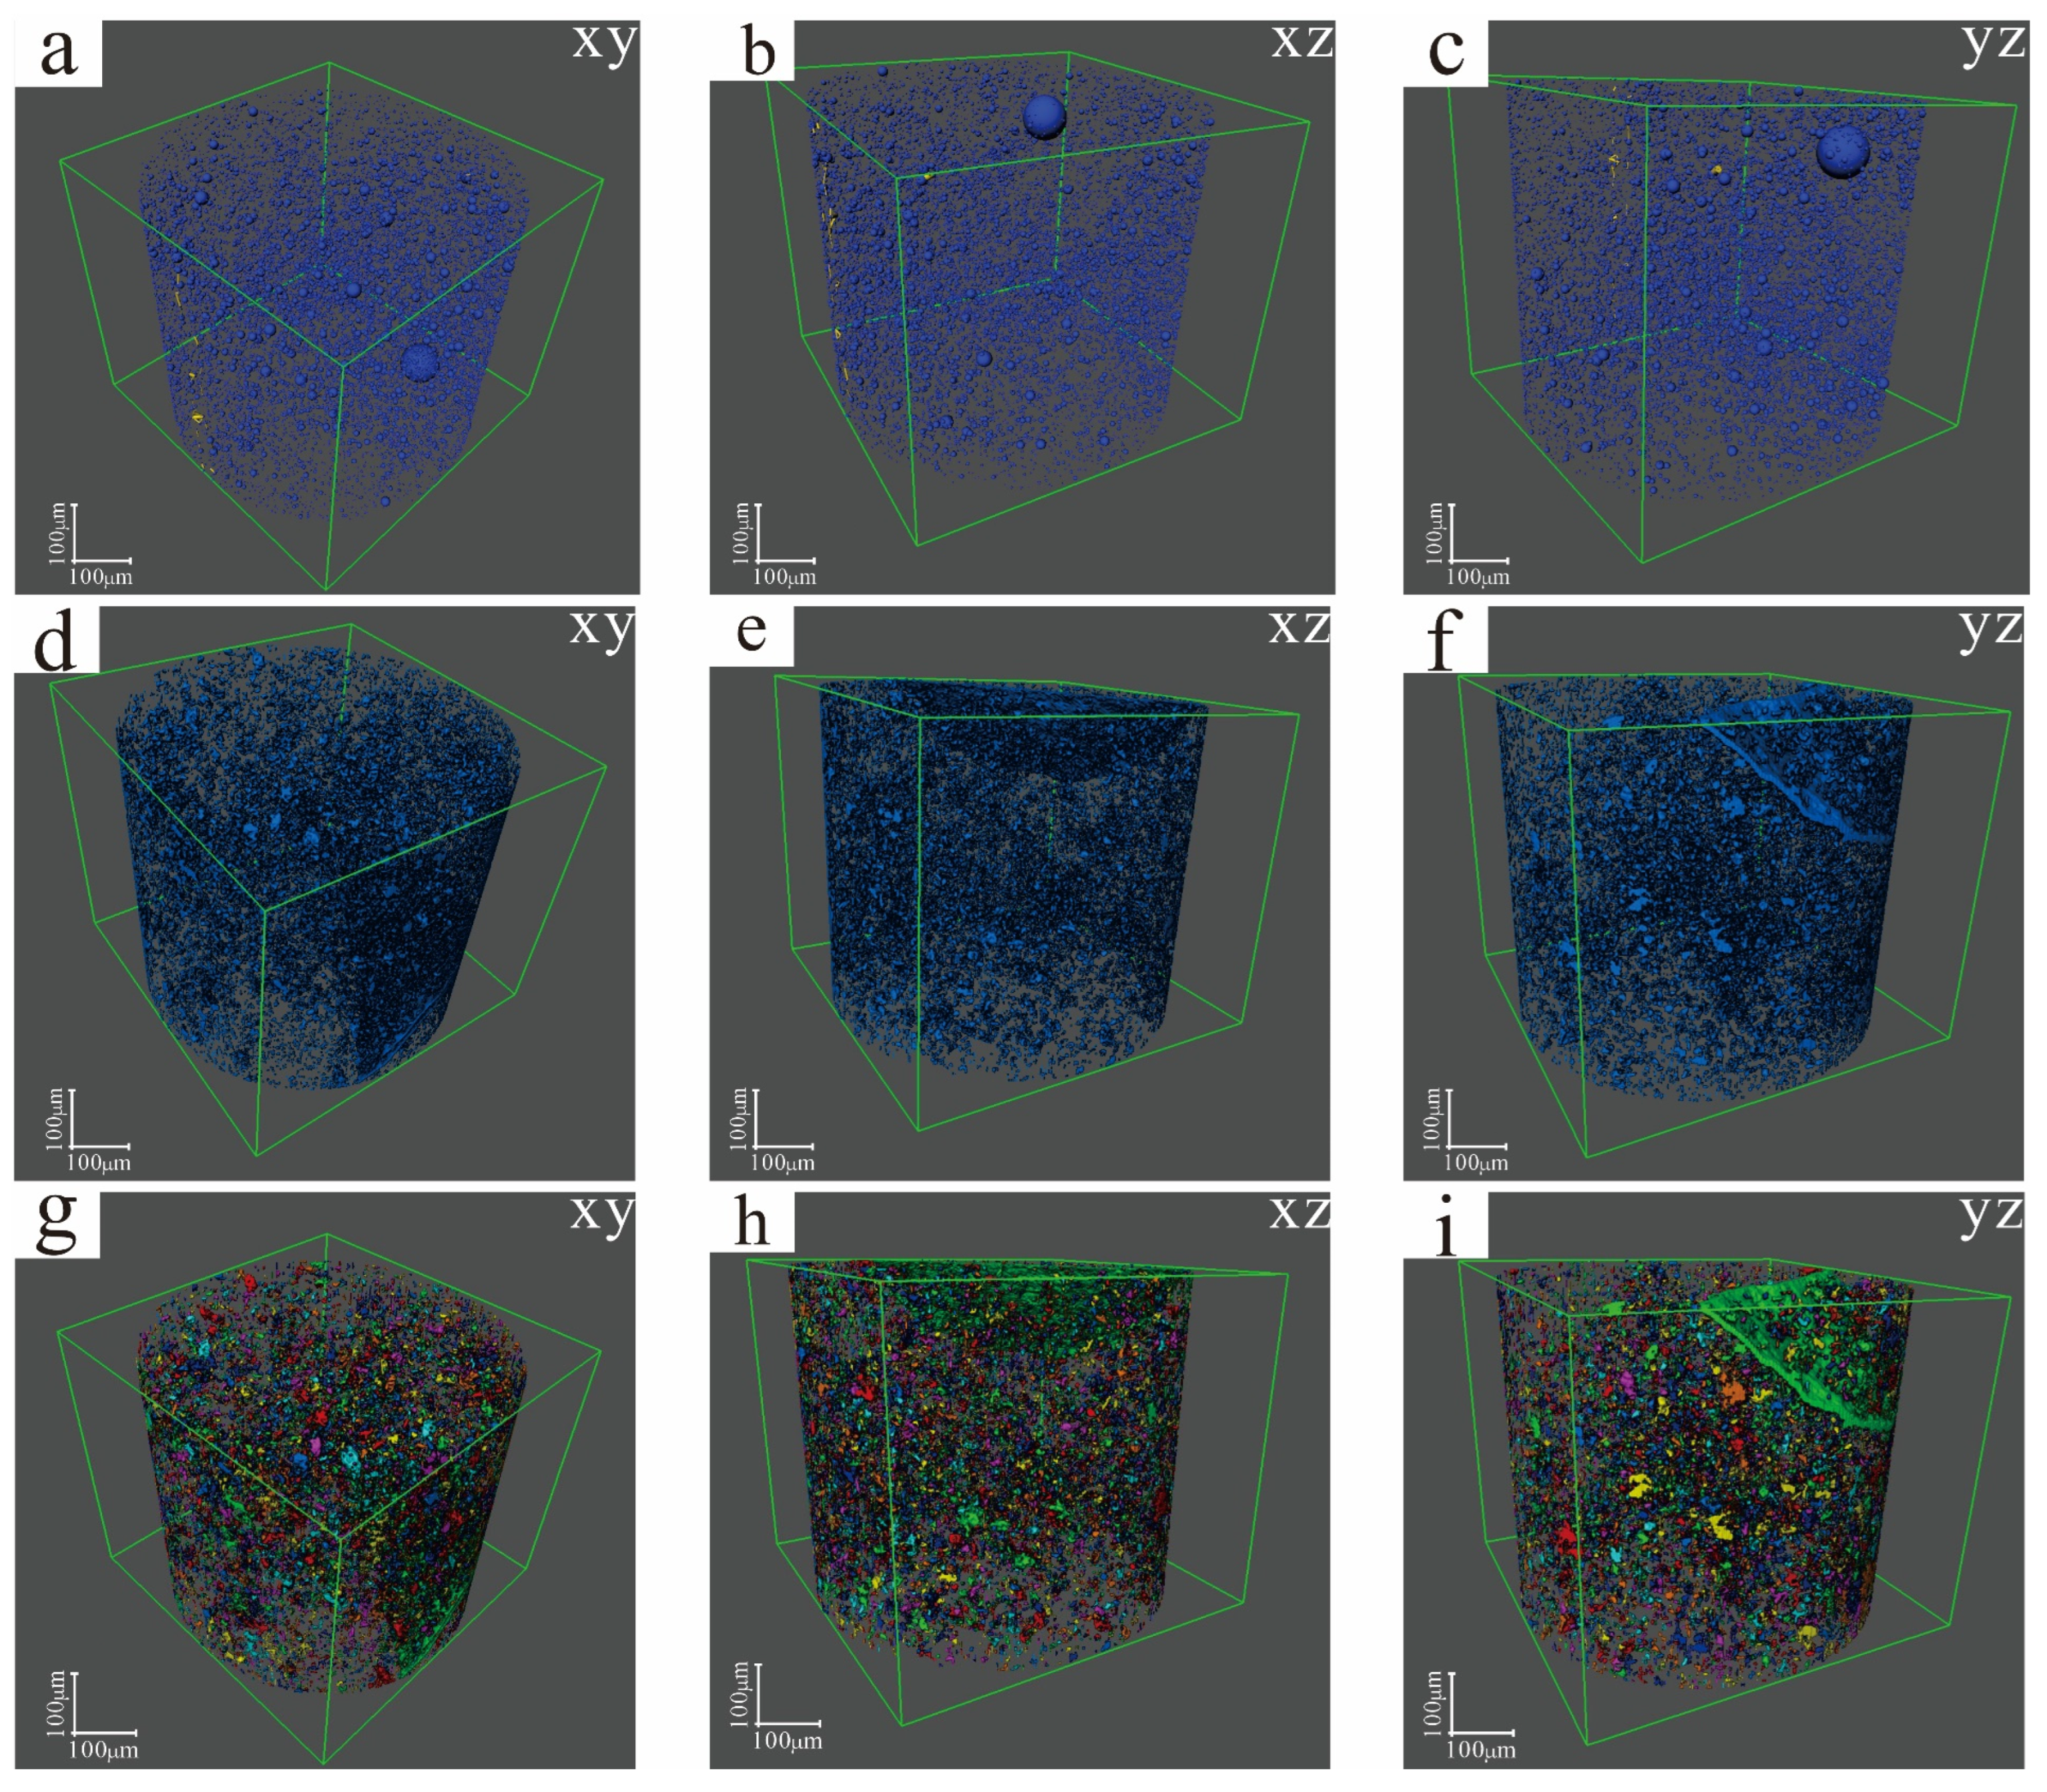
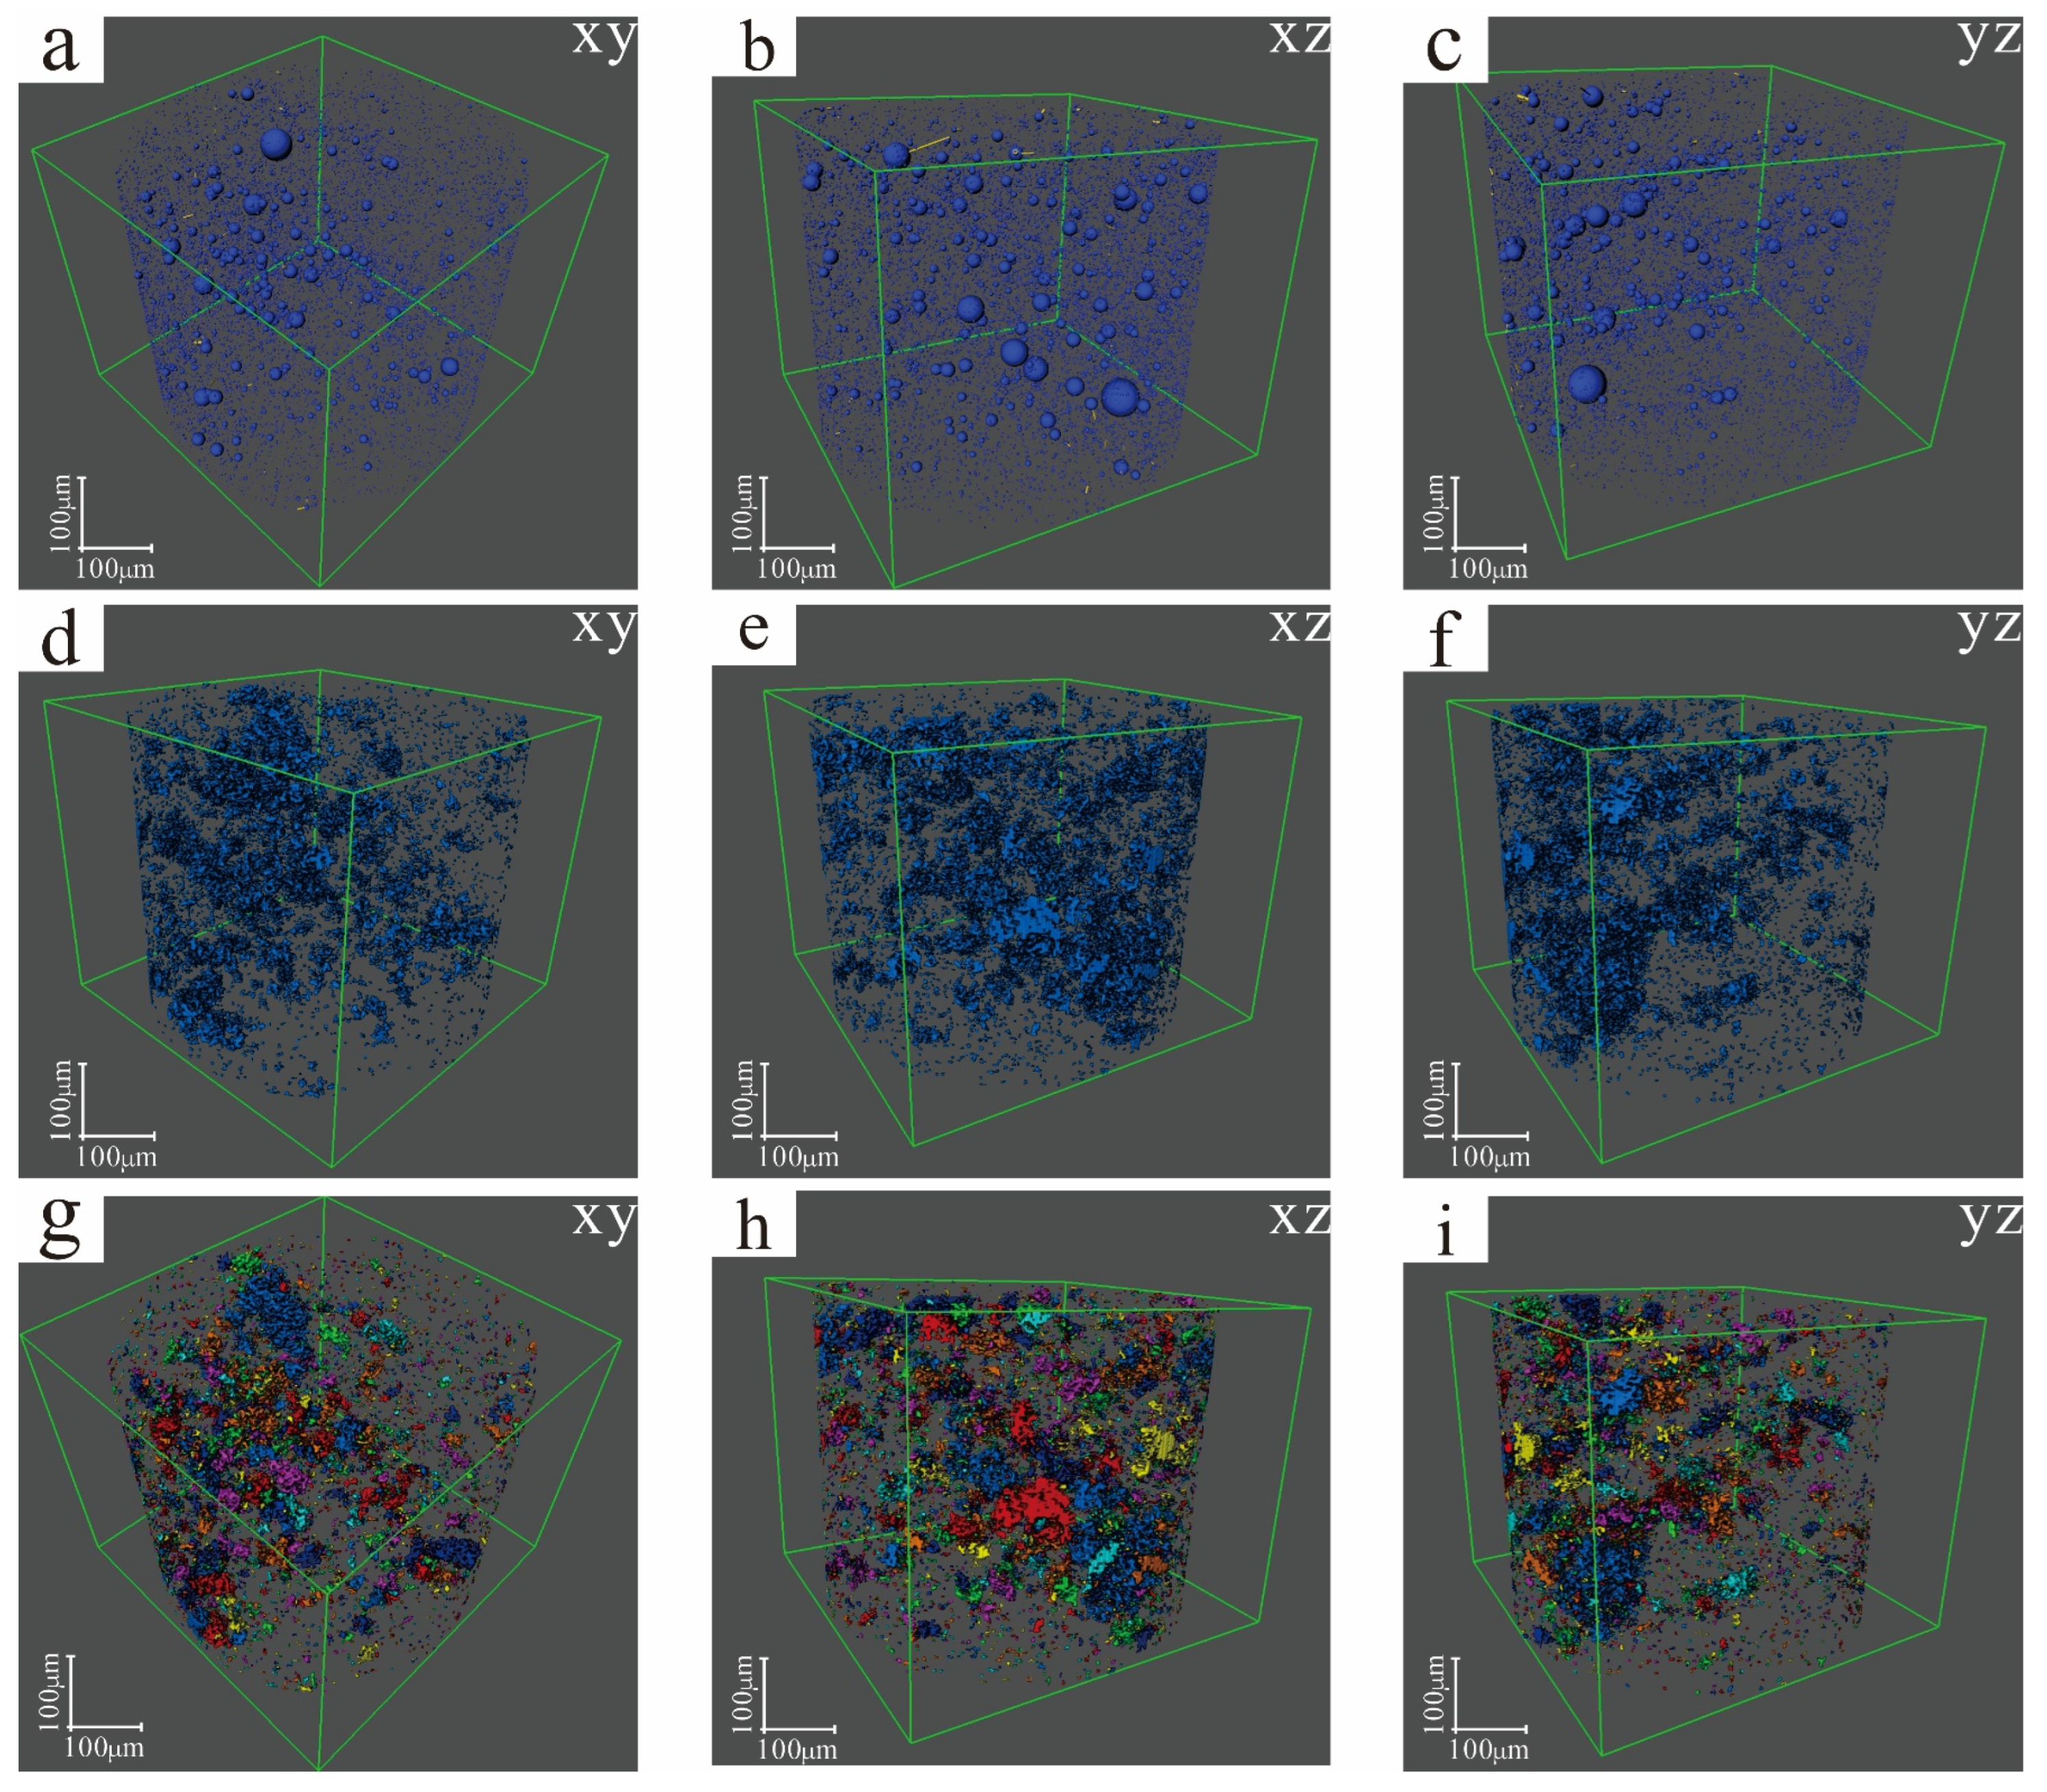
- As the surrounding rock decreases in distance to the orebody, the porosity tends to increase. The CT porosity of the two dolomite samples far away from the orebody were 2.76%–2.81%. The 3D image shows that the number of dolomite pores at this location was relatively small. The CT porosity of the two dolomite samples near the orebody were 3.35%–3.99%. It can be seen from the 3D images that the number of pores in the two samples was large. It can be found that the porosity of the dolomite increased with a decreasing distance to the orebody. This increase was related to the increase in the number of pores. In the microscopic photos, we observed that there were some metal minerals filling the sample pores near the orebody. This indicates that the metal minerals enter and fill the dolomite pores during the mineralization.
- (2)
- The average pore throat radii of the two samples far away from the orebody were 0.77 μm and 1.02 μm, and the average pore throat lengths were 29.57 μm and 39.95 μm. From the 3D image, it can be observed that the number of pore throats in these two samples was large, and many of the pores were interconnected. The average pore throat radii for the two samples near the orebody were 0.38 μm and 0.55 μm, and the average pore throat lengths were 13.57 μm and 16.83 μm. Compared to the samples far away from the orebody, their pore throat radii and pore throat lengths were smaller, which means that the samples near the orebody had low permeability and poor connectivity between the pores. It can also be observed from the 3D image that the number of sample pore throats near the orebody was small and the pores were isolated. This phenomenon indicates that the shorter the distance from the orebody, the worse the permeability of the dolomite. Based on the combined analysis of the microscopic photos and the 3D images, the author believes that the surrounding rock near the orebody underwent two stages of dolomitization due to the influence of hydrothermal activity. In this process, the number of pores in the surrounding rock increased, so the porosity of the dolomite increased. However, the hydrothermal minerals (Sph, Gn, Py) filled a part of the pores and pore throats, resulting in a smaller pore radius and pore throat radius and a smaller pore volume and pore throat length. Therefore, the connectivity between the pores of the samples near the orebody was worse than the samples far away from the orebody. The final result is that, with a decreasing distance to the orebody, the porosity of the dolomite increases and the permeability decreases. According to the above test results and analysis, the author believes that the gray-white coarse-porous crystalline dolomite developed in the Huize lead–zinc mine area can be used as one of the main indicators for future prospecting. The direction of the dolomite porosity increase and the permeability decrease may represent the direction of the orebody.
Author Contributions
Funding
Data Availability Statement
Acknowledgments
Conflicts of Interest
References
- Zhang, C.Q.; Yu, J.J.; Mao, J.; Rui, Z.Y. Advances in the study of Mississippi valley-type deposits. Miner. Depos. 2009, 28, 195–210. [Google Scholar]
- Mao, J.; Li, X.; Li, H.; Qu, X.; Zhang, C.; Xue, C.; Wang, Z.; Yu, J.J.; Zhang, Z.; Feng, C.; et al. Types and characteristics of endogenetic metallic deposits in orogenic belts in China and their metallogenic processes. Acta Geol. Sin. 2005, 79, 342–371. [Google Scholar]
- Zhen, S.; Zhu, X.; Li, Y. A tentative discussion on Mississippi valley-type deposits. Miner. Depos. 2013, 32, 367–379. [Google Scholar]
- Davis, J.H. Genesis of the Southeast Missouri lead deposits. Econ. Geol. 1977, 72, 443–450. [Google Scholar] [CrossRef]
- Davies, G.; Smith, L. Structurally controlled hydrothermal dolomite reservoir facies: An overview. AAPG Bull. 2006, 90, 1641–1690. [Google Scholar] [CrossRef]
- Machel, H.G.; Lonnee, J. Hydrothermal dolomite—A product of poor definition and imagination. Sediment. Geol. 2002, 152, 163–171. [Google Scholar] [CrossRef]
- Huang, S.J. Diagenesis of Carbonate Rocks; Geological Publishing House: Beijing, China, 2010. [Google Scholar]
- Zhang, Z.; Li, C.; Tu, G.; Xia, B.; Wei, Z. Geotectonic evolution background and ore-forming process of Pb-Zn deposits in Chuan-Dian-Qian area of Southwest China. Geotecton. Metallog. 2006, 30, 343–354. [Google Scholar]
- Han, R.; Wang, F.; Hu, Y.; Wang, X.; Ren, T.; Qiu, W.; Zhong, K. Metallogenic tectonic dynamics and chronology constrains on the huize-type (HZT) germanium-rich silver-zinc-lead deposits. Geotecton. Metallog. 2014, 38, 758–771. [Google Scholar]
- Zhang, C.Q. Distribution, Characteristics and Genesis of Mississippi Valley-Type Lead-Zinc Deposits in the Triangle Area of Sichuan-Yunnan-Guizhou Provinces; China University of Geosciences: Beijing, China, 2005. [Google Scholar]
- Zhang, C.Q. The Genetic Model of Mississippi Valley-Type Deposits in the Boundary Area of Sichuan, Yunnan and Guizhou Provinces; Chinese Academy of Geological Sciences: Beijing, China, 2008. [Google Scholar]
- Wang, J. Localization Rules of Large Pb-Zn Deposits in the Southwestern Margin of the Upper-Middle Yangtze Block. Ph.D. Thesis, China University of Geosciences, Beijing, China, 2018. [Google Scholar]
- Wu, J.; Li, G.; Li, Y.; Wei, J.; Wang, H.; Li, P. Chronology research progress of the MVT lead-zinc deposit in the border area of Sichuan-Yunnan-Guizhou and the background of metallogenic tectonics. Geol. Sci. Technol. Info. 2019, 38, 134–144. [Google Scholar]
- Kong, Z.; Wu, Y.; Zhang, F.; Zhang, C.; Meng, X. Sources of hydrothermal fluids of typical Pb-Zn deposits in the Sichuan-Yunnan-Guizhou metallogenic province: Constraints from the S-Pb isotopic compositions. Earth Sci. Front. 2018, 25, 125–137. [Google Scholar]
- Kong, Z.; Zhang, B.; Wu, Y.; Zhang, C.; Liu, Y.; Zhang, F.; Li, Y. Structural control and metallogenic mechanism of the Daliangzi Ge-rich Pb-Zn deposit in Sichuan province, China. Earth Sci. Front. 2022, 29, 143. [Google Scholar]
- Wu, Y. The Age and Ore-Forming Process of MVT Deposits in the Boundary Area of Sichuan-Yunnan-Guizhou Provinces, Southwest China. Ph.D. Thesis, China University of Geosciences, Beijing, China, 2013; pp. 1–167. [Google Scholar]
- Cui, Z.; Liu, X.; Zhou, J. Fractal characteristics of faults and its geological significance in Sichuan-Yunnan-Guizhou Pb-Zn metallogenic province, China. Glob. Geol. 2021, 40, 75–92. [Google Scholar]
- Han, R.; Liu, C.; Huang, Z.; Chen, J.; Ma, D.; Li, Y. Genesis modeling of Huize lead-zinc ore deposit in Yunnan. Acta Mineral. Sin. 2001, 21, 674–680. [Google Scholar]
- Li, W.B.; Huang, Z.L.; Zhang, G. Sources of the ore metals of the Huize ore field in Yunnan province: Constraints from Pb, S, C, H, O and Sr isotope geochemistry. Acta Petrol. Sin. 2006, 22, 2567–2580. [Google Scholar]
- Zhang, C.; Zhang, Z.L.; Huang, Z.L.; Yan, Z.F. Study on the sources of Pb and Zn in Huize lead-zinc ore deposits. Gansu Geol. 2008, 17, 26–31. [Google Scholar]
- Han, R.; Chen, J.; Li, Y.; Ma, D.; Zhao, D.; Ma, G. Ore-controlling tectonics and prognosis of concealed ores in Huize Pb-Zn deposit, Yunnan. Acta Mineral. Sin. 2001, 21, 265–269. [Google Scholar]
- Erik, F. Carbonate Micro-Characteristics; Geological Publishing House: Beijing, China, 2006. [Google Scholar]
- Wang, C. Experimental Study on Mechanical Properties of Dolomite Limestone in Huize Lead-Zinc Mine. Master’s Thesis, Kunming University of Science and Technology, Kunming, China, 2013. [Google Scholar]
- Zhang, C.Q.; Mao, J.; Wu, S.P.; Li, H.M.; Liu, F.; Guo, B.J.; Gao, D.R. Distribution, characteristics and genesis of Mississippi valley-type lead-zinc deposits in Sichuan-Yunnan-Guizhou area. Miner. Depos. 2005, 24, 336–348. [Google Scholar]
- Zhou, J.-X.; Xiang, Z.-Z.; Zhou, M.-F.; Feng, Y.-X.; Luo, K.; Huang, Z.-L.; Wu, T. The giant upper yangtze Pb–Zn province in SW China: Reviews, new advances and a new genetic model. J. Asian Earth Sci. 2018, 154, 280–315. [Google Scholar] [CrossRef] [Green Version]
- Kong, Z.; Wu, Y.; Liang, T.; Zhang, F.; Meng, X.; Lu, L. Sources of ore-forming material for Pb-Zn deposits in the Sichuan-Yunnan-Guizhou triangle area: Multiple constraints from C-H-O-S-Pb-Sr isotopic compositions. Geol. J. 2018, 53, 159–177. [Google Scholar] [CrossRef]
- Zhang, C.; Wu, Y.; Hou, L.; Mao, J. Geodynamic setting of mineralization of Mississippi Valley–type deposits in world–class Sichuan–Yunnan–Guizhou Zn–Pb triangle, Southwest China: Implications from age–dating studies in the past decade and the Sm–Nd age of Jinshachang deposit. J. Asian Earth Sci. 2015, 103, 103–114. [Google Scholar] [CrossRef]
- Tu, G.Z. Two unique mineralization areas in southwest China. Bull. Mineral. Petrol. Geochem. 2002, 21, 1–2. [Google Scholar]
- Han, R.; Hu, Y.; Wang, X.; Huang, Z.; Chen, J.; Wang, F.; Wu, P.; Li, B.; Wang, H.; Dong, L.; et al. Mineralization model of rich Ge-Ag-bearing Zn-Pb polymetallic deposit concentrated district in northeastern Yunnan, China. Acta Geol. Sin. 2012, 86, 280–294. [Google Scholar]
- Zhou, J.X.; Huang, Z.L.; Lv, Z.C.; Zhu, X.K.; Gao, J.G.; Mirnejad, H. Geology, isotope geochemistry and ore genesis of the shanshulin carbonate-hosted Pb–Zn deposit, southwest China. Ore Geol. Rev. 2014, 63, 209–225. [Google Scholar] [CrossRef]
- Li, H.; Zhang, C. The genetic relationship between the H2S-bearing gas in Sichuan basin and lead-zinc-copper deposits around the basin. Geol. Rev. 2012, 58, 495–510. [Google Scholar]
- Chen, J.; Han, R.S.; Gao, D.R.; Zhao, D.S. Geologicai characteristics of huize Pb-Zn deposit, yunnan and model of oreprospectibg method. Earth Environ. 2001, 124–129. [Google Scholar]
- Shi, X.W.; Jia, F.J.; Ke, L.Y.; Zou, C. The geochemical characteristics of the C-O isotope of the Huize mine area of Yunnan province, China. Acta Mineral. Sin. 2021, 41, 657–667. [Google Scholar]
- Wang, Z.Q. Enrichment Regularity of Dispersed Elements in Huize Super-Large Pb-Zn Deposit. Master’s Thesis, China University of Geosciences, Beijing, China, 2017; pp. 1–65. [Google Scholar]
- Wardlaw, N.C.; Li, Y.; Forbes, D. Pore-throat size correlation from capillary pressure curves. Transp. Porous Media 1987, 2, 597–614. [Google Scholar] [CrossRef]
- Wen, D.X.; Han, R.S.; Wu, P.; He, J.J. Altered dolomite features and petro-geochemical prospecting indicators in the Huize lead-zinc deposit. Geol. China 2014, 41, 235–245. [Google Scholar]
- Manning, C.E.; Ingebritsen, S.E. Permeability of the continental crust: Implications of geothermal data and metamorphic systems. Rev. Geophys. 1999, 37, 127–150. [Google Scholar] [CrossRef]
- McCreesh, C.A.; Eris, E.L.; Brumfield, D.S.; Ehrlich, R. Relating Thin Sections to Permeability, Mercury Porosimetry, Formation Factor, and Tortousity; American Association of Petroleum Geologists AAPG/Datapages: Tulsa, OK, USA, 1988. [Google Scholar]


| Ore-Bearing Stratigraphy and Lithology of Different Ages | Large Scale | Medium Type | Smaller | Mining Sites | Mineralization Point | Representative Deposits |
|---|---|---|---|---|---|---|
| Triassic marlstone and limestone | 3 | Mine site only | ||||
| Permian dolomitic limestone | 1 | 3 | 9 | 8 | Fule | |
| Carboniferous medium-coarse crystal dolomite | 2 | 3 | 13 | 39 | 12 | Huize, Maoping |
| Upper Devonian medium-coarse crystalline dolomite | 1 | 1 | 7 | 20 | 30 | Zhaotong |
| Silurian limestone with sandy mudstone | 1 | 5 | 3 | 5 | Zhaziping | |
| Ordovician dolomite | 2 | 2 | 9 | 26 | Butao | |
| Upper Sinian–Lower Cambrian dolomites | 3 | 8 | 18 | 54 | 96 | Daliangzi, Jinsha, Maozu, Tianbaoshan |
| Sample Number | HZ-9 | HZ-12 | HZ-14 | HZ-2 |
|---|---|---|---|---|
| Radius (μm) | Frequency | Frequency | Frequency | Frequency |
| 0–0.2 | 0 | 0 | 0 | 0 |
| 0.2–0.4 | 48 | 11 | 154 | 65 |
| 0.4–0.6 | 19 | 3 | 62 | 45 |
| 0.6–0.8 | 6 | 1 | 8 | 3 |
| 0.8–1.0 | 0 | 0 | 1 | 3 |
| 1.0–1.2 | 2 | 0 | 0 | 0 |
| 1.2–1.4 | 3 | 0 | 0 | 0 |
| 1.4–1.6 | 1 | 0 | 0 | 0 |
| 1.6–1.8 | 0 | 0 | 0 | 0 |
| 1.8–2.0 | 0 | 0 | 0 | 0 |
| >2 | 4 | 3 | 1 | 7 |
| Sample Number | HZ-9 | HZ-12 | HZ-14 | HZ-2 |
|---|---|---|---|---|
| Radius (μm) | Frequency | Frequency | Frequency | Frequency |
| 0–1 | 1245 | 443 | 1515 | 1879 |
| 1–2 | 3412 | 976 | 8052 | 5977 |
| 2–3 | 1084 | 216 | 3692 | 2275 |
| 3–4 | 249 | 38 | 1202 | 418 |
| 4–5 | 50 | 5 | 381 | 86 |
| 5–6 | 16 | 6 | 200 | 36 |
| 6–7 | 8 | 5 | 109 | 18 |
| 7–8 | 0 | 2 | 70 | 13 |
| 8–9 | 3 | 0 | 32 | 18 |
| 9–10 | 0 | 0 | 28 | 8 |
| 10–11 | 1 | 0 | 15 | 7 |
| 11–12 | 1 | 0 | 11 | 6 |
| 12–13 | 0 | 0 | 6 | 6 |
| 13–14 | 0 | 3 | 6 | 4 |
| 14–15 | 0 | 0 | 5 | 2 |
| 15–16 | 0 | 0 | 0 | 5 |
| 16–17 | 0 | 0 | 0 | 3 |
| 17–18 | 0 | 0 | 0 | 3 |
| 18–19 | 0 | 0 | 1 | 3 |
| 19–20 | 1 | 0 | 0 | 0 |
| >20 | 4 | 4 | 2 | 8 |
| Sample Number | HZ-9 | HZ-12 | HZ-14 | HZ-2 |
|---|---|---|---|---|
| Volume (μm3) | Frequency | Frequency | Frequency | Frequency |
| 0–10 | 2694 | 890 | 4560 | 4236 |
| 10–102 | 3012 | 740 | 8436 | 5772 |
| 102–103 | 352 | 55 | 2071 | 668 |
| 103–104 | 11 | 7 | 250 | 71 |
| 104–105 | 1 | 2 | 10 | 28 |
| 105–106 | 4 | 4 | 0 | 0 |
| Sample Number | HZ-9 | HZ-12 | HZ-14 | HZ-2 |
|---|---|---|---|---|
| Area (μm2) | Frequency | Frequency | Frequency | Frequency |
| 0–10 | 857 | 315 | 687 | 1244 |
| 10–102 | 4633 | 1291 | 11,481 | 8324 |
| 102–103 | 566 | 83 | 2954 | 1115 |
| 103–104 | 14 | 5 | 202 | 78 |
| 104–105 | 3 | 4 | 3 | 14 |
| 105–106 | 1 | 0 | 0 | 0 |
| Sample Number | Average Pore Radius (μm) | Average Pore Throat Radius (μm) | Average Pore Volume (μm3) | Average Specific Surface Area (μm2) | Average Pore Throat Length (μm) | CT Porosity (%) |
|---|---|---|---|---|---|---|
| HZ-9 | 1.65 | 0.077 | 179.87 | 91.01 | 29.57 | 2.81 |
| HZ-12 | 1.60 | 1.02 | 857.55 | 159.76 | 39.95 | 2.76 |
| HZ-14 | 2.05 | 0.38 | 110.86 | 107.55 | 13.57 | 3.99 |
| HZ-2 | 1.77 | 0.55 | 120.46 | 92.11 | 16.83 | 3.35 |
Disclaimer/Publisher’s Note: The statements, opinions and data contained in all publications are solely those of the individual author(s) and contributor(s) and not of MDPI and/or the editor(s). MDPI and/or the editor(s) disclaim responsibility for any injury to people or property resulting from any ideas, methods, instructions or products referred to in the content. |
© 2023 by the authors. Licensee MDPI, Basel, Switzerland. This article is an open access article distributed under the terms and conditions of the Creative Commons Attribution (CC BY) license (https://creativecommons.org/licenses/by/4.0/).
Share and Cite
Li, Y.; Kong, Z.; Zhang, C.; Wu, Y.; Yang, X.; Wang, Y.; Chen, G. Pore Variation Characteristics of Altered Wall Rocks in the Huize Lead–Zinc Deposit, Yunnan, China and Their Geological Significance. Minerals 2023, 13, 363. https://doi.org/10.3390/min13030363
Li Y, Kong Z, Zhang C, Wu Y, Yang X, Wang Y, Chen G. Pore Variation Characteristics of Altered Wall Rocks in the Huize Lead–Zinc Deposit, Yunnan, China and Their Geological Significance. Minerals. 2023; 13(3):363. https://doi.org/10.3390/min13030363
Chicago/Turabian StyleLi, Yanglin, Zhigang Kong, Changqing Zhang, Yue Wu, Xue Yang, Yu Wang, and Gang Chen. 2023. "Pore Variation Characteristics of Altered Wall Rocks in the Huize Lead–Zinc Deposit, Yunnan, China and Their Geological Significance" Minerals 13, no. 3: 363. https://doi.org/10.3390/min13030363