Article

Characteristics and Influencing Factors of Multi-Scale Pore Structure Heterogeneity of Lacustrine Shale in the Gaoyou Sag, Eastern China

1
State Key Laboratory of Shale Oil and Gas Enrichment Mechanisms and Effective Development, Beijing 100083, China
2
State Key Laboratory of Petroleum Resources and Prospecting, China University of Petroleum-Beijing, Beijing 102249, China
3
China National Offshore Oil Corporation Energy Economics Institute, Beijing 100011, China
*
Authors to whom correspondence should be addressed.
Minerals 2023, 13(3), 359; https://doi.org/10.3390/min13030359
Submission received: 23 January 2023 / Revised: 14 February 2023 / Accepted: 1 March 2023 / Published: 3 March 2023
(This article belongs to the Special Issue Reservoir and Geochemistry Characteristics of Black Shale)

Abstract

:
The success of shale oil exploration and production is highly dependent on the heterogeneous nature of the reservoir pore structure. Despite this, there remains limited research on the heterogeneity characteristics of pores at different scales in lacustrine shale oil reservoirs and the factors that impact them. This study aims to quantitatively characterize the multi-scale pore heterogeneity differences of the lacustrine shale found in the Funing Formation in Gaoyou Sag. Additionally, the study seeks to clarify the impact of the total organic carbon (TOC) and lithofacies type on pore structure heterogeneity. To achieve this, nitrogen adsorption, scanning electronic microscope (SEM), mercury intrusion porosimetry (MIP), and other experimental means were adopted in combination with the fractal dimension model of FHH and capillary. The results show that the predominant lithofacies of the Funing Formation shale samples are mixed shale (MS) and siliceous shale (SS), with a limited presence of calcareous shale (CS). The micro-pores of lacustrine shale are dominated by inorganic mineral pores and fewer organic pores. Intragranular pores and clay mineral pores are two types of inorganic mineral pores that are widely found. Small pores (pore diameter < 50 nm) make up 89% of the pore volume (PV) and 99% of the specific surface area (SSA). The fractal dimensions D1, D2, and D3 were calculated to characterize the roughness of the pore surface, the structural complexity of small pores, and the structural complexity of large pores (pore diameter > 50 nm), respectively. The increase in the total organic carbon (TOC) resulted in a decrease in the D1, D2, PV, and SSA, while connectivity showed a slight improvement. The fractal dimension of shale across all lithofacies followed the pattern: D3 > D2 > D1. The pore structure is more complex than the pore surface, and the large pores showed a greater heterogeneity than the small pores. Among the three lithofacies, CS had the largest PV, SSA, D1, and D2, indicating the development of a more complex pore structure network. This expands the space required for shale oil occurrence. However, the connectivity of the CS lithofacies is the lowest among the three, which hinders shale oil production. Although the PV of SS is slightly lower than that of CS, its average pore diameter (AVE PD) and connectivity are significantly advantageous, making SS an ideal shale reservoir. This study provides an important reference for the reservoir evaluation required to better develop lacustrine shale oil around the world.

1. Introduction

In recent years, China has made significant progress in shale oil production with the increase in shale oil exploration. In 2021, China’s shale oil output amounted to 240 × 104 t, up by 60% from 2019. In addition, the recoverable resources of shale oil across the country were 7.4–37.2 billion tons, as estimated by the National Energy Administration of China in 2019 [1,2]. In China, shale oil has shown a promising prospect for commercial development. Shale reservoirs not only create important spaces for shale oil generation and storage, but they also act as exceptional porous media with high complexity and irregular properties [3,4,5]. Unlike the shale oil in North America, which is dominated by marine formations [6,7], the shale oil discovered in China is derived mainly from lacustrine facies. The shale oil from lake sediments in China is faced with the challenges of complex geological structures, significant heterogeneity, high clay mineral content, low maturity of organic matter, and poor oil mobility [8,9,10,11,12]. The heterogeneity of lacustrine shale is strongly manifested in both the organic geochemical heterogeneity and the inorganic mineral heterogeneity. The organic geochemical characteristics show significant differences, with the distribution of the content of total organic carbon (TOC) ranging from 0.5% to 15%, and Ro ranging from 0.5% to 1.3% [13,14,15]. The mineral composition is complex, with siliciclastic minerals, carbonate minerals, and clay minerals accounting for the absolute majority of the total mineral content, but other mineral types, such as sulfate minerals, halides, or zeolites are also commonly present [16,17,18]. Precisely because of the heterogeneity of lacustrine shale, it results in a complex pore structure. Moreover, shale pore structure exerts an obvious control effect on the occurrence state and seepage mechanism of oil [8,9,10,11]. Therefore, one of the key issues facing reservoir evaluation and improved shale oil recovery is quantifying the heterogeneity of the pore structure efficiently.
Due to the high complexity of shale pore structure, it is usually difficult to describe its heterogeneity according to the traditional Euclidean geometry theory, which is especially true for the lacustrine shale with high heterogeneity. Fractal theory is applicable to quantify the heterogeneity and complexity of pore structure, which contributes novel ideas and methods to explore the adsorption mechanism, pore structure, and surface properties of shale reservoirs [19,20]. In some studies, scanning electronic microscope (SEM) images, nitrogen adsorption, and mercury intrusion porosimetry (MIP) data are often used to construct a variety of fractal dimension calculation models [21,22,23], such as the Frenkel–Halsey–Hill (FHH) model, the Brunauer–Emmett–Teller (BET) model and the Menger model. Then, the correlation between the fractal dimension and the shale composition is analyzed to find the control factors of the fractal dimension [24,25]. Many models present multiple fractal features. However, previous studies have often overlooked the physical significance of the multiple fractal dimensions [26,27,28,29,30]. The variety of multiple fractal dimensions makes comparison and analysis more challenging. Furthermore, fractal dimensions within a certain range of pore size are calculated through gas adsorption or MIP and other experimental data, which imposes some limitations on analyzing the characteristics of the pore structure in shale and the relationships among different fractal characteristics. Considering the pore space of different scales in shale (including nano-micron-millimeter), the complex pore structure of shale causes differences in the fractal characteristics of different scales. However, there have still been few studies on the quantitative characterization of multi-scale fractal characteristics shown by lacustrine shale pore structure and the influencing factors on the characteristics of pore heterogeneity within each pore size range.
Therefore, the lacustrine shale of the Funing Formation in Gaoyou Sag is taken as the research object in this study to address the above problems. Firstly, the nitrogen adsorption and MIP data were inputted into the FHH model and the capillary model, respectively, to quantitatively characterize the differences in the multi-scale pore heterogeneity. Then, an analysis was conducted to determine the correlation between the pore structure parameters and the fractal dimension. Finally, the impact of the TOC and lithofacies type on the heterogeneity of the pore structure was clarified. This study contributes to a better understanding of the structural characteristics and heterogeneity characteristics of multi-scale pores in lacustrine shale, which provides an important reference for the reservoir evaluation required to carry out lacustrine shale oil production worldwide.

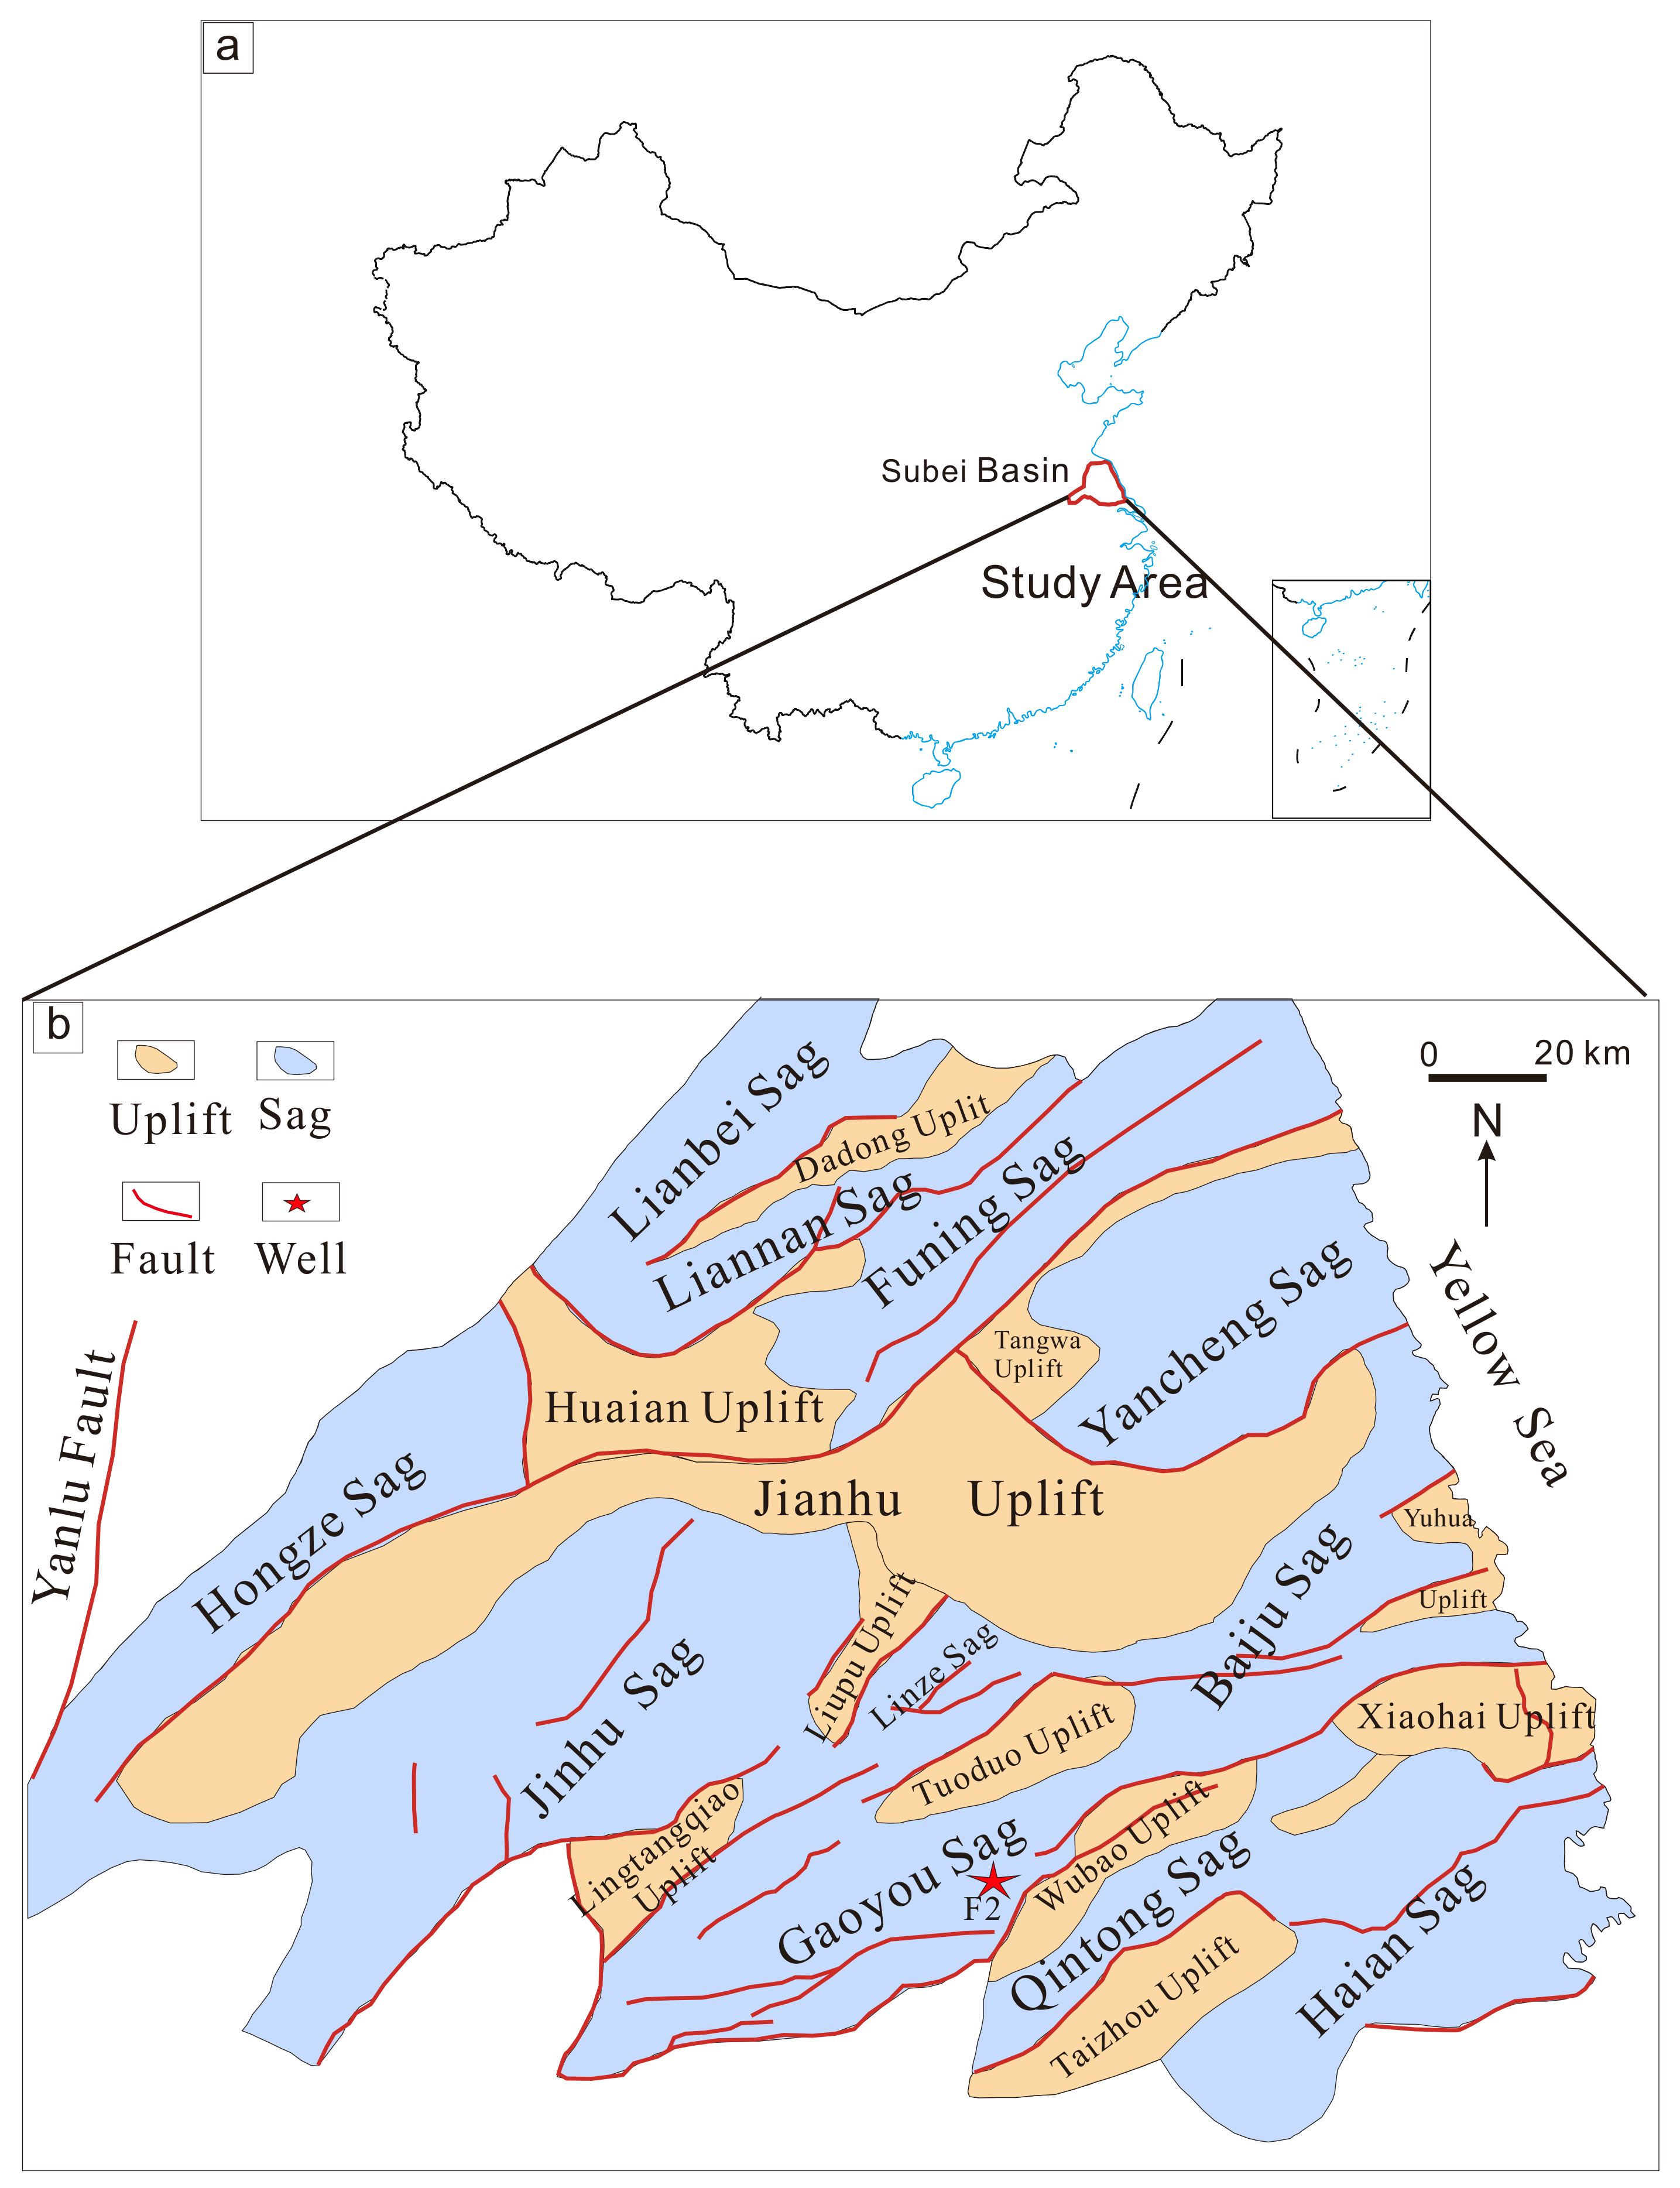
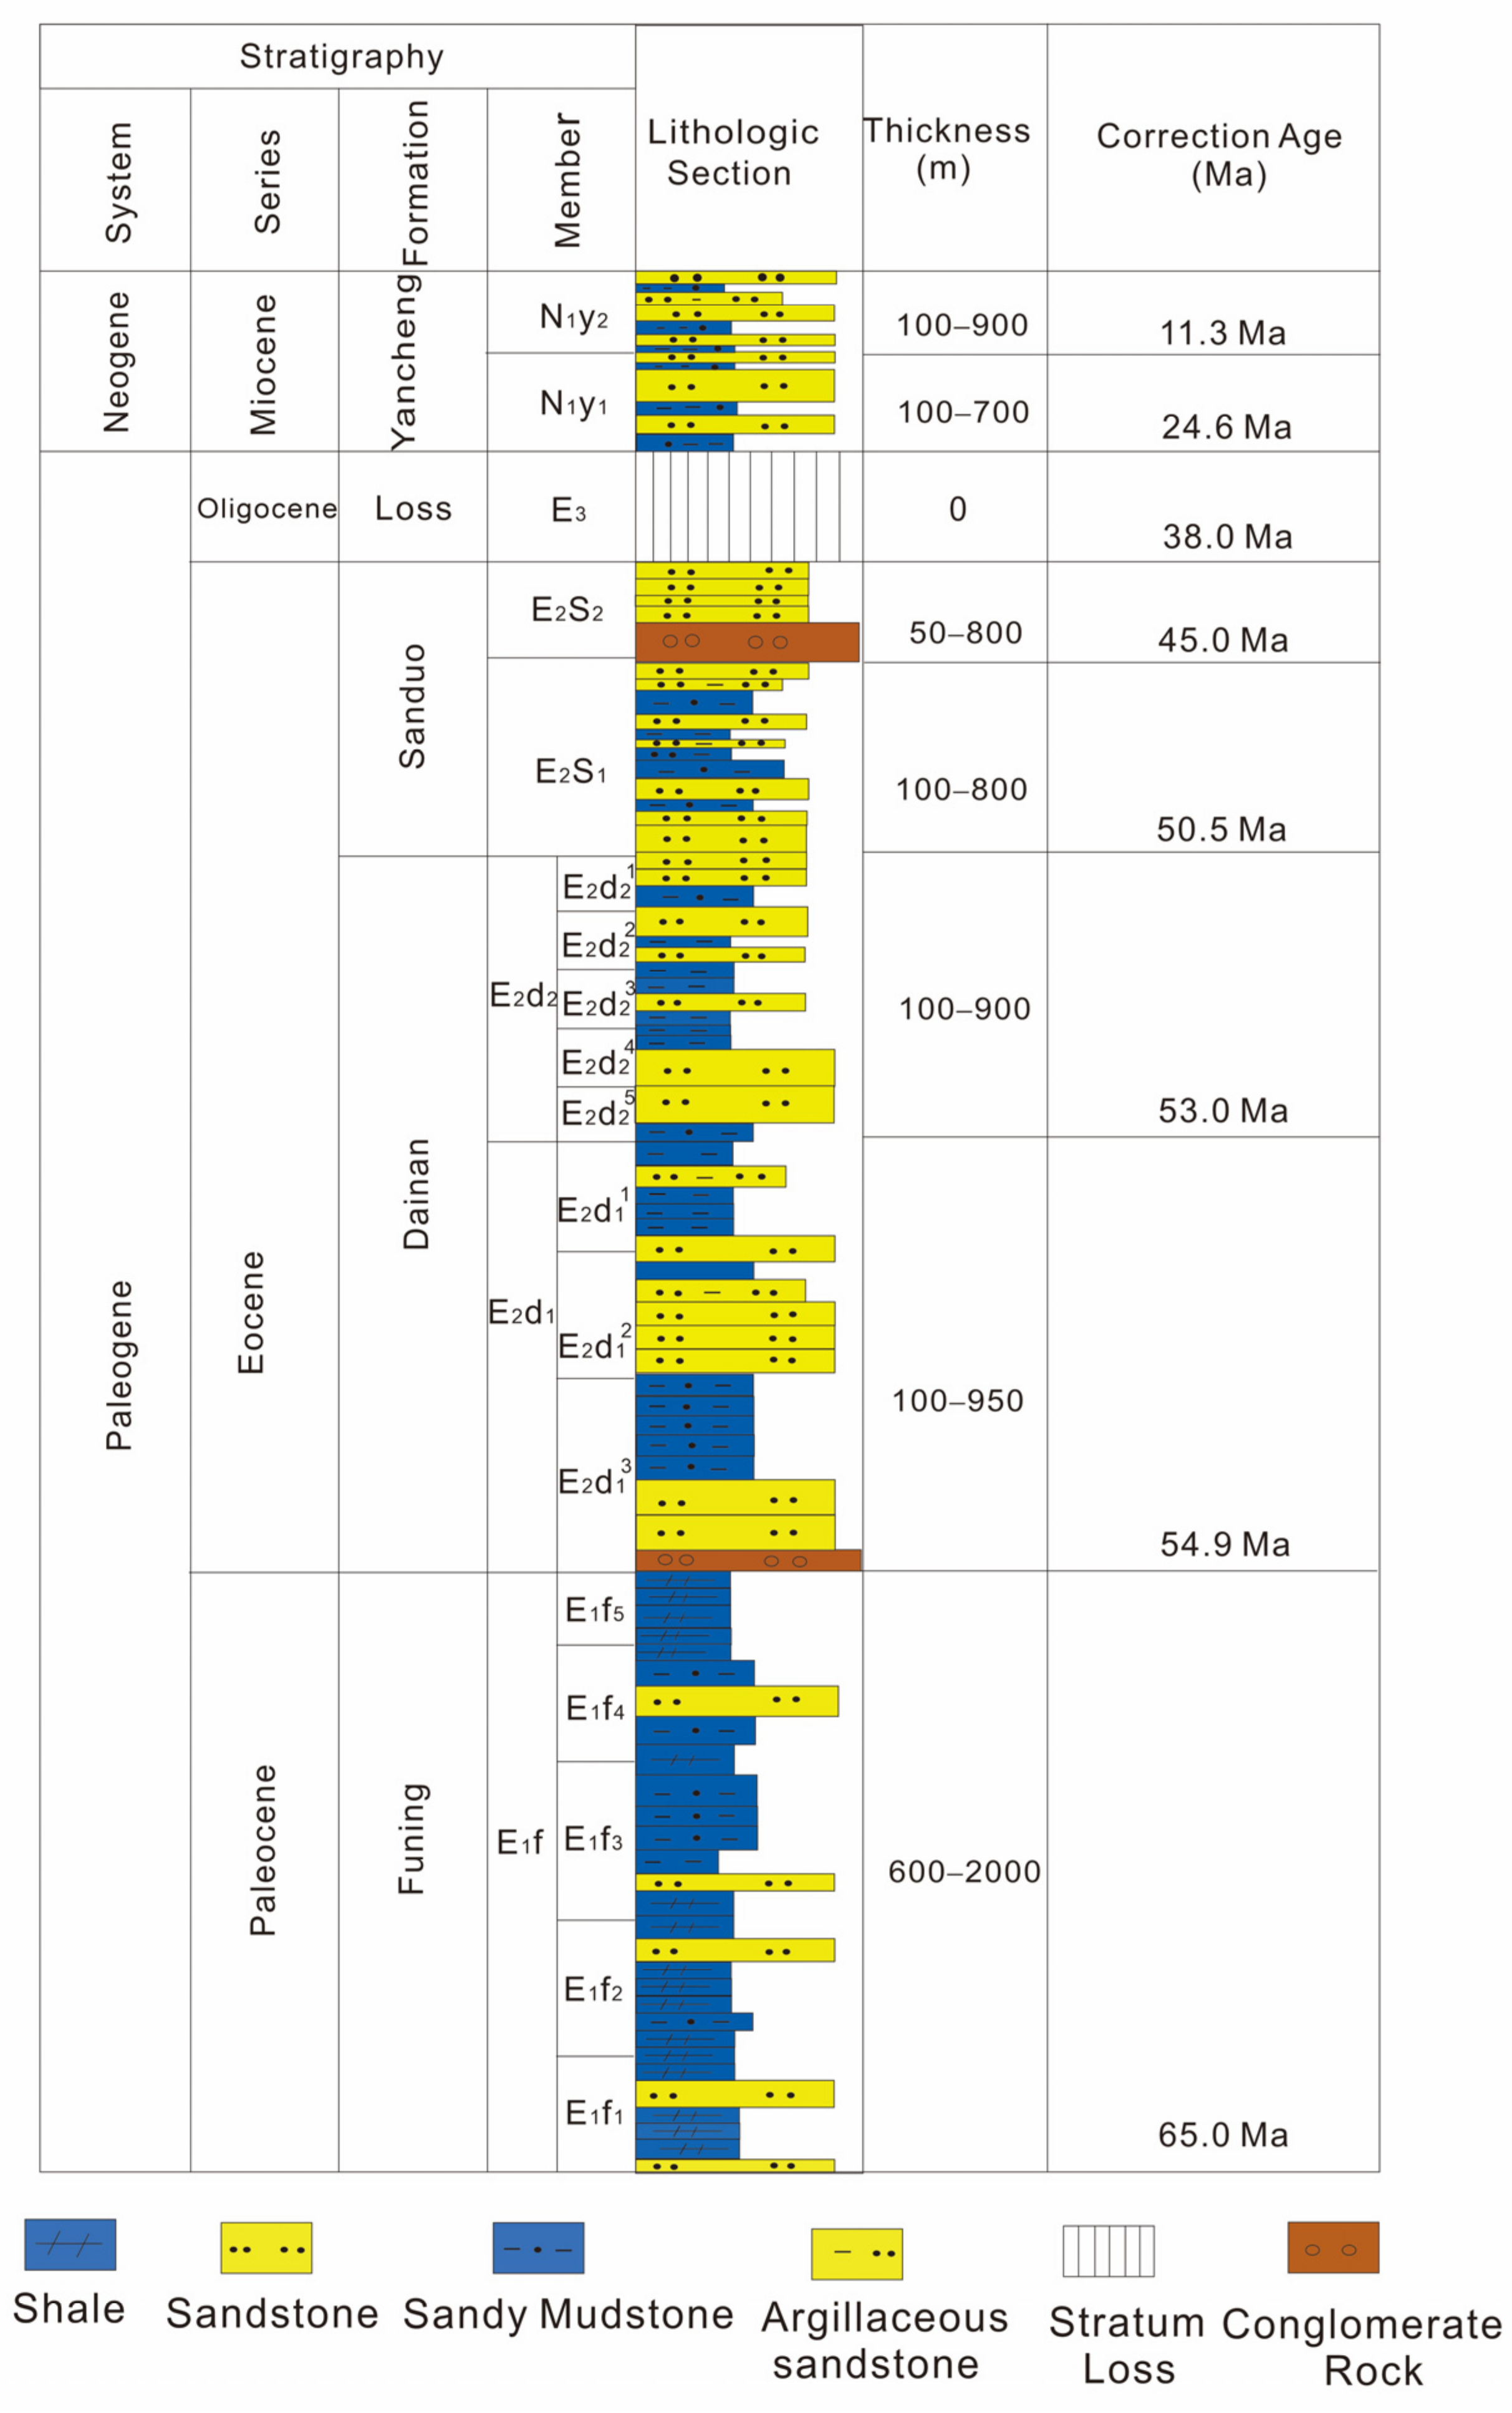
2. Geological Setting and Samples

The Subei Basin is a Mesozoic and Cenozoic sedimentary basin founded on the Cretaceous basement. [31,32]. The Subei Basin is located in eastern China and encompasses approximately 3.5 × 10⁴ km2. With a size of roughly 3000 km2, the Gaoyou Sag is situated in the southern part of the Subei Basin (Figure 1). In the Gaoyou Sag, there is a sequential deposition of five formations, namely, the Cretaceous Taizhou Formation, the Paleogene Funing Formation, the Dainan Formation, the Sanduo Formation, and the Neogene Yancheng Formation, from the bottom up (Figure 2). The Funing Formation is the primary shale development horizon in the Gaoyou Sag. Gray and dark gray shale combined with siltstone and fine sandstone are produced in the Funing Formation, which was formed in a deep lake to semi-deep lake sedimentary environment [32,33]. The Funing Formation is typically more than 300 m thick, and because of its excellent organic geochemical conditions, it is regarded as a good source rock. With significant shale oil resource potential, several wells have been used to drill shale reservoirs in the Funing Formation [32,34]. A total of 17 samples of shale from the Funing Formation in the Gaoyou Sag were chosen for this investigation, and all samples were from Well F2 at a depth of 3460~3688 m.

3. Experiments

3.1. TOC, Mineralogy, and Lithofacies Division

The content of the total organic carbon (TOC) is one of the key matrices used to assess the abundance of organic matter. Using a CS230HC (CS230HC, LECO, San Jose, CA, USA) carbon and sulfur analyzer, the TOC contents of core samples from the Funing Formation were determined in this investigation. The samples were crushed to powder samples of 0.1~0.5 g. (particle size of 200-mesh). Diluted hydrochloric acid was employed to eliminate the samples’ inorganic carbon prior to the experiment. Following the procedure, the samples were dried at 60 to 80 °C. Finally, the samples were burned at a high temperature (930 °C), the CO2 contents were determined, and the samples’ TOC contents were computed in accordance with the results [35]. An MPV-I microphotometer was used to measure the vitrinite reflectance value (Ro) [36].
The mineral components of the samples were quantitatively examined using a Smart-Lab X-ray diffractometer (SmartLab, Rigaku Corporation, Tokyo, Japan). To prepare the samples for analysis, they were crushed into a 200-mesh powder. By examining the distinctive diffraction peak intensities of the X-ray diffraction patterns of individual mineral crystals, it was possible to identify the different minerals present in the samples [37,38].
Scanning electron microscopy can be used to observe the microscopic pores and fractures of shale [39,40,41]. In this study, the pore properties of the shale samples were qualitatively observed using a high-resolution field emission scanning electron microscope, the ZEISS Gemini SEM 500 (Gemini SEM 500, ZEISS, Oberkochen, Germany), with a resolution of up to 0.8 nm. The samples were cut into small pieces measuring 1.5 cm × 1 cm × 0.5 cm before the experiment and then polished using a HITACHI IM 4000 (IM 4000, HITACHI, Tokyo, Japan) argon ion polishing apparatus. Field-emission scanning electron microscopy observations of the results were made.
The lithofacies division method in this study was based on the three-terminal element method [42,43]. The specific method involved dividing the minerals in the shale into three categories, namely calcareous minerals (calcite and dolomite), siliceous minerals (quartz and feldspar), and clay minerals. With 50% as the dividing line of mineral content, it can be divided into four lithofacies types: mixed shale (the content of three types of minerals is less than 50%), clayey shale (the content of clay minerals is more than 50%), calcareous shale (the content of calcareous minerals is more than 50%), and siliceous shale (siliceous mineral content is more than 50%).

3.2. N2 Adsorption and MIP

The low-temperature gas adsorption method is a common characterization method for measuring the specific surface area and pore size distribution of porous materials. N2 is one of the most widely used gas detection media [44]. The ASAP 2460 specific surface area and pore size analyzer was used to test 60-mesh samples. Before starting the analysis, the samples were put into a degassing station and degassed at 110 °C for 10 h to remove the moisture and volatile substances. Then, the degassed samples were transferred to the analysis station, and an adsorption test was carried out at 77.3 K with high-purity N2 as the adsorbate. The relative pressure (P/P0) gradually increased from 0.001 to 0.998 (saturated vapor pressure of N2).
The AutoPore IV 9505 (AUTOPORE IV 9505, Micromeritics, Norcross, USA) automatic mercury porosimeter was employed in this study. The mercury injection pressure provided by the instrument in the test stage reached 200 MPa, and the corresponding minimum test pore size was approximately 7 nm. The samples were formed into cylinders with a diameter of 2.5 cm and a length of 5 cm before the test. The samples were also continually dried for 48 h at 60 °C in order to successfully remove any internal contaminants. Pore structure factors, such as the pore volume and pore size distribution, were determined using the Washburn equation [45,46]:
D = 4 γ cos θ P
where D is the pore diameter, μm; P is the pressure of the mercury injection, MPa; γ is the surface tension of the mercury, generally 0.48 N/m; θ is the contact angle between the mercury and the solid dielectric material (θ = 140° for a non-wetting phase with [47,48]).

3.3. Fractal Dimension

The fractal theory was first proposed by the French mathematician Mandelbert in 1973 [49]. Initially, it was utilized to quantitatively characterize the pore structure of porous media such as coal and shale reservoirs. Fractal theory is a method for studying complex, fragmented systems in nature that are both self-similar and self-inverting [50]. Fractal dimension values can be used to quantify a system’s fractal properties. Numerous data and models, including the mercury intrusion method, the low-temperature gas adsorption method, the high-pressure mercury intrusion experiment, and the scanning electron microscope method, can be used to compute the fractal dimension [21,51,52].
In order to calculate the fractal dimension of the pore structure in porous solid media, the fractal Frenkel–Halsey–Hill (FHH) model, which is based on a low-temperature N2 adsorption experiment, is frequently utilized. PFEIFER proposed the FHH model, which is a straightforward model with broad applicability [53]. The FHH model has been applied to various rock types, including sandstones, carbonates, and shales, and has been found to provide a good approximation of the porous structure of these rocks [54,55,56]. Its formula is:
L n V =   D     3   × L n     L n P 0 P + C
where V is the gas adsorption amount corresponding to the balanced pressure P, cm3/g; P is the balance pressure, MPa; P0 is the saturated steam pressure of the adsorbed gas, MPa; C is a constant; D is the fractal dimension of the porous material, and the value of D is between 2 and 3 [57]. The closer the D value is to 3, the more complex the pore structure in the porous media is and the rougher the surface is. The closer the D value is to 2, the simpler the pore structure is.
For the determination of the fractal dimension of the macroporous pore structure in porous solid media, the capillary model based on the high-pressure mercury intrusion experiment is widely used [58]. Based on the geometric principles and basic elements of the capillary model, which include the relationship between the pore size and the capillary pressure, as well as the relationship between the pore size and the mercury saturation, the subsequent model has been further developed:
L g 1 S H g = 3 D c L g P S + D c 3 L g P c
where SHg is the mercury saturation, %; LgPc is the capillary pressure, MPa; LgPs is the inlet capillary pressure, MPa.

4. Results

4.1. TOC, Mineralogy, and Lithofacies Division

The TOC of all samples ranged from 0.34% to 3.02%, with an average of 1.46% (Table 1). The two principal minerals in the shale samples, according to the XRD analysis, were quartz (20.25%–35.87%, average 28.08%) and clay (6.08%–39.43%, average 23.07%). According to the shale lithofacies classification method provided in Section 3, the shale samples obtained from the Funing Formation can be categorized into three primary types, namely mixed shale (58.82%), siliceous shale (29.41%), and calcareous shale (11.76%).

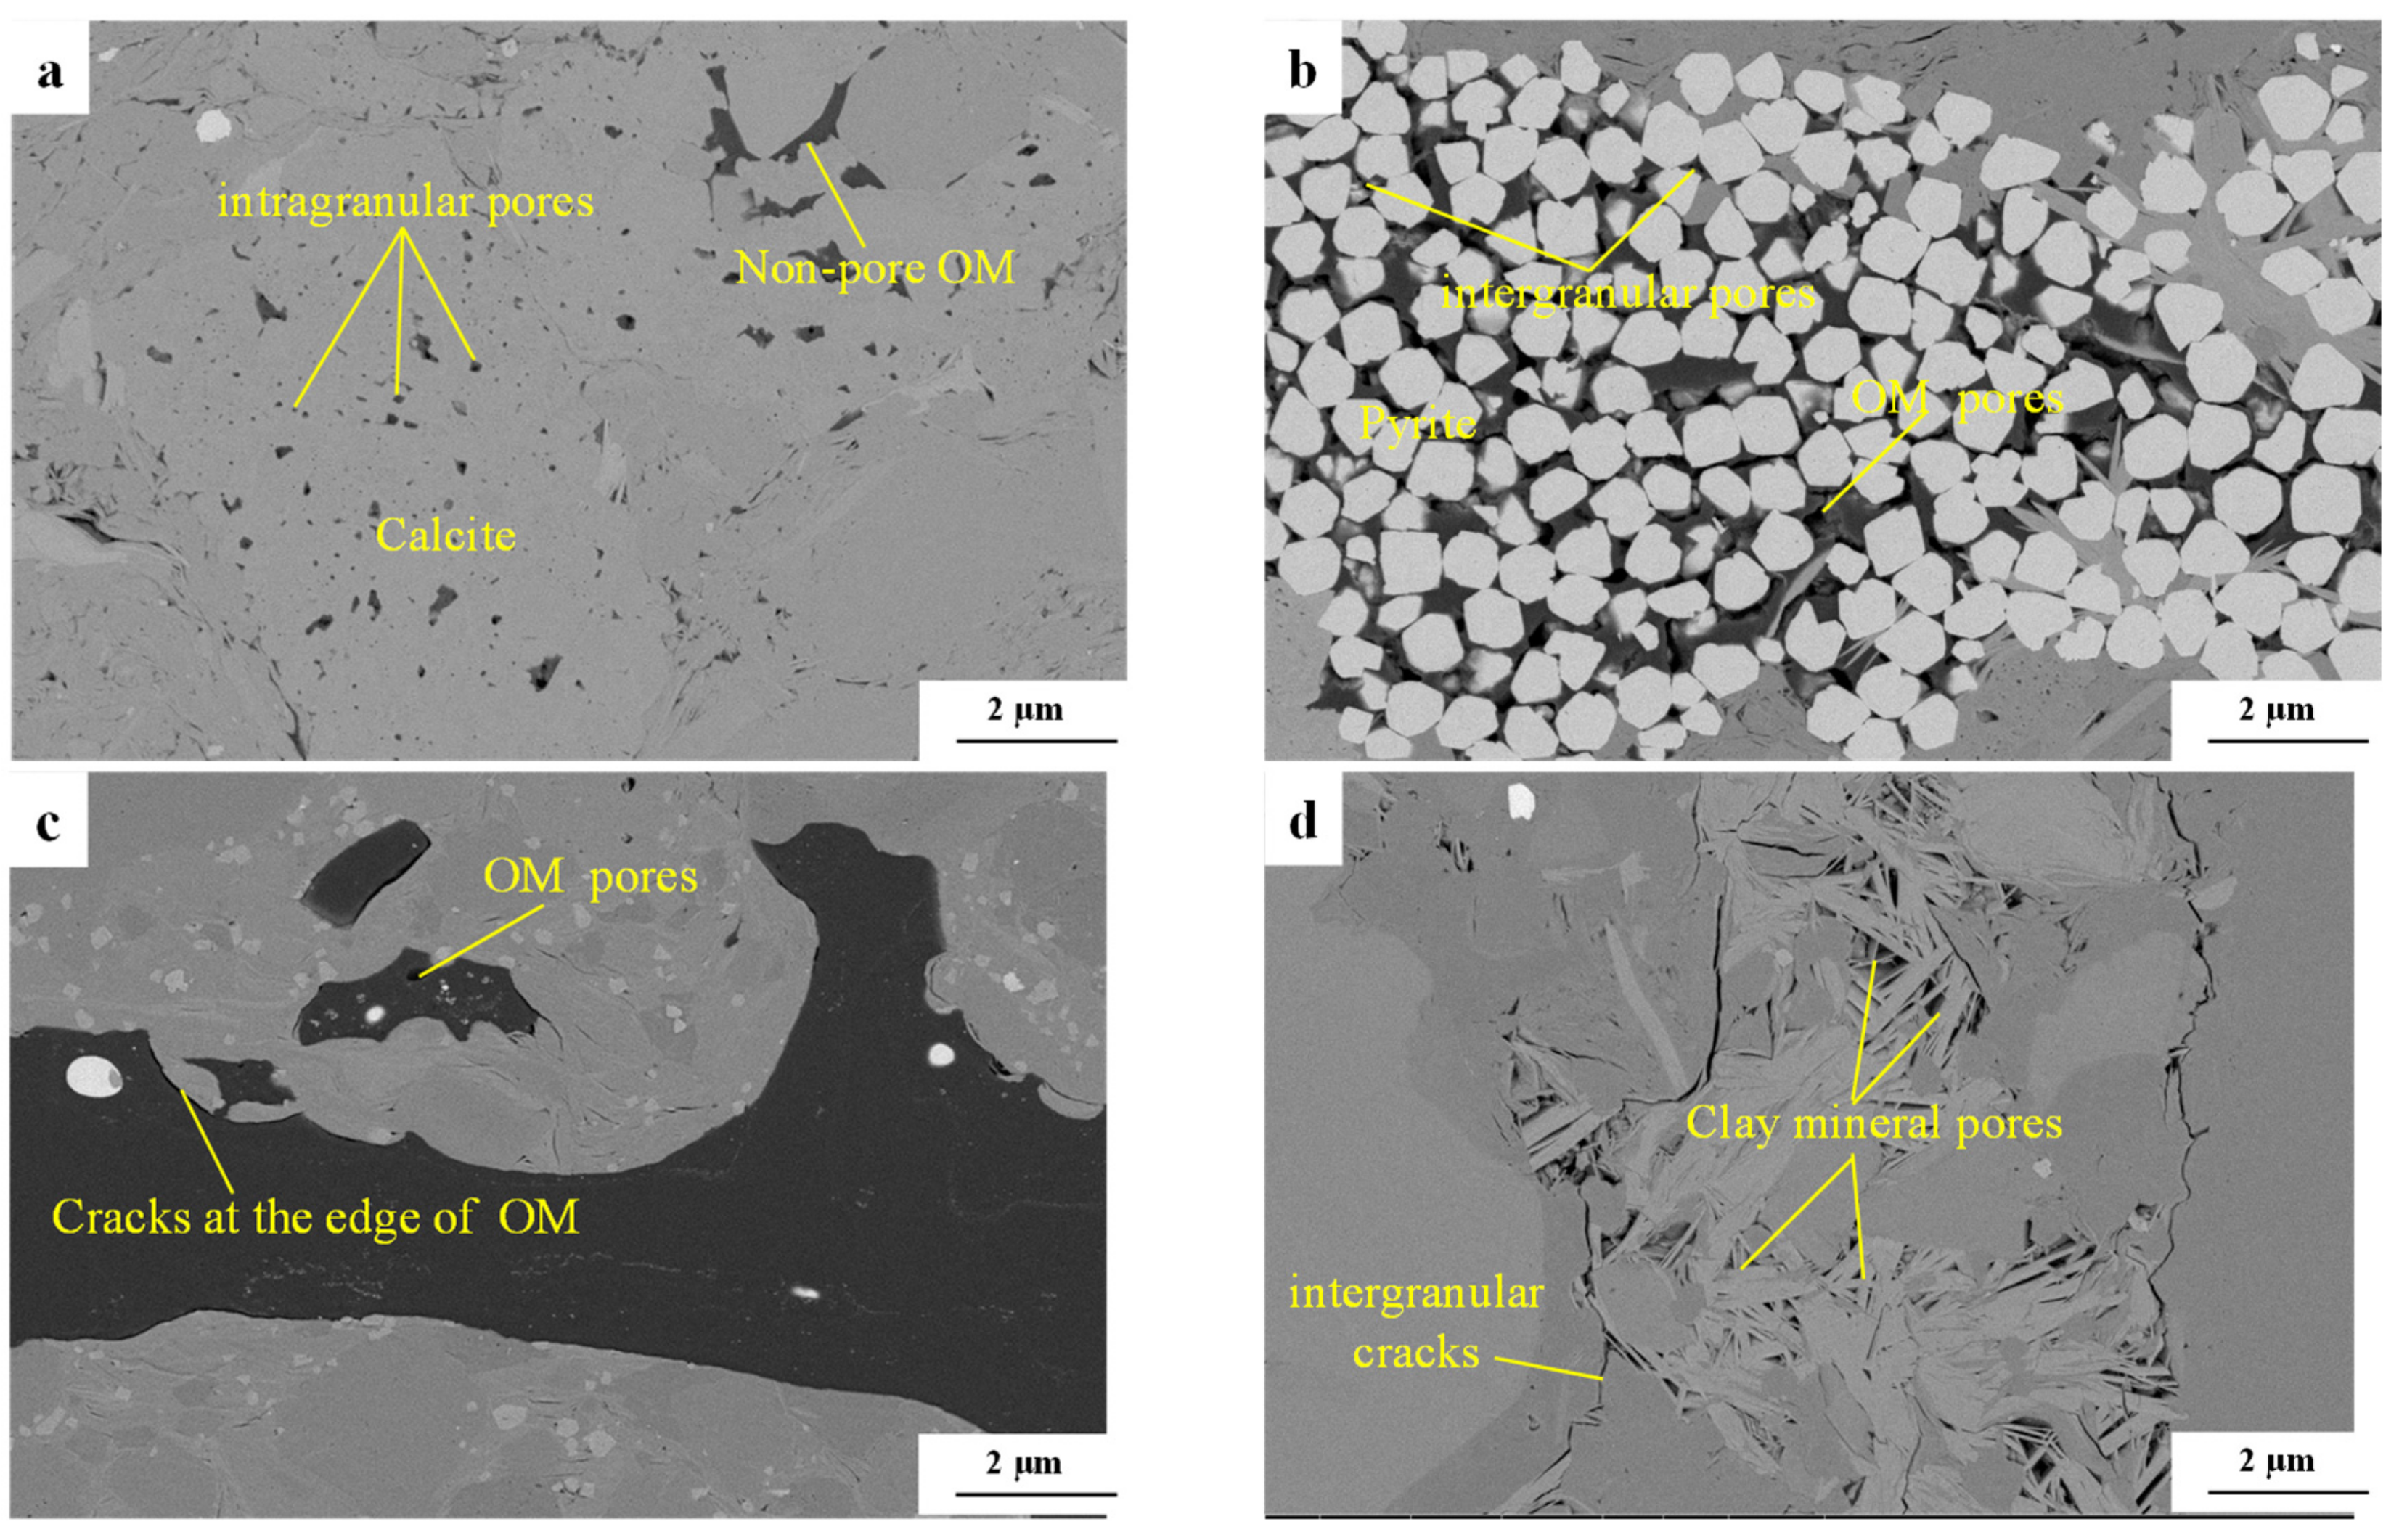
4.2. Types and Morphology of Pores

The majority of the Funing Formation shale’s pores are made of inorganic minerals (Figure 3). The two primary types of inorganic mineral pores are clay mineral pores (Figure 3d) and intragranular pores (Figure 3a). With an average pore size of tens to hundreds of nanometers, the pores of the clay minerals are mainly elongated and triangular. Intragranular pores are formed mainly by the dissolution of soluble minerals such as feldspar and calcite, generally circular or oval in shape. Intragranular pores are typically less than 100 nm in size, isolated, and densely dispersed (Figure 3a). Intergranular pores (Figure 3b) are primarily formed between brittle mineral particles such as pyrite and quartz. Typically, these pores have sizes in the hundreds of nanometers, although they may occasionally exceed micrometers. The Funing Formation shale exhibited fewer organic pores than marine shale, and the majority of the organic material observed in the electron microscope images was non-porous (Figure 3c).

4.3. Pore Structure from N2 Adsorption and MIP

The shale samples from the various Funing Formation lithofacies were all reverse-S-shaped (Figure 4). There was a clear lagged loop between the adsorption and desorption isotherms. Lagged loops are produced when capillary condensation takes place and the relative pressure (P/P0) surpasses 0.5, in accordance with the Kelvin equation [59,60].
The pore shape of the materials in porous media can be seen in the N2 adsorption/desorption isotherm. The lagged loops of all samples were close to the H2 type, which corresponds to the ink-bottle pore shape, according to the IUPAC categorization method [59]. The H3 type, which corresponds to parallel plate-like pores, is also present in the lagged loops of MS and SS. The findings demonstrate that parallel plate pores as well as ink-bottle pores were found in the shale samples of these two lithofacies.
The features of shale’s pore structure can be determined using MIP. Figure 5 depicts the mercury injection–ejection curves for the samples. Different lithofacies’ mercury injection–ejection curves had similar growth trend features, and they often began to rise quickly at pressures of around 30 MPa. However, the mercury withdrawal efficiency (MWE) of various lithofacies varied (Figure 5 and Table 2). The average mercury withdrawal efficiency for CS was 25.76%, which was considerably lower than that for MS (45.94%) and SS (47.91%). This indicates that the connectivity of CS is inadequate. Calcite and dolomite, two soluble carbonate minerals found in high concentrations in CS, form discrete and shoddily connected ink-bottle corrosion pores (Figure 3a and Figure 4c).
To acquire the pore development characteristics of shale at the micro and nano sizes, the method of combining N2 adsorption and MIP was chosen due to the complexity of the pore structure of the Funing Formation shale. The pore size distribution obtained by the N2 adsorption experiments was calculated based on the capillary condensation mechanism. According to the Kelvin equation, the larger the pore, the greater the relative pressure required for capillary condensation. The relative pressure at the time of capillary condensation in the macropores was close to that of the saturated vapor pressure, which was challenging to detect in the experiment. Therefore, to characterize the pore volume and specific surface area of pores with a pore size of less than 50 nm, the density functional theory (DFT) and BET models of the N2 adsorption method were utilized. The information about the pore size was obtained in accordance with the quantity of mercury molecules entering the shale under high pressure. The size of pores that mercury molecules can permeate through reduces with an increase in pressure. However, excessive pressure can lead to generated fractures and pore compression, which can produce false experimental results. MIP is therefore typically employed to examine pores with a diameter range greater than 50 nm. Pore size distributions of <50 nm and >50 nm were obtained by N2 adsorption and MIP, respectively, depending on the range of applications of the two techniques. A thorough analysis of the pore structure parameters (PV, SSA, and MWE) of various scales was performed (Figure 6 and Table 2).
Among the three lithofacies, the PV and SSA of the CS were the largest (Table 2), with ranges of 0.0093~0.0104 cm3/g and 2.2467~2.8540 m2/g and averages of 0.0099 cm3/g and 2.5504 m2/g, respectively. The PV and SSA of the MS were relatively small, ranging from 0.0053 to 0.0130 cm3/g and from 0.3833 to 3.6429 m2/g, respectively, with averages of 0.0087 cm3/g and 1.8264 m2/g. The PV and SSA of the SS were medium, with ranges of 0.0086~0.0112 cm3/g and 0.8741~3.1888 m2/g and averages of 0.0097 cm3/g and 2.0012 m2/g, respectively. In general, the average PV of the CS in the study sample was 1.13 and 1.02 times that of the MS and SS, while the average SSA of the CS was roughly 1.40 and 1.27 times that of the MS and SS. Figure 4 shows that the pore size distribution of the shale from the Funing Formation mainly contained three peaks, at <10 nm, 20~30 nm, and >10,000 nm. Figure 1 shows that the last peak was mainly caused by microcracks, whereas the preceding two peaks were mainly caused by corrosion pores. Small pores with a diameter of <50 nm, which make up the majority of the Funing Formation shale reservoir space, produced 89% of the PV and 99% of the SSA.

4.4. Fractal Dimension

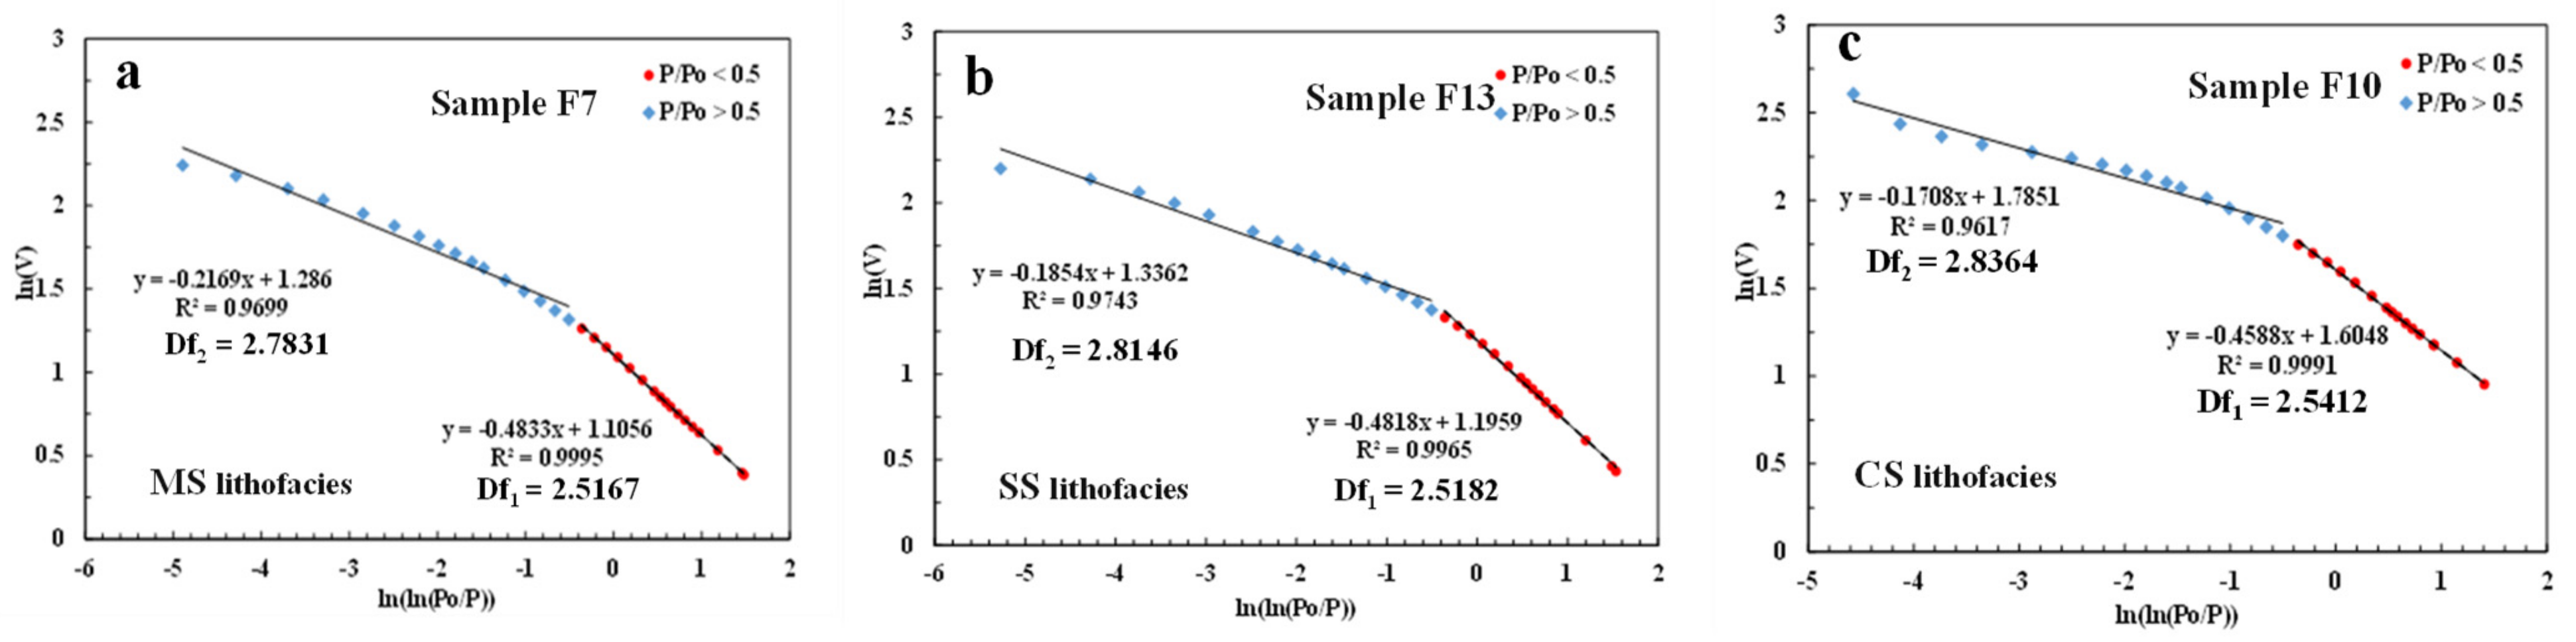
4.4.1. Fractal Dimension Based on N2 Adsorption

The fractal dimensions D1 and D2 were calculated using the nitrogen adsorption data and the FHH model (Equation (2)). Based on the N2 adsorption data with relative pressure between 0 and 0.5, D1 was calculated, with values ranging from 2.4948 to 2.5681 (Table 3 and Figure 7). D1 refers to the fractal dimension of the pore surface and is mainly governed by van der Waals force, representing the degree of irregularity of the shale surface [61]. Based on the N2 adsorption data with relative pressure between 0.5 and 1, D2 was calculated, with values ranging from 2.5952 to 2.8513 (Table 3 and Figure 7). D2, as a result of capillary condensation, represents the degree of irregularity of the pore structure, which is called the fractal dimension of the pore structure [61]. The different lithofacies of the shale demonstrates that D2 was greater than D1, showing that the pore structure is more intricate than the pore surface (Figure 7).

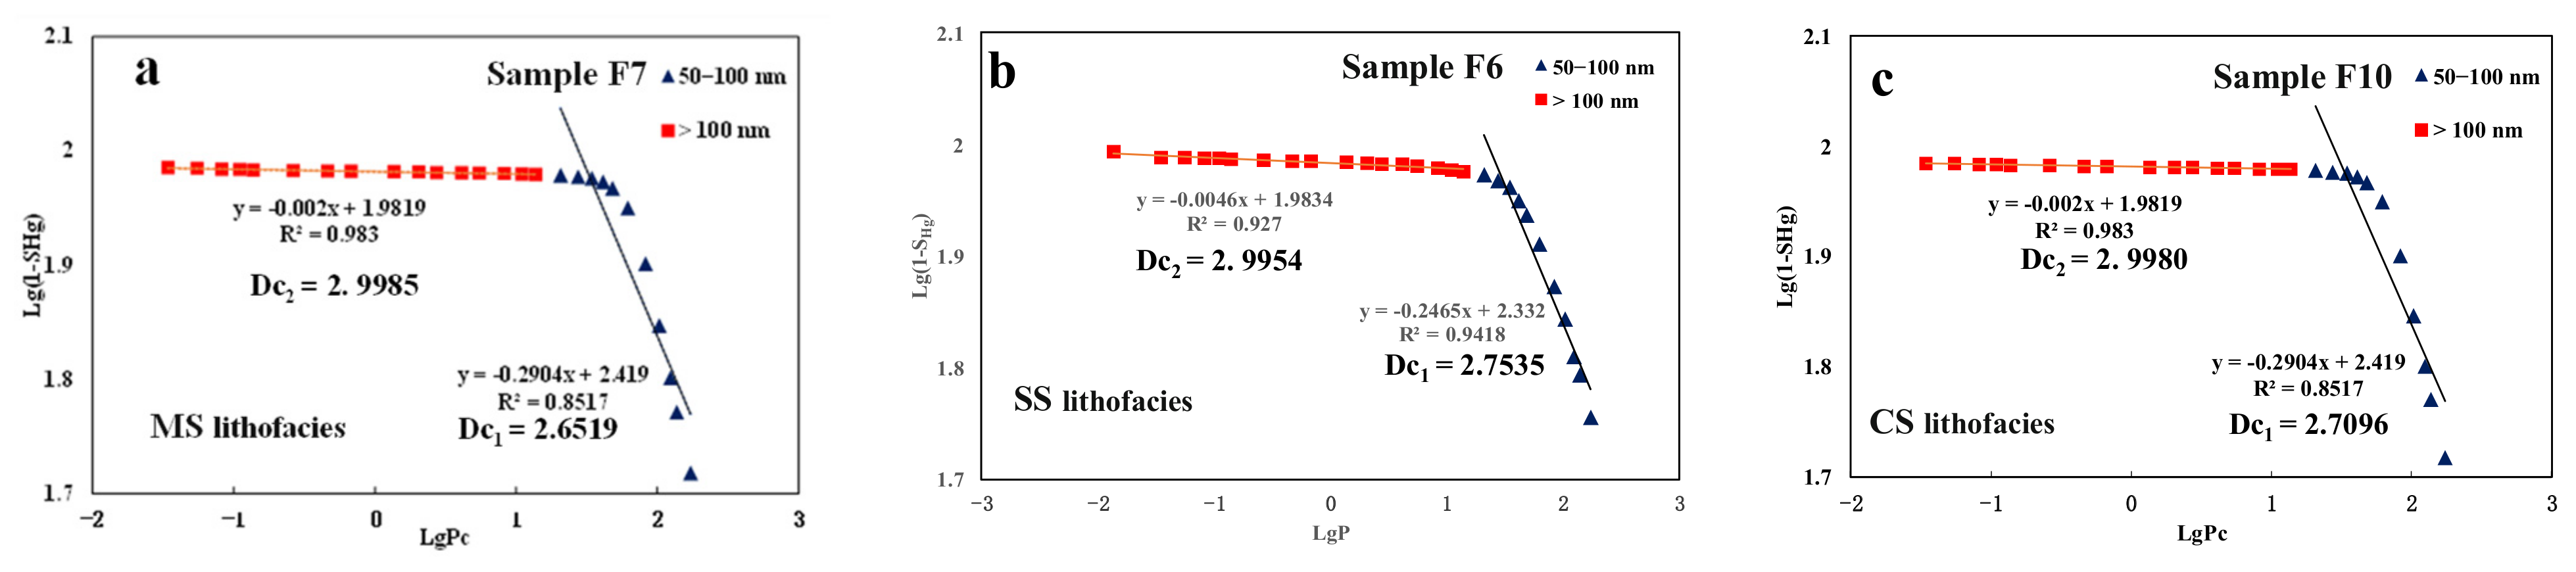
4.4.2. Fractal Dimension Based on MIP

Shale from the Funing Formation features a complicated pore structure with multifractal characteristics (Figure 8 and Table 3). The two-segment fractal characteristics of the MIP fractal curve are evident (Figure 8). As a result, the pore complexity values of various pore ranges matched to the fractal dimension were calculated by varying subsection pressure. In this study, Dc1 and Dc2 represent the optimal fractal properties of pores with widths between 50~100 nm and >100 nm, respectively. Dc1 ranged from 2.5031 to 2.9158 (average 2.7096), and Dc2 ranged from 2.9612 to 2.9985 (average 2.9937). In general, Dc1 < Dc2, suggesting that, as pore size grows, the complexity of the pore structure also increases.
Based on the idea of comprehensive fractal dimensions, a summary of the multi-segment fractal dimensions calculated using the MIP data is provided, allowing for easier comparison of the differences among the fractal dimensions of various sizes. According to the amount of PV within each diameter range, the scattered fractal dimension was then combined to create a total fractal dimension D3, as given in Formula (4) [62]. D3 is used to characterize the complexity of reservoir spaces with diameters greater than 50 nm. The range of D3 was 2.7634 to 2.9858, with an average value of 2.9194 and a median value of 2.9390, indicating that the macropores are highly heterogeneous, and the differences among the lithofacies are very small.
D t = Σ D i V i
where Dt is the comprehensive fractal dimension; Di is the fractal dimension of different pore diameters; Vi is the proportion of pore volume in different pore sizes, %.

5. Discussions

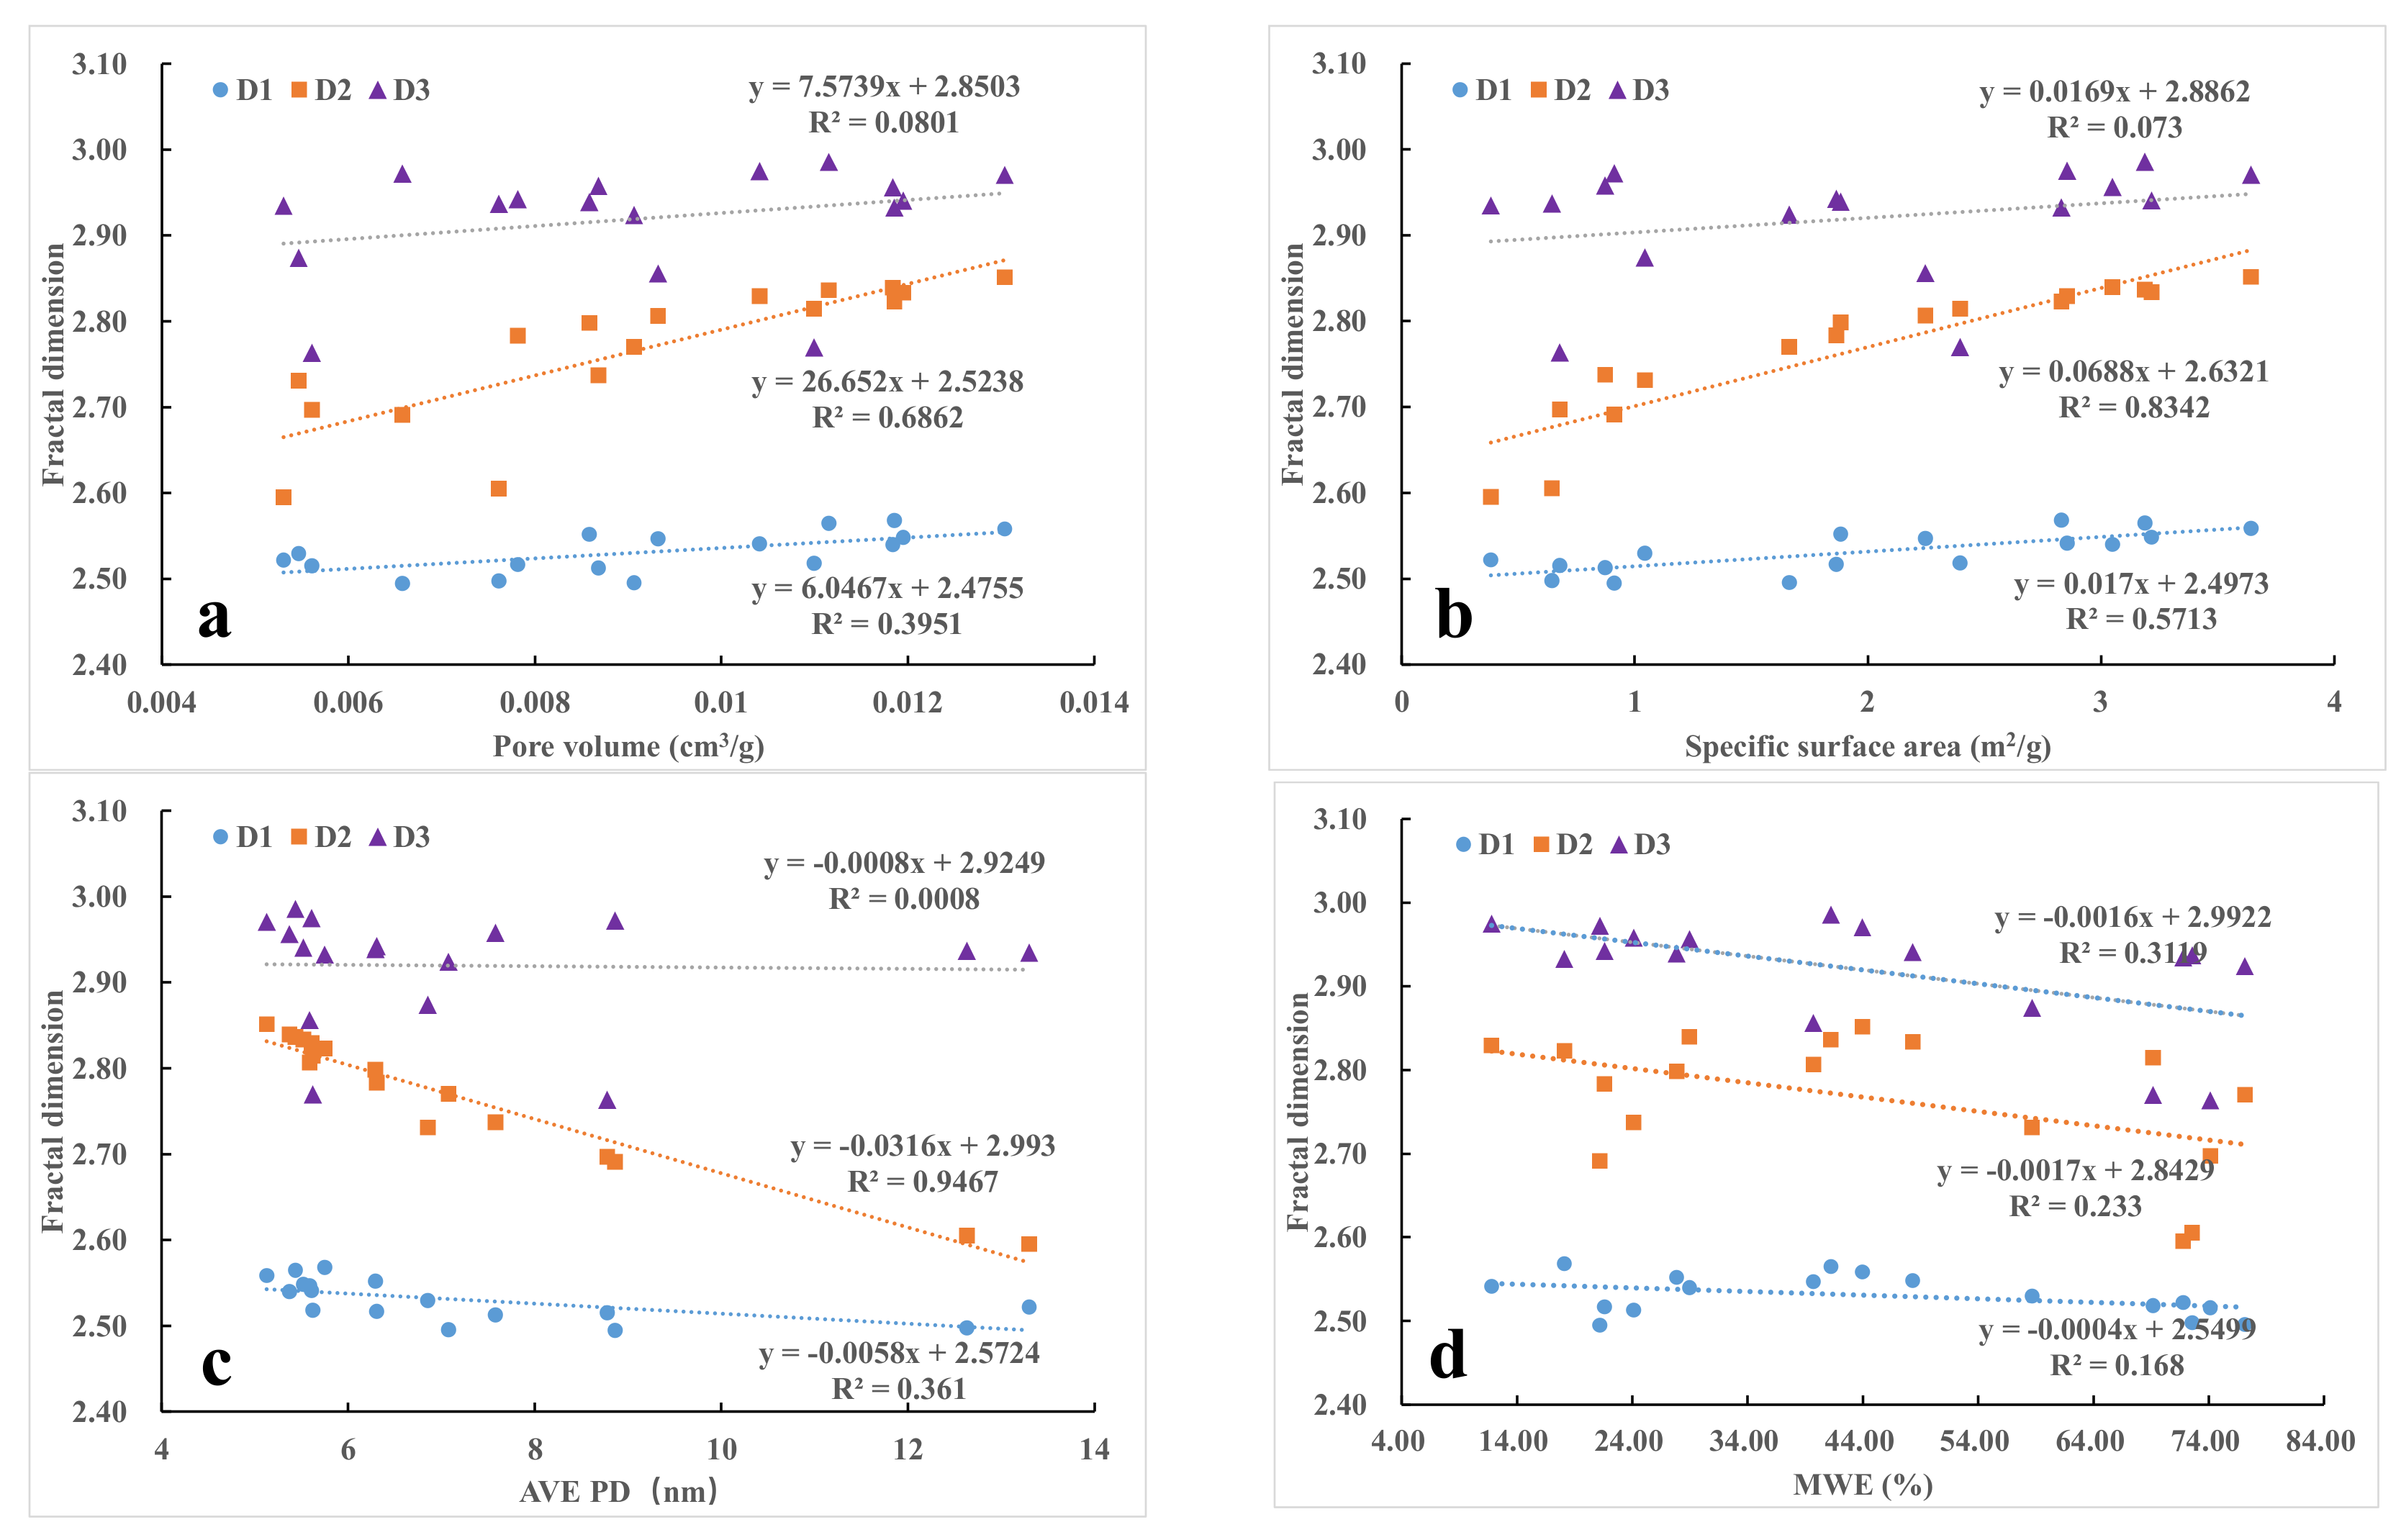
5.1. Relationship between Fractal Dimensions and Pore Structure

Figure 7 shows the correlation between the fractal dimension and the pore structure parameters of the Funing Formation shale samples. As shown in Figure 9a,b, D1 and D2 were positively correlated with the PV and SSA. According to Table 2, 89% of the PV and 99% of the SSA were contributed to by pores under 50 nm in size. From Figure 10a,b, it can be seen that the PV and SSA had a significant negative correlation with the AVE PD. Therefore, the larger the SSA and PV, the larger the number of small pores, and the larger the D1 and D2. The regression equation between the roughness of the shale rock pore surface (D1) and the AVE PD had a slope of −0.0058 and an R2 value of 0.361, indicating a limited impact of the AVE PD on D1. The roughness of the pore surface in shale is primarily influenced by factors such as the mineral composition and depositional environment, while factors such as the pore size, pore volume, and connectivity have a minimal impact [26,29,55,63]. There is little variation in the degree of roughness among pore surfaces with different pore sizes (Table 3). The mineral composition and depositional environment of the 17 samples in this study were highly comparable, as demonstrated in Table 1. As a result, there was minimal variation in the D1 values among the different samples, as shown in Table 3. The structural complexity of the small pores, as measured by D2, was found to be significantly influenced by the AVE PD, as indicated by the slope of −0.031 in the regression equation between the two parameters, with an R2 value of 0.9467. This suggests that there is a substantial difference in the structure complexity of small pores with varying aperture sizes. The main source of the pore volume was the small pores, and the smaller the AVE PD (Figure 10b), the greater the number of small pores, and the more complex the structure of these small pores tended to be. As depicted in Figure 9 and Figure 10, it can be observed that the differences in the D1 and D3 values among the different samples were relatively small, while the differences in the pore structure parameters were often attributed to differences in the development of small pores.
As shown in Table 2, large pores contribute less to the pore volume and specific surface area, a result of which D3 is irrelevant to the PV, SSA, and AVE PD. Furthermore, the correlation coefficient R2 was smaller than 0.1. As for D1, D2, and D3, they were negatively correlated with the MWE. For them, the correlation coefficient R2 values were 0.168, 0.233, and 0.3119, respectively (Figure 7d). The greater the pore network connectivity of shale, the higher the regularity of pores, and the lower the D1 and D2. In addition, D3 had the highest correlation coefficient with regard to the MWE, and the MWE shows a positive correlation with the AVE PD, as can be seen in Figure 10c. This suggests that regular macropore development has a considerable impact on the connectivity of the pore network.

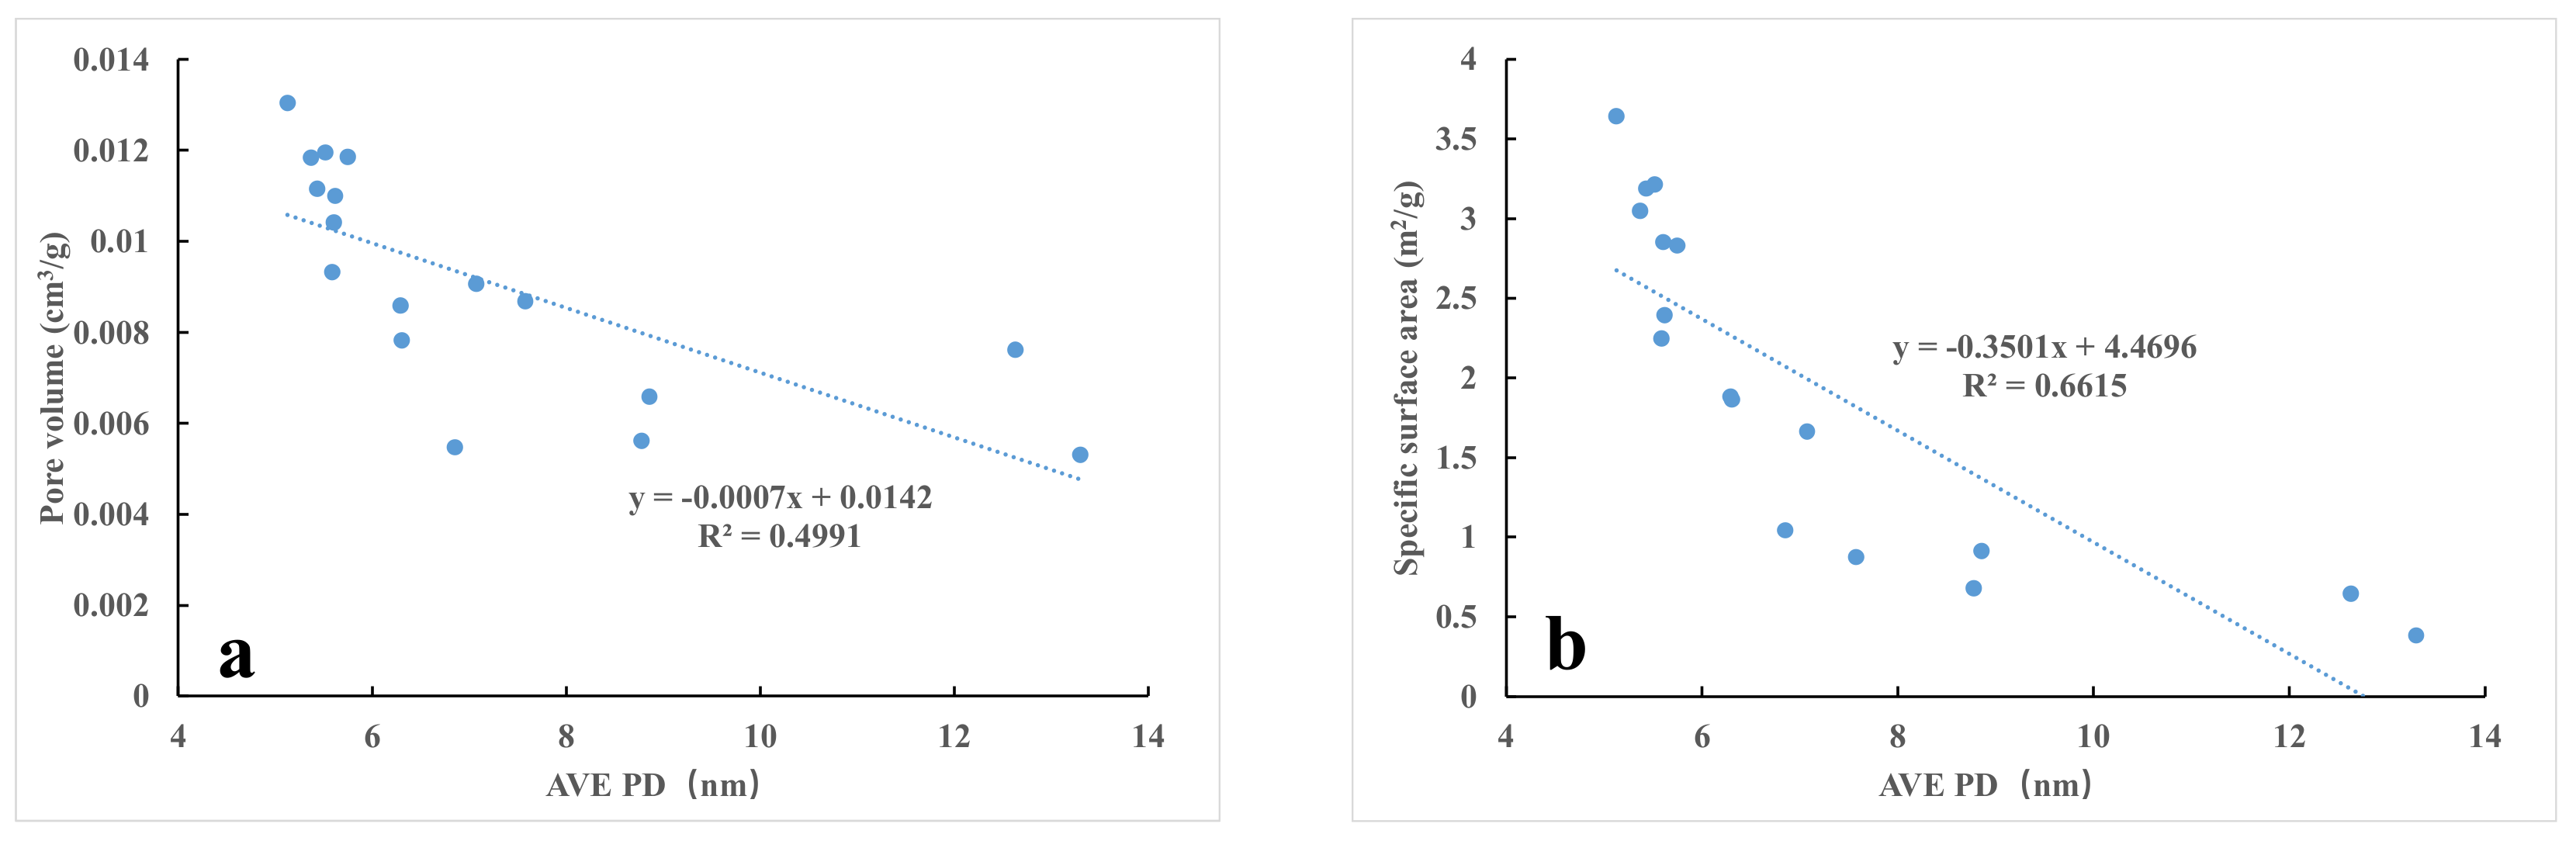
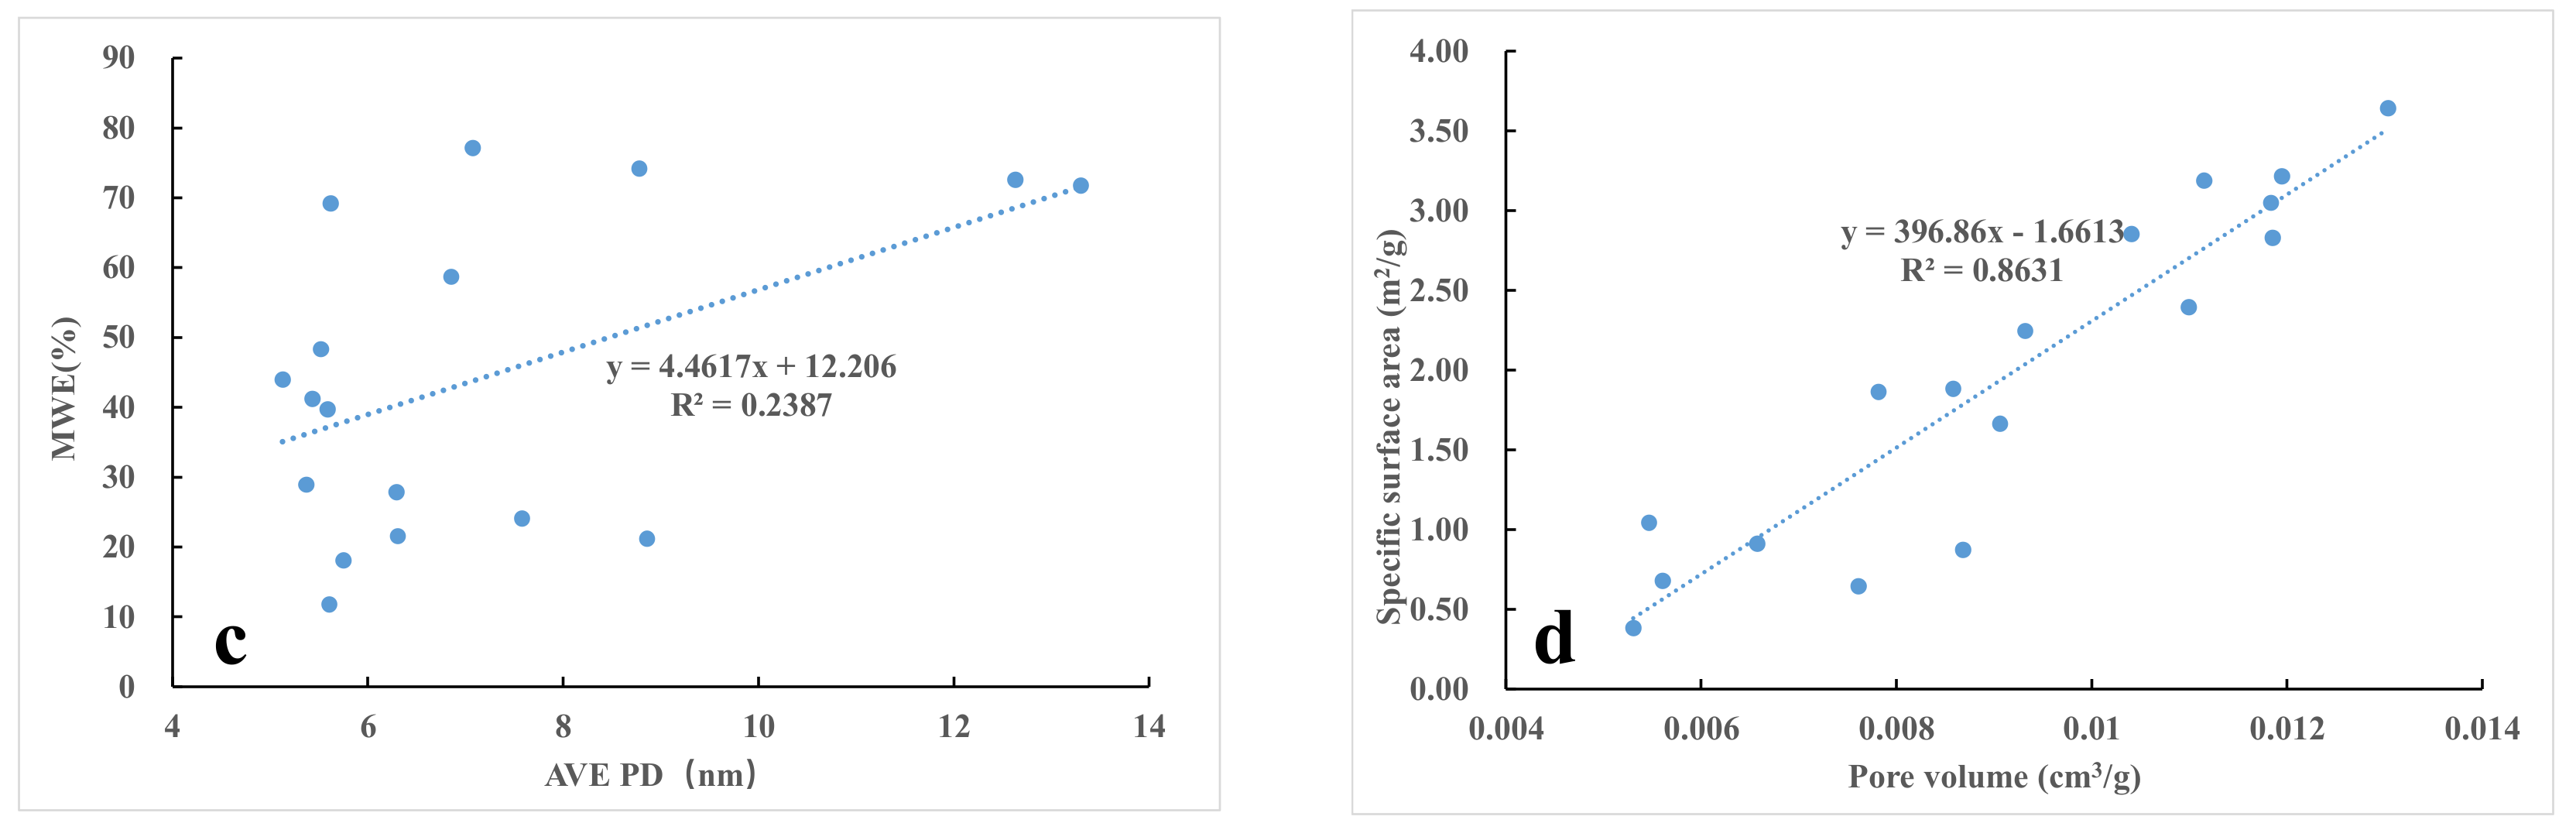
5.2. Control Factors of Heterogeneity of Pore Structure

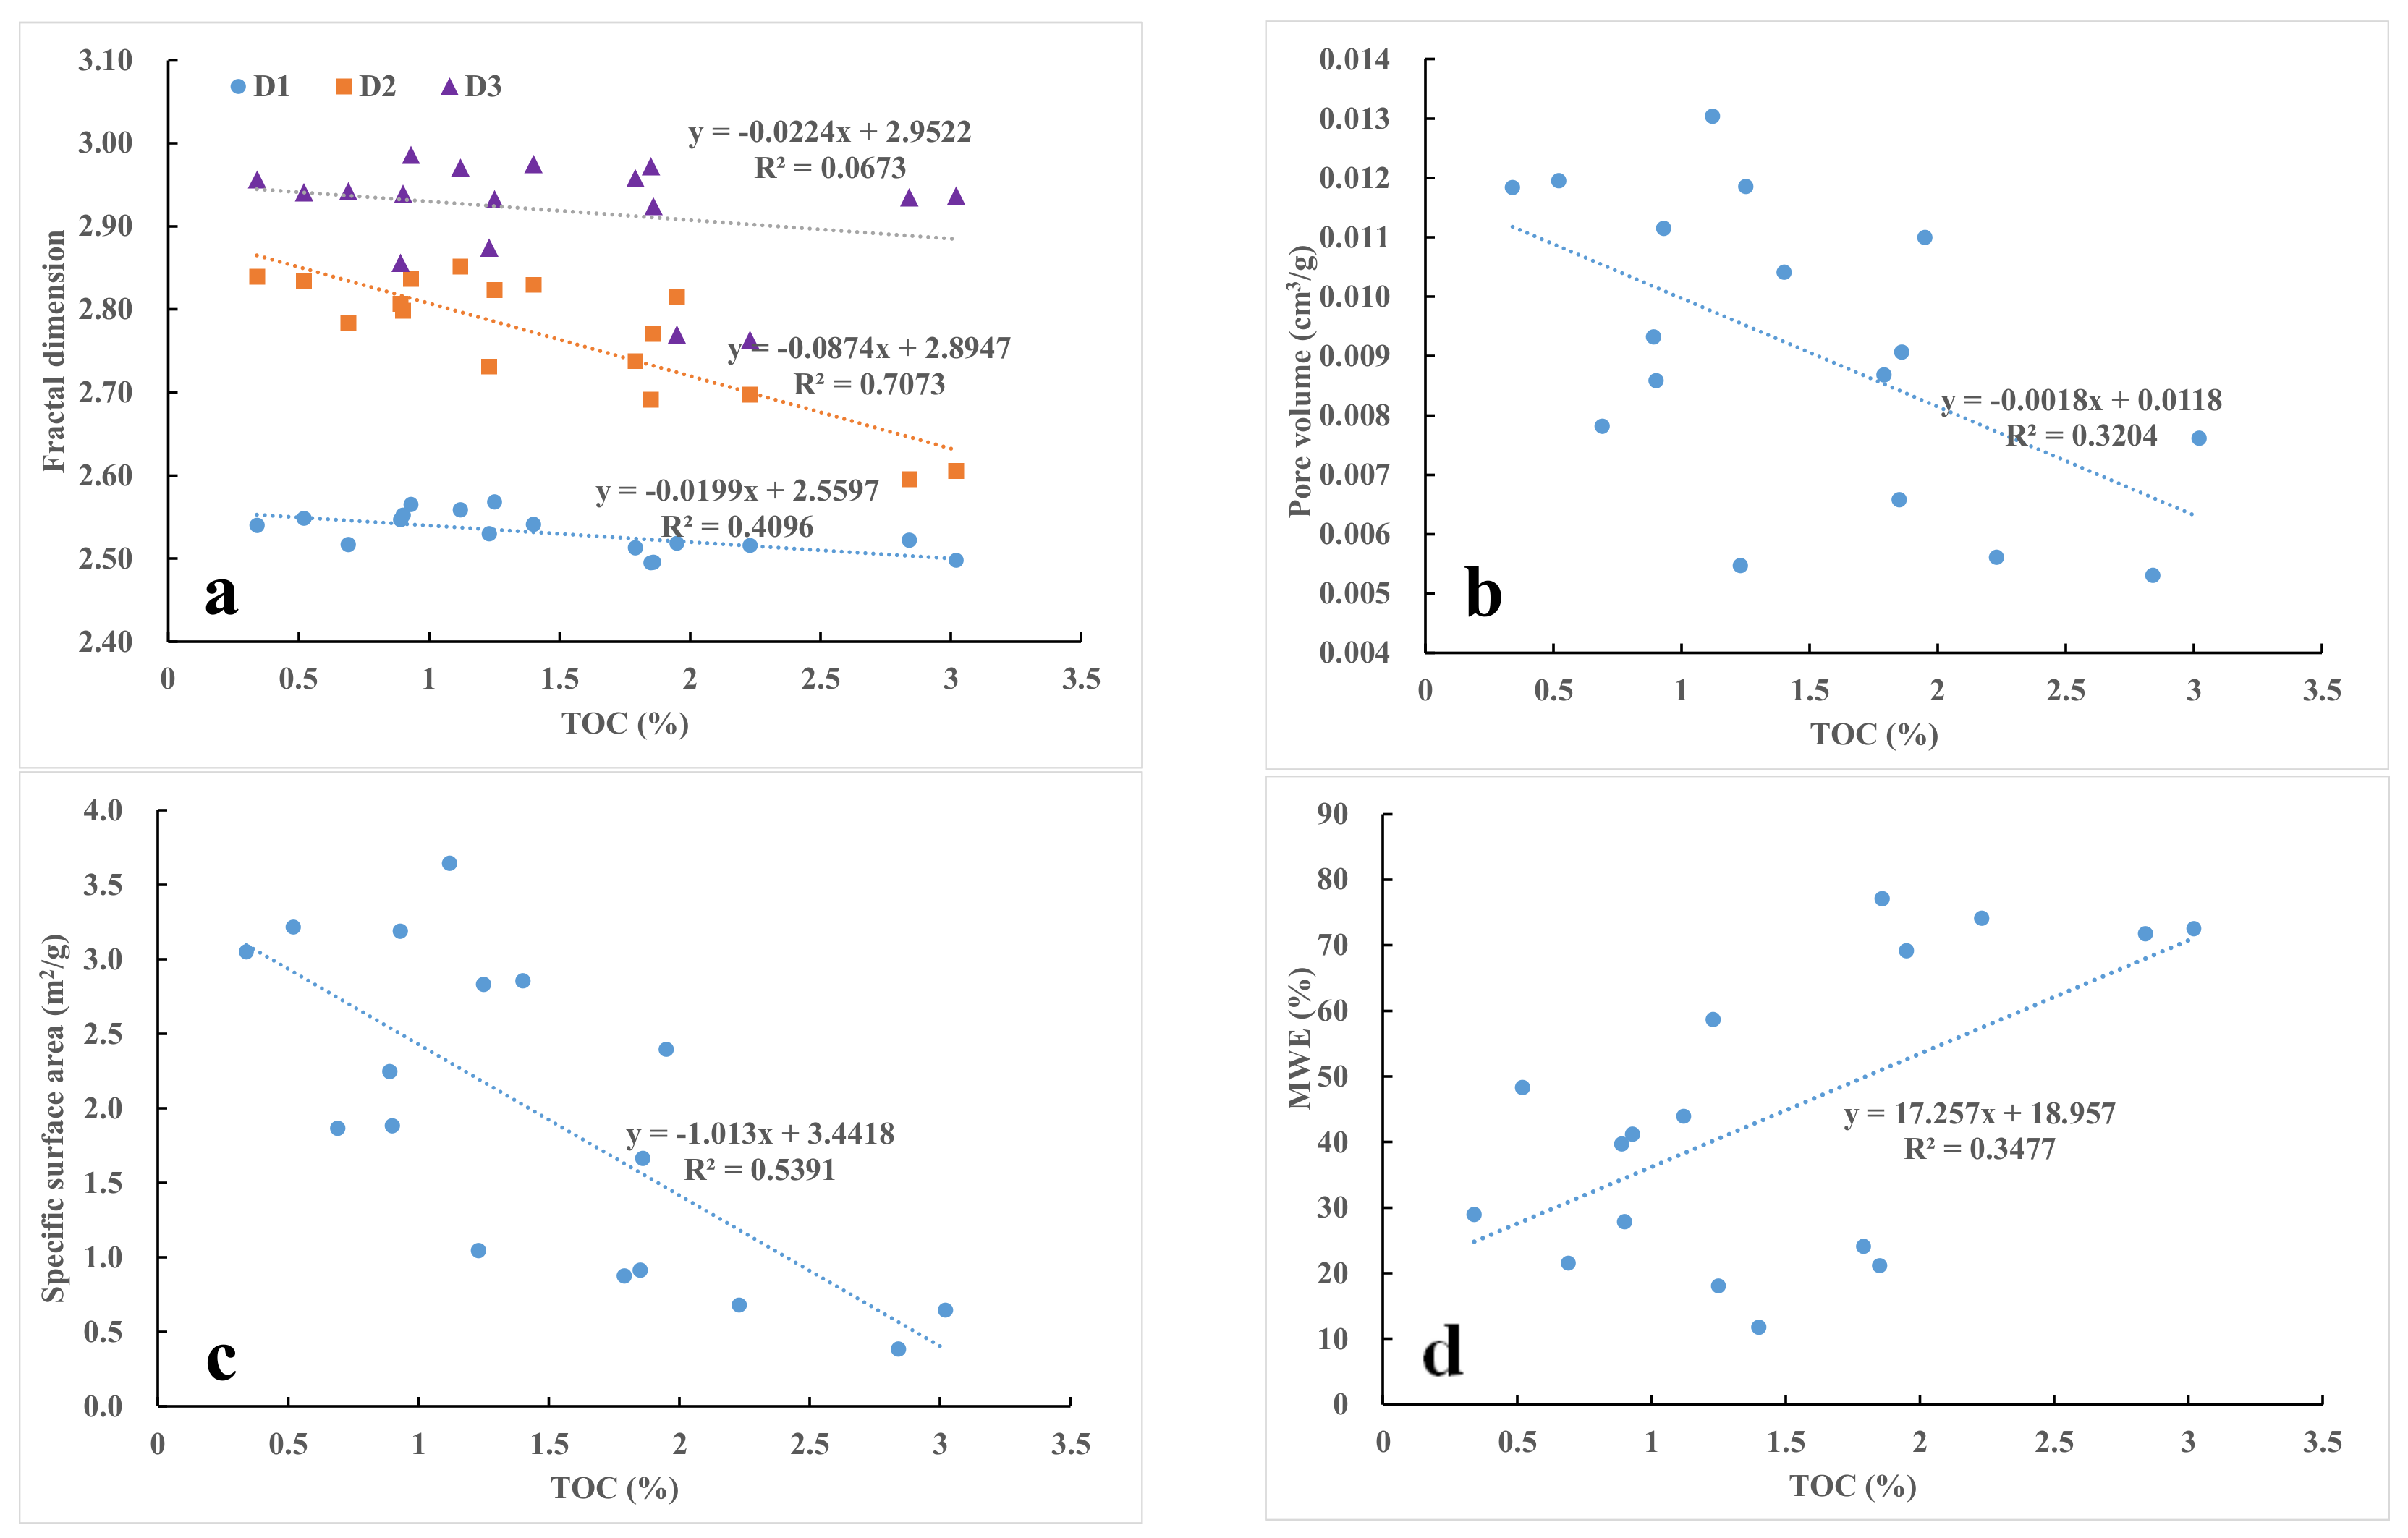
5.2.1. Impact of TOC on the Heterogeneity of Pore Structure

As shown in Figure 3a, nonporous organic matter accounts for a large majority of the organic matter in the shale samples of the Funing Formation. According to a previous study [64], the lower limit of maturity of organic pores in shale is 0.9%. The vitrinite reflectance of the sample ranged mainly between 0.7 and 0.9 (Table 1), and the maturity of organic matter remained low. This hindered the organic matter from generating a large amount of gas to produce pores. Instead, macropores and microfractures developed on a small scale (Figure 3c). On the one hand, with the increase in TOC, the space of development was reduced for small pores, which caused significant reductions in the D1 and D2 (Figure 11a). Due to the decline in the number of small pores, both the PV and SSA decreased (Figure 11b,c). On the other hand, the connectivity of the pore network was improved due to the small number of large pores and micro-fractures produced by organic matter. Therefore, the relationship between the MWE and the TOC content of organic matter was insignificantly positive (Figure 11d). According to the scanning electron microscope observations (Figure 3), the large pores mainly consisted of a large quantity of clay mineral pores and intergranular pores and a small number of organic matter pores, with the latter contributing little to the pore structure of the large pores. Therefore, the level of the structural complexity of the large pores (D3) does not depend on the amount of organic matter. Consequently, there was no clear correlation between the macropore fractal dimension D3 and the TOC (Figure 11a). In summary, the D1, D2, PV, and SSA decreased with an increase in the TOC, but the connectivity was improved slightly.

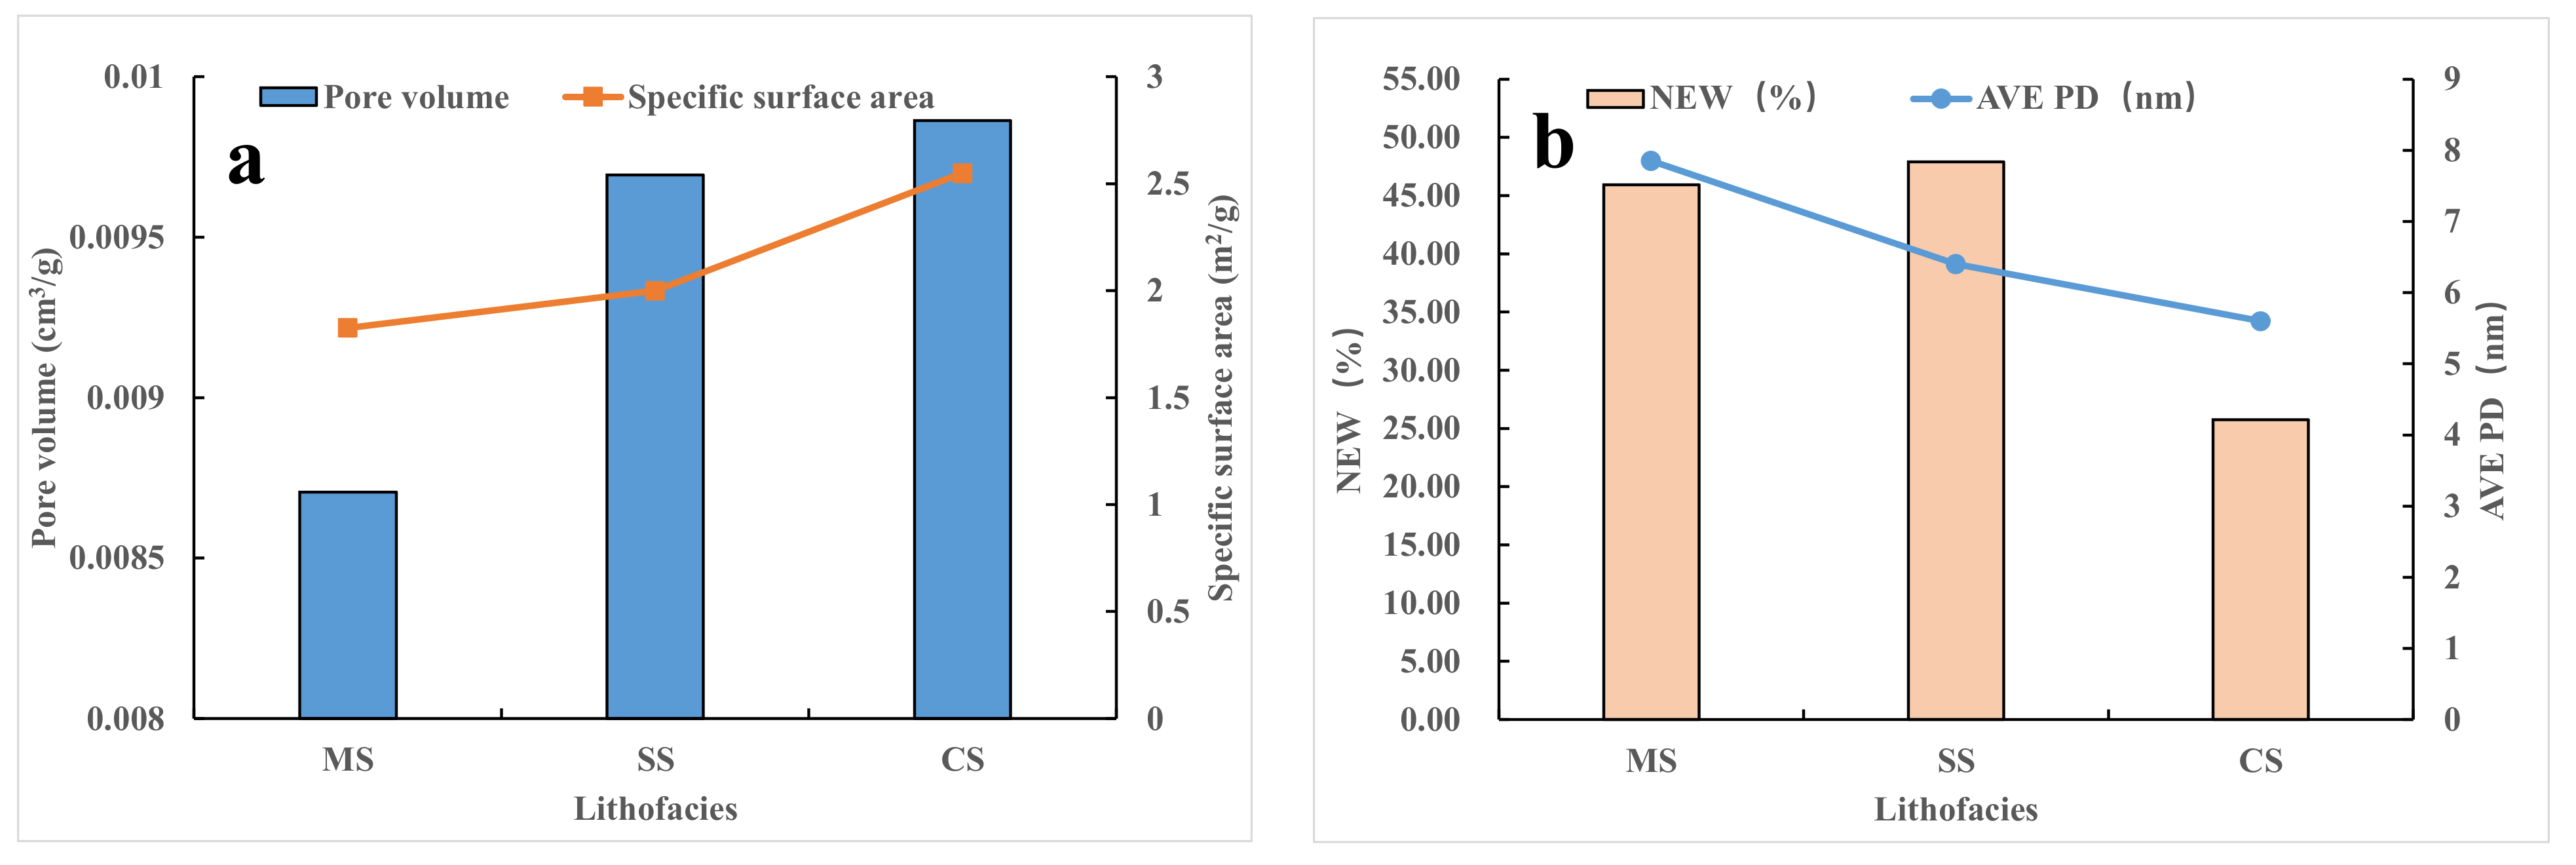
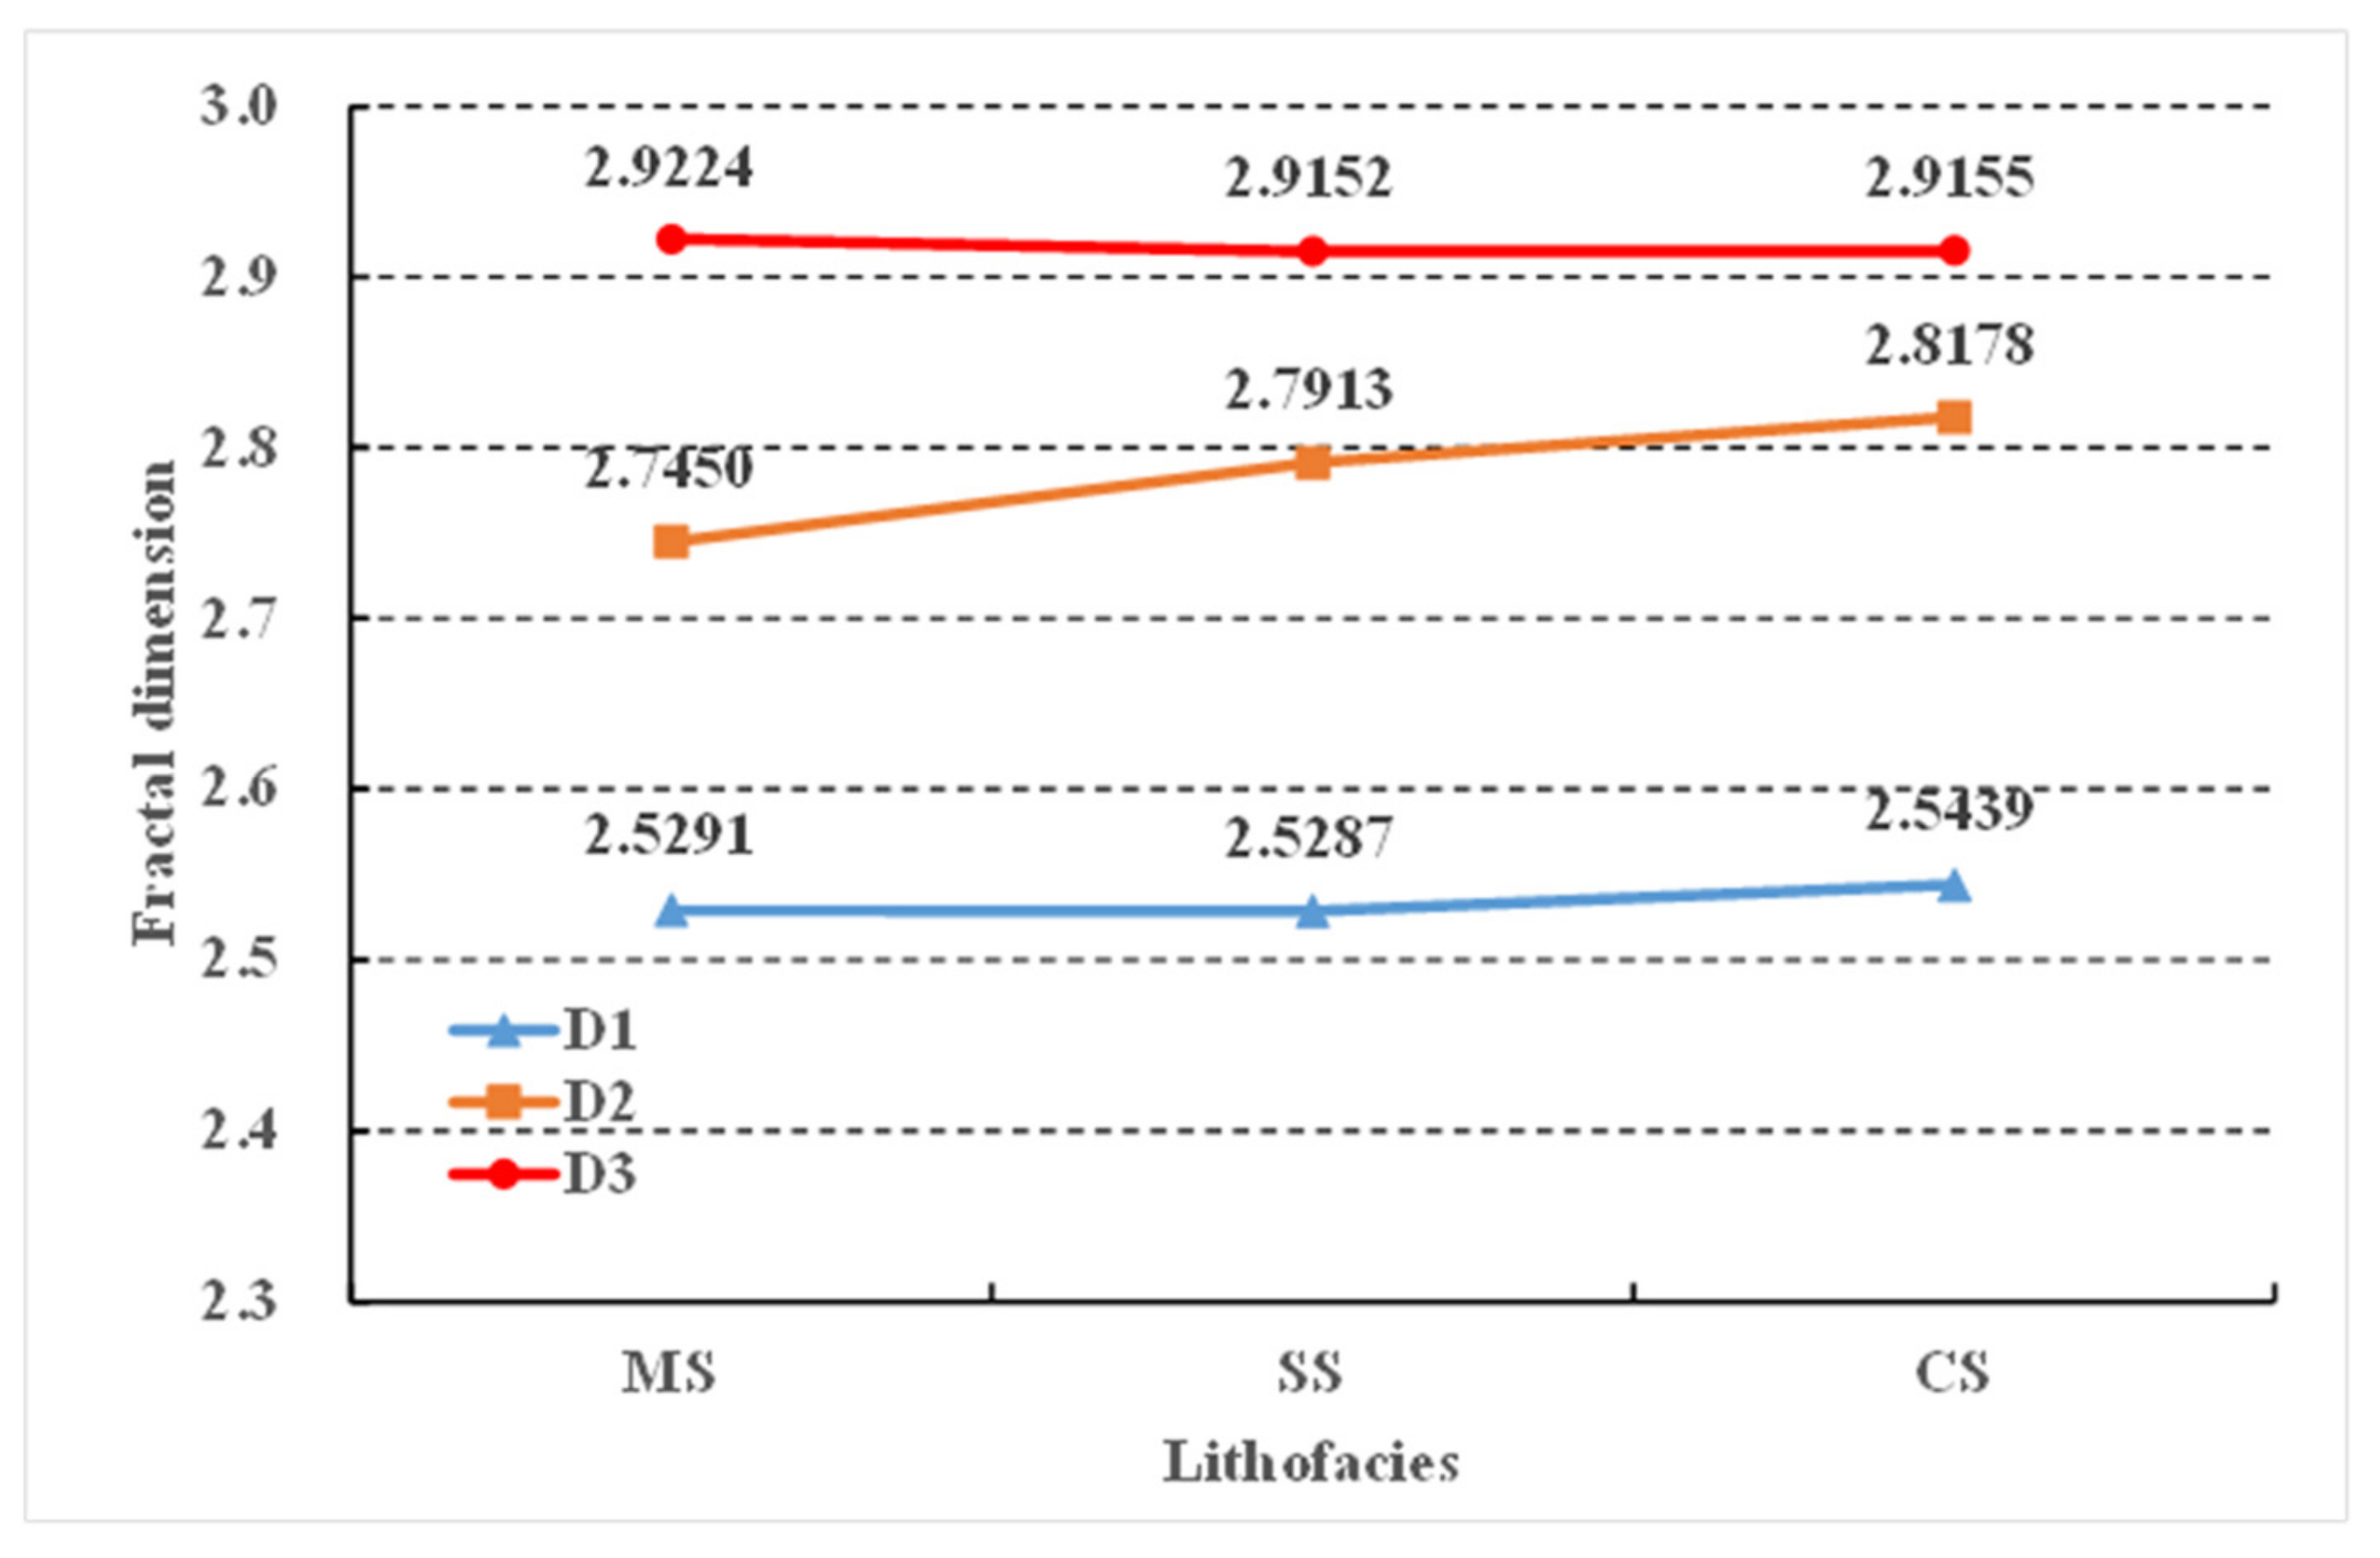
5.2.2. Impact of Lithofacies on the Heterogeneity of Pore Structure

Compared to the MS and SS lithofacies, the PV and SSA of the CS lithofacies were higher (Figure 12a), reaching 0.0093~0.0104 cm3/g and 2.2467~2.8540 m2/g, respectively (Table 2). In addition, the MWE (25.76%) of the CS lithofacies was the lowest, reaching a significantly lower level than that of the MS (45.94%) and CS (47.91%), which indicates it has the worst connectivity. Since the content of soluble carbonate minerals (calcite and dolomite) in CS exceeds 50%, there were a large number of isolated and poorly connected dissolution small pores in development (Figure 3a). Therefore, the pore structure of the CS shale pores was highly heterogeneous, and the shale surface was rough. In addition, the D1 and D2 reached a high level, the average values of which were 2.5439 and 2.8178, respectively (Table 2 and Figure 13).
The PV and SSA of the SS were moderate, reaching 0.0086~0.0112 cm3/g and 0.8741~3.1888 m2/g, respectively. Similar to calcite and dolomite, SS contains a small proportion of feldspar (16.02%~22.69%), making it easy for isolated and poorly connected dissolution small pores to develop. In addition, the contents of rigid minerals, such as quartz and feldspar, in the SS shale reached above 50%. Since the rigid framework composed of quartz, feldspar, and other minerals promotes the preservation of primary intergranular pores, the SS shale contains a small number of small pores and well-preserved macropores. For this reason, the AVE PD of the SS shale was high, the connectivity was satisfactory (Figure 12), and the heterogeneity was moderate (Figure 13).
The average PV and SSA of the MS were the smallest, reaching 0.0087 cm3/g and 1.8264 m2/g, respectively. By contrast, the AVE PD and MWE were higher (Figure 12). MS contains plenty of clay minerals (>25%), which tend to aggregate with organic matter and pyrite to develop macropores and microfractures (Figure 3b,d). Therefore, the AVE PD of the MS was high and the pore connectivity was excellent (Figure 12b). Compared to siliceous minerals and carbonate minerals, clay minerals have greater plasticity but more susceptibility to damage caused by compaction, thus resulting in plate pore morphology (Figure 3d). Therefore, the D1 and D2 of the MS were low, the averages of which were 2.5291 and 2.7450, respectively (Table 2 and Figure 13).
To sum up, the D2 varied significantly among the different lithofacies, but the D1 and D3 barely differed. The shales of the different lithofacies show the order of D3 > D2 > D1. The pore structure is more complex than the pore surface, and the heterogeneity of large pores is greater compared to small pores. Among the three lithofacies, the CS had the largest PV, SSA, D1, and D2, indicating the development of a more complex pore structure network. This expands the space needed for shale oil occurrence. However, the connectivity of the CS lithofacies was the lowest among the three, which hinders shale oil production. Although the PV of the SS was slightly lower than that of the CS, its average pore diameter (AVE PD) and connectivity are significantly advantageous, making the SS an ideal shale reservoir.

6. Conclusions

(1) The Funing Formation shale is in the mature stage, with a TOC of about 60% in the samples exceeding 1%, and the source rock conditions are advantageous. The primary minerals of the Funing Formation include quartz and clay, followed by calcite and dolomite, but there are no obviously dominant minerals, with the average content falling below 30%. The lithofacies are comprised mainly of mixed shale (58.82%) and siliceous shale (29.41%);
(2) The microscopic pores of the Funing Formation shale are dominated by inorganic mineral pores and fewer organic pores. Intragranular pores and clay mineral pores are two types of inorganic mineral pores that have developed widely. The MWE of the Funing Formation shale is usually lower than 50%. Among the three lithofacies, the CS had the worst MWE (25.76%), indicating its poor connectivity. Ink-bottle pores and plate pores represent the main pore morphology. The pore size distribution of the Funing Formation shale had three major peaks, at < 10 nm, 20~30 nm, and >10,000 nm respectively. In addition, 89% of the PV and 99% of the SSA are attributed to the pore sizes below 50 nm, both of which are the principal components of the Funing Formation shale reservoir space;
(3) The fractal dimensions D1, D2, and D3 were calculated respectively to characterize the roughness of the pore surface, the structural complexity of the small pores, and the structural complexity of the large pores (pore size > 50 nm). D1 and D2 are positively correlated with the SSA and PV but negatively correlated with the average pore size. D3 is positively correlated with the connectivity and average pore size but irrelevant to the PV, SSA, and average pore size. With the increase in the TOC, the D1, D2, PV, and SSA decreased, but the connectivity improved slightly. The shales of the different lithofacies show the order of D3 > D2 > D1. The pore structure is more complex than the pore surface, and the heterogeneity of the large pores is greater compared to the small pores. Among the three lithofacies, the CS had the largest PV, SSA, D1, and D2, indicating the development of a more complex pore structure network, which expands the space required for shale oil occurrence. However, the connectivity of the CS was the worst among the three lithofacies, which is adverse to shale oil production. Although the PV of the SS was slightly smaller than that of the CS, the average pore size and connectivity are obviously more desirable, which makes the SS an ideal shale reservoir.

Author Contributions

Conceptualization, P.L. and H.G.; methodology, Z.W.; software, Z.L.; validation, Y.W. and X.S.; formal analysis, H.G.; investigation, Z.J.; resources, Z.J.; data curation, P.L.; writing—original draft preparation, H.G.; writing—review and editing, P.L.; visualization, F.Z.; supervision, F.Z.; project administration, Z.W.; funding acquisition, Z.J. All authors have read and agreed to the published version of the manuscript.

Funding

This study was supported by the National Natural Science Foundation of China (no. 42272137, no .41872135, and no. 42072151).

Data Availability Statement

The data presented in this study are available upon request from the corresponding author. The data are not publicly available because some of the basic research involves confidentiality.

Acknowledgments

We are grateful to the editors and reviewers for their constructive comments and suggestions.

Conflicts of Interest

The authors declare no conflict of interest.

References

  1. Zou, C.; Pan, S.; Jing, Z.; Gao, J.; Yang, Z.; Wu, S.; Zhao, Q. Shale oil and gas revolution and its impact. Acta Pet. Sin. 2020, 41, 1–12. [Google Scholar]
  2. Jin, Z.; Bai, Z.; Gao, B.; Li, M. Has China ushered in the shale oil and gas revolution? Oil Gas Geol. 2019, 40, 451–458. [Google Scholar]
  3. Zhang, T.S.; Hu, S.Y.; Bu, Q.Y.; Bai, B.; Tao, S.Z.; Chen, Y.Y.; Pan, Z.J.; Lin, S.H.; Pang, Z.L.; Xu, W.L.; et al. Effects of lacustrine depositional sequences on organic matter enrichment in the Chang 7 Shale, Ordos Basin, China. Mar. Pet. Geol. 2021, 124, 104778. [Google Scholar] [CrossRef]
  4. Xie, X.M.; Li, M.W.; Littke, R.; Huang, Z.K.; Ma, X.X.; Jiang, Q.G.; Snowdon, L.R. Petrographic and geochemical characterization of microfacies in a lacustrine shale oil system in the Dongying Sag, Jiyang Depression, Bohai Bay Basin, eastern China. Int. J. Coal Geol. 2016, 165, 49–63. [Google Scholar] [CrossRef]
  5. Wang, M.; Guo, Z.Q.; Jiao, C.X.; Lu, S.F.; Li, J.B.; Xue, H.T.; Li, J.J.; Li, J.Q.; Chen, G.H. Exploration progress and geochemical features of lacustrine shale oils in China. J. Pet. Sci. Eng. 2019, 178, 975–986. [Google Scholar] [CrossRef]
  6. Larue, D.; Smithard, M.; Mercer, M. Three deep resource plays in the San Joaquin Valley compared with the Bakken Formation. AAPG Bull. 2018, 102, 195–243. [Google Scholar] [CrossRef]
  7. Furmann, A.; Mastalerz, M.; Schimmelmann, A.; Pedersen, P.K.; Bish, D. Relationships between porosity, organic matter, and mineral matter in mature organic-rich marine mudstones of the Belle Fourche and Second White Specks formations in Alberta, Canada. Mar. Pet. Geol. 2014, 54, 65–81. [Google Scholar] [CrossRef]
  8. Katz, B.; Lin, F. Lacustrine basin unconventional resource plays: Key differences. Mar. Pet. Geol. 2014, 56, 255–265. [Google Scholar] [CrossRef]
  9. Zhang, L.; Bao, Y.; Li, J.; Li, Z.; Zhu, R.; Zhang, J. Movability of lacustrine shale oil: A case study of Dongying Sag, Jiyang Depression, Bohai Bay Basin. Pet. Explor. Dev. 2014, 41, 641–649. [Google Scholar] [CrossRef]
  10. Hu, Q.H.; Zhang, Y.X.; Meng, X.H.; Li, Z.; Xie, Z.H.; Li, M.W. Characterization of micro-nano pore networks in shale oil reservoirs of Paleogene Shahejie Formation in Dongying Sag of Bohai Bay Basin, East China. Pet. Explor. Dev. 2017, 44, 720–730. [Google Scholar] [CrossRef]
  11. Zhao, X.; Zhou, L.; Pu, X.; Jin, F.; Shi, Z.; Xiao, D.; Han, W.; Jiang, W.; Zhang, W.; Wang, H. Favorable formation conditions and enrichment characteristics of lacustrine facies shale oil in faulted lake basin: A case study of Member 2 of Kongdian Formation in Cangdong sag, Bohai Bay Basin. Acta Pet. Sin. 2019, 40, 1013–1029. [Google Scholar]
  12. Zhao, X.; Zhou, L.; Pu, X.; Jin, F.; Han, W.; Xiao, D.; Chen, S.; Shi, Z.; Zhang, W.; Yang, F. Geological characteristics of shale rock system and shale oil exploration in a lacustrine basin: A case study from the Paleogene 1st sub-member of Kong 2 Member in Cangdong sag, Bohai Bay Basin, China. Pet. Explor. Dev. 2018, 45, 361–372. [Google Scholar] [CrossRef]
  13. Du, J.; Hu, S.; Pang, Z.; Lin, S.; Hou, L.; Zhu, R. The types, potentials and prospects of continental shale oil in China. China Pet. Explor. 2019, 24, 560–568. [Google Scholar]
  14. Zhou, L.; Pu, X.; Chen, C.; Yang, F.; Xia, J.; Guan, Q.; Huang, C. Concept,Characteristics and Prospecting Significance of Fine-Grained Sedimentary Oil Gas in Terrestrial Lake Basin: A Case from the Second Member of Paleogene Kongdian Formation of Cangdong Sag, Bohai Bay Basin. Earth Sci. 2018, 43, 3625–3639. [Google Scholar]
  15. Zhou, L.; Zhao, X.; Chai, G.; Jiang, W.; Pu, X.; Wang, X.; Han, W.; Guan, Q.; Feng, J.; Liu, X. Key exploration & development technologies and engineering practice of continental shale oil:A case study of Member 2 of Paleogene Kongdian Formation in Cangdong Sag, Bohai Bay Basin, East China. Pet. Explor. Dev. 2020, 47, 1059–1066. [Google Scholar]
  16. Hu, S.; Zhao, W.; Hou, L.; Yang, Z.; Zhu, R.; Wu, S.; Bai, B.; Jin, X. Development potential and technical strategy of continental shale oil in China. Pet. Explor. Dev. 2020, 47, 819–828. [Google Scholar] [CrossRef]
  17. Jin, Z.; Wang, G.; Liu, G.; Gao, B.; Liu, Q.; Wang, H.; Liang, X.; Wang, R. Research progress and key scientific issues of continental shale oil in China. Acta Pet. Sin. 2021, 42, 821–835. [Google Scholar]
  18. Deng, Y.; Pu, X.; Chen, S.; Yan, J.; Shi, Z.; Zhang, W.; Han, W. Characteristics and controlling factors of fine-grained mixed sedimentary rocks reservoir: A case study of the 2~(nd) member of Kongdian formation in Cangdong depression, Bohai Bay basin. J. China Univ. Min. Technol. 2019, 48, 1301–1316. [Google Scholar]
  19. Zhang, Q.; Liang, F.; Liang, P.; Zhou, S.; Guo, W.; Guo, W.; Lu, B.; Liu, W. Investigation of fractal characteristics and its main controlling factors of shale reservoir: A case study of the Longmaxi shale in Weiyuan shale gas field. J. China Univ. Min. Technol. 2020, 49, 110–122. [Google Scholar]
  20. Yang, F.; Ning, Z.; Wang, Q.; Kong, D.; Peng, K.; Xiao, L. Fractal Characteristics of Nanopore in Shales. Nat. Gas Geosci. 2014, 25, 618–623. [Google Scholar]
  21. Li, Z.; Liang, Z.K.; Jiang, Z.X.; Gao, F.L.; Zhang, Y.H.; Yu, H.L.; Xiao, L.; Yang, Y.D. The Impacts of Matrix Compositions on Nanopore Structure and Fractal Characteristics of Lacustrine Shales from the Changling Fault Depression, Songliao Basin, China. Minerals 2019, 9, 127. [Google Scholar] [CrossRef] [Green Version]
  22. Zhang, F.; Jiang, Z.X.; Sun, W.; Zhang, X.; Zhu, L.; Li, X.H.; Zhao, W. Effect of Microscopic Pore-Throat Heterogeneity on Gas-Phase Percolation Capacity of Tight Sandstone Reservoirs. Energy Fuels 2020, 34, 12399–12416. [Google Scholar] [CrossRef]
  23. Dou, W.C.; Liu, L.F.; Jia, L.B.; Xu, Z.J.; Wang, M.Y.; Du, C.J. Pore structure, fractal characteristics and permeability prediction of tight sandstones: A case study from Yanchang Formation, Ordos Basin, China. Mar. Pet. Geol. 2021, 123, 104737. [Google Scholar] [CrossRef]
  24. Liu, B.; Nakhaei-Kohani, R.; Bai, L.H.; Wen, Z.G.; Gao, Y.F.; Tian, W.C.; Yang, L.; Liu, K.Q.; Hemmati-Sarapardeh, A.; Ostadhassan, M. Integrating advanced soft computing techniques with experimental studies for pore structure analysis of Qingshankou shale in Southern Songliao Basin, NE China. Int. J. Coal Geol. 2022, 257, 103998. [Google Scholar] [CrossRef]
  25. Ma, B.Y.; Hu, Q.H.; Yang, S.Y.; Zhang, T.; Qiao, H.G.; Meng, M.M.; Zhu, X.C.; Sun, X.H. Pore structure typing and fractal characteristics of lacustrine shale from Kongdian Formation in East China. J. Nat. Gas Sci. Eng. 2021, 85, 103709. [Google Scholar] [CrossRef]
  26. Li, X.; Wang, Y.; Lin, W.; Ma, L.; Liu, D.; Liu, J.; Zhang, Y. Micro-pore structure and fractal characteristics of deep shale from Wufeng Formation to Longmaxi Formation in Jingmen exploration area,Hubei Province. Nat. Gas Geosci. 2022, 33, 629–641. [Google Scholar] [CrossRef]
  27. Liang, Z.; Jiang, Z.; Li, Z.; Gao, F.; Liu, X. Investigation into the Pore Structure and Multifractal Characteristics of Shale Reservoirs through N2 Adsorption: An Application in the Triassic Yanchang Formation, Ordos Basin, China. Geofluids 2021, 2021, 9949379. [Google Scholar] [CrossRef]
  28. Liang, Z.; Jiang, Z.; Li, Z.; Song, Y.; Gao, F.; Liu, X.; Xiang, S. Nanopores structure and multifractal characterization of bulk shale and isolated kerogen—An application in Songliao Basin, China. Energy Fuels 2021, 35, 5818–5842. [Google Scholar] [CrossRef]
  29. Ma, X.; Guo, S.B.; Shi, D.S.; Zhou, Z.; Liu, G.H. Investigation of pore structure and fractal characteristics of marine-continental transitional shales from Longtan Formation using MICP, gas adsorption, and NMR (Guizhou, China). Mar. Pet. Geol. 2019, 107, 555–571. [Google Scholar] [CrossRef]
  30. Zhang, S.; Liu, H.; Wu, C.; Jin, Z. Influence of particle size on pore structure and multifractal characteristics in coal using low-pressure gas adsorption. J. Pet. Sci. Eng. 2022, 212, 110273. [Google Scholar] [CrossRef]
  31. Chen, L.Q. Estimation of the amount of erosion at unconformities in the last stage of the Eocene Sanduo period in the Subei Basin, China. Pet. Sci. 2009, 6, 383–388. [Google Scholar] [CrossRef] [Green Version]
  32. Cheng, Q.S.; Zhang, M.; Li, H.B. Anomalous distribution of steranes in deep lacustrine facies low maturity-maturity source rocks and oil of Funing formation in Subei Basin. J. Pet. Sci. Eng. 2019, 181, 106190. [Google Scholar] [CrossRef]
  33. Qiao, X.J.; Li, G.M.; Li, M.; Wang, Z.M. CO2 storage capacity assessment of deep saline aquifers in the Subei Basin, East China. Int. J. Greenh. Gas Control 2012, 11, 52–63. [Google Scholar] [CrossRef]
  34. Liu, X.P.; Lai, J.; Fan, X.C.; Shu, H.L.; Wang, G.C.; Ma, X.Q.; Liu, M.C.; Guan, M.; Luo, Y.F. Insights in the pore structure, fluid mobility and oiliness in oil shales of Paleogene Funing Formation in Subei Basin, China. Mar. Pet. Geol. 2020, 114, 104228. [Google Scholar] [CrossRef]
  35. Peters, K.E. Guidelines for evaluating petroleum source rock using programmed pyrolysis. AAPG Bull. 1986, 70, 318–329. [Google Scholar]
  36. Taylor, G.; Teichmüller, M.; Davis, A.; Diessel, C.; Littke, R.; Robert, P. Organic Petrology; Gebrüder Borntraeger: Berlin/Stuttgart, Germany, 1998; p. 704. [Google Scholar]
  37. Metwally, Y.M.; Chesnokov, E.M. Clay mineral transformation as a major source for authigenic quartz in thermo-mature gas shale. Appl. Clay Sci. 2012, 55, 138–150. [Google Scholar] [CrossRef]
  38. de Kamp, P.C.V. Smectite-illite-muscovite transformations, quartz dissolution, and silica release in shales. Clays Clay Miner. 2008, 56, 66–81. [Google Scholar] [CrossRef]
  39. Wang, P.F.; Jiang, Z.X.; Chen, L.; Yin, L.S.; Li, Z.; Zhang, C.; Tang, X.L.; Wang, G.Z. Pore structure characterization for the Longmaxi and Niutitang shales in the Upper Yangtze Platform, South China: Evidence from focused ion beam He ion microscopy, nano-computerized tomography and gas adsorption analysis. Mar. Pet. Geol. 2016, 77, 1323–1337. [Google Scholar] [CrossRef]
  40. Loucks, R.G.; Reed, R.M.; Ruppel, S.C.; Hammes, U. Spectrum of pore types and networks in mudrocks and a descriptive classification for matrix-related mudrock pores. AAPG Bull. 2012, 96, 1071–1098. [Google Scholar] [CrossRef] [Green Version]
  41. Jiao, S.; Han, H.; Weng, Q.; Yang, F.; Jiang, D.; Cui, L. Scanning electron microscope analysis of porosity in shale. J. Chin. Electron. Microsc. Soc. 2012, 31, 432–436. [Google Scholar]
  42. Yuan, Y.J.; Rezaee, R.; Yu, H.Y.; Zou, J.; Liu, K.Q.; Zhang, Y.H. Compositional controls on nanopore structure in different shale lithofacies: A comparison with pure clays and isolated kerogens. Fuel 2021, 303, 121079. [Google Scholar] [CrossRef]
  43. Li, T.W.; Jiang, Z.X.; Xu, C.L.; Yuan, Y.; Wang, P.F.; Liu, G.H.; Zhang, B.; Ning, C.X.; Wang, Z. Effect of sedimentary environment on shale lithofacies in the lower third member of the Shahejie Formation, Zhanhua Sag, eastern China. Interpret. J. Subsurf. Charact. 2017, 5, T487–T501. [Google Scholar] [CrossRef]
  44. Li, T.W.; Jiang, Z.X.; Li, Z.; Wang, P.F.; Xu, C.L.; Liu, G.H.; Su, S.Y.; Ning, C.X. Continental shale pore structure characteristics and their controlling factors: A case study from the lower third member of the Shahejie Formation, Zhanhua Sag, Eastern China. J. Nat. Gas Sci. Eng. 2017, 45, 670–692. [Google Scholar] [CrossRef]
  45. Li, K.W. Analytical derivation of Brooks-Corey type capillary pressure models using fractal geometry and evaluation of rock heterogeneity. J. Pet. Sci. Eng. 2010, 73, 20–26. [Google Scholar] [CrossRef]
  46. Zhang, P.F.; Lu, S.F.; Li, J.Q.; Xue, H.T.; Li, W.H.; Zhang, P. Characterization of shale pore system: A case study of Paleogene Xin’gouzui Formation in the Jianghan basin, China. Mar. Pet. Geol. 2017, 79, 321–334. [Google Scholar] [CrossRef]
  47. Daigle, H.; Johnson, A.; Thomas, B. Determining fractal dimension from nuclear magnetic resonance data in rocks with internal magnetic field gradients. Geophysics 2014, 79, D425–D431. [Google Scholar] [CrossRef]
  48. Lai, J.; Wang, G.W.; Fan, Z.Y.; Chen, J.; Wang, S.C.; Zhou, Z.L.; Fan, X.Q. Insight into the Pore Structure of Tight Sandstones Using NMR and HPMI Measurements. Energy Fuels 2016, 30, 10200–10214. [Google Scholar] [CrossRef]
  49. Mandelbrot, B.B.; Mandelbrot, B.B. The Fractal Geometry of Nature; WH Freeman: New York, NY, USA, 1982; Volume 1. [Google Scholar]
  50. Thommes, M.; Kaneko, K.; Neimark, A.V.; Olivier, J.P.; Rodriguez-Reinoso, F.; Rouquerol, J.; Sing, K.S.W. Physisorption of gases, with special reference to the evaluation of surface area and pore size distribution (IUPAC Technical Report). Pure Appl. Chem. 2015, 87, 1051–1069. [Google Scholar] [CrossRef] [Green Version]
  51. Yang, R.; He, S.; Yi, J.Z.; Hu, Q.H. Nano-scale pore structure and fractal dimension of organic-rich Wufeng-Longmaxi shale from Jiaoshiba area, Sichuan Basin: Investigations using FE-SEM, gas adsorption and helium pycnometry. Mar. Pet. Geol. 2016, 70, 27–45. [Google Scholar] [CrossRef]
  52. Jia, A.Q.; Hu, D.F.; He, S.; Guo, X.W.; Hou, Y.G.; Wang, T.; Yang, R. Variations of Pore Structure in Organic-Rich Shales with Different Lithofacies from the Jiangdong Block, Fuling Shale Gas Field, SW China: Insights into Gas Storage and Pore Evolution. Energy Fuels 2020, 34, 12457–12475. [Google Scholar] [CrossRef]
  53. Pfeifer, P.; Obert, M.; Cole, M. Fractal BET and FHH theories of adsorption: A comparative study. Proc. R. Soc. London. A. Math. Phys. Sci. 1989, 423, 169–188. [Google Scholar]
  54. Mendhe, V.A.; Bannerjee, M.; Varma, A.K.; Kamble, A.D.; Mishra, S.; Singh, B.D. Fractal and pore dispositions of coal seams with significance to coalbed methane plays of East Bokaro, Jharkhand, India. J. Nat. Gas Sci. Eng. 2017, 38, 412–433. [Google Scholar] [CrossRef]
  55. Yao, Y.; Liu, D.; Tang, D.; Tang, S.; Huang, W. Fractal characterization of adsorption-pores of coals from North China: An investigation on CH4 adsorption capacity of coals. Int. J. Coal Geol. 2008, 73, 27–42. [Google Scholar] [CrossRef]
  56. Ismail, I.M.; Pfeifer, P. Fractal analysis and surface roughness of nonporous carbon fibers and carbon blacks. Langmuir 1994, 10, 1532–1538. [Google Scholar] [CrossRef]
  57. Pfeifer, P.; Avnir, D. Chemistry in noninteger dimensions between two and three. I. Fractal theory of heterogeneous surfaces. J. Chem. Phys. 1983, 79, 3558–3565. [Google Scholar] [CrossRef]
  58. Li, X.; Xue, H.; Chen, L.; Shen, Z.; Xu, M.; Xu, S. Micropore structure of outburst coal seam in Guizhou Area and its effect on gas flow. Coal Sci. Technol. 2020, 48, 67–74. [Google Scholar]
  59. Sing, K.S. Reporting physisorption data for gas/solid systems with special reference to the determination of surface area and porosity (Recommendations 1984). Pure Appl. Chem. 1985, 57, 603–619. [Google Scholar] [CrossRef]
  60. Budaeva, A.D.; Zoltoev, E.V. Porous structure and sorption properties of nitrogen-containing activated carbon. Fuel 2010, 89, 2623–2627. [Google Scholar] [CrossRef]
  61. Pyun, S.I.; Rhee, C.K. An investigation of fractal characteristics of mesoporous carbon electrodes with various pore structures. Electrochim. Acta 2004, 49, 4171–4180. [Google Scholar] [CrossRef]
  62. Song, Y.; Jiang, B.; Li, F.; Yan, G.; Yao, Y. Applicability of Fractal Models and Nanopores’fractal Characteristics for Low-Middle Rank Tectonic Deformed Coals. Earth Sci. 2018, 43, 1611–1622. [Google Scholar]
  63. Chang, J.Q.; Fan, X.D.; Jiang, Z.X.; Wang, X.M.; Chen, L.; Li, J.T.; Zhu, L.; Wan, C.X.; Chen, Z.X. Differential impact of clay minerals and organic matter on pore structure and its fractal characteristics of marine and continental shales in China. Appl. Clay Sci. 2022, 216, 106334. [Google Scholar] [CrossRef]
  64. Curtis, M.E.; Cardott, B.J.; Sondergeld, C.H.; Rai, C.S. Development of organic porosity in the Woodford Shale with increasing thermal maturity. Int. J. Coal Geol. 2012, 103, 26–31. [Google Scholar] [CrossRef]
Figure 1. (a) Location of the Subei Basin and (b) map of the study area in the Gaoyou Sag.
Minerals 13 00359 g001
Figure 2. Comprehensive stratigraphic column of the Gaoyou Sag.
Minerals 13 00359 g002
Figure 3. SEM images showing the characteristics of pores in the Funing Formation. (a) Intragranular pores, F10; (b) intergranular pores between pyrite, F1; (c) organic pores, F5; (d) clay mineral pores, F16.
Minerals 13 00359 g003
Figure 4. N2 adsorption–desorption curve of Funing Formation shale: (a) MS lithofacies; (b) SS lithofacies; (c) CS lithofacies.
Minerals 13 00359 g004
Figure 5. MIP of the Funing Formation shale samples. MWE: mercury withdrawal efficiency. (a) MS lithofacies; (b) SS lithofacies; (c) CS lithofacies.
Minerals 13 00359 g005
Figure 6. Pore volume and surface area distribution of the Funing Formation shale samples: (a) PV of distribution of the MS lithofacies; (b) SSA of distribution of the MS lithofacies; (c) PV of distribution of the SS lithofacies; (d) SSA of distribution of the SS lithofacies; (e) PV of distribution of the CS lithofacies; (f) SSA of distribution of the CS lithofacies.
Minerals 13 00359 g006
Figure 7. Slopes of ln(V) and ln(ln(P0/P)) from the FHH model of N2 adsorption: (a) MS lithofacies; (b) SS lithofacies; (c) CS lithofacies.
Minerals 13 00359 g007
Figure 8. Fractal dimension curves calculated based on MIP data: (a) MS lithofacies; (b) SS lithofacies; (c) CS lithofacies.
Minerals 13 00359 g008
Figure 9. Relationship between fractal dimension and pore structure parameters: (a) relationship between fractal dimension and PV; (b) relationship between fractal dimension and SSA; (c) relationship between fractal dimension and AVE PD; (d) relationship between fractal dimension and MWE.
Minerals 13 00359 g009
Figure 10. Relationship between different pore structure parameters: (a) relationship between PV and AVE PD; (b) relationship between SSA and AVE PD; (c) relationship between MWE and AVE PD; (d) relationship between PV and MWE.
Minerals 13 00359 g010aMinerals 13 00359 g010b
Figure 11. Impact of TOC on fractal dimension (a)and pore structure parameters (bd).
Minerals 13 00359 g011
Figure 12. Distribution of mean values of pore structure parameters for different lithofacies: (a) mean values of PV and SSA for different lithofacies; (b) mean values of MWE and AVE PD for different lithofacies.
Minerals 13 00359 g012
Figure 13. Fractal dimension distribution of different shale lithofacies.
Minerals 13 00359 g013
Table 1. TOC contents and mineral compositions of all samples.
Sample IDDepth (m)LithofaciesFeldspar (wt.%)Quartz (wt.%)Calcite
(wt.%)
Dolomite (wt.%)Clay (wt.%)TOC (wt.%)Ro
(%)
F13469.55MS13.6629.0429.640.8525.353.020.79
F23474.05MS13.4629.9632.720.3021.122.840.82
F33474.91MS12.8927.4034.990.6120.422.230.81
F43588.30MS9.8120.8410.6933.2220.231.120.84
F53591.23SS16.0234.048.7811.1723.370.930.83
F63591.51SS22.6927.748.9011.8223.490.900.84
F73657.20MS11.3224.0517.3018.8722.820.690.85
F83659.47MS10.7032.0811.5716.4922.780.520.84
F93663.20MS14.5330.884.5025.7121.821.850.86
F103666.00CS11.4924.4341.4913.256.081.400.86
F113667.00MS9.4125.4412.1724.7222.160.340.88
F123676.81SS16.1034.213.013.5339.431.790.87
F133679.10SS18.6231.7018.870.6724.841.950.90
F143679.60MS10.1521.570.0639.3425.131.230.86
F153680.35CS9.5320.250.5049.6017.560.890.89
F163684.92SS16.8835.8714.324.3024.131.860.91
F173687.20MS13.1327.916.7114.6331.511.250.88
Table 2. Pore structure parameters of different lithofacies.
LithofaciesSample IDPore Volume (cm3/g)Specific Surface Area (m2/g)MWE (%)
TotalD < 50 nmD > 50 nmTotalD < 50 nmD > 50 nm
MSF10.00760.00690.00070.64540.64450.000972.57
F20.00530.00480.00050.38330.38270.000771.78
F30.00560.00520.00040.68000.67990.000274.16
F40.01300.01210.00093.64293.64120.001743.97
F70.00780.00740.00051.86511.86480.000321.58
F80.01190.01130.00073.21593.21550.000448.34
F90.00660.00630.00020.91280.91260.000221.18
F110.01180.01070.00113.04953.04820.001328.96
F140.00550.00530.00011.04451.04430.000258.69
F170.01190.01120.00062.83092.83040.000518.12
Mean0.00870.00810.00061.82701.82640.000645.94
SSF50.01120.01040.00073.18883.18790.000841.23
F60.00860.00750.00111.88361.88220.001427.87
F120.00870.00490.00380.87410.86710.007024.11
F130.01100.00950.00152.39512.39350.001769.18
F160.00910.00770.00141.66411.66180.002377.15
Mean0.00970.00800.00172.00121.99850.002747.91
CSF100.01040.01010.00032.85402.85380.000211.80
F150.00930.00720.00212.24672.24540.001339.73
Mean0.00990.00870.00122.55042.54960.000825.76
Table 3. Fractal dimensions obtained from N2 adsorption and MIP.
LithofaciesSample IDD1D2Dc1Dc2D3
MSF12.49772.60532.81962.99492.9370
F22.52202.59522.84372.99302.9346
F32.51552.69712.55622.99512.7634
F42.55842.85132.84202.99552.9706
F72.51672.78312.65192.99852.9423
F82.54832.83352.78112.99842.9406
F92.49482.69112.70822.99762.9721
F112.53992.83942.85702.99602.9563
F142.52962.73112.50312.99442.8741
F172.56812.82302.80482.99742.9325
Mean2.52912.74502.73682.99612.9224
SSF52.56492.83642.89772.99572.9858
F62.55192.79822.75352.99102.9390
F122.51292.73742.91582.97412.9576
F132.51822.81462.55502.97332.7697
F162.49552.77022.80232.97772.9240
Mean2.52872.79132.78492.98772.9152
CSF102.54122.82922.70962.99802.9750
F152.54672.80642.76232.99512.8560
Mean2.54392.81782.73592.99652.9155
Disclaimer/Publisher’s Note: The statements, opinions and data contained in all publications are solely those of the individual author(s) and contributor(s) and not of MDPI and/or the editor(s). MDPI and/or the editor(s) disclaim responsibility for any injury to people or property resulting from any ideas, methods, instructions or products referred to in the content.

