Article

Uranium(VI) Sorption onto Hardened Cement Paste under High Saline and Alkaline Conditions

Université Paris-Saclay, CEA, Service de Physico-Chimie, 91191 Gif-sur-Yvette, France
*
Author to whom correspondence should be addressed.
Minerals 2023, 13(3), 325; https://doi.org/10.3390/min13030325
Submission received: 8 September 2022 / Revised: 22 February 2023 / Accepted: 23 February 2023 / Published: 25 February 2023

Abstract

:
Evaluation of the mobility behaviour of radionuclides under highly saline and alkaline conditions is a major concern for the performance assessment of radioactive waste disposal. The aim of this study was to determine the effect of up to 2.8 mol/kgsolution content of NaNO3, on the solubility and the retention of U(VI) at 22 °C onto a hardened cement paste (HCP) prepared from ordinary Portland cement (CEM I). To avoid the interference of the high salt concentration and ionic strength, and because of the expected low solubility of uranium under such alkaline conditions, time-resolved laser fluorescence spectroscopy (TRLFS) was selected to accurately measure U(VI) concentration in solution using the standard addition method in 85% H3PO4. This allows both limiting the dilution and matrix effects and determining the resulting [U(VI)] in solution with acceptable precision for the distribution factor (Rd) in both sorption and desorption experiments. The operational solubility limit measured at high ionic strength lowered by a factor of three compared to the reference cementitious condition, and its Rd values decreased by a factor ca. four. The sorption of U(VI) appears to be reversible under these conditions.

1. Introduction

In the framework of radioactive waste disposal, the French national agency for radioactive waste management (Andra, https://international.andra.fr/, accessed on 8 September 2022) managed a scientific partnership between several laboratory groups called CTEC (French acronym for “Comportement des Toxiques chimiques en Environnement Complexe”), which is dedicated to evaluating the behaviour of radionuclides (RN) and toxic species in complex environments, particularly in highly saline and alkaline conditions. Some intermediate-level long-lived (ILW-LL) wastes from reprocessing of nuclear fuels may contain high levels of soluble salts, which are mainly composed of sodium nitrate (NaNO3) and sodium sulphate (Na2SO4) [1]. Such waste could be stabilized in cementitious matrices as concrete, mortars, or grouts. Therefore, after water ingress, an alkaline and saline plume would induce changes in RN speciation and mobility.
In alkaline media and at ionic strengths up to 250 mM, the solubility limit of U(VI) is expected to be low (i.e., less than 10−7 M, as reported by Ochs et al. [2]) and to depend on the considering solubility limiting phase. Calcium uranate (CaUO4(cr)), calcium diuranate (CaU2O7:3H2O(cr)), sodium diuranate (Na2U2O7), and uranophane (Ca(UO2)2(SiO3OH)2:5H2O) are U(VI)-containing solid phases that are relevant to control the solubility limit of uranium for ionic strengths up to 4 mol/kgwater (see, e.g., [3,4,5,6]). Recent data [7,8,9] concerning the U(VI) solubility-limiting phase in high saline media containing NaCl up to 5.6 mol/kgwater and/or KCl up to 4.58 mol/kgwater also evidenced UO3:2H2O(cr), K2U6O19:11H2O, K2U2O7:1.5H2O, and Na2U2O7:H2O as being part of this group.
The mobility of U(VI) in such media is significantly delayed. Felipe-Sotelo et al. [10] observed a resulting U penetration profile of 40 µm in a cement cylinder after a three-year diffusion test. This can be explained by the very high sorption capability of cement-based materials, for which distribution ratio (Rd) values ranging from 103 and 106 L/kg were reported by Ochs et al. [2].
In parallel, significant changes were observed at high ionic strengths in the mineralogical assembly and chemical equilibria of the cement matrix. Numerous data exist in the literature to describe the evolution of the mineralogical assembly of cement-based materials under highly saline conditions (see, e.g., [11,12,13,14]). Johnston and Grove [11] observed that the solubility of portlandite (Ca(OH)2) in cement assembly was increasing by a factor of 1.35–2.8 compared to its solubility in pure water, independently of the salt used to fix the ionic strength, including sodium chloride, potassium chloride, lithium chloride, cesium chloride, and sodium nitrate, but not calcium chloride. To characterize the effect of high concentrations of NaNO3 on the stability of CSH gels, some leaching experiments using a 0.6 M NH4Cl solution were performed by Zheng et al. [14]. The hardened cement paste (HCP) sample was prepared with NaNO3 (up to 500 g/L, i.e., 7.36 mol/kgwater) and cured 3 days before the leaching process. One of the main results based on the cumulative leached rate of Ca and solid characterization led the authors to conclude that with leaching, both decalcification of the solid and silica gel polymerization occur. These phenomena will induce a modification of Ca concentration and pH in solution as well as a modification of the structure of one of the main cementitious phase candidates for U(VI) sorption.
The presence of a high ionic strength solution in contact with cement materials leads de facto to an impact on U solubility and mobility. For ionic strengths higher than 4 mol/kgwater, thermodynamic calculations can be performed using databases developed in the framework of the Pitzer model for activity coefficient correction [15]. Such data have been improved [16,17] but remain incomplete, especially to describe all cementitious phases, particularly uranium phases, under high NaNO3 ionic strengths.
The aim of this study was to determine the effect of high content levels of NaNO3, specifically up to 2.8 mol/kgsolution, on the sorption of U(VI) in a hardened cement paste (HCP). Because of the high ionic strength, its associated matrix effect, and the expected low solubility of uranium in such alkaline conditions, the selected analytical method to measure accurate U(VI) concentration in solution was the time-resolved laser fluorescence (TRLFS) technique using the standard addition method. This technique has proven particularly useful for speciation characterization of specific luminescent species in solution, such as U(VI) [18], Cm(III) [19], or Eu(III) [20]. It can be used for quantitative determination as well [21,22,23,24,25,26] by using the standard addition method to limit the dilution factor and matrix effects.

2. Materials and Methods

2.1. Inductively Coupled Plasma Mass Spectrometry

Uranium concentration was determined by inductively coupled plasma mass spectrometry (ICP-MS, 810-MS, Agilent, Santa Clara, CA, USA). To this aim, the cementitious supernatant samples were diluted in 2% HNO3 solution (using HNO3 65%, suprapur, Aldrich CAS-7697-37-2) with a minimum dilution factor of 3000 in order to decrease the pH value and to minimize sodium content in the matrix. The external calibration curve was measured using U(VI)-diluted solutions in the range of 10−11 mol/kgsolution and 2 × 10⁻⁹ mol/kgsolution prepared from uranium standard solution, specifically (1003 ± 4) mg/kgsolution in 4% HNO3 solution (plasmaCal, SCP science). A spike of a standard solution containing Tl ((998 ± 3) mg/kgsolution in 4% HNO3 solution, plasmaCal, SPC science) to reach 10−10 mol/kgsolution was used to check the stability of the signal intensity.

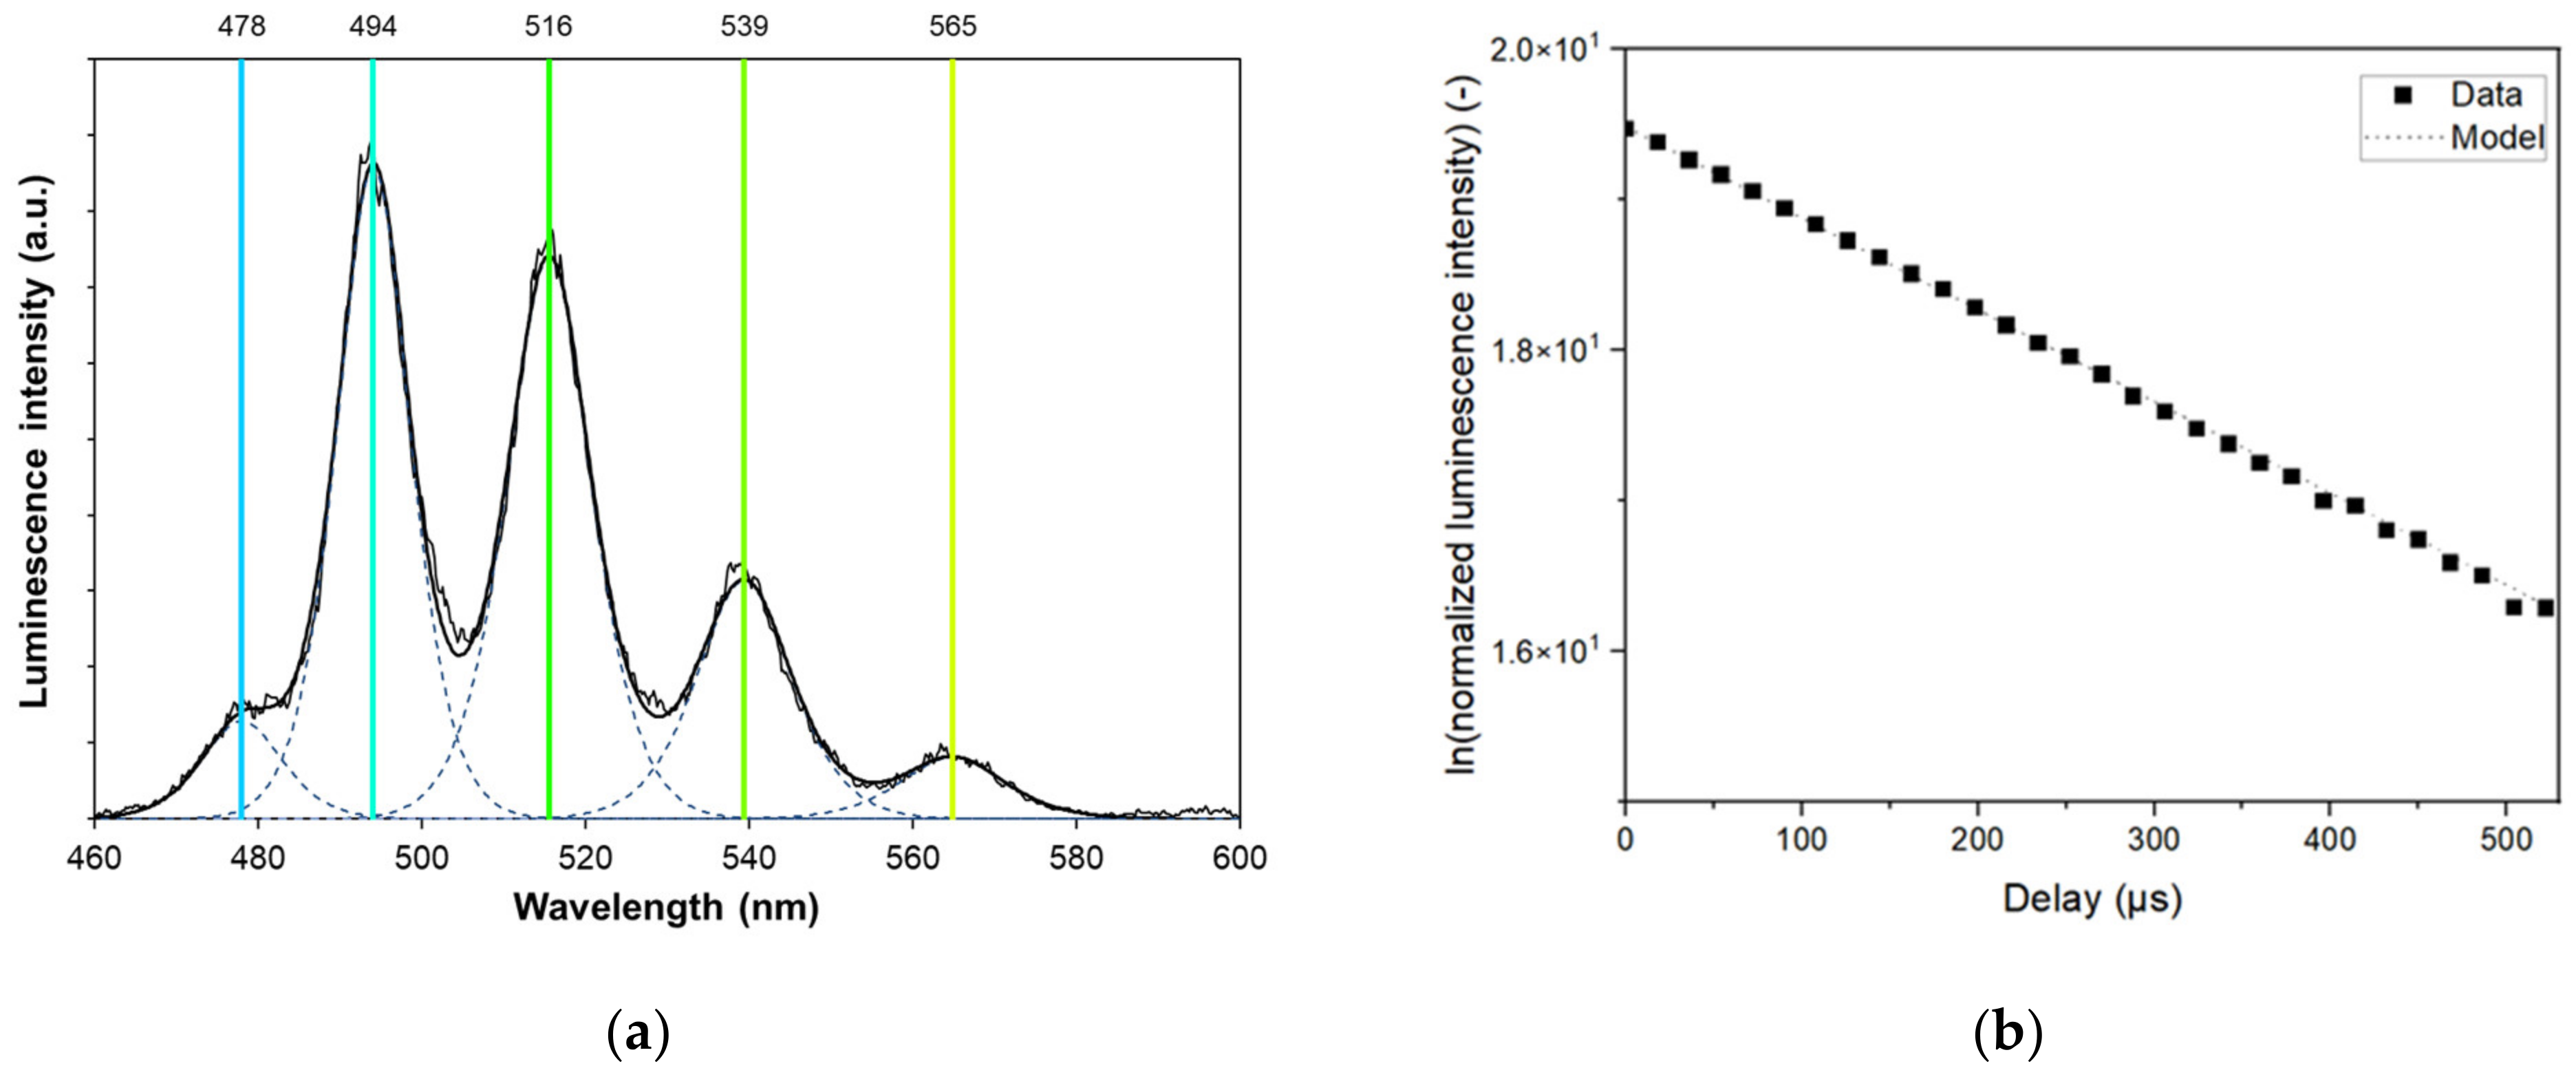
2.2. Time-Resolved Laser Fluorescence Spectroscopy

In some instances, the NaNO3 concentration was too high to perform ICP-MS analyses, and the concentration of U(VI) in solution was then determined by using the time-resolved laser fluorescence spectroscopy (TRLFS) technique using the method of standard addition at 22 °C. The principles and TRLFS set-up used in this study has already been fully described elsewhere [21,22,23,24,25,26,27,28,29,30]. Taking advantage of the time-resolution and the luminescence properties of U(VI) species in phosphoric media [21,23], the luminescence spectra were obtained at λexc = 300 nm at a delay of D = 2 µs after the laser flash and during a gate width W = 1 ms, thereby accumulating 1000 spectra. The decomposition of the spectra was done using the Solver from Microsoft Excel, as already explained elsewhere [27], and the fitting uncertainties and correlation matrices were calculated using the SolverAid macro [31]. For this study, and prior to the TRLFS characterization, an aliquot of 2 mL of the U(VI)-containing cementitious solutions was acidified with a spike of 120 µL of orthophosphoric acid (H3PO4, 85%, Merck CAS-N° 7664-38-2). Thus, the resulting pH was ca. 2. For an initial U(VI) concentration of 5 × 10⁻⁶ mol/L in 0.8 mol/kgw H3PO4, the following speciation was expected using the PHREEQC software and Thermochimie database, including the ion interaction theory (SIT) for activity coefficient correction [32] (https://www.thermochimie-tdb.com/pages/view.php, accessed on 8 September 2022): 80% of UO2(H2PO4)2, 11% of UO2(H2PO4)(H3PO4)+, and 9% UO2(H2PO4)+. Figure 1 shows the TRLFS results obtained for such a solution. The luminescence spectrum shows the typical fingerprint of uranyl species in phosphoric acidic conditions. The first main band at 494 nm corresponds to the wavelength used by Moulin et al. [23]. The lifetime decay evolution can be fitted with a mono-exponential curve, and a lifetime τ = (164 ± 1) µs can be calculated from these data. This result suggests that only one species was observed, and the de-excitation processes of all other theoretical species are faster than what can be observed. There was also a marked quenching effect of NaNO3 compared to the 200 µs lifetime otherwise observed [23].

2.3. Cement-Based Materials Preparation and Characterization

Cement-based materials were prepared using CEM I cement (CEM I 52.5N CE PM-ES-CP2 NF– Lafarge, Val d’Azergues, France). Cement paste samples were prepared with a water-to-cement mass ratio (w/c) of 0.43. Ultrapure water (Merck Millipore Milli-Q, with a resistivity at 25 °C of 18.2 MΩ·cm) was used in this study. The cement samples were poured into closed cylindrical polyethylene plastic moulds (125 cm3) and initially cured in a 100% relative humidity chamber for 28 days. After the curing period, HCP samples were crushed and sieved (fraction < 250 µm).
The artificial cement porewater (S1-0-NaNO3) was an alkaline solution, and it was used to equilibrate HCP samples during additional cure and sorption experiments with no NaNO3 content. The S1-0-NaNO3 solution was a portlandite-saturated solution at ambient temperature with 65 × 10−3 mol/kgsolution of NaOH and 140 × 10−3 mol/kgsolution of KOH.
The pH value (13.3 ± 0.1) of the S1-0-NaNO3 solution was determined using a PHM250 pHmeter (Radiometer Analytical) with a temperature probe and a combined pH glass electrode (Ag/AgCl, with KCl 3 mol/kgsolution as electrolyte, Metrohm). Calibration was carried out using 3 Certipur buffer solutions (Merck) with theoretical pH values at 22 °C of 7.01 (KH2PO4/Na2HPO4 ca. 0.020/0.0275 mol/kgsolution), 9.21 (Na2B4O7, 0.01 mol/kgsolution), and 12.09 (Na2HPO4 NaOH in water). An alkaline solution (0.1 mol/kgsolution NaOH) with a pH of 13.0 was used to check the linearity of the calibration above pH = 12.09. The pH measurements were made with an uncertainty calculated at 2σ, or 0.1 pH unit. The chemicals used for the preparation of this solution were NaOH (Sigma-Aldrich, CAS-N°: 1310-73-2), KOH (Emsure, Merck, CAS-N°: 1310-58-3), and CaO (Sigma-Aldrich, CAS-N°: 1305-78-8).
The S1-0-NaNO3 solution was filtered (Nylon, 0.45 µm, Nalgene) to remove the excess portlandite and prepare its use for sorption experiments before the addition of NaNO3. The appropriate amount of NaNO3 salt (AnalR Normapur, VWR, CAS-N°: 7631-99-4) was then added to the filtered S1-0-NaNO3 to reach 1.4 moles of NaNO3 per kilogram of S1-0-NaNO3 solution and 2.8 moles of NaNO3 per kilogram of S1-0-NaNO3 solution; the resulting solutions were labelled S1-1.4-NaNO3 and S1-2.8-NaNO3, respectively. The density of each resulting solution was determined at 22 °C using an electronic pycnometer (Mettler Toledo, densito-30PX) at 1.0077, 1.0823, and 1.1541 g/cm3 for S1-0-NaNO3, S1-1.4-NaNO3, and S1-2.8-NaNO3, respectively.
After filtration, the concentration of major cations was determined by using ionic chromatography (IC, Metrohm, C3 column, HNO3 5 × 10⁻³ mol/kgsolution as eluent solution). For the S1-0-NaNO3 solution, a value of (6 ± 1) 10−3 mol/kgsolution was obtained for Ca2+, (65 ± 2) × 10−3 mol/kgsolution for Na+, and (140 ± 2) × 10−3 mol/kgsolution for K+. For the other solutions, due to their high NaNO3 content, calcium concentration was not possible to be measured accurately using the IC technique.
After this initial period of cure, the crushed HCP samples were maintained in the S1-x-NaNO3 (x = 0, 1.4, and 2.8) solutions for 6 months to achieve better hydration and reactions with NaNO3 with a liquid/solid ratio of (27 ± 1) kgsolution/kgsolid. Solids were isolated by removing the supernatant after ultracentrifugation (Beckman 50,000 g, 1 h), and they were dried overnight in a desiccator flushed with Ar. Solid samples were then characterized by using X-ray diffractometry (XRD, XRG 3000, INEL Instrumentation Electronique, Artenay, France) using a Co anode as the X-ray source (λCo = 1.7903 Å). Diffractograms were then analysed using the “Match!” (Phase identification from powder diffraction, Crystal impact, version 3) and the Crystallography Open Database (COD, http://www.crystallography.net/cod/, accessed on 8 September 2022).
Cementitious solid and liquid sample storage, preparation, and U solubility as well as sorption/desorption experiments were performed under a N2 atmosphere in a glove box to avoid carbonation (PCO2 < 1 ppm, CO2 gas analyser 410i model, MEGATEC, Saint-Aubin, France).

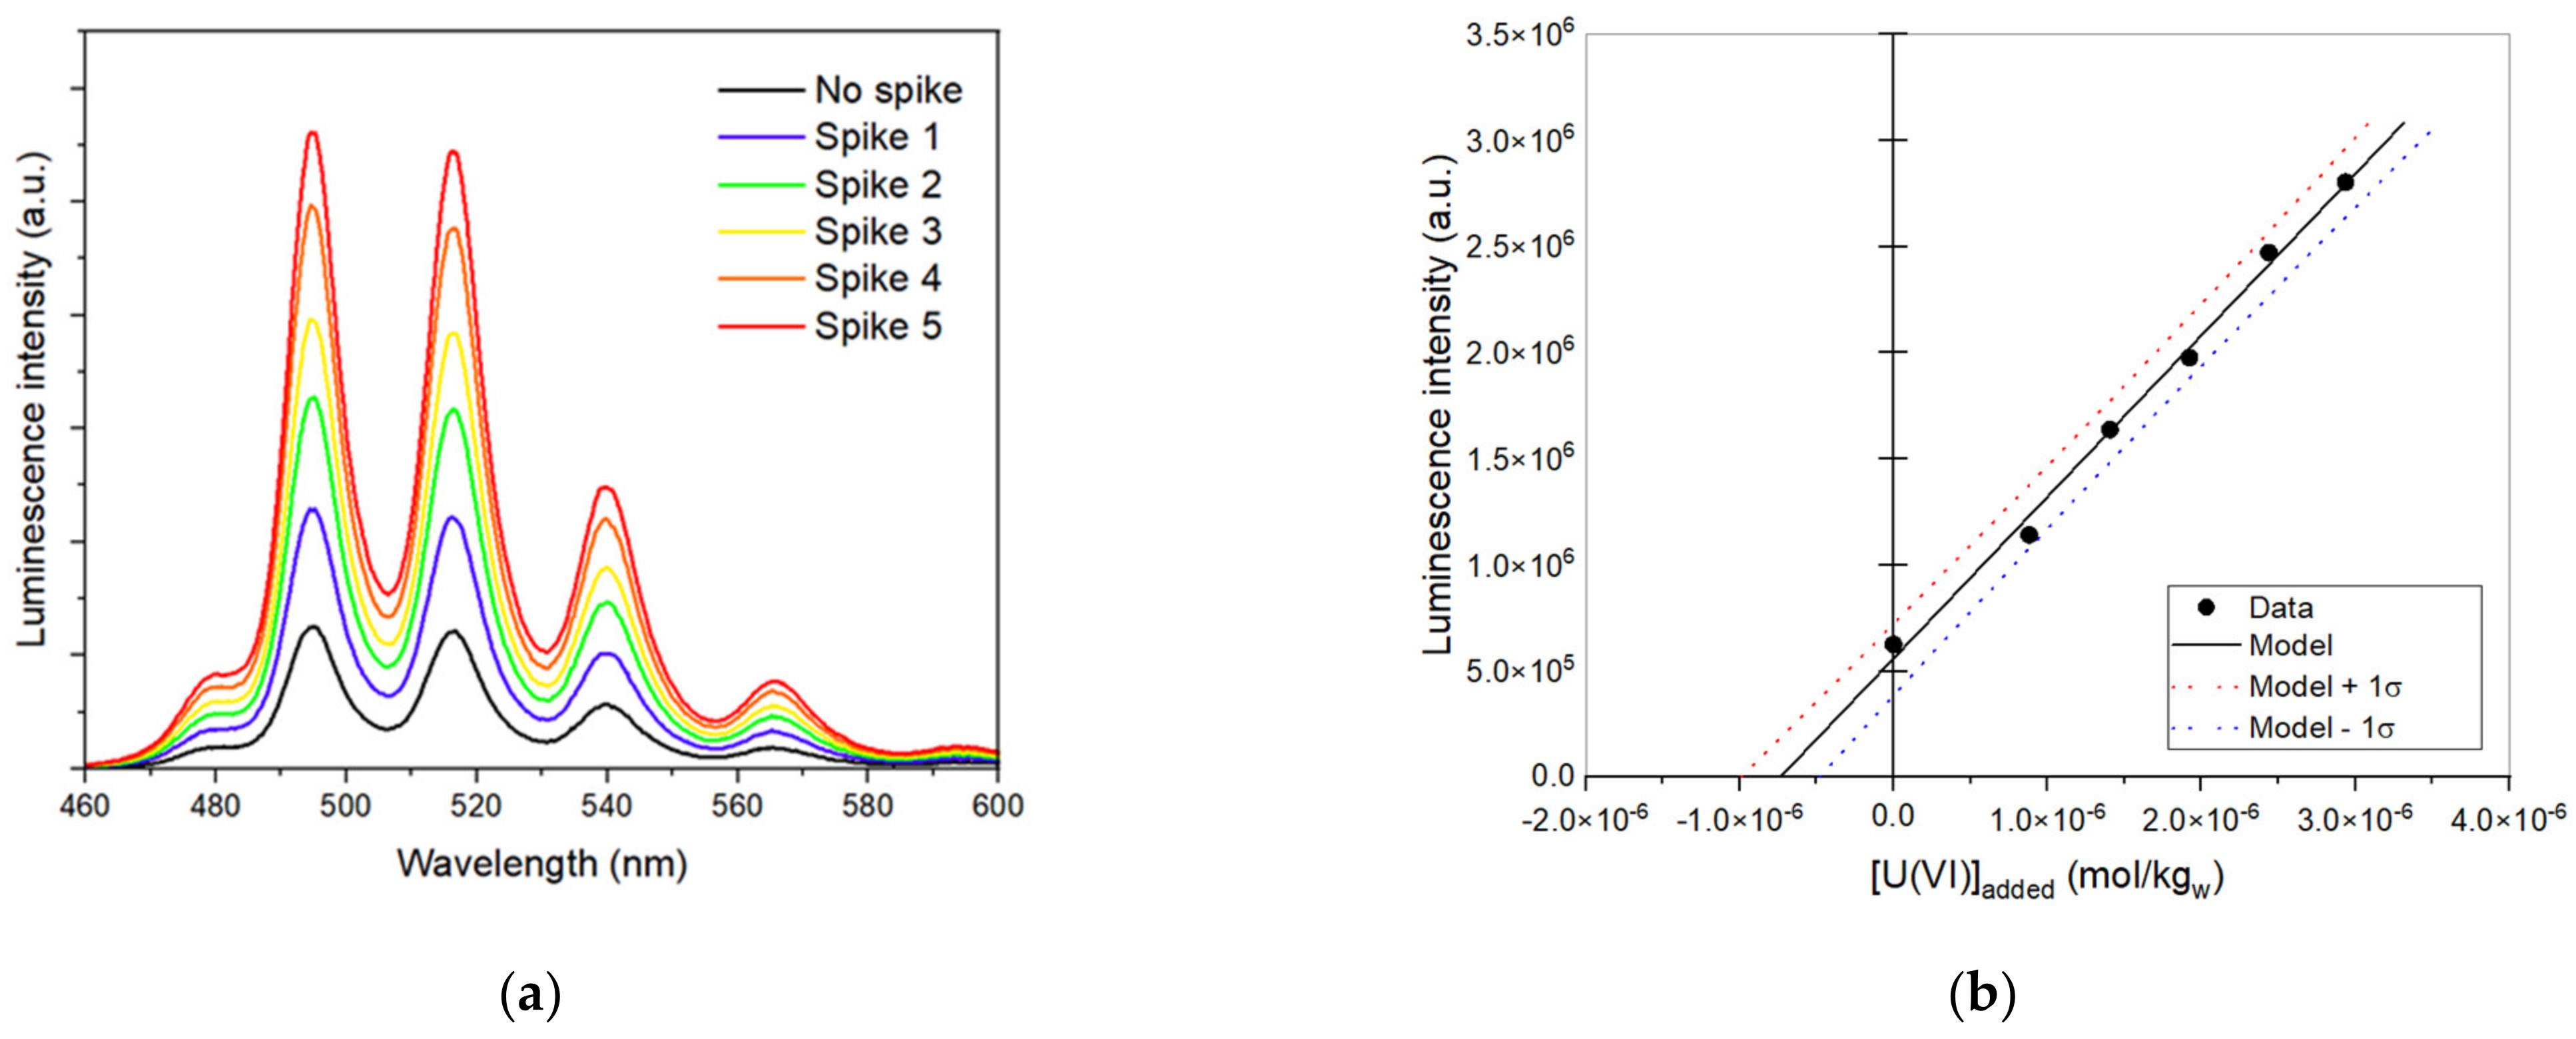
2.4. U(VI) Operational Solubility Determination

For each investigated NaNO3-containing-cementitious solution, the operational solubility of U(VI) was investigated at 22 °C. A spike of the U(VI) standard solution was added to 25 mL of the cementitious solution to reach approximatively 2 × 10⁻⁴ mol/kgsolution as the initial concentration. After 24 h, a yellow-orange precipitate was observed in each solution. After 4 h, 48 h, and 7 months of contact time, the samples were ultracentrifuged (50,000× g, 1 h, Beckman) in order to isolate the yellow precipitate from the supernatant. HNO3 2% was added to acidify and dilute the two first samplings, and then the U(VI) concentration was measured by using ICP-MS. A spike of H3PO4 85% solution was added to the last sample, and the U(VI) concentration was determined by using TRLFS coupled with the standard addition method for all investigated NaNO3-containing-cementitious solutions.

2.5. Batch Sorption Determination

In order to evaluate the effect of NaNO3 on U(VI) affinity for HCP, batch sorption experiments were performed on dispersed materials at 22 °C. All batch sorption experiments were carried out in polysulphone polymer (PSF) centrifuge tubes (Nalgene) with polypropylene screw closures. Batch sorption experiments were carried out using a diluted U(VI) standard solution. The solution-to-solid ratios for each HCP suspension and the U(VI) initial concentrations are given in Table 1.
Figure 2a corresponds to the luminescence spectra obtained for the U(VI) blank solution in the S1-0-NaNO3 solution in 0.8 mol/kgw H3PO4 as a function of the U(VI) standard addition. The series “no spike” corresponds to the spectrum of the solution with the unknown concentration of U(VI). The series “spike x” (where x = 1 to 5) correspond to the spectra obtained after each addition of the U(VI) standard solution, which ranged from ca. 1.0 × 10⁻⁶ to 3.0 × 10⁻⁶ mol/kgw. Figure 2b corresponds to the evolution of the intensity obtained for the fluorescence peak at 495 nm as a function of the concentration of U(VI) obtained from the standard addition. Data treatment led to obtaining a U(VI) concentration of (8.1 ± 1.3) × 10−7 mol/kgsolution, which is consistent with the calculated initial concentration of 9.2 × 10⁻⁷ mol/kgsolution for this sample (see Table 1). For each initial U(VI) concentration and NaNO3 content, a similar experimental determination with TRLFS was performed (spectra not shown).
Experimental results are expressed as distribution ratio (Rd) in kgsolution/kgsolid, which corresponds to the distribution of U(VI) between its concentration in the solid ([U(VI)]solid) and the one in solution ([U(VI)]solution) as defined in Equation (1):
R d = [ U ( VI ) ] solid [ U ( VI ) ] solution = ( [ U ( VI ) ] ini [ U ( VI ) ] solution ) [ U ( VI ) ] solution × V m
where [U(VI)]ini (mol/kgsolution) is the introduced concentration; V (kgsolution) is the quantity of solution, and m (kgsolid) is the calculated dry mass of solid. [U(VI)]ini (mol/kgsolution) was determined either with ICP-MS or TRLFS measurements from a “blank sample”, which was similarly prepared without cementitious materials. [U(VI)]solution (mol/kgsolution) is the concentration of U(VI) in the supernatant measured after 1, 8, and 15 days, and after 1 month of contact time with ICP-MS and TRLFS.
After the last sampling, the suspensions were ultracentrifuged (at 50,000 g for 1 h, Beckmann) before completely removing the supernatant. To quantify desorption, the supernatant was replaced by the equivalent volume of cementitious solution containing the same amount of NaNO3. The value of the Rd after desorption was then calculated (as in Equation (1)), where [U(VI)]ini (mol/kgsolution) was calculated from the sorption result and corresponded to the U(VI) species present in the solid by sorption, and [U(VI)]solution (mol/kgsolution) was the concentration of U(VI) in the supernatant measured by using TRLFS after 1 month of contact time.

3. Results

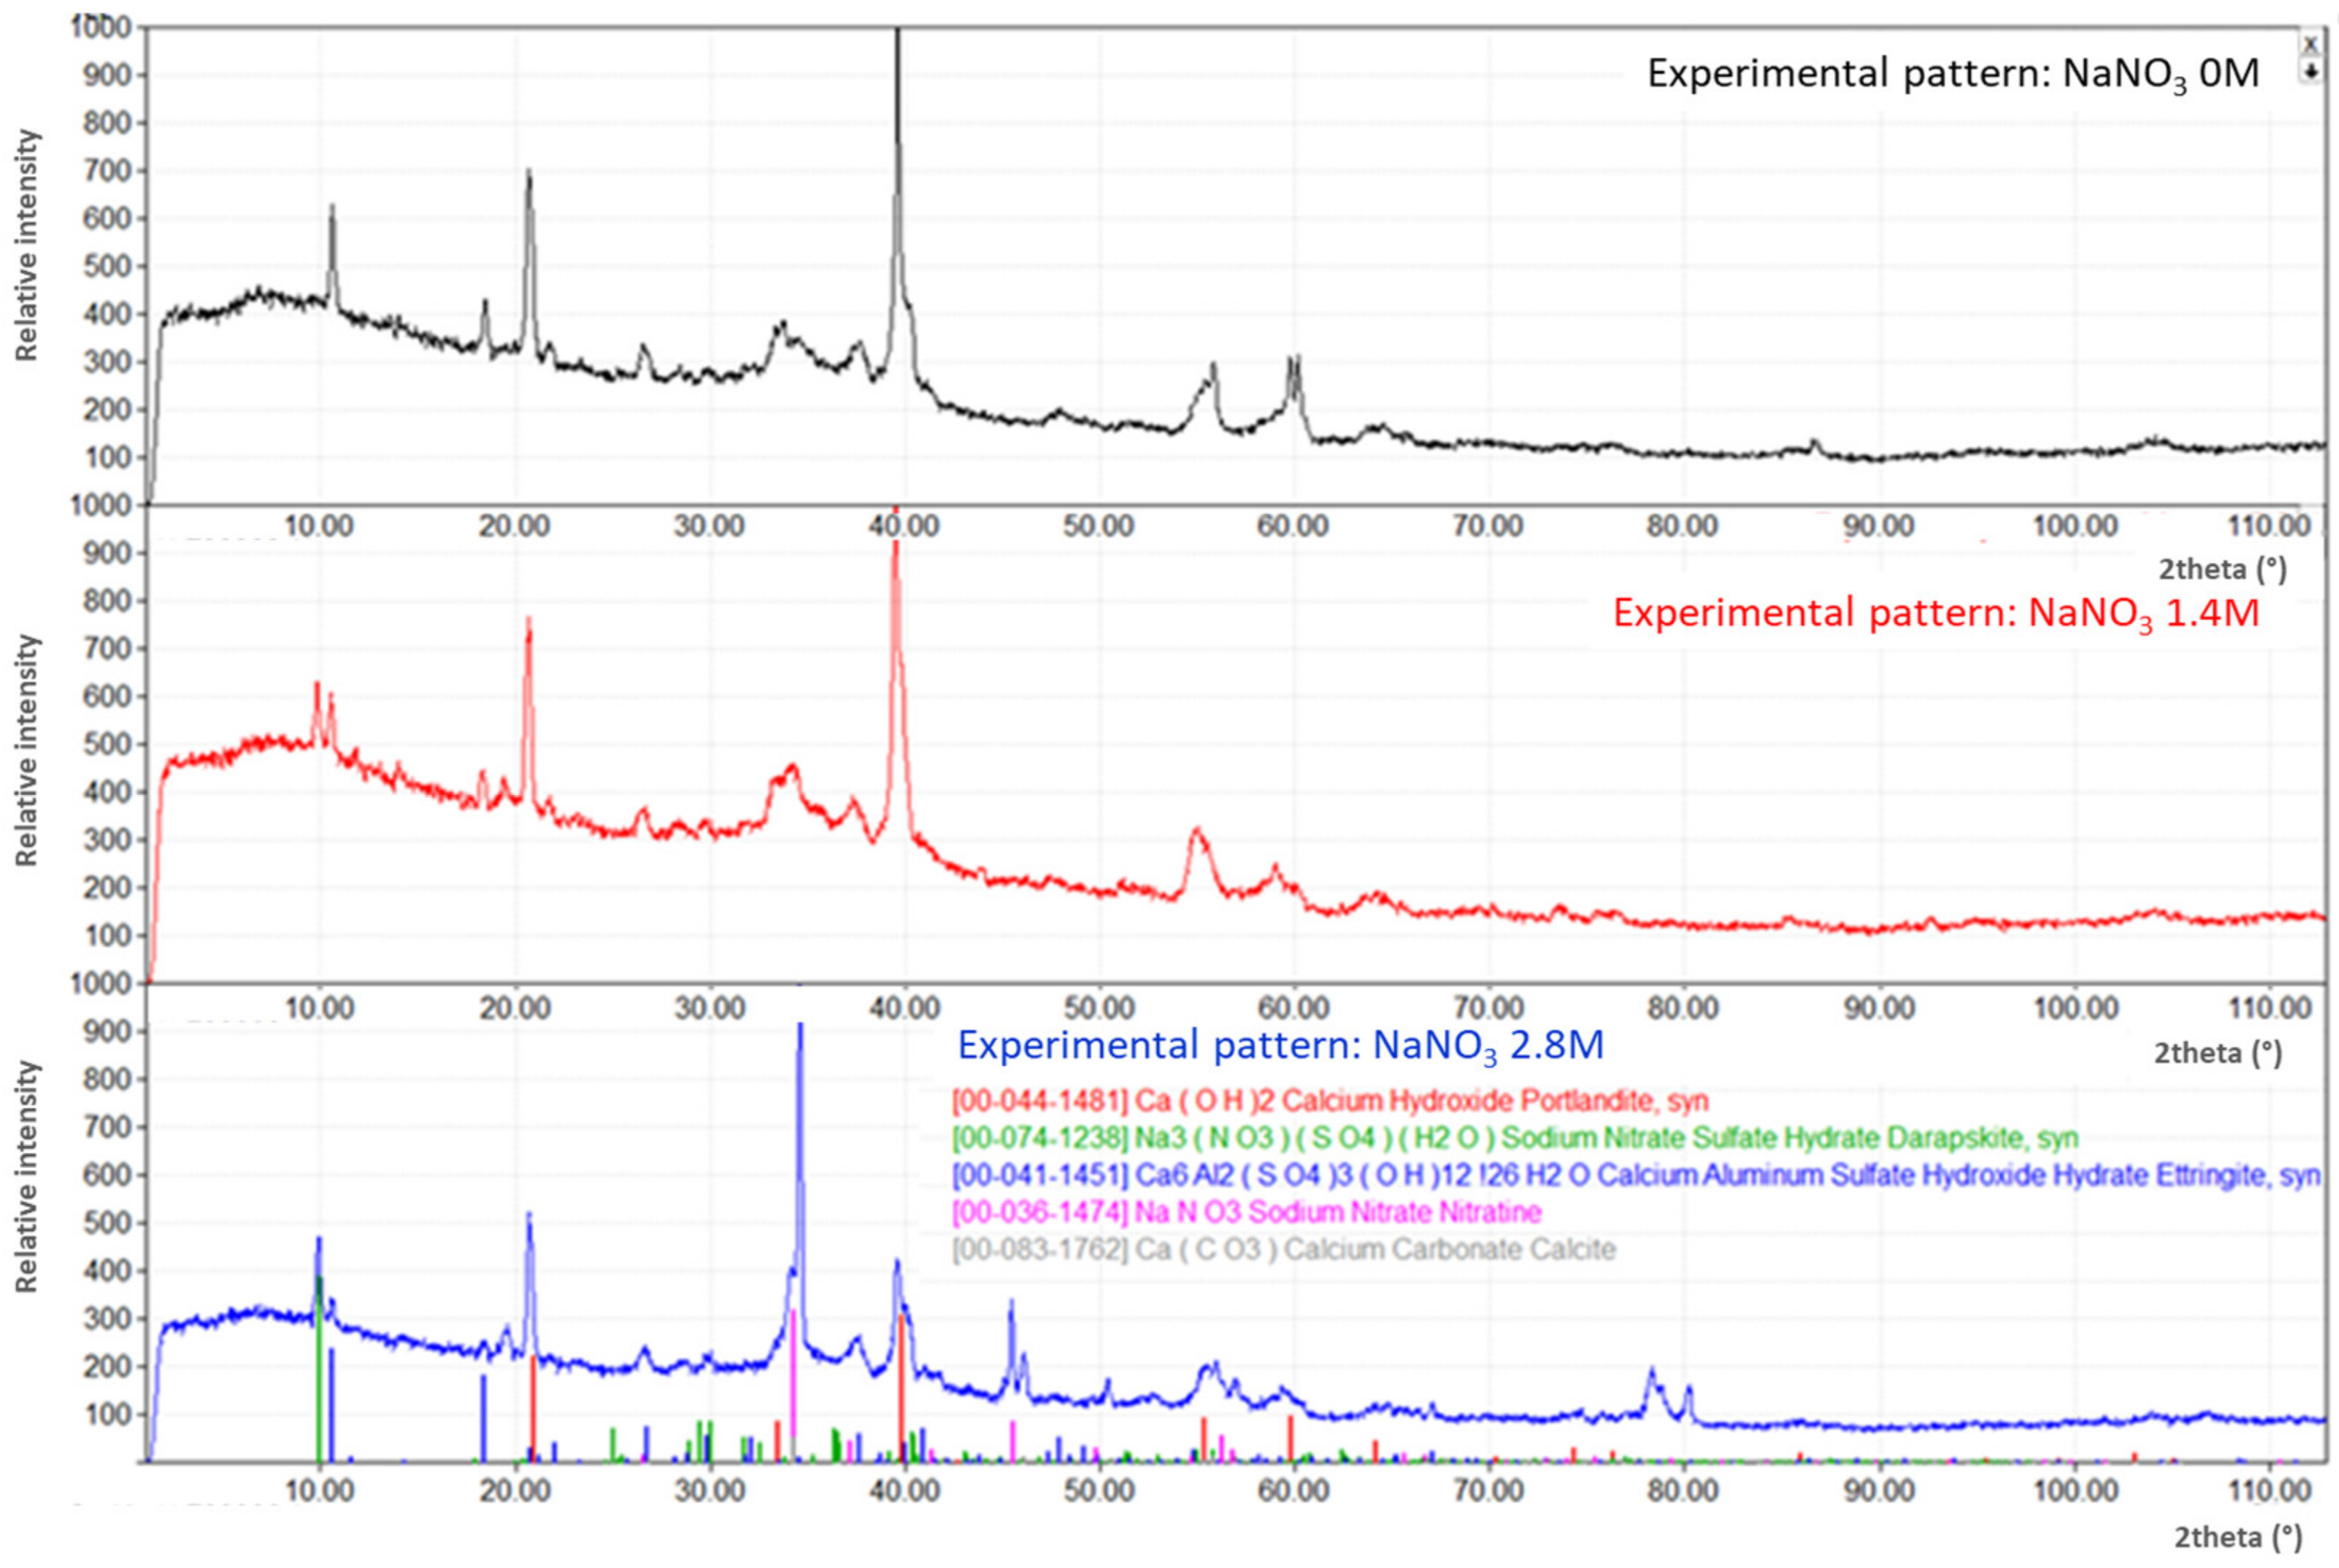
3.1. Evolution of the Cementitious-Phase Assembly as a Function of NaNO3 Content

Figure 3 shows the evolution of the cementitious-phase assembly as a function of NaNO3 content after 6 months of contact time. The experimental pattern of the sample containing no NaNO3 (series labelled “NaNO3 0 M” in Figure 3) corresponded to a typical CEM I HCP assembly containing ettringite (Ca6Al2(SO4)3(OH)12(H2O)26, COD ref (00-041-1451)), portlandite (COD ref (00-044-1481)), and some amorphous phases supposed to correspond to calcium silicate hydrate phases (CSH) in the 2θ regions between 5°–10° and between 30°–45°. Peaks corresponding to calcite (CaCO3, COD ref (00-083-1762)) were added to the pattern because its presence in the assembly was suspected but not fully proven because of the lack of the main peak at 2θ at ca. 34.3°. The XRD result obtained for the sample cured in contact with 1.4 mol/kgsolution NaNO3 (the series labelled “NaNO3 1.4 M” in Figure 3) and 2.8 mol/kgsolution NaNO3 (the series labelled “NaNO3 2.8 M” in Figure 3) show similar diffractograms. In addition, nitratine (NaNO3, COD ref (00-036-1474)) and darapskite (Na3(NO3)(SO4)(H2O), COD ref (00-074-1238)) were also observed. The presence of nitratine could be explained by sample preparation before XRD acquisition. As the HCP sample dried in the desiccator without any rinsing procedure, some residual curing solution containing a significant amount of NaNO3 may have precipitated and crystallized during the drying time. Without sulphate ions in solution, the precipitation of NaNO3 was expected for concentrations higher than 921 g/kgw (10.7 mol/kgw) [33,34].
When no internal XRD standard was mixed with the HCP powder, the diffractogram can only be interpreted qualitatively. Nevertheless, the decrease of the main portlandite peak was observed when NaNO3 content increased. This observation could be linked to an increase of portlandite solubility with increasing NaNO3 content [10,35]. Moreover, for the samples cured in contact with NaNO3, the 2θ region between 8° and 12° shows the occurrence of darapskite, which correlates with the decreasing of the main peak of ettringite. This darapskite crystalline phase was already observed in cement-based materials [12], and its formation could be explained by the presence of sulphate in the solution after ettringite dissolution. In this study, no particular effort was made to simulate with thermodynamic calculations the observed concentrations in the solution compared to the cementitious assembly in the solid. This is due to (i) the incompleteness of thermodynamic data on cementitious phases within the framework of the Pitzer model [15,36] and (ii) the too-high solubility of both nitratine and darapskite to be accurately modelled in the framework of the SIT (see Annex B in Guillaumont et al. [3]).

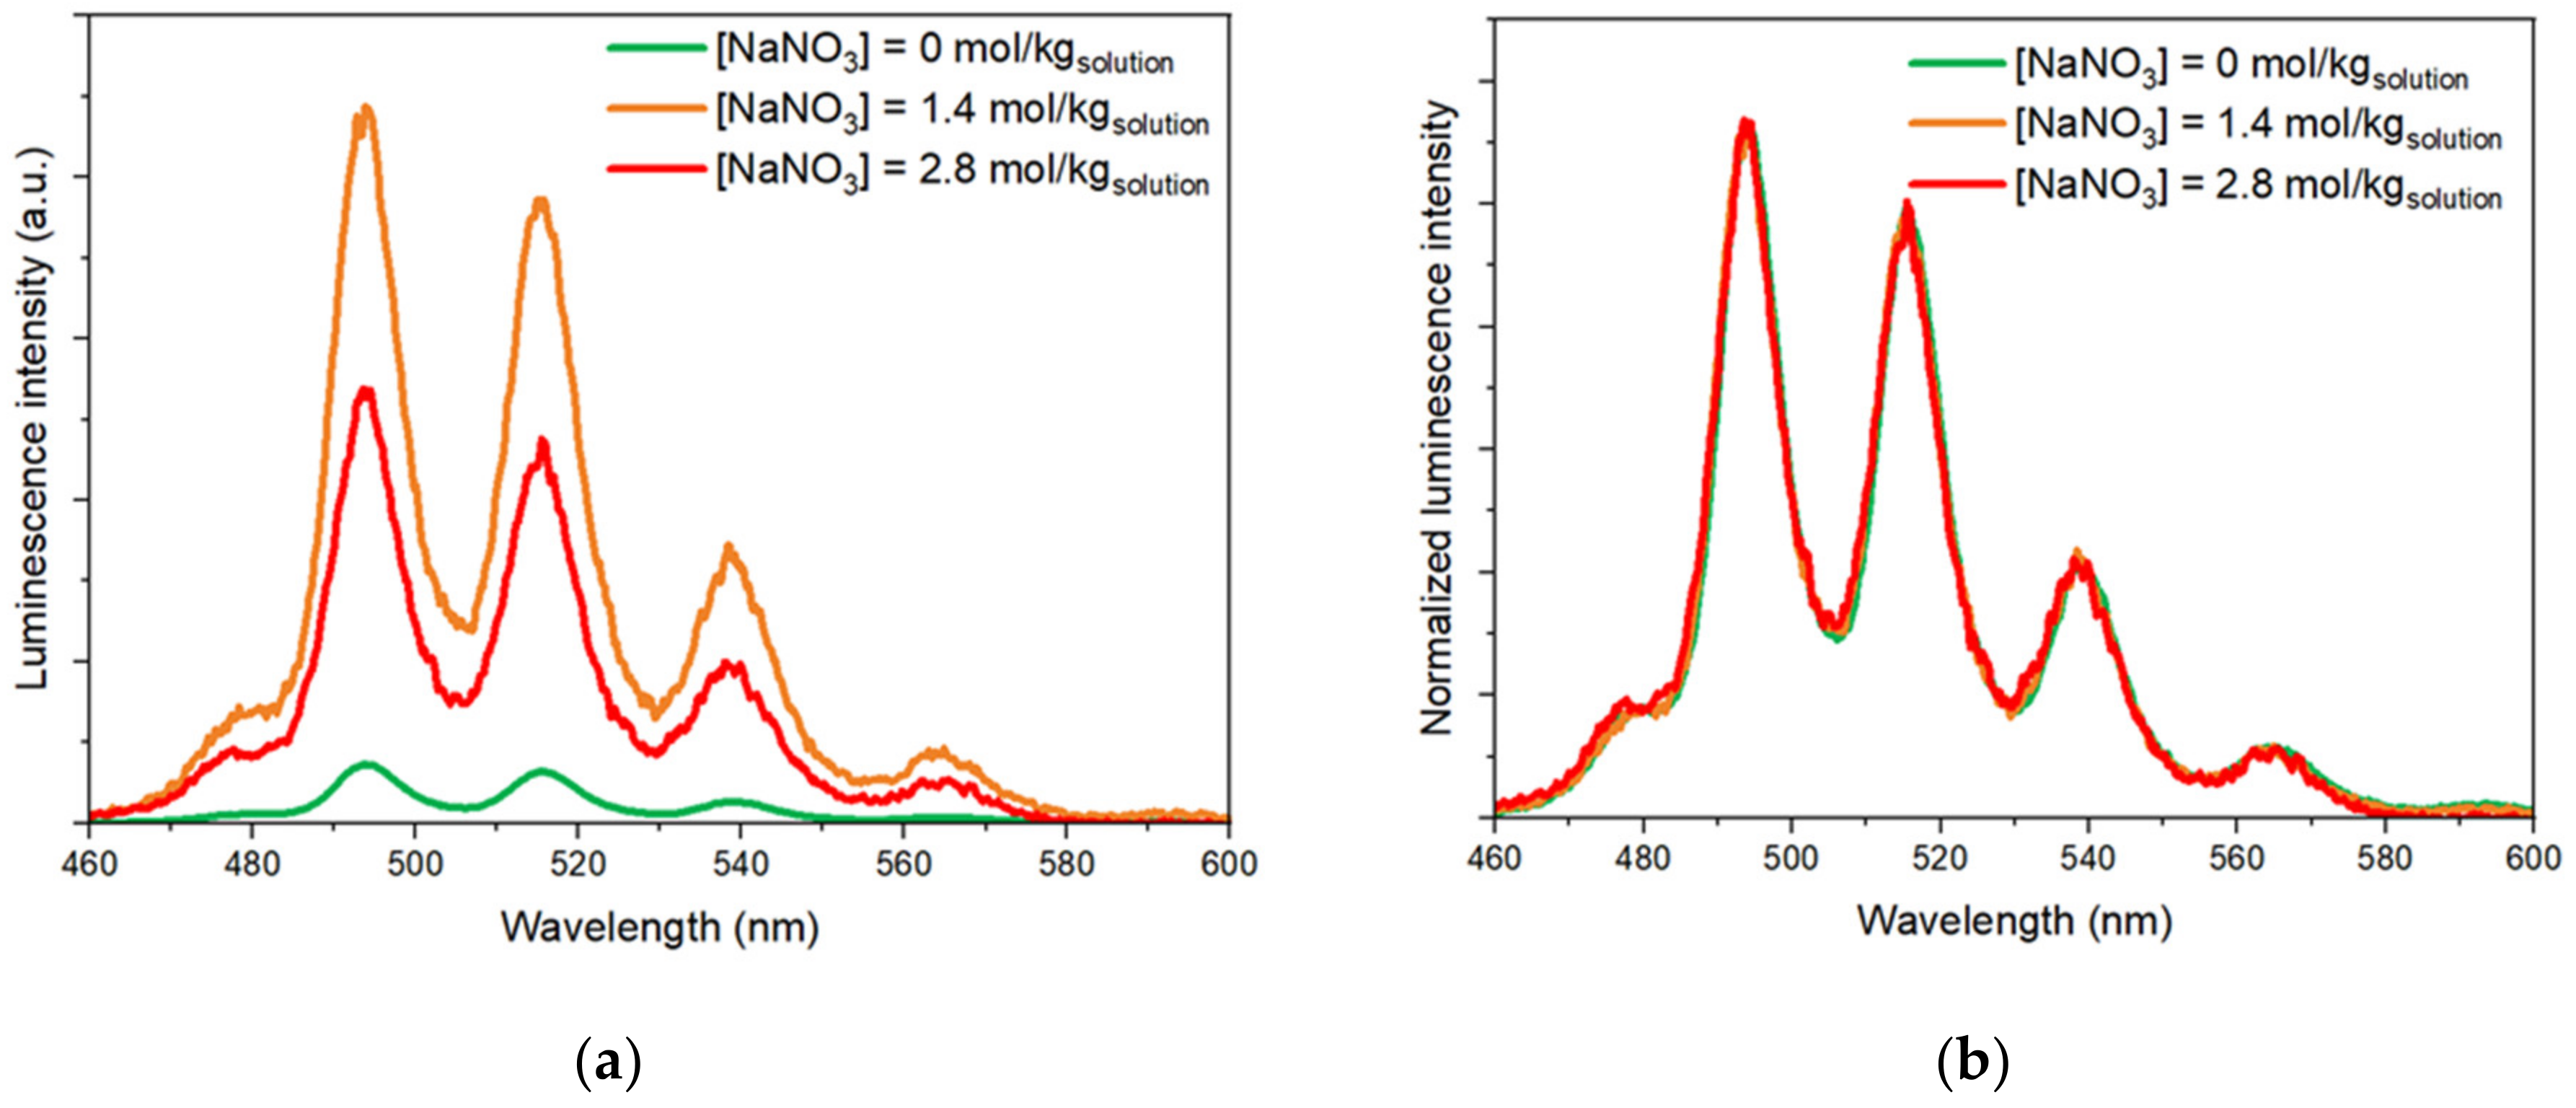
3.2. Evolution of the U(VI) Solubility Limit as a Function of NaNO3 Content

Table 2 corresponds to the measured U(VI) concentration after 4 h, 48 h, and 7 months of contact time.
After 4 h of contact time, the remaining concentration was comparable to the initial one, i.e., 10−4 mol/kgsolution, with respect to experimental uncertainties. The second spike of U(VI), i.e., [U(VI)]initial = 2 × 10⁻⁴ mol/kgsolution, led 24 h later to the formation of a yellow-orange precipitate in each system. After 48 h of contact time, the U(VI) concentration in solution decreased to a minimum of (1.67 ± 0.03) × 10−5 mol/kgsolution for the system with the higher amount of NaNO3. For the S1-0-NaNO3 system after 48 h of contact time, the U(VI) concentration was higher by a factor of ca. 5, compared to the systems with NaNO3. This gap decreased by a factor of ca. 3 after 7 months of contact time.
As stated beforehand, the Pitzer database for uranium speciation is incomplete, particularly for NaNO3. Hence, the calculation in this work was done in the framework of the SIT [3,37]. Based on a PHREEQC [38] calculation using the Thermochimie database [32] (https://www.thermochimie-tdb.com/pages/extraction.php, accessed on 8 September 2022) and the SIT for activity coefficient correction, the theoretical speciation for U(VI) in the S1-x-NaNO3 system showed UO2(OH)3 and UO2(OH)42− as the main aqueous species (Table 3).
Operational solubilities measured elsewhere [5,39,40] were in the span of 10−7–10−5 mol/kgsolution for solutions with ionic strengths up to 0.5 mol/kgsolution. In these studies, the amount of precipitate was not sufficient to perform a solid characterization. The orange-yellow precipitate was typical to U(VI)-containing solids in such conditions as currently reported by literature (see, e.g., Macé et al. [4]). The CaUO4·xH2O phase appears to be the best candidate to explain the solubility limit in S1-0-NaNO3-type solution in reference to spectroscopic evidence [4]. The solubility constant of the hydrated calcium uranate is not available in the literature. One can estimate it using the solubility constant of CaUO4(cr) from Grenthe et al. [37]. The best option could be the use of the solubility constant of CaU2O7:3H2O(cr) from Altmaier et al. [6]. Taking into consideration CaU2O7:3H2O as only a U(VI) solubility-limiting phase, adding 10−4 mol/kgsolution of uranyl in the S1-0-NaNO3 solution led to reaching a residual uranyl concentration of 6 × 10⁻⁶ mol/kgsolution, which is consistent with what was obtained after 7 months of equilibration. Other PHREEQC calculations were performed using CaU2O7:3H2O, K2U2O7:1.5H2O, and Na2U2O7:H2O as U(VI) solubility-limiting-phase candidates: with an initial U(VI) concentration of 10−4 mol/kgsolution, the increase of NaNO3 up to 2.8 mol/kgsolution led to a decrease of the U(VI) concentration to 9 × 10⁻⁷ mol/kgsolution when Na2U2O7:H2O was the major phase responsible for limiting the solubility of U(VI).
Figure 4a corresponds to the luminescence spectra of the U(VI) species present in the supernatant after 7 months of contact time in contact with NaNO3 with a spike of H3PO4, 85%. The spectra were normalized with respect to the U(VI) concentration determined after the U(VI) standard addition. It seems that the addition of NaNO3 until 1.4 mol/kgsolution increased the intensity of U(VI) in phosphoric media, and then the opposite trend was observed. The inflection point of this trend cannot be determined only with these results. Figure 4b corresponds to the same spectra normalized by the total area of each spectrum. This representation allows us to conclude that the same speciation was observed in all investigated media after the addition of the spike of H3PO4 85%.
The initial U(VI) concentration in batch sorption experiments given in Table 1 was chosen while taking into consideration the operational solubility limit. This enabled avoiding U(VI) precipitation. Therefore, the decrease of U(VI) concentration in solution after contact with the HCP can be attributed only to sorption.

3.3. U(VI) Sorption onto Hardened Cement Paste under High Saline and Alkaline Conditions

No exploitable U(VI) fluorescence spectra were obtained in supernatants after the investigated contact times in HCP suspensions. Because of the amount of NaNO3 in the alkaline supernatant, the spectra acquired at ambient temperature showed no clear uranyl fingerprint shape for all samples. Note that the UO2(OH)42− species was observed only at 153 K by Tits et al. [41]. The addition of a high amount of NaNO3 seemed to quench the signal as it did in phosphoric media (Figure 1), confirming a high matrix effect on the fluorescence in such media.
Figure 5 represents the sorption kinetics obtained as a function of NaNO3 concentration. The results are expressed as Rd values. Contact times ranged from 1 day to 30 days before U(VI) concentration measurement and Rd determination. Due to analytical issues, in the S1-0-NaNO3 system, only the sample after 30 days of contact time was measured. For the other systems, U(VI) concentration in the supernatant was determined for each contact time. There was a factor of ca. 4 between Rd values at high NaNO3 content levels and the one obtained in the reference system. The Rd value obtained after 30 days of contact time in the reference system was similar to those reported in literature for comparable cementitious systems by Ochs et al. [2]. There was not a clear trend of the evolution of Rd value with time, taking into consideration the experimental uncertainties. This suggests that equilibrium was reached after 30 days of contact time at the latest. A fast sorption mechanism can be considered in these media, as observed in other studies [39,40], in which a steady state was reached within ca. 15 days.
The decrease of Rd values with increasing ionic strength was consistent with the Rd values recommended by Ochs et al. [42] in NaCl media up to 6 M.
Table 4 and Figure 6 show the data obtained for sorption and desorption after 30 days of contact time. Considering the experimental uncertainties, the U(VI) concentration in supernatant after desorption was comparable to the one obtained after sorption for each system. In Figure 6, the Rd values for sorption and desorption are comparable. A higher value was observed for the reference system for sorption and desorption. From these results, one can conclude that a reversible U(VI) sorption mechanism occurred in all investigated systems despite the NaNO3 content.
For sorption and desorption, one can notice that the increase in NaNO3 concentration and ionic strength of the solution seems to be linked to the change in speciation of uranium (Table 3). Nevertheless, the main part of the decrease in Rd in Figure 6 occurred between the S1-0-NaNO3 and S1-1.4-NaNO3 solutions, whereas the decrease in UO2(OH)42− occurred between S1-1.4-NaNO3 and S1-2.8-NaNO3.
At pH ca. 13.3, Pointeau et al. [39,43,44] showed that the surface potential of HCP was slightly negative, with a majority of negative >SO sites (58%), significant >SOCa+ sites (30%), and neutral >SOH sites (12%) calculated using the original data, but it did not hinder the U(VI) adsorption that was supposedly controlled by negatively charged UO2(OH)3 and UO2(OH)42−. With increasing ionic strength, two phenomena can occur: (i) the Debye length decreases with ionic strength, and Na+ can approach the >SO surface sites, even if a significant amount of >SOCa+ sites are existing; (ii) the speciation of uranium(VI) renders less negatively charged species. The influence of the two phenomena is not easily decoupled within our limited number of experiments.
Pointeau et al. [39,44] showed that the joint effect of pH on uranium(VI) speciation and the change in surface potential of HCP led to an increase of Rd. Here, with no measurable pH change (cf. Table 3), it seems that the increase of NaNO3 concentration, which also induced a decrease in the equivalents of negatively charged uranium(VI) species, led to a decrease in Rd. It seems then that the high concentration of NaNO3 slightly decreased the Rd value and changed the surface speciation by a mechanism which remains to be clarified but is likely the occupation of >SOH/>SO sites with Na+, as observed in other contexts [45].

4. Conclusions

Our aim was to study the influence of a saline plume on U(VI) sorption into cementitious phases. The use of the standard addition method in 5% H3PO4 using TRLFS allowed us to (i) circumvent the high matrix effects of up to 2.8 mol/kgsolution NaNO3 media; (ii) drastically limit the dilution factor; (iii) determine the resulting [U(VI)] in solution with acceptable precision for distribution factor (Rd) determination in sorption and desorption experiments. The Rd values decreased by a factor of ca. four, with a decrease by a factor of three from the operational solubility limit measured at high ionic strength compared to the reference cementitious condition. The sorption of U(VI) appears to be reversible. The mineralogical phase assembly observed for the HCP after curing in NaNO3 solutions cannot directly be linked to the decrease of Rd values. The occupation of surface sites by Na+ is a likely phenomenon, which could explain the observed results. There is still a need to verify the affinity of uranium for each of the observed cementitious individual phases to obtain a comprehensive overview of the system, with particular attention to calcium silicate hydrates and AFm/AFt phases.

Author Contributions

Formal analysis, J.P., N.M. and P.E.R.; methodology, N.M. and P.E.R.; investigation, N.M. and P.E.R.; writing—original draft preparation, N.M.; writing—review and editing, N.M. and P.E.R.; supervision, N.M. and P.E.R. All authors have read and agreed to the published version of the manuscript.

Funding

This work received financial support from the French National Agency for Radioactive Waste Management (Andra) as part of the GL CTEC project.

Data Availability Statement

Not applicable.

Acknowledgments

The authors acknowledge E. Thory and S. Lefevre for technical assistance in ICP-MS measurements and P. Henocq for fruitful discussions.

Conflicts of Interest

The authors declare no conflict of interest.

References

  1. Reynolds, J.G.; Cooke, G.A.; Herting, D.L.; Warrant, R.W. Salt mineralogy of Hanford high-level nuclear waste staged for treatment. Ind. Eng. Chem. Res. 2013, 52, 9741–9751. [Google Scholar] [CrossRef]
  2. Ochs, M.; Mallants, D.; Wang, L. Radionuclide and metal sorption on cement and concrete. In Topics in Safety, Risk, Reliability and Quality; Springer International Publishing: Cham, Switzerland, 2016. [Google Scholar]
  3. Guillaumont, R.; Fanghänel, T.; Fuger, J.; Grenthe, I.; Neck, V.; Palmer, D.A.; Rand, M. Chemical Thermodynamics 5. Update on the Chemical Thermodynamics of Uranium, Neptunium, Plutonium, Americium and Technetium; North Holland Elsevier Science Publishers B. V.: Amsterdam, The Netherlands, 2003; Volume 5, p. 918. [Google Scholar]
  4. Macé, N.; Wieland, E.; Dähn, R.; Tits, J.; Scheinost, A.C. EXAFS investigation on U(VI) immobilization in hardened cement paste: Influence of experimental conditions on speciation. Radiochim. Acta 2013, 101, 379–389. [Google Scholar] [CrossRef] [Green Version]
  5. Wieland, E.; Macé, N.; Dahn, R.; Kunz, D.; Tits, J. Macro- and micro-scale studies on U(VI) immobilization in hardened cement paste. J. Radioanal. Nucl. Chem. 2010, 286, 793–800. [Google Scholar] [CrossRef]
  6. Altmaier, M.; Neck, V.; Mueller, R.; Fanghänel, T. Solubility of U(VI) and formation of CaU2O7:3H2O(cr) in alkaline CaCl2 solutions. In Proceedings of the MIGRATION 2005, 10th International Conference on Chemistry and Migration Behaviour of Actinides and Fission Products in the Geosphere, Avignon, France, 18–23 September 2005. [Google Scholar]
  7. Altmaier, M.; Yalçintaş, E.; Gaona, X.; Neck, V.; Muller, R.; Schlieker, M.; Fanghänel, T. Solubility of U(VI) in chloride solutions. I. The stable oxides/hydroxides in NaCl systems, solubility products, hydrolysis constants and SIT coefficients. J. Chem. Thermodyn. 2017, 114, 2–13. [Google Scholar] [CrossRef]
  8. Çevirim-Papaioannou, N.; Yalcintas, E.; Gaona, X.; Altmaier, M.; Geckeis, H. Solubility of U(VI) in chloride solutions. II. The stable oxides/hydroxides in alkaline KCl solutions: Thermodynamic description and relevance in cementitious systems. Appl. Geochem. 2018, 98, 237–246. [Google Scholar] [CrossRef]
  9. Endrizzi, F.; Gaona, X.; Zhang, Z.C.; Xu, C.; Rao, L.F.; Garcia-Perez, C.; Altmaier, M. Thermodynamic description of U(VI) solubility and hydrolysis in dilute to concentrated NaCl solutions at T = 25, 55 and 80 °C. Radiochim. Acta 2019, 107, 663–678. [Google Scholar] [CrossRef]
  10. Felipe-Sotelo, M.; Hinchliff, J.; Field, L.P.; Milodowski, A.E.; Preedy, O.; Read, D. Retardation of uranium and thorium by a cementitious backfill developed for radioactive waste disposal. Chemosphere 2017, 179, 127–138. [Google Scholar] [CrossRef] [PubMed] [Green Version]
  11. Johnston, J.; Grove, C. The solubility of calcium hydroxide in aqueous salt solutions. J. Am. Chem. Soc. 1931, 53, 3976–3991. [Google Scholar] [CrossRef]
  12. Malone, P.G.; Poole, T.S.; Wakeley, L.D.; Burkes, J.P. Salt related expansion reactions in Portland-cement-based wasteforms. J. Hazard. Mater. 1997, 52, 237–246. [Google Scholar] [CrossRef]
  13. Liu, L.; Sun, C.; Geng, G.Q.; Feng, P.; Li, J.Q.; Dähn, R. Influence of decalcification on structural and mechanical properties of synthetic calcium silicate hydrate (C-S-H). Cem. Concr. Res. 2019, 123, 105793. [Google Scholar] [CrossRef]
  14. Zheng, Z.; Li, Y.X.; Yang, J.; Cui, M.X.; Wang, H.T.; Ma, X. Insights into the deterioration of C-S-H gels in hardened cement pastes with different NaNO3 concentrations. Constr. Build. Mater. 2020, 259, 120423. [Google Scholar] [CrossRef]
  15. Pitzer, K.S. Activity Coefficients in Electrolyte Solutions; CRC Press: Boca Raton, FL, USA, 1991; p. 542. [Google Scholar]
  16. Lach, A.; André, L.; Lassin, A. Darapskite solubility in basic solutions at 25 °C: A Pitzer model for the Na-NO3-SO4-OH-H2O system. Appl. Geochem. 2017, 78, 311–320. [Google Scholar] [CrossRef]
  17. Reynolds, J.G.; Carter, R. A sulfate and darapskite solubility model with Pitzer interaction coefficients for aqueous solutions containing NaNO2, NaNO3, and NaOH. J. Chem. Thermodyn. 2016, 101, 380–386. [Google Scholar] [CrossRef]
  18. Shang, C.; Reiller, P.E. Effect of temperature on the complexation of triscarbonatouranyl(VI) with calcium and magnesium in NaCl aqueous solution. Dalton Trans. 2021, 50, 17165–17180. [Google Scholar] [CrossRef]
  19. Tits, J.; Stumpf, T.; Rabung, T.; Wieland, E.; Fanghänel, T. Uptake of Cm(III) and Eu(III) by calcium silicate hydrates: A solution chemistry and time-resolved laser fluorescence spectroscopy study. Environ. Sci. Technol. 2003, 37, 3568–3573. [Google Scholar] [CrossRef]
  20. Huclier-Markai, S.; Mazza, M.; Alliot, C.; Reiller, P.E. Complexation of europium(III) with exopolysaccharides from a marine bacterium envisaged as luminescent probe in a theranostic approach. Dalton Trans. 2021, 50, 17215–17227. [Google Scholar] [CrossRef]
  21. Mauchien, P. Dosage de l’Uranium par Spectrofluorimétrie à Source d’Excitation Laser; CEA-R-5300; Commissariat à l’Energie Atomique, CEN Saclay: Gif-sur-Yvette, France, 1985. [Google Scholar]
  22. Berthoud, T.; Decambox, P.; Kirsch, B.; Mauchien, P.; Moulin, C. Direct uranium trace analysis in plutonium solutions by time-resolved laser-induced spectrofluorometry. Anal. Chem. 1988, 60, 1296–1299. [Google Scholar] [CrossRef]
  23. Moulin, C.; Beaucaire, C.; Decambox, P.; Mauchien, P. Determination of uranium in solution at the ng.l−1 level by time-resolved laser-induced spectrofluorimetry: Application to geological samples. Anal. Chim. Acta 1990, 238, 291–296. [Google Scholar] [CrossRef]
  24. Decambox, P.; Mauchien, P.; Moulin, C. Direct and fast determination of uranium in human urine samples by laser-induced time-resolved spectrofluorometry. Appl. Spectrosc. 1991, 45, 116–118. [Google Scholar] [CrossRef]
  25. Reiller, P.; Moulin, C.; Beaucaire, C.; Lemordant, D. Dual use of micellar enhanced ultrafiltration and time-resolved laser-induced spectrofluorometry for the study of uranyl exchange at the surface of alkylsulfate micelles. J. Colloid Interface Sci. 1994, 163, 81–86. [Google Scholar] [CrossRef]
  26. Reiller, P.E.; Fromentin, E.; Ferry, M.; Dannoux-Papin, A.; Badji, H.; Tabarant, M.; Vercouter, T. Complexing power of hydro-soluble degradation products from γ-irradiated polyvinylchloride: Influence on Eu(OH)3(s) solubility and Eu(III) speciation in neutral to alkaline environment. Radiochim. Acta 2017, 105, 665–675. [Google Scholar] [CrossRef] [Green Version]
  27. Brevet, J.; Claret, F.; Reiller, P.E. Spectral and temporal luminescent properties of Eu(III) in humic substance solutions from different origins. Spectrochim. Acta Part A 2009, 74, 446–453. [Google Scholar] [CrossRef] [PubMed] [Green Version]
  28. Kouhail, Y.Z.; Benedetti, M.F.; Reiller, P.E. Eu(III)-fulvic acid complexation: Evidence of fulvic acid concentration dependent interactions by time-resolved luminescence spectroscopy. Environ. Sci. Technol. 2016, 50, 3706–3716. [Google Scholar] [CrossRef] [Green Version]
  29. Fromentin, E.; Reiller, P.E. Influence of adipic acid on the speciation of Eu(III): Review of thermodynamic data in NaCl and NaClO4 media, and a new determination of Eu-adipate complexation constant in 0.5 mol.kgw−1 NaClO4 medium by time-resolved luminescence spectroscopy. Inorg. Chim. Acta 2018, 482, 588–596. [Google Scholar] [CrossRef]
  30. Kouhail, Y.Z.; Benedetti, M.F.; Reiller, P.E. Formation of mixed Eu(III)-CO3-fulvic acid complex: Spectroscopic evidence and NICA-Donnan modeling. Chem. Geol. 2019, 522, 175–185. [Google Scholar] [CrossRef]
  31. De Levie, R. Advanced Excel for Scientific Data Analysis; Oxford University Press: Oxford, UK, 2004; p. 638. [Google Scholar]
  32. Giffaut, E.; Grivé, M.; Blanc, P.; Vieillard, P.; Colàs, E.; Gailhanou, H.; Gaboreau, S.; Marty, N.; Madé, B.; Duro, L. Andra thermodynamic database for performance assessment: ThermoChimie. Appl. Geochem. 2014, 49, 225–236. [Google Scholar] [CrossRef]
  33. Marion, G.M. A molal-based model for strong acid chemistry at low temperatures (<200 to 298 K). Geochim. Cosmochim. Acta 2002, 66, 2499–2516. [Google Scholar] [CrossRef]
  34. Toghiani, R.K.; Phillips, V.A.; Smith, L.T.; Lindner, J.S. Solubility in the Na + SO4 + NO3 and Na + SO4 + NO2 systems in water and in sodium hydroxide solutions. J. Chem. Eng. Data 2008, 53, 798–804. [Google Scholar] [CrossRef]
  35. Yeatts, L.B.; Marshall, W.L. Aqueous systems at high temperature. XVIII. Activity coefficient behavior of calcium hydroxide in aqueous sodium nitrate to critical temperature of water. J. Phys. Chem. 1967, 71, 2641–2650. [Google Scholar] [CrossRef]
  36. Reardon, E.J. An ion interaction model for the determination of chemical equilibria in cement/water systems. Cem. Concr. Res. 1990, 20, 175–192. [Google Scholar] [CrossRef]
  37. Grenthe, I.; Gaona, X.; Plyasunov, A.V.; Rao, L.; Runde, W.H.; Grambow, B.; Koning, R.J.M.; Smith, A.L.; Moore, E.E. Chemical Thermodynamics 14. Second Update on the Chemical Thermodynamics of Uranium, Neptunium, Plutonium, Americium and Technetium; Ragoussi, M.-E., Martinez, J.S., Costa, D., Eds.; OECD Publications: Paris, France, 2020; Volume 14, p. 1572.
  38. Parkhurst, D.L.; Appelo, C.A.J. User’s Guide to PHREEQC (Version 2)—A Computer Program for Speciation, Batch-Reaction, One-Dimensional Transport, and Inverse Geochemical Calculations; 99-4259; U.S. Geological Survey, Water-Resources Investigations: Lakewood, CO, USA, 1999.
  39. Pointeau, I.; Landesman, C.; Giffaut, E.; Reiller, P. Reproducibility of the uptake of U(VI) onto degraded cement pastes and calcium silicate hydrate phases. Radiochim. Acta 2004, 92, 645–650. [Google Scholar] [CrossRef] [Green Version]
  40. Tits, J.; Fujita, T.; Tsukamoto, M.; Wieland, E. Uranium(VI) uptake by synthetic calcium silicate hydrates. MRS Proc. 2008, 1107, 467–474. [Google Scholar] [CrossRef]
  41. Tits, J.; Geipel, G.; Macé, N.; Eilzer, M.; Wieland, E. Determination of uranium(VI) sorbed species in calcium silicate hydrate phases: A laser-induced luminescence spectroscopy and batch sorption study. J. Colloid Interface Sci. 2011, 359, 248–256. [Google Scholar] [CrossRef]
  42. Ochs, M.; Vriens, B.; Tachi, Y. Retention of uranium in cement systems: Effects of cement degradation and complexing ligands. Prog. Nucl. Sci. Technol. 2018, 5, 208–2012. [Google Scholar] [CrossRef]
  43. Pointeau, I.; Reiller, P.; Macé, N.; Landesman, C.; Coreau, N. Measurement and modeling of the surface potential evolution of hydrated cement pastes as a function of degradation. J. Colloid Interface Sci. 2006, 300, 33–44. [Google Scholar] [CrossRef]
  44. Pointeau, I.; Coreau, N.; Reiller, P.E. Uptake of anionic radionuclides onto degraded cement pastes and competing effect of organic ligands. Radiochim. Acta 2008, 96, 367–374. [Google Scholar] [CrossRef] [Green Version]
  45. Siroux, B.; Latrille, C.; Petcut, C.; Beaucaire, C.; Tabarant, M.; Benedetti, M.F.; Reiller, P.E. On the use of a multi-site ion-exchange model to predictively simulate the adsorption behaviour of strontium and caesium onto French agricultural soils. Appl. Geochem. 2021, 132, 105052. [Google Scholar] [CrossRef]
Figure 1. TRLFS results obtained at 22 °C for a solution with an initial U(VI) concentration of 5 × 10⁻⁶ mol/L in 0.8 mol/kgw H3PO4: (a) U(VI) luminescence spectrum; (b) lifetime decay of the resulting U(VI) species.
Minerals 13 00325 g001
Figure 2. Luminescence spectra of U(VI) in 0.8 mol/kgw H3PO4 as a function of U(VI) standard addition: (a) raw U(VI) luminescence spectra; (b) evolution of the intensity obtained for the peak at 495 nm as a function of the U(VI) standard addition.
Minerals 13 00325 g002
Figure 3. XRD patterns of CEM I HCP samples’ powder after 6 months of equilibration in NaNO3 cementitious solutions.
Minerals 13 00325 g003
Figure 4. Luminescence spectra of U(VI) in 0.8 mol/kgw H3PO4 and as a function of NaNO3 content: (a) luminescence spectra normalized considering the U(VI) concentration; (b) U(VI) luminescence spectra normalized to the area of the spectra.
Minerals 13 00325 g004
Figure 5. U(VI) sorption kinetics as a function of NaNO3 content.
Minerals 13 00325 g005
Figure 6. U(VI) sorption and desorption after 30 days of contact time as a function of NaNO3 content.
Minerals 13 00325 g006
Table 1. Initial conditions for U(VI) batch sorption as a function of NaNO3 content.
Solution AddedV/m
(kgsolution/kgsolid)
[U(VI)]ini
(mol/kgsolution)
S1-0-NaNO3325 ± 19(9.2 ± 1.5) × 10−7
S1-1.4-NaNO3346 ± 20(8.5 ± 0.6) × 10−7
S1-2.8-NaNO3364 ± 12(7.3 ± 1.1) × 10−7
Table 2. U(VI) concentration measured in solution as a function of contact time and NaNO3 content.
Contact Time,
Technique
S1-0-NaNO3
(mol/kgsolution)
S1-1.4-NaNO3
(mol/kgsolution)
S1-2.8-NaNO3
(mol/kgsolution)
4 h, ICP-MS(1.1 ± 0.1) × 10−4(9.6 ± 0.5) × 10−5(1.0 ± 0.1) × 10−4
48 h, ICP-MS(8.68 ± 0.08) × 10−5(1.38 ± 0.03) × 10−5(1.67 ± 0.03) × 10−5
7 m, ICP-MS<LOD *<LOD *<LOD *
7 m, TRLFS(7.2 ± 2.1) × 10−6(2.7 ± 0.3) × 10−6(2.2 ± 0.4) × 10−6
* LOD: limit of detection.
Table 3. U(VI) speciation and −log10[H+] values calculated in the three solutions using the Thermochimie database [32] (https://www.thermochimie-tdb.com/pages/extraction.php, accessed on 8 September 2022) and SIT for activity coefficient correction [3,37].
S1-0-NaNO3S1-1.4-NaNO3S1-2.8-NaNO3
UO2(OH)31.8%5.8%11.7%
UO2(OH)42−98.2%94.2%88.3%
−log10[H+]13.313.013.2
Table 4. U(VI) concentration measured by TRLFS in supernatant after 1 month of sorption or desorption as a function of NaNO3 content.
[U(VI)]solutionS1-0-NaNO3
(mol/kgsolution)
S1-1.4-NaNO3
(mol/kgsolution)
S1-2.8-NaNO3
(mol/kgsolution)
sorption(1.3 ± 0.1) × 10−8(7.4 ± 1.2) × 10−8(6.8 ± 0.8) × 10−8
desorption(1.6 ± 0.3) × 10−8(5.9 ± 1.6) × 10−8(4.6 ± 0.9) × 10−8
Disclaimer/Publisher’s Note: The statements, opinions and data contained in all publications are solely those of the individual author(s) and contributor(s) and not of MDPI and/or the editor(s). MDPI and/or the editor(s) disclaim responsibility for any injury to people or property resulting from any ideas, methods, instructions or products referred to in the content.

