Article

The Occurrence Mechanism of Lacustrine Shale Oil in the Second Member of the Paleogene Kongdian Formation, Cangdong Sag, Bohai Bay Basin

1
School of Geosciences, China University of Petroleum (East China), Qingdao 266580, China
2
Research Institute of Exploration and Development, Dagang Oilfield Company, PetroChina, Tianjin 300280, China
*
Authors to whom correspondence should be addressed.
Minerals 2023, 13(2), 199; https://doi.org/10.3390/min13020199
Submission received: 25 November 2022 / Revised: 29 December 2022 / Accepted: 19 January 2023 / Published: 30 January 2023
(This article belongs to the Special Issue Reservoir and Geochemistry Characteristics of Black Shale)

Abstract

:
The lacustrine shale in the second member of the Kongdian Formation (Ek2) is the most significant target of shale oil exploration in the Cangdong Sag, Bohai Bay Basin, China. To investigate the occurrence mechanisms and to reveal the influencing factors of shale oil mobility in Ek2, a series of analyses (X-ray diffraction (XRD), field emission scanning electron microscopy (FE-SEM), total organic carbon (TOC) analysis, Rock-Eval pyrolysis, low-temperature nitrogen physisorption (LNP), mercury intrusion porosimetry (MIP), and multiple isothermal stage (MIS) pyrolysis) were conducted on samples collected from well cores in the Cangdong Sag. The results show that the lithofacies can be categorized as laminated felsic shales, laminated and massive mixed shales, and laminated and massive carbonate shales. The shales were characterized by a high organic matter abundance and moderate thermal evolution with good to excellent hydrocarbon generation potential and contained a high abundance of Type I and II1 kerogens. Laminated felsic shales and laminated mixed shales, compared with other lithofacies, had clear advantages in the amount of free hydrocarbon that can be volatilized from the rock (S1), the oil saturation index (OSI) value, and the free oil and movable oil content. LNP, MIP, and MIS pyrolysis analyses show that the residual shale oil mainly occurred in pores with diameters smaller than 200 nm, and the pore diameter when residual oil occurred in some laminated shale samples could reach 50 μm. The lower limits of the pore diameter where free oil and movable oil occurred were 7 and 30 nm, respectively. The mobility of shale oil is controlled by the shale oil component, thermal maturity, TOC content, and pore volume. The results herein provide a basis for the evaluation of optimal shale oil intervals.

1. Introduction

Shale oil is defined as oil resources trapped in organic-rich shale successions and mainly occurring in micro-nano pores. It is widely developed in North America, Eastern Europe, and the Asia-Pacific region and has great exploration potential [1,2,3,4]. The United States, the world’s largest oil producer, produced 3.85 × 10⁸ t of shale oil in 2019, accounting for 65.2% of its total crude oil output, and its energy supply is nearly self-sufficient [5,6]. Drawing on the inspiration and experience of shale oil exploration and development in the United States, the continental shale oil industry has also made important progress and breakthroughs in China and has achieved production in the Bohai Bay, Ordos, Junggar, and Songliao basins, and other areas [7,8,9,10,11]. At present, 46 horizontal wells have been drilled, and 32 horizontal wells have been put into production in the second member of the Kongdian Formation (Ek2) in the Cangdong Sag in the Bohai Bay Basin, with a daily oil production of 160–260 t and a cumulative oil production of 8 × 10⁴ t. The maximum daily oil production of two of the horizontal wells, GD1701H and GD1702H, is 68.3 t and 55 t, which has been continuously produced for more than 1300 days. It is proven that the shale oil of Ek2 is an important replacement resource for building production and increasing reserves in the Cangdong Sag [4,12]. Compared with the geological conditions for the formation of marine shale oil in North America, the geological structure of continental shale oil is complex, the area of the lacustrine basin is small, it is much more affected by climatic conditions, the shale oil enrichment conditions are more demanding, while the enrichment rules are also more complex [13,14]. Under the framework of complex geological conditions, the exploration and development of continental shale oil also face certain problems in China, and the oil production of some continental shale wells has decreased to a large extent. Taking wells BYHF1 and BY2HF of the Biyang Sag as an example, daily oil production was 21.5 t and 29.1 t, respectively, after fracturing in the early stage, but daily production quickly reduced to 0.9 t, and the stable production time was short [15]. The main reason for this is that the resource potential and distribution of shale oil are unclear, and the oil-bearing properties of shale intervals lack quantitative characterization. The viscosity of shale oil is high, and the adsorption between minerals, organic matter and shale oil restricts fluidity, resulting in poor mobility, which is related to the occurrence state and pore size of shale oil. Therefore, the evaluation of shale oil content, occurrence characteristics, and controlling factors of different occurrence states is of great significance for the evaluation of shale oil resource potential.
As a key area of shale oil exploration and development in China, Ek2 in the Cangdong Sag developed thick shale with a high abundance of organic matter. The shale intervals are characterized by various rock types, frequent interbedding of lithology, dense pores and fractures, and a high amount of brittle minerals, so they are a good basis for shale oil development. Predecessors have studied the geological characteristics, pore structure characteristics, and sedimentary environment evolution and revealed the formation and enrichment conditions of shale oil from macroscopic analysis of the relationship between the distribution and production of shale oil production wells and mineral composition, laminar structure, overpressure, fracture development, interlayer, porosity, permeability, and organic matter abundance. It has been found that favorable lithofacies, a moderate abundance of organic matter, an abnormally high pressure, intercalation, the development of natural fractures, and a high fluidity are the controlling factors of high shale oil production, but the research on its oil-bearing properties, occurrence characteristics, and controlling factors is weak. In this study, the techniques of core and thin section observation, as well as the experimental results of X-ray diffraction (XRD), organic geochemistry, low-temperature nitrogen physisorption (LNP), high-pressure mercury intrusion porosimetry (MIP), and field emission scanning electron microscopy (FE-SEM), are used to describe the lithofacies variation, characterize the oil-bearing properties of different lithofacies, clarify the occurrence characteristics, discuss the influencing factors of shale oil mobility, and optimize the sweet spot intervals of shale oil. The approaches and findings can provide a reference for the next exploration of shale oil in the Cangdong Sag.

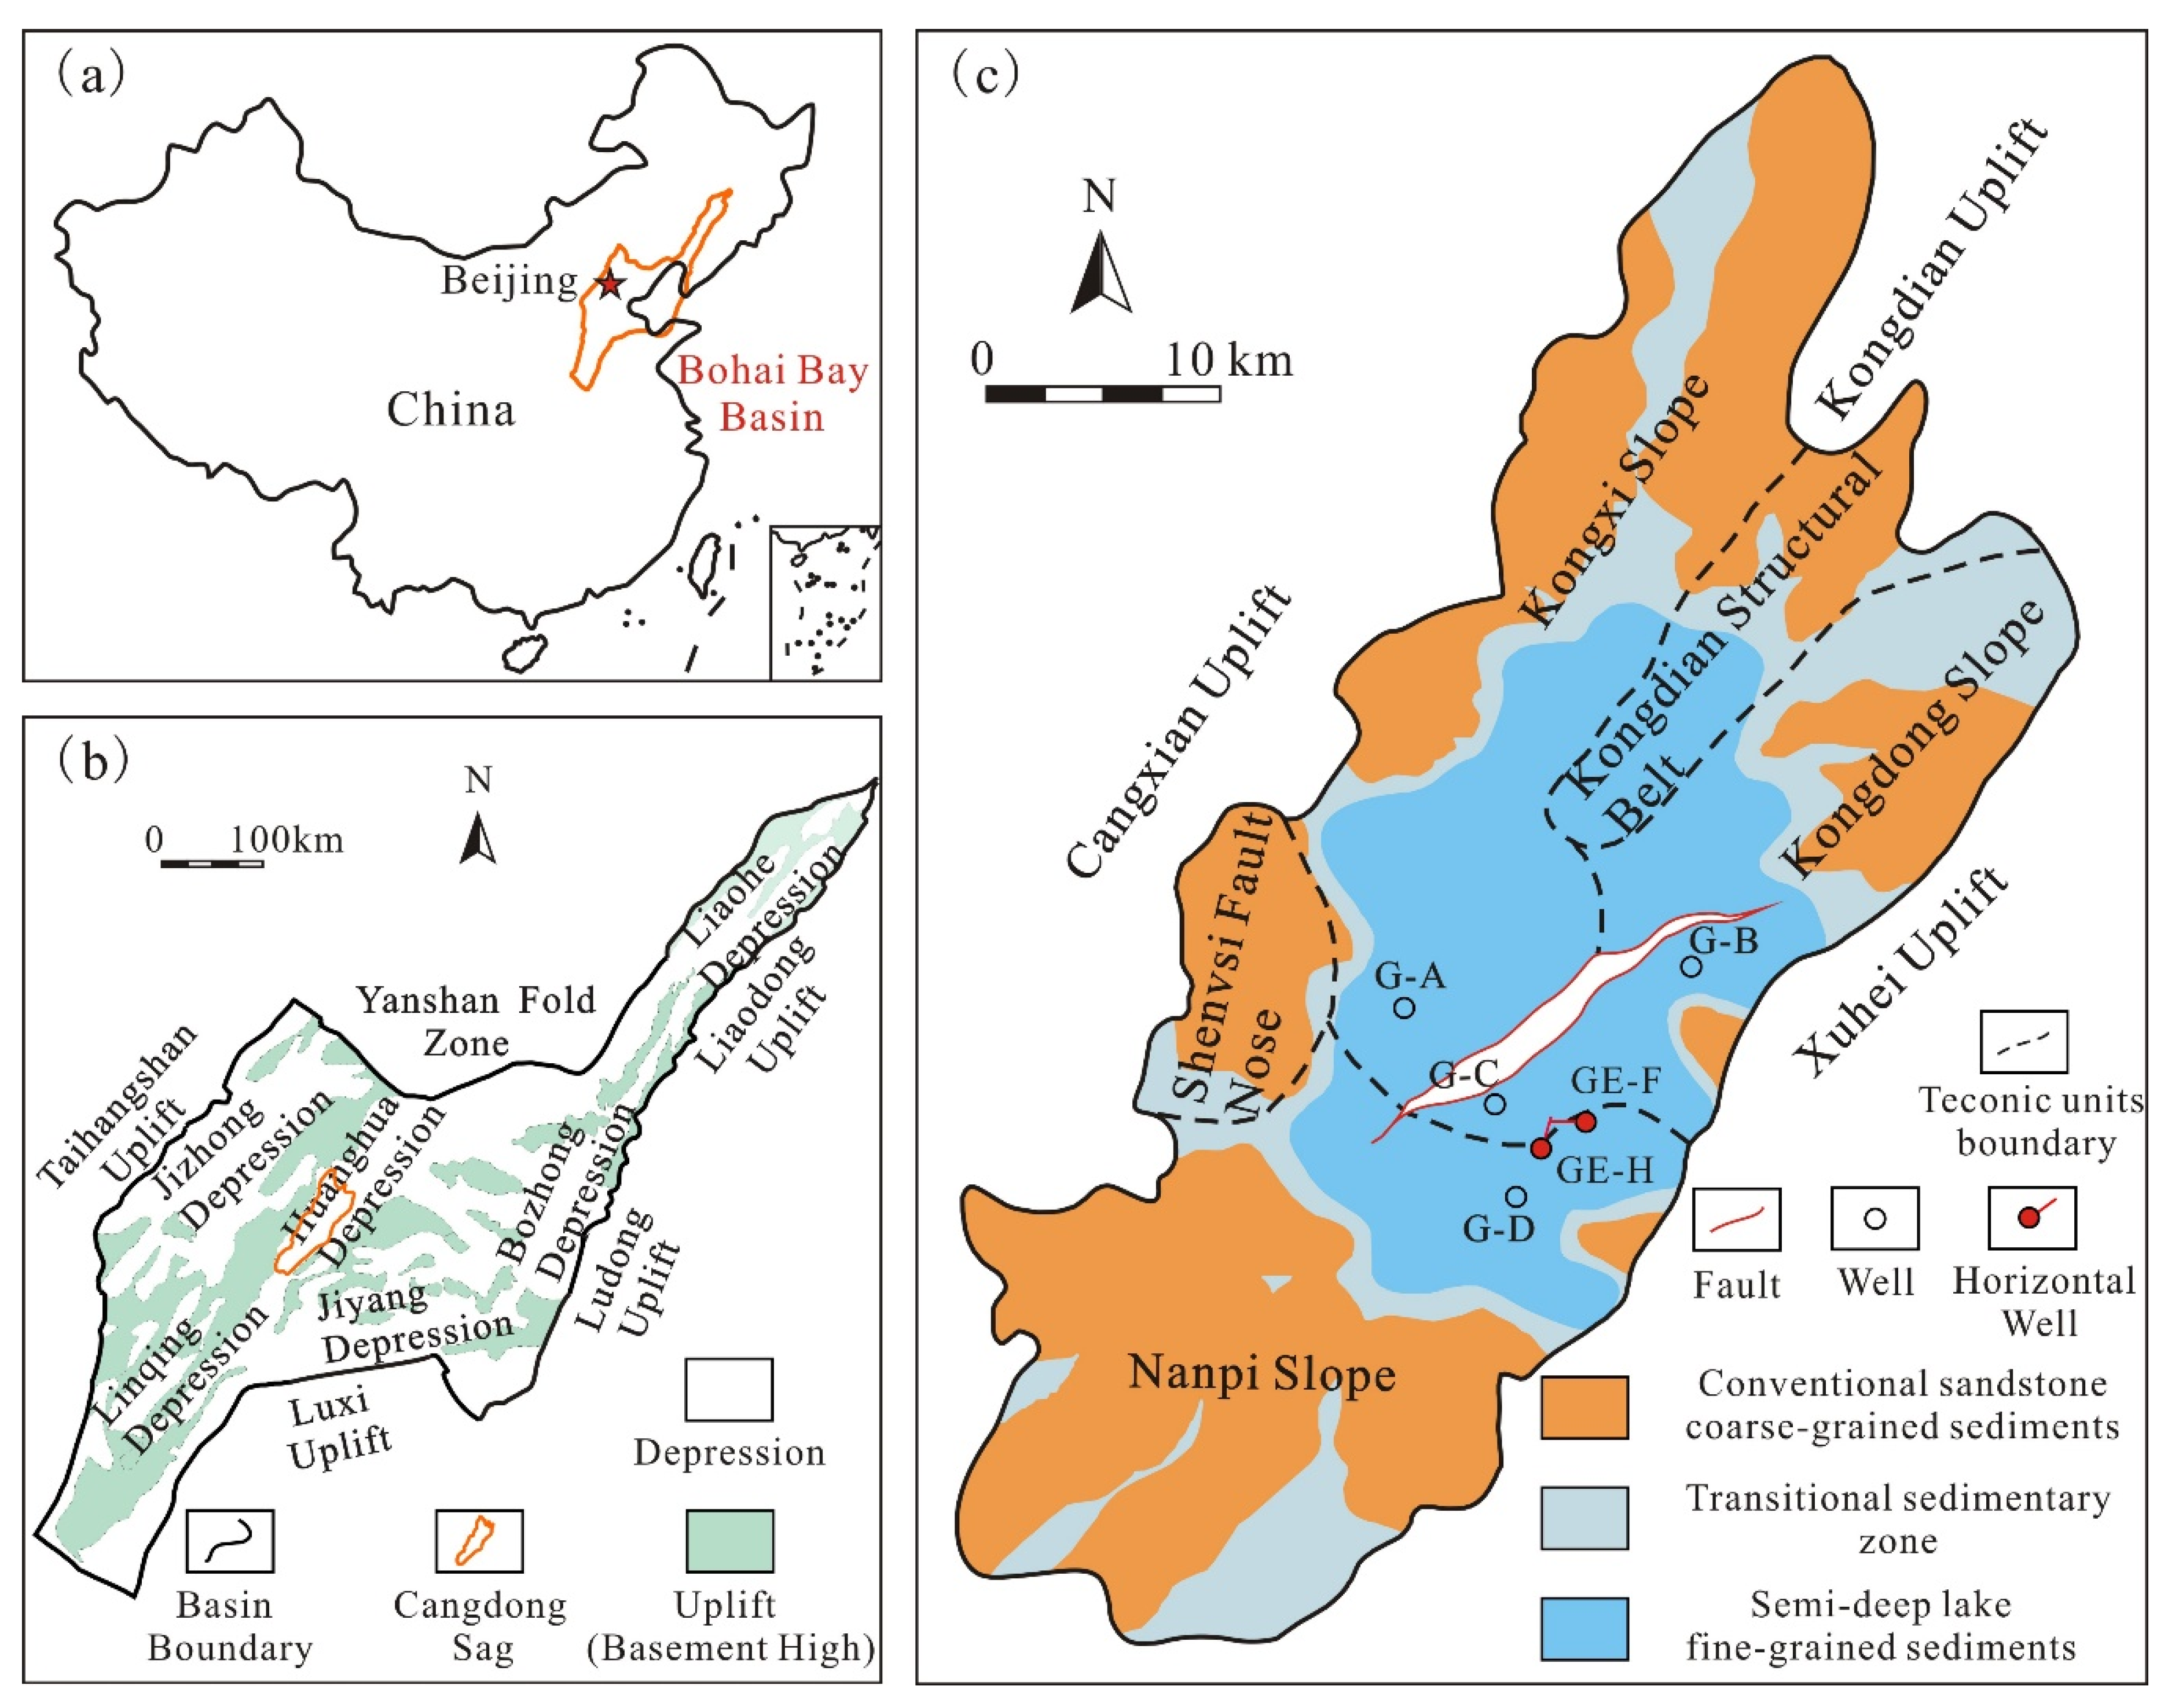
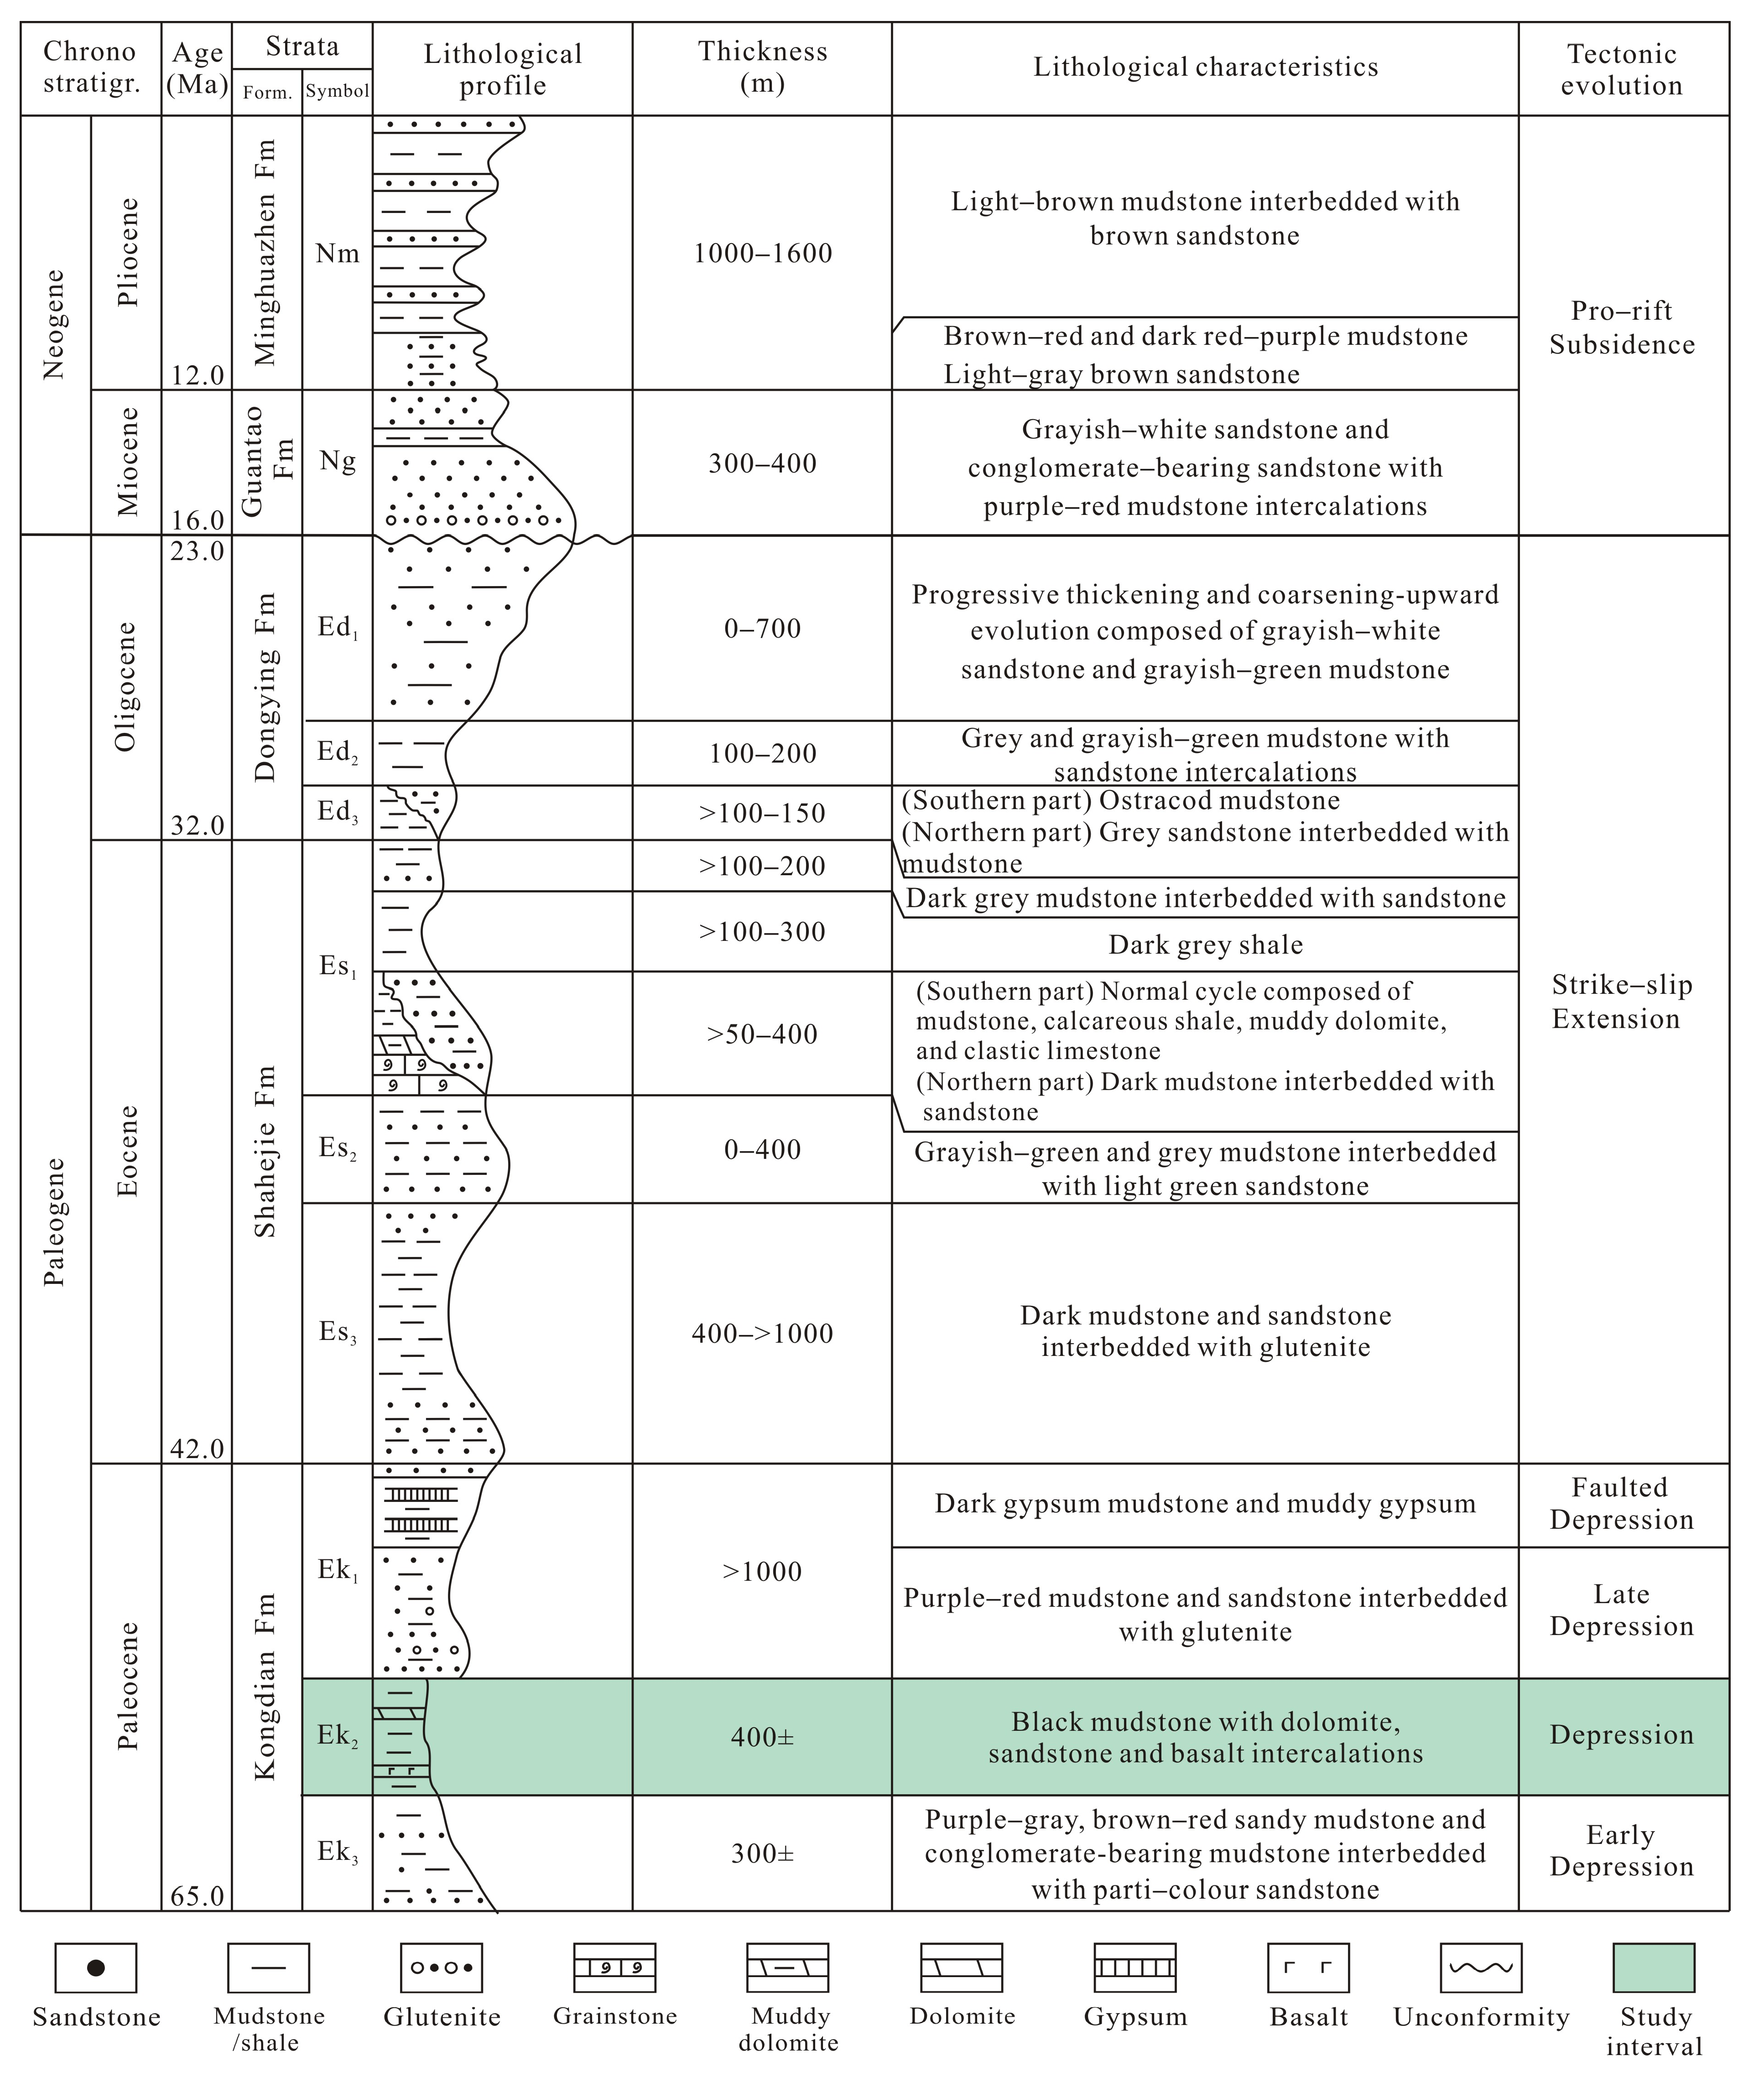
2. Geological Setting

The Cangdong Sag is located in the southwest of the Huanghua Depression, Bohai Bay basin, China, which is the second largest oil-rich sag in the Huanghua Depression, with an exploration area of about 1760 km2 [16,17,18]. The Cangdong Sag is sandwiched between the Cangxian uplift, Xuhei uplift, Kongdian uplift, and Dongguang uplift. Under the influence of basin boundary faults, the Cangdong Sag can be divided into five secondary structural units: the Kongdong slope, the Kongxi slope, the Nanpi slope, the Kongdian structural belt, and the Shenvsi fault nose belt (Figure 1) [12,19].
The Kongdian Formation, Shahejie Formation, and Dongying Formation were deposited in the Paleogene period of the Cangdong Sag, in which the thickness of Kongdian Formation is about 2000 m, which is divided into Ek3, Ek2, and Ek1 from bottom to top (Figure 2). As the main source rock of the Cangdong Sag, Ek2 can be further divided into four sub-members from bottom to top: Ek24, Ek23, Ek22, and Ek21 (Figure 3) [18,20]. Ek24 and Ek21 are mainly composed of fine-grained sandstone and mudstone with poor organic matter content, so the lower Ek21, Ek22, and Ek23 are more favorable targets for shale oil exploration in the Cangdong Sag. During the paleodeposition of Ek2, the paleoclimate was dominantly semi-arid–humid, with an inland closed lake basin with fresh–brackish water. Influenced by several lobate delta deposits around the lake basin, the sedimentary facies changed regularly from the edge to the center of the lake basin. At the edge of the lake basin, the delta front subfacies was dominated by medium-fine sandstone, representing a conventional sandstone development area. A semi-deep lacustrine subfacies was developed in the central part of the lake basin, which is the development zone of fine-grained sediments (Figure 1) [18,21,22].
Figure 1. (a) Location of the Bohai Bay Basin in China (modified from [23]). (b) Structural map of the Bohai Bay Basin and location of the Cangdong Sag (modified from [23,24]). (c) Structural map with regional setting of the Cangdong Sag (modified from [18,19,20,21,22,23,24,25]).
Minerals 13 00199 g001

3. Materials and Methods

A core sample from 4 different wells (G-A, G-B, G-C and G-D), which are located in the Cangdong Sag, contained the entire range of Ek2 shales. A total of 1015 samples in this study were collected from Ek2 semi-deep–deep lacustrine shales. These shale samples were analyzed using X-ray diffraction (XRD), total organic carbon (TOC) analysis, Rock-Eval pyrolysis, low-temperature nitrogen physisorption (LNP), mercury intrusion porosimetry (MIP), and multiple isothermal stage (MIS) pyrolysis.
X-ray diffraction (XRD) analyses were performed on 1015 samples in the State Key Laboratory of Heavy Oil Processing in China. Prior to experiments, samples were powdered to 200 mesh with an agate mortar. To collect the XRD data, an X’Pert PRO MPD with CuK α radiation (60 kV, 55 mA) and Ni filtering was used. Samples were scanned from 1° to 160° with 2θ angular ranges. After XRD testing, relative mineral percentages were estimated using a method developed by Pecharsky and Zavalij (2003) with MDI Jade 5.0 software [27]. The mineral compositions were identified via computer analysis of diffractograms, resulting in quantitative results of weight percentages for each mineral.
The total organic carbon (TOC) content was determined for 726 samples in the State Key Laboratory of Heavy Oil Processing in China using a Leco CS-744 carbon-sulfur analyzer on the powdered samples (100 mesh). The powdered samples were used to remove inorganic carbon via a treatment with 12.5% hydrochloric acid (HCL) and dried at 60–80 °C in a drying oven after being rinsed with deionized water and flushed through a filtration apparatus to neutrality. The powdered samples were then burnt with a high-temperature oxygen flow in the analyzer. The pyrolysis tests were analyzed in the State Key Laboratory of Heavy Oil Processing in China using a Rock-Eval 6 analyzer on the powdered samples (100 mesh). The powdered samples were heated at 300 °C for 3 min at a constant temperature to obtain the amount of free hydrocarbon that could be volatilized from the rock (S1), and then heated to 600 °C at a heating rate of 25 °C/min to obtain the amount of hydrocarbon produced by the cracking of organic matter in the rock (S2) and the temperature at which the maximum S2 yield is reached (Tmax). The hydrogen index (HI) was calculated using the ratios of S2 to TOC.
The vitrinite reflectance (Ro) measurements were carried out on 30 samples in the State Key Laboratory of Heavy Oil Processing in China. The sample was cut into cubes along the vertical plane direction, cured with epoxy resin, and then ground and polished with a Buehler EcoMet/AutoMet 250 Grinder-Polisher and alumina polishing slurry to obtain a polished section. The polishing surface was free of stains and scratches, and the boundaries between components were clear. When the sample was completely dry, the vitrinite reflectance was measured using a Leica DM4500P polarizing microscope with an MPV-I spectrophotometer at an ambient temperature of 23 °C and a relative humidity of 20%. In addition, the microscopic composition was identified using a microscope with an oil immersion lens and a blue fluorescence device.
Low-temperature nitrogen physisorption (LNP) tests were performed on 20 samples in the State Key Laboratory of Heavy Oil Processing in China using a Micromeritics ASAP 2460 Surface Area and Porosity Analyzer to characterize the pore structure in the shale samples. Samples were powdered to 35–80 mesh with an agate mortar. The powdered samples were oven-dried at 60 °C for at least 48 h to remove the moisture and volatile hydrocarbons, and then degassed under vacuum at an identical temperature of 60 °C for 24 h. Nitrogen physisorption isotherms were obtained at 77.3 K, with a relative pressure (P/P0) of nitrogen ranging from 0.002 to 0.993. According to the adsorbed quantity of nitrogen, the Brunauer–Emmett–Teller (BET) method can calculate the surface area of shale samples [28], and the Barrett–Joyner–Halenda (BJH) method can obtain the pore volume and pore size distribution characteristics [29]. After the test was completed, the sample was taken back for solvent extraction. The organic solvents were dichloromethane and methanol, and the extraction time was 14 d. The extracted samples were oven-dried and degassed again for the LNP tests.
Mercury intrusion porosimetry (MIP) tests were performed on 20 samples in the State Key Laboratory of Heavy Oil Processing in China using a mercury porosimeter (Micromeritics AutoPore IV 9520) to measure the pore structure characteristics of the shale samples. The rule of sample selection is that the same sample is cut into two cube-shaped samples (1 cm × 1 cm × 1 cm). One is extracted by a solvent (the method of solvent extraction is the same as in the LNP test), and the other is not. Before the MIP tests, all the shale samples were oven-dried at 60 °C for 48 h and then cooled to room temperature (about 23 °C) in a desiccator. Since mercury porosimetry relies on the strongly nonwetting behavior of mercury relative to other fluids, mercury will gradually occupy the pore space of the shales with a progressively increasing external pressure ranging from 5 psi (0.034 MPa) to 60,000 psi (413 MPa). The pore-throat size corresponding to external pressure was determined using the Washburn equation [30], and MIP measured pores ranging from 3 to 50 μm.
Multiple isothermal stages (MIS) pyrolysis tests were performed on 20 samples in the State Key Laboratory of Heavy Oil Processing in China using a Rock-Eval 7 analyzer on the powdered samples (100 mesh). The powdered samples were heated at 200 °C for 3 min at a constant temperature to obtain S1-1, thereafter to 350 °C for 3 min at a heating rate of 25 °C/min to obtain S1-2, then to 450 °C for 3 min at the same rate to obtain S2-1, and finally to 600 °C at the same rate for 1 min to obtain S2-2. The S1-1 peak represents the light hydrocarbon fractions (movable oil), the S1-2 peak represents the light-to-medium-molecular-weight oil fractions, the S2-1 peak primarily corresponds to heavier hydrocarbons and polar compounds (adsorbed oil), and the S2-2 peak stands for the thermal decomposition products of kerogen (residual hydrocarbon generation potential). The sum of S1-1 + S1-2 represents free oil, and the total residual oil amount within the shales is the sum of S1-1 + S1-2 + S2-1.

4. Results

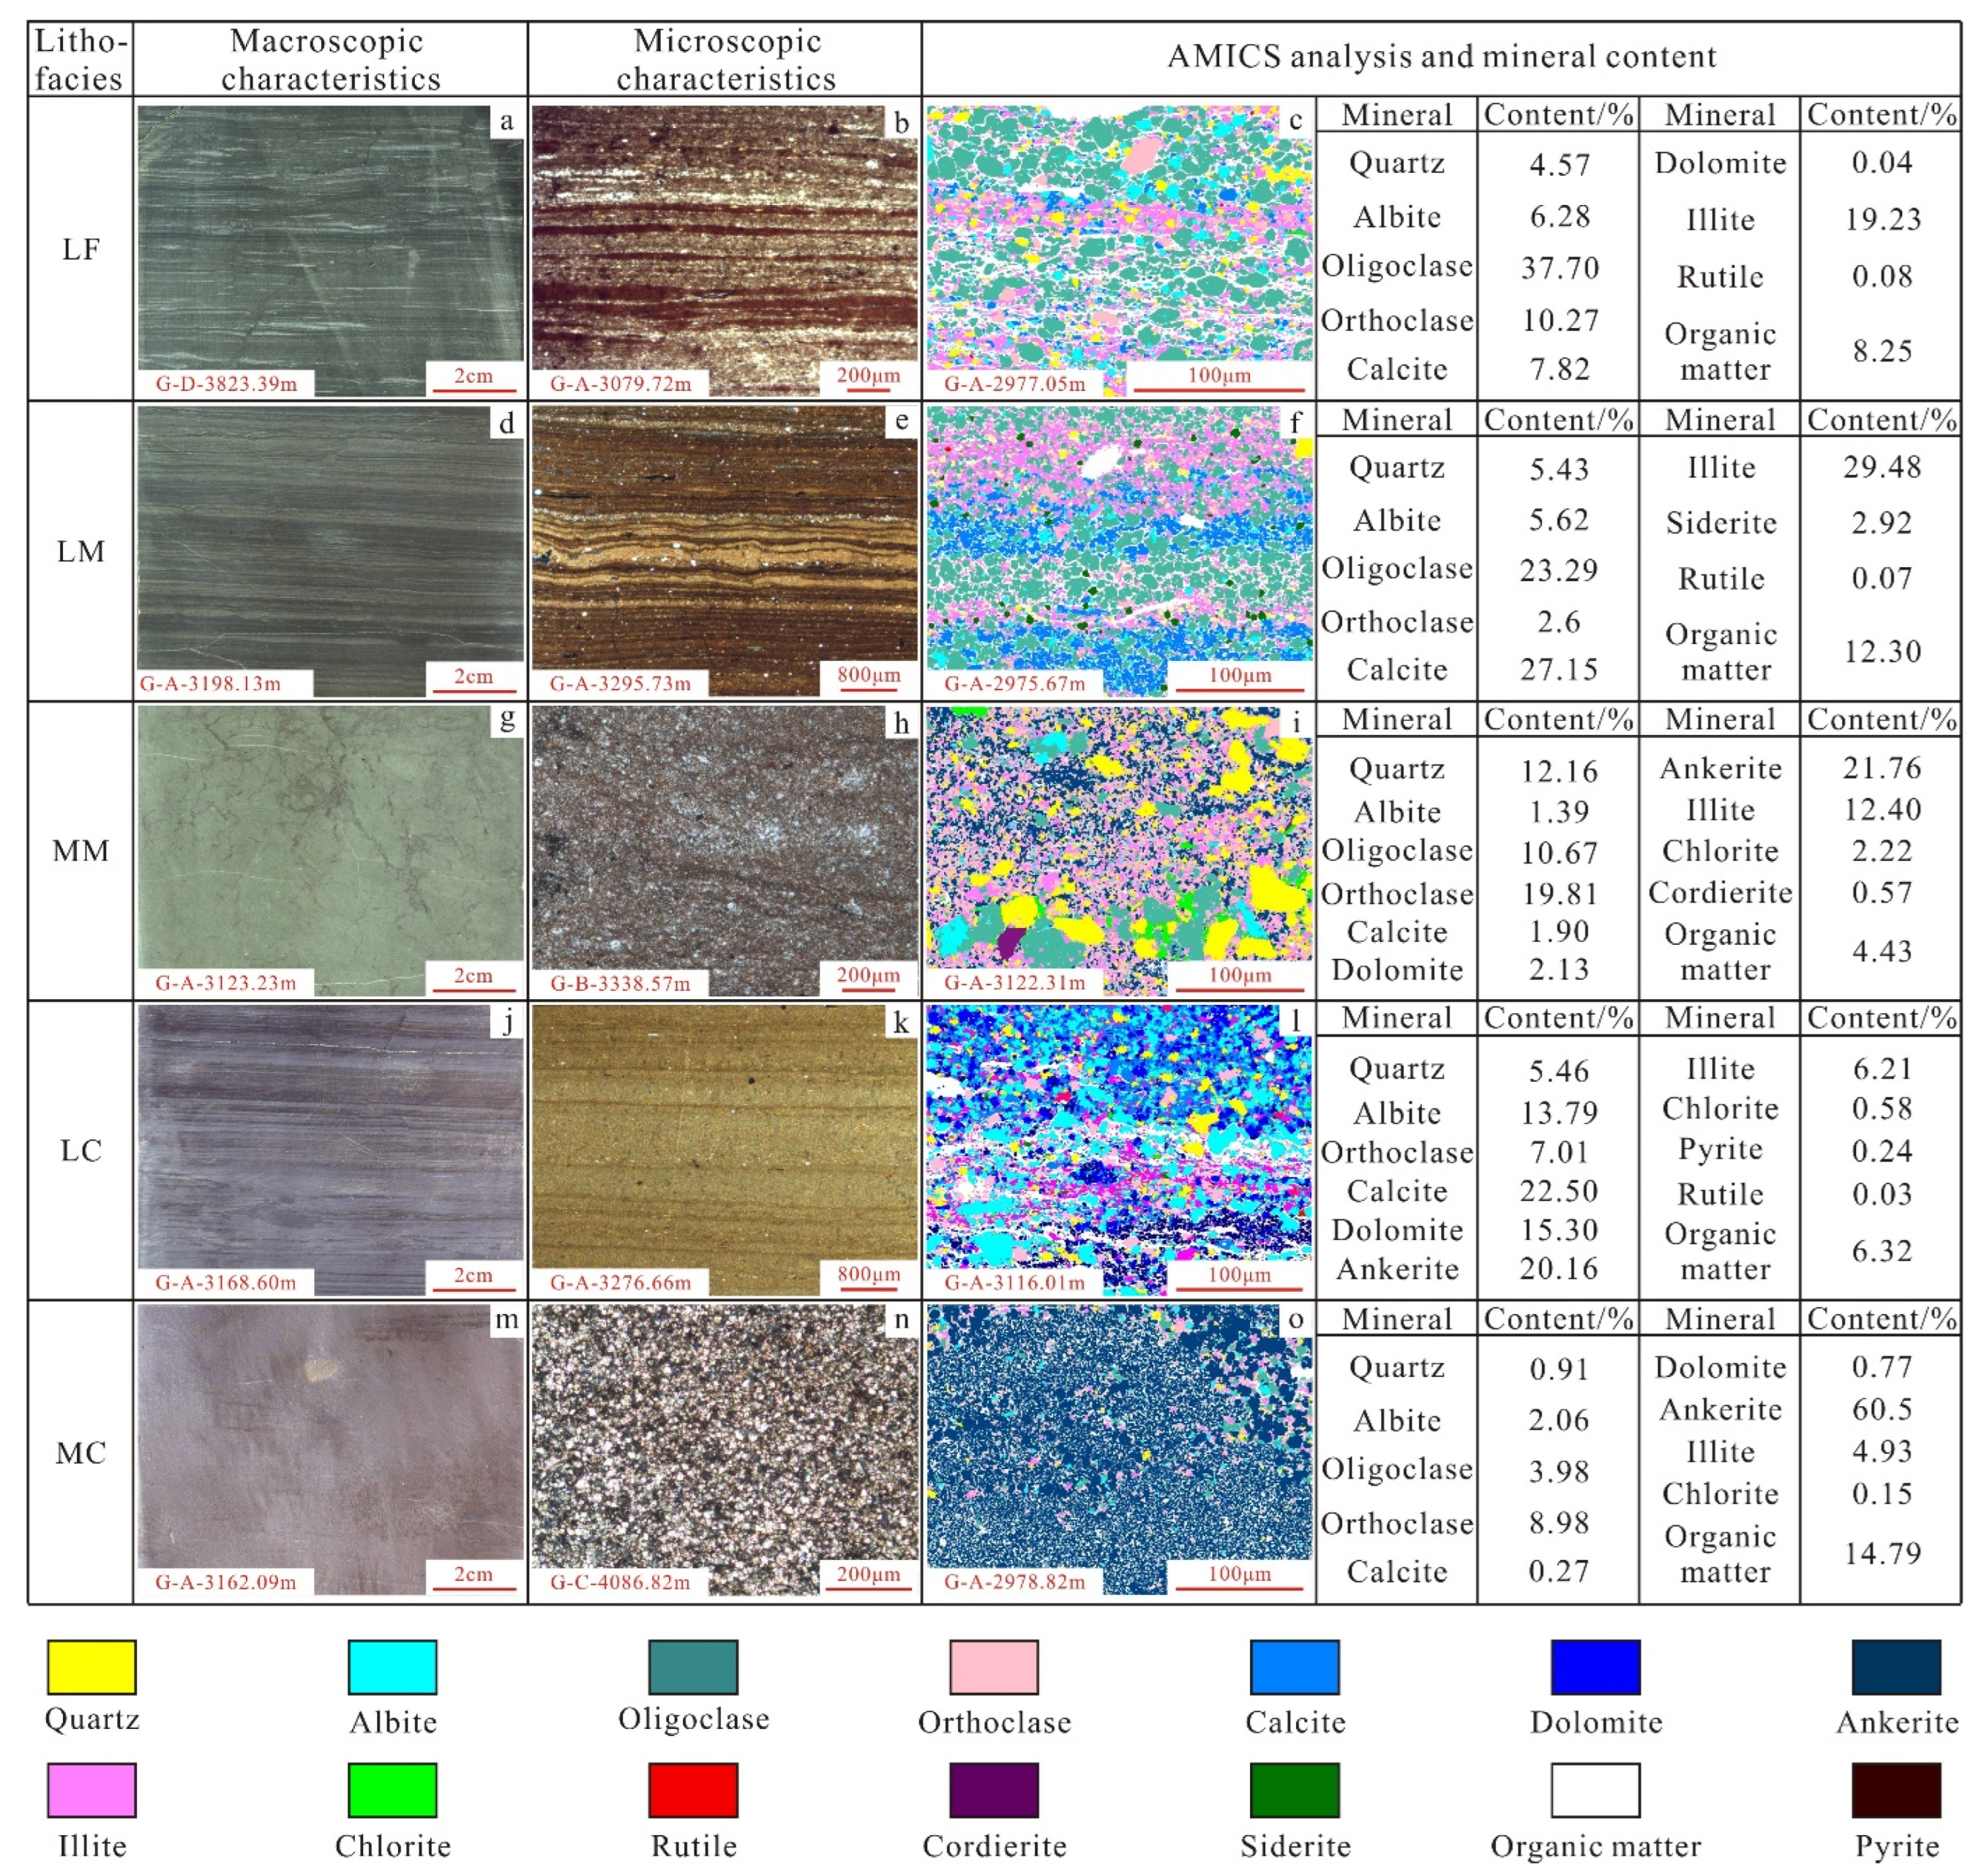
4.1. Mineralogy and Petrology

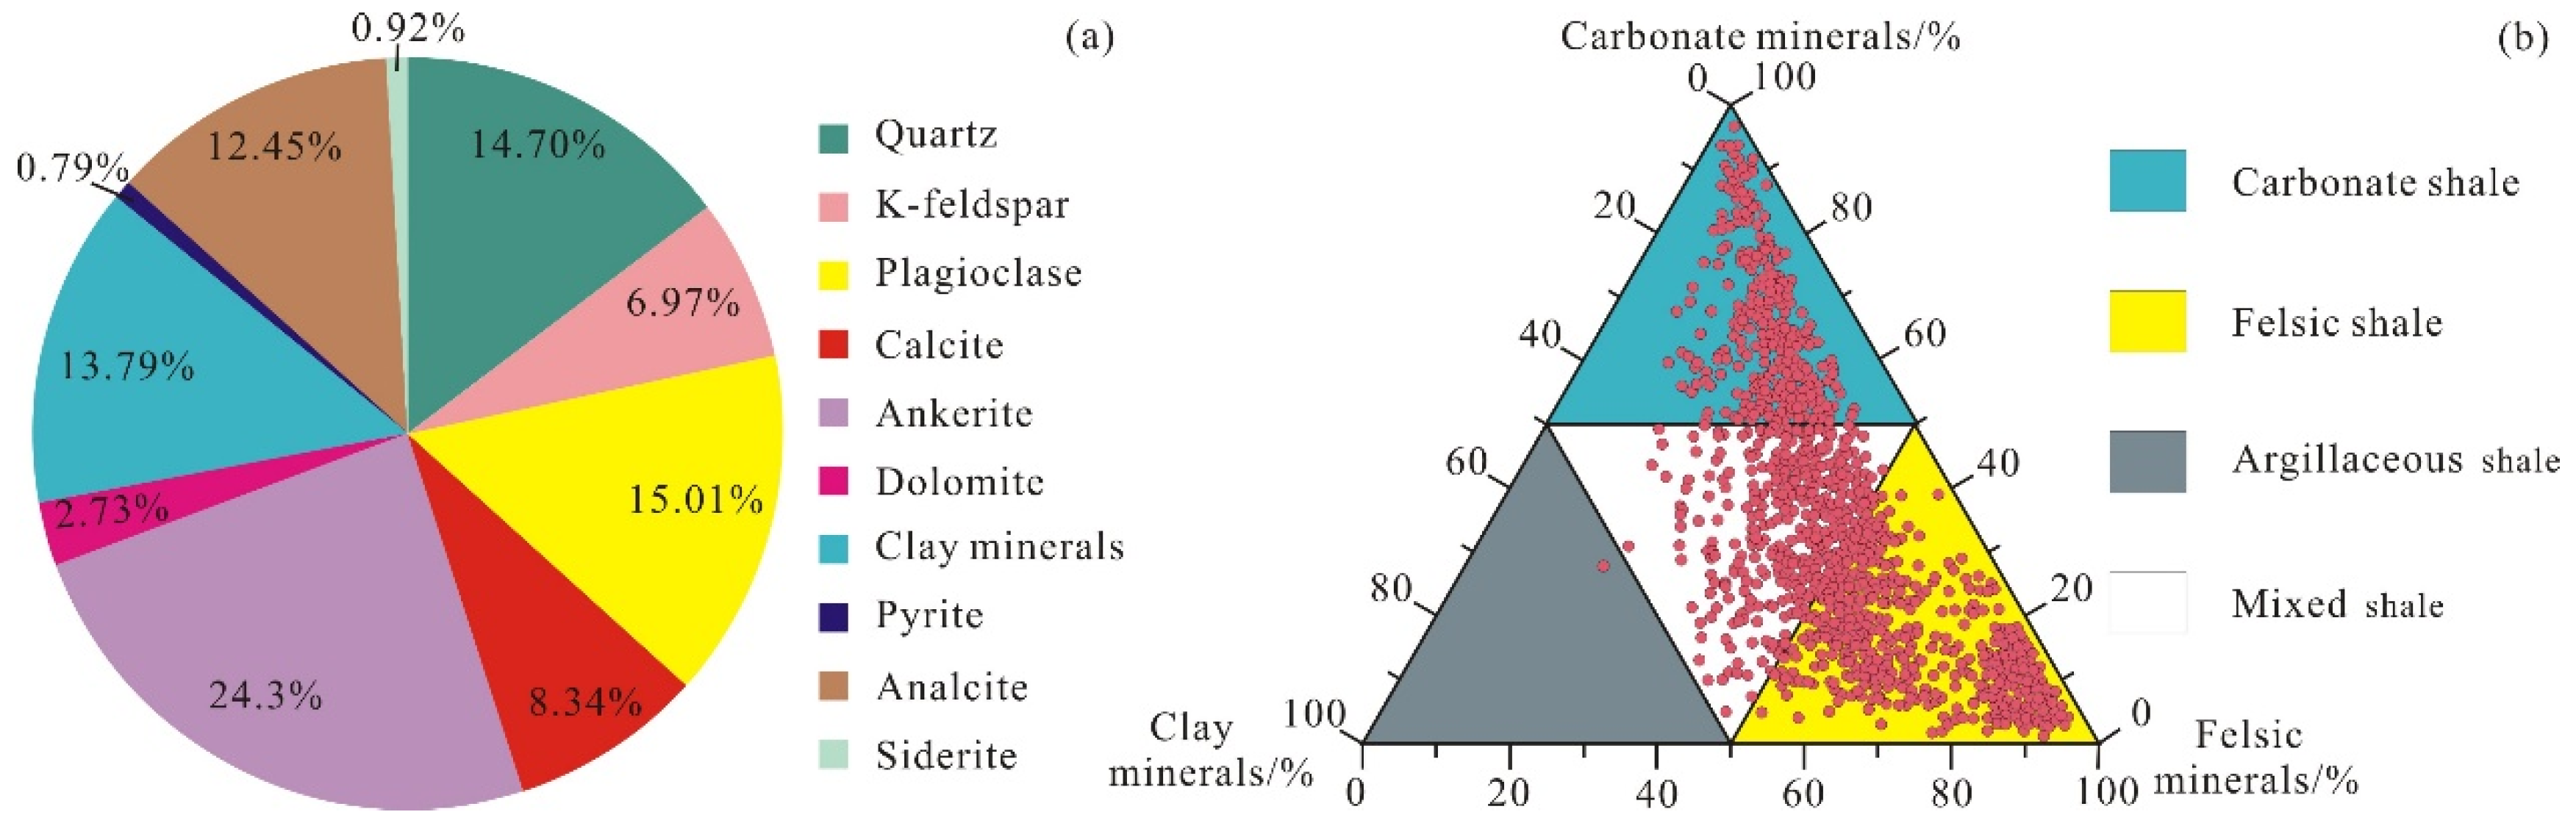
4.1.1. Mineral Composition

Due to the small particle size and complex composition of shale, it is difficult to accurately identify mineral types and calculate mineral content using core observation and thin section identification [31,32,33,34,35]. XRD analysis and thin section identification show that the mineral composition of the Ek2 shale in the Cangdong Sag, mainly including quartz, K-feldspar, plagioclase, ankerite, calcite, and clay minerals, as well as a small amount of analcite, and pyrite is diverse. The content of felsic minerals, mainly composed of quartz and plagioclase, but also K-feldspar, ranges from 1% to 92%, with an average of 36.68% (1015 samples). The content of carbonate minerals, mainly composed of dolomite and ankerite, but also calcite and siderite, ranges from 0% to 95%, with an average of 35.37% (1015 samples). The content of clay minerals, mainly composed of illite and illite/smectite mixed layers, ranges from 1% to 43.8%, with an average of 13.79% (1015 samples). These findings show that the mineral composition of the Ek2 shales is characterized by a high amount of brittle minerals, a low amount of clay minerals, and no absolute dominant mineral (Figure 4a).

4.1.2. Sedimentary Structures

The sedimentary structure refers to the general characteristics of the spatial distribution and arrangement of the components of sedimentary rocks, which can directly reflect the hydrodynamic conditions and deposition mechanisms during the sedimentary period and provide an effective basis for distinguishing shale lithofacies [36,37,38]. In previous studies, lacustrine shale sedimentary structures were mostly divided into laminated (a single layer thickness less than 1 mm), layered (a single layer thickness greater than 1 mm), and massive (no laminar development) [23]. However, thin section identification, two-dimensional X-ray fluorescence spectroscopy (2D-XRF) analysis, and advanced mineral identification and characterization system (AMICS) analysis show that the layered structure observed in the core still has obvious laminar development at the micro scale. Therefore, the sedimentary structures of the Ek2 shales in the Cangdong Sag are divided into laminated and massive structures. The laminated structure is widely developed in the study area. According to the mineral composition, the laminae can be divided into felsic, carbonate, clay, organic matter, and composite laminae. Different types of laminae have obvious differences in thickness, continuity, and contact relationship. The results of 2D-XRF analysis and continuous thin section identification show that the cumulative laminar thickness/core length ratio can reach more than 70%, and the lamina quantity/core length ratio can reach up to 11,000 layers/m [4]. The massive structure is characterized by internal laminae that are not developed, which are generally formed by the uniform or messy mixing of one or more minerals.

4.1.3. Lithofacies

Color, sedimentary environment, textural variation, mineral composition, organic carbon content, and sedimentary and biogenic features (e.g., lamination, banding) can be used as the basis for shale lithofacies classification in different areas or horizons. Mineral composition, sedimentary structures, and TOC content are the most commonly used parameters [39,40,41]. Mineral composition and sedimentary structures are suitable for lithofacies analysis, as they can directly represent the diversity of rocks and reflect information such as provenance input intensity and hydrodynamic conditions [42]. TOC content was not selected as the basis for the division in this study, because even in the same lithofacies, there were great differences in TOC content between different samples under the influence of lacustrine productivity and later preservation conditions. In addition, the TOC content of the Ek2 shales in the Cangdong Sag was high (most are >2%). Therefore, lithofacies division of the Ek2 shales was carried out using mineral compositions and structural characteristics. According to the analysis of mineral composition, felsis minerals, carbonate minerals, and clay minerals were selected as the three end-members, with 50% of the end-member mineral content as the boundary. Four lithotypes were identified in the Ek2, including felsic shales, carbonate shales, mixed shales and argillaceous shales. These results show that the Ek2 shales in the Cangdong Sag are composed of felsic shales, carbonate shales, and mixed shales, while argillaceous shales have rarely developed (Figure 4b). Combined with the sedimentary structures, the Ek2 shales in the Cangdong Sag can be further divided into six lithofacies types: laminated felsic shales, massive felsic shales, laminated mixed shales, massive mixed shales, laminated carbonate shales and massive carbonate shales (Figure 5). Since the massive felsic shales have rarely developed in the study area, they are not discussed in this study.

4.2. Oil-Bearing Properties and Occurrence form Characteristics

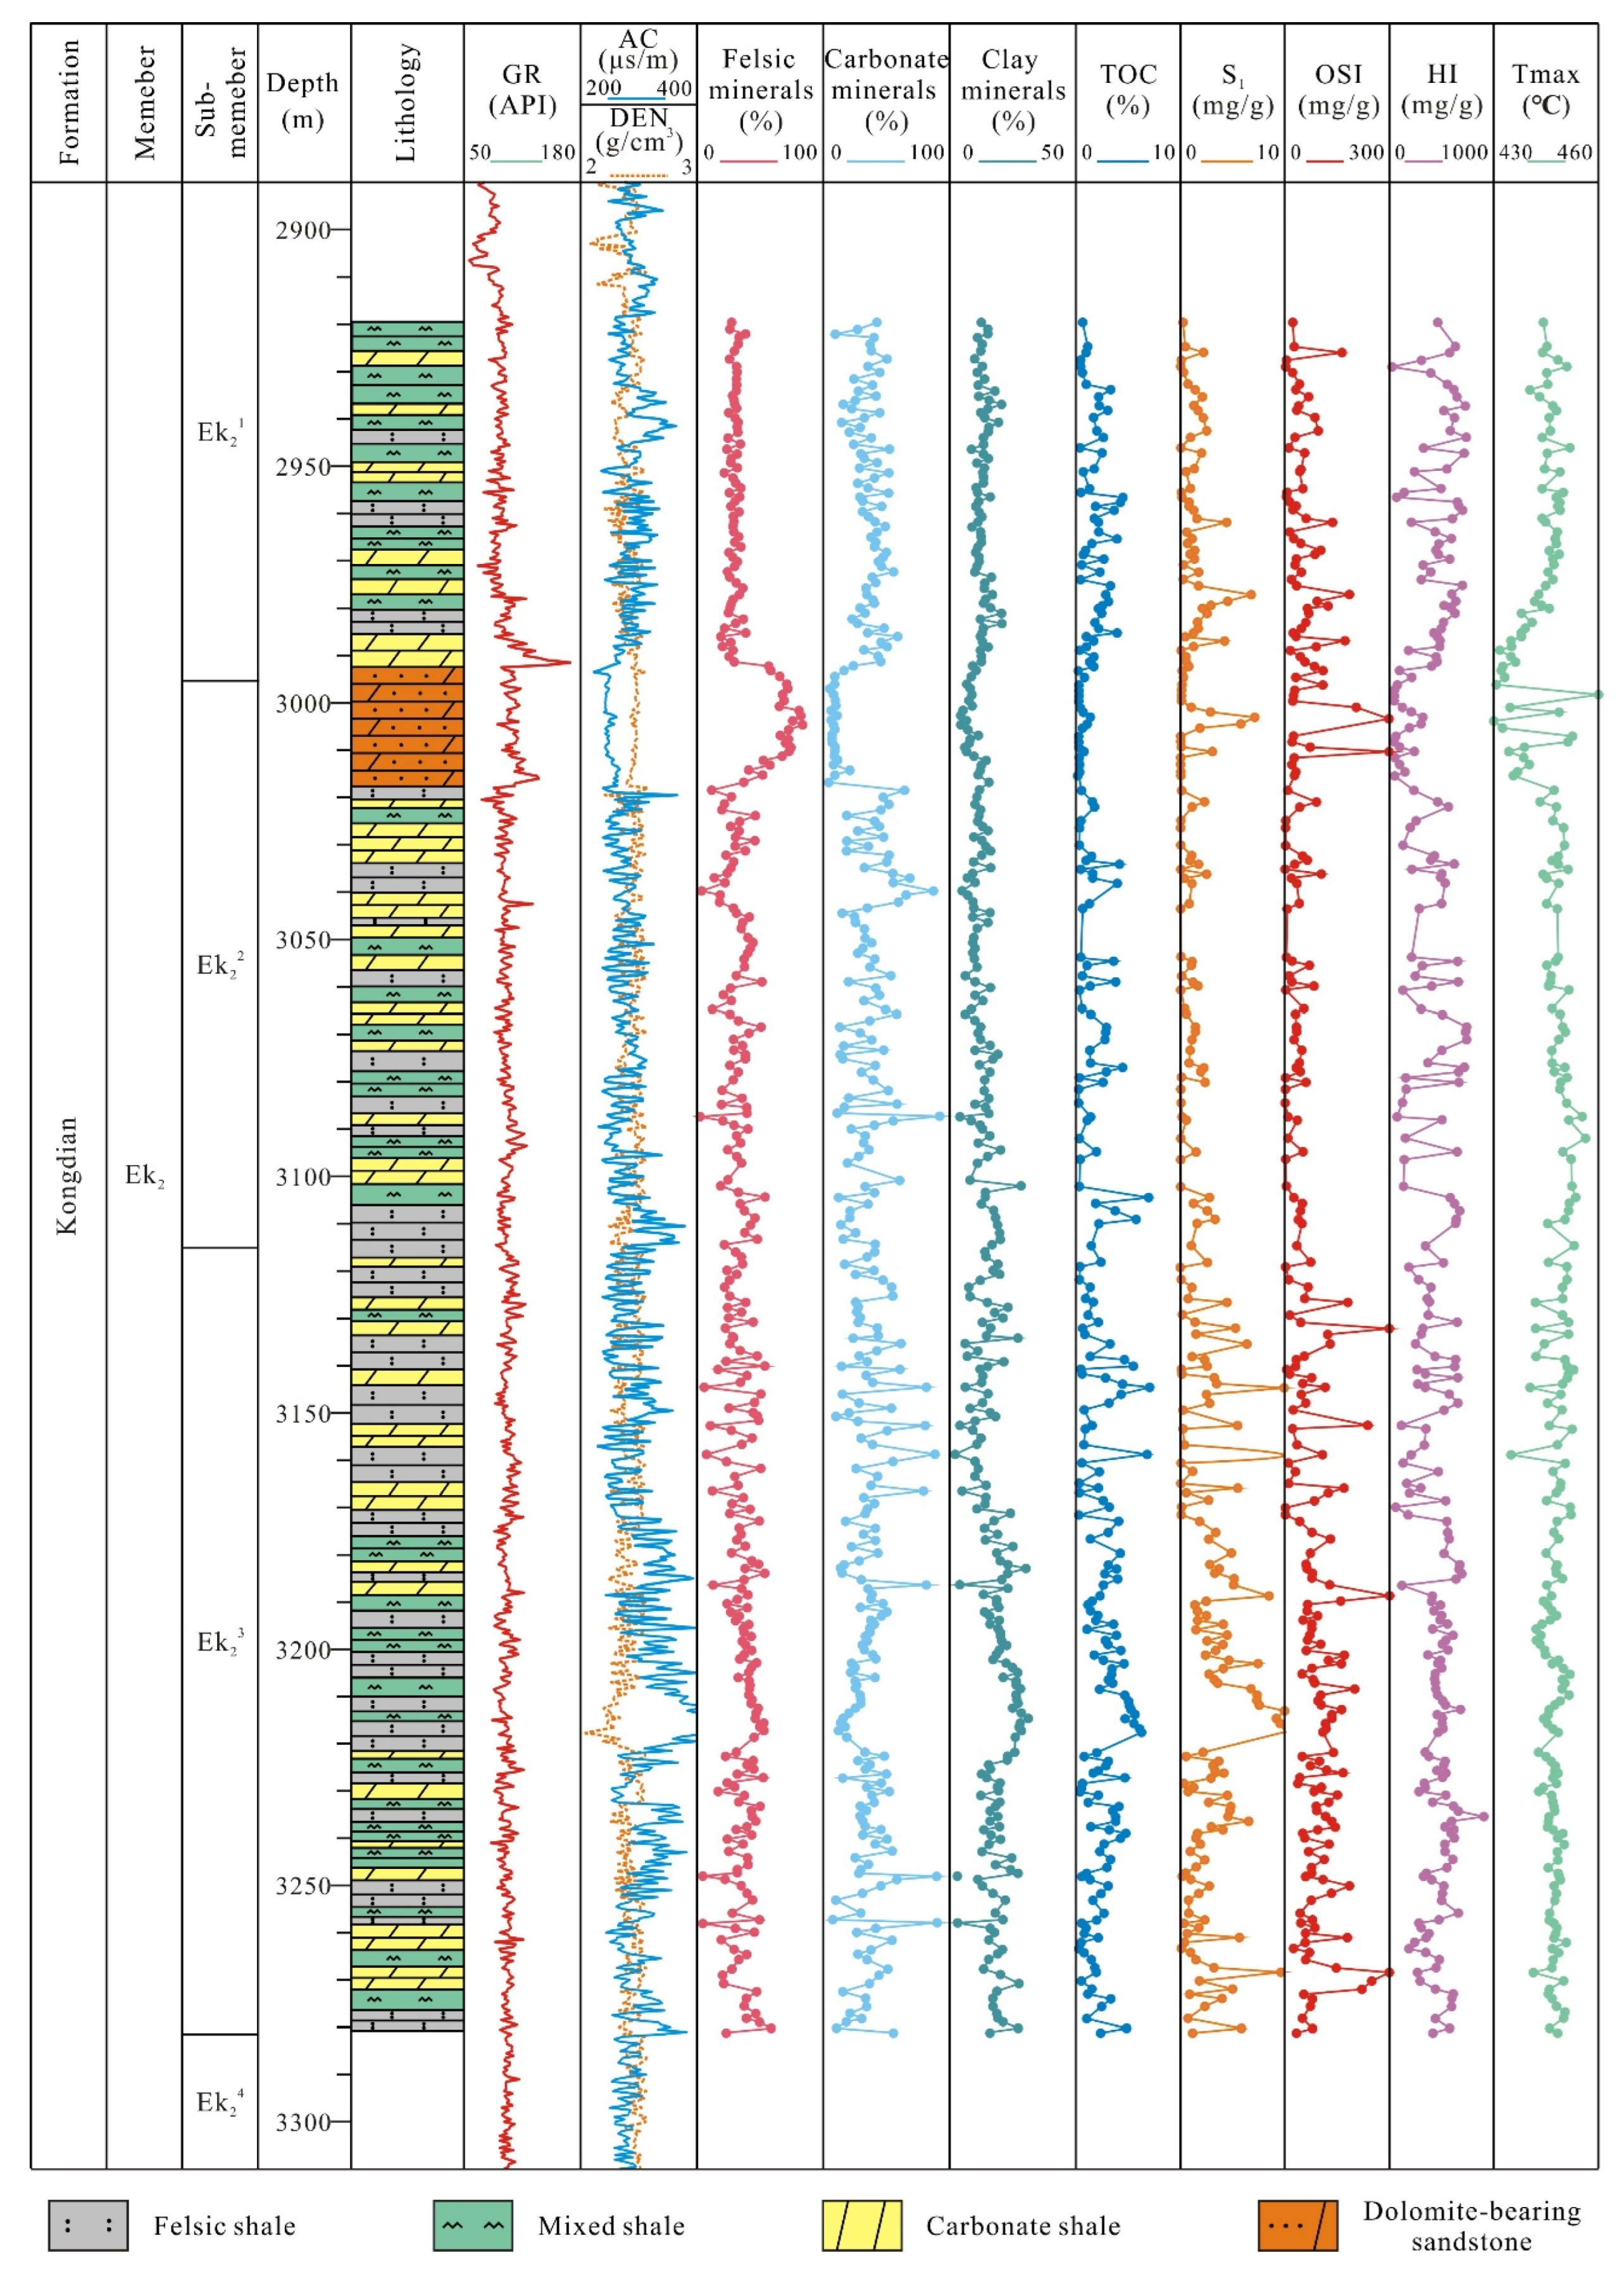
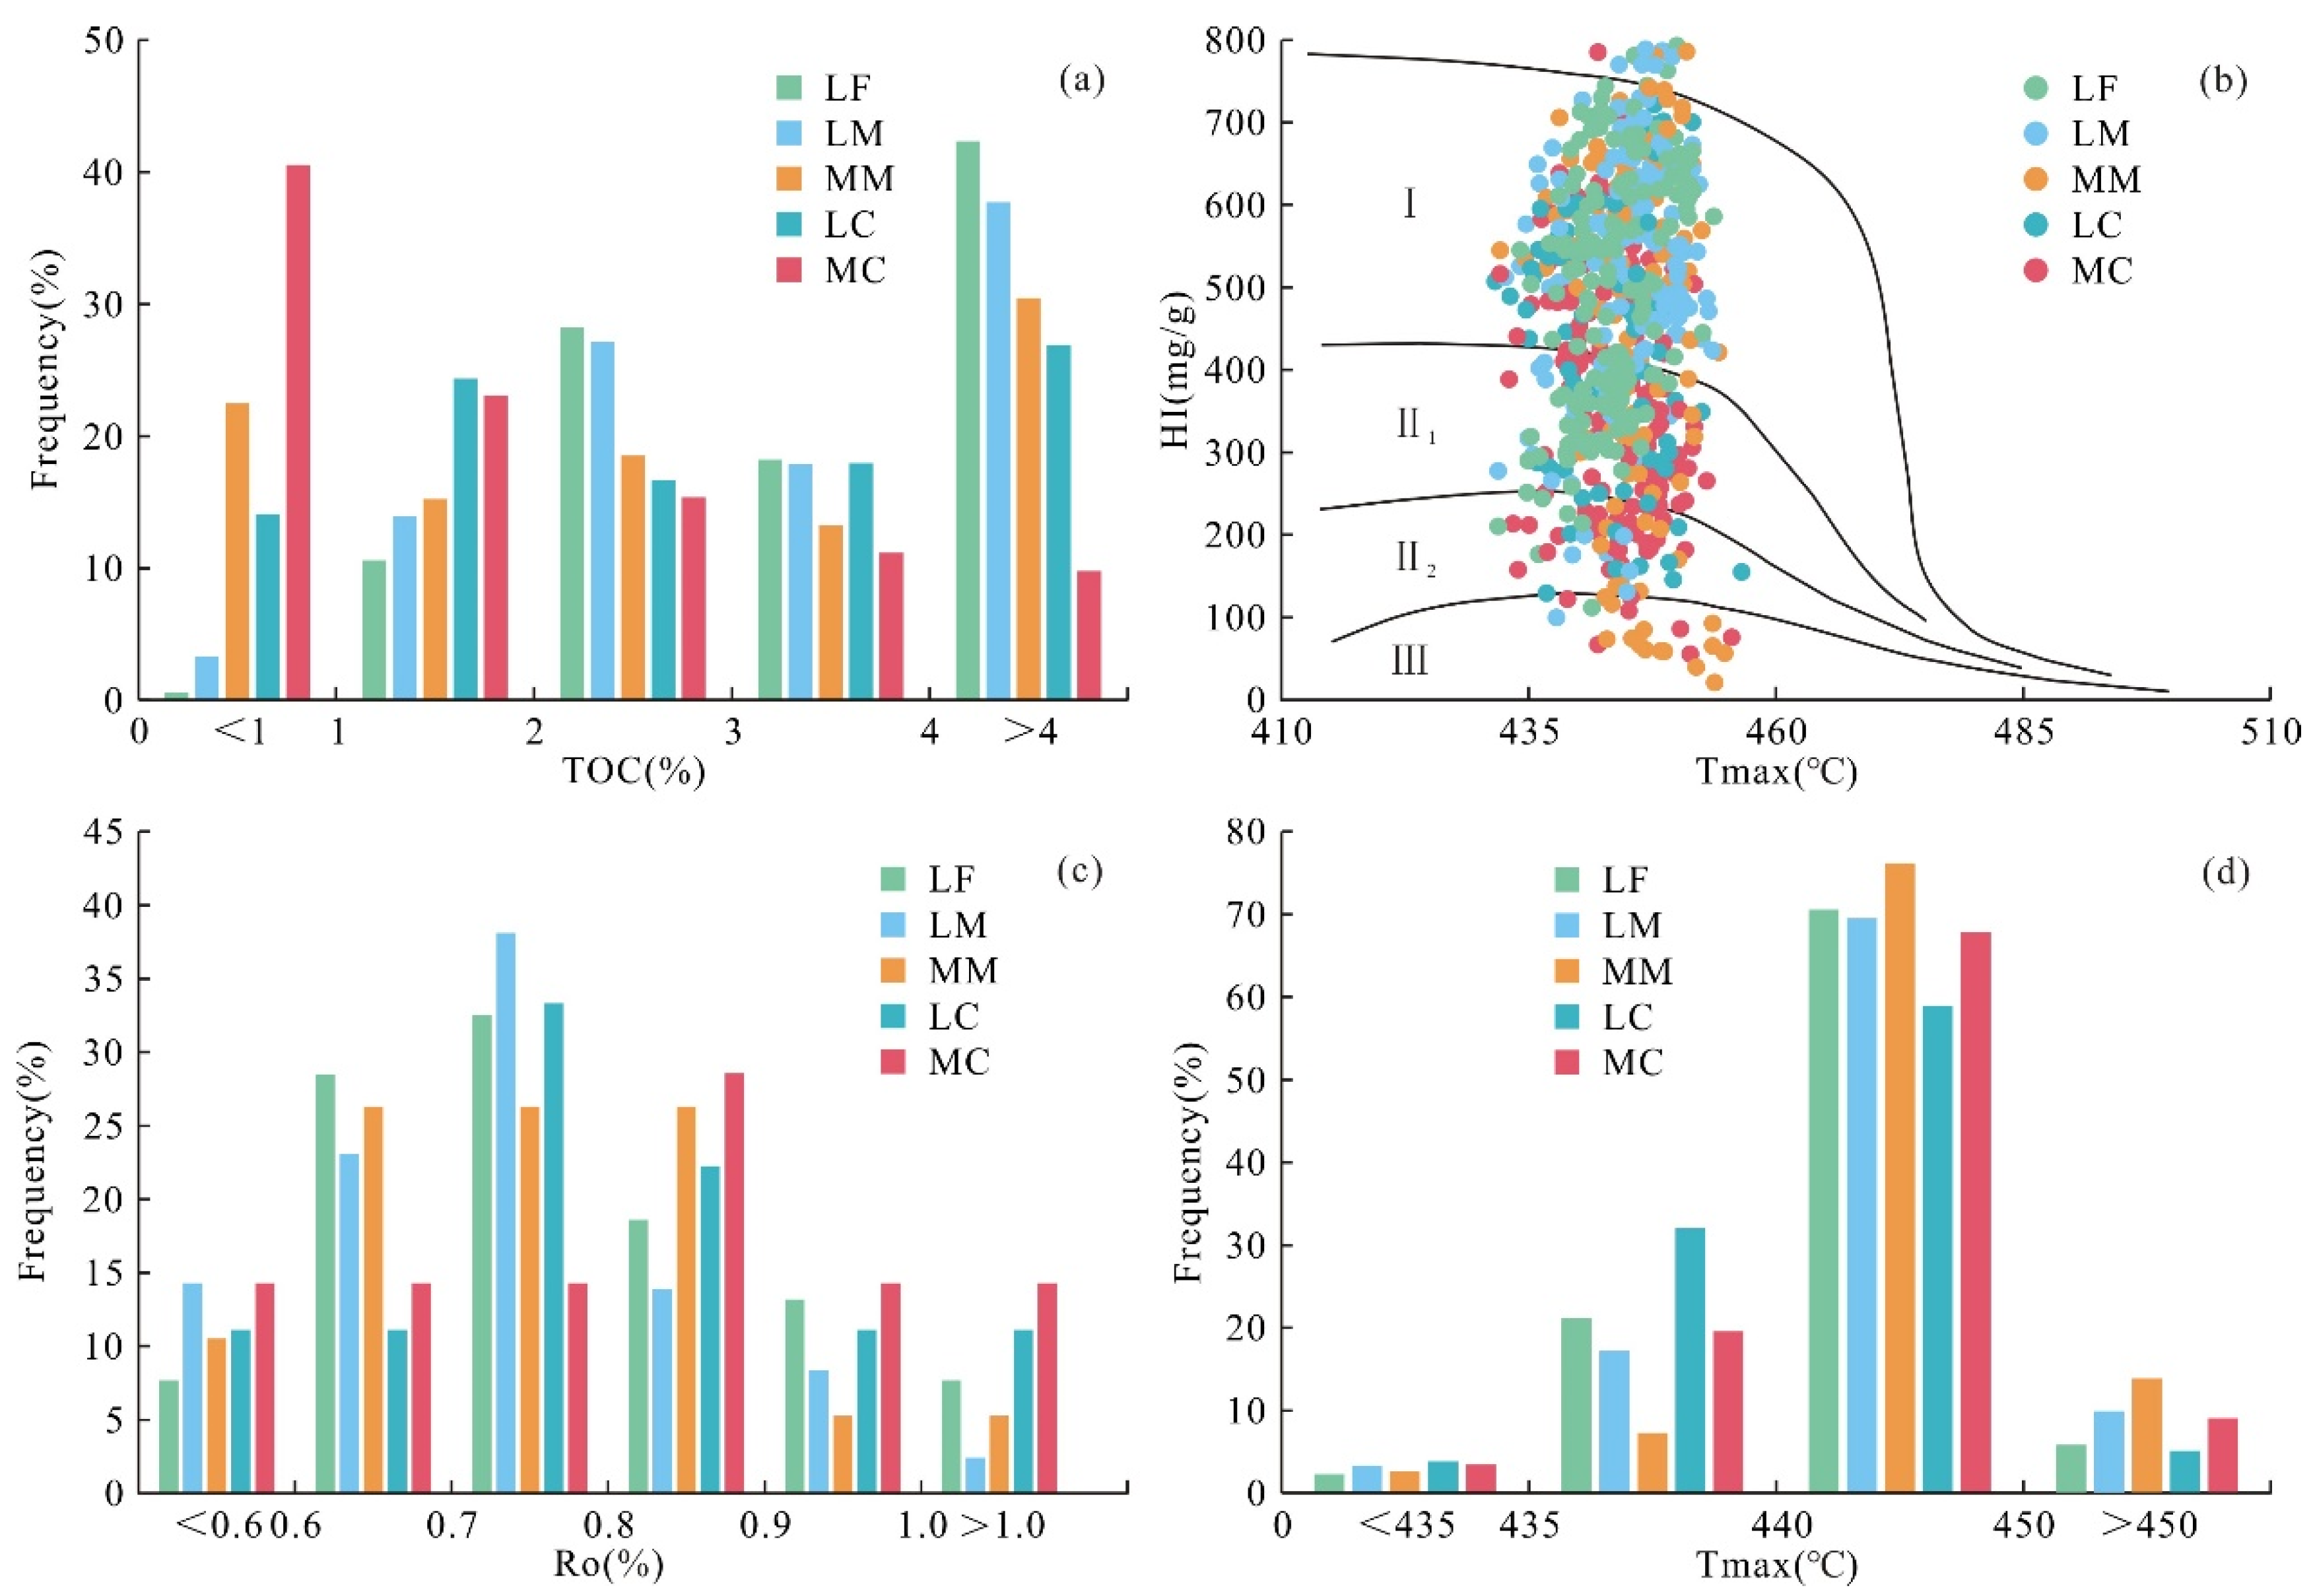
4.2.1. Organic Geochemical Characteristics

Organic matter plays an important role in the formation and evolution of shale oil; as a part of rock components, it is an important carrier of pore development and shale oil occurrence. In addition, organic matter is the material basis of shale oil formation, and its content determines the resource potential of shale oil [24]. Therefore, this study summarizes the basic organic geochemical characteristics of the Ek2 shales in the Cangdong Sag from the abundance, type, and thermal maturity of organic matter. The Ek2 shales are characterized by a high organic matter abundance, and the TOC content values are distributed between 0.12 and 13.09%, with an average of 3.65%. The TOC content in different lithofacies shows great differences. The TOC content values of laminated felsic shales, laminated mixed shales, massive mixed shales, laminated carbonate shales, and massive carbonate shales are distributed between 0.85 and 13.09% (avg. 4.74%), between 0.53 and 10.86% (avg. 4.51%), between 0.12 and 12.47% (avg. 2.96%), between 0.47 and 9.99% (avg. 2.94%), and between 0.16 and 10.64% (avg. 1.96%), respectively (Table 1). The organic matter abundance of laminated felsic shales and laminated mixed shales is similar, but slightly lower in other lithofacies types. In addition, except for massive carbonate shale, the other lithofacies are mainly distributed in a range greater than 2% (Figure 6a).
Based on the cross-plot of HI (hydrogen index) versus Tmax (pyrolysis peak temperature), the maturity and distribution of sedimentary organic matter types could be determined [43,44,45]. The kerogen of Ek2 in the Cangdong Sag is mainly Type I and II1, and the proportion of Type II2 and III is relatively low. There are also some differences in kerogen types between different lithofacies, which shows that the proportion of Type II2 and III kerogen in massive shale is relatively higher than that of laminated shale (Figure 6b). The identification of maceral shows that the maceral of the Ek2 shales is mainly composed of sapropelite and vitrinite, followed by exinite and inertinite. The vitrinite reflectance (Ro) values of the Ek2 shales in the Cangdong Sag are distributed between 0.51 and 1.21%, with an average of 0.75%, mainly between 0.70% and 0.90% (Table 1; Figure 6c). The Tmax values of the Ek2 shales in the Cangdong Sag are distributed between 431.60 and 456.50 °C, with an average of 444.14 °C, mainly between 440 °C and 450 °C (Table 1; Figure 6d). These findings show that there is no significant difference in the Ro and Tmax values between different lithofacies, indicating that the Ek2 shales are in the mature stage and have entered the oil window [46].

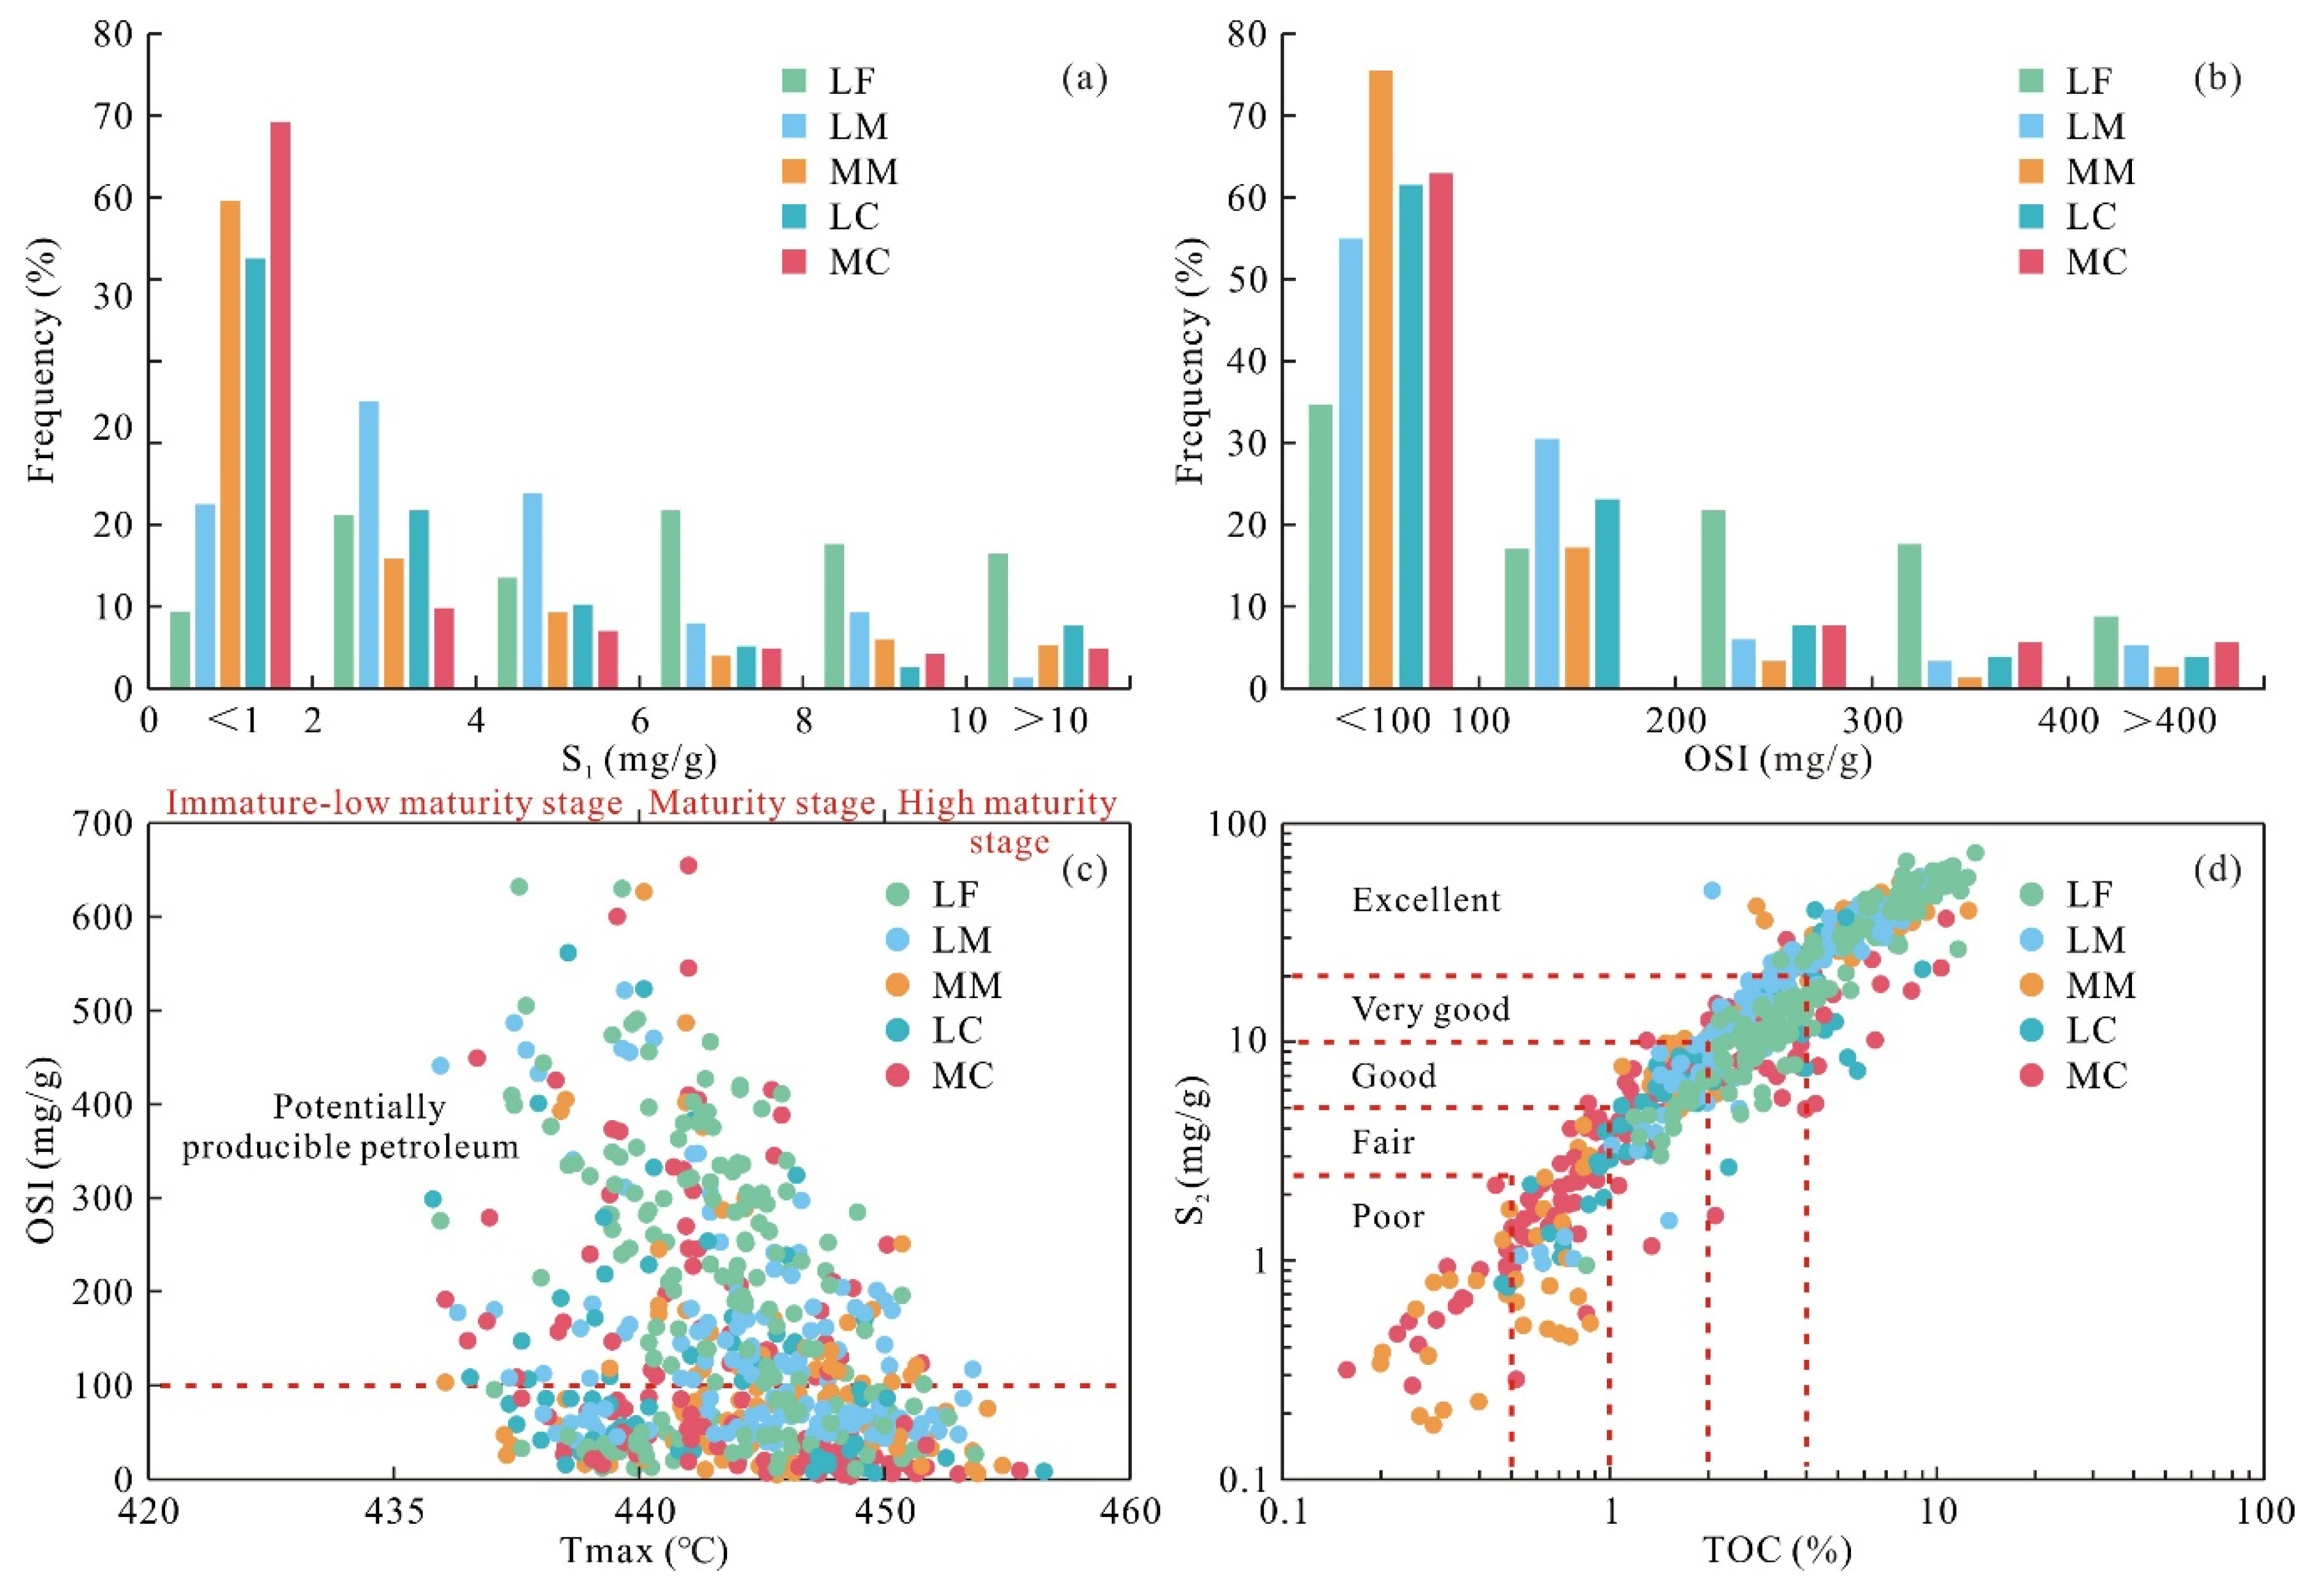
4.2.2. Oil-Bearing Characteristics

The oil-bearing properties of shale can be characterized by the organic geochemical method and the core physical method. The former is the most practical method for oil-bearing property characterization because it is fast and economical, and it is difficult to miss hydrocarbons in unconnected closed pores. The organic geochemical method mainly involves measuring the content of chloroform asphalt “A” and S1 in shales, but they need to be compensated and corrected due to the influence of sample storage conditions and testing techniques [47,48]. Jarvie et al. (2007) proposed that the oil saturation index (characterized by S1 × 100/TOC, simplified as OSI) can characterize the oil-bearing properties of shale, where an OSI of >100mg/g indicates that the shale has oil production potential and can be combined with Tmax values to evaluate the oil-bearing level of shales [49]. Several groups of pyrolysis experiments were carried out using the closed coring samples of the Ek2 shales in the Cangdong Sag by Zhao et al. (2021). Light hydrocarbons were recovered by comparing the experimental results under different experimental conditions, and the correction coefficient of light hydrocarbon was calculated to be 2.1 [25]. In this study, the oil-bearing characteristics of the Ek2 shales in the Cangdong Sag were evaluated using the S1 and OSI values (Table 1).
Previous studies have proposed that higher S1 values indicate that the shales have better oil-bearing properties [50,51]. The S1 values of the Ek2 shales in the Cangdong Sag are distributed between 0.02 and 18.03 mg/g, with an average of 4.04 mg/g. There are differences in S1 values in different lithofacies. The variations in S1 values from laminated felsic shales, laminated mixed shales, massive mixed shales, laminated carbonate shales, and massive carbonate shales are 0.17–17.99 mg/g (avg. 6.64 mg/g), 0.38–11.69 mg/g (avg. 4.03 mg/g), 0.02–16.28 mg/g (avg. 2.81 mg/g), 0.03–11.38 mg/g (avg. 3.05 mg/g), and 0.02–18.03 mg/g (avg. 2.44 mg/g), respectively (Table 1; Figure 7a). The OSI values of the Ek2 shales in the Cangdong Sag range from 3.62 to 654.93 mg/g, with an average of 132.38 mg/g. The variations in OSI values from laminated felsic shales, laminated mixed shales, massive mixed shales, laminated carbonate shales and massive carbonate shales are 11.01–632.10 mg/g (avg. 198.10 mg/g), 8.48–522.00 mg/g (avg. 128.08 mg/g), 5.25–627.13 mg/g (avg. 86.53 mg/g), 3.78–562.06 mg/g (avg. 111.05 mg/g), and 3.62–654.93 mg/g (avg. 115.95 mg/g), respectively (Table 1; Figure 7b).
Based on the diagram of OSI versus Tmax, the oil-bearing level of the Ek2 shales in the Cangdong Sag could be evaluated [2]. Figure 7c shows that the overall oil-bearing properties of the Cangdong Sag are good, and the proportion of samples with shale oil production potential is 45%. The samples with shale oil production potential in laminated felsic shales account for 65.29% of the total laminated felsic shale samples, and the proportions of laminated mixed shales, massive mixed shales, laminated carbonate shales, and massive carbonate shales with shale oil production potential are 45.03%, 24.50%, 38.46% and 37.06%, respectively (Figure 7c). A diagram of S2 versus TOC is often used to evaluate the hydrocarbon generation potential of source rocks, which can be classified as having poor, fair, good, very good, or excellent quality [52]. The diagram reveals that most of the shale samples have good to excellent hydrocarbon generation potential (Figure 7d). Among such samples, the proportion with very good to excellent hydrocarbon generation potential is 57.30%. The samples with very good to excellent hydrocarbon generation potential in laminated felsic shales account for 75.59% of all laminated felsic shale samples, and the proportions of samples with this amount of potential in laminated mixed shales, massive mixed shales, laminated carbonate shales and massive carbonate shales are 75.50%, 56.95%, 51.28% and 22.38%, respectively. The results show that the laminated felsic shales and laminated mixed shales are characterized by good oil-bearing properties with higher S1 and OSI values.

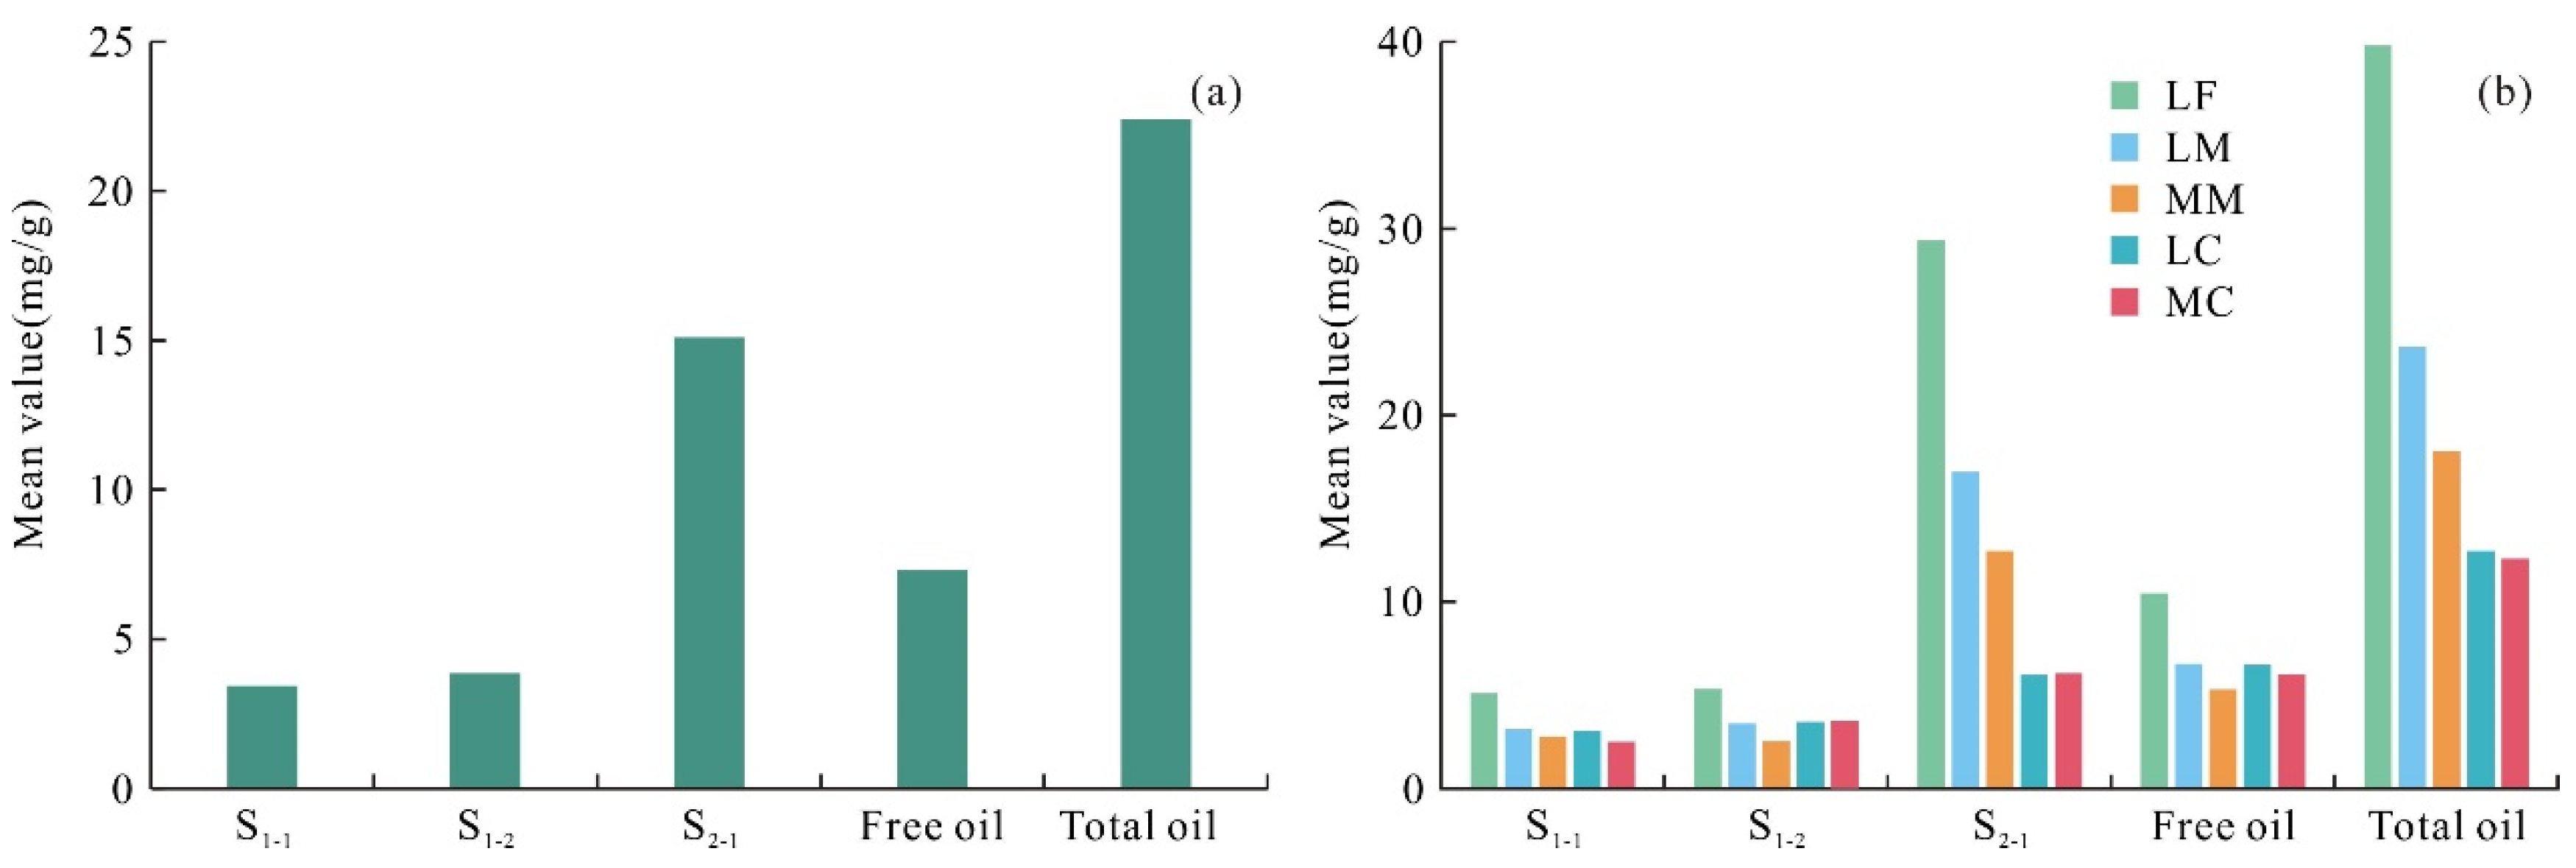
4.2.3. Quantitative Characterization of Shale Oil in Different Occurrence States

The residual oil content is the material basis for determining whether shale intervals have shale oil exploration potential. Larter et al. (2012) inferred that the migration mode of residual oil in organic matter mainly depends on diffusion rather than Darcy seepage [53]. Even in the case of artificial fracturing, the effect on production capacity is very small, which indicates that the residual oil in organic matter with an adsorption-intermiscibility state is difficult to effectively produce, regardless of the techniques applied. Therefore, the key to evaluating the sweet spots and effective resources of shale intervals is to clarify the free oil content. MIS pyrolysis can more effectively separate free oil from adsorbed oil by improving the heating process, and can characterize the light hydrocarbon fraction (S1-1), which is theoretically the easiest to exploit and beneficial for evaluating the mobility of shale oil [54,55]. In order to ensure the accuracy of the data, and to be more in line with actual exploration, this study carried out a quantitative characterization of shale oil in different occurrence states based on the MIS pyrolysis results and combined it with the aforementioned light hydrocarbon correction results.
The results of multi-temperature pyrolysis analysis of the Ek2 shale samples show that the residual oil content values (S1-1 + S1-2 + S2-1) are distributed between 0.84 and 61.91 mg/g, with an average of 23.20 mg/g. The variations in S1-1, S1-2, S1-1 + S1-2, and S2-1 values are 0.03–10.09 mg/g (avg. 3.23 mg/g), 0.23–10.17 mg/g (avg. 3.69 mg/g), 0.46–20.26 mg/g (avg. 6.92 mg/g), and 0.28–47.31 mg/g (avg. 16.28 mg/g), respectively. The proportions of S1-1, S1-2, S1-1 + S1-2, and S2-1 values to the residual oil content values are 2.56%–42.21% (avg. 16.27%), 3.67–58.43% (avg. 22.34%), 6.66%–72.27% (avg. 38.60%), and 27.73%–93.34% (avg. 61.40%), respectively (Table 1; Figure 8a). It can be seen that the residual oil is mainly composed of adsorbed oil, which is similar to the Ordos Basin and other areas of the Bohai Bay Basin in China [55,56]. Free oil is exploitable under current technical conditions, and S1-1 is the easiest to exploit in the shales. The statistical analysis shows that the average values of S1-1 are 2.91, 2.33, and 1.9 mg/g from Well N-1 of the Dongying Sag in the Bohai Bay Basin, Well B-1 in the Ordos Basin, and Well W-7 of the Qianjiang Sag in the Jianghan Basin, respectively. It can be seen that the S1-1 values of the Ek2 shales in the Cangdong Sag are higher than those in the above areas, and the free oil content is also highest in the Cangdong Sag [55,56,57,58].
On this basis, the shale oil content values of each lithofacies in different occurrence states were compared and analyzed. The movable oil and free oil are obviously dominant in laminated felsic shales and laminated mixed shales. The variations in S1-1, S1-2, and S1-1 + S1-2 values from laminated felsic shales are 1.29–10.09 mg/g (avg. 5.12 mg/g), 1.58–10.17 mg/g (avg. 5.34 mg/g), and 2.87–20.26 mg/g (avg. 10.46 mg/g), respectively. The variations in S1-1, S1-2, and S1-1 + S1-2 values from laminated mixed shales are 0.46–6.53 mg/g (avg. 3.44 mg/g), 0.91–7.14 mg/g (avg. 4.02 mg/g), and 1.37–13.67 mg/g (avg. 7.46 mg/g), respectively. The results of other lithofacies are shown in Table 1 and Figure 8b.
In summary, analyzing the oil-bearing properties and shale oil content in different occurrence states of Ek2 in the Cangdong Sag showed that the Ek2 shales have moderate thermal maturity, are in an oil generation stage, and have good to excellent hydrocarbon generation potential. The laminated felsic shales (LF) typically have the highest TOC, S1, OSI, and free oil content, followed by the laminated mixed shales (LM), while the other three types of lithofacies, i.e., massive mixed shales (MM), laminated carbonate shales (LC), and massive carbonate shales (MC), are relatively poor.

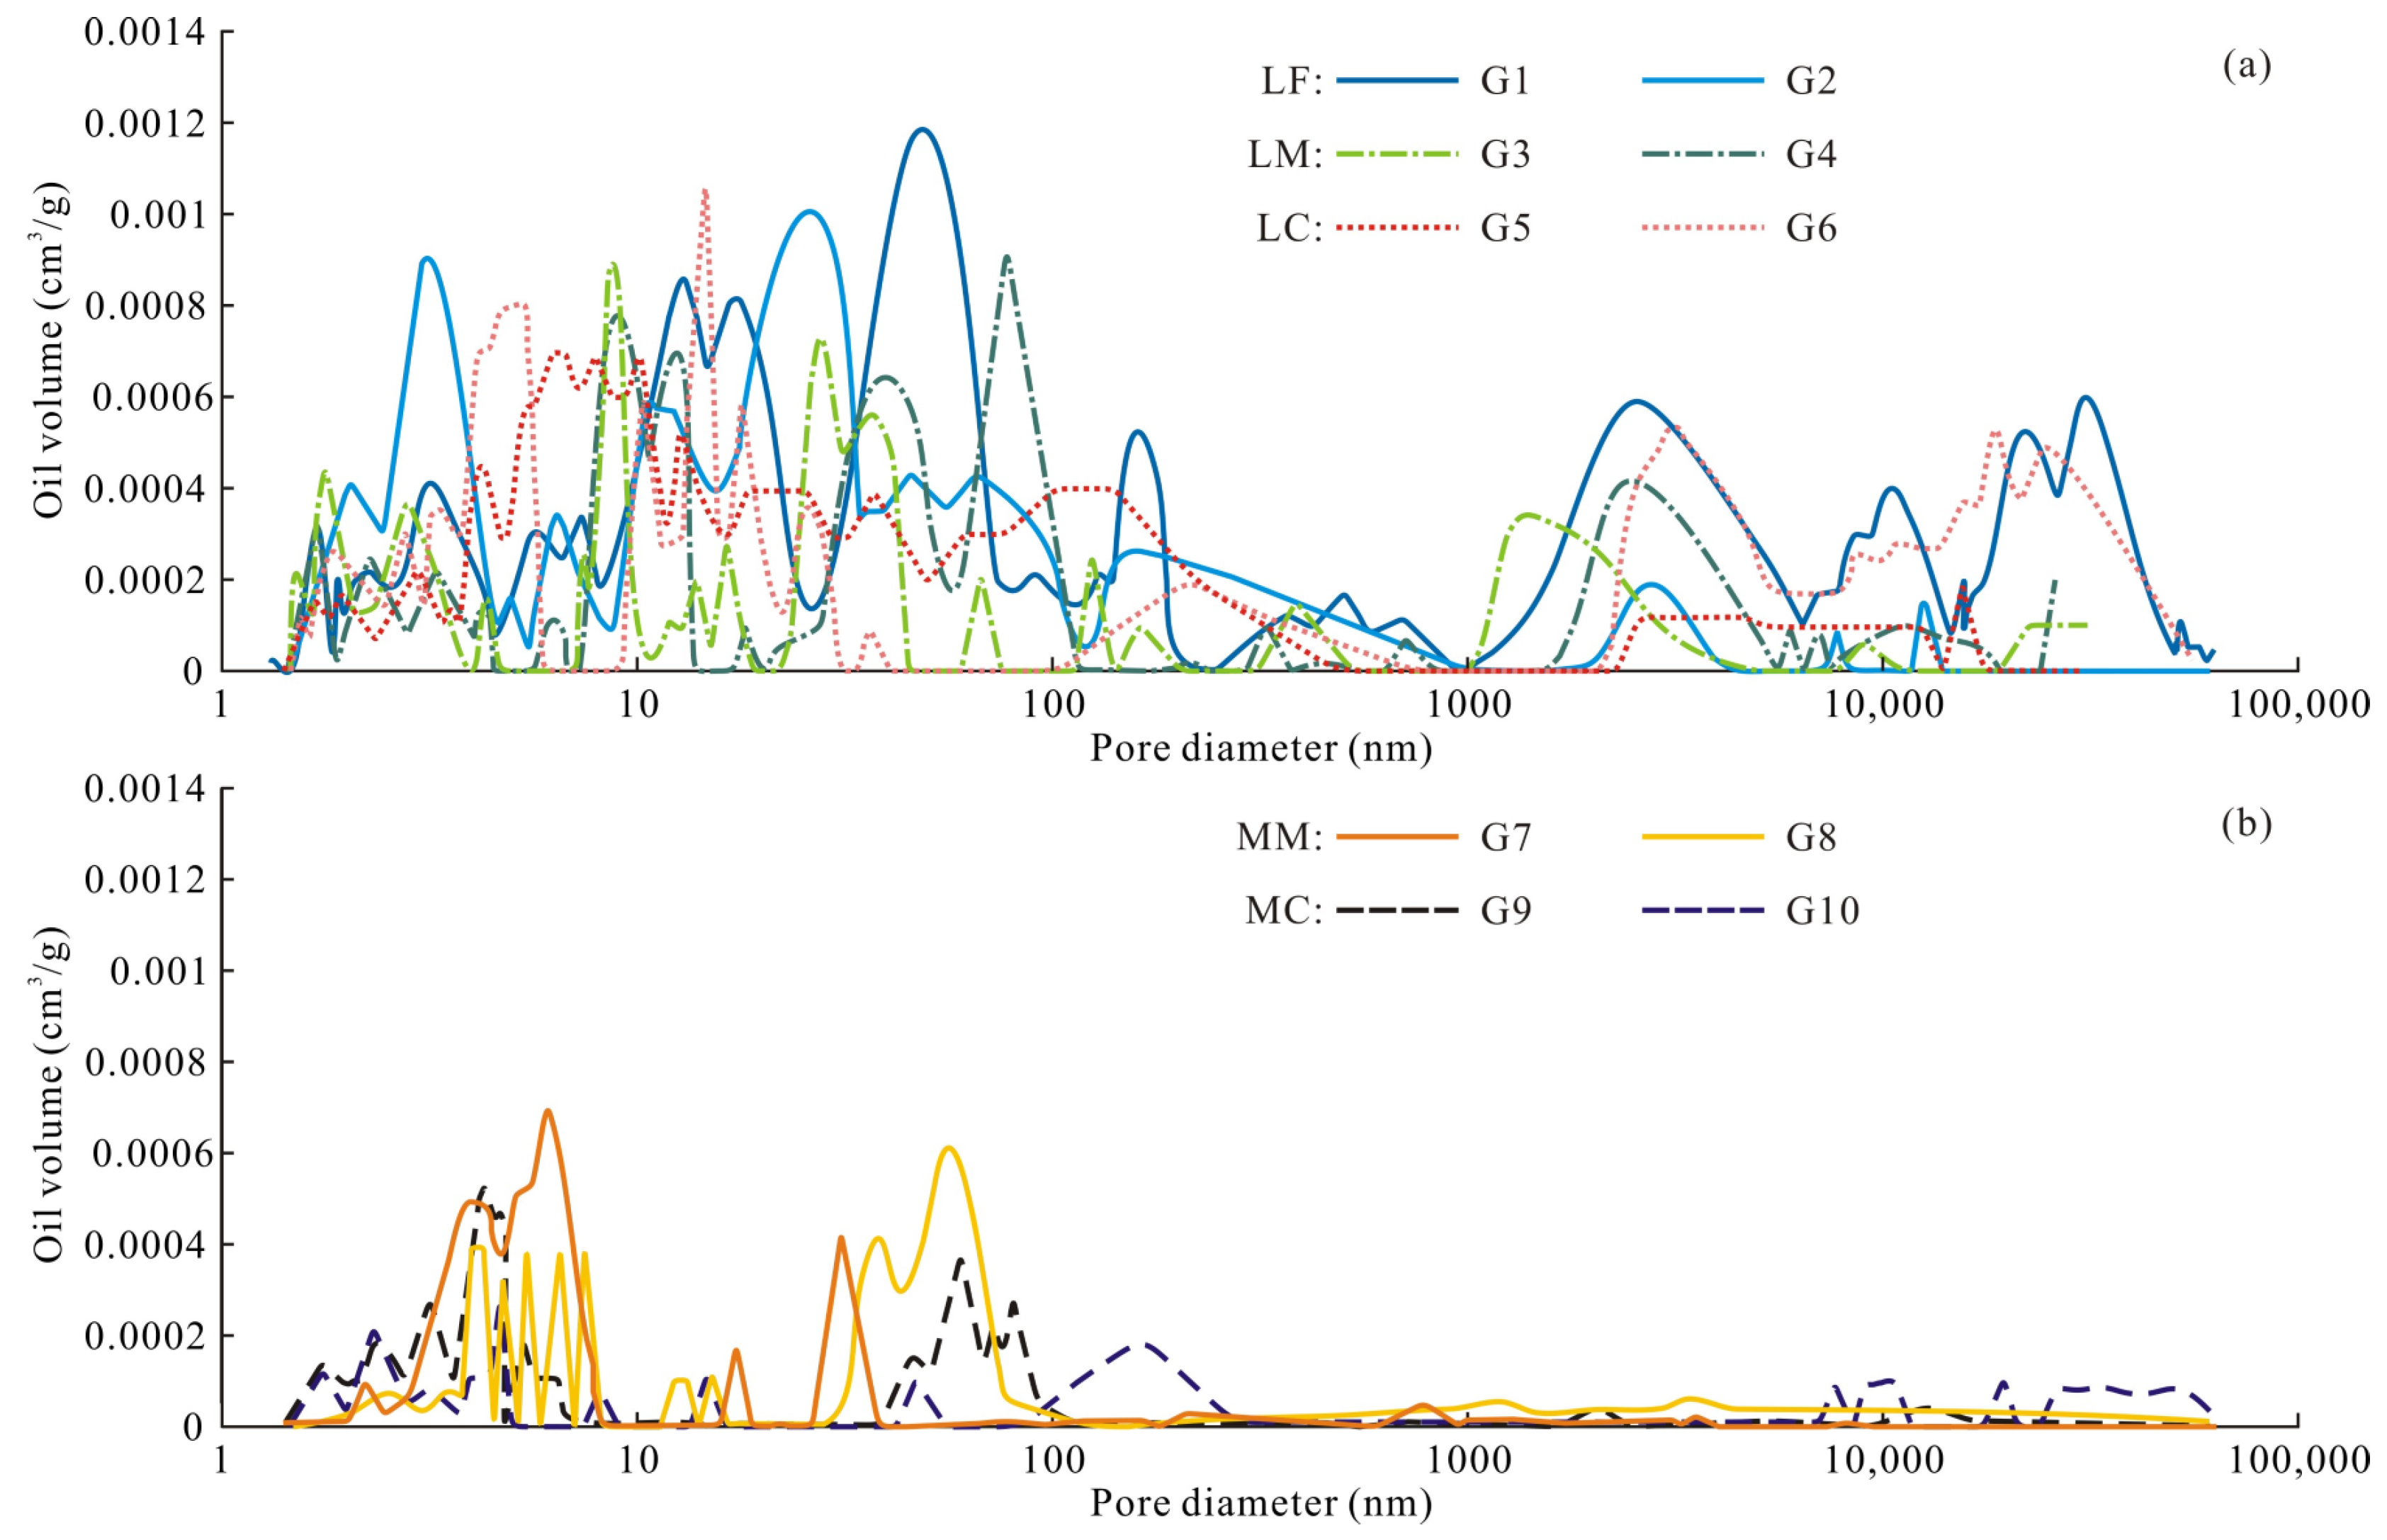
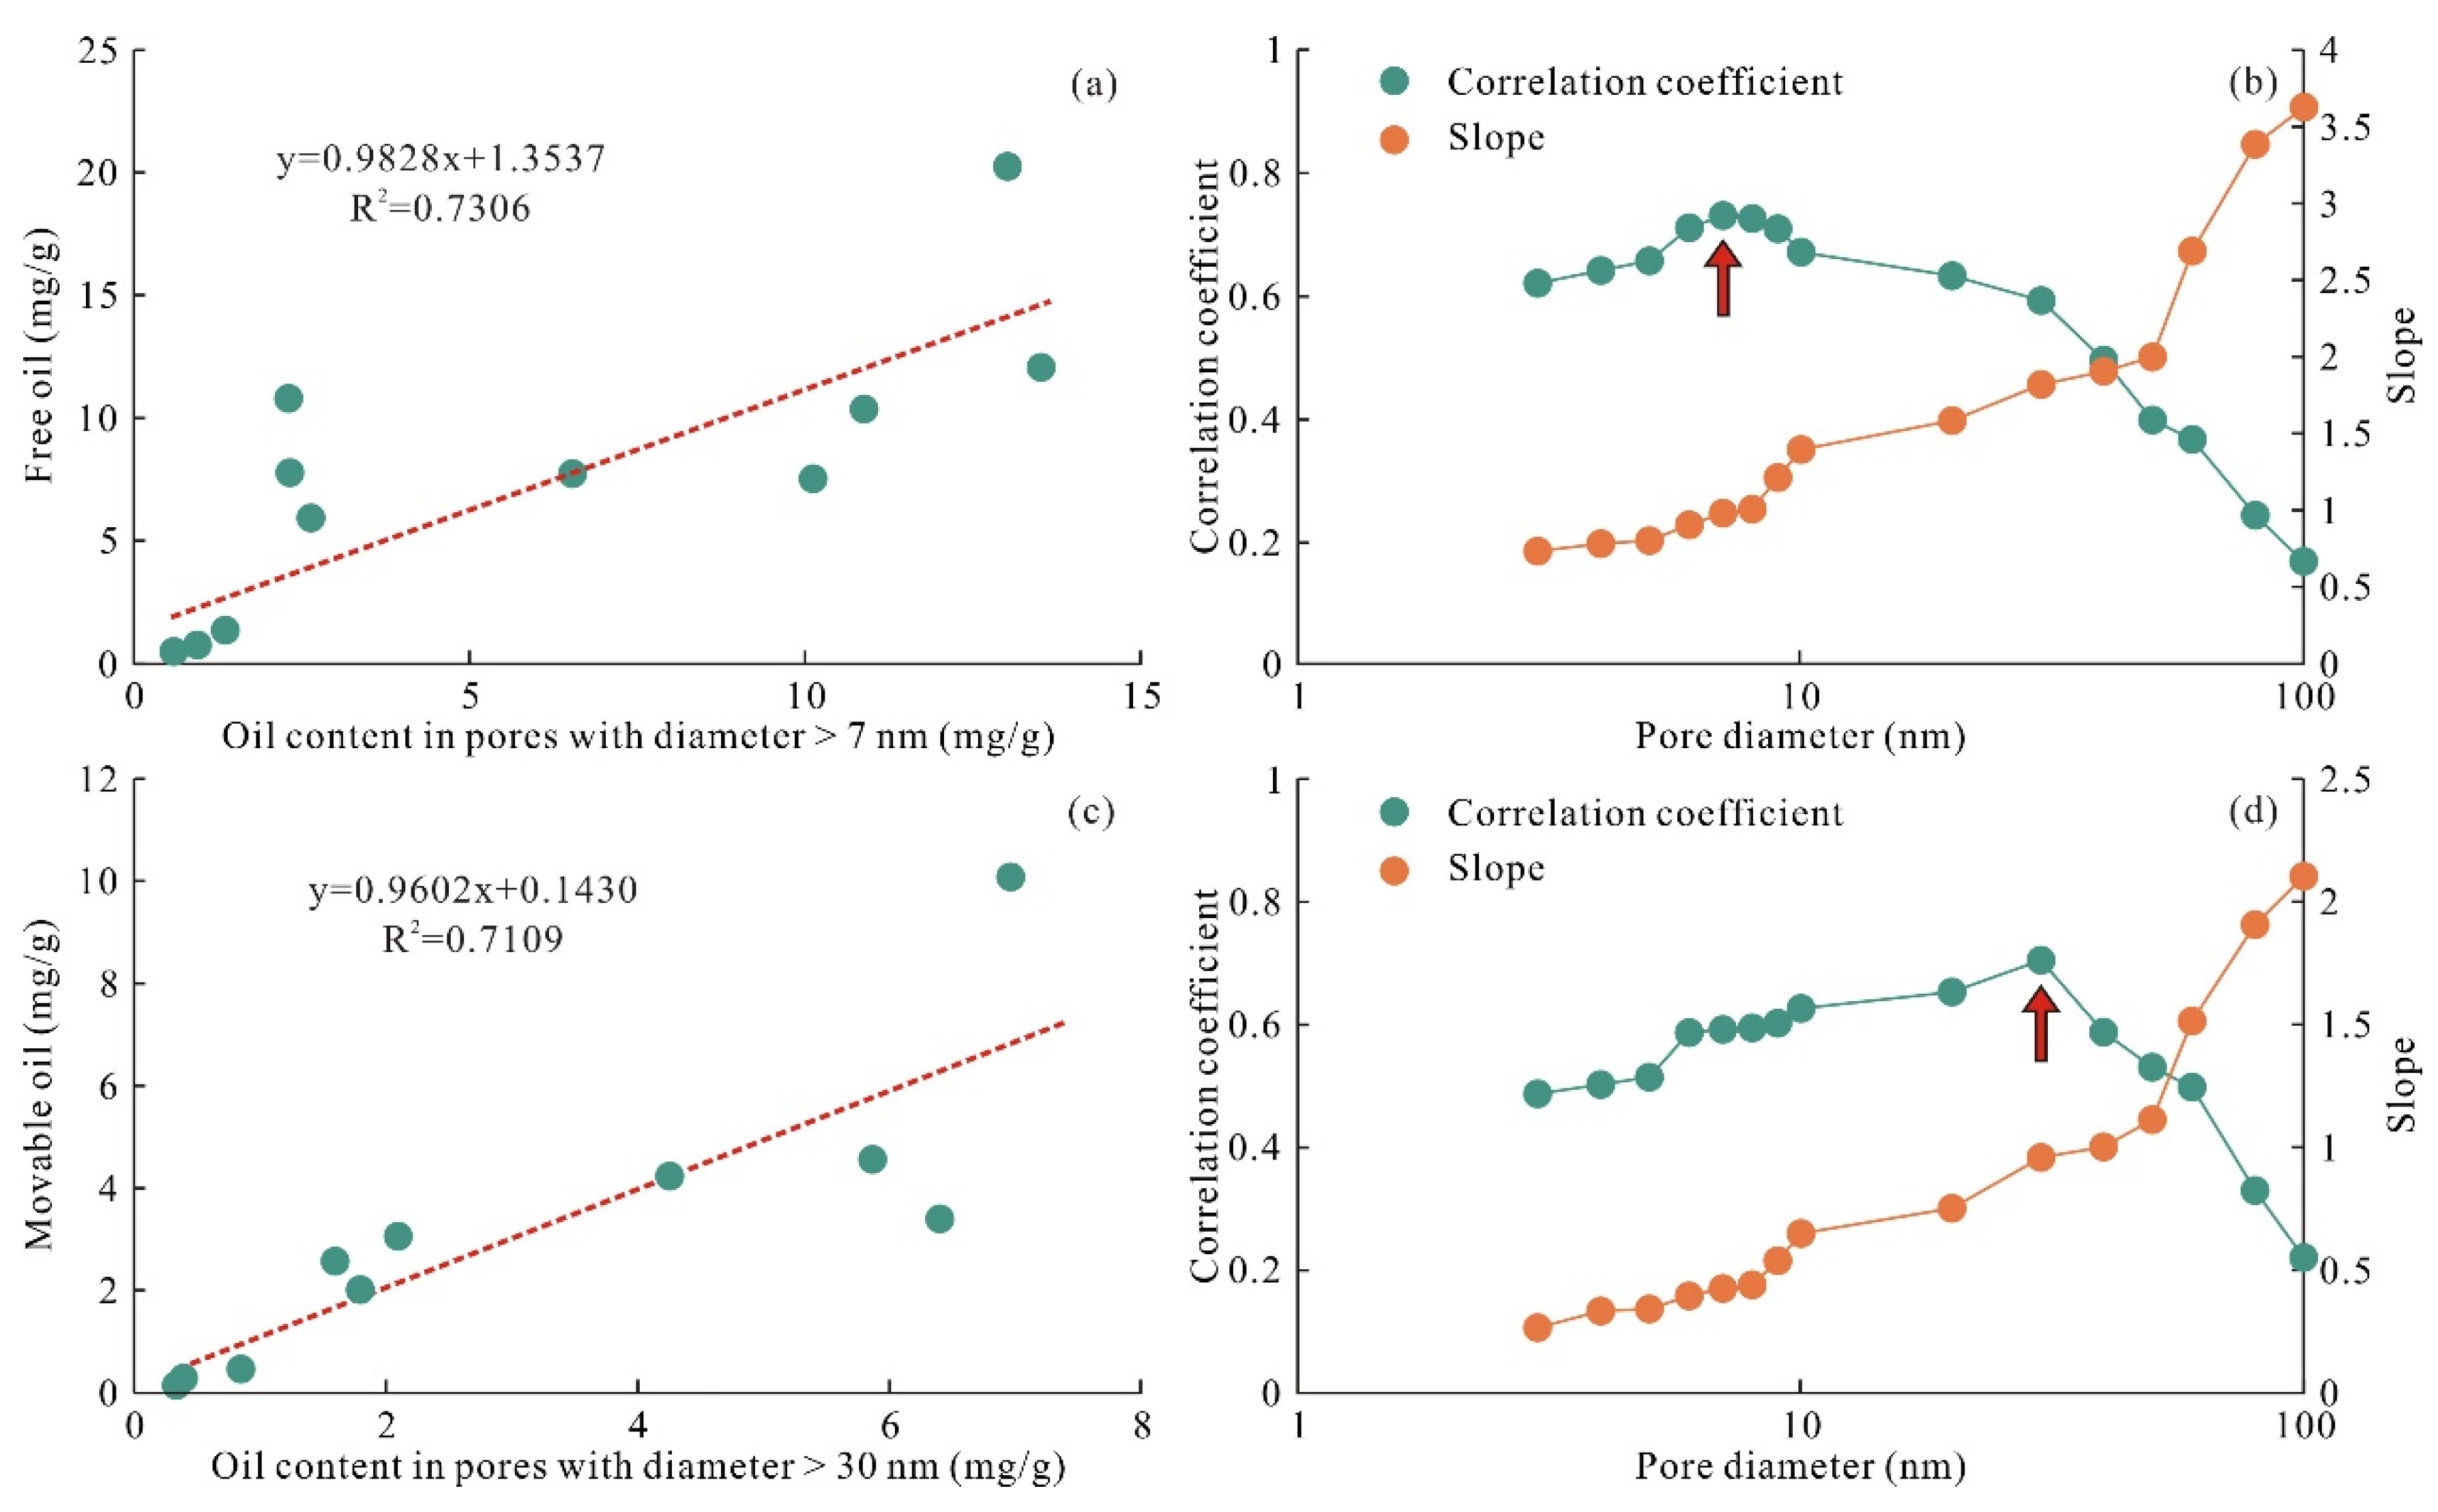
4.3. Occurrence Characteristics of Shale Oil

According to the evaluation and research of the Ek2 shale resources in the Cangdong Sag by Zhao et al. (2021), the preliminary calculated resources reach 10.96 × 10⁸ t, showing the substantial potential of shale oil resources [25]. The study of the pore structure characteristics of the shale reservoir showed the pores are small not in the study area but rather within the studied samples, mainly consisting of nano and micro pores [22]. As the occurrence characteristics (occurrence amount and occurrence state) of shale oil in different scale pores directly affect the mobility of shale oil, it is of great significance to clarify these occurrence characteristics for efficient petroleum exploration [59].
Most shales are filled with residual oil before solvent extraction, and the presence of residual oil will reduce the pore volume and even block part of the pore throat [60]. Therefore, the pore size range and shale oil content of an occurrence can be determined by comparing the experimental results of the LNP and MIP tests of the Ek2 shale samples before and after solvent extraction. According to the results of the LNP tests, the hysteresis loop before solvent extraction is of type H3, while the hysteresis loop after organic solvent extraction is of type H2, and the pore shapes change from a parallel plate shape to an ink bottle shape. The adsorption amount, desorption amount, and hysteresis loop area also markedly increased after solvent extraction (Figure 9a), indicating that shale oil is released during the solvent extraction process. The pore size distribution curve before and after solvent extraction shows that shale oil occurs at a pore diameter from 2 to 200 nm (Figure 9b). According to the results of the MIP tests, the mercury intrusion volume increases significantly after solvent extraction, based on the MIP intrusion and extrusion curves (Figure 9c). The pore size distribution curve before and after solvent extraction shows that shale oil occurs at a pore diameter from 3 to 50 um (Figure 9d). In addition, the maximum injection pressure of 414 MPa in these tests may cause the residual free oil in the unextracted sample to move and squeeze into smaller pores, and organic matter, asphalt, or clay minerals with relatively strong plasticity may contract under higher pressure, resulting in a higher volume of smaller pores [61].
When the pore size distributions were characterized using both LNP and MIP, the matching degree of the two experiments was poor in terms of splicing, and it was difficult to obtain consistent pore structure test results in the same pore size range, so its application effect was not ideal [62]. In addition, the oil molecules are relatively large, and the pore diameter below 3 nm contributes less to the shale reservoir [63]. The MIP tests can quantitatively characterize the pore diameter distributions and pore volumes from 2.8 nm to 50 μm, which are much larger than the pore characterization range of the LNP tests (2–300 nm) [64]. Therefore, the variation curves of the oil volume with pore diameter are established by calculating the difference in the pore volume increment of the samples from the MIP tests before and after solvent extraction, and then the pore size distribution ranges of residual shale oil in different lithofacies of the Ek2 shales in the Cangdong Sag are evaluated (Figure 10). It shows that the residual oil mainly occurs in pores with a diameter of less than 200 nm. The occurrence of shale oil in larger pores (pore diameter > 200 nm) is gradual. From laminated shales to massive shales, the oil volume gradually reduces, and the pore diameter when residual oil occurred in some laminated shale samples can reach 50 μm.
Shale oil can not only be adsorbed on the surface or inside pores but also exist in the pore and fracture system of shale in a free state, and pore size has an important impact on the occurrence and migration of shale oil [55,57]. The pore size distributions of residual oil can calculate the oil volume in pores with different diameters (Figure 10), and the MIS pyrolysis can quantitatively characterize the shale oil content in different occurrence states. Therefore, the two methods can be combined to calculate the lower limit of the pore diameter of shale oil in different occurrence states. The detailed processes are as follows: (1) According to the pore size distributions of residual oil in the Ek2 shales, the oil volume from a large to a small pore size gradually accumulates, a certain pore diameter value is set to d, and the oil volume at and above the pore diameter (d) is calculated. Combined with the actual crude oil density (0.85 g/cm3) of shale oil of Ek2 in the Cangdong Sag, the shale oil content in the corresponding pore diameter range can be calculated. (2) When the pore size is greater than d1 and the shale oil content is closest to the free oil content, the lower limit of the pore diameter of occurring free oil is d1, and movable oil can also be inferred by this principle [59]. Figure 11a shows an intersection diagram where the free oil content obtained by MIS pyrolysis is the longitudinal axis, and the oil content of a certain pore diameter and of a larger pore diameter is the horizontal axis. Another intersection diagram was made by counting the correlation and slope coefficient of the other intersection diagram under different pore diameters (Figure 11b). With the increase in the lower limit of the pore diameter (d1), the content of the shale oil with a pore diameter ranging from d1 to 50 μm gradually decreases, the slope coefficient gradually increases, and the correlation coefficient increases first and then decreases. When the slope coefficient is close to 1 and the correlation coefficient is at its maximum, the corresponding pore diameter is at the lower limit of the pore diameter of the occurring free oil, and the evaluation method of the lower limit of the pore diameter of the occurring movable oil is similar. Figure 11b shows that when the slope coefficient is close to 1, the correlation coefficient is the highest (R2 = 0.7306), indicating that the lower limit of the pore diameter of the occurring free oil is 7 nm. According to this method, the lower limit of the pore diameter of occurring movable oil is 30 nm (Figure 11c,d). Jin et al. (2021) confirmed that movable oil is the main cause of the charging effect based on a series of experiments such as a conductivity test and polar solvent extraction [65]. It was found that the minimum pore diameter of precipitated oil is about 30 nm, which represents the lower limit of the pore diameter of the occurring movable oil. Because the phenomenon of oil precipitation in small pores is not easily observed in FE-SEM images, it is observed that the pore diameter of oil precipitation is mostly above 50 nm (Figure 12).

5. Discussion

5.1. Relationship between Thermal Maturity and Shale Oil

The thermal maturity of organic matter is negatively correlated with the proportion of adsorbed oil according to the correlation diagram between the proportion of adsorbed oil obtained from MIS pyrolysis and thermal maturity (Figure 13a). With the increase in thermal maturity, the proportion of adsorbed oil gradually decreases, while the proportion of free oil gradually increases. This is because, on the one hand, with the increase in thermal maturity, the number of shale oil adsorption layers decreases, the density of adsorption peaks and viscosity decreases, and shale oil is less able to attach to the pore surface. On the other hand, with this increase in thermal maturity, the functional groups such as the aliphatic chain, the carboxyl group, and the carbonyl group in kerogen disappear, and the atomic ratio of carbon to hydrogen (C/H) and carbon to oxygen (C/O) gradually increases, which reduces the mutual solubility and adsorption capacity between shale oil and kerogen [54].
The composition of shale oil determines the density, viscosity, and freezing point of shale oil, which has an important influence on the occurrence and mobility of shale oil. The correlation diagrams between the proportion of adsorbed oil and the composition of shale oil shows that the proportion of adsorbed oil decreases with the increase in saturated hydrocarbon content, and increases with the increase in aromatic hydrocarbon, nonhydrocarbon, and asphaltene content, which means that the lighter the shale oil components, the lower the proportion of adsorbed oil (Figure 13b–e). Previous studies have found that the density and viscosity of crude oil decrease with the increase in organic matter maturity of Ek2 in the Cangdong Sag [66]. Therefore, with the increase in organic matter maturity, the organic macromolecules undergo chain scission condensation, and the hydrocarbon generation products become lighter. The difference between the parent material structure and the molecular structure of hydrocarbons becomes larger, the density and viscosity of crude oil decrease, and fluidity increases, resulting in a gradual decrease in the adsorption and mutual solubility between them. Therefore, the light component content can be used as an important evaluation factor in the optimization of exploration segments (Figure 13).

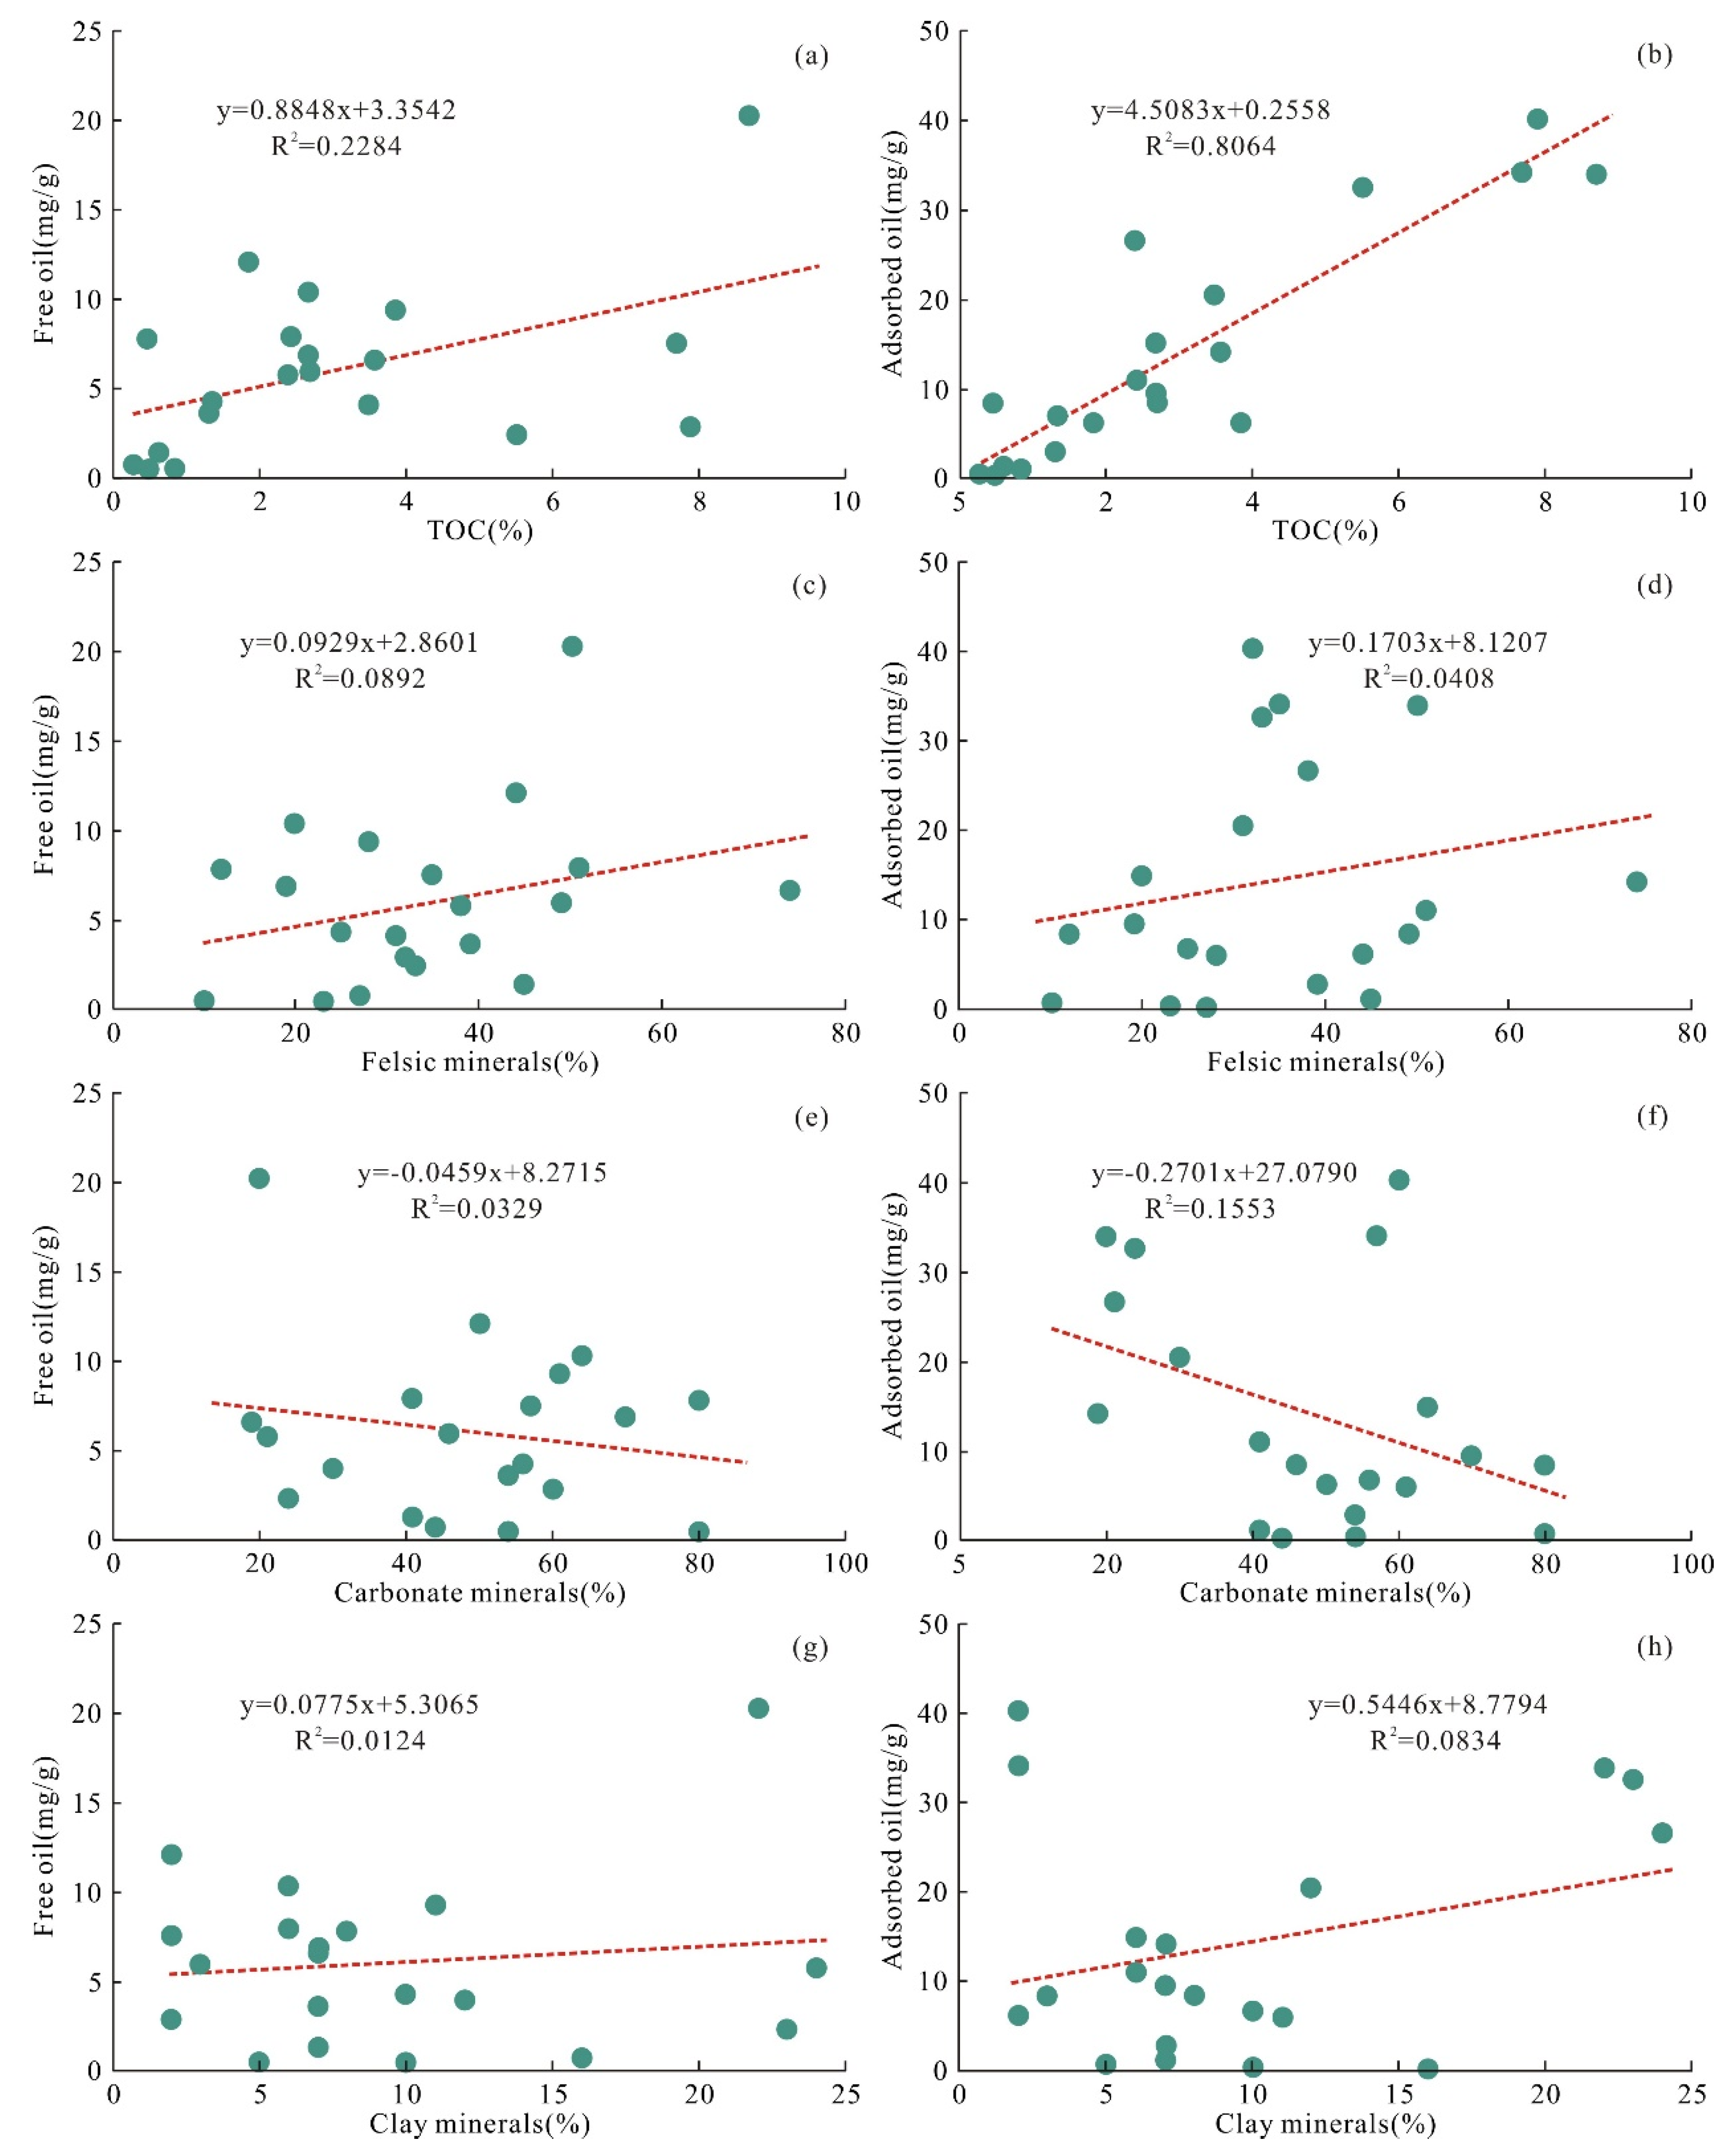
5.2. Relationship between Rock Composition and Shale Oil

The occurrence state of shale oil is related not only to thermal maturity, but also to organic matter abundance. The free oil content shows a weak positive correlation with the TOC content, while the adsorbed oil content shows a significant positive correlation with the TOC content (Figure 14a,b). The determination coefficient (R2) shows that the control effect of the TOC content on the adsorbed content is much stronger than that on the free oil content. Therefore, the samples with a lower TOC content will have less oil adsorption in shale with the same oil content, and the mobility will be greater.
The correlation diagrams show that the free and adsorbed oil content is weakly positively correlated with felsic and clay mineral content, but weakly negatively correlated with carbonate mineral content (Figure 14c–h). The determination coefficient (R2) shows that the control effect of mineral content on the adsorbed oil is much weaker than that of the TOC content. The fitting equation does not pass through the origin in Figure 14b, indicating that the residual oil includes not only the dissolution of organic matter and the adsorption on the surface of organic pores, but also the adsorption on the surface of some inorganic pores. The oil content obtained by the adsorption of inorganic minerals in the unit rock is about 0.2558 mg/g (TOC content is 0), which indicates that the adsorption capacity of inorganic minerals to oil is very low, and adsorbed oil mainly occurs in kerogen in the form of adsorption and mutual solubility. The main reason is that the development of pore quantity, pore volume, and specific surface area is not completely controlled by mineral content, and the specific surface area with shale oil adsorption properties is irregular. The pores in clay minerals that control the specific surface area especially have oil wetting properties, so the correlation between adsorbed oil content and inorganic mineral content is weak.

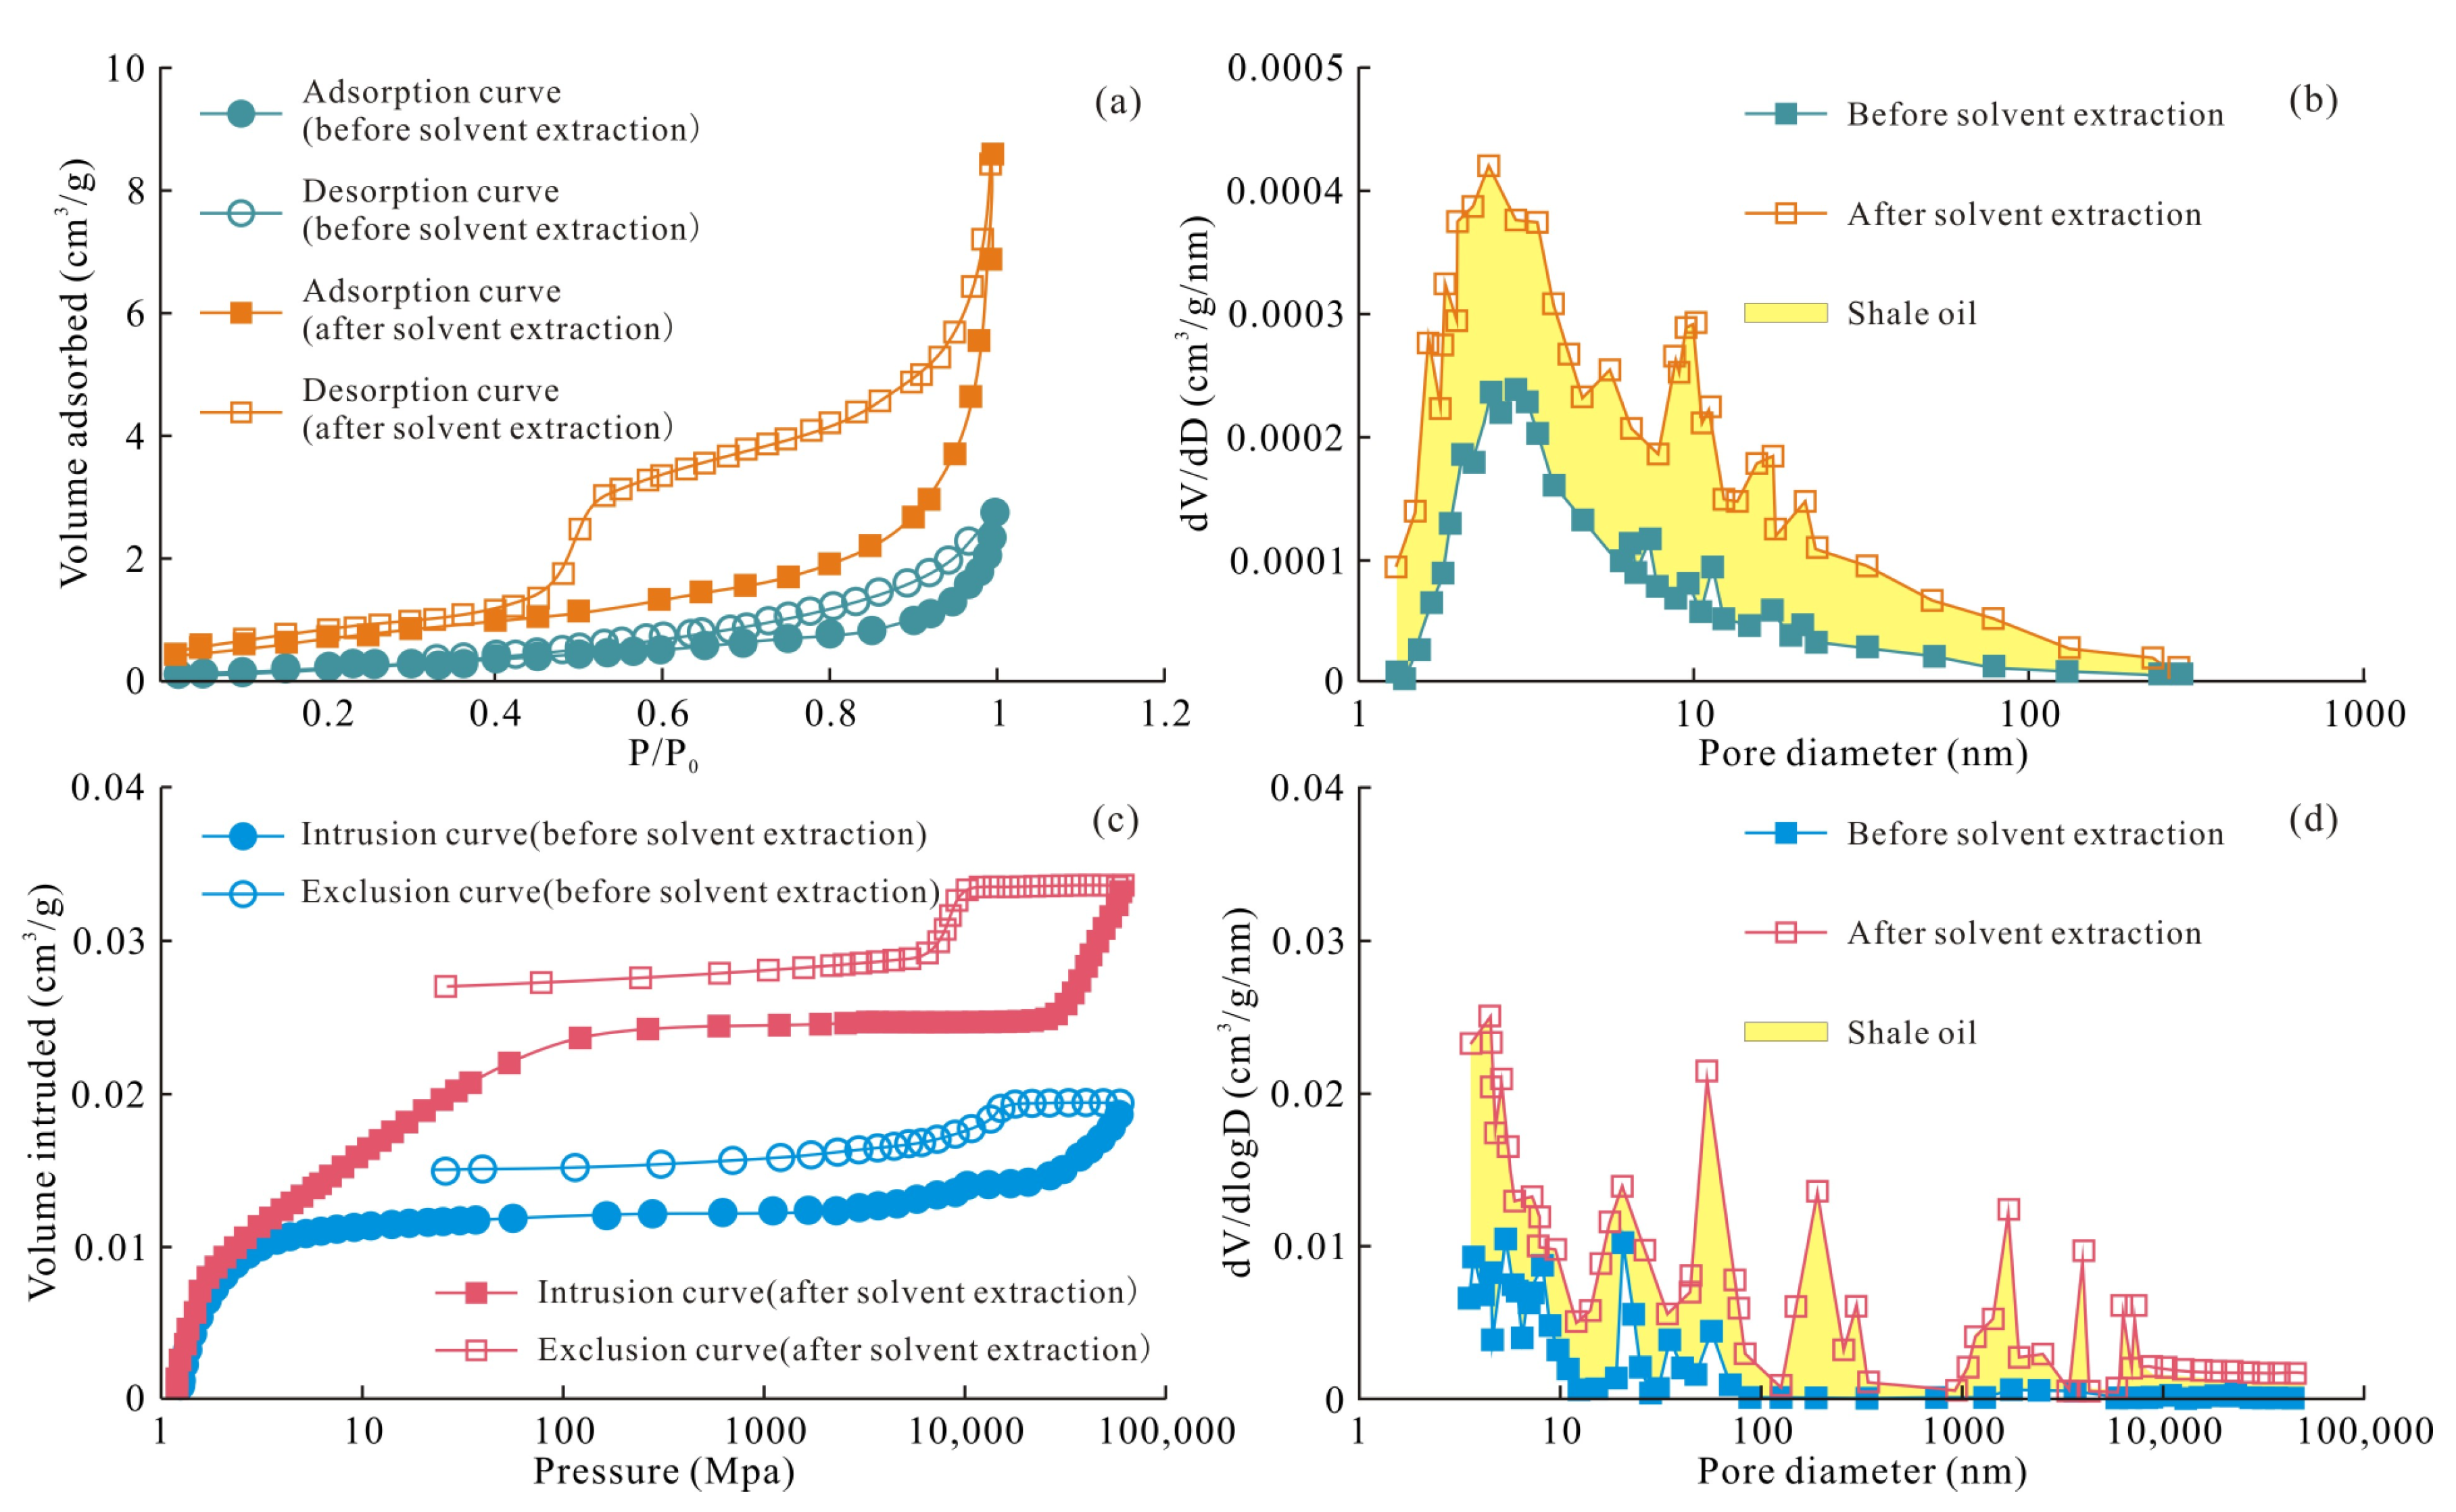
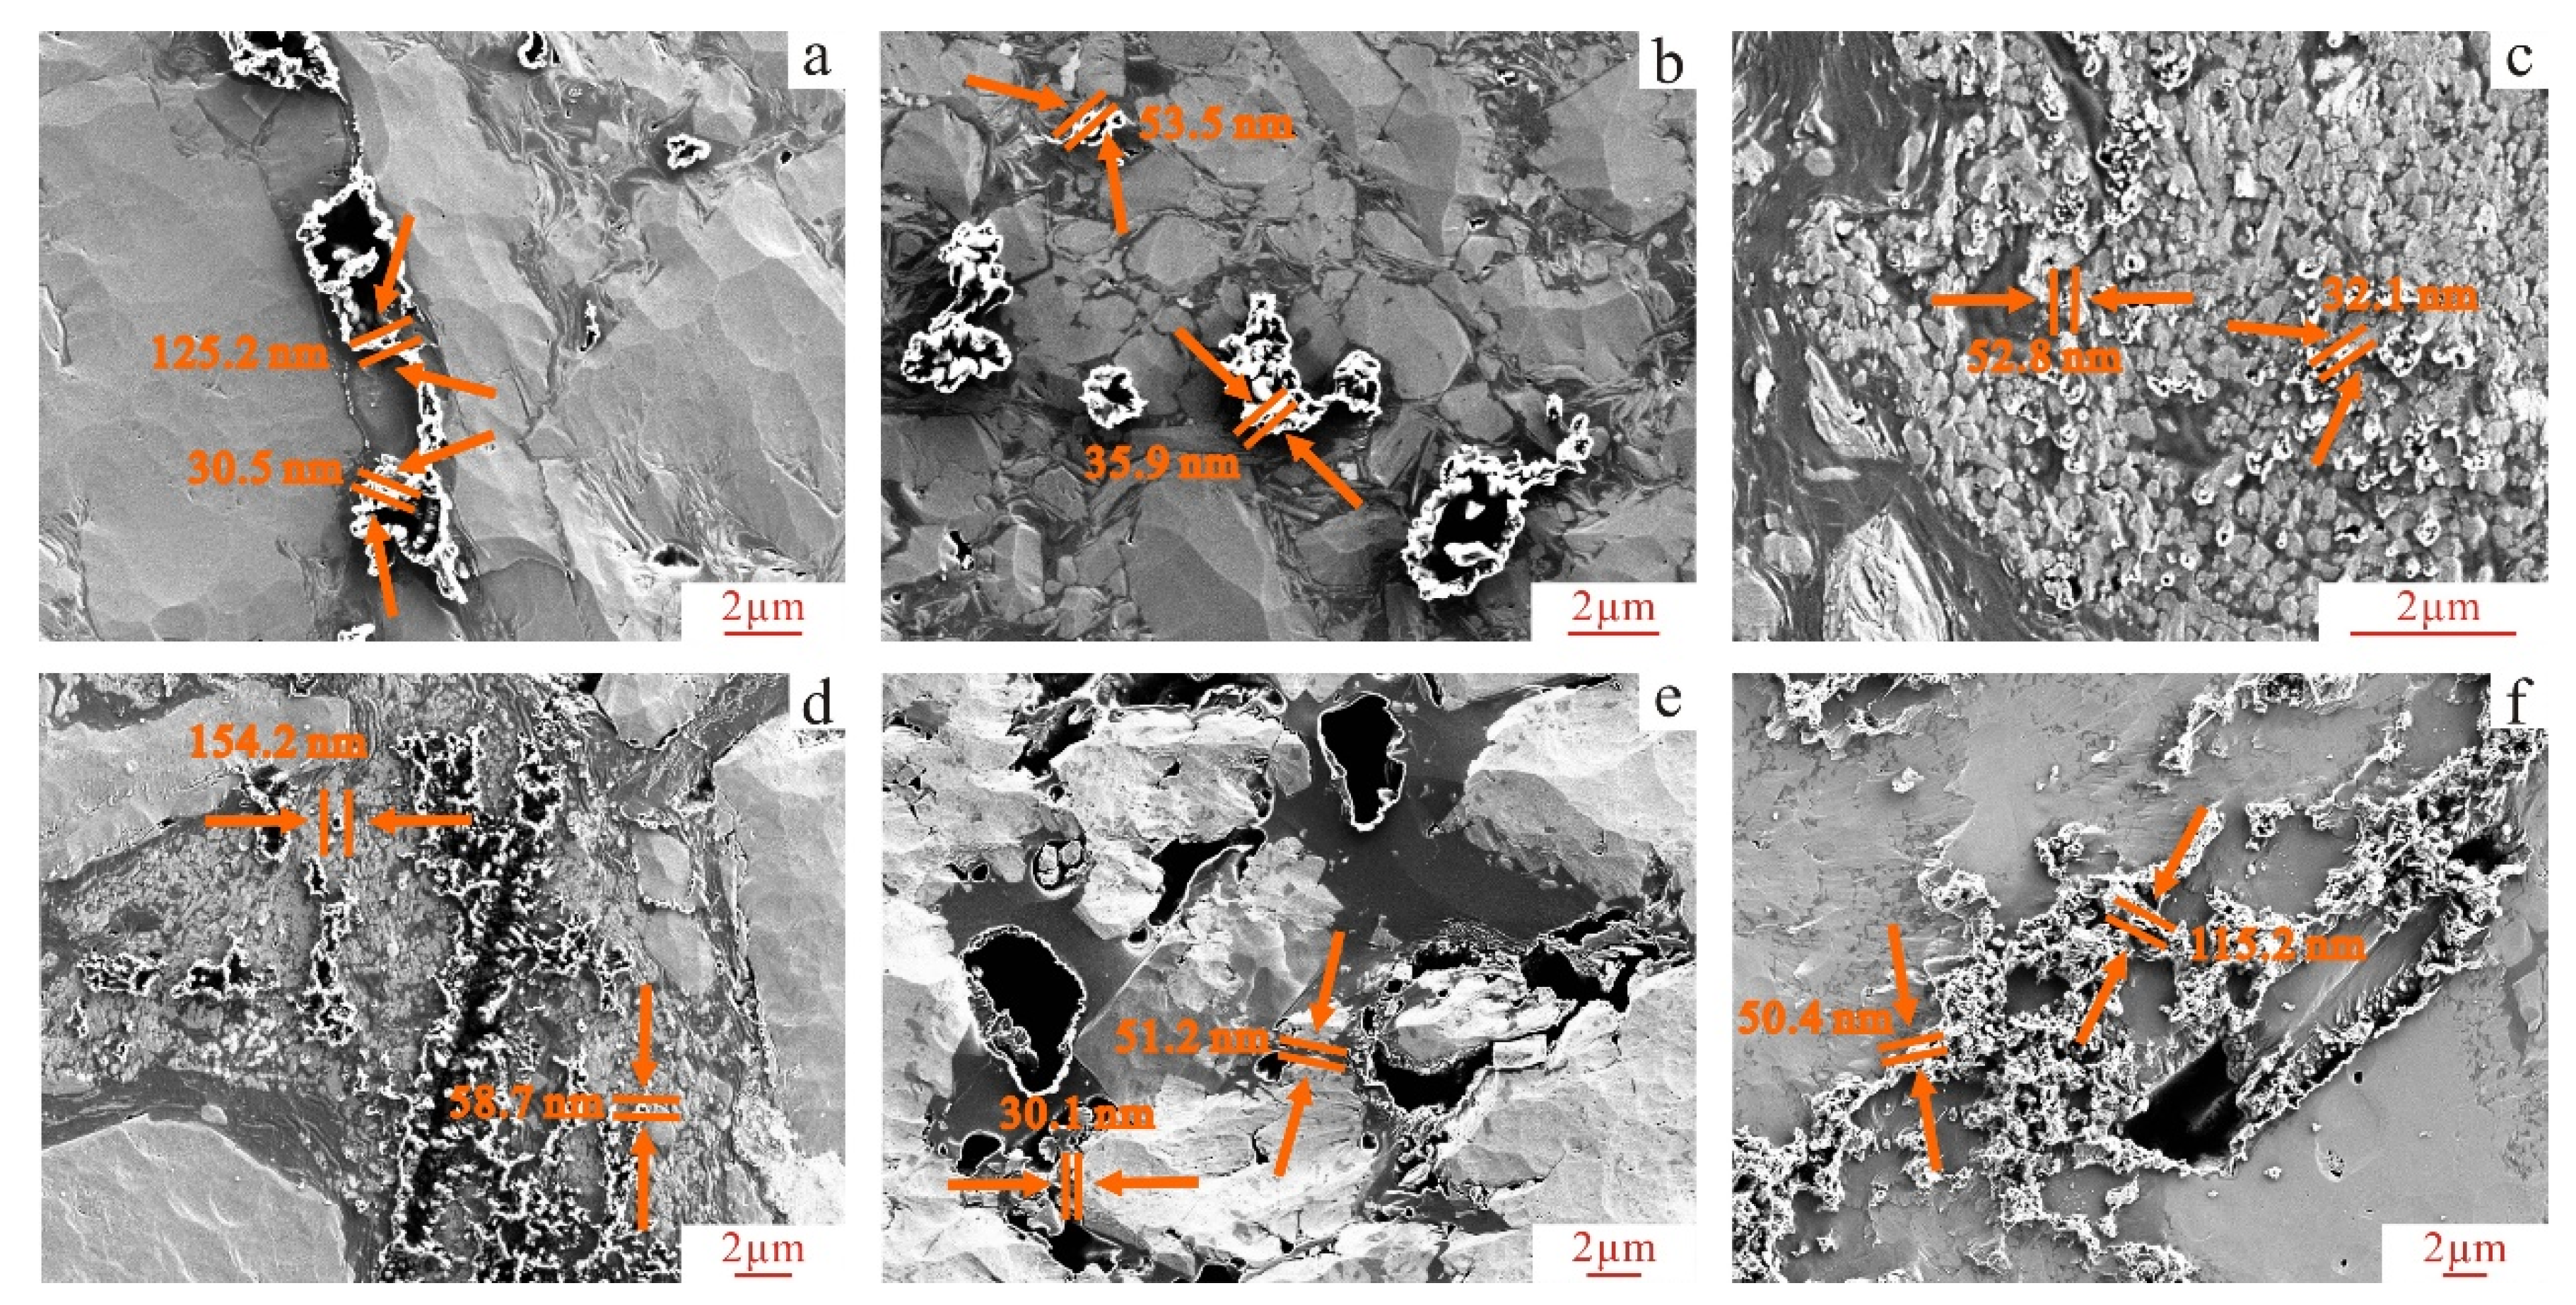
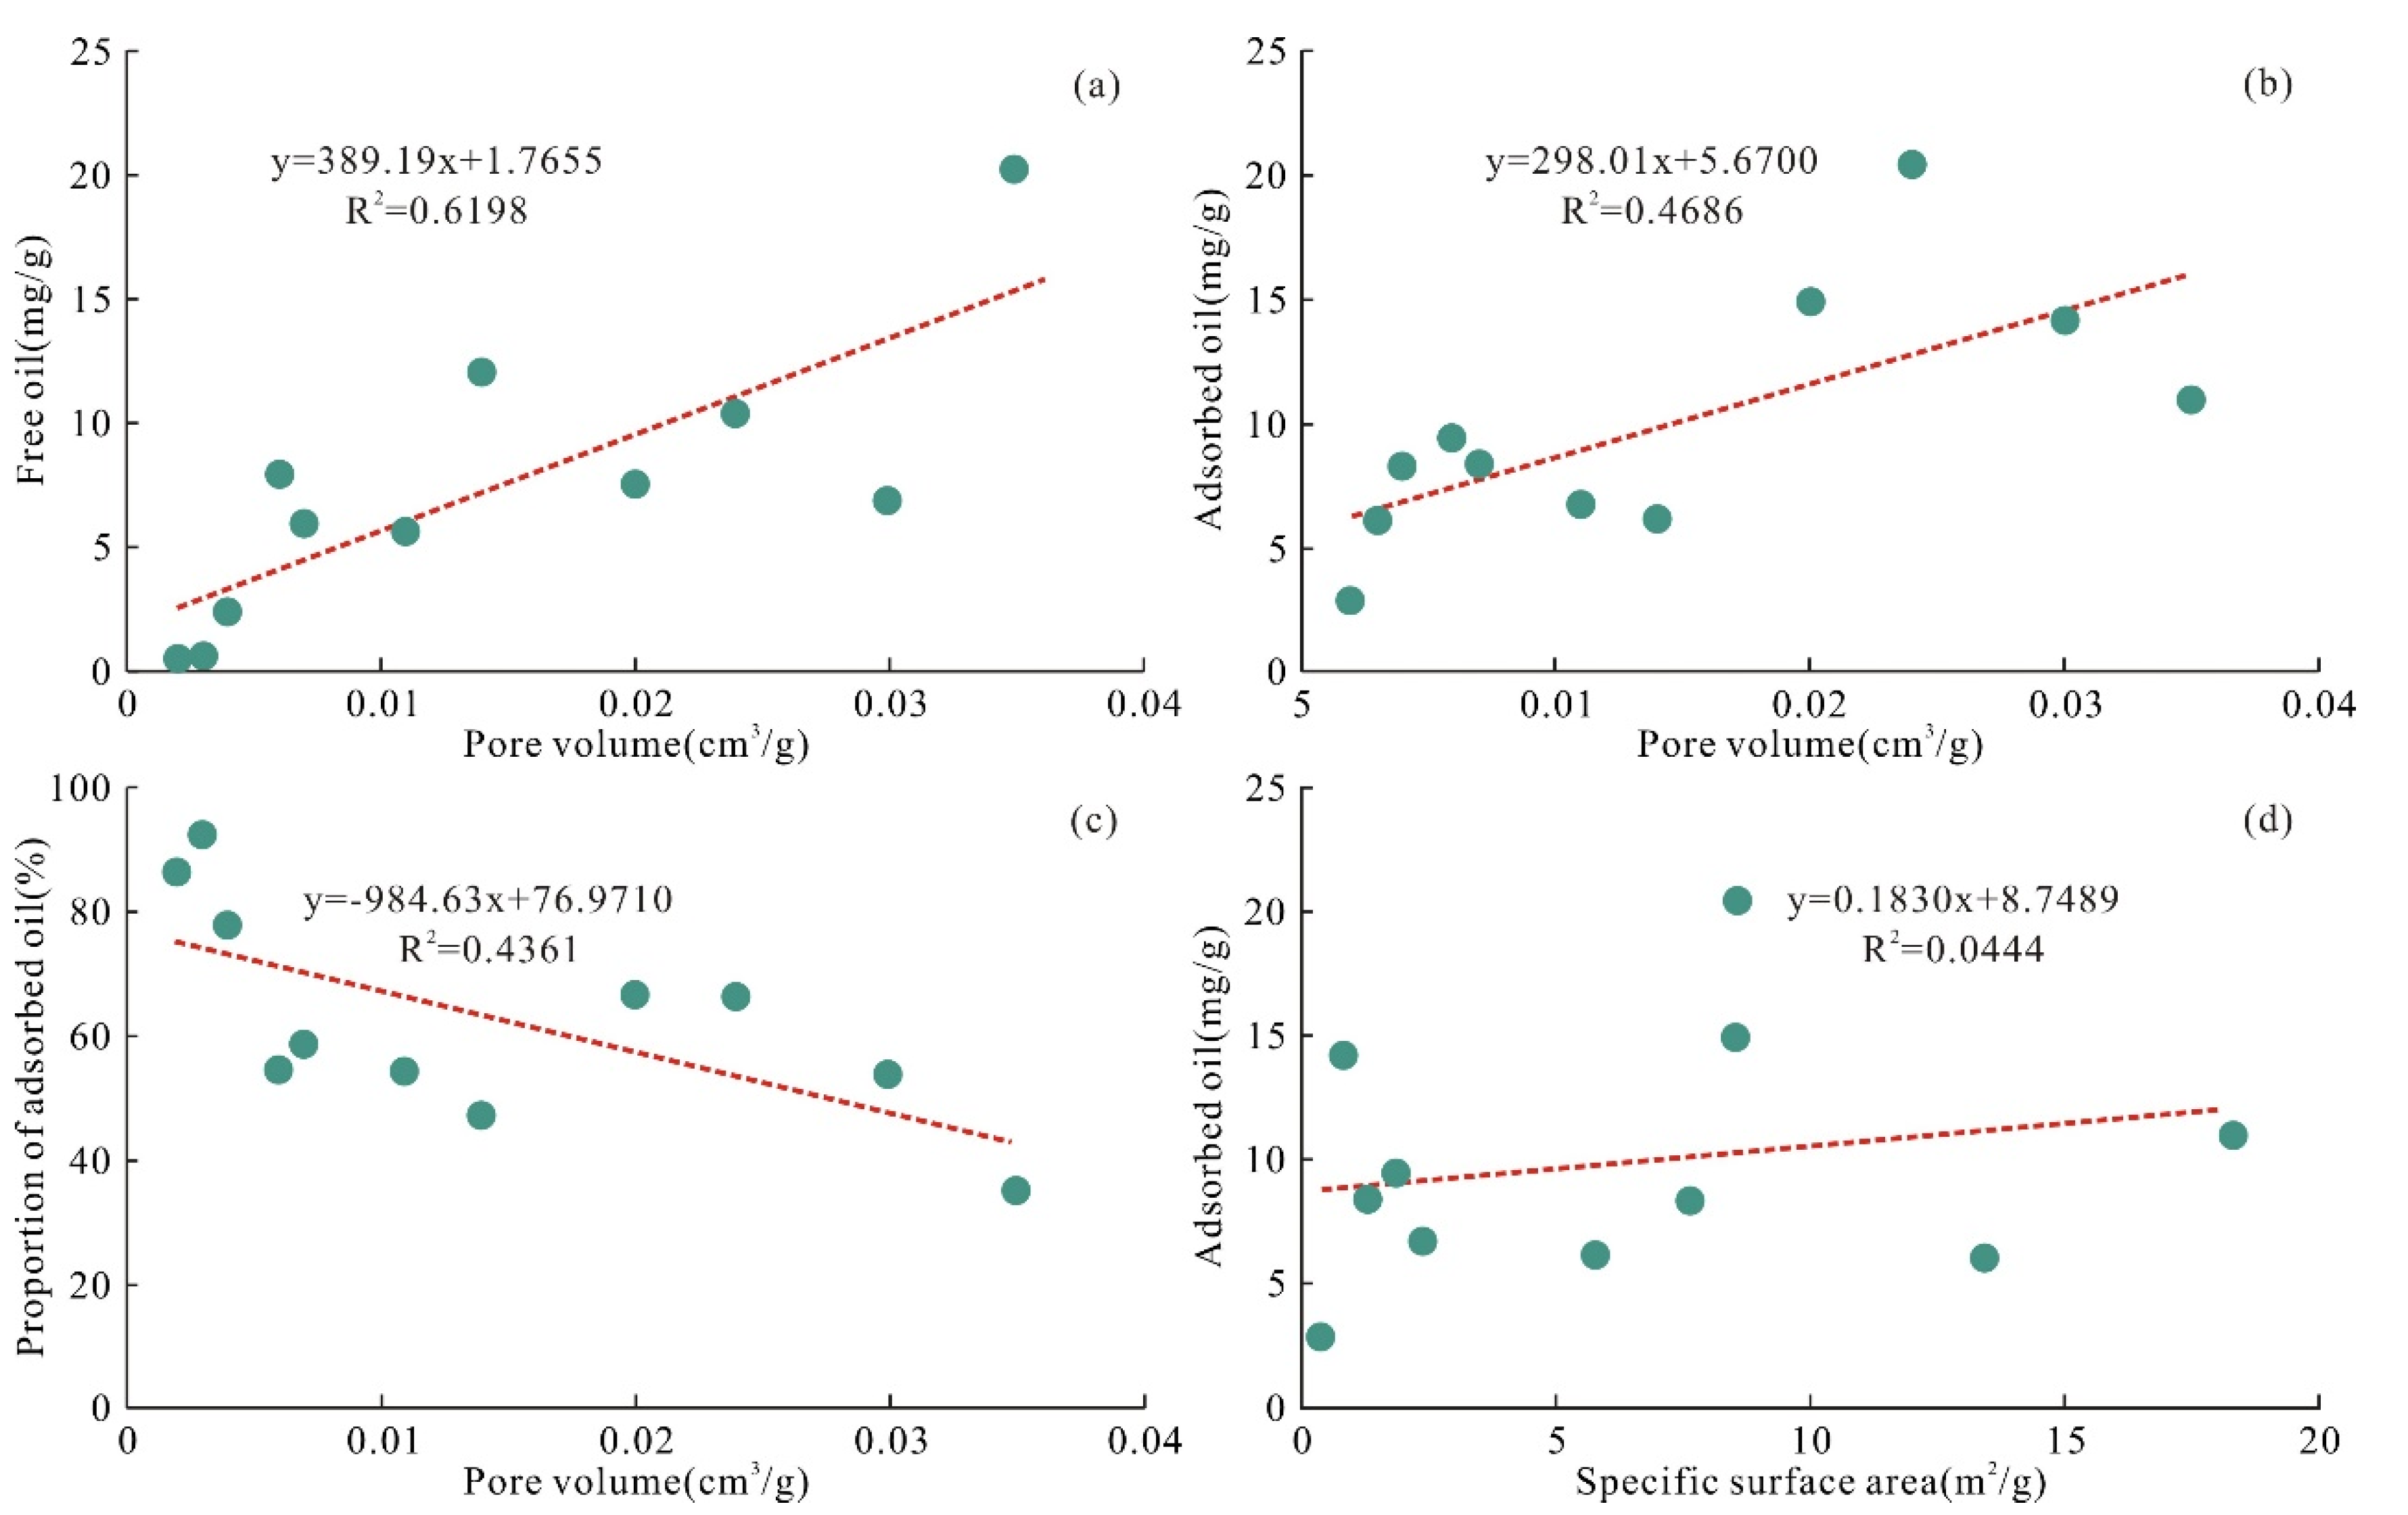
5.3. Relationship between Pore Volume and Shale Oil

The adsorption effect of pore size on shale oil is mainly reflected in the physical properties, including shale pore volume and average pore diameter [67]. Because the pore size distribution of shale is wide, the average pore diameter is not representative in characterizing pore size, so the pore volume is used to analyze the influence of physical properties on shale oil adsorption. The correlation diagram of pore volume with free oil, adsorbed oil, and the proportion of adsorbed oil shows that, with the increase in pore volume, the adsorbed oil and free oil content increases, but the proportion of adsorbed oil decreases. On the other hand, the proportion of free oil increases with the increase in pore volume, and the movable proportion of the shale oil is higher (Figure 15a–c). Previous studies have demonstrated that the pore volume, macropore proportion, and microfractures of laminated felsic shales and laminated mixed shales are more developed than in other lithofacies of the Ek2 shales in the Cangdong Sag, with large pore throats and strong connectivity, which guarantees a reservoir space for the occurrence and enrichment of shale oil [19,20]. Therefore, these two lithofacies have obvious advantages in reservoir physical properties, pore structure, and pore connectivity and have better occurrence ability for shale oil. The plot shows that the correlation between adsorbed oil content and pore specific surface area is not obvious (Figure 15d). The reasons for this are that the adsorbed oil content obtained from MIS pyrolysis not only is adsorbed on the pore surface, but also occurs in kerogen in a dissolved state, and that the pores of lacustrine shale show the characteristics of mixed wetting, and hydrocarbon adsorption does not occur on the surface of some water-wet pores, which makes the correlation between specific surface area and adsorbed oil content not obvious. In addition, although some samples have a large specific surface area, a low TOC content shows that the specific surface area of shale is mainly controlled by inorganic minerals, and the pore surface of inorganic minerals is not necessarily adsorbed by shale oil, so the adsorbed oil content is still low.
There were few studies on the effect of temperature and pressure on the adsorption performance of shale oil, Wang et al. (2022) analyzed the effect of different temperature and pressure conditions on the adsorbed oil content using molecular simulation models [67]. The results show that, with the increase in temperature, the movement of alkane molecules is more violent, and it is easier to separate and desorb from the surface of organic matter, so the adsorption amount decreases. The thermal desorption treatment of the physical adsorption effect (dominated by van der Waals force) is based on this principle. In addition, as the temperature increases, the viscosity of oil will be significantly reduced, fluidity will be enhanced, and the adsorbed oil content will also be reduced. Molecular simulation technology results show that pressure has little effect on shale oil adsorption, but pressure as a driving force can significantly promote the mobility or recoverability of shale oil [67]. The increase in pressure under geological conditions can increase the dissolved gas content of shale oil, which has a significant effect on the adsorption of shale oil [4]. With the increase in gas content, the ratio of gas to oil in shale oil increases, and the viscosity and crude oil density decrease continuously, which can significantly improve the flow performance. Molecular dynamics simulation also confirmed that, with the increase in small molecular hydrocarbon content, the adsorption content gradually decreased, and the fluidity increased [68]. Therefore, pressure or overpressure has been considered a factor affecting shale oil mobility in some studies [4,69].

5.4. Optimization of Shale Oil Sweet Spot Intervals

According to the analysis results of basic organic geochemical parameters, oil-bearing properties and occurrence forms, laminated felsic shales and laminated mixed shales have a high organic matter abundance, a high oil saturation index, and high free oil content, and this is a good material basis for obtaining industrial shale oil flow. In addition, the actual exploration results also prove that the lithofacies of horizontal fracturing sections of horizontal wells GD1701H and GD1702H with high and stable production are mainly laminated felsic shales and laminated mixed shales. Taking the measurement and analysis of the liquid production profile of GD1702H as an example, laminated felsic shale and laminated mixed shale are the main lithofacies contributing to production, especially laminated felsic shale, whose length accounts for 38.5% of the total horizontal section, while the oil production accounts for 74.8% of the total well section, and the daily oil production per 100 m is more than 3 t. The exploration and deployment of vertical wells also achieved good results. More than 20 vertical wells have been fractured, and the oil production of 17 wells has exceeded 5 t/d. The oil production of eight of these wells is more than 10 t/d. The intervals with high production are mainly laminated felsic shales, laminated mixed shales, or a combination of these [19,20,21,22,23,24,25,26,27,28,29,30,31,32,33,34,35,36,37,38,39,40,41,42,43,44,45,46,47,48,49,50,51,52,53,54,55,56,57,58,59,60,61,62,63,64,65,66].
To select the optimal enrichment intervals of shale oil from laminated felsic shales and laminated mixed shales, a comprehensive evaluation column of shale oil sweet spot intervals was established according to key parameters such as physical properties, compressibility, saturated hydrocarbon content, and lamina density, combined with the identification results of fracture and lamina development by fullbore formation microimager (FMI) logs. Two Class I shale oil sweet spot intervals were developed in well G-A, with depths of 2932.7–2976.7 m and 3190.77–3244.97 m, respectively, and one class II shale oil sweet spot interval was developed in well G-A with a depth of 3138.97–3160.87 m, and these intervals can be considered favorable for shale oil exploration (Figure 16).

6. Conclusions

Based on XRD analysis, FE-SEM, TOC analysis, Rock-Eval pyrolysis, LNP, MIP, and MIS pyrolysis tests, this study investigated the occurrence of lacustrine shale oil in the second member of the Kongdian Formation and gained a deeper understanding of the factors controlling shale oil mobility. The shales were dominated by quartz, plagioclase, ankerite, and clay minerals with subordinated dolomite, calcite, and analcite. Five types of lithofacies were identified in Ek2 according to the content of three main mineral compositions together with sedimentary structures, including laminated felsic shales, laminated mixed shales, massive mixed shales, laminated carbonate shales, and massive carbonate shales.
The shales were characterized by a high organic matter abundance and moderate thermal evolution with good to excellent hydrocarbon generation potential, and contained a high abundance of Type I and II1 kerogens. The oil-bearing properties and occurrence form characteristics in different lithofacies showed great differences. Laminated felsic shales and laminated mixed shales showed obvious advantages in S1, OSI, free oil, and movable oil content compared with other lithofacies.
Residual oil mainly occured in pores with diameters smaller than 200 nm. The occurrence of shale oil in larger pores from laminated shales to massive shales was gradual, and the pore diameter of the residual oil which occurred in some laminated shale samples reached 50 μm. The lower limits of the pore diameter of the occurring free oil and movable oil were 7 and 30 nm, respectively. Shale oil components, thermal maturity, TOC content, and pore volume played essential roles in the mobility of shale oil. Two Class I shale oil sweet spot intervals and one class II interval can be considered favorable for shale oil exploration based on the above results.

Author Contributions

Conceptualization, Q.D.; methodology, S.C.; software, B.W.; validation, D.X.; formal analysis, Z.S.; investigation, Z.F.; resources, J.D.; data curation, W.H.; writing—original draft preparation, Q.D.; writing—review and editing, S.C.; visualization, Q.D.; supervision, J.Y.; project administration, X.P.; funding acquisition, X.P. All authors have read and agreed to the published version of the manuscript.

Funding

This research was funded by the National Key R&D Program of China (2020YFA0710504), Scientific Research and Technology Development Project of PetroChina (2021DQ0508) and Major Science and Technology Project of PetroChina (2019E-26).

Data Availability Statement

Not applicable.

Conflicts of Interest

The authors declare no conflict of interest.

References

  1. Sonnenberg, S.A.; Pramudio, A. Petroleum geology of the giant Elm Coulee field, Williston Basin. AAPG Bull. 2009, 93, 1127–1153. [Google Scholar] [CrossRef]
  2. Jarvie, D.M. Shale Resource Systems for Oil and Gas: Part 2-Shale-Oil Resource Systems; AAPG Memoir; American Association of Petroleum Geologists: Tulsa, OK, USA, 2012; pp. 89–119. [Google Scholar]
  3. Soeder, D.J. The successful development of gas and oil resources from shales in North America. J. Pet. Sci. Eng. 2018, 163, 399–420. [Google Scholar] [CrossRef]
  4. Zhao, X.Z.; Zhou, L.H.; Pu, X.G.; Jin, F.M.; Shi, Z.N.; Han, W.Z.; Jiang, W.Y.; Han, G.M.; Zhang, W.; Wang, H.; et al. Formation conditions and enrichment model of retained petroleum in lacustrine shale: A case study of the Paleogene in Huanghua depression, Bohai Bay Basin, China. Pet. Explor. Dev. 2020, 47, 856–869. [Google Scholar] [CrossRef]
  5. Energy Information Administration (EIA). Annual Energy Outlook 2020: With Projections to 2050. 2020. Available online: https://www.eia.gov/outlooks/aeo/pdf/AEO2020%20Full%20Report.pdf (accessed on 12 October 2021).
  6. Jin, X.; Li, G.X.; Meng, S.W.; Wang, X.Q.; Liu, C.; Tao, J.P.; Liu, H. Microscale comprehensive evaluation of continental shale oil recoverability. Pet. Explor. Dev. 2021, 48, 256–268. [Google Scholar] [CrossRef]
  7. Liu, C.L.; Wang, Z.L.; Guo, Z.Q.; Hong, W.Y.; Dun, C.; Zhang, X.; Li, B.; Wu, L.Q. Enrichment and distribution of shale oil in the Cretaceous Qingshankou Formation, Songliao Basin, Northeast China. Mar. Pet. Geol. 2017, 86, 751–770. [Google Scholar] [CrossRef]
  8. Zhou, L.M.; Pang, X.Q.; Wu, L.Y.; Kuang, L.W.; Pang, H.; Jiang, F.J.; Bai, H.; Peng, J.W.; Pan, J.W.; Pan, Z.H.; et al. Petroleum generation and expulsion in middle Permian Lucaogou Formation, Jimusar Sag, Junggar Basin, northwest China: Assessment of shale oil resource potential. Geol. J. 2017, 52, 1032–1048. [Google Scholar] [CrossRef]
  9. Zhou, L.; Chen, C.; Yang, F.; Han, W.Z.; Guan, Q.S. Micropore structure characteristics and quantitative characterization methods of lacustrine shale-A case study from the member 2 of Kongdian Formation, Cangdong sag, Bohai Bay Basin. Pet. Res. 2020, 5, 93–102. [Google Scholar] [CrossRef]
  10. Wu, Z.Y.; Zhao, X.Z.; Li, J.Z.; Pu, X.G.; Tao, X.W.; Shi, Z.N.; Sun, Y.Z. Paleoenvironmental modes and organic matter enrichment mechanisms of lacustrine shale in the Paleogene Shahejie Formation, Qikou Sag, Bohai Bay Basin. Energy Rep. 2021, 7, 9046–9068. [Google Scholar] [CrossRef]
  11. Zhang, J.G.; Jiang, Z.X.; Liang, C.; Baars, T.F.; Wang, Y.W.; Abets, H.A. Astronomical forcing of meter-scale organic-rich mudstone-limestone cyclicity in the Eocene Dongying sag, China: Implications for shale reservoir exploration. AAPG Bull. 2022, 106, 1557–1579. [Google Scholar] [CrossRef]
  12. Han, W.Z.; Zhao, X.Z.; Jin, F.M.; Pu, X.G.; Chen, S.Y.; Mu, L.G.; Zhang, W.; Shi, Z.N.; Wang, H. Sweet spots evaluation and exploration of lacustrine shale oil of the second member of Paleogene Kongdian Formation in Cangdong Sag, Bohai Bay Basin. Pet. Explor. Dev. 2021, 48, 777–786. [Google Scholar] [CrossRef]
  13. Li, M.W.; Ma, X.X.; Jiang, Q.G.; Li, Z.M.; Pang, X.Q.; Zhang, C.T. Enlightenment from formation conditions and enrichment characteristics of marine shale oil in North America. Pet. Geol. Recovery Effic. 2019, 26, 13–28. [Google Scholar]
  14. Hu, S.Y.; Bai, B.; Tao, S.Z.; Bian, C.S.; Zhang, T.S.; Chen, Y.Y.; Liang, X.W.; Wang, L.; Zhu, R.K.; Jia, J.H.; et al. Heterogeneous geological conditions and differential enrichment of medium and high maturity continental shale oil in China. PetrolPet. Explor. Dev. 2022, 49, 257–271. [Google Scholar] [CrossRef]
  15. Ma, Y.S.; Feng, J.H.; Mu, Z.H.; Zhao, P.R.; Bao, S.J.; Wang, F. The potential and exploring progress of unconventional hydrocarbon resources in SINOPEC. Eng. Sci. 2012, 14, 22–30. [Google Scholar] [CrossRef]
  16. Pu, X.G.; Zhou, L.H.; Han, W.Z.; Zhou, J.S.; Wang, W.G.; Zhang, W.; Chen, S.Y.; Shi, Z.N.; Liu, S. Geologic features of fine-grained facies sedimentation and tight oil exploration: A case from the second Member of Paleogene Kongdian Formation of Cangdong sag, Bohai Bay Basin. Pet. Explor. Dev. 2016, 43, 24–33. [Google Scholar] [CrossRef]
  17. Pu, X.G.; Shi, Z.N.; Han, W.Z.; Peng, X.M.; Zhang, W.; Zhu, B.X. Petroleum geological characteristics and hydrocarbon discovery of shale system in fine-grained sedimentary area of lacustrine basin: A case study of Kong2 Member in Cangdong Sag, Huanghua Depression. Pet. Geol. Recovery Effic. 2019, 26, 46–58. [Google Scholar]
  18. Zhao, X.Z.; Zhou, L.H.; Pu, X.G.; Jin, F.M.; Han, W.Z.; Xiao, D.Q.; Chen, S.Y.; Shi, Z.N.; Zhang, W.; Yang, F. Geological characteristics of shale rock system and shale oil exploration breakthrough in a lacustrine basin: A case study from the Paleogene 1st sub-member of Kong 2 Member in Cangdong sag, Bohai Bay Basin, China. Pet. Explor. Dev. 2018, 45, 377–388. [Google Scholar] [CrossRef]
  19. Zhao, X.Z.; Zhou, L.H.; Pu, X.G.; Jin, F.M.; Han, W.Z.; Shi, Z.N.; Chen, C.W.; Jiang, W.Y.; Guan, Q.S.; Xu, J.; et al. Theories, technologies and practices of lacustrine shale oil exploration and development: A case study of Kongdian Formation in Cangdong sag, Bohai Bay Basin, China. Pet. Explor. Dev. 2022, 49, 707–718. [Google Scholar] [CrossRef]
  20. Chen, K.F.; Liu, X.P.; Liu, J.; Zhang, C.; Guan, M.; Zhou, S.X. Lithofacies and pore characterization of continental shale in the second Member of the Kongdian Formation in the Cangdong Sag, Bohai Bay Basin, China. J. Pet. Sci. Eng. 2019, 177, 154–166. [Google Scholar] [CrossRef]
  21. Han, W.Z.; Zhao, X.Z.; Pu, X.G.; Chen, S.Y.; Wang, H.; Liu, Y.; Shi, Z.N.; Zhang, W.; Wu, J.P. Fine-grained rock fabric facies classification and its control on shale oil accumulation: A case study from the Paleogene Kong 2 Member, Bohai Bay Basin. Front. Earth Sci. 2021, 15, 423–437. [Google Scholar] [CrossRef]
  22. Yang, R.; Jia, A.Q.; He, S.; Wang, T.; Hu, Q.H. Pore Structure characterization and reservoir quality evaluation of analcite-rich shale oil reservoir from the Bohai Bay Basin. Energy Fuels 2021, 35, 9349–9368. [Google Scholar] [CrossRef]
  23. Liang, C.; Wu, J.; Jiang, Z.X.; Cao, Y.C.; Song, G.Q. Sedimentary environmental controls on petrology and organic matter accumulation in the upper fourth member of the Shahejie Formation (Paleogene, Dongying depression, Bohai Bay Basin, China). Int. J. Coal Geol. 2018, 186, 1–13. [Google Scholar] [CrossRef]
  24. Fang, Z.; Chen, S.Y.; Pu, X.G.; Yan, J.H.; Chen, X.R. Control of sedimentary environment on the lithofacies of lacustrine fine-grained sedimentary rocks in the second member of the Kongdian Formation in the Cangdong sag, Bohai Bay Basin, China. Geol. J. 2022, 57, 2321–2345. [Google Scholar] [CrossRef]
  25. Zhao, X.Z.; Pu, X.G.; Zhou, L.H.; Jin, F.M.; Han, G.M.; Shi, Z.N.; Han, W.Z.; Ding, Y.J.; Zhang, W.; Wang, G.N.; et al. Enrichment theory, exploration technology and prospects of shale oil in lacustrine facies zone of deep basin:a case study of the Paleogene in Huanghua depression, Bohai Bay Basin. Acta Pet. Sin. 2021, 42, 143–162. [Google Scholar]
  26. Luo, L.; Qi, J.; Li, H.; Dong, Y.; Zhang, S.; Zhang, X.; Yu, X.; Luo, L. Geometry and evolution of the Cangdong sag in the bohai bay basin, China: Implications for subduction of the Pacific Plate. Sci. Rep. 2017, 7, 15393. [Google Scholar] [CrossRef] [Green Version]
  27. Pecharsky, V.K.; Zavalij, P.Y. Fundamentals of Powder Diffraction and Structural Characterization of Materials; Kluwer Academic: Amsterdam, The Netherlands, 2003. [Google Scholar]
  28. Brunauer, S.; Emmett, P.H.; Teller, E. Adsorption of gases in multimolecular layers. J. Am. Chem. Soc. 1938, 60, 309–319. [Google Scholar] [CrossRef]
  29. Barrett, E.P.; Joyner, L.G.; Halenda, P.P. The determination of pore volume and area distributions in porous substances. I. Computations from nitrogen isotherms. J. Am. Chem. Soc. 1951, 73, 373–380. [Google Scholar] [CrossRef]
  30. Washburn, E.W. The dynamics of capillaryflow. Phys. Rev. 1921, 17, 273. [Google Scholar] [CrossRef] [Green Version]
  31. Milliken, K. A compositional classification for grain assemblages in fine-grained sediments and sedimentary rocks. J. Sediment. Res. 2014, 84, 1185–1199. [Google Scholar] [CrossRef]
  32. Birdwell, J.E.; Berg, M.D.V.; Johnson, R.C.; Mercier, T.J.; Boehlke, A.; Brownfield, M. Geological, geochemical and reservoir characterization of the Uteland Butte member of the Green River Formation, Uinta Basin, Utah. In Hydrocarbon Source Rocks in Unconventional Plays; Dolan, M.P., Higley, D.H., Lillis, P.G., Eds.; Rocky Mountain Association of Geologists, Rocky Mountain Region: Denver, CO, USA, 2016; pp. 352–378. [Google Scholar]
  33. Peng, J.W.; Milliken, K.; Fu, Q. Quartz types in the Upper Pennsylvanian organic-rich Cline Shale (Wolfcamp D), Midland Basin, Texas: Implications for silica diagenesis, porosity evolution, and rock mechanical properties. Sedimentology 2020, 67, 2040–2064. [Google Scholar] [CrossRef]
  34. Peng, J.W.; Milliken, K.; Fu, Q.; Janson, X. Grain assemblages and diagenesis in organic-rich mudrocks, Upper Pennsylvanian Cline Shale (Wolfcamp D), Midland Basin, Texas. AAPG Bull. 2020, 104, 1593–1624. [Google Scholar] [CrossRef]
  35. Boak, J.; Wu, T.F.; Birdwell, J.E. Geochemical Studies of the Green River Formation in the Piceance Basin, Colorado: I. Major, Minor, and Trace Elements; Utah Geological Association Publication: Salt Lake City, UT, USA, 2022; pp. 1–32. [Google Scholar]
  36. Yawar, Z.; Schieber, J. On the origin of silt laminae in laminated shales. Sediment. Geol. 2017, 360, 22–34. [Google Scholar] [CrossRef]
  37. Martin-Bello, L.; Arenas, C.; Andrews, J.E.; Alonso-Zarza, A.M.; Marca, A. Lacustrine stromatolites as multi-scale recorders of climate change: Insights from the Miocene Ebro Basin. Palaeogeogr. Palaeoclimatol. Palaeoecol. 2019, 530, 312–329. [Google Scholar] [CrossRef]
  38. Peng, J.W. Sedimentology of the Upper Pennsylvanian organic-rich Cline Shale, Midland Basin: From gravity flows to pelagic suspension fallout. Sedimentology 2021, 68, 805–833. [Google Scholar] [CrossRef]
  39. Loucks, R.G.; Ruppel, S.C. Mississippian barnett shale: Lithofacies and depositional setting of a deep-water shale-gas succession in the fort worth basin, Texas. AAPG Bull. 2007, 91, 579–601. [Google Scholar] [CrossRef] [Green Version]
  40. Hickey, J.J.; Henk, B. Lithofacies summary of the Mississippian Barnett shale, mitchell 2 T.P. Sims well, Wise county, Texas. AAPG Bull. 2007, 91, 437–443. [Google Scholar] [CrossRef]
  41. Peng, J.W.; Hu, Z.; Feng, D.; Wang, Q. Sedimentology and sequence stratigraphy of lacustrine deep-water fine-grained sedimentary rocks: The Lower Jurassic Dongyuemiao Formation in the Sichuan Basin, Western China. Mar. Petr. Geol. 2022, 146, 105933. [Google Scholar] [CrossRef]
  42. Hackley, P.C.; Fishman, N.; Wu, T.; Baugher, G. Organic petrology and geochemistry of mudrocks from the lacustrine Lucaogou Formation, Santanghu Basin, northwest China: Application to lake basin evolution. Int. J. Coal Geol. 2016, 168, 20–34. [Google Scholar] [CrossRef] [Green Version]
  43. Van Krevelen, D. Coal: Typology. Chemistry, Physics, Constitution; Elsevier Publishing Company: New York, NY, USA, 1961; p. 541. [Google Scholar]
  44. Tissot, B.; Durand, B.; Espitalié, J.; Combaz, A. Influence of nature and diagenesis of organic matter in formation of petroleum. AAPG Bull. 1974, 58, 499–506. [Google Scholar]
  45. Mukhopadhyay, P.K.; Wade, J.A.; Kruge, M.A. Organic facies and maturation of Jurassic/Cretaceous rocks, and possible oil-source rock correlation based on pyrolysis of asphaltenes, Scotian basin, Canada. Org. Geochem. 1995, 22, 85–104. [Google Scholar] [CrossRef]
  46. Espitalié, J.; Bordenave, M.L. Source rock parameters. In Applied Petroleum Geochemistry; Editions Technip: Paris, France, 1993; p. 524. [Google Scholar]
  47. Espitalié, J.; Makadi, K.S.; Trichet, J. Role of the mineral matrix during kerogen pyrolysis. Org. Geochem. 1984, 6, 365–382. [Google Scholar] [CrossRef]
  48. Bordenave, M.L.; Espitalié, J.; Leplat, P.; Oudin, J.L.; Vandenbroucke, M. Screening techniques for source rock evaluation. In Applied Petroleum Geochemistry; Bordenave, M.L., Ed.; Editions Technip: Paris, France, 1993; pp. 217–278. [Google Scholar]
  49. Jarvie, D.M.; Hill, R.J.; Ruble, T.E.; Pollastro, R.M. Unconventional shale-gas systems: The Mississippian Barnett Shale of north-central Texas as one model for thermogenic shale-gas assessment. AAPG Bull. 2007, 91, 475–499. [Google Scholar] [CrossRef]
  50. Tissot, B.; Welte, D.H. Petroleum Formation and Occurrence; Springer: New York, NY, USA, 1984. [Google Scholar]
  51. Peters, K.E. Guidelines for evaluating petroleum source rock using programmed pyrolysis. AAPG Bull. 1986, 70, 318–329. [Google Scholar]
  52. Peters, K.E.; Cassa, M.R. Applied source rock geochemistry. In The Petroleum System-From Source to Trap; Magoon, L.B., Dow, W.G., Eds.; AAPG Memoir: Tulsa, OK, USA, 1994; Volume 60, pp. 93–120. [Google Scholar]
  53. Larter, S.R.; Huang, H.P.; Snowdon, L.R.; Bennett, B. What we do not know about self sourced oil reservoirs: Challenges and potential solutions. In Proceedings of the Society of Petroleum Engineers-Canadian Unconventional Resources Conference 2012, Calgary, AB, Canada, 30 October–1 November 2012; Volume 2012, pp. 1–4. [Google Scholar] [CrossRef]
  54. Jiang, Q.G.; Li, M.W.; Qian, M.H.; Li, Z.M.; Li, Z.; Huang, Z.K.; Zhang, C.M.; Ma, Y.Y. Quantitative characterization of shale oil in different occurrence states and its application. Pet. Geol. Exp. 2016, 38, 842–849. [Google Scholar]
  55. Li, Z.M.; Tao, G.L.; Li, M.W.; Jiang, Q.G.; Cao, T.T.; Liu, P.; Qian, M.H.; Xie, X.M.; Li, Z. Favorable interval for shale oil prospecting in coring Well L69 in the Paleogene Es3L in Zhanhua Sag, Jiyang Depression, Bohai Bay Basin. Oil Gas Geol. 2019, 40, 236–247. [Google Scholar]
  56. Li, Z.M.; Tao, G.L.; Li, M.W.; Qian, M.H.; Xie, X.M.; Jiang, Q.G.; Liu, P.; Bao, Y.J.; Xia, D.L. Discussion on prospecting potential of shale oil in the 3rd sub-member of the Triassic Chang 7 member in Binchang block, southwestern Ordos Basin. Oil Gas Geol. 2019, 40, 558–570. [Google Scholar]
  57. Li, Z.M.; Liu, P.; Qian, M.H.; Li, M.W.; Cao, T.T.; Tao, G.L.; Jiang, Q.G.; Bao, Y.J. Quantitative comparison of different occurrence oil for lacustrine shale: A case from cored interval of shale oil special drilling wells in Dongying depression, Bohai Bay Basin. Oil Gas Geol. 2018, 47, 1252–1263. [Google Scholar]
  58. Tao, G.L.; Liu, P.; Qian, M.H.; Li, M.W.; Li, Z.M.; Jiang, Q.G.; Wu, S.Q. Oil-bearing characteristics and exploration significance of inter-salt shale in Qianjiang formation, Qianjiang depression, Jianghan Basin. J. China Univ. Min. Technol. 2019, 48, 1256–1265. [Google Scholar]
  59. Wang, M.; Ma, R.; Li, J.B.; Lu, S.F.; Li, C.M.; Guo, Z.Q.; Li, Z. Occurrence mechanism of lacustrine shale oil in the Paleogene Shahejie Formation of Jiyang Depression, Bohai Bay Basin, China. Pet. Explor. Dev. 2019, 46, 833–846. [Google Scholar] [CrossRef]
  60. Chen, G.H.; Lu, S.F.; Zhang, J.F.; Pervukhina, M.; Liu, K.Y.; Wang, M.; Han, T.C.; Tian, S.S.; Liu, J.B.; Zhang, Y.Y.; et al. A method for determining oil-bearing pore size distribution in shales: A case study from the Damintun Sag, China. J. Petl. Sci. Eng. 2018, 166, 673–678. [Google Scholar] [CrossRef]
  61. Comisky, J.T.; Santiago, M.; McCollom, B.; Buddhala, A.; Newsham, K.E. Sample size effects on the application of mercury injection capillary pressure for determining the storage capacity of tight gas and oil shales. In Proceedings of the Society of Petroleum Engineers-Canadian Unconventional Resources Conference 2011, Calgary, AB, Canada, 15–17 November 2011; Volume 2011, pp. 2103–2125. [Google Scholar] [CrossRef]
  62. Yu, Y.X.; Wang, Z.X.; Zhang, K.X.; Cheng, M. Advances in quantitative characterization of shale pore structure by using fluid injection methods. J. Geomech. 2020, 26, 201–210. [Google Scholar]
  63. Zou, C.N.; Zhu, R.K.; Bai, B.; Yang, Z.; Wu, S.T.; Su, L.; Dong, D.Z.; Li, X.J. First discovery of nano-pore throat in oil and gas reservoir in China and its scientific value. Acta Petrol. Sin. 2011, 27, 1857–1864. [Google Scholar]
  64. Hu, Q.H.; Zhang, Y.X.; Meng, X.H.; Li, Z.; Xie, Z.H.; Li, M.W. Characterization of micro-nano pore networks in shale oil reservoirs of Paleogene Shahejie Formation in Dongying Sag of Bohai Bay Basin, East China. Pet. Explor. Dev. 2017, 44, 720–730. [Google Scholar] [CrossRef]
  65. Jin, Z.J.; Zhu, R.K.; Liang, X.P.; Shen, Y.Q. Several issues worthy of attention in current lacustrine shale oil exploration and development. Pet. Explor. Dev. 2021, 48, 1471–1484. [Google Scholar] [CrossRef]
  66. Zhao, X.Z.; Zhou, L.H.; Pu, X.G.; Jin, F.M.; Shi, Z.N.; Xiao, D.Q.; Han, W.Z.; Jiang, W.Y.; Zhang, W.; Wang, H. Favorable formation conditions and enrichment characteristics of lacustrine facies shale oil in faulted lake basin:a case study of Member 2 of Kongdian Formation in Cangdong sag, Bohai Bay Basin. Acta Pet. Sin. 2019, 40, 1013–1029. [Google Scholar]
  67. Wang, Y.S.; Li, Z.; Wang, M.; Bao, Y.S.; Zhu, R.F.; Liu, J.; Wu, L.B.; Yu, L.M. Factors controlling lacustrine shale oil adsorption in the Jiyang Depression, Bohai Bay Basin. Oil Gas Geol. 2022, 43, 489–498. [Google Scholar]
  68. Pernyeszi, T.; Patzkó, Á.; Berkesi, O.; Dékány, I. Asphaltene adsorption on clays and crude oil reservoir rocks. Colloid Surf. A 1998, 137, 373–384. [Google Scholar] [CrossRef]
  69. Zhang, L.Y.; Bao, Y.S.; Li, J.Y.; Li, Z.; Zhu, R.F.; Zhang, J.G. Movability of lacustrine shale oil: A case study of Dongying Sag, Jiyang Depression, Bohai Bay Basin. Pet. Explor. Dev. 2015, 41, 703–711. [Google Scholar] [CrossRef]
Figure 2. Composite stratigraphic column of Paleogene and Neogene strata in the Cangdong Sag, Bohai Bay Basin, China (modified from [24,25,26]).
Minerals 13 00199 g002
Figure 3. Mineral compositions and geochemical parameters of the Ek2 shales in the Cangdong Sag.
Minerals 13 00199 g003
Figure 4. Mineral compositions of the Ek2 shales in the Cangdong Sag. (a) Pie diagram. (b) Ternary diagram.
Minerals 13 00199 g004
Figure 5. Lithofacies characteristics of the Ek2 shales in the Cangdong Sag. (a) Well G-D, 3823.39 m, laminated felsic shale, core image. (b) Well G-A, 3079.72 m, laminated felsic shale, thin section image. (c) Well G-A, 2977.05 m, laminated felsic shale, AMICS image. (d) Well G-A, 3198.13 m, laminated mixed shale, core image. (e) Well G-A, 3295.73 m, laminated mixed shale, thin section image. (f) Well G-A, 2975.67 m, laminated mixed shale, AMICS image. (g) Well G-A, 3123.23 m, massive mixed shale, core image. (h) Well G-B, 3338.57 m, massive mixed shale, thin section image. (i) Well G-A, 3122.31 m, massive mixed shale, AMICS image. (j) Well G-A, 3168.60 m, laminated carbonate shale, core image. (k) Well G-A, 3276.66 m, laminated carbonate shale, thin section image. (l) Well G-A, 3116.01 m, laminated carbonate shale, AMICS image. (m) Well G-A, 3162.09 m, massive carbonate shale, core image. (n) Well G-C, 4086.82 m, massive carbonate shale, thin section image. (o) Well G-A, 2978.82 m, massive carbonate shale, AMICS image. LF: laminated felsic shale; LM: laminated mixed shale; MM: massive mixed shale; LC: laminated carbonate shale; MC: massive carbonate shale.
Minerals 13 00199 g005
Figure 6. Basic organic geochemical characteristics of the Ek2 shales in the Cangdong Sag. (a) Frequency distribution histogram of TOC. (b) Frequency distribution histogram of Ro. (c) Frequency distribution histogram of Tmax. (d) Plot of HI versus Tmax, showing the organic matter types. LF: laminated felsic shale; LM: laminated mixed shale; MM: massive mixed shale; LC: laminated carbonate shale; MC: massive carbonate shale.
Minerals 13 00199 g006
Figure 7. Oil-bearing characteristics of the Ek2 shales in the Cangdong Sag. (a) Frequency distribution histogram of S1. (b) Frequency distribution histogram of OSI. (c) Diagram of OSI versus Tmax. (d) Diagram of S2 versus TOC. LF: laminated felsic shale; LM: laminated mixed shale; MM: massive mixed shale; LC: laminated carbonate shale; MC: massive carbonate shale.
Minerals 13 00199 g007
Figure 8. Content of shale oil in different occurrence states of the Ek2 shales in the Cangdong Sag. (a) Histogram of S1-1, S1-2, S2-1, free oil, and total oil mean values. (b) Histogram of S1-1, S1-2, S2-1, free oil, and total oil mean values in different lithofacies. LF: laminated felsic shale; LM: laminated mixed shale; MM: massive mixed shale; LC: laminated carbonate shale; MC: massive carbonate shale.
Minerals 13 00199 g008
Figure 9. Experiment results and pore diameter distributions of low-temperature nitrogen physisorption and mercury intrusion porosimetry before and after solvent extraction of the Ek2 shales in the Cangdong Sag. (a,b) Results from low-temperature nitrogen physisorption. (c,d) Results from mercury intrusion porosimetry.
Minerals 13 00199 g009
Figure 10. Pore diameter distribution characteristics of residual oil in the Ek2 shales in the Cangdong Sag. (a) Oil volume distribution versus pore diameter of laminated shales. (b) Oil volume distribution versus pore diameter of massive shales. LF: laminated felsic shale; LM: laminated mixed shale; MM: massive mixed shale; LC: laminated carbonate shale; MC: massive carbonate shale.
Minerals 13 00199 g010
Figure 11. Lower limits of the pore diameter of the occurring free oil and movable oil in the Ek2 shales in the Cangdong Sag. (a) Correlation between free oil and oil content in pores with diameter >7 nm. (b) Correlation between pore diameter and correlation coefficient and slope of free oil. (c) Correlation between free oil and oil content in pores with diameter >30 nm. (d) Correlation between pore diameter and correlation coefficient and slope of movable oil.
Minerals 13 00199 g011
Figure 12. Characteristics of movable oil in the Ek2 shales in the Cangdong Sag. (a) Well G-C, 4106.79 m, laminated felsic shale. (b) Well G-C, 4112.41 m, laminated mixed shale. (c) Well G-A, 3212.21 m, laminated felsic shale. (d) Well G-A, 3189.36 m, La. (e) Well G-D, 3896.92 m, laminated felsic shale. (f) Well G-D, 3821.67 m, laminated carbonate shale.
Minerals 13 00199 g012
Figure 13. Correlations (a) between the proportion of adsorbed oil and Ro and (be) between the proportion of adsorbed oil and shale oil component.
Minerals 13 00199 g013
Figure 14. Correlations (a) between free oil and TOC, (b) between adsorbed oil and TOC, (c) between free oil and felsic minerals, (d) between adsorbed oil and felsic minerals, (e) between free oil and carbonate minerals, (f) between adsorbed oil and carbonate minerals, (g) between free oil and clay minerals, and (h) between adsorbed oil and clay minerals in the Ek2 shale in the Cangdong Sag.
Minerals 13 00199 g014
Figure 15. Correlations (a) between free oil and pore volume, (b) between adsorbed oil and pore volume, (c) between the proportion of adsorbed oil and pore volume, and (d) between adsorbed oil and specific surface area of the Ek2 shale in the Cangdong Sag.
Minerals 13 00199 g015
Figure 16. Comprehensive evaluation of sweet spot intervals of the Ek2 shale oil in the Cangdong Sag.
Minerals 13 00199 g016
Table 1. Organic geochemical parameters of the Ek2 shales in the Cangdong Sag.
Parameter Lithofacies
TotalLFLMMMLCMC
TOC/(wt.%)Average value3.654.744.512.962.941.96
Maximum value13.0913.0910.8612.479.9910.64
Minimum vale0.120.850.530.120.470.16
Ro/%Average value0.750.750.730.730.760.77
Maximum value1.211.031.040.900.911.21
Minimum vale0.510.590.510.530.710.68
Tmax/°CAverage value444.14443.26444.69445.41443.02443.85
Maximum value456.5453.70453.60454.80456.5455.5
Minimum vale431.60431.90431.90432.10431.60432.10
S1/(mg/g)Average value4.046.644.032.813.052.44
Maximum value18.0317.9911.6916.2811.3818.03
Minimum vale0.020.170.380.020.030.02
OSIAverage value132.38198.10128.0886.53111.05115.95
Maximum value654.93632.10522.00627.13562.06654.93
Minimum vale3.6211.018.485.253.783.62
S1-1 + S1-2 + S2-1/(mg/g)Average value23.2039.823.625.2112.7512.07
Maximum value61.9161.9145.3341.6925.3616.37
Minimum vale0.8418.942.581.010.841.34
S1-1/(mg/g)Average value3.235.123.442.323.082.31
Maximum value10.0910.096.534.845.955.35
Minimum vale0.031.290.460.140.030.26
S1-2/(mg/g)Average value3.695.344.022.263.573.46
Maximum value10.1710.177.144.146.145.78
Minimum vale0.231.580.910.590.430.23
S1-1 + S1-2
/(mg/g)
Average value6.9210.467.464.586.645.77
Maximum value20.2620.2613.677.7012.099.37
Minimum vale0.462.871.370.730.460.49
S2-1/(mg/g)Average value16.2829.3416.1420.636.116.30
Maximum value47.3147.3131.6634.1414.989.46
Minimum vale0.2811.031.240.280.380.85
Disclaimer/Publisher’s Note: The statements, opinions and data contained in all publications are solely those of the individual author(s) and contributor(s) and not of MDPI and/or the editor(s). MDPI and/or the editor(s) disclaim responsibility for any injury to people or property resulting from any ideas, methods, instructions or products referred to in the content.

