Article

Crude Oil Source and Accumulation Models for the Wenchang Formation, Southern Lufeng Sag, Pearl River Mouth Basin, (Offshore) China

1
State Key Laboratory of Petroleum Resources and Prospecting, China University of Petroleum, Beijing 102249, China
2
College of Geosciences, China University of Petroleum, Beijing 102249, China
*
Author to whom correspondence should be addressed.
Minerals 2023, 13(2), 162; https://doi.org/10.3390/min13020162
Submission received: 28 November 2022 / Revised: 5 January 2023 / Accepted: 13 January 2023 / Published: 21 January 2023
(This article belongs to the Special Issue Geochemical Characterization of Source Rocks in Oil and Gas Fields)

Abstract

:
In recent years, a large amount of industrial oil and gas resources have been discovered in the Paleogene Wenchang Formation (WC) of the southern Lufeng sag, confirming that the WC resources are promising prospects for petroleum exploration. However, because of the complex lithology, multiple sources of crude oil and multi-period charging characteristics in the WC, the accumulation process and model have not been clearly understood. Therefore, in this study, the main sources of crude oil and the process of hydrocarbon accumulation in key oil accumulation periods are determined by combining biomarker and geological analyses. Finally, the model of oil and gas accumulation is systematically summarized. The obtained results show that the source rock of the WC is the main source of hydrocarbons in the study area. The crude oil types in the southern Lufeng sag are classified into three types. Type A crude oil comes from source rocks of Wenchang Formation Members 3 and 4. Type B crude oil comes partly from source rocks of Wenchang Formation Members 1, 2, and 3 and partly from source rocks of Wenchang Formation Members 5 and 6. Type C crude oil is a mix of type A and type B crude oil. There are three accumulation periods that typify the study area: in the first period, accumulation was with vertical migration by fault; in the second period, accumulation was with lateral migration by sand body; and in the third period, accumulation was with vertical migration by sand body and adjacent to the source. The methodology and results of the accumulation process in southern Lufeng sag can support offshore oil and gas exploration.

1. Introduction

The ultimate goal of oil exploration is to help oil field companies make oil and gas discoveries at a low cost in the shortest possible time [1]. Identifying the source of crude oil in the reservoir and understanding the migration paths and accumulation molds can better predict favorable areas for hydrocarbon accumulation thereby maximizing the rate of exploration results [2,3,4], and oil–source correlation plays an important role in determining crude oil sources and analyzing hydrocarbon migration directions [5]. It is mainly based on the principles of organic geochemistry, and reasonable matching parameters are selected to analyze the relationship between crude oil and source rocks [6,7,8,9]. Previously, a large number of domestic and foreign scholars have explored geochemical methods for oil–source correlation [10,11,12,13].
Currently, oil and source rock correlation indicators are widely used, including physical properties of crude oil, biomarker compounds, bulk composition, stable carbon isotopes, and so on [7,14]. The most commonly used correlation index is biomarker compounds [9]. The applicability and indicative significance of terpenes, isoprene, steranes, and aromatic steranes in oil and source rock correlation have been clarified internationally [15,16,17]. However, there is almost no detailed study and conclusive evidence as to whether biomarkers are significantly affected by thermal maturation or biodegradation [18]. Moreover, the biomarker can occasionally feature similarly in various oil and source rock correlations, resulting incorrect conclusions [19,20]. Therefore, the use of geochemical methods for oil and source rock correlation must be combined with actual geological conditions to draw inferences.
The Pearl River Mouth Basin is located in the northern part of the South China Sea. Lufeng sag is located in the northeast of the Zhu I depression in the Basin. It is the most mature area for Paleogene exploration and research in the Pearl River Mouth Basin, with promising prospects for resource exploration [21,22,23,24]. In the past 10 years, a series of breakthroughs have already been achieved in the Paleogene. For instance, Lufeng 14-D, Lufeng 13-A, Lufeng 14-H, Lufeng 8-A, Lufeng 13-J, and other oilfields have been discovered [25,26,27]. Shallow lacustrine to deep lacustrine facies source rocks of the Wenchang Formation (WC) and shallow lacustrine to swamp facies source rocks of the Enping Formation (EP) are developed in the Paleogene, in which source rocks of the WC are the main source, and EP is a secondary hydrocarbon source rock [24,27,28,29,30]. The WC has the remarkable advantage of “near-source accumulation”. It is a favorable section for petroleum exploration and development and an important reserve-increasing field in the sag [31,32].
Although the Paleogene WC has great resource potential, the success rate of commercial exploration is low [25]. In addition, the lithology of the source rocks of the WC is complex, showing heterogeneity, and the abundance of organic matter is different in each member [33]. The source and accumulation process of oil and gas in the WC reservoir are not clearly understood, and the direction of the next breakthrough is unknown, which restricts the exploration of the deep Paleogene. Therefore, determining the accumulation process throughout the geological history of the study area and establishing accumulation models are necessary tasks.
There are few research data in the north of Lufeng sag, and the oil and gas discovery is mainly located in the southwest of the sag. This paper takes the southwest of Lufeng sag as the main research object. Firstly, the relative contribution of source rocks in different strata is determined by the characteristics of hydrocarbon generation and expulsion of source rocks, and the source of crude oil of the WC is determined by the combination of the organic geochemical method and geological analysis. Then, according to the hydrocarbon accumulation period in the study area, the hydrocarbon accumulation process of the WC reservoir in southern Lufeng area is confirmed. Finally, hydrocarbon accumulation is established. The results of this study have great significance in guiding offshore petroleum exploration in the Lufeng sag.

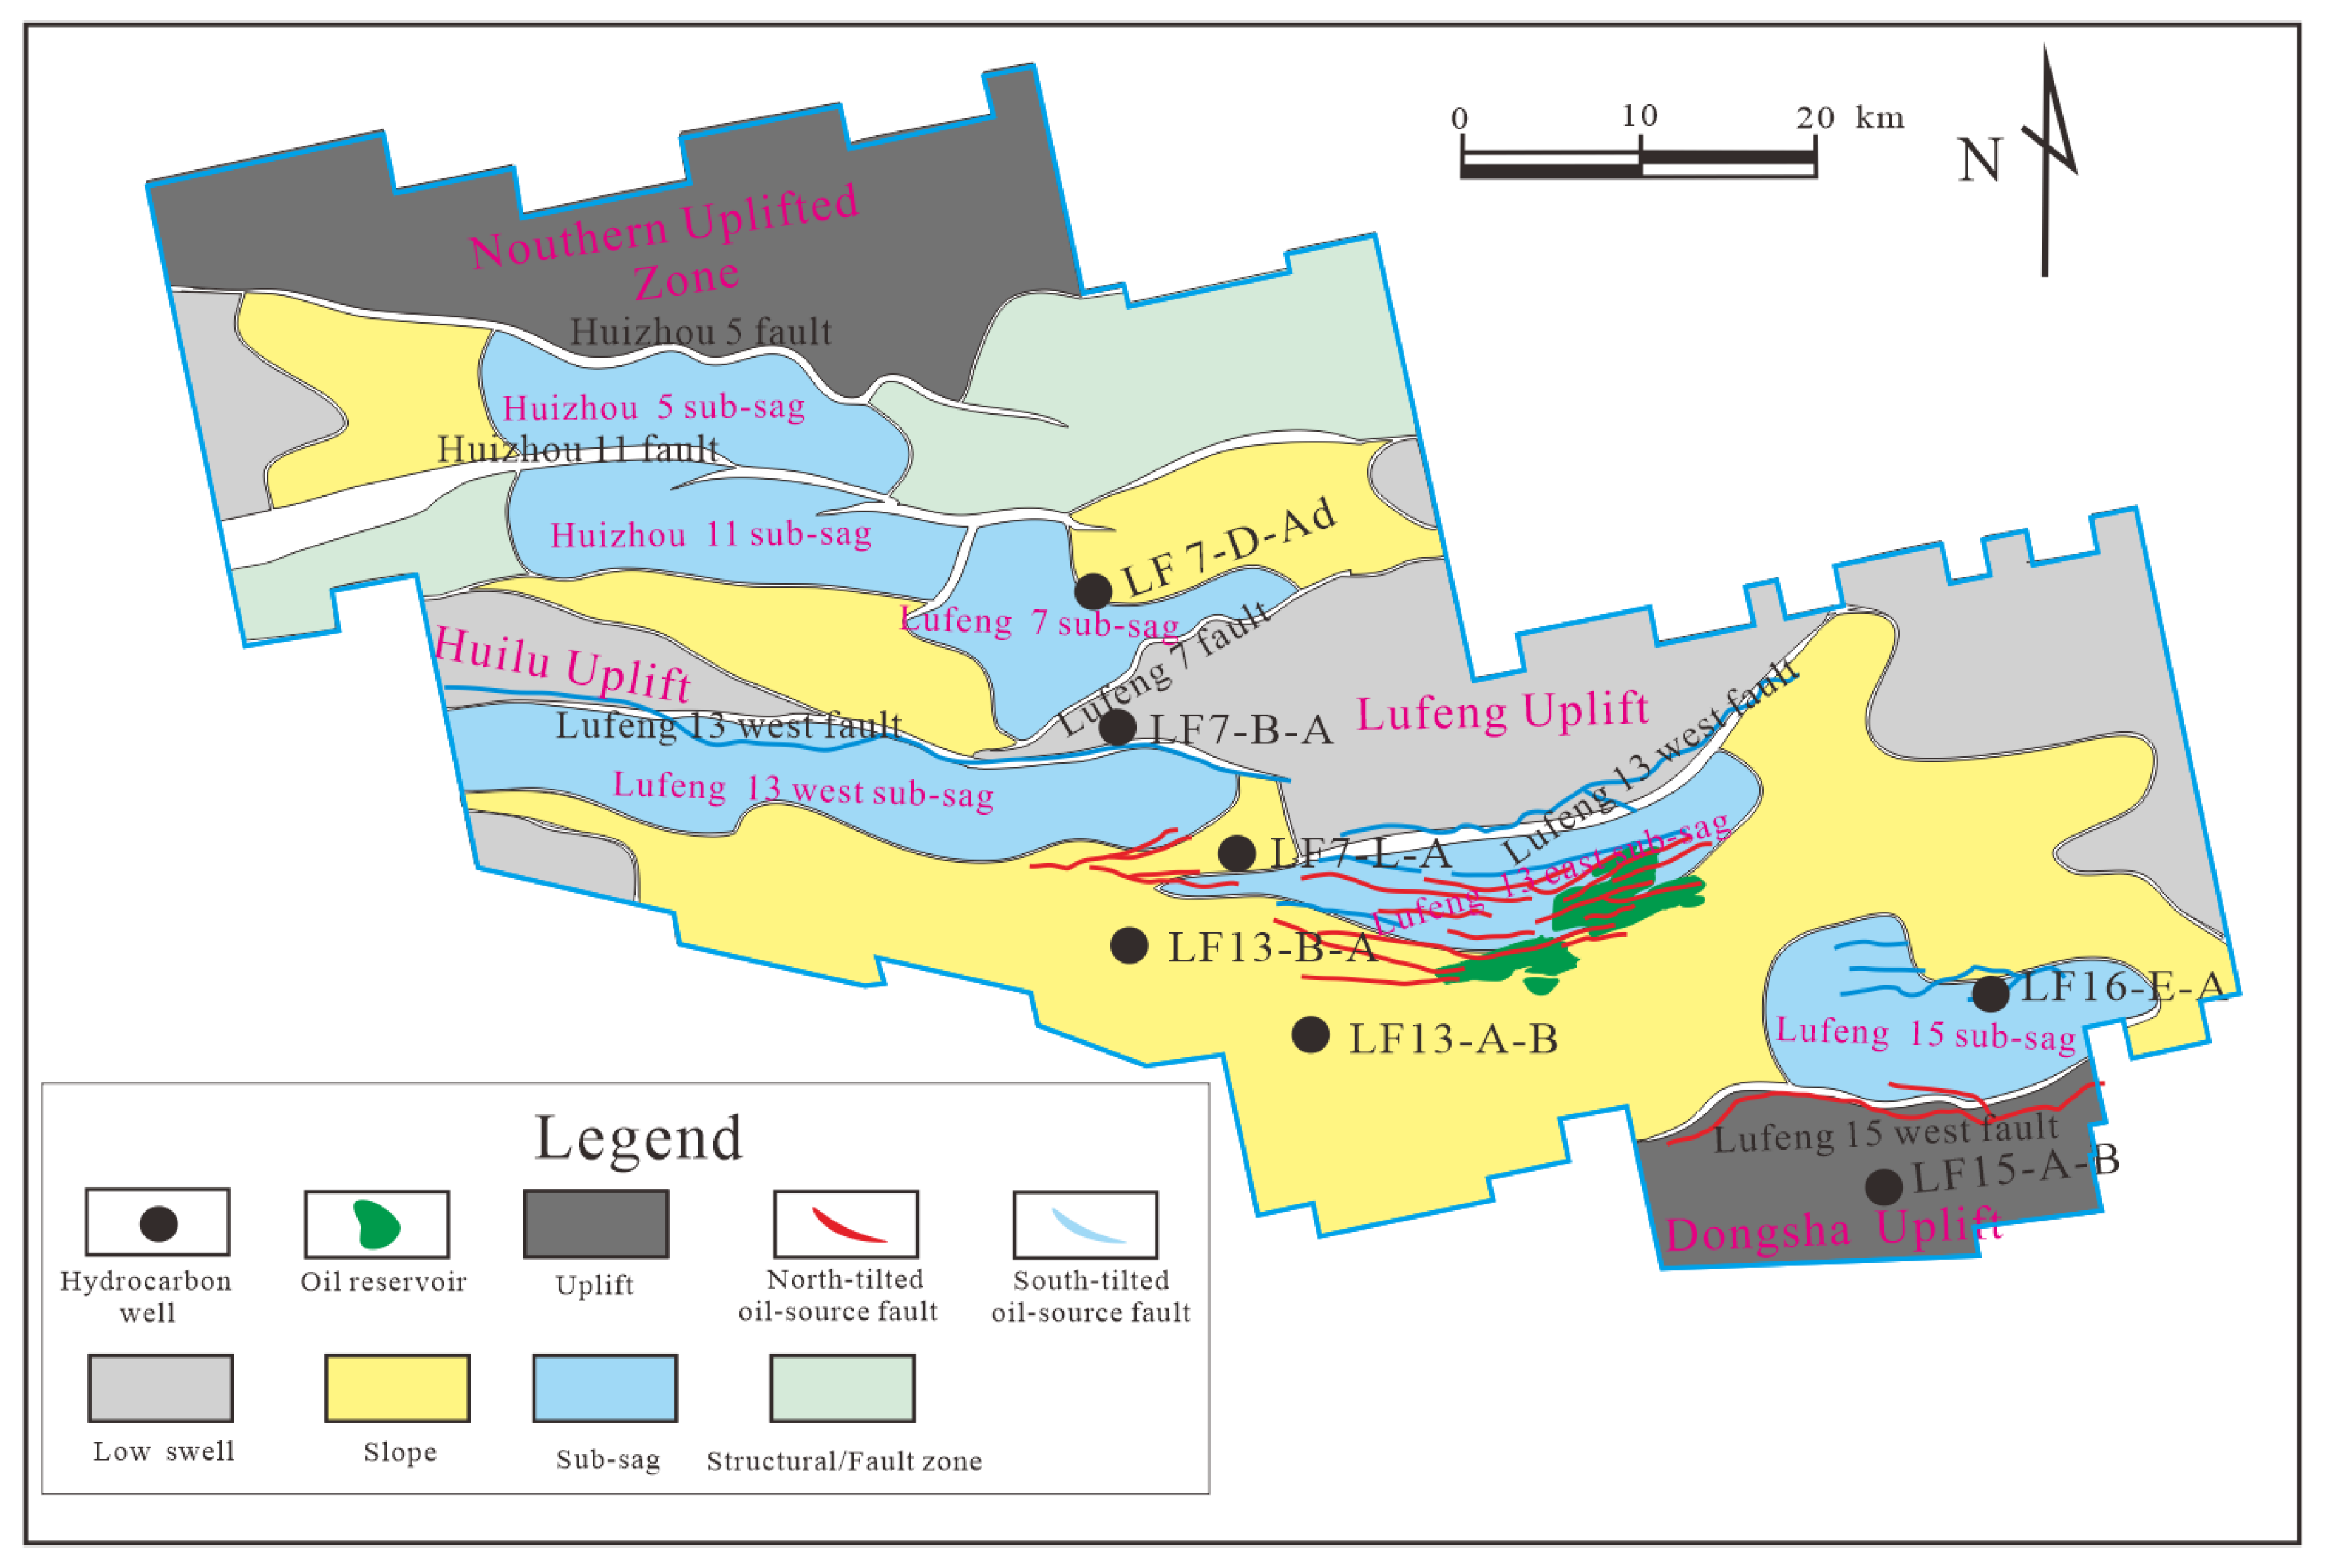
2. Geological Background

The Pearl River Mouth Basin is located in the northern part of the South China Sea, adjacent to Taiwan and Hainan, and is one of the largest offshore petroliferous basins in China (Figure 1a) [34,35]. This 800 km long and 100–300 km wide basin spreads in the northeast–southwest direction [36] with three uplifts and two depressions in its structure. It is divided into five structural units: the northern uplift belt, the northern depression belt, the central uplift belt, the southern depression belt, and the southern uplift belt [35,37,38].
The Zhu I depression is located in the northern depression belt of the Pearl River Mouth Basin, spanning an area of about 37,380 km2 in the northeast–southwest direction. From north to south, it has five secondary sags: the Hanjiang, Lufeng, Huizhou, Xijiang, and Enping sags (Figure 1b). The Lufeng sag is located in the north of the Zhu I depression, adjacent to the Haifeng uplift in the north and the Huilu low uplift in the south, and is bounded by the northern uplift belt and Dongsha uplift in the east and west, respectively. It spans an area of about 7760 km2 and is the most explored hydrocarbon sag in the Zhu I depression [21]. Here, Paleogene strata are the key areas for further petroleum exploration [24].
There are six sub-sags and two uplifts in the Paleogene of the Lufeng sag (Figure 1c). Of these, the Lufeng 13 and Lufeng 15 sub-sags are important hydrocarbon generation sub-sags and significant petroleum exploration blocks [21]. Up to November 2020, about 51 exploration wells had been explored in the Lufeng sag, only 4 of which are Paleogene industrial hydrocarbon wells. The distribution of Paleogene hydrocarbon reservoirs has been very limited, mainly distributed in the southeast of the Lufeng 13 eastern sub-sag. In addition, a Paleogene reservoir has also been drilled in the area where the Lufeng 7 sub-sag and Lufeng 13 sub-sag intersect. However, this reservoir area is small, and no significant hydrocarbon discoveries have been made in the exploration wells deployed around the reservoir (Figure 1c).
The Shenhu Formation is not existent in the Lufeng area, and the pre-Paleogene basement is in disconformity or unconformity contact with the WC. The strata include the Paleogene WC, the EP, and the Zhuhai Formation; the Neogene Zhujiang Formation, the Hanjiang Formation, the Yuehai Formation, and the Wanshan Formation; and a Quaternary stratum [24,27]. Overall, the study area has suffered from continental to marine facies sedimentary processes, where the Paleogene stratigraphic sedimentary period mainly belongs to the continental sedimentary stage. The tectonic movement was strong, and the sedimentary system rapidly changed. The sedimentary facies are mainly of three types: lacustrine, braided river delta, and fan delta facies (Figure 1d). During the Neogene stratigraphic sedimentary period, the structure was stable, dominated by marine sediments.
The WC is the main source rock series in the Lufeng sag, mainly comprising semi-deep lacustrine to deep lacustrine facies. The WC is subdivided from bottom to top into the Wenchang Formation Member 6 (WC6), the Wenchang Formation Member 5 (WC5), the Wenchang Formation Member 4 (WC4), the Wenchang Formation Member 3 (WC3), the Wenchang Formation Member 2 (WC2), and the Wenchang Formation Member 1 (WC1). WC6 to WC4 are collectively called the lower WC, and the top three members are collectively called the upper WC [38]. In the period of WC6 sedimentation, the sedimentary range was limited (only in the interior of the Lufeng 13 and Lufeng 15 sub-sags). From the WC5 to the WC6, the water body deepened, and the area of the lake gradually increased. At the end of the sedimentary period of the WC3, the sag began to enter the uplift stage, the water body began to become shallow, and the lake area began to decrease. By the end of the WC1 sedimentary period, the Lufeng sag rose above the sea level as a whole and suffered weathering and erosion. The lower WC, from the WC6 to the WC5 mainly comprises clastic conglomerate, pyroclastic rock, channel sandstone, and the lithology of the WC4 is mainly thick dark mudstone. The upper WC is dominated by mudstone intercalated with thin sandstone and red mudstone [39].
Since the Paleogene, the Lufeng sag has experienced two tectonic evolution stages, a rifting period and a late rift stage, forming a double-layer structure of the lower part of the fracture and the upper part of the depression [21,40,41]. Several tectonic movements occurred during this period (Figure 1d) [24,39]. The sedimentary period of the WC mainly corresponded to the tectonic movement stage from the first act of the Zhuqiong Movement to the second act of the Zhuqiong Movement, which was about 47.8–38.0 Ma, forming a fault in the NE–NEE direction [42]. This sedimentary period can be classified into three rift stages as follows.
  • Initial rift stage: This stage corresponds to the WC6 and the WC5 sedimentary stage. The main fault was normal, and the basement fault or trunk fault controlled the graben structure;
  • Strong rift stage: This stage corresponds to the WC5 and the WC4 sedimentary period. The fault distance of the main fault increased obviously. The fault rotated and was controlled to form several rolling half-graben structures, and the sedimentary thickness increased. The sag centers of the Lufeng 7, Lufeng 13, and Lufeng 15 sub-sags are obvious. Under the influence of the Huizhou Movement, during the WC4 sedimentary period, the strata uplifted and suffered extensive erosion at the Lufeng low uplifts and the Huilu low uplift;
  • Weak rift stage: This stage corresponds to the WC3 to the WC1 sedimentary period. During this stage, the fault extension was weakened, and the fault distance was small.

3. Materials and Methods

3.1. Materials

In this study, 210 core samples were obtained from 25 wells in the southern Lufeng sag. The sampling wells and sampling layers were relatively uniformly distributed. A total of 65 vitrinite reflectance data of the WC, 8 vitrinite reflectance data of the EP, crude oil physical property data of 15 wells, accumulation period data of 9 hydrocarbon reservoirs from 8 wells, and other geological data were collected. All samples and geological data were provided by Shenzhen Branch of China National Offshore Oil Corporation Limited.

3.2. Laboratory Methods

3.2.1. Total Organic Carbon (TOC) and Pyrolysis Experiment

The source rock samples were crushed to a size smaller than 0.2 mm for TOC analysis. According to the lithology and color of the sample, the sample of 0.01 g to 1.00 g was weighed and put in the crucible. The crucible was placed into the beaker, and the solution of excess hydrochloric acid and distilled water (volume ratio: 1:7) was added. The beaker was heated on an electric hot plate with temperature 60–80 °C for more than 2 h until the reaction was complete. We placed the crucible on the filter and rinsed with distilled water until neutral. We put the sample in a constant temperature drying oven and dried the sample within 60–80 °C. One g iron flux and one g tungsten flux were added to the dried sample porcelain crucible. The crucible with the air-dried sample was placed in a LECO CS instrument for determination.
A Rock-Eval II instrument was used for the Rock-Eval pyrolysis [43,44]. Firstly, the source rock samples were crushed to the size of 0.07 mm~0.15 mm. Then, the 100 mg samples were weighed and placed into Rock-Eval II instrument for pyrolysis. The heating rate of the instrument was 50 °C/min. The S1 peak was measured when heated to 300 °C. S2 peak, and Tmax were obtained when heated from 300 °C to 600 °C.

3.2.2. Biomarker Identification

Firstly, the source rock samples were dried and crushed until the particle size was less than 0.18 mm. We put the sample powder into an extracted filter paper cylinder. Then, we put the sample into a Soxhlet extractor and added a piece of copper to the flask. Secondly, the extractor and flask containing the sample were installed on the bracket and heated in a constant temperature water bath for 24 h. When the extraction solution showed no fluorescence, the extraction was completed. The extracted solvent was volatilized to near dry at no more than 40 °C, and chloroform asphalt “A” was obtained by weighing.
We weighed chloroform asphalt “A” and crude oil under constant shaking, added 30 mL or so of n-hexane, and placed for more than 12 h to fully precipitate asphaltene. We filtered the asphaltene with a short-necked funnel stuffed with skimmed cotton and washed it with n-hexane until the filtrate was colorless. The soluble substances of chloroform asphalt “A” and crude oil from the source rock were injected into the chromatographic column. The saturated hydrocarbon components were separated by eluting 5 mL n-hexane for 6 times each time. Using a clean micro syringe, 1–2 μL samples were injected into a gas chromatography–mass spectrometer (GC-MS) for analysis.

3.3. Hydrocarbon Generation Potential (HGP) Method

The HGP method is mainly based on the distribution of present-day source rocks to infer the previous change pattern of source rocks. The same type of source rocks at different locations and different burial depths are regarded as samples of this type of source rock in different locations and different historical periods. Thus, based on the vertical variation relationship of the HGP of this type of source rock in the geological profile, the depth of the hydrocarbon expulsion threshold (HET) of the source rocks in geological history can be comprehensively identified [45].
The HGP index was defined as (S1 + S2)/TOC) × 100 (mg HC/g TOC) and used to measure the number of hydrocarbons that can be generated per unit of organic carbon [46]. In the process of burial and thermal evolution of hydrocarbon source rocks, the HGP index shows a trend of increasing first and then decreasing. When the source rock begins to generate hydrocarbons, the hydrocarbons in the source rock are in an undersaturated condition, and all the generated hydrocarbons remain in the source rock. When the hydrocarbons generated by organic matter in the source rocks satisfy self-absorption and capillary saturation, they are discharged from the source rock in a free phase [46,47]. Pang et al. (2004) [46] defined the geological condition in which hydrocarbons begin to be expelled as the free phase at the HET. The envelope curve of the HGP index data point reaches the maximum at the HET. Therefore, only when the burial depth of the source rock exceeds the HET does the source rock expel hydrocarbons (Figure 2) [36].

4. Results

4.1. Source Rock Characteristics

4.1.1. Hydrocarbon Generation and Expulsion Characteristics of the Source Rocks

Hydrocarbons were generated by the source rocks and migrated to reservoirs [48]. There are two sets of source rocks in the southern Lufeng sag, the WC and EP source rocks [24,49], forming relatively complex oil sources. Thus, clarifying the sources of the different types of crude oil and the relative contribution of different source rocks is necessary. The concept of effective source rocks, which refers to fine-grained sedimentary rocks that have generated and expelled enough hydrocarbons to be able to form commercial hydrocarbon accumulation under natural conditions, was first introduced by Hunt in 1979 [50]. This shows that large-scale hydrocarbon expulsion is an essential indicator in measuring the effectiveness of source rocks.
In 1997, Pang et al. [51] proposed the theory of “hydrocarbon expulsion threshold (HET)” defined as follows: geological conditions such as the critical buried depth and vitrinite reflectance for hydrocarbons generated from source rocks to begin expelling hydrocarbons to the outside world in a free state after satisfying their self-retention in various forms. This theory has been accepted by most scholars, and the source rocks above the HET have almost no contribution to actual hydrocarbon generation. However, when they evolved below the HET, many hydrocarbon expulsion events occur and can be considered effective source rocks. Therefore, the HGP index was calculated based on the pyrolysis data and TOC data of 210 hydrocarbon source rock samples (Table A1). And, the relationship of HGP index variation with burial depth is established (Figure 3a). Then, the HET is judged according to the variation of the envelope of the HGP index data points in the longitudinal direction.
The results show that when the burial depth is less than 3500 m, with increasing burial depth, the HGP index gradually increases, indicating that hydrocarbons begin to be generated at this depth but remain in the source rock in various forms and are not expelled. At 3500 m, the evolution curve of the HGP index turns, indicating that the source rocks begin to expel hydrocarbons. Thus, the burial depth of 3500 m was determined as the HET (Figure 3a).
The majority of the source rocks of the EP are buried above the HET, indicating that their hydrocarbon expulsion amount is limited. The source rocks of the EP contribute little to the hydrocarbon accumulation. In contrast, the whole source rocks of the WC are below the HET. This implies that the majority of hydrocarbon source rocks of the WC have expelled or are expelling numerous hydrocarbons (Figure 4a).
The maturity of hydrocarbon source rocks can also assist in identifying effective source rocks. The overall vitrinite reflectance is between 0.4% and 0.98%, which is in the immature–mature phase. Of these, the source rocks of the EP are shallowly buried, with a vitrinite reflectance between 0.4% and 0.61%, which is in the immature–low-mature phase. In comparison, the WC is deeply buried and mature with a vitrinite reflectance distributed between 0.5% and 0.98%. The vitrinite reflectance is thus mainly concentrated in the range of 0.6%–0.8% and is in the low-mature phase (Figure 3b).
The effectiveness of the source rocks can be judged based on the comprehensive analysis of their hydrocarbon expulsion characteristics and organic matter maturity. The source rocks of the WC are the main source in the southern Lufeng sag.

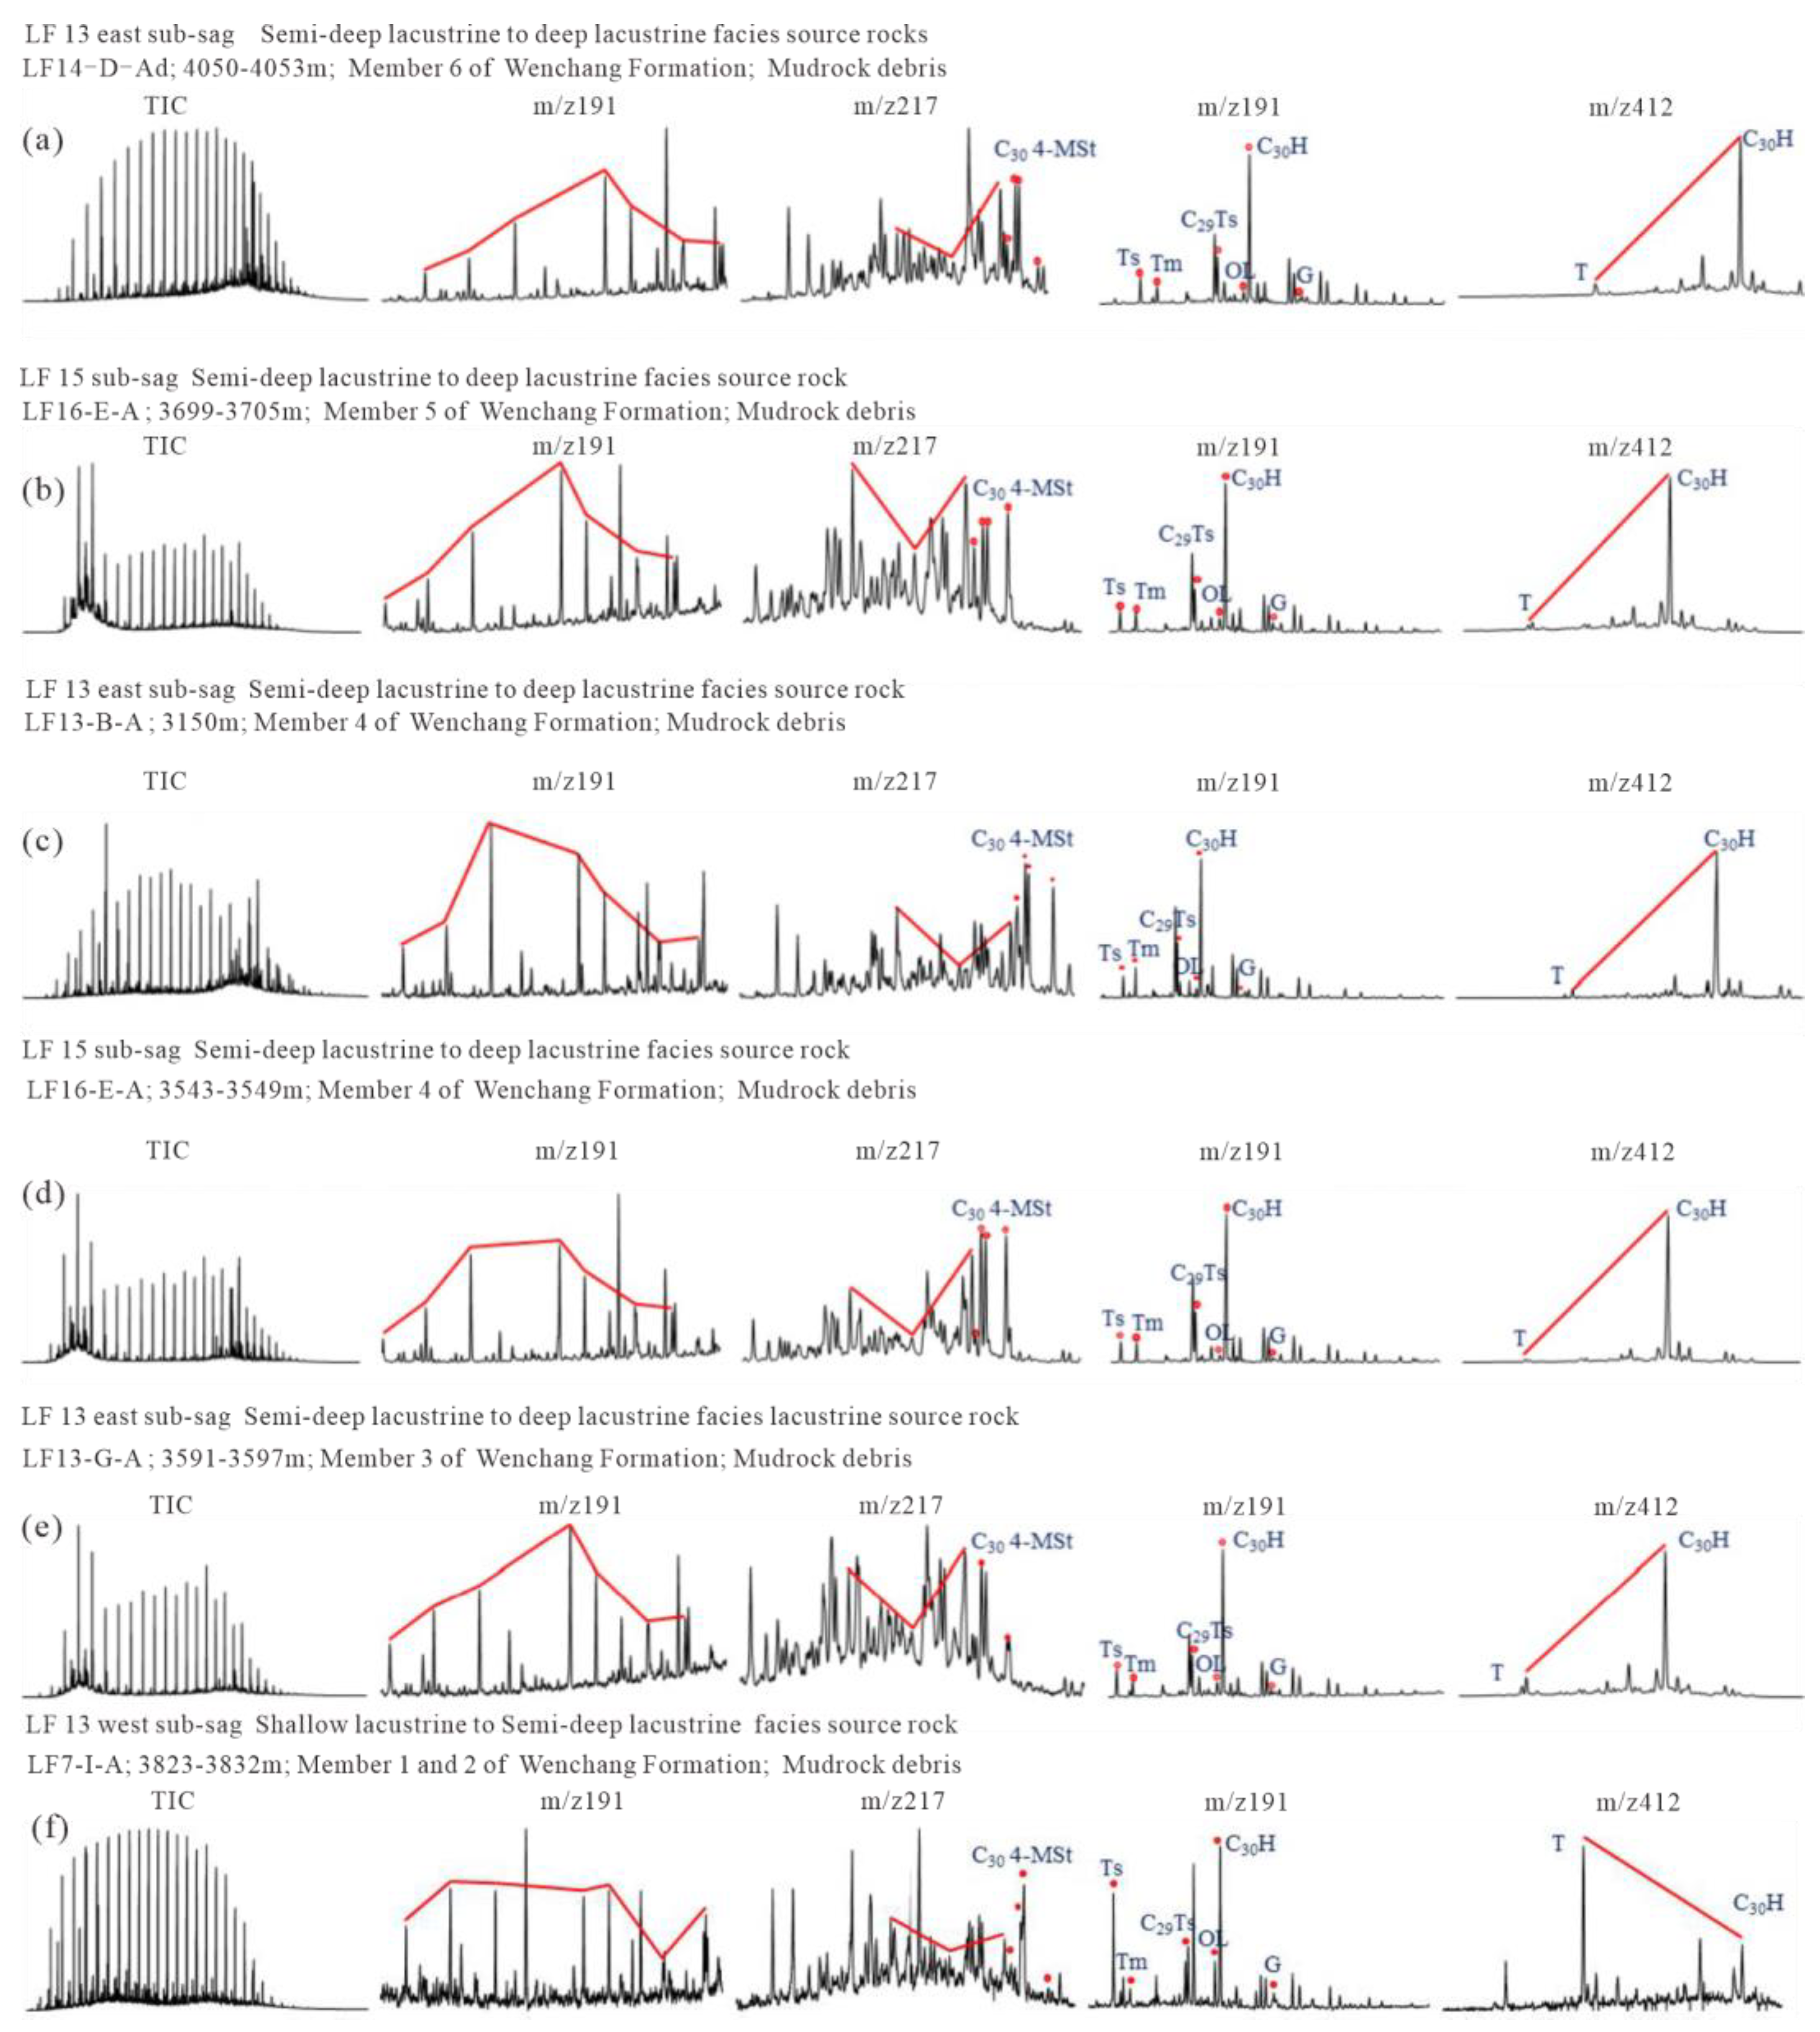
4.1.2. Biomarker Characteristics in the Source Rocks

The characteristics of the biomarker compounds in the effective source rocks of the WC are clarified through a detailed geochemical analysis of the soluble organic matter remaining in the source rocks. Combined with the richness of biomarkers in the source rocks of the WC, eight biomarkers (i.e., long-chain tricyclic terpenes, rearranged steranes, C27–C29 regular steranes, C30 4-methylsteranes, Ts and Tm, C30 Dia-Hop, oleanane, and bicadinane) are selected to summarize and analyze the geochemical characteristics of the source rocks. These biomarkers have different biogenic sources and can indicate the sedimentary environment of source rocks [15,52,53,54,55,56,57].
WC6 and WC5 were mainly drilled in the Lufeng 13 east sub-sag and the Lufeng 15 sub-sag. The biomarker of source rocks all show characteristics of semi-deep lacustrine to deep lacustrine facies. Normally distributed long-chain tricyclic terpenes, low content of rearranged steranes, C27–C29 regular steranes with “L” or “V” distribution, the obvious predominance of C29 regular steranes, and abundant C30 4-methylsteranes were observed. The Ts content was slightly higher than that of Tm (Ts/Tm, 1.35–3.01). The average value of C30 Dia-Hop/C30 H was 0.19. Similarly, the oleanane content was not high. Bicadinane was basically not observed (Figure 4a,b). Although the biomarker of source rocks appears to be semi-deep lacustrine to deep lacustrine facies, this formation belongs to the shore–shallow lacustrine to delta facies distributed at the edge of the sag in sedimentology, and the biomarker cannot accurately represent the sedimentary environment inside the sag. This is because only thin mudstone has been drilled in this Formation at the edge of the sag, and the Formation’s upper part is covered with thick sediments of the WC4. The mudstone of the WC6 and the WC5 may have been mixed with the hydrocarbons of semi-deep lacustrine to deep lacustrine facies in the WC4, resulting in inconsistencies between the characteristics of biomarker and sedimentological analysis (Figure 4a,b).
The source rocks of the WC4 and the WC3 were drilled in the Lufeng 13 east sub-sag and the Lufeng 15 sub-sag. The biomarker of source rocks all exhibit characteristics of semi-deep lacustrine to deep lacustrine facies. Normally distributed long-chain tricyclic terpenes, low-content rearranged steranes, C27–C29 regular steranes with “V” distribution, and the rich content of C30 4-methylsterane were observed. The Ts content was slightly lower than that of Tm (Ts/Tm, 0.18–3.38). The C30 Dia-Hop/C30 H value ranged from 0.05 to 0.45. Similarly, the oleanane content was not high. The source rocks do not contain bicadinane. (Figure 4c–e).
WC1 and WC2 feature shallow lacustrine to semi-deep lacustrine facies mudstone in each sub-sag. Long-chain tricyclic terpenes show normal distribution, and the rearranged sterane content was not high. C27–C29 regular steranes show a “V” shape distribution, and the rich content of C30 4-methylsteranewere observed. The Ts content was significantly higher than that of Tm (Ts/Tm, 4.12–7.22). The C30 Dia-Hop/C30 H value ranged from 0.75 to 1.04. The oleanane content was high. The content of bicarbodiane is rich (Figure 4f).

4.2. Crude Oil Source

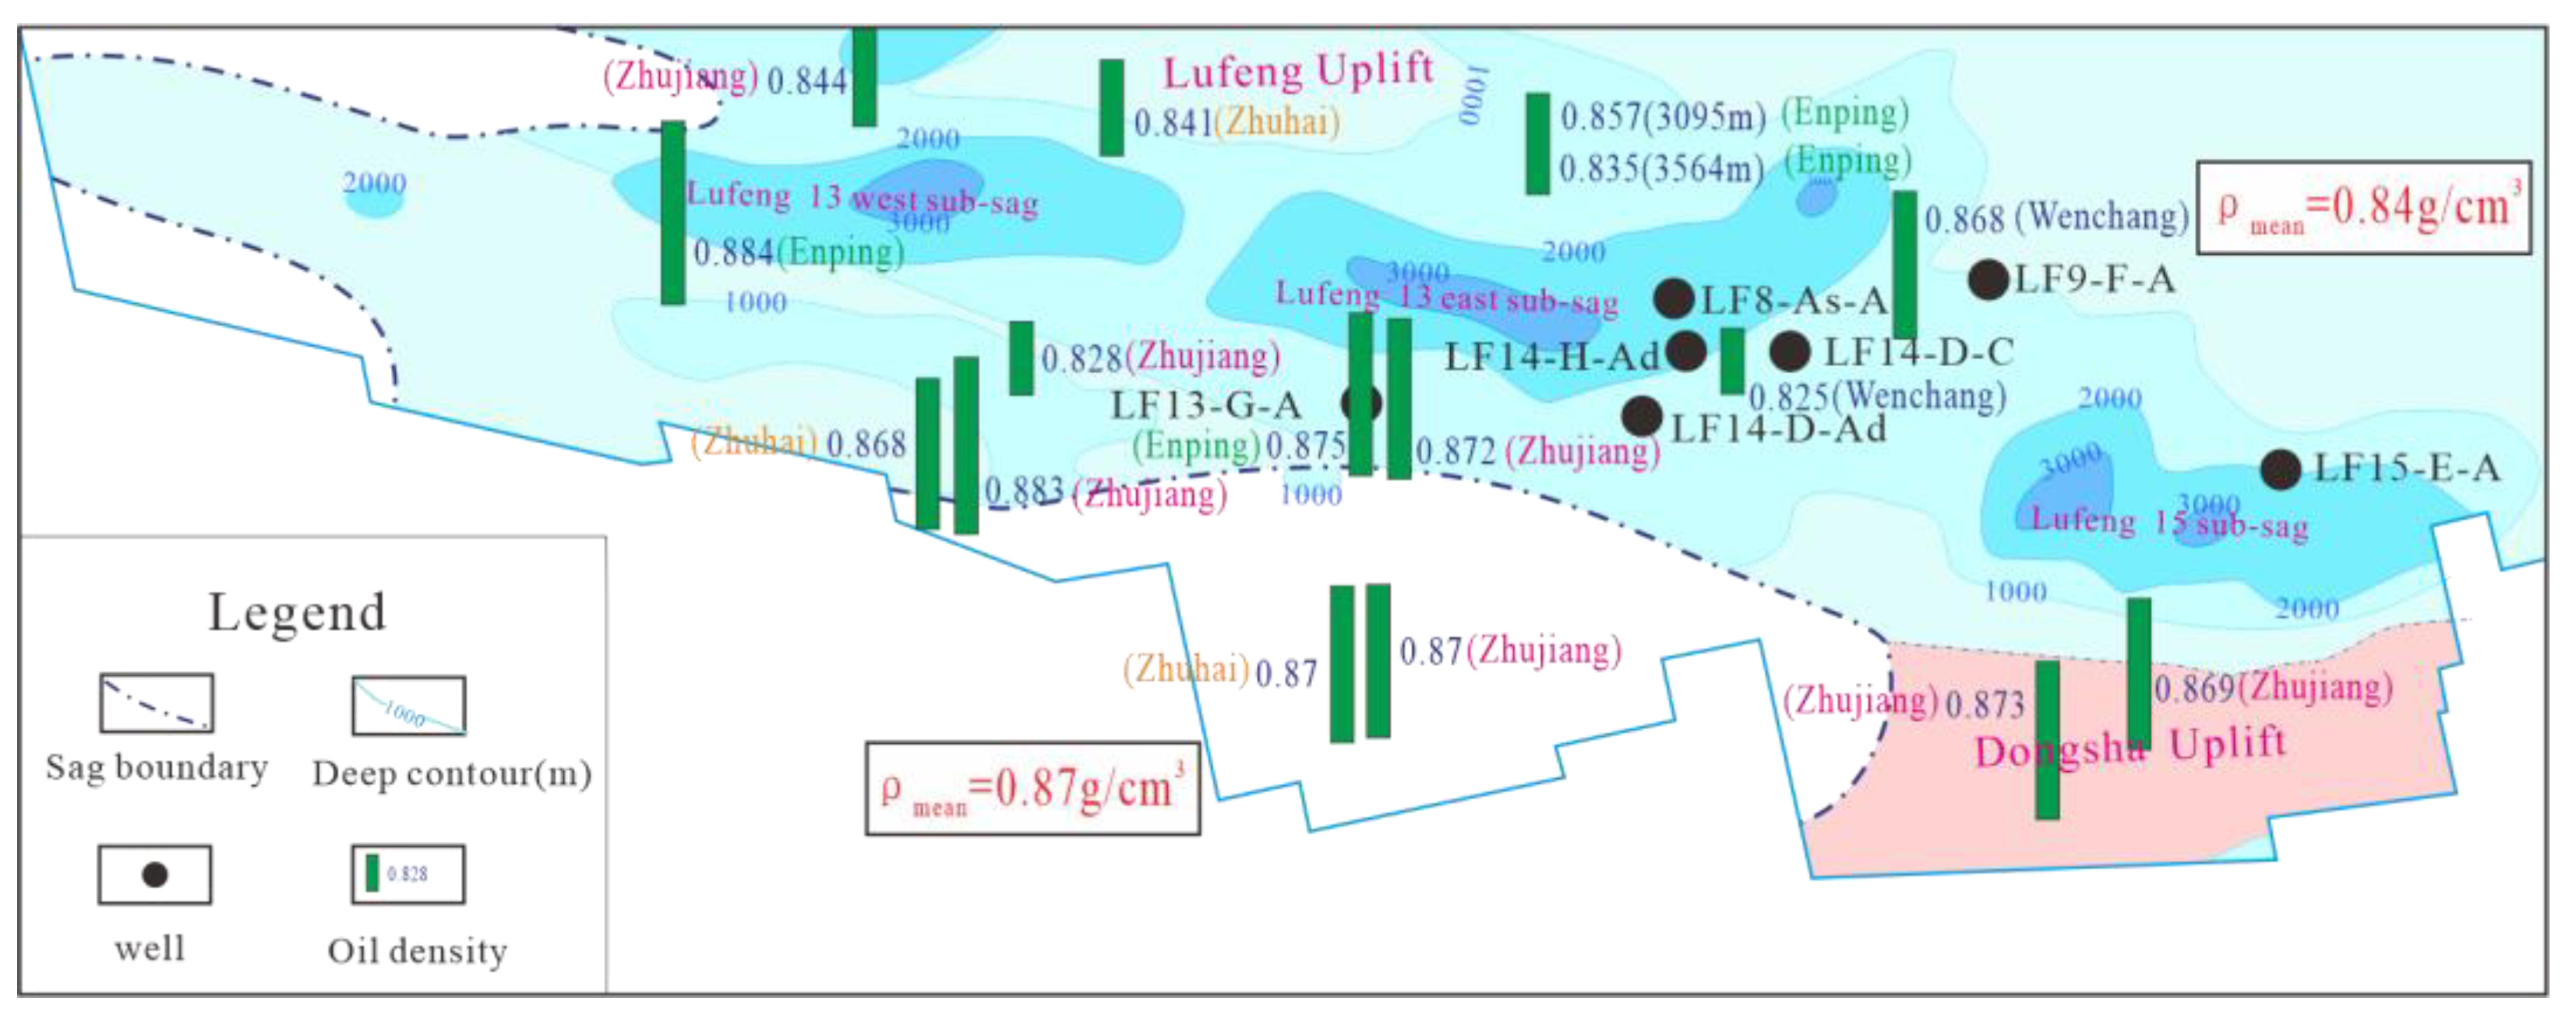
4.2.1. Crude Oil Physical Properties

When hydrocarbons migrate along the transport layer, the viscosity and density of crude oil gradually decrease with increasing hydrocarbon migration distance. When hydrocarbons migrate along the open fault, the viscosity and density of crude oil increase because of oxidation [58]. The injection direction of hydrocarbons can be macroscopically judged using the physical properties of crude oil [59,60,61]. Considering that the density data of crude oil from the WC is less and the regularity is not obvious enough, the density data of the other layers were used for the overall analysis. Fifteen crude oil samples were obtained from 15 wells in the southern Lufeng sag, with a uniform distribution of sample points. The density of the samples was statistically analyzed, and the results showed that the density of the crude oil widely varied, with an average of 0.86 g/cm3 and a range of 0.73–0.97 g/cm3. The main distribution range of 80% of the samples is 0.80–0.92 g/cm3. The crude oil is mainly light–medium oil, followed by condensate and heavy oil.
The crude oil density follows an apparent distribution law in the vertical direction. With increasing reservoir burial depth, the reservoir temperature increases, and the density decreases. The crude oil density obviously increases from the sub-sag to the uplift. The average crude oil density in the sub-sag is 0.84 g/cm3, whereas that in the uplift is 0.87 g/cm3 (Figure 5).

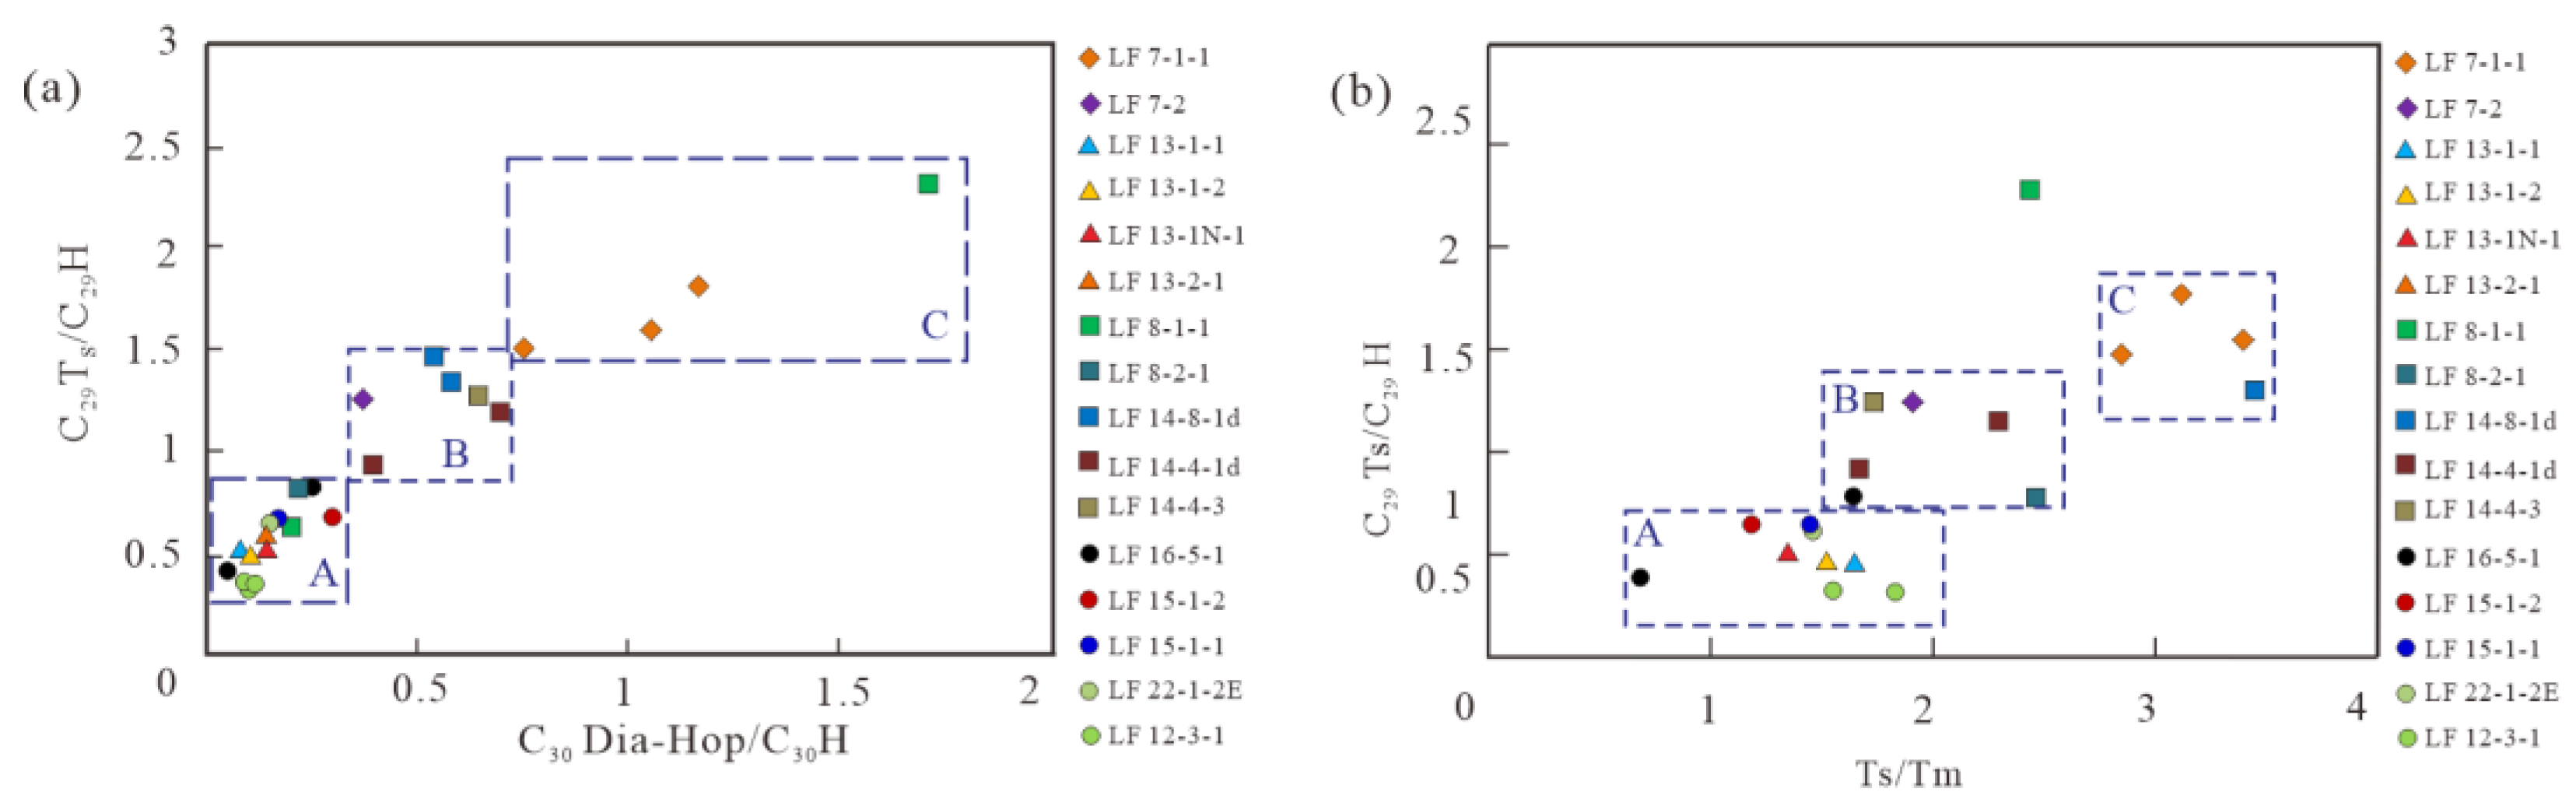
4.2.2. Characteristics of the Crude Oil Biomarker

Classification of crude oil types is the basis for oil and source rock correlation. Herein, according to the biomarker obtained from GC-MS fingerprint, the crude oil in the southern Lufeng sag is classified into three types: Type A, Type B, and Type C. Significant differences exist in the geochemical characteristics of the three types (Figure 6). Then, based on the study of the characteristics of the biomarker of the crude oil, six types of biomarkers (i.e., long-chain tricyclic terpenes, C30 4-methylsterase, Ts and Tm, C30 Dia-Hop, oleanane, and bicadinane) accurately represent the geochemical characteristics of the crude oil. Of these, the three biomarker parameters C29Ts/C29 H, Ts/Tm, and C30 Dia-Hop/C30 H can be used to visually distinguish the types of crude oil. Because of the little and unclear data on crude oil from the WC, crude oil data of other layers were used in the overall analysis, and the three types of crude oil can be completely separated through the comparative analysis of the optimized biomarker parameters (Figure 7).
Type A crude oil exhibits characteristics of semi-deep lacustrine to deep lacustrine facies. It is mainly found in the reservoirs of the EP in the Lufeng 13 sub-sag and the WC reservoirs in the Lufeng 15 sub-sag. Its main biomarker is characterized by C19 tricyclic terpene content that is significantly lower than that of C23 tricyclic terpene, with rich C30 4-methylsterane content. The Ts content is slightly higher than Tm content. The C29 Ts, rearrangement hopane, oleanane, and bicadinane contents are low (Figure 6a).
Type B crude oil exhibits characteristics of shallow lacustrine to semi-deep lacustrine facies. It is mainly found in the EP reservoir in the north gentle slope belt of the Lufeng 13 west sub-sag and the central uplift of the Lufeng 13 east sub-sag. The main biomarker is characterized by a significant increase in the C19 tricyclic terpene content, which is equivalent to that of C23 tricyclic terpenes. The oil is rich in C30 4-methylsterane, and the Ts content is significantly higher than the average value of the Tm content. The C29Ts, rearranged hopane, and oleanane contents are very high, and the oil is rich in bicadinane (Figure 6b).
Type C crude oil exhibits characteristics of mixed source oil of semi-deep lacustrine to deep lacustrine facies and shallow lacustrine to semi-deep lacustrine facies. It is mainly found in the WC in the southern steep slope belt of the Lufeng 13 east sub-sag. The main biomarker is characterized by C19 tricyclic terpene content that is slightly lower than C23 tricyclic terpene content. The C30 4-methylsterane content is high, and the Ts content is significantly higher than the Tm content (the average value of Ts/Tm is 2.89). The C29Ts, rearranged hopane, oleanane contents were very high, and the oil is rich in bicadinane (Figure 6c).

4.2.3. Oil and Source Rock Correlation

In this section, the oil and source rock are compared using the classification results of the crude oil types, combined with the organic geochemical analysis and test data of the source rocks. The degree of drilling in the Lufeng 13 west sub-sag, the Lufeng 13 east sub-sag, and the Lufeng 15 sub-sag is relatively high, and there is no obvious difference in the biomarker characteristics of the source rocks in each layer of the WC controlled by the same sedimentary facies in each sag. Therefore, the Lufeng 13 and Lufeng 15 sub-sags can be used as a whole for oil and source rock comparison. First, the crude oil source is determined by directly comparing the biomarker fingerprint of the crude oil and source rocks [62], and C29Ts/C29H, Ts/Tm, and C30 Dia-Hop/C30H are selected as the parameters for the oil and source rock correlation (Figure 8). The comparison results show the following.
Type A crude oil is derived from semi-deep lacustrine to deep lacustrine source rocks of the WC4 and the WC3. It is characterized by high C30 4-methylsterane relative content, extremely low T compound content, and very low oleanane content. Ts and Tm contents are approximately equal, with low C29Ts/C29Hop, and low C30Dia-Hop/C30H. This type of crude oil is mainly found in the structure far from the center of the Lufeng 13 sub-sag and the reservoir around the Lufeng 15 sub-sag (Figure 9).
Type B crude oil is derived from shallow lacustrine–semi-deep lacustrine source rocks developed in the WC1, the WC2, and the WC3. This type of source rock is only found in the WC in wells LF7-9-1 and LF14-8-1D. It is rich in C30 4-methylsterane, the T compound content is abnormally high, and the oleanane content is high. The Ts content has an obvious advantage over the Tm relative content, and the Ts/Tm value is significantly higher than that of class I crude oil. This oil type is mainly characterized by high C29Ts/C29Hop and high C30Dia-Hop/C30H contents. This type of crude oil is mainly found in the LF7-1 and the LF8-1 reservoirs (Figure 9).
Type C crude oil belongs to the mixed-source oil generated by source rocks of the WC4 and the WC3 and part of upper WC source rocks. Therefore, the biomarker parameters such as C29Ts/C29Hop, Ts/Tm, C30Dia-Hop/C30H, and T/C30H values of this type of crude oil are among the parameters of Type A and Type B crude oil. This mixed-source oil is mainly found in the LF7-2 reservoir in the Lufeng 13 west sub-sag and the Wenchang Formation reservoirs in the LF14-4 and LF14-8 reservoirs in the Lufeng 13 east sub-sag. Generally, the crude oil from source rocks of the upper WC is mainly contaminated and filled with crude oil from source rocks of the WC4 and the WC3 (Figure 9).

4.3. Hydrocarbon Accumulation Period

Studying the hydrocarbon accumulation period is highly significant for revealing the spatiotemporal matching relationships between hydrocarbons from source rocks to traps [63,64,65]. In this work, sandstone samples were taken from nine reservoirs of the WC from eight wells. Seven sandstone samples were used in fluid inclusion homogenization temperature experiments, and two sandstone samples were used in 40Ar–39Ar dating analysis experiments. Table 1 displays the experimental results.
The results revealed that the time of the hydrocarbon accumulation in the WC is relatively late. During the sedimentary period of the upper Zhujiang Formation (18.1 Ma), the hydrocarbon began to accumulate in the traps, which has continued to the present day. The hydrocarbon accumulation phase can be classified into three stages according to the concentration degree of the hydrocarbon accumulation time (Figure 10).
In the first stage (from the beginning of 18.1 Ma to the end of 13.6 Ma), the reservoirs filled with hydrocarbons are the WC reservoir of the LF14-D-Ad well and the LF16-E-A well in the Lufeng 15 sub-sag.
In the second stage (from the beginning of 13.6 Ma to the end of 8 Ma), which is the main hydrocarbon filling period in the southern Lufeng sag, the reservoirs of the WC in the LF7-D and LF14-H structures completed hydrocarbon filling.
In the third stage (since the beginning of 8.4 Ma), the WC reservoir in the Lufeng 13 east sub-sag filled with hydrocarbon (Table 1).

4.4. Migration System

4.4.1. Fault

Fault migration systems are important vertical migration channels of hydrocarbons. The development scale, characteristics, and sealing of faults are the key factors affecting fault migration systems [66,67,68,69]. According to the contact relationship between the fault and the effective source rock, the faults are classified into oil–source faults and non-oil–source faults. When a fault cuts through the effective source rocks, it is an oil–source fault; otherwise, it is a non-oil–source fault. The effective source rocks include the WC source rocks in the Lufeng 13, Lufeng 15, and Lufeng 7 sub-sags with burial depths exceeding the HET. Thus, the oil–source faults are considered to have vertical communication with the hydrocarbon sources (Figure 11). A total of 30 oil–source faults are identified. Of these, six oil–source faults are in the Lufeng 15 sub-sag, and non-oil–source faults are developed inside the sag. There are 19 oil–source faults in the Lufeng 13 east sub-sag and 12 oil–source faults inside the sag, and the density of oil–source faults inside the sag is large. Paleogene hydrocarbon is mainly distributed in the Lufeng 13 east sub-sag oil–source fault distribution zone. There are five oil–source faults in the Lufeng 13 west sub-sag and no oil–source faults inside the sag (Figure 12).

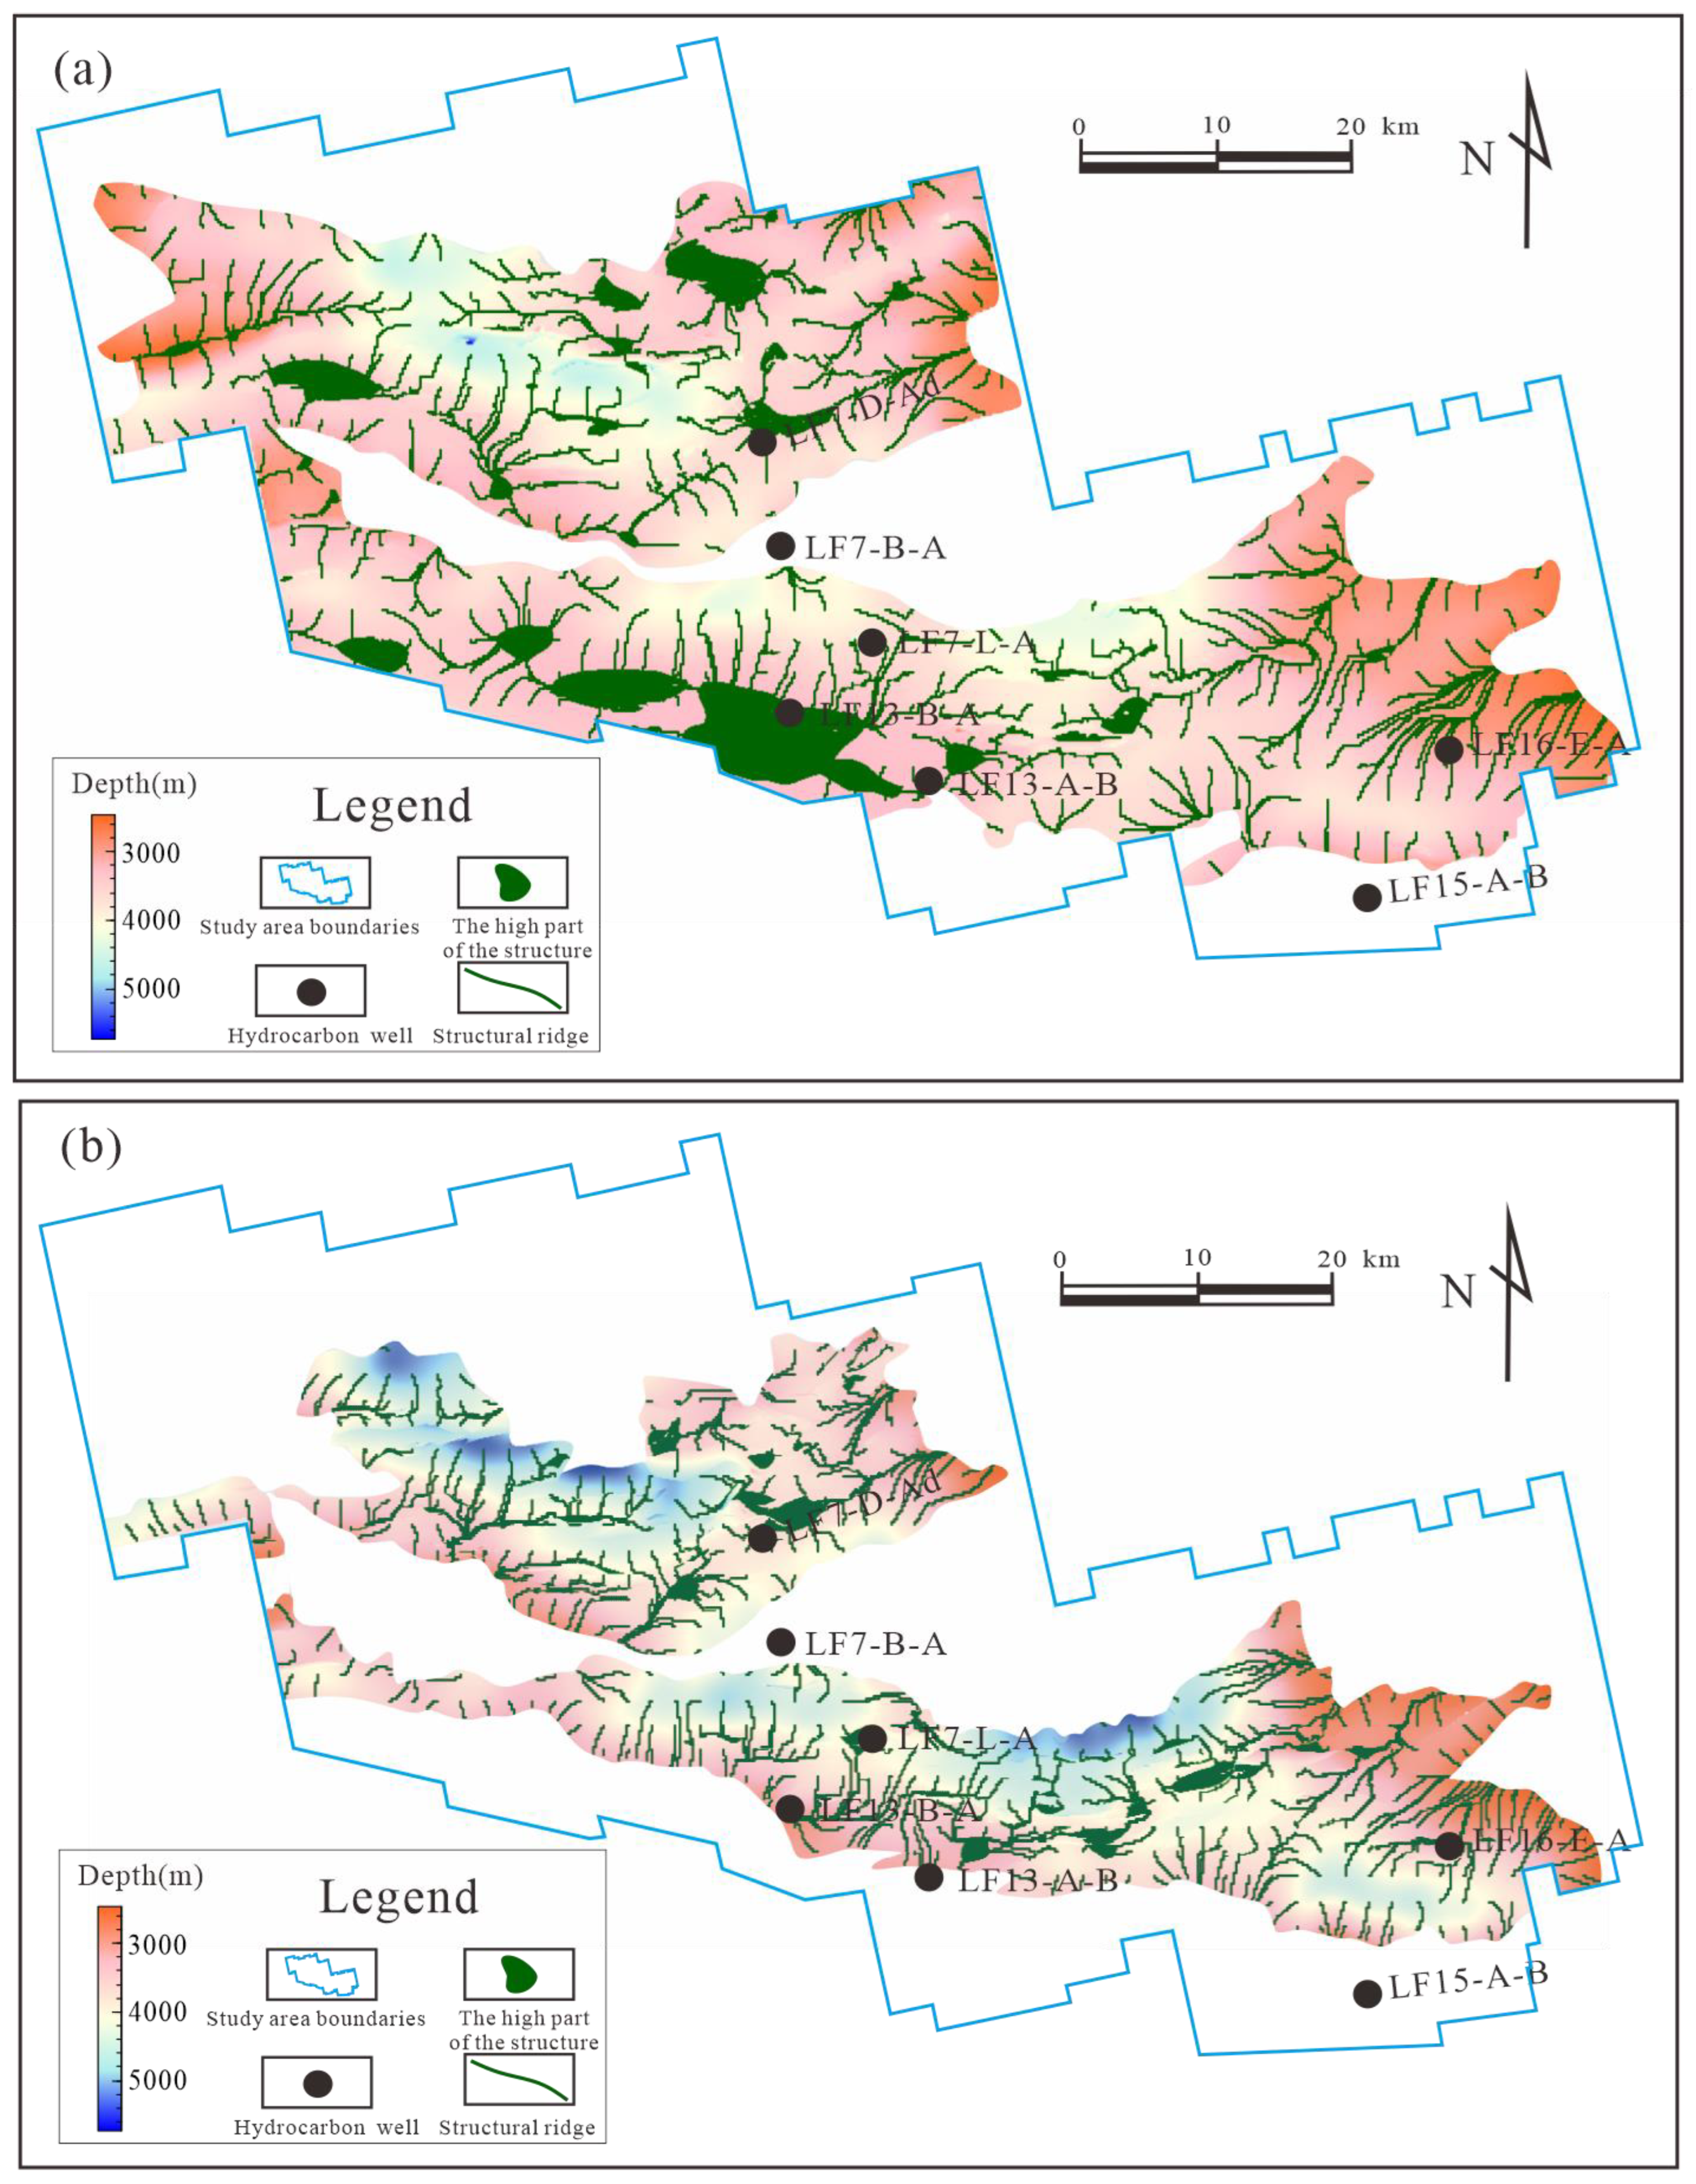
4.4.2. Structural Ridge
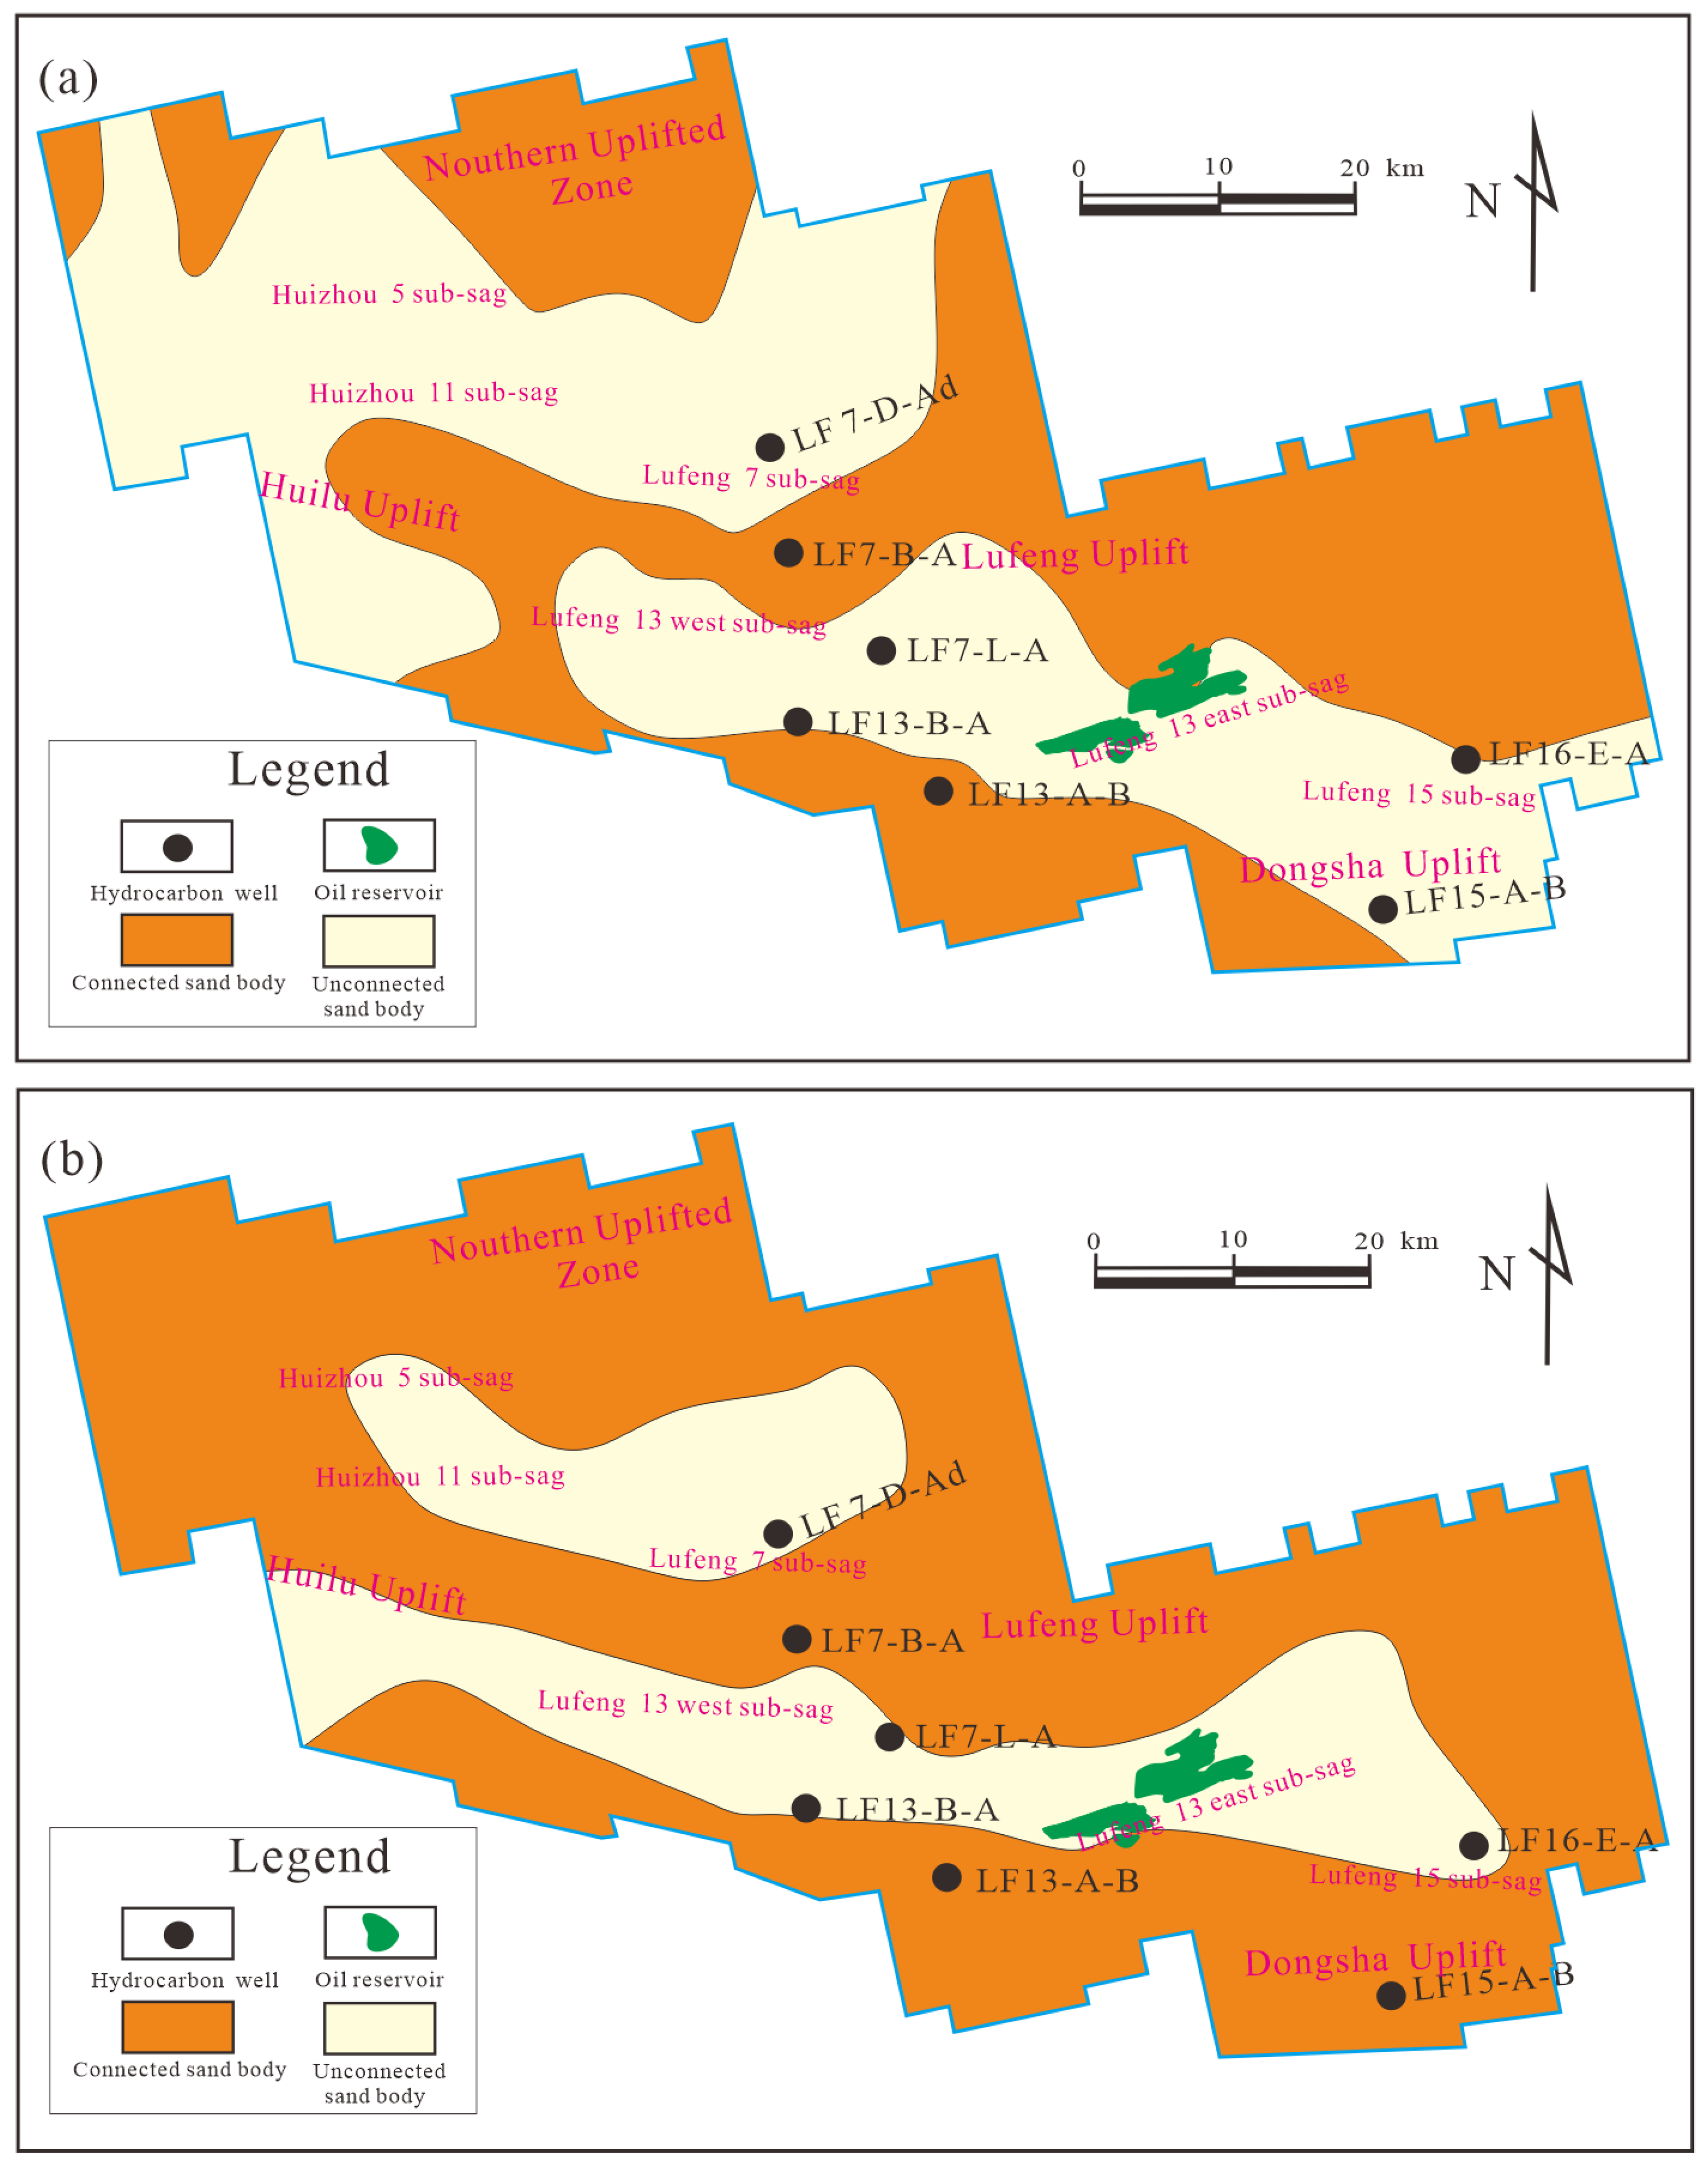
The migration of hydrocarbons in the migration pathway is not homogeneous. That is, hydrocarbons do not fill the migration pathway and maintain parallel movement in the extension direction of the migration pathway. However, they are concentrated in dominant migration pathways of various types in a migration system, where the dominant migration pathway in a sandstone migration layer is the “structural ridge” direction [61,69,70].
In this study, the structural ridge distribution of the WC is studied in detail, and the dominant migration direction of hydrocarbons in the sandstone transport layer is determined. The results show that the stratum is affected by sedimentary conditions and denudation and does not cover the whole Lufeng sag. Their distribution area is limited, and the distribution of the structural ridges is more complex. The structural ridge of the upper WC radiates from the center of the sub-sag to all sides in the Lufeng 15 sub-sag. Furthermore, in the Lufeng 13 east sub-sag, the structural ridge mainly extends from the interior of the sub-sag to the southern uplift belt and the Dongsha uplift. A few of the western structural ridges extend in the direction of the Huilu low uplift. The structural ridge of the Lufeng 13 west sub-sag extends from the interior of the sub-sag to the southern Huilu low uplift. The structural ridge of the Lufeng 7 sub-sag extends from the interior of the sub-sag to the local uplift at the junction of the Lufeng 13 and Lufeng 7 sub-sags (Figure 13a). The structural ridge of the lower WC extends from the interior of the sub-sag to the Huilu low uplift in the Lufeng 13 east sub-sag, and the characteristics of the structural ridge in the other sub-sags are similar to those of the upper WC (Figure 13b).

4.4.3. Sand Body

Transport layers are the most common migration systems in actual geological conditions. They are important research objects in determining hydrocarbon migration [71]. The migration driving force of hydrocarbon in transport layers is dominated by buoyancy, and the migration pathway is dominated by connected pores in sandstone. Therefore, detecting connected sand bodies is the key to determining the range of a transport layer. If the sand bodies are separated by mudstone or other tight layers, fluid exchange between them is very difficult. Generally, a good correlation exists between the sandstone-to-stratum ratio and the connectivity of a sand body. The higher the sandstone-to-stratum ratio, the lower the thickness of tight layers, such as mudstone in the stratum [72], and the higher the contact probability and connectivity probability between sand bodies.
A good correlation exists between the sandstone-to-stratum ratio and the connectivity of sandstone transport layers. Luo et al. (2012) [72] proposed a method to measure the quality of the sandstone transport layers. The basic idea is that there is a percolation threshold of C0. When the sandstone-to-stratum ratio is less than C0, contact between sandstone transport layers is difficult, and the possibility of connection is very low. When the sandstone-to-stratum ratio is greater than C0, the sandstone transport layers are in contact with each other, and interconnection is thus possible. Then, the connection probability equation of sandstone transport layers is established using Gaussian fitting [72], and the calculation equation is as follows:
P = { 0   ( h C 0 ) 1 e [ 2 ( h C 0 ) 2 ( C C 0 ) 2 ]     ( h C 0 )
where P is the connectivity probability, C0 is the percolation threshold, h is the sandstone-to-stratum ratio of the sand body, and C is the complete connectivity threshold.
During parameter selection in the calculation, the credibility of the lithology correlation results is low, and the percolation threshold C0 and complete connectivity threshold C cannot be accurately determined because of the limitations in the number of exploration wells in the Lufeng area. Thus, the analogy method is adopted.
The Shahejie Formation in the Niuzhuang sub-sag of the Dongying sag in the Bohai Bay basin has geological conditions similar to those of the Paleogene Formations in the Lufeng sag and therefore may be used in an analogy:
  • The Shahejie Formation was in a rift continental basin during its sedimentary period. It is very similar to the Lufeng sag in terms of overall structural and sedimentary background;
  • The geo-temperature gradient of the Dongying sag is 3.59 °C/100 m [73], which is very similar to that of the Lufeng sag;
  • The sedimentary facies of the Shahejie Formation are mainly delta, alluvial fan, and lacustrine facies [74], which are very similar to the sedimentary system of the Paleogene in the Lufeng sag.
The results show the following: the connectivity of the sandstone transport layer of the WC is poor inside the sag. The sand body transport layer is not connected in the Lufeng 13, Lufeng 15, and Lufeng 7 sub-sags, and only a connected sand body transport layer is around the sub-sag (Figure 14). Moreover, the sand body connectivity zone of the lower WC is obviously larger than that of the upper WC mainly because the water area was wider during the sedimentary period of the lower WC. The stable sedimentation and strong sedimentary source recharge caused a wide distribution of sand bodies. In contrast, during the upper WC’s sedimentary period, the sag entered an uplift stage, the water body began to become shallow, and the development of sand bodies was weaker than that during the lower WC period.

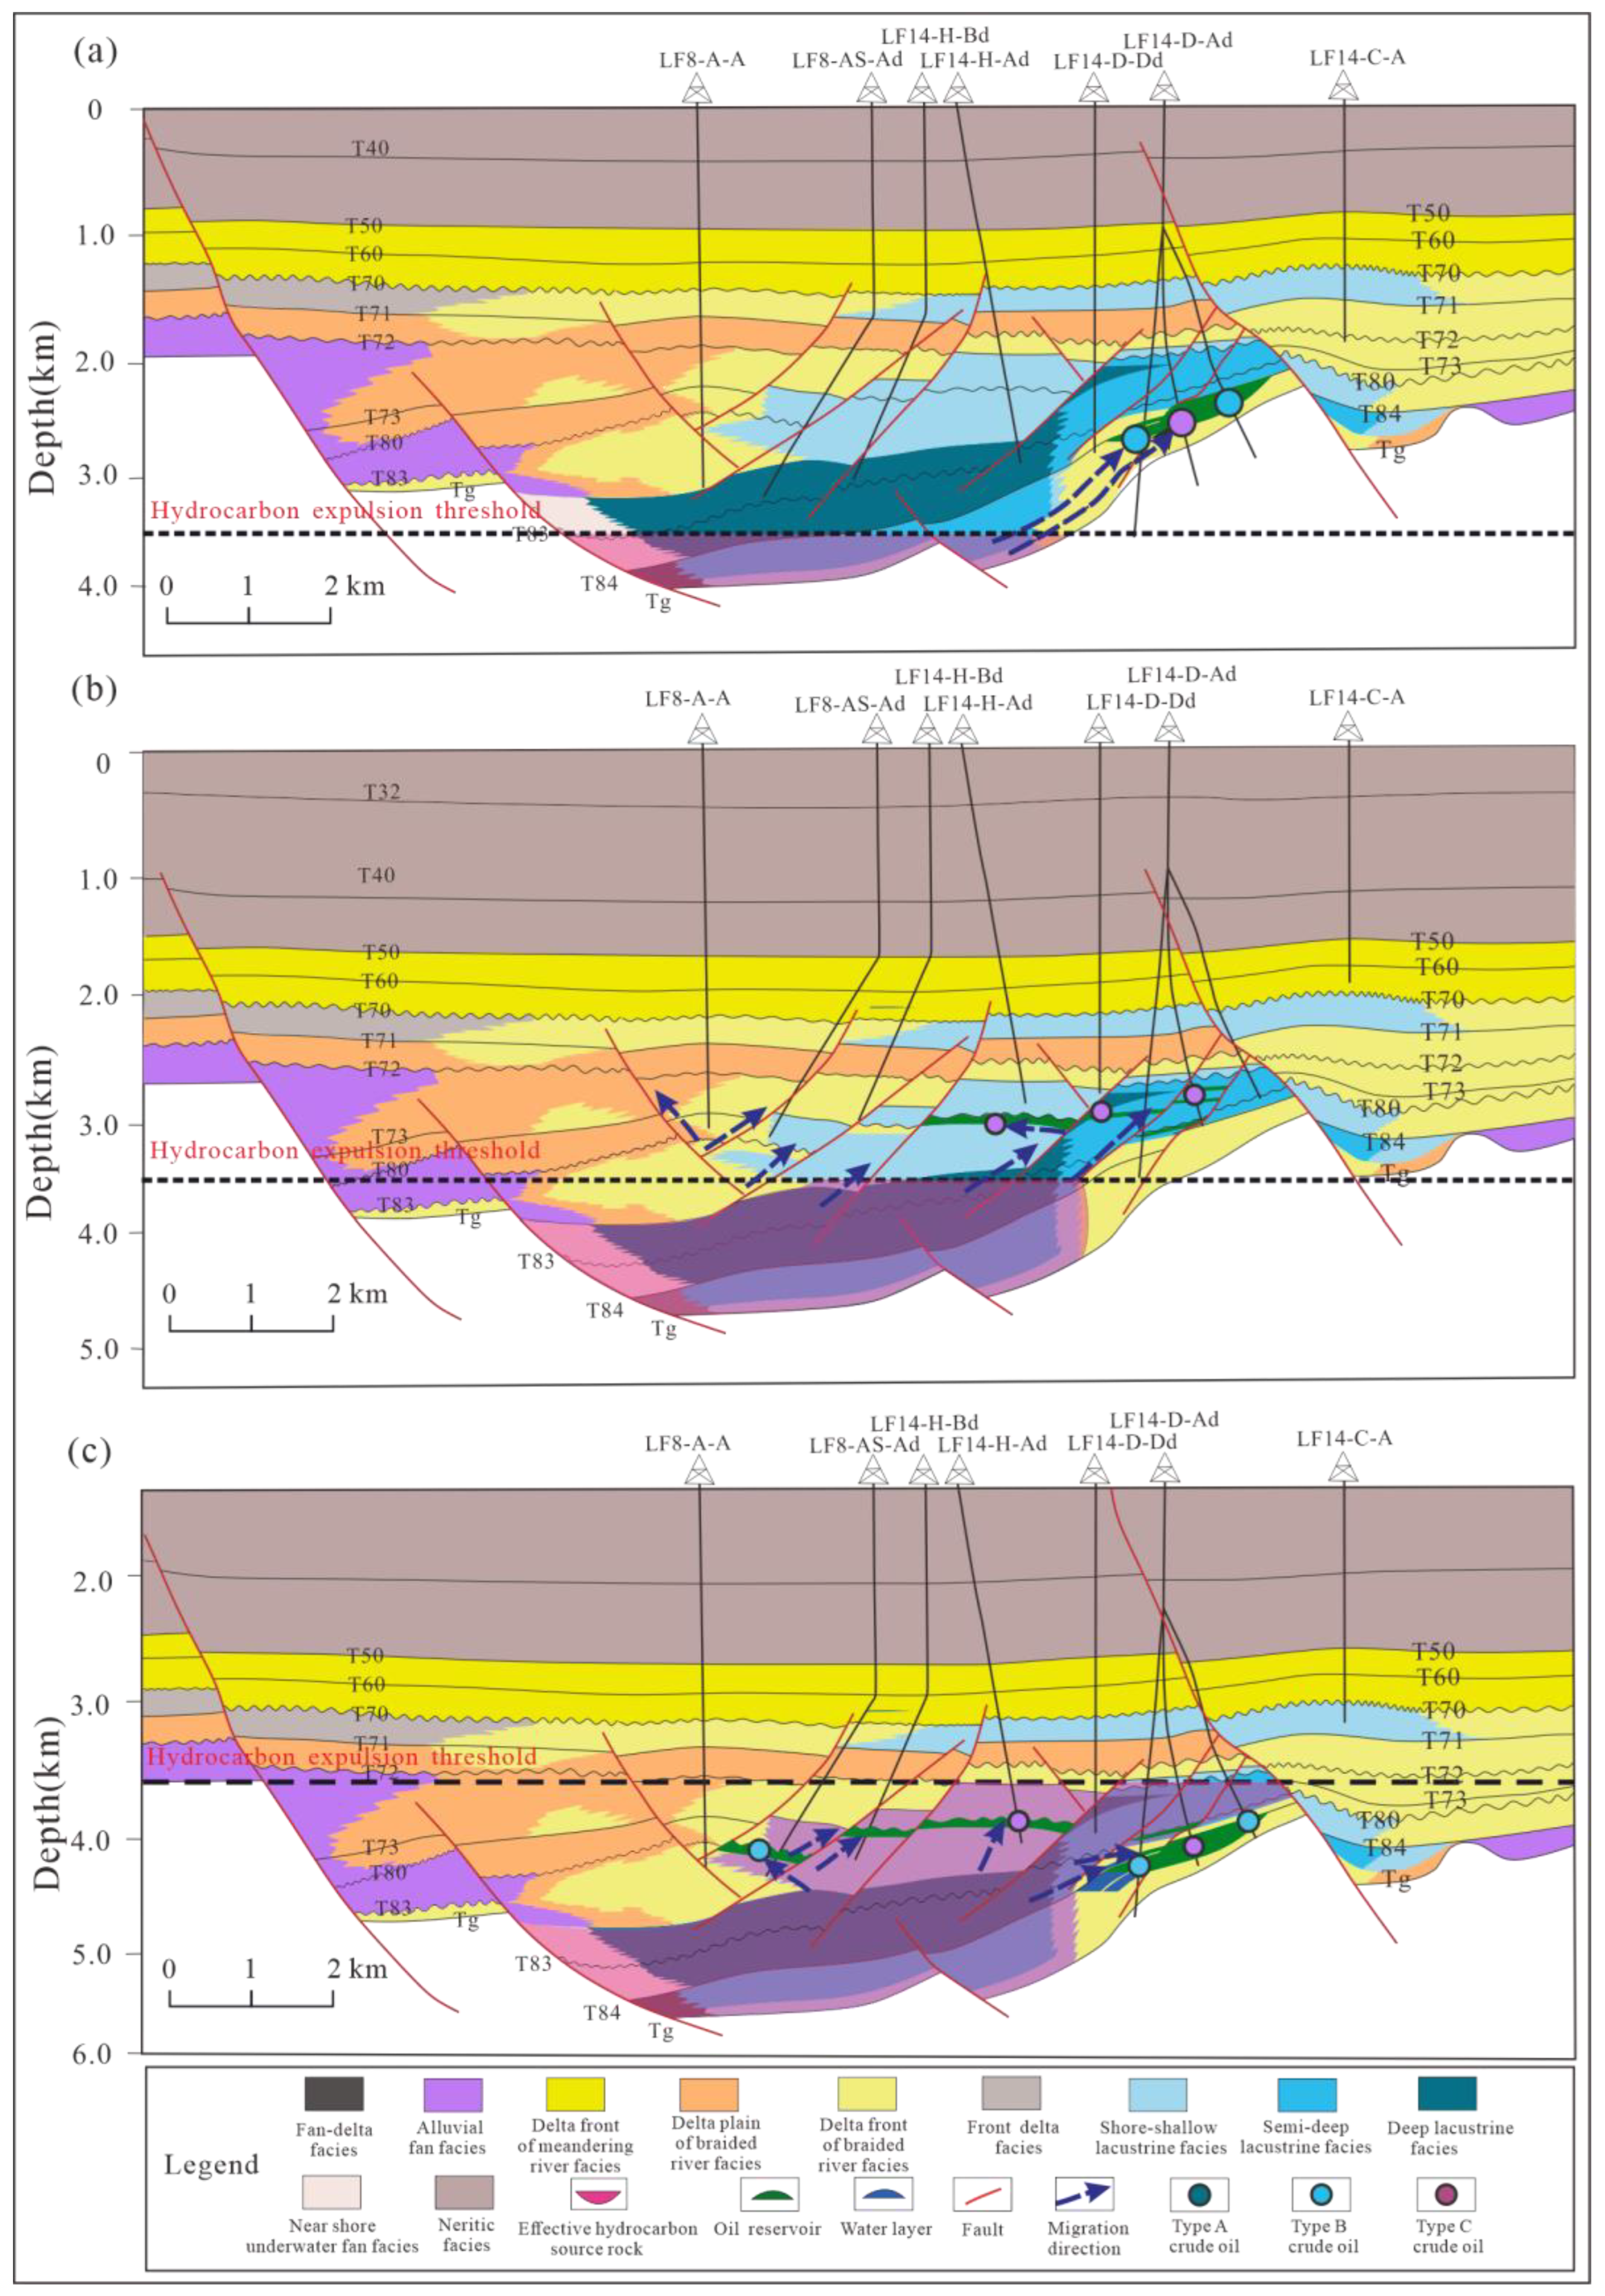
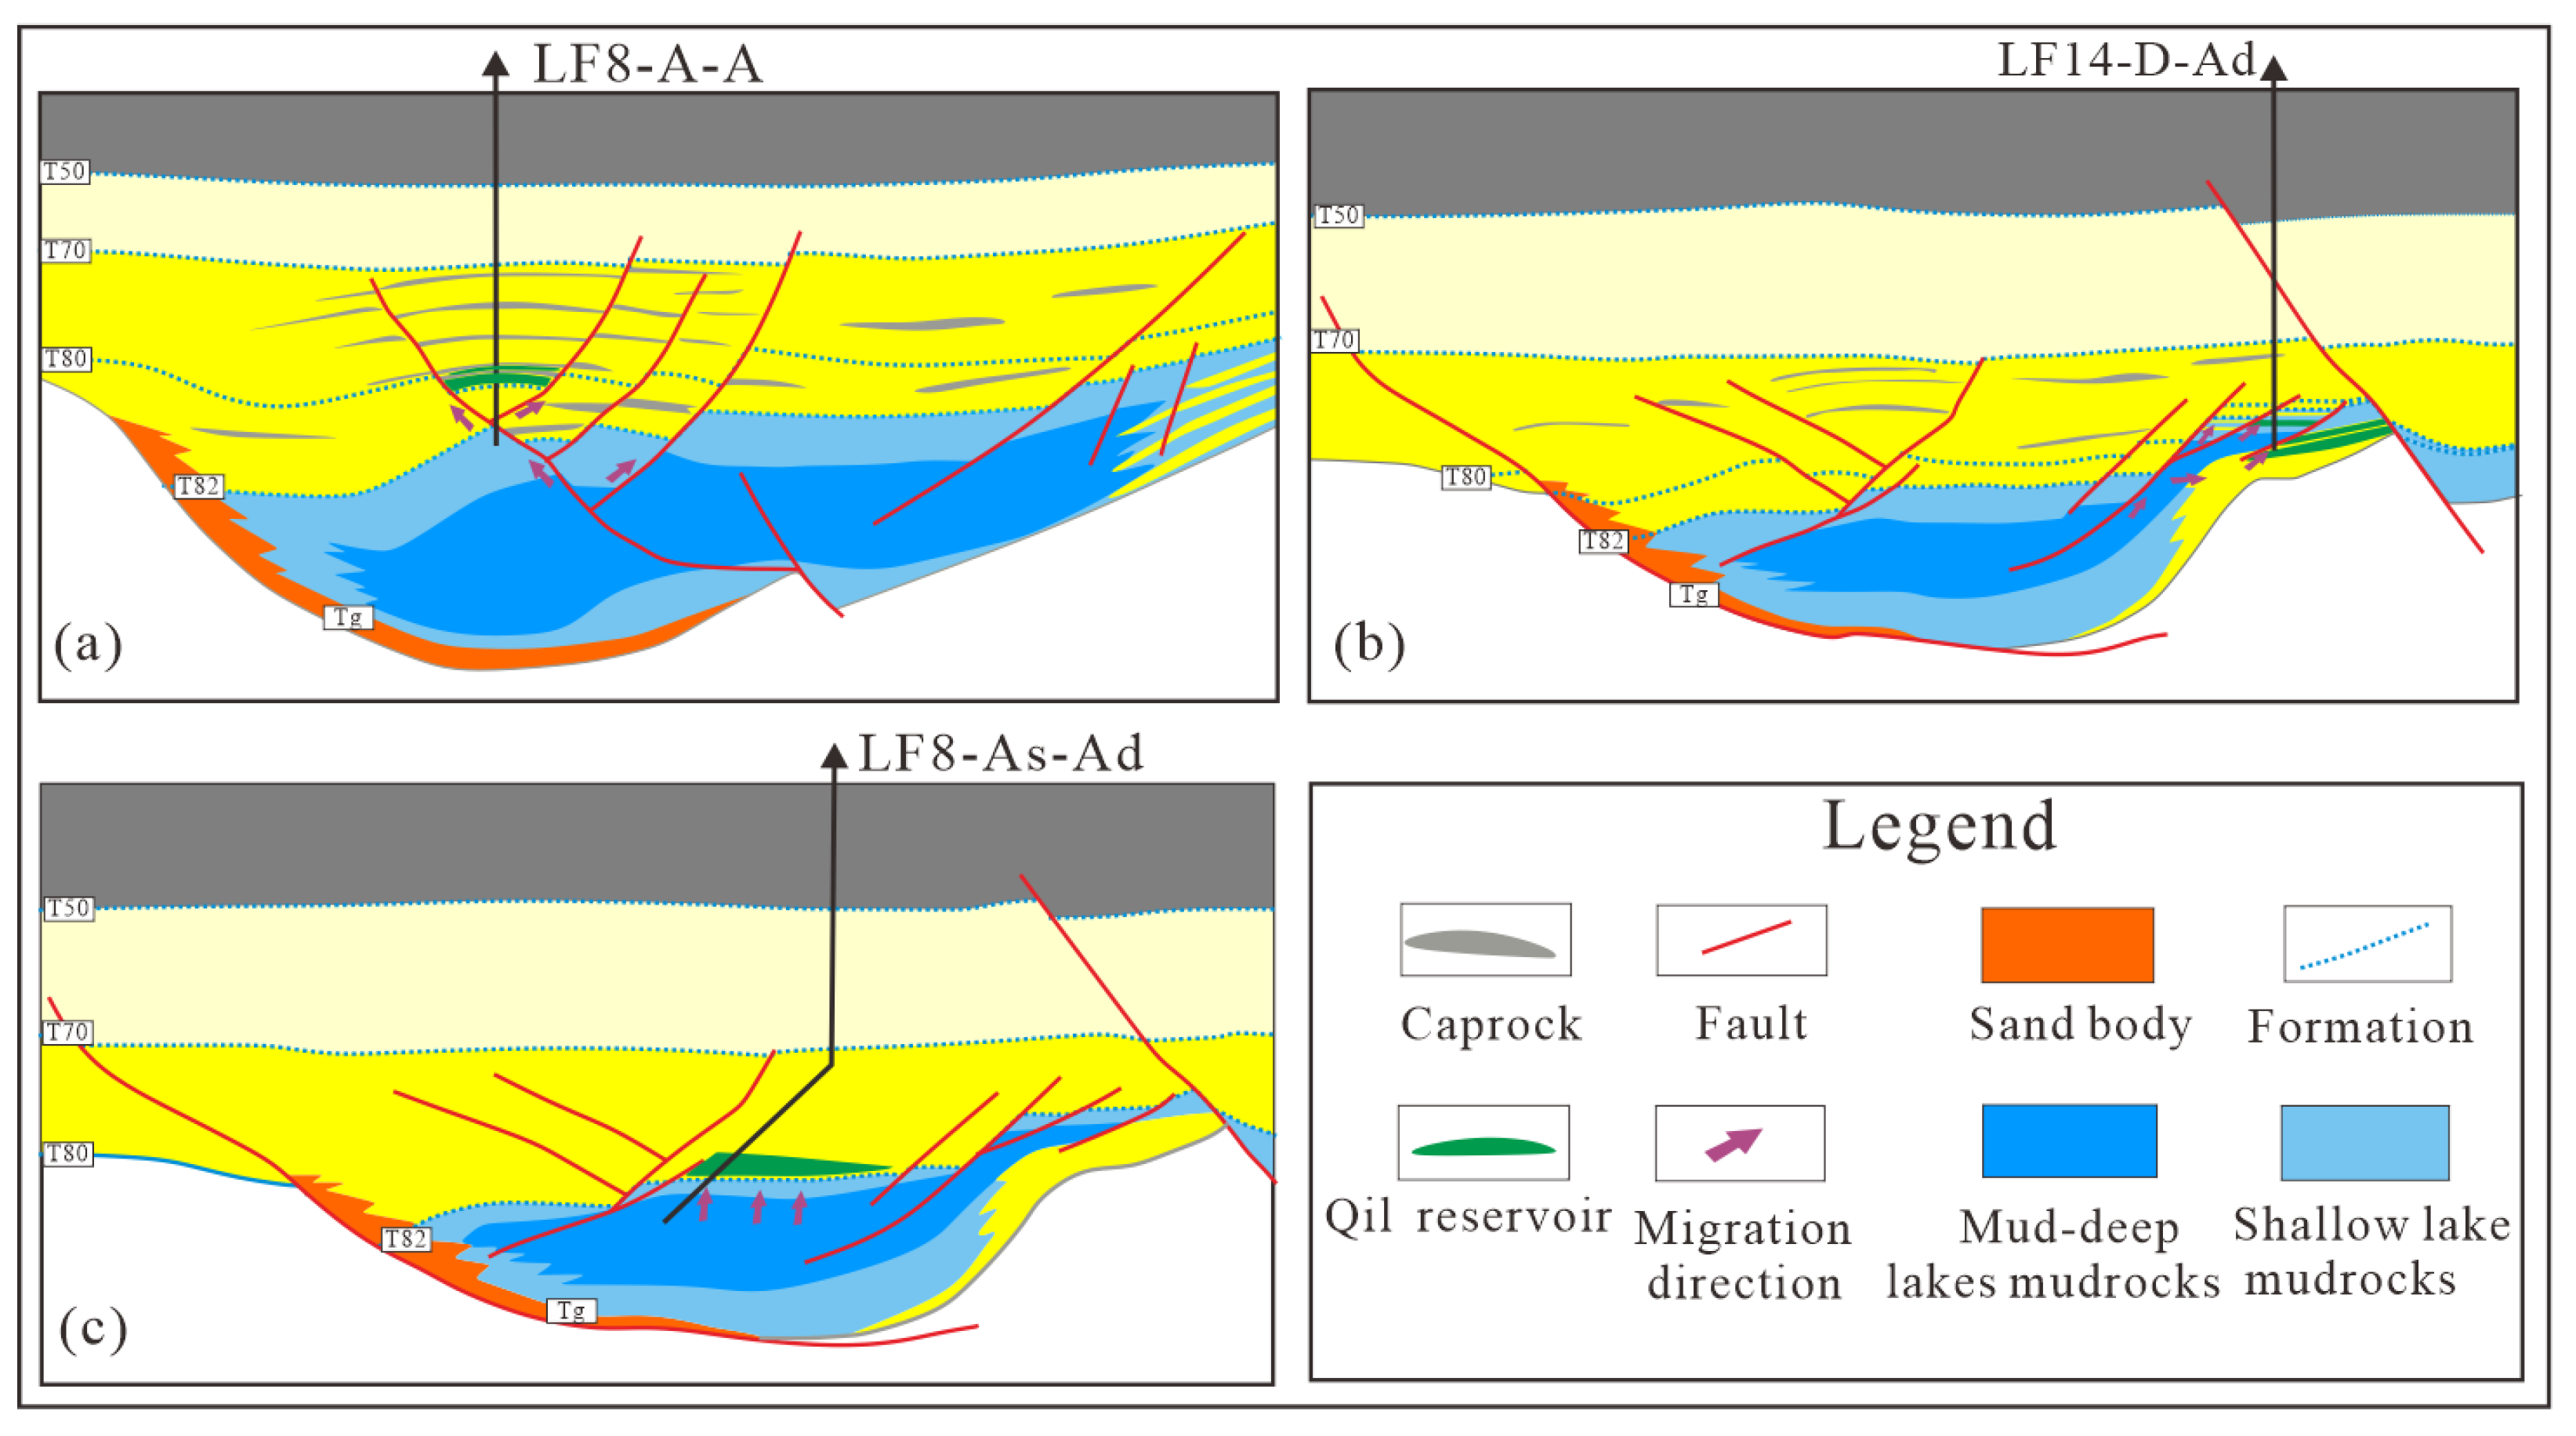
4.5. Accumulation Model

According to previous studies [36], the source rocks of the Paleogene WC are the effective source rocks, and the lithology of the WC is mainly dark mudstone. Within the sub-sag, the sandstone-to-stratum ratio of the WC is relatively low, which is an unconnected sand body assemblage. Toward the edge of the sub-sag, the sandstone-to-stratum ratio gradually increases, and the sand body begins to exhibit connectivity characteristics near the uplift belt. Thus, hydrocarbon migration to the WC reservoir outside the sub-sag through the fault–sand-body migration system becomes difficult, and the hydrocarbon is mainly accumulated inside the sub-sag. However, the time–space matching relationships between source rocks, reservoirs, and discovered hydrocarbon reservoirs inside the sub-sag and the specific reservoir formation are unclear.
The Pearl River Mouth Basin is a composite basin that experienced the development of the Cenozoic rift and passive continental margin [75]. Since the WC was developed during the syn-rift stage, the subsidence and burial history play an important role in the petroleum systems in relation to thermal evolution and maturation of organic matter. The evolution of faulted blocks by the tectonic subsidence could enhance the formation of petroleum system in the Paleogene strata, burial, and further thermal history. The post-rift thermal subsidence could also contribute the deeper burial and thermal evolution. Therefore, the evolution stage and maturity of the source rocks of the WC are different in different periods of oil and gas accumulation. However, only the source rocks below the HET can expel hydrocarbon, which contributes to the oil and gas accumulation of the WC.
This study comprehensively considered the results of oil and source rock correlation, the conditions of hydrocarbon accumulation, the dominant migration pathway, and the stages of hydrocarbon accumulation. The internal structural morphology of the sub-sag in each accumulation period was restored using the “layer leveling method” [76]. Through this method, the hydrocarbon accumulation model applied to the Lufeng sag is summarized.
In the first period of hydrocarbon accumulation (18.1–13.6 Ma), the Paleogene strata were still buried shallowly, and only the lower WC in the sub-sag began to enter the HET (3500 m). The hydrocarbon expulsion occurs mainly from the source rocks of the WC5 and the WC6. Because few faults cut through the lower WC and connect with the connected sand body transport layer, vertical migration of hydrocarbon to the shallow sand body is difficult. During the sedimentary periods of the WC6 and the WC5, the water body was shallow and limited, only lacustrine mudstone was distributed in the sub-sag, and delta sandstone was mainly sedimented at the edge of the sub-sag. The lacustrine facies and delta facies were superimposed on each other at the edge of the sub-sag owing to the continuous change of the lake area, which increased the contact area between them. Therefore, there is good lateral contact between the mudstone of the WC6 and the WC5 in the sub-sag and the sand body at the edge of the sub-sag. These provide conditions for lateral hydrocarbon expulsion from source rocks. The sandstone of the WC6 and the WC5 is thicker and more mature at the edge of the sub-sag, which provides a good reservoir for hydrocarbon accumulation. In addition, the thickness of the delta sandstone of the WC6 and the WC5 gradually decreases to the edge of the sub-sag, and the upper part is covered with the thick mudstone of the WC4 and the WC3, which forms lithologic pinchout traps as a whole. This provides sealing and trap conditions for hydrocarbon accumulation. Within the Lufeng 13 sub-sag, the reservoirs of the WC6 and the WC5 of the LF14-D structure are typical in this period. The reservoir forming time is 13.7 Ma, the types of crude oil are types B and C, the hydrocarbon sources are the source rocks of the WC5 and the WC6 inside the Lufeng 13 sub-sag, and the hydrocarbon migration is through the sand body transport layer. The source–reservoir–caprock assemblage belongs to the oil and gas reservoir lateral contact with source rock (Figure 15a).
In the second period of hydrocarbon accumulation (13.6–8 Ma), most of the top interfaces of the WC3 were buried below the HET. In this period, the shore–shallow lacustrine and semi-deep lacustrine source rocks of the WC6 and the WC5 were cogenerated with the semi-deep lacustrine to deep lacustrine source rocks of the WC3 and the WC4. However, because of the limited distribution and small thickness of the WC6 and the WC5 mudstone, the amount of hydrocarbon generation is limited. Inside the sub-sag, numerous oil–source faults cut through the source rocks of the WC3 and the WC4 and come into contact with the overlying sandstone. The development density of oil–source faults is the highest in the Lufeng 13 east sub-sag. The sandstone-to-stratum ratio of the WC3 and the WC4 increases at the edge of the sub-sag, exhibiting characteristics of “mudstone encrusted sandstone” in its entirety. Although the thickness of the reservoir is small, it has superior sealing conditions. The area close to the fault is suitable for hydrocarbon accumulation. The LF14-H-Ad of the WC4 reservoir belongs to this type. Its reservoir forming time is 13–8 Ma; the crude oil belongs to Type C crude oil, where semi-deep lacustrine to deep lacustrine crude oil comes from the WC3 and the WC4 source rocks. The faults are the vertical migration pathway, and the sand body transport layer is the lateral migration pathway (Figure 15b).
In the third period of hydrocarbon accumulation (8–0 Ma), the WC was all buried below the HET, and the source rocks of shallow lacustrine to semi-deep lacustrine source rocks of the upper WC began to expel a large number of hydrocarbons. The actual oil and source rock correlation results show that Type B crude oil is distributed in deeper layers, the reservoir is closer to the source rock, the migration distance is short, and the accumulation characteristics mainly reflect those of fault hydrocarbon reservoirs. This phenomenon may be due to the weak vertical conductivity of the faults. During this period, the vertical migration conditions are poor. Except for a few faults with weak activity, the internal faults of the sub-sag ceased their activities, and hydrocarbons mainly migrated around through the sand body. In the interior of the sub-sag, owing to the lack of vertical migration conditions, hydrocarbon generated from the source rocks of the WC3 and the WC4 are difficult to accumulate into reservoirs. At the edge of the sub-sag, the source rocks are close to faults, and the vertical migration conditions are good. Thus, there was a continuous supply of hydrocarbons to the overlying strata. In addition, during the second period, the hydrocarbon reservoir formed by capping the source rocks of the Upper WC was filled with Type B crude oil formed by the source rocks of the upper WC, forming Type C crude oil with mixed-source characteristics. The structural hydrocarbon reservoir of the LF14-H-Ad well indicates a typical reservoir of this type.
Because of the deterioration of vertical migration conditions, the upper WC reservoir inside the sub-sag is near the source rocks, its sandstone physical properties become worse with increasing burial depth, and the fault sealing becomes stronger, resulting in a new hydrocarbon accumulation. The LF8-As-Ad reservoir is representative of this type of reservoir. The oil is sourced in the source rock of the upper WC, and the crude oil type is Type B crude oil. The sandstone of the upper WC provides good reservoir conditions, and the shore–shallow lacustrine mudstone of the lower EP provides good sealing conditions. Fault traps were formed because of the poor vertical conductivity and poor physical properties of the sandstone on both sides of the fault (Figure 15c).
According to the result analysis of oil and source rock correlation, dominant hydrocarbon migration pathways, accumulation stages, and accumulation processes in the Lufeng sag summarized three hydrocarbon accumulation models (Figure 16):
  • In the first period, accumulation with vertical migration by fault, which considers the fault–sand-body structural ridge as the migration system, formed anticlines and fault hydrocarbon reservoirs, such as the LF8-A-A reservoir (Figure 16a);
  • In the second period, accumulation with lateral migration by sand body, which uses the lateral sand body as the migration pathway, generally formed lithologic hydrocarbon reservoirs, such as the LF14-D-Ad reservoir (Figure 16b);
  • In the third period, accumulation with vertical migration by sand body and adjacent to source accumulation, which uses the vertical sand body as a migration pathway, generally formed structural and fault reservoirs, such as LF8-As-Ad reservoirs (Figure 16c).

5. Discussion

5.1. Geological Condition Verify Oil and Source Rock Correlation Results

Concluding oil and source rock correlation results using only biomarkers is highly risky [19]. As early as 1981, there was an error in the study of the Michigan basin when it was considered that the crude oil of the Yanxia Formation is comparable to that of the Yanshang Formation. However, a later study on migration conditions confirmed that there was probably no correlation between them [77]. Similarly, there are differences in the Lufeng sag: the conclusions obtained from the geochemical and sedimentological analysis of the character of the WC6 and the WC5 source rocks. Therefore, this paper uses oil and source rock correlation inversion combined with existing data to distinguish the crude oil source and explain the cause of such differences mentioned.
The source rocks of the WC5 and the WC6 were only drilled at the edge of the Lufeng 13 and Lufeng 15 sub-sags, and the drilling thickness was small. The geochemical characteristics of the residual soluble organic matter in the two Formations of source rocks exhibited deep lacustrine to semi-deep lacustrine facies characteristics (Figure 17). However, based on sedimentological analysis, during the sedimentary period of the WC5 and the WC6, the southwest Lufeng sag was in the initial rift stage, the lake depth was shallow, and the distribution of lakes was limited, mainly developing shore–shallow lacustrine to semi-deep lacustrine and delta sedimentary systems, almost not a developed deep lacustrine sedimentary system (Figure 17).
According to the above geological conditions of hydrocarbon generation, the sedimentological perspective is more realistic in the discrimination of the source rock properties of the WC5 and the WC6. The reasons for this are as follows:
  • The drilled mudstone sections of the WC5 and the WC6 have high sand content, exhibiting alternating delta facies and shore–shallow lacustrine facies characteristics as a whole;
  • The deep lacustrine to semi-deep lacustrine mudstone of the WC4 of the thick mudstone overlying the WC5 and the WC6 is drilled. As an important hydrocarbon reservoir, the sandstone of the WC5 and the WC6 may have been infected with Type A crude oil. Consequently, this section exhibits deep lacustrine to semi-deep lacustrine characteristics;
  • The crude oil of the LF 14-D-Ad, LF 14-D-Adsa, and LF 14-D-Adsb wells in the WC5 and the WC6 exhibit the characteristics of Type B and C crude oil.
Geochemical biomarkers indicate that only the source rocks of the WC1 and the WC2 exhibit characteristics of shallow lacustrine facies. However, the source rocks of the WC1 and the WC2 and the reservoirs of the WC6 and the WC5 are divided by the thick mudstone of the WC3 and the WC4 (Figure 17). Therefore, it is almost impossible for the crude oil of the WC6 and the WC5 to have originated from the source rocks of the WC1 and the WC2. According to the study of the tectonic development history and sedimentology [38], it is considered that there are shallow lacustrine to semi-deep lacustrine facies source rocks of the WC6 and the WC5.
According to the analysis of the actual geological conditions of the study area, the source rocks of the WC6 and the WC5 have the characteristics of shallow lacustrine to semi-deep lacustrine facies. The Type B crude oil of the lower WC in the LF 14-D structural belt probably come from the source rock of the WC6 and the WC5.

5.2. Compound Migration System

The source of crude oil, the migration system of hydrocarbon, and the time-space allocation relationship of various factors of hydrocarbon accumulation are the main research contents of the hydrocarbon accumulation model. Among them, hydrocarbon migration is the focus of accumulation research, and the migration system connects source rocks and reservoirs, providing a channel for oil and gas accumulation [78,79]. The migration system in southern Lufeng sag includes faults and connected sand bodies, and the structural ridge is the dominant path of oil and gas migration.
A single migration pathway is insufficient for constructing the transport systems of hydrocarbons from sources to traps. Generally, hydrocarbon migration occurs along compound migration systems comprising different migration pathways [80]. The configuration of these migration pathways in three-dimensional space constitutes the compound transport system of oil and gas migration, and the configuration relationship of each transport system in the plane determines the boundary and range of the formation and distribution of oil and gas reservoirs.
A well-configured migration system can result in hydrocarbon accumulation from the source rock to the high part of a structure and form a structural hydrocarbon reservoir. In contrast, a poorly configured migration system will largely affect the long-distance migration of hydrocarbons. However, regardless of the configuration relationship of the composite migration system, hydrocarbons also migrate to the structural high point and the fault zone under the effect of potential energy and pressure differences. Thus, even if the configuration relationship between migration systems is poor, hydrocarbons will migrate along the extension direction of a single migration pathway, which mainly forms lithologic or stratigraphic hydrocarbon reservoirs with near-source distribution. Therefore, by summarizing the distribution characteristics of the oil–source fault, the structural ridge, and the connected sand body transport layer in the Lufeng sag, the migration pathways of hydrocarbon in the compound migration system and single migration pathway are analyzed comprehensively.
The configuration of the compound migration system in the WC is poor, and the whole migration system is dominated by a single migration system. The oil–source fault of the upper WC and the connected sand body transport layer is not good, and there is a good configuration relationship only in the north of the Lufeng 13 east sub-sag. The dominant hydrocarbon migration direction of the Lufeng 13 east sub-sag composite migration system is from the interior of the sub-sag to the Lufeng low uplift. Second, the oil–source faults developed around the Lufeng 15 sub-sag and inside the Lufeng 13 sub-sag may be in contact with disconnected sand bodies inside the sag (Figure 18a). The configuration of the composite migration system of the lower Wenchang Formation is poor, and the oil–source faults and connected sand bodies are well-configured in the south of the Lufeng 15 and Lufeng 13 east sub-sags. The dominant migration direction is from the interior of the Lufeng 15 sub-sag to the Dongsha uplift to the south and east and from the inside of the Lufeng 13 sub-sag to the Huilu low uplift in the south. In addition, the oil–source faults developed around the Lufeng 15 sub-sag and inside the Lufeng 13 sub-sag may also be connected with disconnected sand bodies inside the sag (Figure 18b).

5.3. The Lower Limit of Hydrocarbon Accumulation under Buoyancy

Based on the oil and source rock correlation and hydrocarbon migration pathways, this study analyzes the accumulation process of oil and gas in three reservoir accumulation periods and establishes three accumulation models for the southwest Lufeng sag. However, the migration-driving force of hydrocarbons, which plays an important role in their accumulation, was not considered while establishing the accumulation models. Hydrocarbons form different types of reservoirs under different dynamics [81]. During the exploration of the southwest Lufeng sag, the LF14-D-Ad found tight oil in the reservoir of the WC. Thus, it can form unconventional hydrocarbons. The difference between conventional and unconventional hydrocarbon accumulation dynamics causes differences in hydrocarbon distribution characteristics [82,83]. It was generally accepted by previous researchers that porosity equals 10%, and permeability equals 1 mD as the critical conditions for the change in dynamic mechanisms in reservoir physical properties in conventional reservoirs and tight oil [84,85]. Pang et al. (2021) [81] introduced the theory of lower limits of oil and gas reservoir accumulation under buoyancy and identified the boundary between conventional and unconventional hydrocarbon accumulation based on this theory. By analyzing the variation of porosity and permeability in the Lufeng sag, the lower limit of hydrocarbon accumulation under buoyancy is determined to be between 3900 and 4100 m (Figure 19).
According to the lower limit of hydrocarbon accumulation under buoyancy, a part of the WC is located under the lower limit. The confining dynamic field of the WC is widely distributed. The LF14-D-Ad reservoir is located under the lower limit of hydrocarbon accumulation under buoyancy, and the reservoir has low porosity and mid–low permeability characteristics. This is mainly because faults are well developed in this area, which enhances the physical properties and pore structure of the reservoir. Thus, a fractured hydrocarbon reservoir can most likely be discovered under the lower limit of hydrocarbon accumulation under buoyancy, which is the focus of further exploration.

6. Conclusions

  • The relative contribution of the source rocks of the EP to the WC reservoir is relatively small, and the source rocks of the WC are generally below the HET, which is the main source of crude oil of the WC reservoirs. The source rocks of the WC could be divided into three types: the shallow lacustrine to semi-deep lacustrine source rocks of the WC5 and the WC6, semi-deep lacustrine to deep lacustrine source rocks of the WC4 and the WC3, and shallow lacustrine to semi-deep lacustrine source rocks of the WC3, the WC1, and the WC2.
  • The crude oil in the southern Lufeng sag was classified into three types. Type A crude oil is generated from source rocks of the WC4 and the WC3; Type B crude oil is generated from source rocks of the WC3, the WC1, and the WC2; and Type C crude oil is a mixed-source oil of Type A and Type B crude oil.
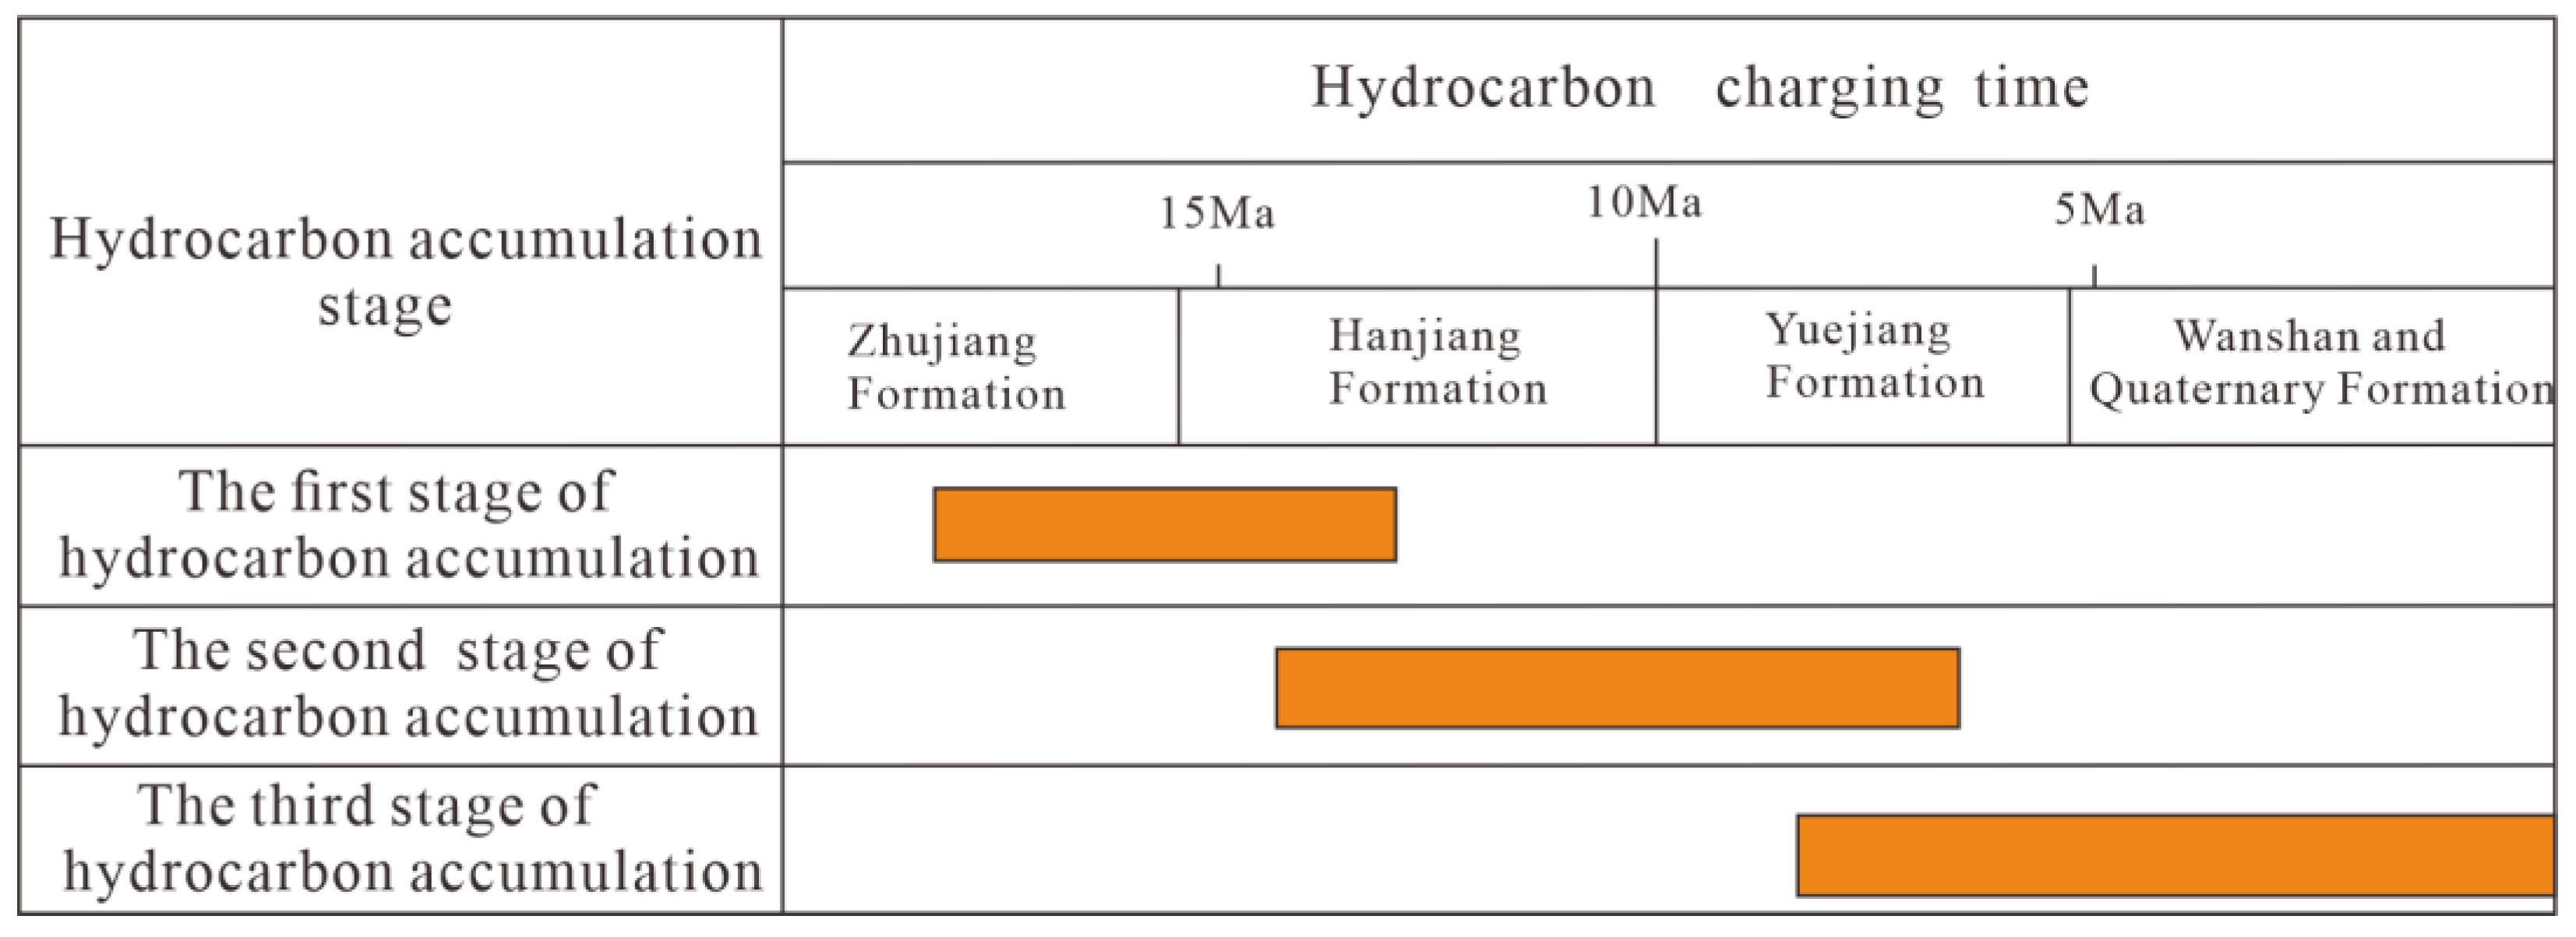
  • This study systematically summarizes three main accumulation models of the WC oil reservoir: in the first period (begins at 18.1 Ma and ends at 13.3 Ma), there was accumulation with vertical migration by fault; in the second period (beginning from 14.6 Ma to the end of 6.8 Ma), there was accumulation with lateral migration by sand body; and in the third period (from 8.5 Ma to the present), there was accumulation with vertical migration by sand body and adjacent to source.
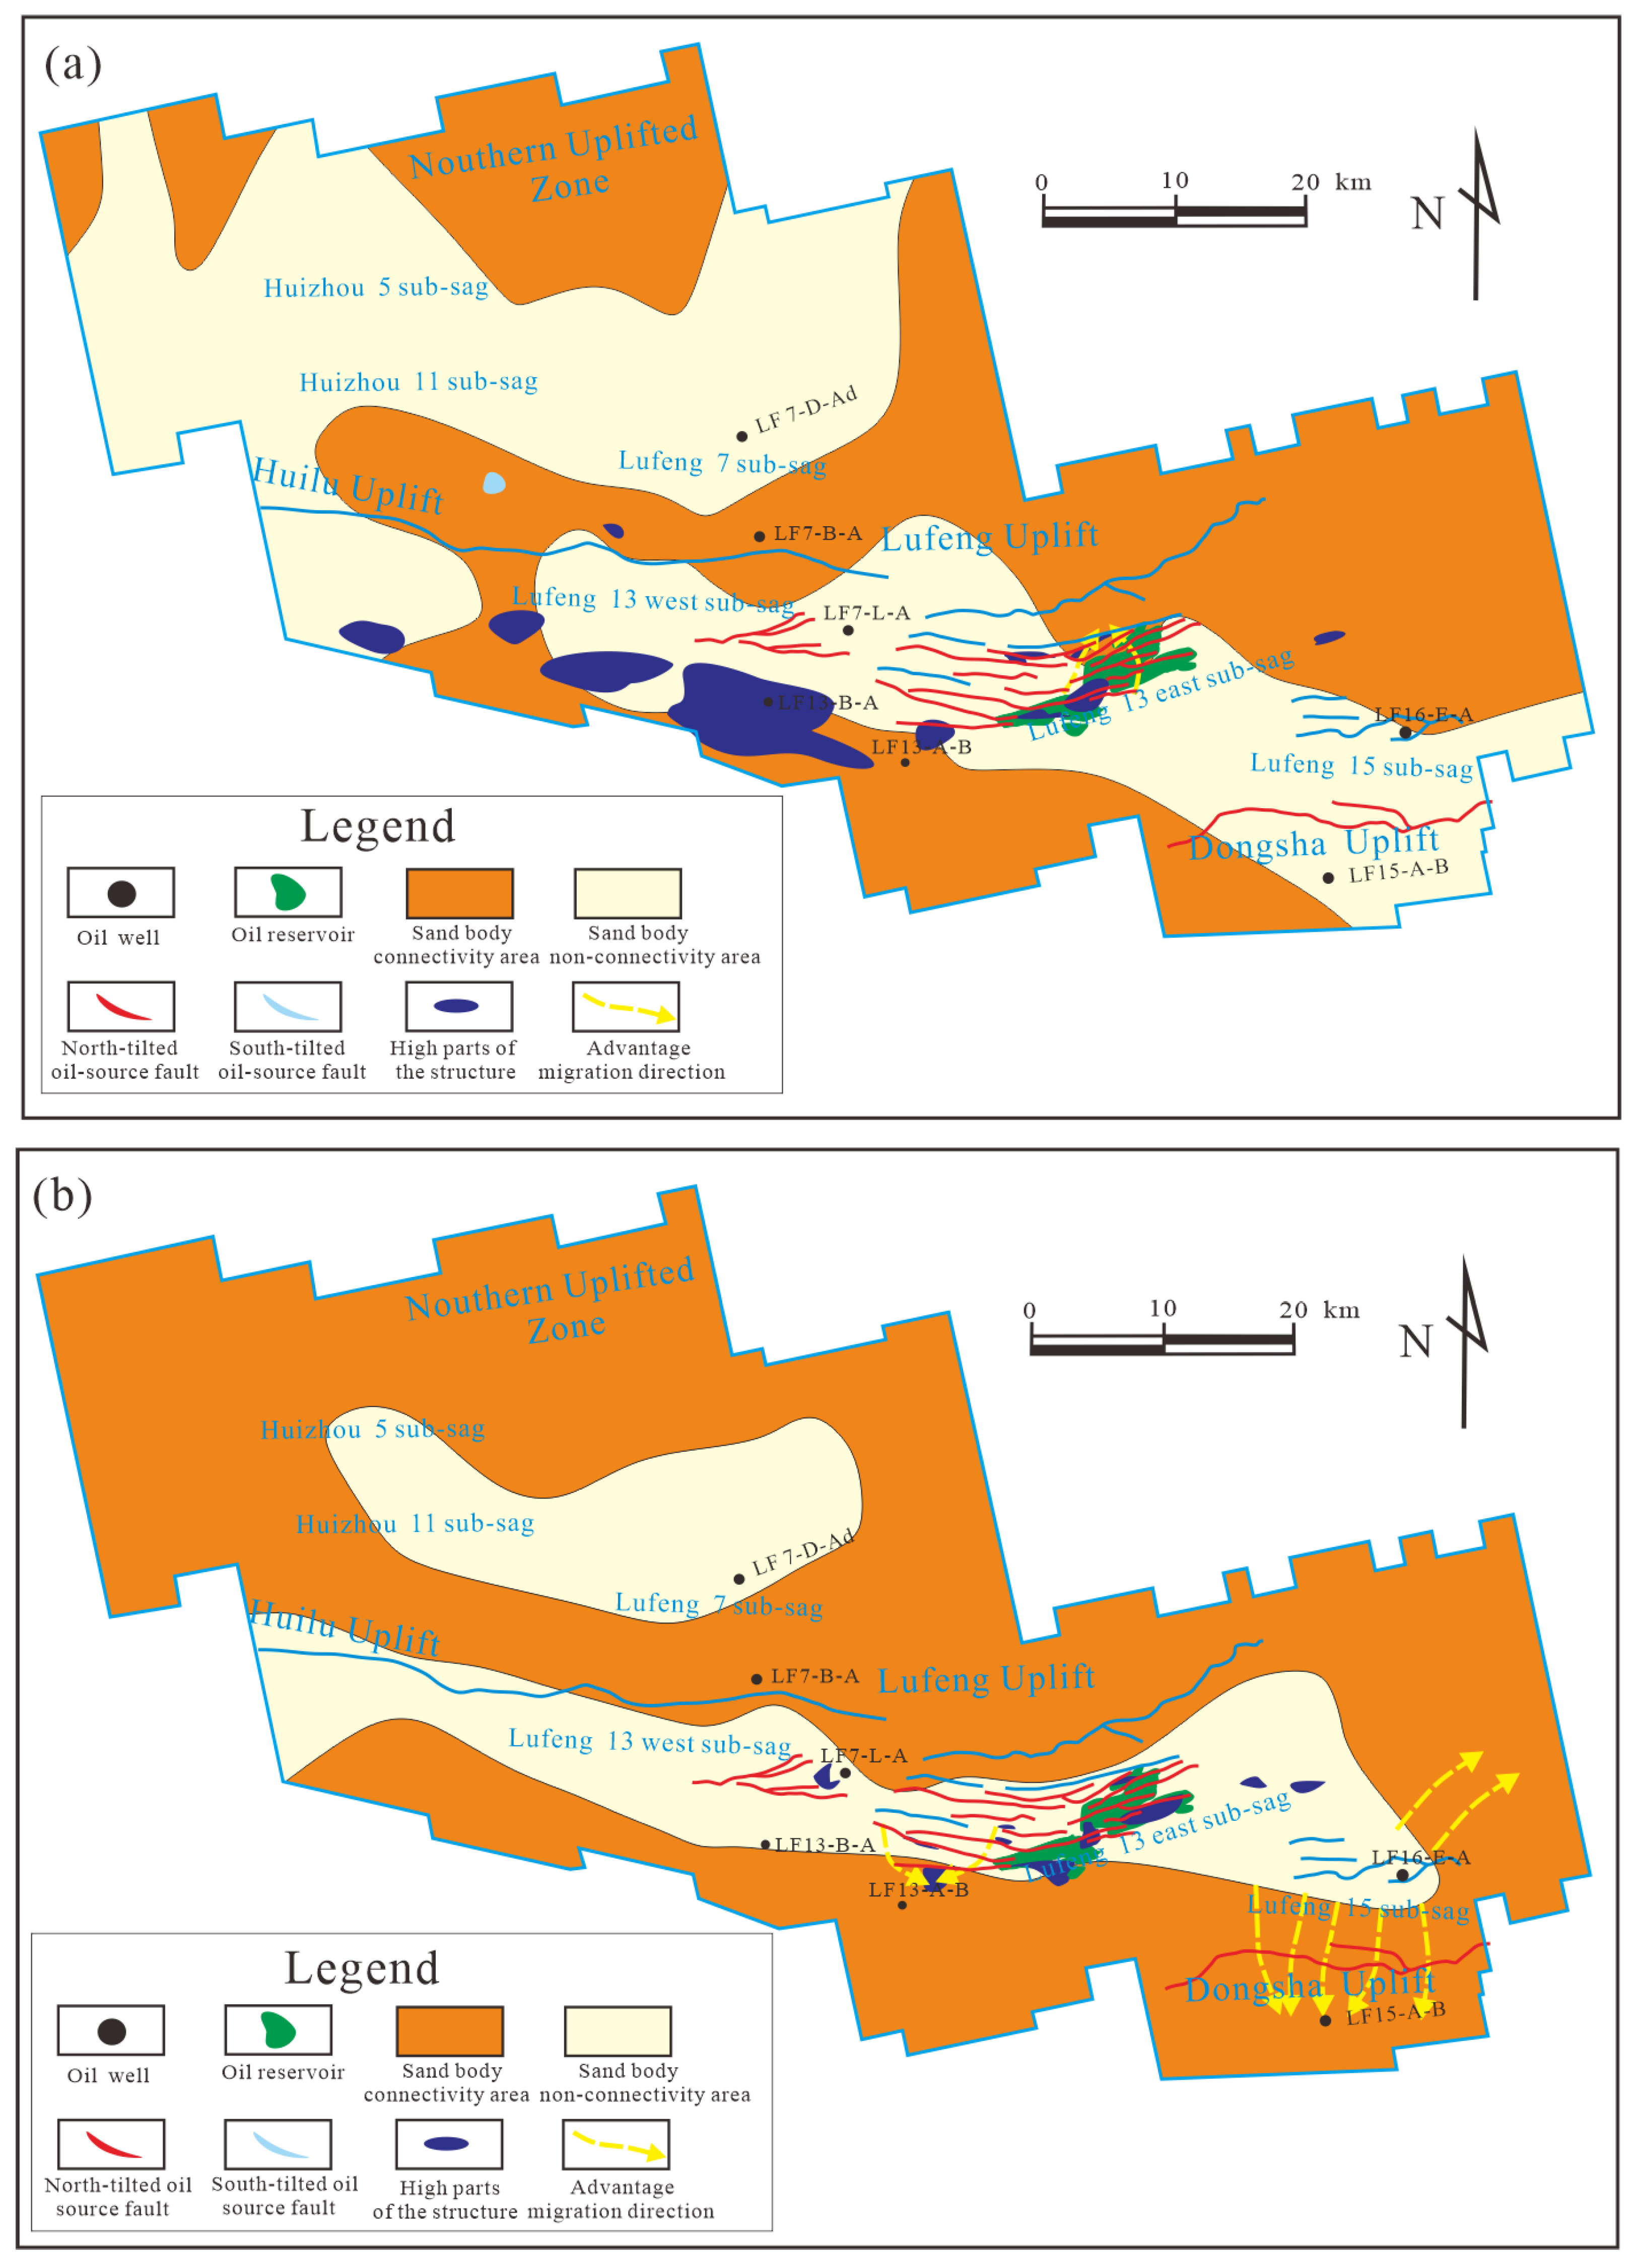
  • The sand body transport layers have little direct contact with oil–source faults, and a few oil–source faults at the edge of the sub-sag are in contact with the sand body transport layers, forming a few dominant hydrocarbon migration pathways to the uplift belt. The oil–source faults in the WC inside the sub-sag connect the unconnected sand body transporting layers, providing good conditions for the formation of lithologic hydrocarbon reservoirs.

Author Contributions

Conceptualization, H.P. and K.M.; methodology, K.M.; validation, K.M. and X.H.; formal analysis, X.H.; investigation, K.M., X.H. and X.Z.; data curation, S.H. and S.W.; writing—original draft preparation, K.M. and X.H.; writing—review and editing, H.P. and X.H.; visualization, S.H., S.W. and X.Z.; supervision, H.P.; project administration, H.P. All authors have read and agreed to the published version of the manuscript.

Funding

This work was supported by Joint Funds of the National Natural Science Foundation of China, China grant number: U19B6003-02 and the National Natural Science Foundation of China, grant number 42102145.

Data Availability Statement

The data presented in this study are available on request from the corresponding author.

Acknowledgments

We appreciate the Shenzhen Branch of China National Offshore Oil Corporation (CNOOC) Limited, Shenzhen for contributing relevant geological data and allowing the publication of the results. The authors hereby express their gratitude to the anonymous reviewers who improved the manuscript.

Conflicts of Interest

The authors declare no conflict of interest.

Appendix A

Table A1. Calculation table of organic geochemical data and hydrocarbon generation potential index of Paleogene source rocks in southern Lufeng sag.
WellDepth
(m)
StrataTOC
(%)
Ro
(%)
Tmax
(°C)
S1 (mg/g)S2 (mg/g)(S1 + S2)/TOC × 100 (mg/g)
LF13-1N-A 2850.0Enping Formation0.06 4790.210.10516.67
LF13-A-A3181.3Enping Formation0.42 4390.040.2773.81
LF13-A-A3215.0Enping Formation0.35 4310.050.2791.43
LF13-A-A3055.0Enping Formation0.78 4410.162.03280.77
LF13-A-A3145.0Enping Formation0.47 4450.081.07244.68
LF13-A-A2995.0Enping Formation0.68 4370.060.5386.76
LF13-A-A3037.5Enping Formation0.93 4360.100.84101.08
LF13-A-A3077.5Enping Formation0.50 4390.030.2250.00
LF13-A-A3137.5Enping Formation0.48 4390.060.3993.75
LF13-A-A2911.4Enping Formation0.47 4400.030.57127.66
LF13-B-A2890.0Enping Formation4.44 4310.6411.39270.95
LF13-B-A2927.5Enping Formation0.78 4350.080.6796.15
LF13-B-A2962.5Enping Formation5.52 4310.7212.85245.83
LF13-B-A3015.0Enping Formation1.49 4350.182.41173.83
LF13-B-A3027.5Enping Formation1.51 4400.192.05148.34
LF13-G-A3174.0Enping Formation1.210.524131.303.32381.82
LF13-G-A3018.0Enping Formation1.440.514352.564.05459.03
LF14-B-A2924.8Enping Formation17.23 4184.4472.81448.35
LF14-B-A2928.0Enping Formation1.33 4320.303.04251.13
LF14-B-A2987.0Enping Formation0.49 4300.130.70169.39
LF14-B-A3005.6Enping Formation0.21 426 0.55261.90
LF14-B-A3110.0Enping Formation1.18 4370.112.30204.24
LF14-B-A3200.0Enping Formation1.40 4380.132.15162.86
LF14-C-A3037.0Enping Formation1.44 4350.453.16250.69
LF14-D-Ad3009.0Enping Formation0.560.604160.541.93441.07
LF14-D-Dd2971.5Enping Formation 4296.21139.98460.01
LF14-H-AD3094.5Enping Formation0.500.584270.341.45358.00
LF14-H-AD3211.5Enping Formation0.590.604240.351.75355.93
LF15-H-A3183.0Enping Formation0.61 4340.452.97560.66
LF15-H-A2877.5Enping Formation6.50 4270.7025.75406.92
LF15-H-A3111.0Enping Formation1.21 4360.302.82257.85
LF16-F-Ad3014.0Enping Formation1.85 4261.034.82316.22
LF16-F-Ad3077.0Enping Formation1.17 4220.853.45367.52
LF16-G-A2827.5Enping Formation1.15 4121.003.44386.09
LF16-G-A3027.5Enping Formation0.92 4170.793.99519.57
LF7-J-Ad3439.5Enping Formation0.83 4160.483.13434.94
LF7-J-Ad3484.5Enping Formation0.63 4100.362.04380.95
LF7-J-Ad3171.0Enping Formation1.33 4350.403.73310.53
LF7-J-Ad3340.5Enping Formation11.04 4361.7849.49464.40
LF7-L-A3536.5Enping Formation0.03 4830.010.04166.67
LF7-L-A3563.5Enping Formation0.140.444840.020.0657.14
LF7-L-A3614.5Enping Formation0.100.444460.070.10170.00
LF7-L-B3798.0Enping Formation0.76 4400.260.89151.32
LF8-A-A2971.5Enping Formation0.60 4310.770.81263.33
LF8-A-A2998.5Enping Formation0.40 4320.570.71320.00
LF8-A-A3085.5Enping Formation0.27 4220.500.67433.33
LF8-A-A3262.5Enping Formation0.32 4300.650.65406.25
LF8-A-B3445.5Enping Formation0.91 4370.332.40300.00
LF8-A-C3557.6Enping Formation0.11 4390.050.33345.45
LF8-A-C3511.0Enping Formation0.76 4410.492.04332.89
LF8-A-C3558.0Enping Formation0.61 4391.032.26539.34
LF8-A-C3660.0Enping Formation0.84 4351.052.52425.00
LF8-A-C3828.0Enping Formation0.97 4301.162.98426.80
LF8-A-C2949.0Enping Formation0.66 4240.681.85383.33
LF8-A-C3060.0Enping Formation0.57 4340.591.97449.12
LF8-A-C3183.0Enping Formation0.47 4270.541.49431.91
LF8-AS-Ad3420.0Enping Formation0.94 4390.643.17405.32
LF8-AS-Ad3486.0Enping Formation0.71 4310.631.89354.93
LF8-AS-Ad3124.5Enping Formation0.91 4310.712.93400.00
LF8-B-A3494.9Enping Formation0.040.544370.020.12350.00
LF9-C-Ad3018.0Enping Formation2.97 4320.489.49335.69
LF9-C-Ad3040.5Enping Formation6.87 4230.8430.24452.40
LF9-C-Ad3089.5Enping Formation1.85 4320.384.88284.32
LF9-C-Ad3178.5Enping Formation1.22 4250.401.96193.44
LF9-F-A2841.0Enping Formation0.24 4230.130.54279.17
LF13-B-A3145.0Wenchang Formation4.46 4401.8127.01646.19
LF13-B-A3155.0Wenchang Formation2.24 4370.6111.06520.98
LF13-B-A3185.0Wenchang Formation 4390.5211.09560.87
LF13-B-A3192.5Wenchang Formation2.30 4380.7211.24520.00
LF13-B-A3195.0Wenchang Formation2.09 4390.6410.07512.44
LF13-B-A3200.0Wenchang Formation1.93 4370.357.16389.12
LF13-B-A3205.0Wenchang Formation2.09 4380.6110.01508.13
LF13-B-A3212.5Wenchang Formation2.50 4400.9311.64502.80
LF13-B-A3217.5Wenchang Formation7.75 4342.1123.84334.84
LF13-B-A3227.5Wenchang Formation3.50 4391.1710.57335.43
LF13-B-A3232.5Wenchang Formation3.54 4360.589.50284.75
LF13-B-A3237.5Wenchang Formation3.94 4370.9212.60343.15
LF13-B-A3250.0Wenchang Formation2.21 4420.587.94385.52
LF13-B-A3275.0Wenchang Formation3.56 4370.9812.44376.97
LF13-B-A3242.5Wenchang Formation2.93 4400.749.81360.07
LF13-B-A3267.5Wenchang Formation2.58 4380.8410.17426.74
LF13-B-A3272.5Wenchang Formation2.32 4420.709.70448.28
LF13-G-A3438.0Wenchang Formation1.760.554272.095.19413.64
LF13-G-A3468.0Wenchang Formation2.130.564402.806.34429.11
LF13-G-A3594.0Wenchang Formation1.920.564402.776.53484.38
LF13-G-A3609.0Wenchang Formation6.100.5842016.6114.18504.75
LF13-G-A3624.0Wenchang Formation5.650.5843213.4216.23524.78
LF13-G-A3651.0Wenchang Formation3.950.594318.3811.54504.30
LF13-G-A3669.0Wenchang Formation3.260.604336.4110.23510.43
LF13-G-A3684.0Wenchang Formation3.450.664366.6010.48495.07
LF13-G-A3702.0Wenchang Formation3.680.674337.0210.63479.62
LF13-G-A3726.0Wenchang Formation3.140.714346.509.11497.13
LF13-G-A3747.0Wenchang Formation4.120.6943210.0313.97582.52
LF13-G-A3919.5Wenchang Formation1.270.884253.334.70632.28
LF13-G-A4014.0Wenchang Formation2.560.824324.079.76540.23
LF14-D-Ad3516.0Wenchang Formation0.560.694210.462.14464.29
LF14-D-Ad3564.0Wenchang Formation0.820.704590.573.07443.90
LF14-D-Ad4051.5Wenchang Formation0.530.744320.601.96483.02
LF14-D-Ad4060.5Wenchang Formation0.860.754710.833.10456.98
LF14-D-Ad3639.0Wenchang Formation 0.714680.703.07
LF14-D-Ad3720.0Wenchang Formation 0.724320.030.0431.82
LF14-D-Ad3801.0Wenchang Formation1.560.724602.718.90744.23
LF14-D-Ad3825.0Wenchang Formation1.390.724602.126.44615.83
LF14-D-Ad3870.0Wenchang Formation1.230.734661.945.94640.65
LF14-D-Ad3879.0Wenchang Formation1.420.774712.507.45700.70
LF14-D-B3631.5Wenchang Formation3.110.614134.6713.36579.74
LF14-D-B3718.5Wenchang Formation2.070.674131.513.37235.75
LF14-D-Dd3851.0Wenchang Formation1.21 4400.905.32514.05
LF14-D-Dd3912.5Wenchang Formation1.09 4410.815.02534.86
LF14-D-Dd3987.5Wenchang Formation1.32 4420.986.20543.94
LF14-D-Dd4067.0Wenchang Formation1.25 4420.875.53512.00
LF14-H-Ad3778.5Wenchang Formation0.99 4390.622.88353.54
LF14-H-Ad3847.5Wenchang Formation1.12 4410.873.96431.25
LF14-H-Ad3883.5Wenchang Formation1.26 4411.105.11492.86
LF14-H-Ad3979.5Wenchang Formation1.54 4441.637.02561.69
LF14-H-Ad4023.0Wenchang Formation1.27 4411.355.97576.38
LF14-H-Ad4104.0Wenchang Formation1.54 4411.386.30498.70
LF14-H-Ad3778.5Wenchang Formation0.990.644390.622.88353.54
LF14-H-Ad3847.5Wenchang Formation1.120.624410.873.96431.25
LF14-H-Ad3883.5Wenchang Formation1.260.634411.105.11492.86
LF14-H-Ad3979.5Wenchang Formation1.540.644441.637.02561.69
LF14-H-Ad4023.0Wenchang Formation1.270.634411.355.97576.38
LF14-H-Ad4104.0Wenchang Formation1.540.674411.386.30498.70
LF15-H-A3297.0Wenchang Formation0.79 4320.513.26477.22
LF15-H-A3495.0Wenchang Formation1.10 4380.675.85592.73
LF15-H-A3615.0Wenchang Formation2.75 4442.2818.40752.00
LF15-H-A3660.0Wenchang Formation3.14 4432.3420.60730.57
LF15-H-A3694.0Wenchang Formation3.07 4432.5519.07704.23
LF15-H-A3738.0Wenchang Formation2.12 4431.8712.18662.74
LF15-H-A3950.0Wenchang Formation1.48 4420.455.93431.08
LF16-E-A3114.0Wenchang Formation0.760.554380.783.26532.98
LF16-E-A3156.0Wenchang Formation0.690.544440.431.64300.44
LF16-E-A3480.0Wenchang Formation 0.564430.939.69
LF16-E-A3216.0Wenchang Formation0.570.554380.612.52550.09
LF16-E-A3264.0Wenchang Formation0.880.554460.502.12297.05
LF16-E-A3273.0Wenchang Formation0.800.564410.773.53539.52
LF16-E-A3315.0Wenchang Formation1.400.624431.497.13615.71
LF16-E-A3341.5Wenchang Formation2.51 4340.6412.61527.89
LF16-E-A3349.5Wenchang Formation4.83 4332.5424.64562.73
LF16-E-A3427.5Wenchang Formation4.61 4412.0828.45662.26
LF16-E-A3584.0Wenchang Formation 0.574430.232.05
LF16-E-A3417.0Wenchang Formation1.880.584381.276.83430.85
LF16-E-A3426.0Wenchang Formation1.700.604401.136.27435.29
LF16-E-A3456.0Wenchang Formation2.450.604411.849.75473.06
LF16-E-A3474.0Wenchang Formation1.790.614402.1810.38701.68
LF16-E-A3492.0Wenchang Formation2.090.624361.887.39443.54
LF16-E-A3514.5Wenchang Formation2.010.624401.597.95474.63
LF16-E-A3531.0Wenchang Formation2.140.644372.079.22527.57
LF16-E-A3546.0Wenchang Formation2.440.664392.219.46478.28
LF16-E-A3561.0Wenchang Formation2.730.664413.5917.02754.95
LF16-E-A3576.0Wenchang Formation2.050.654392.7111.79707.32
LF16-E-A3757.0Wenchang Formation3.35 4412.6616.53572.84
LF16-F-Ad3191.0Wenchang Formation 4294.4891.97447.36
LF16-F-Ad3233.0Wenchang Formation1.94 4321.829.23569.59
LF16-F-Ad3263.0Wenchang Formation4.06 4342.1125.90689.90
LF16-F-Ad3296.0Wenchang Formation3.65 4372.1923.98716.99
LF16-F-Ad3326.0Wenchang Formation3.55 4361.8221.26650.14
LF16-F-Ad3356.0Wenchang Formation3.44 4351.5822.91711.92
LF16-F-Ad3395.0Wenchang Formation3.86 4371.7724.87690.16
LF16-F-Ad3479.0Wenchang Formation3.33 4371.8321.55702.10
LF16-G-A3285.0Wenchang Formation0.920.734350.543.82473.91
LF16-G-A3387.0Wenchang Formation0.640.774260.442.26421.88
LF16-G-A3600.0Wenchang Formation0.640.764230.532.54479.69
LF16-G-A3702.0Wenchang Formation0.810.814090.743.12476.54
LF16-G-A3955.5Wenchang Formation0.820.834310.703.63528.05
LF16-G-A4077.0Wenchang Formation1.020.864330.542.90337.25
LF16-G-A4149.0Wenchang Formation1.30 4100.502.51231.54
LF7-J-Ad3606.0Wenchang Formation1.82 4421.006.73424.73
LF7-J-Ad3621.0Wenchang Formation1.51 4460.634.99372.19
LF7-J-Ad3639.0Wenchang Formation1.48 4450.735.52422.30
LF7-J-Ad3671.5Wenchang Formation2.10 4450.978.65458.10
LF7-J-Ad3723.0Wenchang Formation1.72 4441.307.04484.88
LF7-J-Ad3792.0Wenchang Formation3.13 4461.7015.29542.81
LF7-J-Ad3825.0Wenchang Formation2.41 4482.5611.33576.35
LF7-J-Ad4179.5Wenchang Formation1.65 4501.207.68538.18
LF7-L-A3821.5Wenchang Formation0.930.474450.211.68203.23
LF7-L-A3722.5Wenchang Formation1.31 4460.483.27286.26
LF7-L-A3776.5Wenchang Formation1.170.574480.422.55253.85
LF7-L-A3827.5Wenchang Formation1.420.564480.672.87249.30
LF7-L-A3872.5Wenchang Formation1.110.584500.542.27253.15
LF7-L-A3935.5Wenchang Formation2.510.594443.136.75393.63
LF7-L-B3804.0Wenchang Formation1.98 4391.293.60246.97
LF7-L-B3814.5Wenchang Formation1.88 4421.283.99280.32
LF7-L-B3823.5Wenchang Formation1.81 4410.973.71258.56
LF7-L-B3833.5Wenchang Formation1.63 4410.762.80218.40
LF7-L-B3844.5Wenchang Formation1.63 4401.043.11254.60
LF7-L-B3852.0Wenchang Formation1.79 4391.153.11237.99
LF7-L-B3858.0Wenchang Formation2.00 4411.273.43235.00
LF8-A-C4212.0Wenchang Formation1.01 4310.952.90381.19
LF8-A-C4266.0Wenchang Formation1.66 4401.325.04383.13
LF8-A-C4351.5Wenchang Formation1.23 4461.013.95403.25
LF8-AS-Ad4136.3Wenchang Formation0.74 4440.201.32205.41
LF8-AS-Ad4272.0Wenchang Formation1.41 4421.485.10466.67
LF8-AS-Ad4317.0Wenchang Formation1.27 4421.324.47455.91
LF8-AS-Ad4380.0Wenchang Formation1.54 4451.475.08425.32
LF8-AS-Ad4515.0Wenchang Formation1.62 4411.625.57443.83
LF9-C-Ad3207.5Wenchang Formation1.43 4320.403.99306.99
LF9-C-Ad3289.5Wenchang Formation3.13 4382.0123.32809.27
LF9-C-Ad3322.5Wenchang Formation3.30 4391.8322.92750.00
LF9-C-Ad3418.5Wenchang Formation0.92 4340.854.83617.39
LF9-C-Ad3490.5Wenchang Formation0.84 4240.724.42611.90
LF9-C-Ad3558.0Wenchang Formation0.89 4320.693.74497.75
LF9-F-A3110.0Wenchang Formation2.88 4431.1519.79727.08
LF9-F-A3075.0Wenchang Formation1.090.524390.394.52450.46
LF9-F-A3135.0Wenchang Formation2.63 4391.3514.77612.93
LF9-F-A3162.0Wenchang Formation1.590.554410.475.81394.97
LF9-F-A3195.0Wenchang Formation1.580.564410.485.54381.01
LF9-F-A3264.0Wenchang Formation1.430.584410.484.40341.26
LF9-F-A3297.0Wenchang Formation1.230.574400.372.53235.77
LF9-F-A3315.0Wenchang Formation0.47 4160.190.81212.77

References

  1. Leila, M.; Awadalla, A.; Farag, A.; Moscariello, A. Organic Geochemistry and Oil-Source Rock Correlation of the Cretaceous Succession in West Wadi El-Rayan (WWER) Concession: Implications for a New Cretaceous Petroleum System in the North Western Desert, Egypt. J. Pet. Sci. Eng. 2022, 219, 111071. [Google Scholar] [CrossRef]
  2. Safaei-Farouji, M.; Kamali, M.R.; Rahimpour-Bonab, H.; Gentzis, T.; Liu, B.; Ostadhassan, M. Organic Geochemistry, Oil-Source Rock, and Oil-Oil Correlation Study in a Major Oilfield in the Middle East. J. Pet. Sci. Eng. 2021, 207, 109074. [Google Scholar] [CrossRef]
  3. Dembicki, H. Practical Petroleum Geochemistry for Exploration and Production; Elsevier: Amsterdam, The Netherlands, 2016. [Google Scholar]
  4. Peters, K.E.; Walters, C.C.; Moldowan, J. The Biomarker Guide: Biomarkers and Isotopes in Petroleum Systems and Earth History; Cambridge University Press: Cambridge, UK, 2005. [Google Scholar]
  5. Zheng, R.; Zhang, G.; Qu, Y.; Wang, S.; Jin, X.; Chen, X.; Zhang, Z. Oil-Source Correlation under the Complex Geological Conditions: A Case Study of the Chaiwopu Sag, Southern Junggar Basin, NW China. J. Pet. Sci. Eng. 2022, 210, 110056. [Google Scholar] [CrossRef]
  6. Hunt, J.M.; Philp, R.P.; Kvenvolden, K.A. Early Developments in Petroleum Geochemistry. Org. Geochem. 2002, 33, 1025–1052. [Google Scholar] [CrossRef]
  7. Lan, X.; Liu, H. The Geochemical Characteristics of the Paleogene Lacustrine Source Rock and Cenozoic Oil in the Eastern Huanghekou Sag, Bohai Bay Basin, China: An Oil–Source Rock Correlation. J. Pet. Sci. Eng. 2022, 214, 110434. [Google Scholar] [CrossRef]
  8. Li, D.; Li, R.; Wang, B.; Liu, Z.; Wu, X.; Liu, F.; Zhao, B.; Cheng, J.; Kang, W. Study on Oil–Source Correlation by Analyzing Organic Geochemistry Characteristics: A Case Study of the Upper Triassic Yanchang Formation in the South of Ordos Basin, China. Acta Geochim. 2016, 35, 408–420. [Google Scholar] [CrossRef]
  9. Lu, S.; Zhang, M. Oil and Gas Geochemistry; Petroleum Industry Press: Beijing, China, 2010. [Google Scholar]
  10. Bray, E.E.; Evans, E.D. Distribution of N-Paraffins as Clue to Recognision of Source Beds. Geochim. Cosmochim. Acta 1961, 22, 2–15. [Google Scholar] [CrossRef]
  11. Jiamo, F.; Cunmin, P.; Guoying, S.; Dehan, L.; Sizhong, C. A Geochemical Investigation of Crude Oils from Eastern Pearl River Mouth Basin, South China Sea. J. Southeast Asian Earth Sci. 1993, 8, 469–486. [Google Scholar] [CrossRef]
  12. Huang, Z. Nonmarine Source Rock and Petroleum Formation of Pearl River Mouth Basin. China Offshore Oil Gas (Geol.) 1998, 12, 255–261. [Google Scholar]
  13. Zhang, S.; Liang, D.; Gong, Z.; Wu, K.; Li, M.; Song, F.; Song, Z.; Zhang, D.; Wang, P. Geochemistry of Petroleum Systems in the Eastern Pearl River Mouth Basin: Evidence for Mixed Oils. Org. Geochem. 2003, 34, 971–991. [Google Scholar] [CrossRef]
  14. Ji, C. Biomarker Characteristics and Oil-Sources Correlation Research of the Research in the Southern Qiangtang Depression; Chengdu University of Technology: Chengdu, China, 2015. [Google Scholar]
  15. Huang, W.-Y.; Meinschein, W.G. Sterols as Ecological Indicators. Geochim. Cosmochim. Acta 1979, 43, 739–745. [Google Scholar] [CrossRef]
  16. Mackenzie, A.S.; Patience, R.; Maxwell, J.R.; Vandenbroucke, M.; Durand, B. Molecular Parameters of Maturation in the Toarcian Shales, Paris Basin, France. I. Changes in the Configurations of Acyclic Isoprenoid Alkanes, Steranes and Triterpanes (Organic Geochemistry). Geochim. Cosmochim. Acta 1980, 44, 1709–1721. [Google Scholar] [CrossRef]
  17. Seifert, W. Source rock/oil correlations by C27–C30 biological marker hydrocarbons. In Advances in Organic Geochemistry 1975; Enadimsa: Madrid, Spain, 1977; pp. 21–44. [Google Scholar]
  18. Hu, Y.; Hao, F.; Zhu, J.; Tian, J.; Ji, Y. Origin and Occurrence of Crude Oils in the Zhu1 Sub-Basin, Pearl River Mouth Basin, China. J. Asian Earth Sci. 2015, 97, 24–37. [Google Scholar] [CrossRef]
  19. Illich, H.A.; Grizzle, P.L. Comment on “Comparison of Michigan Basin Crude Oils” by Vogler et Al. Geochim. Cosmochim. Acta 1983, 47, 1151–1155. [Google Scholar] [CrossRef]
  20. Rullkötter, J.; Meyers, P.A.; Schaefer, R.G.; Dunham, K.W. Oil Generation in the Michigan Basin: A Biological Marker and Carbon Isotope Approach. Org. Geochem. 1986, 10, 359–375. [Google Scholar] [CrossRef] [Green Version]
  21. Peng, J.; Pang, X.; Peng, H.; Ma, X.; Shi, H.; Zhao, Z.; Xiao, S.; Zhu, J. Geochemistry, Origin, and Accumulation of Petroleum in the Eocene Wenchang Formation Reservoirs in Pearl River Mouth Basin, South China Sea: A Case Study of HZ25-7 Oil Field. Mar. Pet. Geol. 2017, 80, 154–170. [Google Scholar] [CrossRef]
  22. Ge, J.W.; Zhu, X.M.; Zhang, X.T.; Jones, B.G.; Yu, F.S.; Niu, Z.C.; Li, M. Tectono-Stratigraphic Evolution and Hydrocarbon Exploration in the Eocene Southern Lufeng Depression, Pearl River Mouth Basin, South China Sea. Aust. J. Earth Sci. 2017, 64, 931–956. [Google Scholar] [CrossRef]
  23. Zheng, L.; Chen, C.; Lu, C.; Cheng, M. Study on Facies-Controlled Model of a Reservoir in Xijiang 24-3 Oilfield in the Northern Pearl River Mouth Basin. Adv. Geo-Energy Res. 2018, 2, 282–291. [Google Scholar] [CrossRef]
  24. Niu, Z.; Liu, G.; Ge, J.; Zhang, X.; Cao, Z.; Lei, Y.; An, Y.; Zhang, M. Geochemical Characteristics and Depositional Environment of Paleogene Lacustrine Source Rocks in the Lufeng sag, Pearl River Mouth Basin, South China Sea. J. Asian Earth Sci. 2019, 171, 60–77. [Google Scholar] [CrossRef]
  25. Peng, G.; Pang, X.; Xu, D.; Luo, J.; Yu, S.; Li, H.; Hu, T.; Wang, C.; Liu, Y. Characteristics of Paleogene whole petroleum system and orderly distribution of oil and gas reservoirs in south Lufeng depression, Pearl River Mouth Basin. Earth Sci. 2002, 47, 2494–2508. [Google Scholar]
  26. Shi, H. “Source-migration-accumulation” evaluation system and its application in hydrocarbon exploration: A case study of Zhu I depression in Pearl River Mouth Basin. China Offshore Oil Gas 2015, 27, 1–12. [Google Scholar]
  27. Zhu, X.; Ge, J.; Wu, B. Reservoirs characteristics and main controlling factors of deep sandstone in Lufeng sag, Pearl River Mouth Basin. Acta Pet. Sin. 2019, 40, 69–80. [Google Scholar]
  28. Zhang, J.; Cao, J.; Hu, W.; Zhi, D.; Guo, X.; Bian, B. Insights into Carboniferous Subduction-Related Petroleum Systems in the Central Asian Orogenic Belt (CAOB) from Hydrocarbons in Vein Calcite Cements, West Junggar, Northwest China. Mar. Pet. Geol. 2021, 124, 104796. [Google Scholar] [CrossRef]
  29. Lin, H.-M.; Liu, H.; Wang, X.-D.; Qiu, X.-W.; Ju, Y.-T.; Meng, J.; Li, L. Basin-Filling Processes and Hydrocarbon Source Rock Prediction of Low-Exploration Degree Areas in Rift Lacustrine Basins: A Case from the Wenchang Formation in Low-Exploration Degree Areas, Northern Zhu I Depression, Pearl River Mouth Basin, E China. J. Palaeogeogr. 2022, 11, 286–313. [Google Scholar] [CrossRef]
  30. Quan, Y.; Hao, F.; Liu, J.; Zhao, D.; Tian, J.; Wang, Z. Source Rock Deposition Controlled by Tectonic Subsidence and Climate in the Western Pearl River Mouth Basin, China: Evidence from Organic and Inorganic Geochemistry. Mar. Pet. Geol. 2017, 79, 1–17. [Google Scholar] [CrossRef]
  31. Shi, H.; Lei, Y.; Wu, M.; Lan, Q. Research on the evolution of pores in deep sandstone reservoir in ZHU1 Depression. Earth Sci. Front. 2008, 15, 169–175. [Google Scholar]
  32. Yan, R. The Study of Reservoir Accumulation Mechanism and Enrichment Laws of Paleogene Low-Permeability Reservoirs in the South of Lufeng sag in the Pearl River Estuary Basin; China University of Petroleum: Beijing, China, 2016. [Google Scholar]
  33. Ding, L. Resource potential and main controlling factors of hydrocarbon accumulation of Wenchang Formation in southwest Lufeng sag. J. Yangtze Univ. (Nat. Sci. Ed.) 2021, 17, 46–56. [Google Scholar] [CrossRef]
  34. Aguilera, C.L.; Huizinga, B.J.; Lomando, A.J. Petroleum Geology of the Zhu-1 Depression, Pearl River Mouth Basin, People’s Republic of China. AAPG Bull. 1990, 74, 5. [Google Scholar] [CrossRef]
  35. Peng, J.; Pang, X.; Shi, H.; Peng, H.; Xiao, S.; Yu, Q.; Wu, L. Hydrocarbon Generation and Expulsion Characteristics of Eocene Source Rocks in the Huilu Area, Northern Pearl River Mouth Basin, South China Sea: Implications for Tight Oil Potential. Mar. Pet. Geol. 2016, 72, 463–487. [Google Scholar] [CrossRef]
  36. Jiang, H.; Pang, X.; Shi, H.; Yu, Q.; Cao, Z.; Yu, R.; Chen, D.; Long, Z.; Jiang, F. Source Rock Characteristics and Hydrocarbon Expulsion Potential of the Middle Eocene Wenchang Formation in the Huizhou Depression, Pearl River Mouth Basin, South China Sea. Mar. Pet. Geol. 2015, 67, 635–652. [Google Scholar] [CrossRef]
  37. Shi, H.; Dai, Y.; Liu, L.; Shu, Y.; Mei, L. Genetic Pattern of Belt-Wide Petroliferous Phenomenon in the Eastern Pearl River Mouth Basin and Its Practical Application. Pet. Sci. 2014, 11, 1–13. [Google Scholar] [CrossRef] [Green Version]
  38. Wang, X.; Zhang, X.; Lin, H.; Que, X.; He, Y.; Jia, L.; Xiao, Z.; Li, M. Paleogene Geological Framework and Tectonic Evolution of the Central Anticlinal Zone in Lufeng 13 Sag, Pearl River Mouth Basin. Pet. Res. 2019, 4, 238–249. [Google Scholar] [CrossRef]
  39. Ge, J.; Zhu, X.; Chen, F.; Zhu, D.; An, Y.; Niu, Z.; Lei, Y. Sequence Architecture and Controlling Factors of the Wenchang Formation in the Gentle Slope of Eastern Lufeng Depression, Pearl River Mouth Basin. J. China Univ. Min. Technol. 2017, 46, 563–577. [Google Scholar] [CrossRef]
  40. Huang, B.; Xiao, X.; Zhang, M. Geochemistry, Grouping and Origins of Crude Oils in the Western Pearl River Mouth Basin, Offshore South China Sea. Org. Geochem. 2003, 34, 993–1008. [Google Scholar] [CrossRef]
  41. Peng, J.; Pang, X.; Li, H.; Xiao, S.; Wang, Z.; Pang, X. A new method based on hydrocarbon migration threshold and combined reservoir controlling function for quantitatively predicting favorable hydrocarbon exploration zones: A case study of the lower Member of the Zhujiang r Formation in Zhuyi depression. Acta Pet. Sin. 2015, 36, 156–168. [Google Scholar]
  42. Robison, C.R.; Elrod, L.W.; Bissada, K.K. Petroleum Generation, Migration, and Entrapment in the Zhu 1 Depression, Pearl River Mouth Basin, South China Sea. Int. J. Coal Geol. 1998, 37, 155–178. [Google Scholar] [CrossRef]
  43. Espitalie, J.; Laporte, J.L.; Madec, M.; Marquis, F.; Leplat, P.; Paulet, J.; Boutefeu, A. Rapid Method for Source Rock Characterization and for Determination of Their Petroleum Potential and Degree of Evolution. Oil Gas Sci. Technol. Rev. 1977, 32, 23–42. [Google Scholar]
  44. Peters, K. Guidelines for Evaluating Petroleum Source Rock Using Programmed Pyrolysis. AAPG Bull. 1986, 70, 318–329. [Google Scholar] [CrossRef]
  45. Zhou, J.; Pang, X. A method for calculating the quantity of hydrocarbon generation and expulsion. Pet. Explor. Dev. 2002, 29, 24–27. [Google Scholar]
  46. Pang, X.; Li, M.; Li, S.; Jin, Z. Geochemistry of Petroleum Systems in the Niuzhuang South Slope of Bohai Bay Basin: Part 3. Estimating Hydrocarbon Expulsion from the Shahejie Formation. Org. Geochem. 2005, 36, 497–510. [Google Scholar] [CrossRef]
  47. Pepper, A.S. Estimating the Petroleum Expulsion Behaviour of Source Rocks: A Novel Quantitative Approach. Geol. Soc. Lond. Spec. Publ. 1991, 59, 9–31. [Google Scholar] [CrossRef]
  48. Zhao, J.; Cao, Q.; Bai, Y.; Li, J.; Er, C.; Wu, W. Petroleum system: From conventional to unconventional. In Proceedings of the International Conference and Exhibition, Barcelona, Spain, 3–6 April 2016; Society of Exploration Geophysicists: Tulsa, OK, USA; American Association of Petroleum Geologists: Tulsa, OK, USA, 2016; p. 213. [Google Scholar]
  49. Mu, D.; Peng, G.; Zhu, D.; Li, S.; Suo, Y.; Zhan, H.; Zhao, L. Structure and Formation Mechanism of the Pearl River Mouth Basin: Insights from Multi-Phase Strike-Slip Motions in the Yangjiang Sag, SE China. J. Asian Earth Sci. 2022, 226, 105081. [Google Scholar] [CrossRef]
  50. Hunt, J.M. Petroleum Geochemistry and Geology; W.H. Freeman and Company: New York, NY, USA, 1995. [Google Scholar]
  51. Pang, X.; Chen, Z. Basic concept of hydrocarbon expulsion threshold and its research significance and application. Geoscience 1997, 11, 510–521. [Google Scholar]
  52. Atoyebi, A.O.; Adekola, S.A.; Akinlua, A. Tricyclic Terpane Geochemistry of Source Rocks from Northwestern and Central Niger Delta. Pet. Sci. Technol. 2017, 35, 2094–2101. [Google Scholar] [CrossRef]
  53. De Leeuw, J.W.; Cox, H.C.; van Graas, G.; van de Meer, F.W.; Peakman, T.M.; Baas, J.M.A.; van de Graaf, B. Limited Double Bond Isomerisation and Selective Hydrogenation of Sterenes during Early Diagenesis. Geochim. Cosmochim. Acta 1989, 53, 903–909. [Google Scholar] [CrossRef]
  54. Jiamo, F.; Guoying, S.; Jiayou, X.; Eglinton, G.; Gowar, A.P.; Rongfen, J.; Shanfa, F.; Pingan, P. Application of Biological Markers in the Assessment of Paleoenvironments of Chinese Non-Marine Sediments. Org. Geochem. 1990, 16, 769–779. [Google Scholar] [CrossRef]
  55. Moldowan, J.M.; Fago, F.J.; Carlson, R.M.K.; Young, D.C.; an Duvne, G.; Clardy, J.; Schoell, M.; Pillinger, C.T.; Watt, D.S. Rearranged Hopanes in Sediments and Petroleum. Geochim. Cosmochim. Acta 1991, 55, 3333–3353. [Google Scholar] [CrossRef]
  56. Rubinstein, I.; Albrecht, P. The Occurence of Nuclear Methylated Steranes in a Shale. J. Chem. Soc. Chem. Commun. 1975, 24, 957–958. [Google Scholar] [CrossRef]
  57. Simoneit, B.R.T.; Leif, R.N.; Radler de Aquino Neto, F.; Almeida Azevedo, D.; Pinto, A.C.; Albrecht, P. On the Presence of Tricyclic Terpane Hydrocarbons in Permian Tasmanite Algae. Naturwissenschaften 1990, 77, 380–383. [Google Scholar] [CrossRef]
  58. Huang, Z.; Gao, G. Comprehensive Research Methods of Petroleum Geology; Petroleum Industry Press: Beijing, China, 2017. [Google Scholar]
  59. England, W.A.; Mackenzie, A.S.; Mann, D.M.; Quigley, T.M. The Movement and Entrapment of Petroleu Fluids in the Subsurface. J. Geol. Soc. 1987, 144, 327–347. [Google Scholar] [CrossRef]
  60. Horstad, I.; Larter, S.R.; Mills, N. Migration of Hydrocarbons in the Tampen Spur Area, Norwegian North Sea: A Reservoir Geochemical Evaluation. Geological Society, London, Special Publications 1995, 86, 159–183. [Google Scholar] [CrossRef]
  61. Zhu, C.; Gang, W.; Zhao, X.; Wang, Y.; Chen, G.; Pu, X. The Preferential Pathways of Oil Migration in the Qi-Nan Slope Belt of Bohai Bay Basin, China: Insights from Integrated Analyses Using Geochemical and Morphology Tools. J. Pet. Sci. Eng. 2020, 193, 107451. [Google Scholar] [CrossRef]
  62. Peters, K.E.; Walters, C.C.; Moldowan, J.M. The Biomarker Guide: Volume 1: Biomarkers and Isotopes in the Environment and Human History, 2nd ed.; Cambridge University Press: Cambridge, UK, 2004; Volume 1, ISBN 978-0-521-78697-3. [Google Scholar]
  63. Bodnar, R.J. Petroleum Migration in the Miocene Monterey Formation, California, USA: Constraints from Fluid-Inclusion Studies. Mineral. Mag. 1990, 54, 295–304. [Google Scholar] [CrossRef] [Green Version]
  64. Lou, R.; Wang, L.; Wang, L.; Yang, G.; Wang, J.; Liu, C.; Pei, Y.; Zhang, C. Characteristics of Fluid Inclusions and Hydrocarbon Accumulation Period of Huoshiling -Yingcheng Formations in Wangfu Fault Depression, Songliao Basin, China. J. Pet. Sci. Eng. 2022, 208, 109421. [Google Scholar] [CrossRef]
  65. McLimans, R.K. The Application of Fluid Inclusions to Migration of Oil and Diagenesis in Petroleum Reservoirs. Appl. Geochem. 1987, 2, 585–603. [Google Scholar] [CrossRef]
  66. Aydin, A. Fractures, Faults, and Hydrocarbon Entrapment, Migration and flow. Mar. Pet. Geol. 2000, 17, 797–814. [Google Scholar] [CrossRef]
  67. Smith, D.A. Sealing and Non-Sealing Faults. AAPG Bull. 1965, 49, 1749. [Google Scholar] [CrossRef]
  68. Zhang, L.; Luo, X.; Vasseur, G.; Yu, C.; Yang, W.; Lei, Y.; Song, C.; Yu, L.; Yan, J. Evaluation of Geological Factors in Characterizing Fault Connectivity during Hydrocarbon Migration: Application to the Bohai Bay Basin. Mar. Pet. Geol. 2011, 28, 1634–1647. [Google Scholar] [CrossRef]
  69. Thomas, M.M.; Clouse, J.A. Scaled Physical Model of Secondary Oil Migration1. AAPG Bull. 1995, 79, 19–28. [Google Scholar] [CrossRef]
  70. Schowalter, T.T. Mechanics of Secondary Hydrocarbon Migration and Entrapment. AAPG Bull. 1979, 63, 723–760. [Google Scholar] [CrossRef]
  71. Wei, D.; Bilin, S.; Haiyan, J. Daliuquan-Hexiwu Structural Oil and Gas Migration Model and Migration Characteristics of the Plane. IOSR J. Eng. 2016, 6, 10–13. [Google Scholar]
  72. Luo, X.; Lei, Y.; Zhang, L.; Chen, R.; Chen, Z.; Xu, J.; Zhao, J. Research and quantitative characterization method of oil and gas transport conductive layer. Acta Pet. Sin. 2012, 33, 428–436. [Google Scholar]
  73. Liu, Z.; Zhu, W.; Sun, Q.; Jin, B.; Xu, X.; Zhang, H. Characteristics of geotemperature-geopressure system in petroliferous basins of China. Acta Pet. Sin. 2012, 33, 1–17. [Google Scholar] [CrossRef]
  74. Sun, H.; Wan, N.; Xu, T. Provence system and their control on the sedimentation of the upper Es4 in the Guangli Area of Dongying Sag, the Bohai Bay Basin. Oil Gas Geol. 2010, 31, 583–593. [Google Scholar] [CrossRef]
  75. Han, J.; Steel, R.J.; Hou, M.; Li, Y.; Yuan, L.; Zheng, J.; Liu, J. Subsidence and Maturation Evolution of a New Lower-Slope Minibasin, Xingning Sag, Northern South China Sea. J. Pet. Sci. Eng. 2021, 198, 108163. [Google Scholar] [CrossRef]
  76. Li, J. Application of layer leveling method in pre-sedimentary paleomorphological restoration: A case study of Dongying delta development zone in Jiyang Depression. Oil Gas Geophys. 2008, 6, 46–49. [Google Scholar]
  77. Vogler, E.A.; Meyers, P.A.; Moore, W.A. Comparison of Michigan Basin Crude Oils. Geochim. Cosmochim. Acta 1981, 45, 2287–2293. [Google Scholar] [CrossRef]
  78. Liang, J.; Wang, H.; Blum, M.J.; Ji, X. Modeling of Hydrocarbon Migration and Accumulation on the Chengzikou Uplift, Bohai Bay Basin, China: Implications for Petroleum Exploration on Slope Belts in Rift Basins. J. Pet. Sci. Eng. 2020, 189, 106963. [Google Scholar] [CrossRef]
  79. Hindle, A.D. Petroleum Migration Pathways and Charge Concentration: A Three-Dimensional Model. AAPG Bull. 1997, 81, 1451–1481. [Google Scholar]
  80. Zhao, Z.; Wang, H.; Guo, Q.; Gan, H.; Han, J.; Tian, X. Evolutionary analysis of the types of oil and gas transmission systems and their transmission performance in space and space. Pet. Exp. Geol. 2002, 24, 527–532. [Google Scholar] [CrossRef]
  81. Pang, X. Hydrocarbon Distribution Threshold and Accumulation Areas Prediction; Science Press: Beijing, China, 2015. [Google Scholar]
  82. Pang, X.; Jia, C.; Chen, J.; Li, M.; Wang, W.; Hu, Q.; Guo, Y.; Chen, Z.; Peng, J.; Liu, K.; et al. A Unified Model for the Formation and Distribution of Both Conventional and Unconventional Hydrocarbon Reservoirs. Geosci. Front. 2021, 12, 695–711. [Google Scholar] [CrossRef]
  83. Pang, X.; Shao, X.; Li, M.; Hu, T.; Chen, Z.; Zhang, K.; Jiang, F.; Chen, J.; Chen, D.; Peng, J.; et al. Correlation and Difference between Conventional and Unconventional Reservoirs and Their Unified Genetic Classification. Gondwana Res. 2021, 97, 73–100. [Google Scholar] [CrossRef]
  84. Ben, E. Law1 Basin-Centered Gas Systems. AAPG Bull. 2002, 86, 1891–1919. [Google Scholar] [CrossRef]
  85. Holditch, S.A. Tight Gas Sands. J. Pet. Technol. 2006, 58, 86–93. [Google Scholar] [CrossRef]
Figure 1. (a) Map of the Pearl River Mouth Basin in China; (b) the division of tectonic units in the Pearl River Mouth Basin and the location of the Lufeng sag; (c) the division of sub-tectonic units and well location of the WC in Lufeng sag (A-A’ shows the location of the geological section line; B-B’ shows the location of the seismic profile line); (d) formation, lithology, and tectonic of the Lufeng sag.
Minerals 13 00162 g001
Figure 2. Determination of HET model based on the variation of HGP index with depth, modified after [36].
Minerals 13 00162 g002
Figure 3. (a) Determination of HET map with depth variation of HGP index in southern Lufeng sag; (b) variation of vitrinite reflectance (Ro) with depth of the WC and the EP in the southern Lufeng sag.
Minerals 13 00162 g003
Figure 4. Characteristics of the biomarker in the typical source rocks of the WC in the southern Lufeng sag; (a) hydrocarbon source rocks of the WC6; (b) hydrocarbon source rocks of the WC5; (c) hydrocarbon source rocks of the WC4; (d) hydrocarbon source rocks of the WC3; (e) hydrocarbon source rocks of the WC2; (f) hydrocarbon source rocks of the WC1 and WC2.4.2; Crude Oil Source.
Minerals 13 00162 g004
Figure 5. Distribution characteristics of crude oil density in the southern Lufeng sag.
Minerals 13 00162 g005
Figure 6. Characteristics of the biomarker of the three types of crude oil in the southern Lufeng region: (a) type A semi-deep lacustrine to deep lacustrine facies crude oil; (b) type B shallow lacustrine to semi-deep lacustrine facies crude oil; (c) type C mixed crude oil.
Minerals 13 00162 g006
Figure 7. Comparison of parameters of biomarkers of crude oil in the southern Lufeng region: (a) relationship between C29 Ts/C29 H and C30 Dia-Hop/C30 H; (b) relationship between C29 Ts/C29 H and Ts/Tm.
Minerals 13 00162 g007
Figure 8. Comparison of parameters of biomarkers of crude oil and source rocks in the southern Lufeng sag: (a) relationship between C29 Ts/C29 Hop and Ts/Tm; (b) relationship between C30 Dia-Hop/C30H and Ts/Tm.
Minerals 13 00162 g008
Figure 9. Oil and source rock correlation results for the WC in the southern Lufeng sag.
Minerals 13 00162 g009
Figure 10. Relationship between hydrocarbon accumulation stages and oil and gas charging time.
Minerals 13 00162 g010
Figure 11. Distribution map of the oil–source fault and non-oil–source fault in seismic profile (the location of the seismic section is shown in Figure 1c B-B’).
Minerals 13 00162 g011
Figure 12. Distribution map of oil–source fault and non-oil–source fault on the plane.
Minerals 13 00162 g012
Figure 13. Plane distribution characteristics of structural ridges in Lufeng sag: (a) the upper WC; (b) the lower WC.
Minerals 13 00162 g013
Figure 14. Plane distribution characteristics of the connected sand bodies in Lufeng sag; (a) the upper WC; (b) the lower WC.
Minerals 13 00162 g014
Figure 15. Characteristics of oil and gas migration and accumulation in the southern Lufeng region (the section position is shown in Figure 1c A-A’): (a) first hydrocarbon accumulation periods; (b) second hydrocarbon accumulation period; (c) third hydrocarbon accumulation period.
Minerals 13 00162 g015
Figure 16. Schematic diagram of oil and gas accumulation model in the typical reservoir: (a) LF8-A-A reservoir; (b) LF14-D-Ad reservoir; (c) LF8-As-Ad reservoir.
Minerals 13 00162 g016
Figure 17. Distribution characteristics of different types of crude oil in profile in the southern Lufeng sag.
Minerals 13 00162 g017
Figure 18. Plane distribution characteristics of composite oil and gas migration system (including oil–source faults, connected sand bodies, and structural ridges): (a) the upper WC; (b) the lower WC.
Minerals 13 00162 g018
Figure 19. (a) Relationship between reservoir porosity and permeability in the Lufeng sag; (b) reservoir porosity varies with depth in the Lufeng sag; (c) reservoir permeability changes with depth in the Lufeng sag.
Minerals 13 00162 g019
Table 1. Identification of hydrocarbon accumulation table based on reservoir fluid inclusions and Ar isotope dating.
WellReservoirThe Time When Hydrocarbon Begins AccumulatingTime for the Hydrocarbon to End AccumulationThe Test Method
(Ma)(Ma)
LF8-A-AThe Wenchang Formation4.90Fluid inclusion homogenization temperature experiment
LF14-D-AdThe Wenchang Formation3.23.240Ar–39Ar Legal Year Analysis
LF14-D-DdThe Wenchang Formation70Fluid inclusion homogenization temperature experiment
LF14-D-BdThe Wenchang Formation0.60Fluid inclusion homogenization temperature experiment
LF14-H-BdsaThe Wenchang Formation40Fluid inclusion homogenization temperature experiment
LF14-D-AdThe Wenchang Formation13.713.740Ar–39Ar Legal Year Analysis
LF14-H-AdThe Wenchang Formation138Fluid inclusion homogenization temperature experiment
LF7-D-AdThe Wenchang Formation14.68.4Fluid inclusion homogenization temperature experiment
LF16-E-AThe Wenchang Formation18.113.6Fluid inclusion homogenization temperature experiment
Disclaimer/Publisher’s Note: The statements, opinions and data contained in all publications are solely those of the individual author(s) and contributor(s) and not of MDPI and/or the editor(s). MDPI and/or the editor(s) disclaim responsibility for any injury to people or property resulting from any ideas, methods, instructions or products referred to in the content.

