Article

Assessing the Baseline Uranium in Groundwater around a Proposed Uraninite Mine and Identification of a Nearby New Reserve

Department of Geology, Anna University, Chennai 600025, India
*
Author to whom correspondence should be addressed.
Minerals 2023, 13(2), 157; https://doi.org/10.3390/min13020157
Submission received: 11 November 2022 / Revised: 22 December 2022 / Accepted: 10 January 2023 / Published: 20 January 2023
(This article belongs to the Special Issue Radionuclides and Radiation Exposure in Mine Sites)

Abstract

:
The presence of uranium in groundwater is a cause of concern all over the world. In mineralized regions where elevated concentrations of uranium are possible in groundwater, mining activities can further degrade the water quality. Hence, it is essential to document the baseline uranium concentration in groundwater before the commencement of mining. This study was carried out with the objective of assessing the concentration of uranium in groundwater around a proposed uraninite mining site in the Gogi region, Karnataka, India. Gogi is a village in the Yadgir district of Karnataka where groundwater is the main source of water for domestic needs. The uranium mineralized zone in this region occurs along the major E-W trending Gogi-Kurlagere fault at a depth of about 150 m. Groundwater samples were collected every three months from January 2020 to October 2020 from 52 wells located in this area. The concentration of uranium in groundwater ranged from 1.5 ppb to 267 ppb. The USEPA and WHO have recommended a permissible limit of 30 ppb, while the Atomic Energy Regulatory Board of India has a limit of 60 ppb for the purpose of drinking water. Based on these permissible limits for uranium in drinking water, concentrations exceeded the limit in about 25% of wells within 20 km from the mineralized region. Wells present in the granitic and limestone terrain exhibited higher concentrations of uranium in this area. Uranium concentration in groundwater changes depending on the degree of weathering, lithology, and rainfall recharge. This study will serve as a baseline and will help to assess the impact of mining activities in this region in the future. In wells where the uranium concentration exceeds permissible limits, it is suggested not to use groundwater directly for drinking purposes. These sites need to be explored further for the possible presence of uranium-bearing minerals.

1. Introduction

Uranium is a radioactive element that is often present in groundwater, and the consumption of uranium-rich water can cause a serious threat to human health. The USEPA and WHO have recommended a permissible limit of 30 ppb for drinking water. However, in India, Bureau of Indian Standards (BIS) has not suggested any permissible limit, while the Atomic Energy Regulatory Board of India (AERB) has suggested a maximum limit of 60 ppb for the purpose of drinking water. In general, uranium occurs with an average concentration of 2.8 parts per million in the earth’s crust [1]. Uranium can occur in groundwater due to uranium mining, processing and production, disposal of milling wastes; due to the application of various pesticides and fertilizers, and also geochemical processes [2,3]. Mostly, the chemical composition of groundwater is influenced by the parent rock chemistry, weathering rate, residence time, precipitation, and temperature [4,5,6,7]. In addition to the influence of Uranium hosting minerals, thermodynamic controls, the oxidation state of uranium, and the kinetics of mineral dissolutions are also responsible for the presence of uranium in groundwater [8,9] Some of the major side effects of consuming water that has a high concentration of uranium by human beings are genotoxicity, kidney disorders, gastrointestinal issues, and colorectal and breast cancer [10]. In countries such as India, where most of the population depends on groundwater for basic domestic needs, it is essential to periodically monitor the background uranium concentration to ensure that drinking water is not contaminated.
India has about 1.5% of the world’s total uranium reserves and occupies the 13th position globally [11]. Uranium deposits in India belong to the Proterozoic age. Uranium exploration in the Proterozoic basins in India and its present status and future strategy was studied by ref. [12], where it was found that the Proterozoic rocks are the most favorable targets for uranium exploration. The Atomic Minerals Directorate of India (AMD) has identified several uranium deposits of low to medium-grade ore in several parts of the country, including the Singhbum shear zone in Jharkhand, Cuddapah basin in Andhra Pradesh and Telangana, Aravalli and Delhi super groups in Rajasthan, Dongargarh shear zone and North Surguja shear zone in Chattisgarh, Mahadek basin in Meghalaya and Bhima basin in Karnataka [13]. Bhima basin is one among the seven Purana basins of the Palaeoproterozoic–Neoproterozoic age in the Indian peninsula [14], which is characterized by seven major faults [15] in which the medium grade of uranium deposits occurs around one of them [16]. The uranium deposit in Gogi is structurally controlled and is of hydrothermal vein type [17]. The mineralized region extends over a strike length of 600 m and a depth of 150 m. The presence of sandstone, limestone, purple shale and shale, granites, basalts, schist and gneissic rocks characterizes this region, also medium-grade uranium ore deposits has been reported in this region [18]. Radioactivity in this region is mainly because of adsorbed uranium on limonite, absorbed uranium in collophane, labile uranium along grain boundaries, and also due to the presence of ultrafine pitchblende [16]. Uranium mineralization is hosted by non-phosphatic brecciated limestone which is near the granitic contact. About 0.017%–0.084% and 0.02%–0.27% of U3O8 are present in phosphatic and non-phosphatic limestones, respectively, whereas samples from granitic terrain contained up to 20% of U3O8 [18]. The radiation levels and radionuclide distributions in soils of the Gogi region have already been analyzed by researchers [19,20]. The geochemistry of the rocks of this region was studied and a high concentration of uranium in shale present in this region has been reported [21]. The mineralogical characterization of the uranium deposit was studied [22], and the geochemical behavior in uranium mineralized and non-mineralized zones of the Gogi region have also been reported [23]. Refs. [24,25] studied groundwater quality and the distribution coefficient of uranium in the soils of the Gogi region.
Recent studies reported that about 1 in 10,000 people are prone to radiological risks in the granitic terrains of the Bhima basin [26]. Due to the increasing demand for uranium, it is proposed to mine uranium in near future from the Gogi region in Shahpur taluk, Karnataka. Therefore, it is vital to have baseline information on the prevailing periodic uranium concentration in groundwater. The objective of this study was to understand the spatial and temporal variation of uranium concentrations in groundwater as well as assess its sources in the Gogi region. This study will serve as a baseline and will help to assess the impact of mining activities and other anthropogenic contributions of uranium in the future.

2. Study Area

The study area spans over 1680 km2 and is located in the Yadgir district of Karnataka. The Krishna and Bhima rivers flow on the southeastern and northeastern boundaries (Figure 1). The topographical elevation of this area ranges from 340 m to 580 m above mean sea level (MSL), and the ground surface slopes towards the southeast direction.
Dendritic to a sub-dendritic type of drainage patterns are observed in the study area due to the gentle slope of this region (Figure 1). Most of the study region experiences a semi-arid type of climate. Southwest monsoon is the prominent rainy season (Middle of June to end of September), and the annual average rainfall is 633 mm.

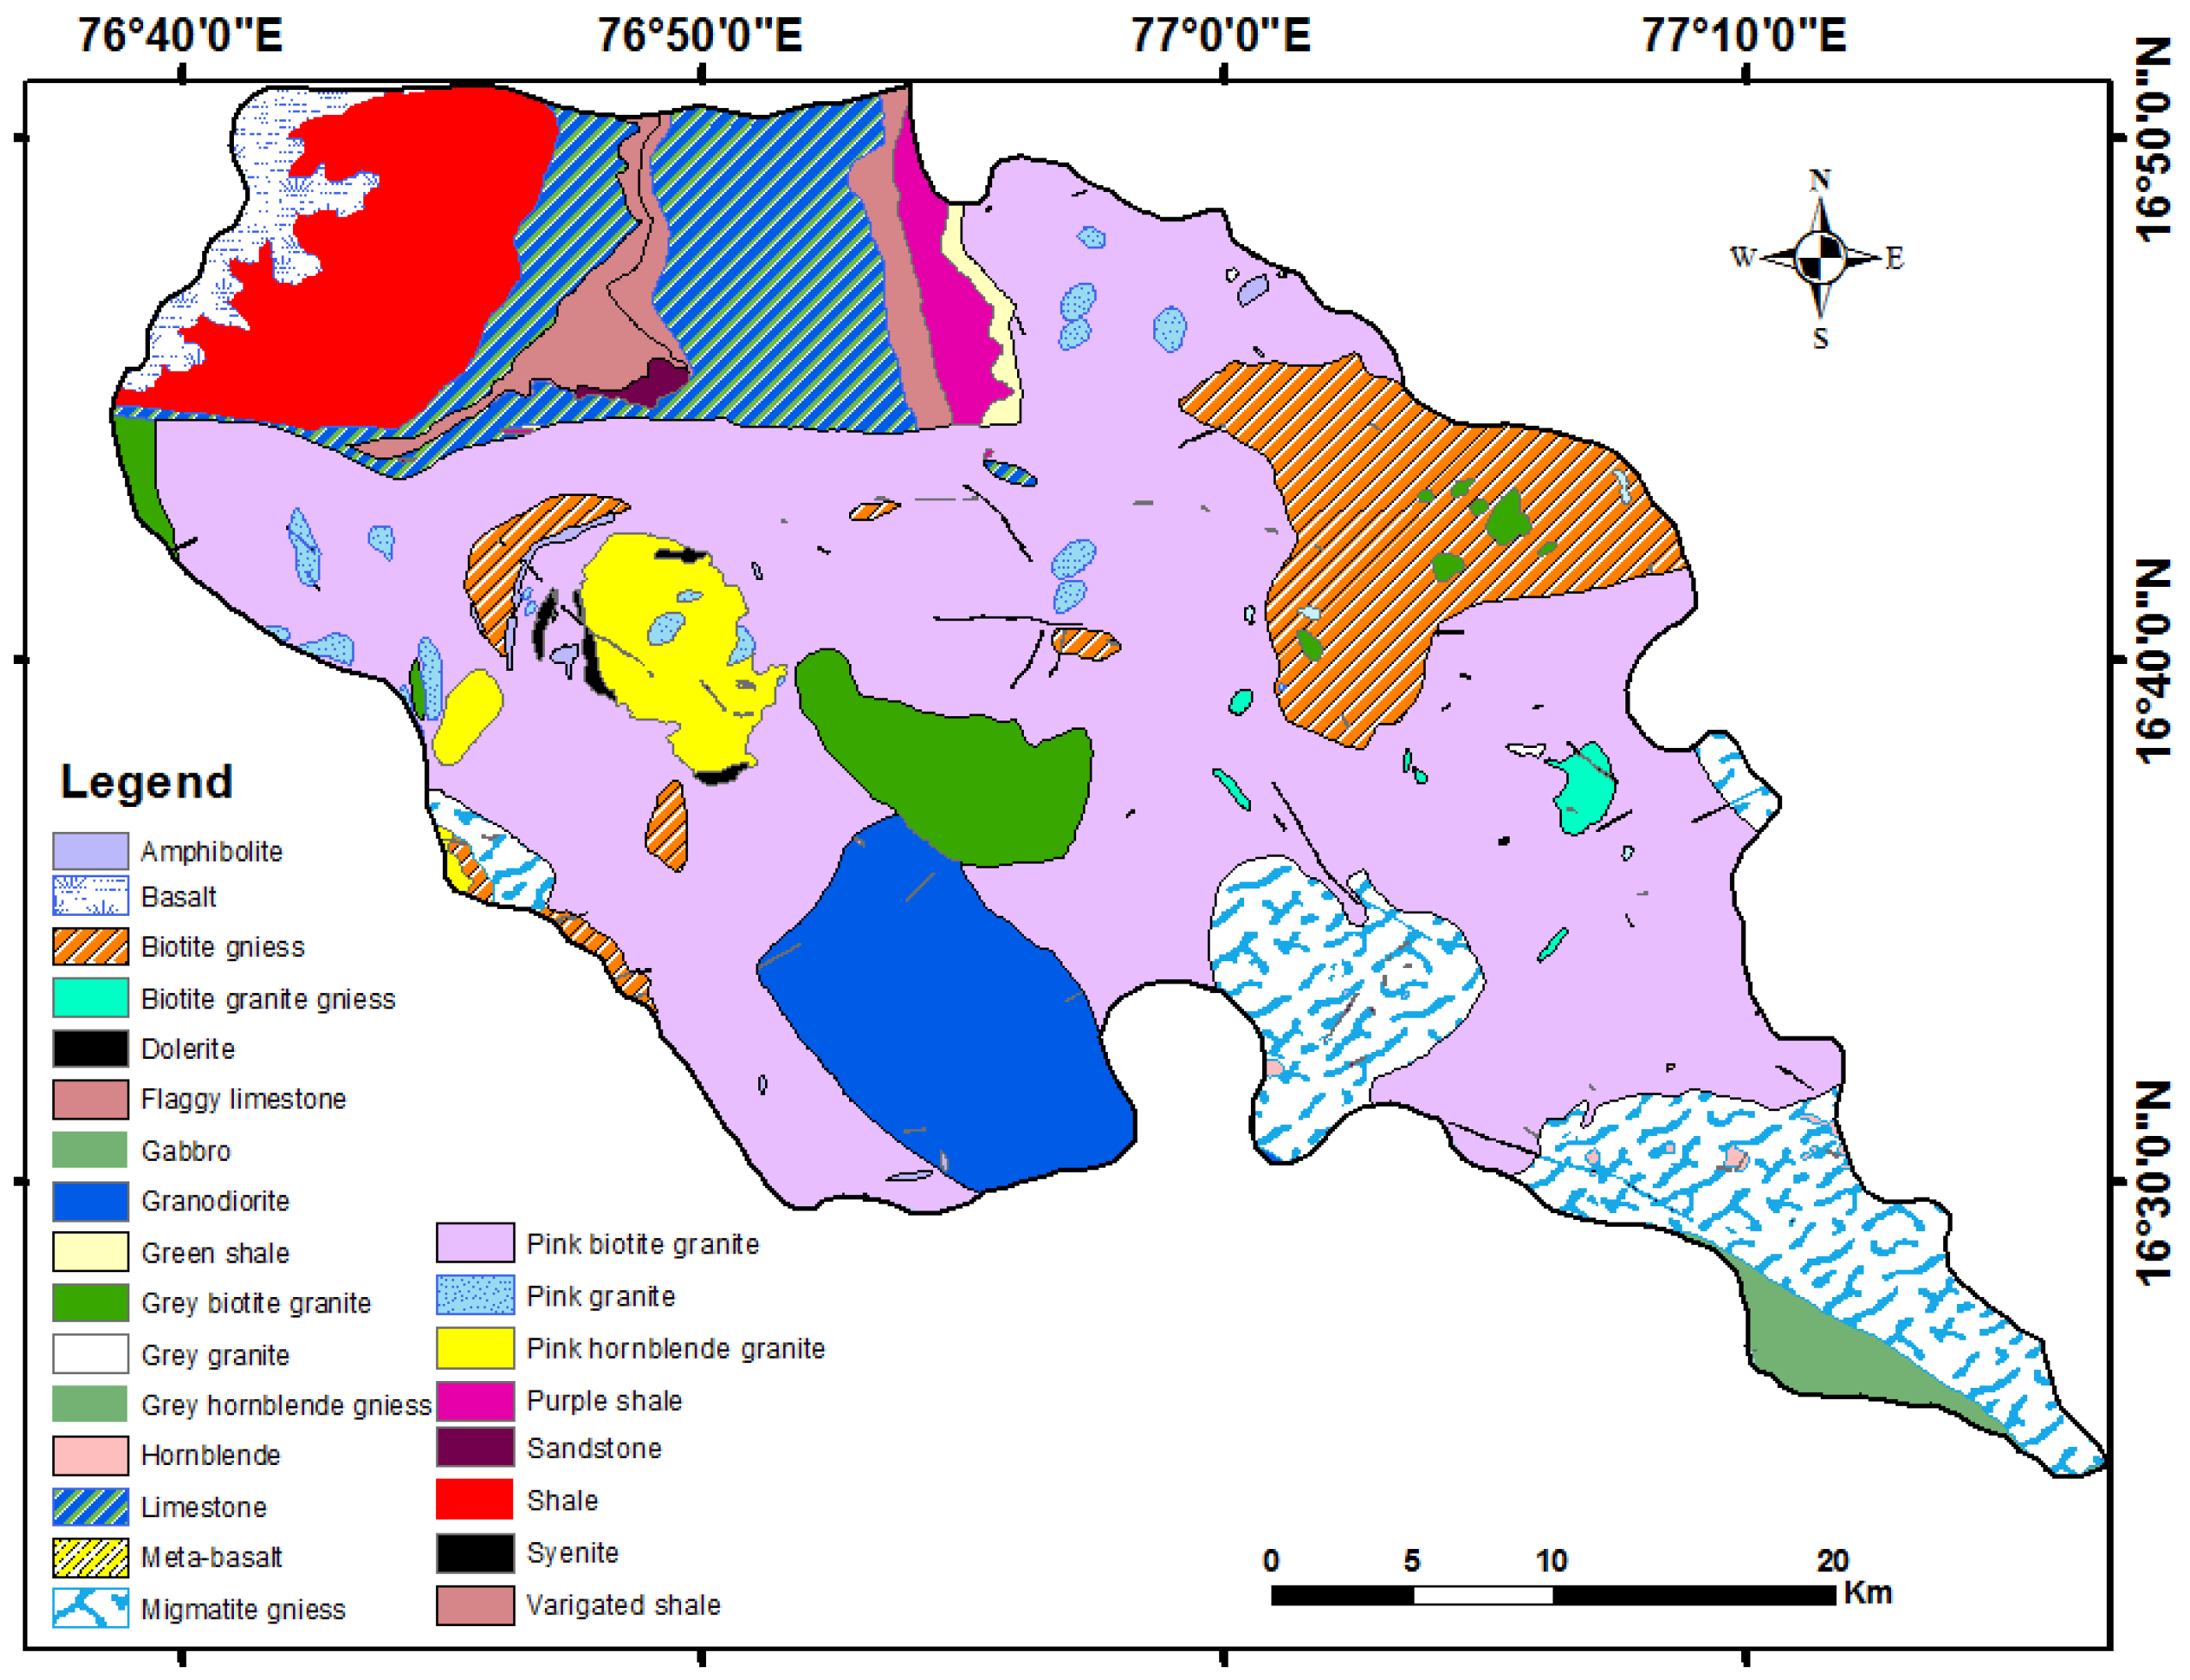
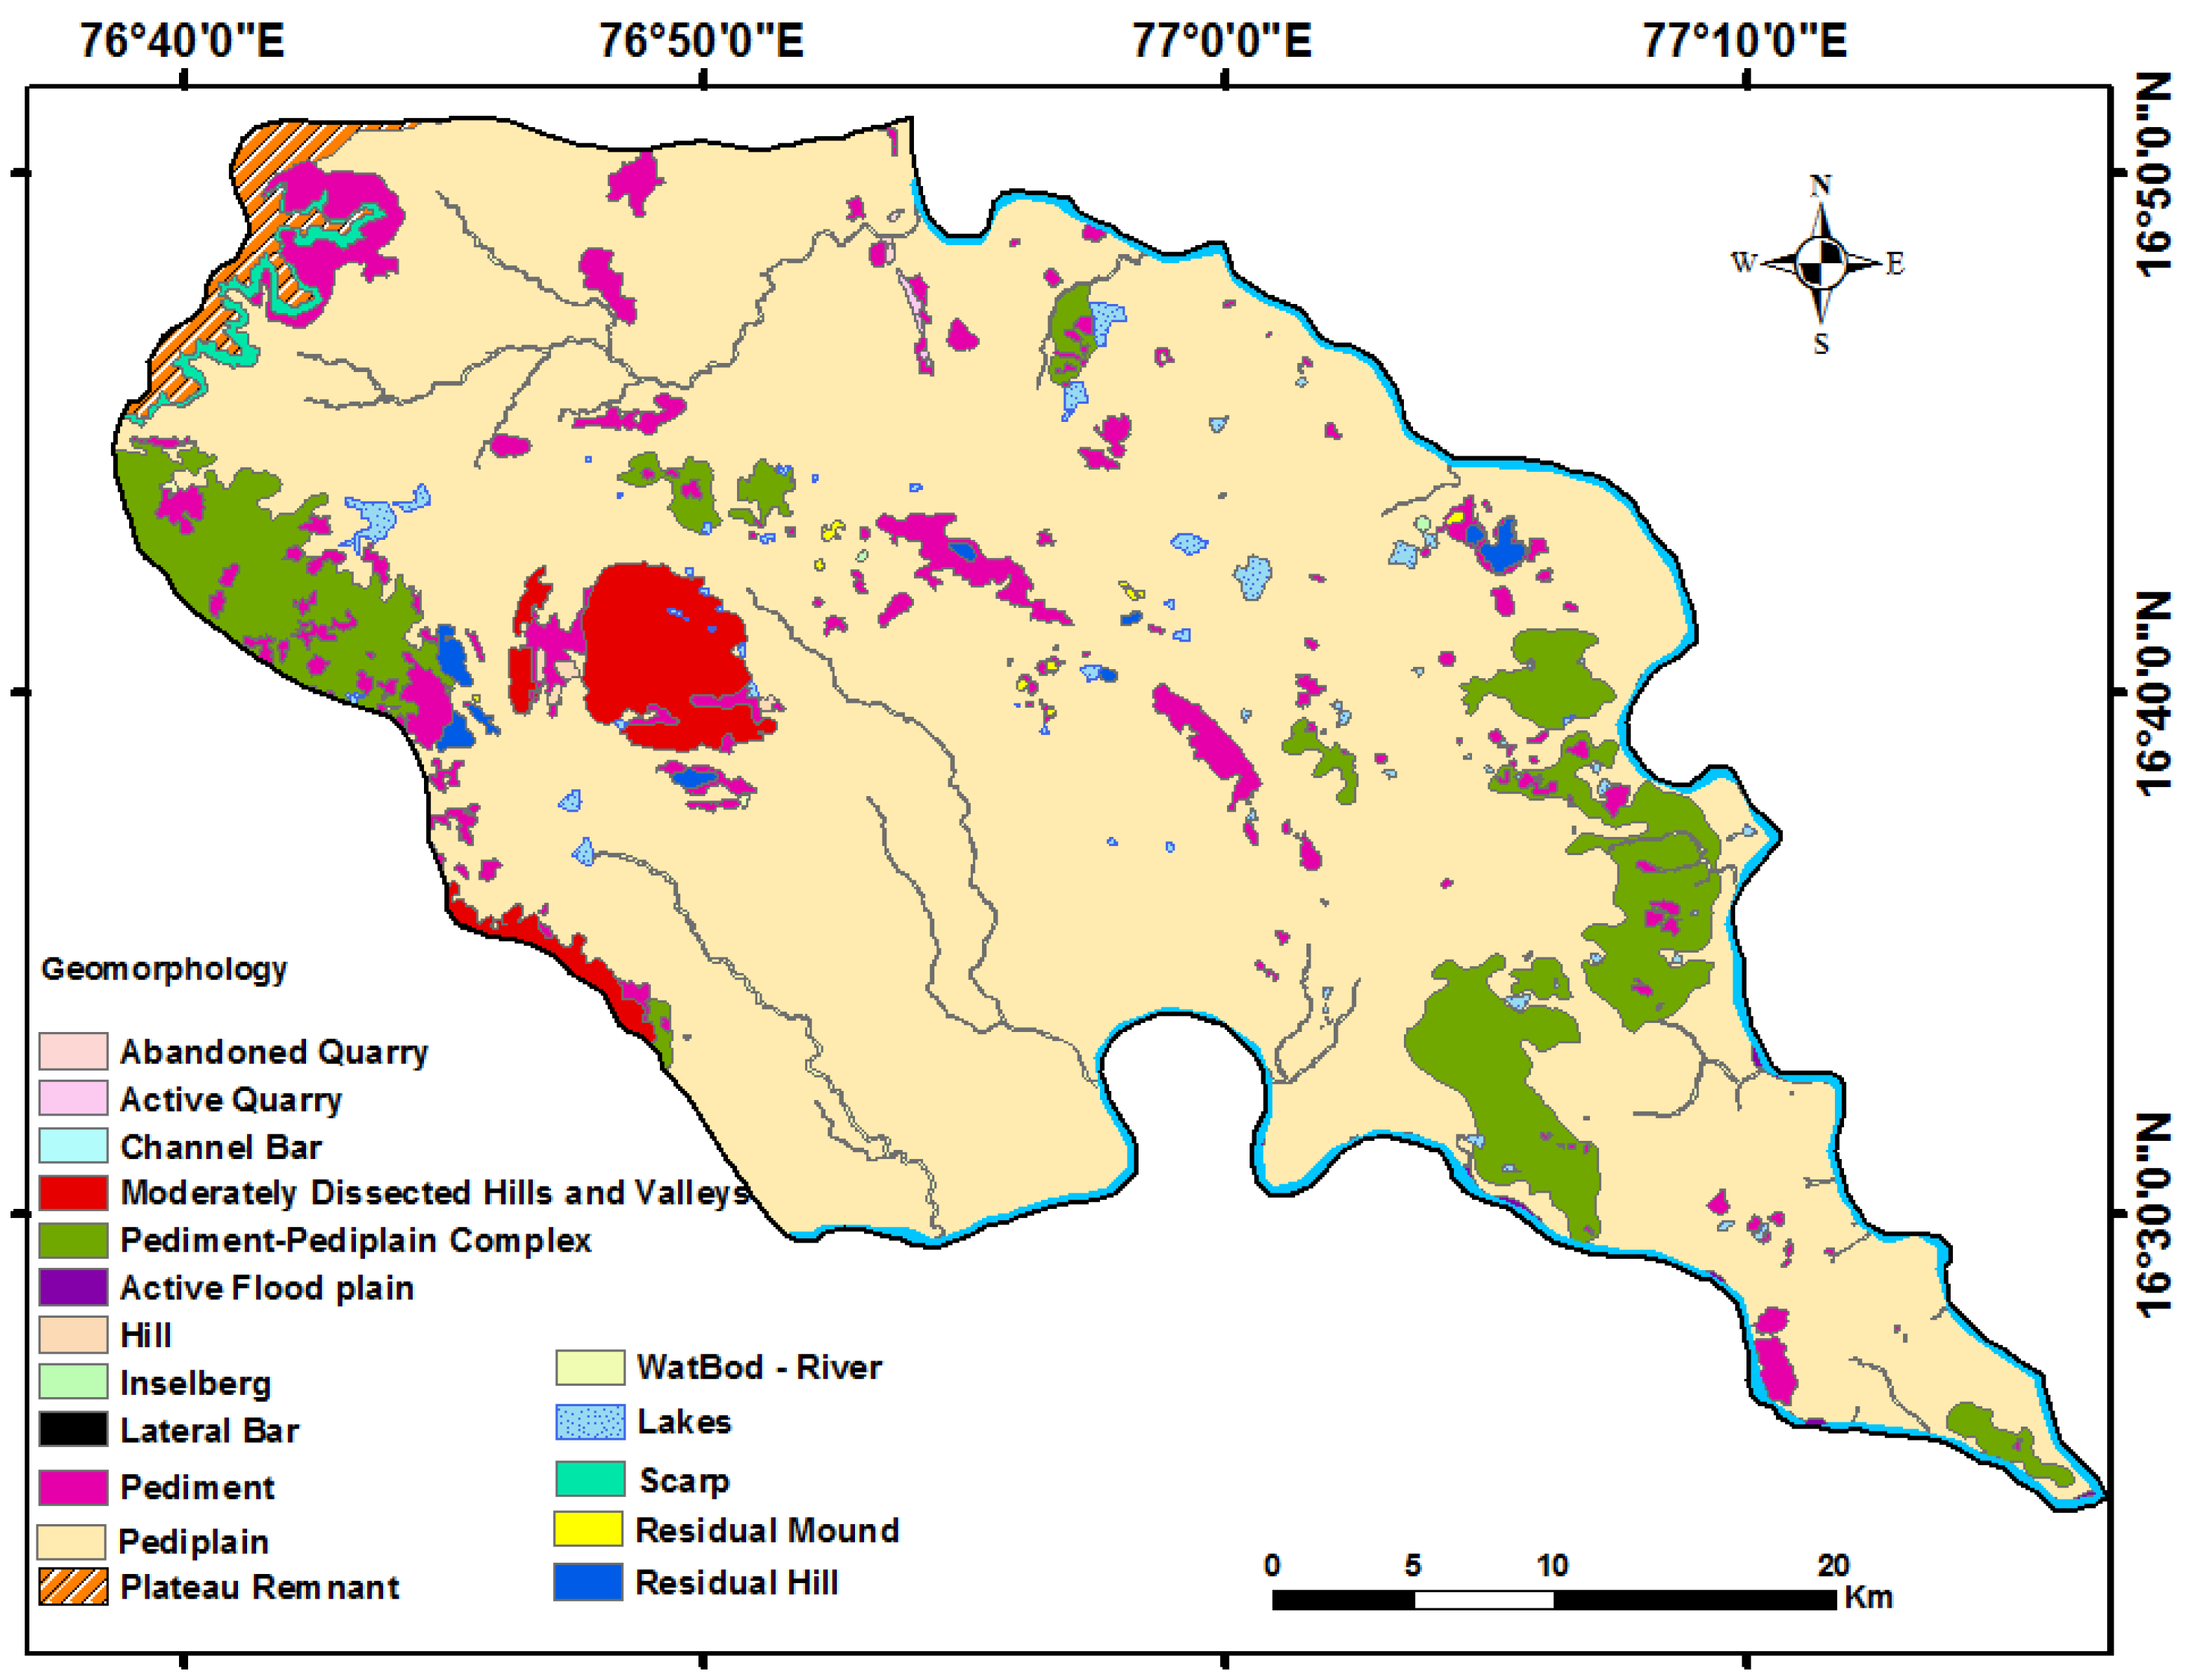
3. Geology and Geomorphology

Geologically, the study area is composed of granite and peninsular gneiss as basement rocks which are exposed at the region’s central and southeast parts and overlaid by the sedimentary rocks at the northwest part (Figure 2).The Gogi-Kurlagere reverse fault is a major structural feature trending east-west direction and separates the granite and sedimentary formation in this region (Figure 3) [18].Along the Gogi-Kurlagere fault, the basement granite is medium to coarse-grained, porphyritic to non-porphyritic, grey to pink colored potassic granite (Figure 2).
The geomorphological features of this area were derived using an IRS 1D-LISS III image. Valley fill, residual hill, pediplain, and pediments are the geomorphological features identified in this region (Figure 4). Plateau and Deccan trap terrain that is deeply indented by ravines are seen in the northern part of the study area. The southern part represents undulating terrain with sparsely distributed knolls and tors. Uranium-bearing uraninite is hosted in the sheared phosphatic limestone, non-phosphatic limestone, and basement granite in this region.
The lithostratigraphic sequence of the study area is given in Table 1. The northwestern part of the area is capped with basaltic rock, which is the extension of the Deccan trap of the Upper Cretaceous-Eocene age [27]. The deposition of limestone in the Shahabad formation and shale is in the downthrown region of the Gogi-Kurlagere fault. These sedimentary rocks are horizontally bedded, except in the neighborhood of the fault, where they are steeply dipping and extremely brecciated with isoclinal and recumbent folds [15,18].

4. Hydrogeology

The major water-bearing formations in the area are granite, vesicular basalt, gneiss, and limestone. The aquifer zones in the Gogi region are under the phreatic conditions in the weathered formation and semi-confined to the confined conditions in fractured and jointed formations. Precipitation, irrigation return flow, and recharge from river beds and other surface water bodies are the major sources of aquifer recharge. Most of the wells have groundwater tables ranging from 5 to 11 m below ground level. Ref. [25] reported that the groundwater table varies between 3 and 8 m in sedimentary terrain, 5 and 15 m in granitic terrain, and 1 and 8 m in gneissic terrain of this region.

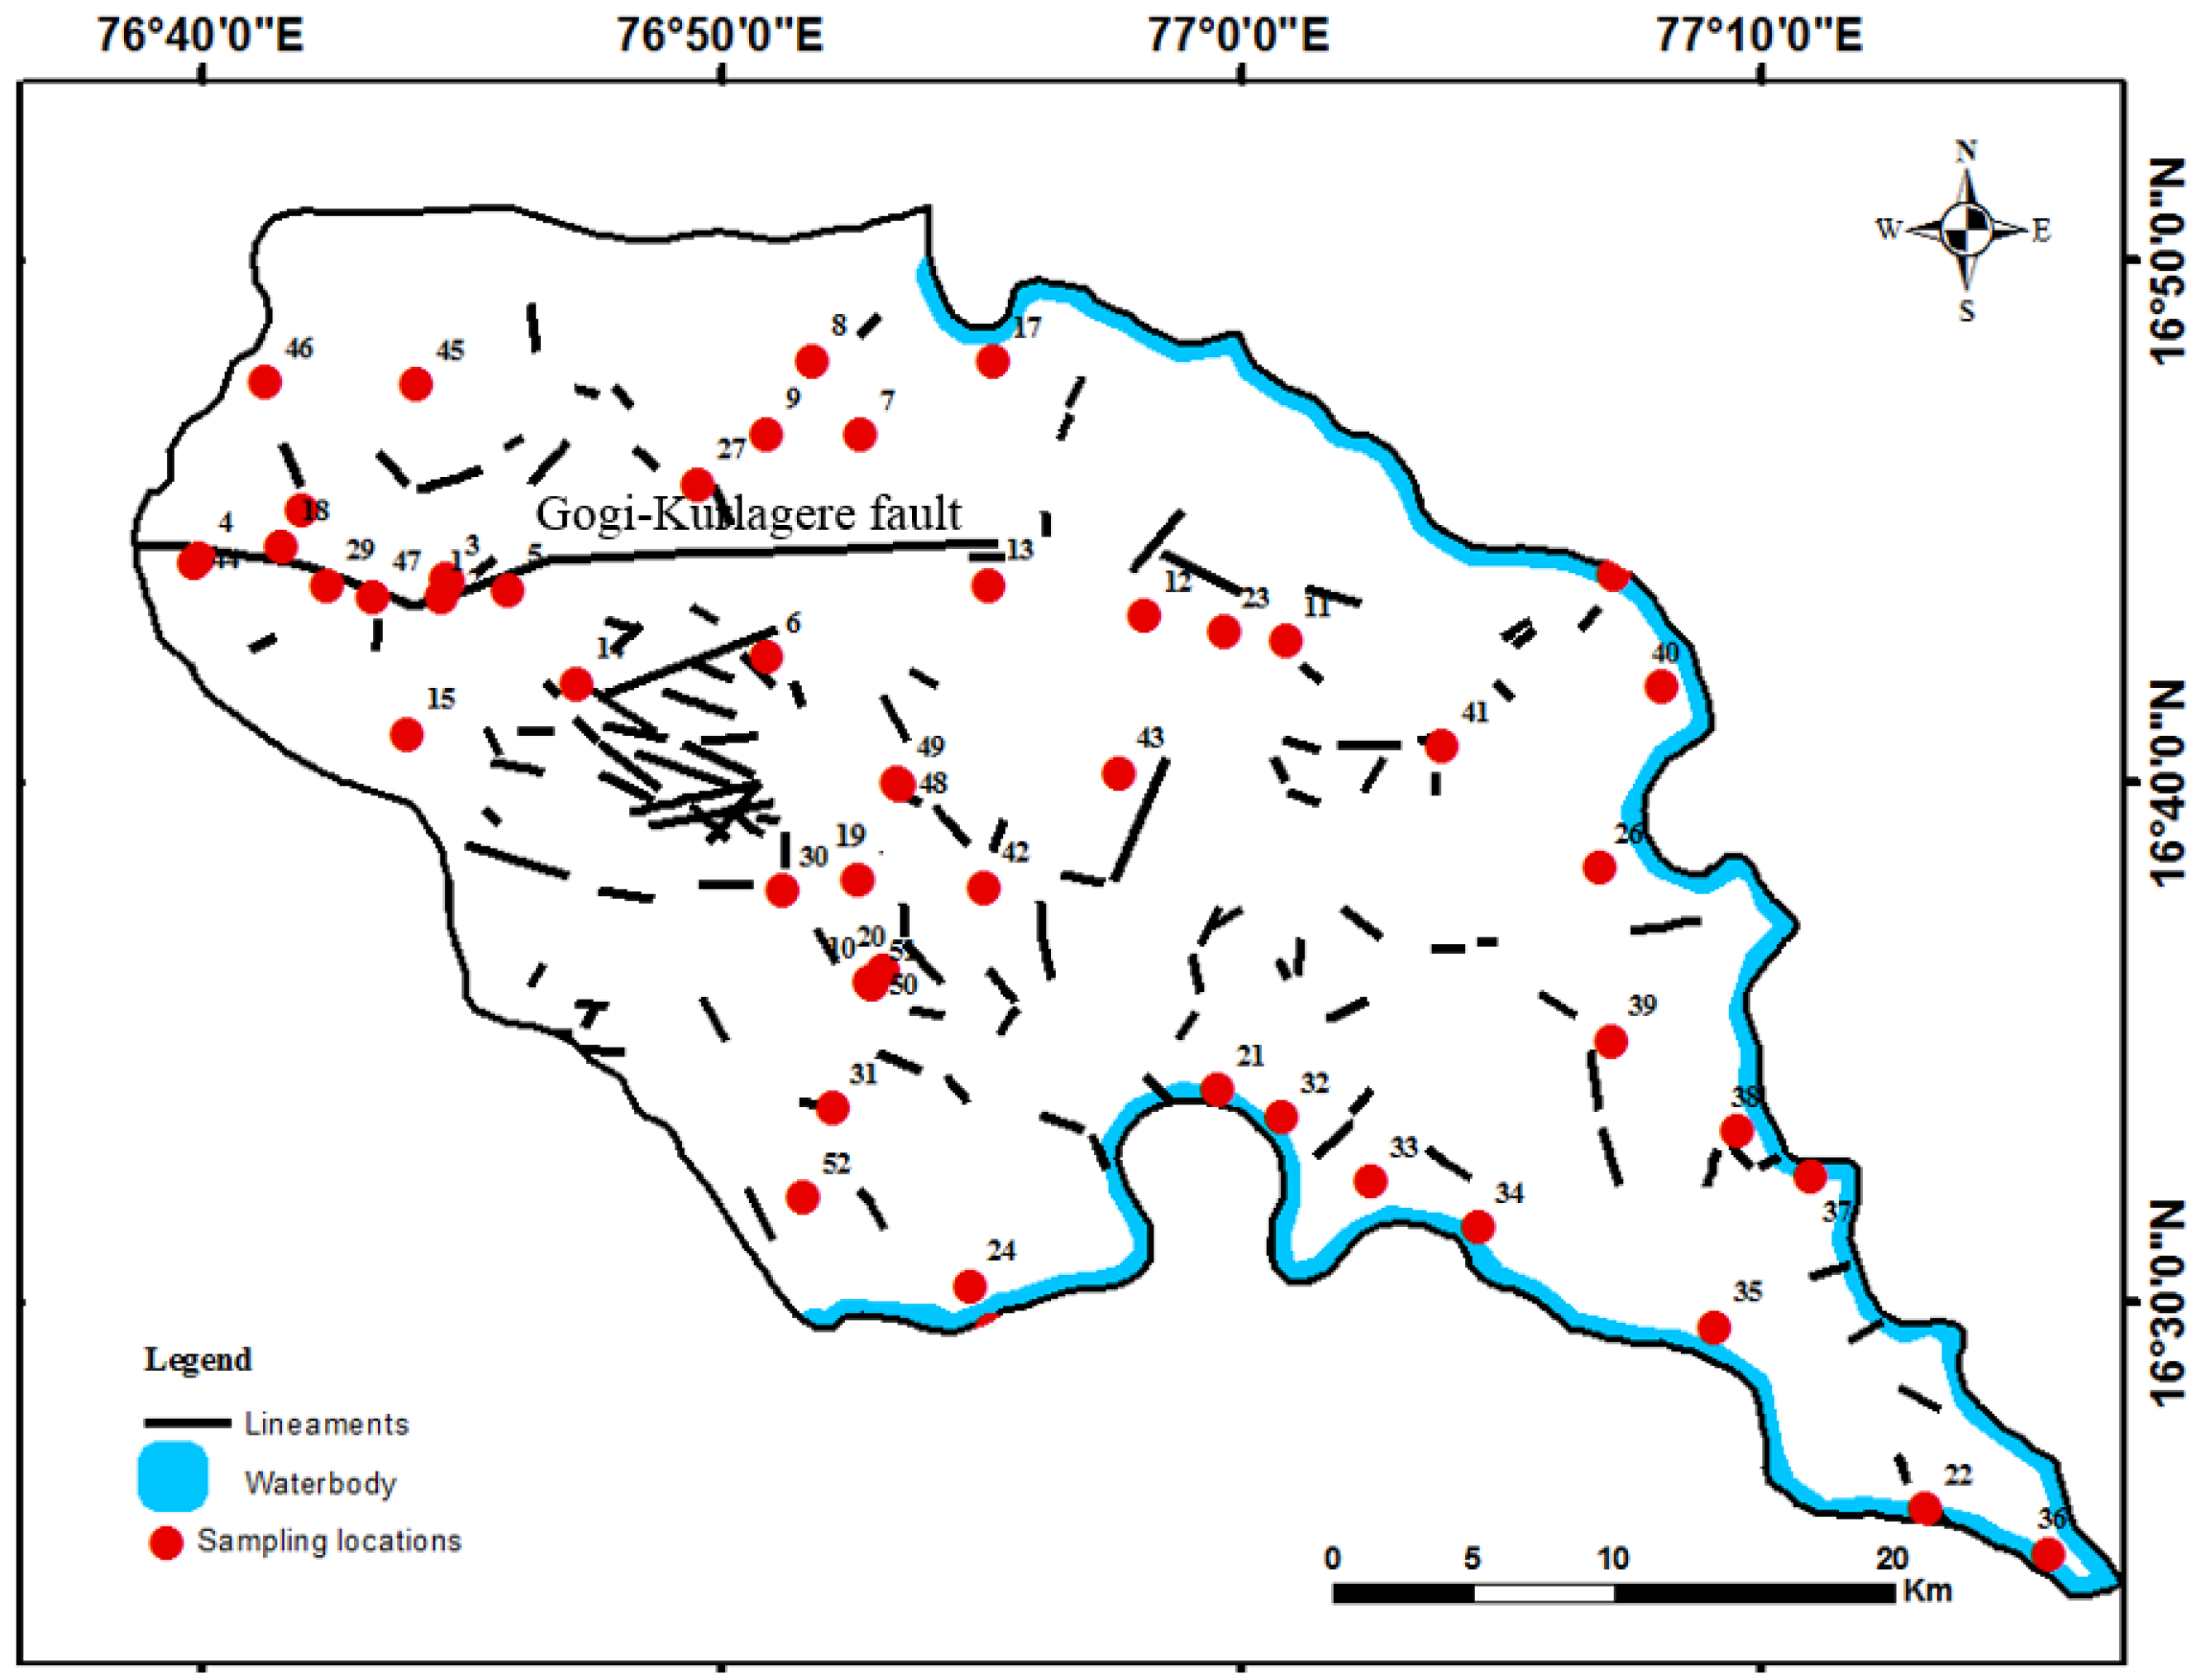
5. Sampling and Analysis

An extensive field survey was carried out, and 52 bore wells were considered for groundwater sampling (Figure 3). Groundwater samples were collected from these wells once every two months from January 2020 to October 2020. The pH and electrical conductivity (EC) were analyzed in the field using a portable multi-parameter probe (EUREKA Sub manta2, Eureka Environmental Engineering, TX, USA), and ORP (oxidation-reduction potential) was measured using a YSI PRODSS 62,690 probe (Xylem Inc., OH, USA). For calibration of pH and ORP sensors, buffer solutions of known pH and ORP were used and cross-checked for accuracy between water sample collections. In open wells, a bailer was used to collect groundwater samples at a depth of 2 m below the groundwater level. Whereas in borewells, the wells were purged for at least 15 min, and then the groundwater samples were collected in polyethylene bottles. Polyethylene sampling bottles of 500 mL capacity were cleaned by soaking them in diluted HNO3 for 24 h. Further, these bottles were rinsed in the filtrates of the sample at least twice before each sampling. The collected samples were filtered through 0.45 μm filter paper and acidified with two drops of HNO3 to prevent wall adsorption and slow down biological changes, and then transferred to the laboratory for further analysis. The groundwater level in the wells was recorded using a Solinst 101 water level indicator, and uranium concentrations were measured in the laboratory using Quantalase’s LF-2a LED fluorimeter with a detection limit of 0.1 ppb. The instrument was calibrated in the range of 1–100 ppb using a stock solution prepared by dissolving 1.78 g of uranyl acetate dihydrate in 1 L of Millipore elix-3 water containing 1 mL of HNO3 (70% pure). 5% phosphoric acid in ultrapure water was used as a fluorescence reagent. Blanks and standards were run alternatively during the measurement to ensure the accuracy of the results. Some samples were diluted prior to analysis in order to get the instrument response within the linear dynamic range. All the analytical reagents used were from Merck. A fresh representation of all rock types of this region was collected. Thin sections were prepared for mineralogical studies. These sections were studied under a petrological microscope, LEICA DMLP (Leica Microsystems, Wetzlar, Germany), and the surface of the rock samples was studied under a scanning electron microscope, SEM- COXM EM-30 (COXEM Co., Ltd, Daejeon, Korea). The rock samples were cooked in Canada balsam to strengthen them before making thin sections. For SEM analysis of surface texture, the samples were mounted on brass stubs (1 cm in diameter) using a double-sided adhesive carbon tape and coated with platinum for about 90 to 120 s using an ion sputtering device to render the surface conductive for scanning. To study the characteristics of powdered rock samples, X-ray diffraction (XRD) was performed at room temperature using Siemens D 500 X-ray diffractometer (Siemens AG, Munich, Germany) with copper anticathode radiation (λCuKα = 1.541838 Å) at 2θ from 10 to 90°.

6. Results and Discussions

It is important to study groundwater quality in areas that are mineralized since there is a high chance that the groundwater there could be contaminated by the leaching of those minerals. In India, a high concentration of uranium in groundwater has been reported in over 16 states. Some of the states in India that are affected by excess uranium concentration are Punjab, Haryana, Telangana, Karnataka, Delhi and Andhra Pradesh tops the list of the most affected states [28]. This is one of the main motivations for choosing this uranium-mineralized area located in Karnataka. A total of 208 groundwater samples were collected and analyzed during this study. The uranium concentrations in this region were interpreted and studied in relation to the geology, pH, EC, ORP, and water level. About 70% of samples were less than 30 ppb which is suitable for drinking. Around 20% of groundwater samples fall within 30 ppb to 60 ppb, which are considered suitable for drinking according to AERB drinking water standards (Figure 5). The remaining 10% of the samples are a matter of concern since they range up to 267 ppb, which is about 10 times more than the permissible limit of uranium in drinking water in India.

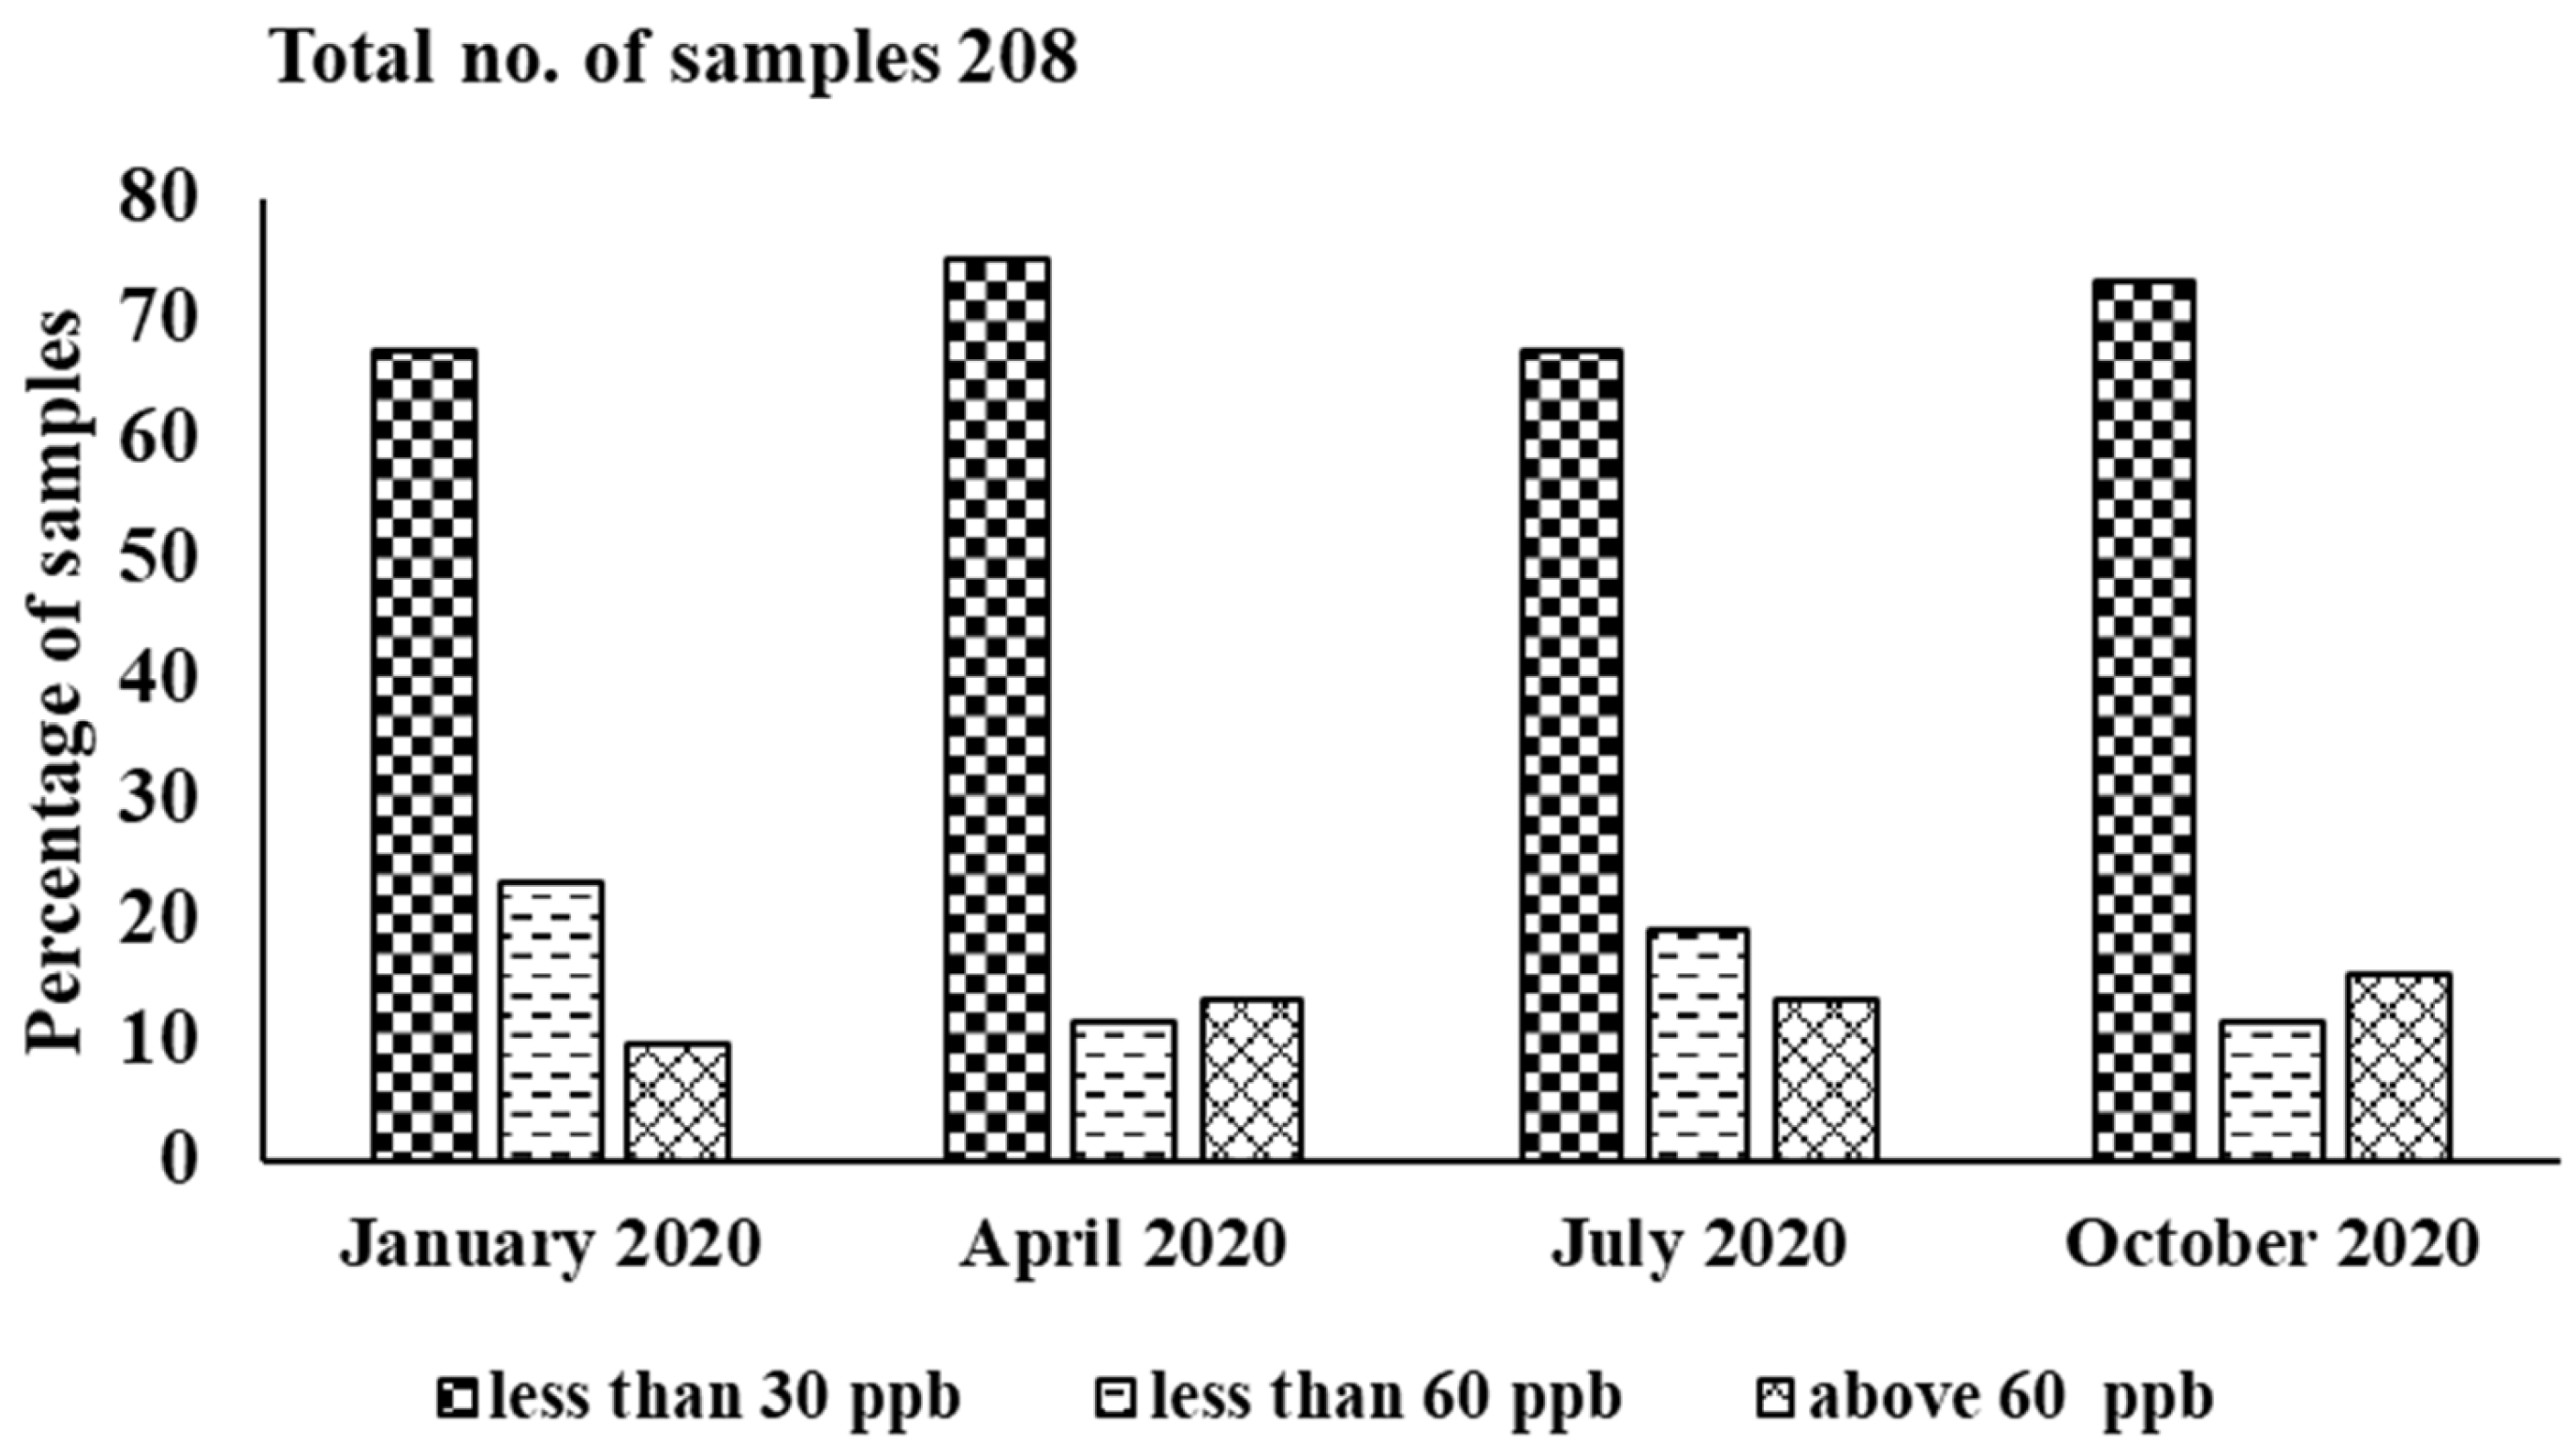
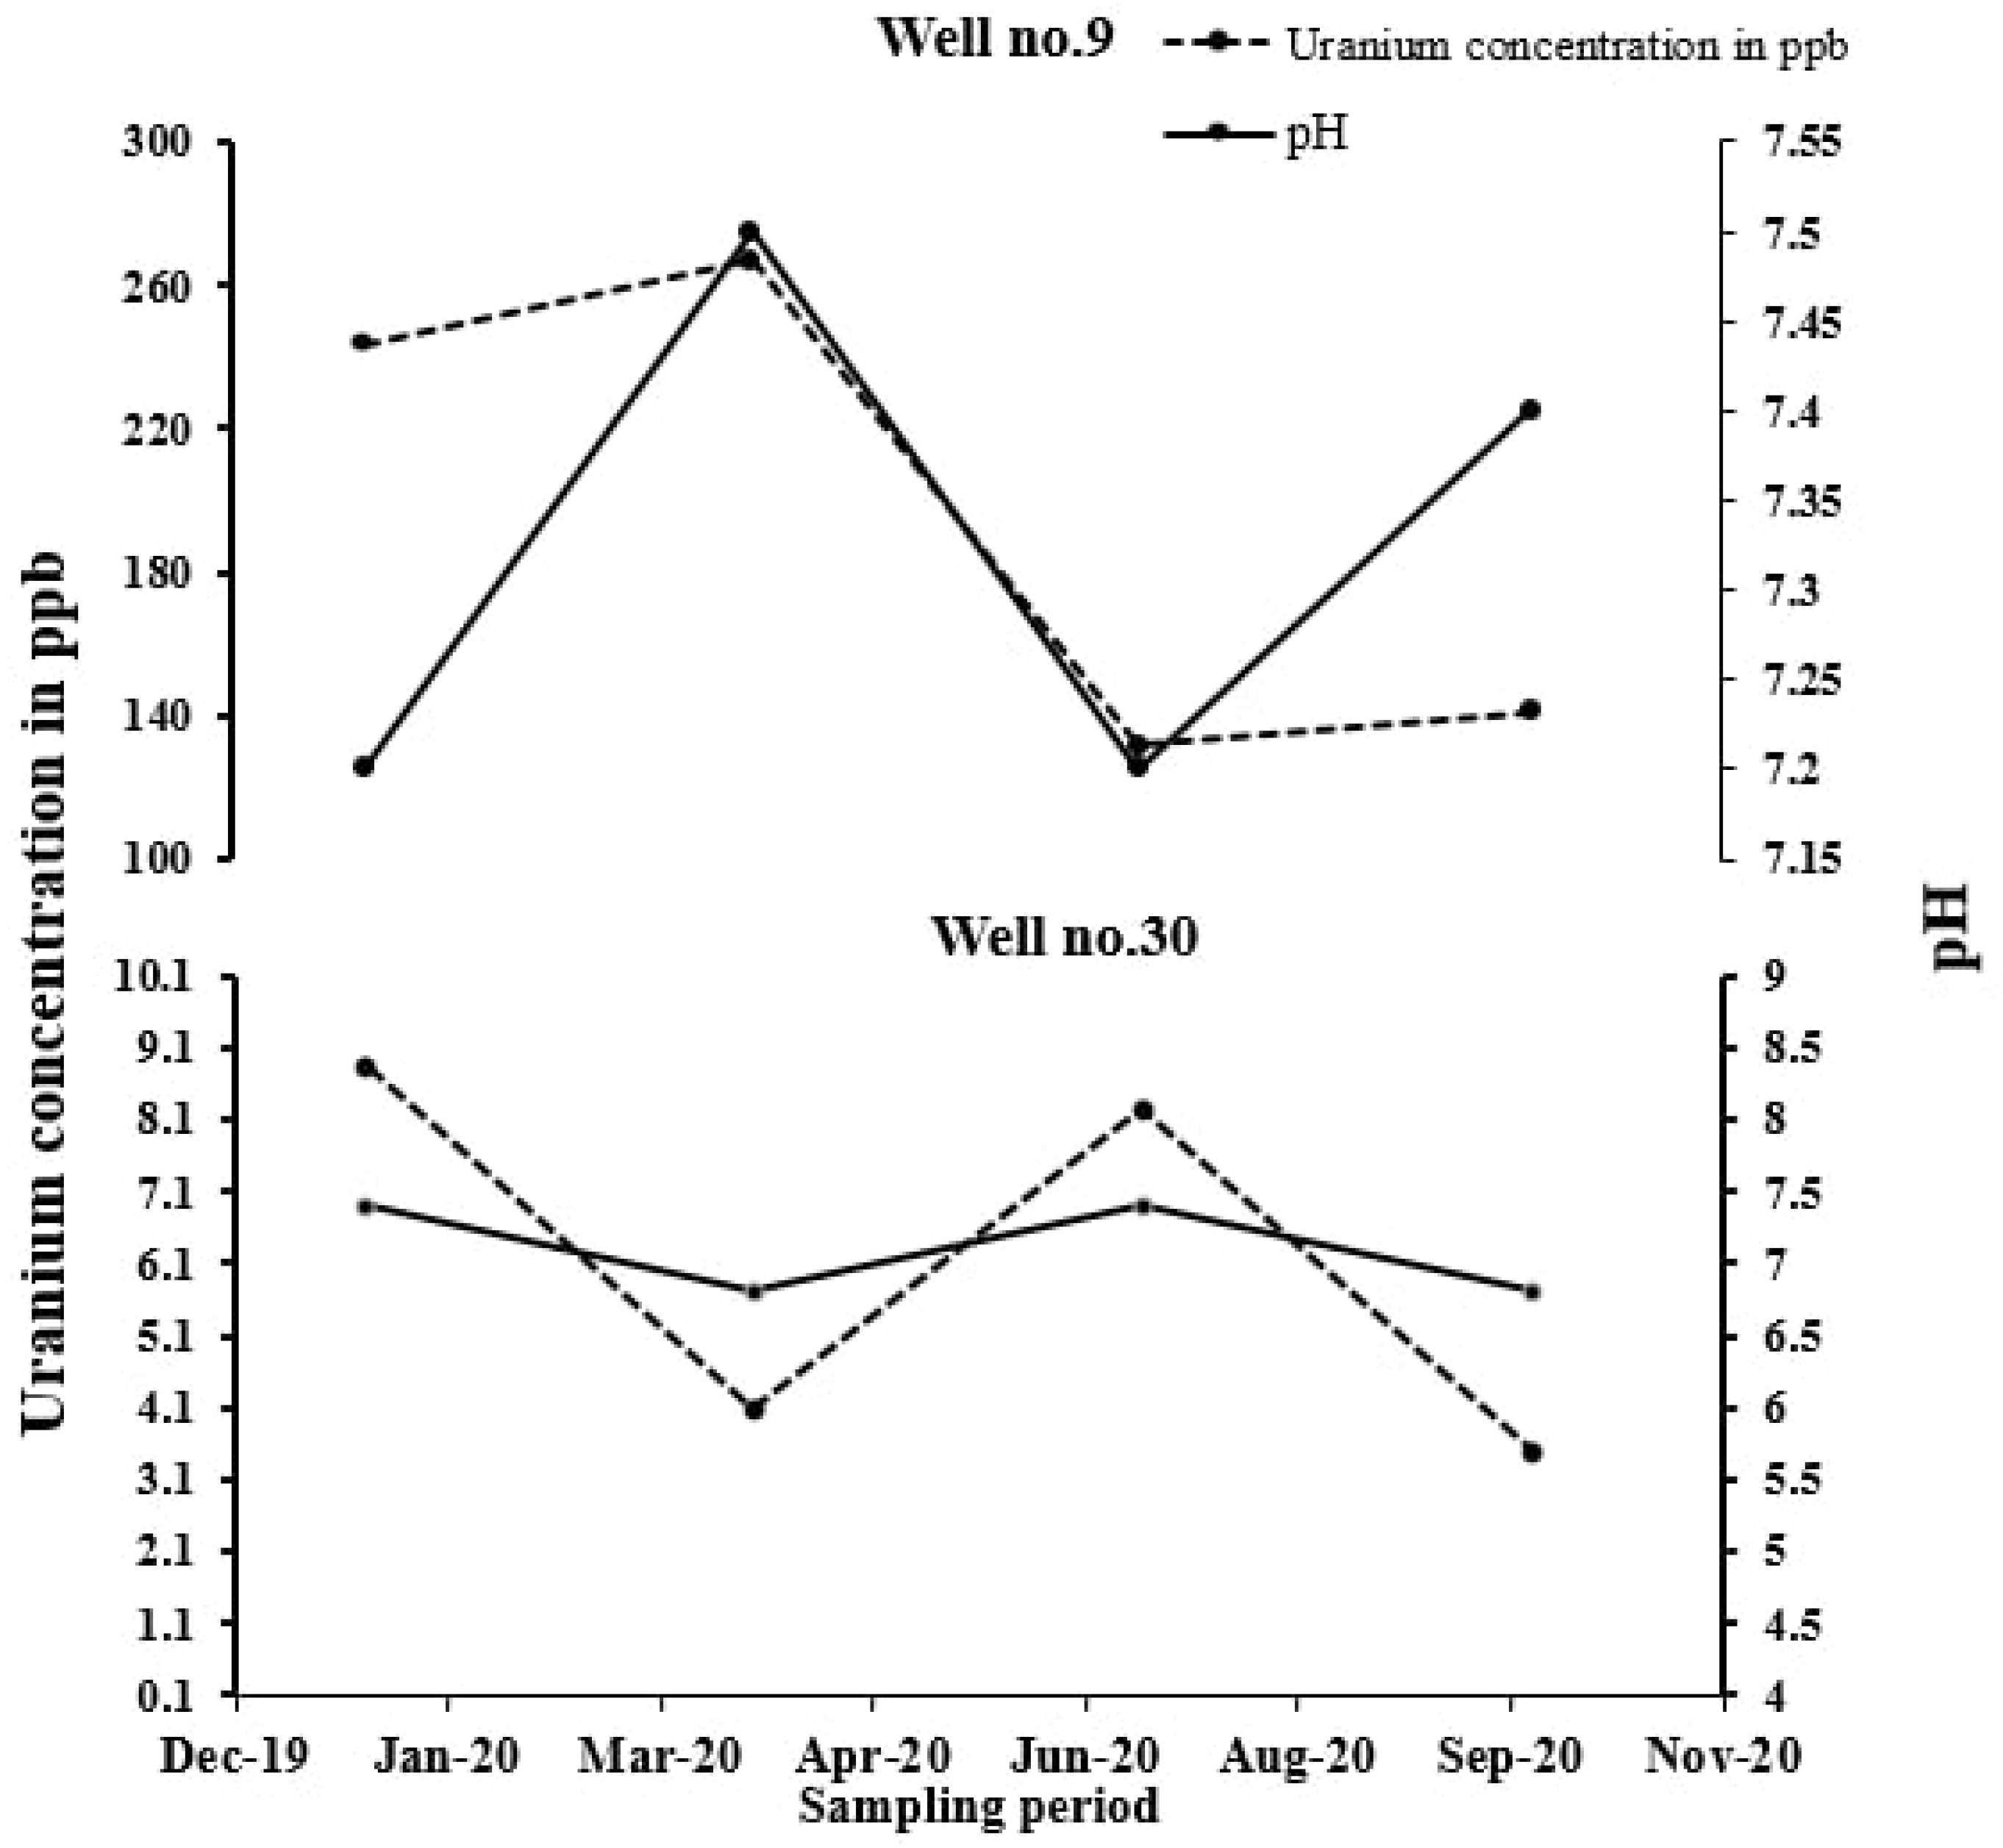
6.1. Variation in Uranium Concentration

Uranium present in groundwater is a mixture of three isotopes, U234, U235, and U238, and all three isotopes have the same chemical properties. Hence, any combination of these would have the same impact on human health if present in drinking water. Uranium occurs in two dominant forms: U(IV) and U(VI). The hexavalent form U(VI) occurs in groundwater mostly under oxidation conditions, and U(IV) is abundant in anoxic conditions. Uranium is usually complexed in solution, especially with carbonate ions and with hydroxide, chloride, and sulfate, depending on their respective dissolved concentration [29]. The ranges of concentration of uranium in groundwater with respect to permissible limits from January 2020 to October 2020 are shown in Figure 5. The concentrations of uranium ranged from 1.29 ppb to 267 ppb, with an average of 29.39 ppb.
The concentration of uranium in groundwater of granitic terrain is higher as compared to sedimentary and gneissic terrains. Most of the wells with high uranium concentration lie in the pink biotite granitic terrain and limestone region. In this study region, the reason for the high concentration of uranium groundwater, especially in locations away from the mineralized zone, must be identified. One of the sources of uranium can be the use of excessive fertilizers. Hence, to identify this, the land use around the location of wells with high uranium concentrations was studied. Hence, the leaching from agrochemicals is likely to be the major source. Thus, it is important to further explore the geology, land use, irrigation, and composition of rock in this region to understand the reason for the presence of uranium in groundwater.

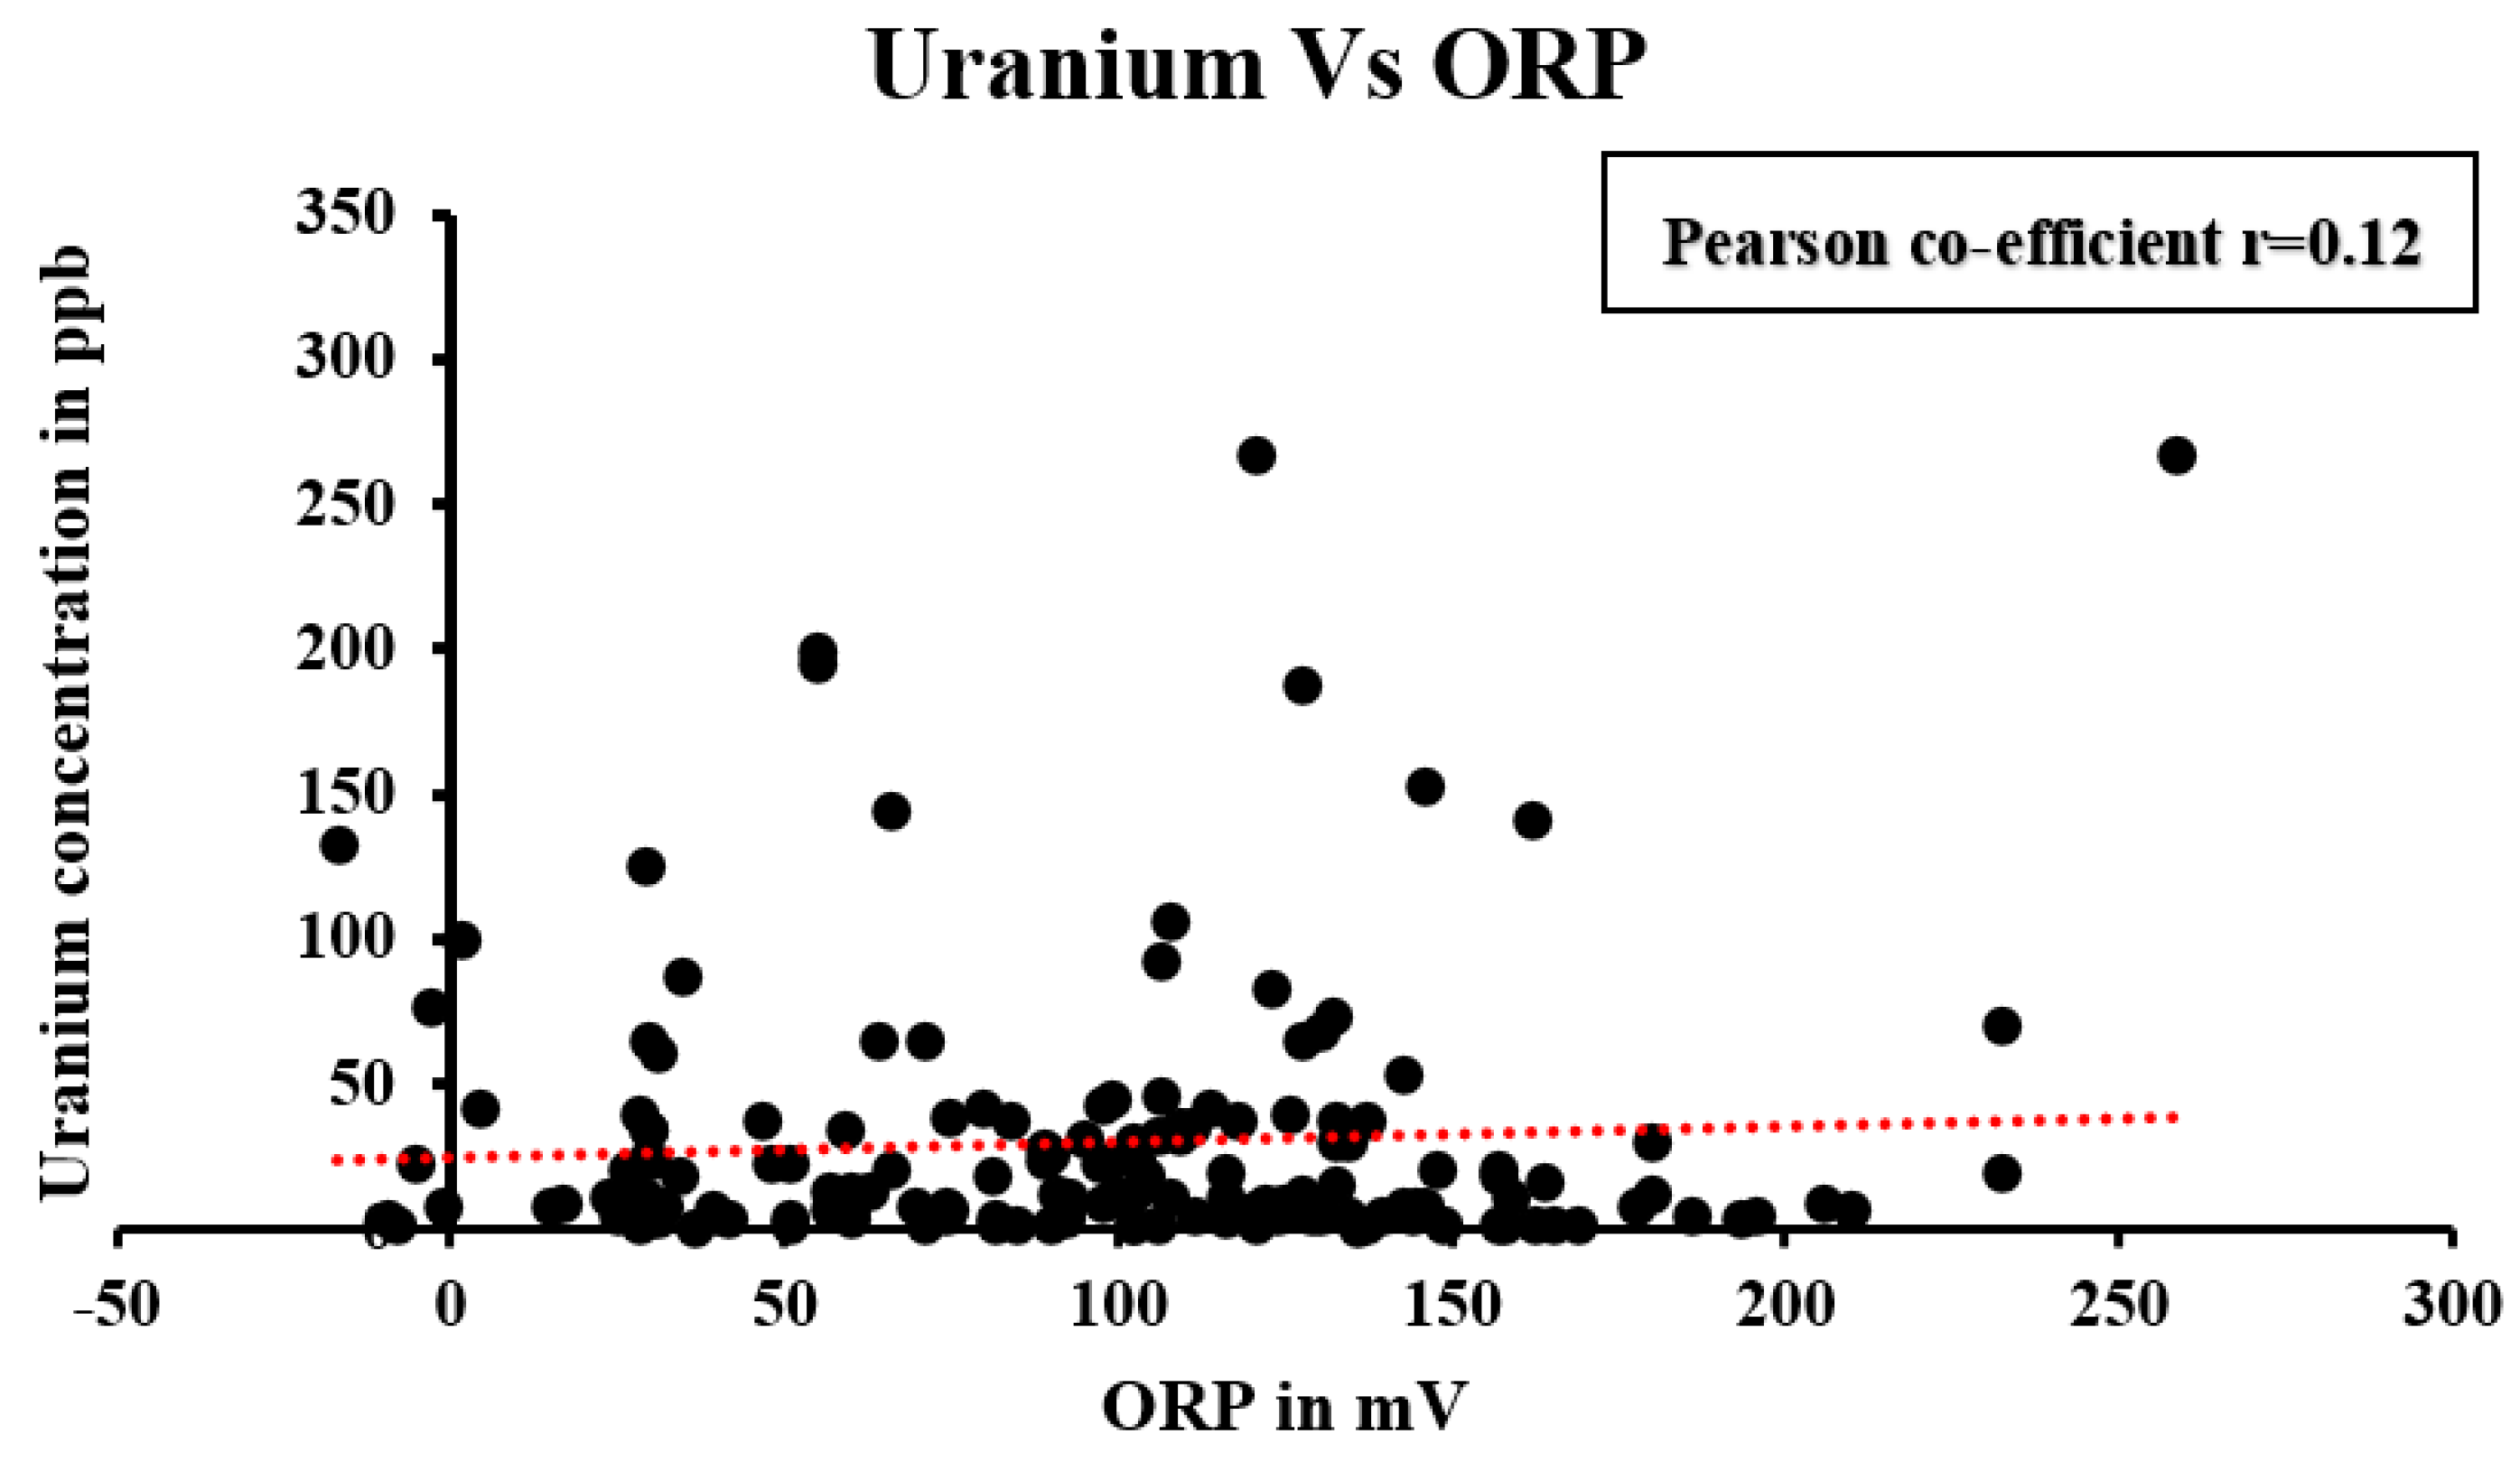
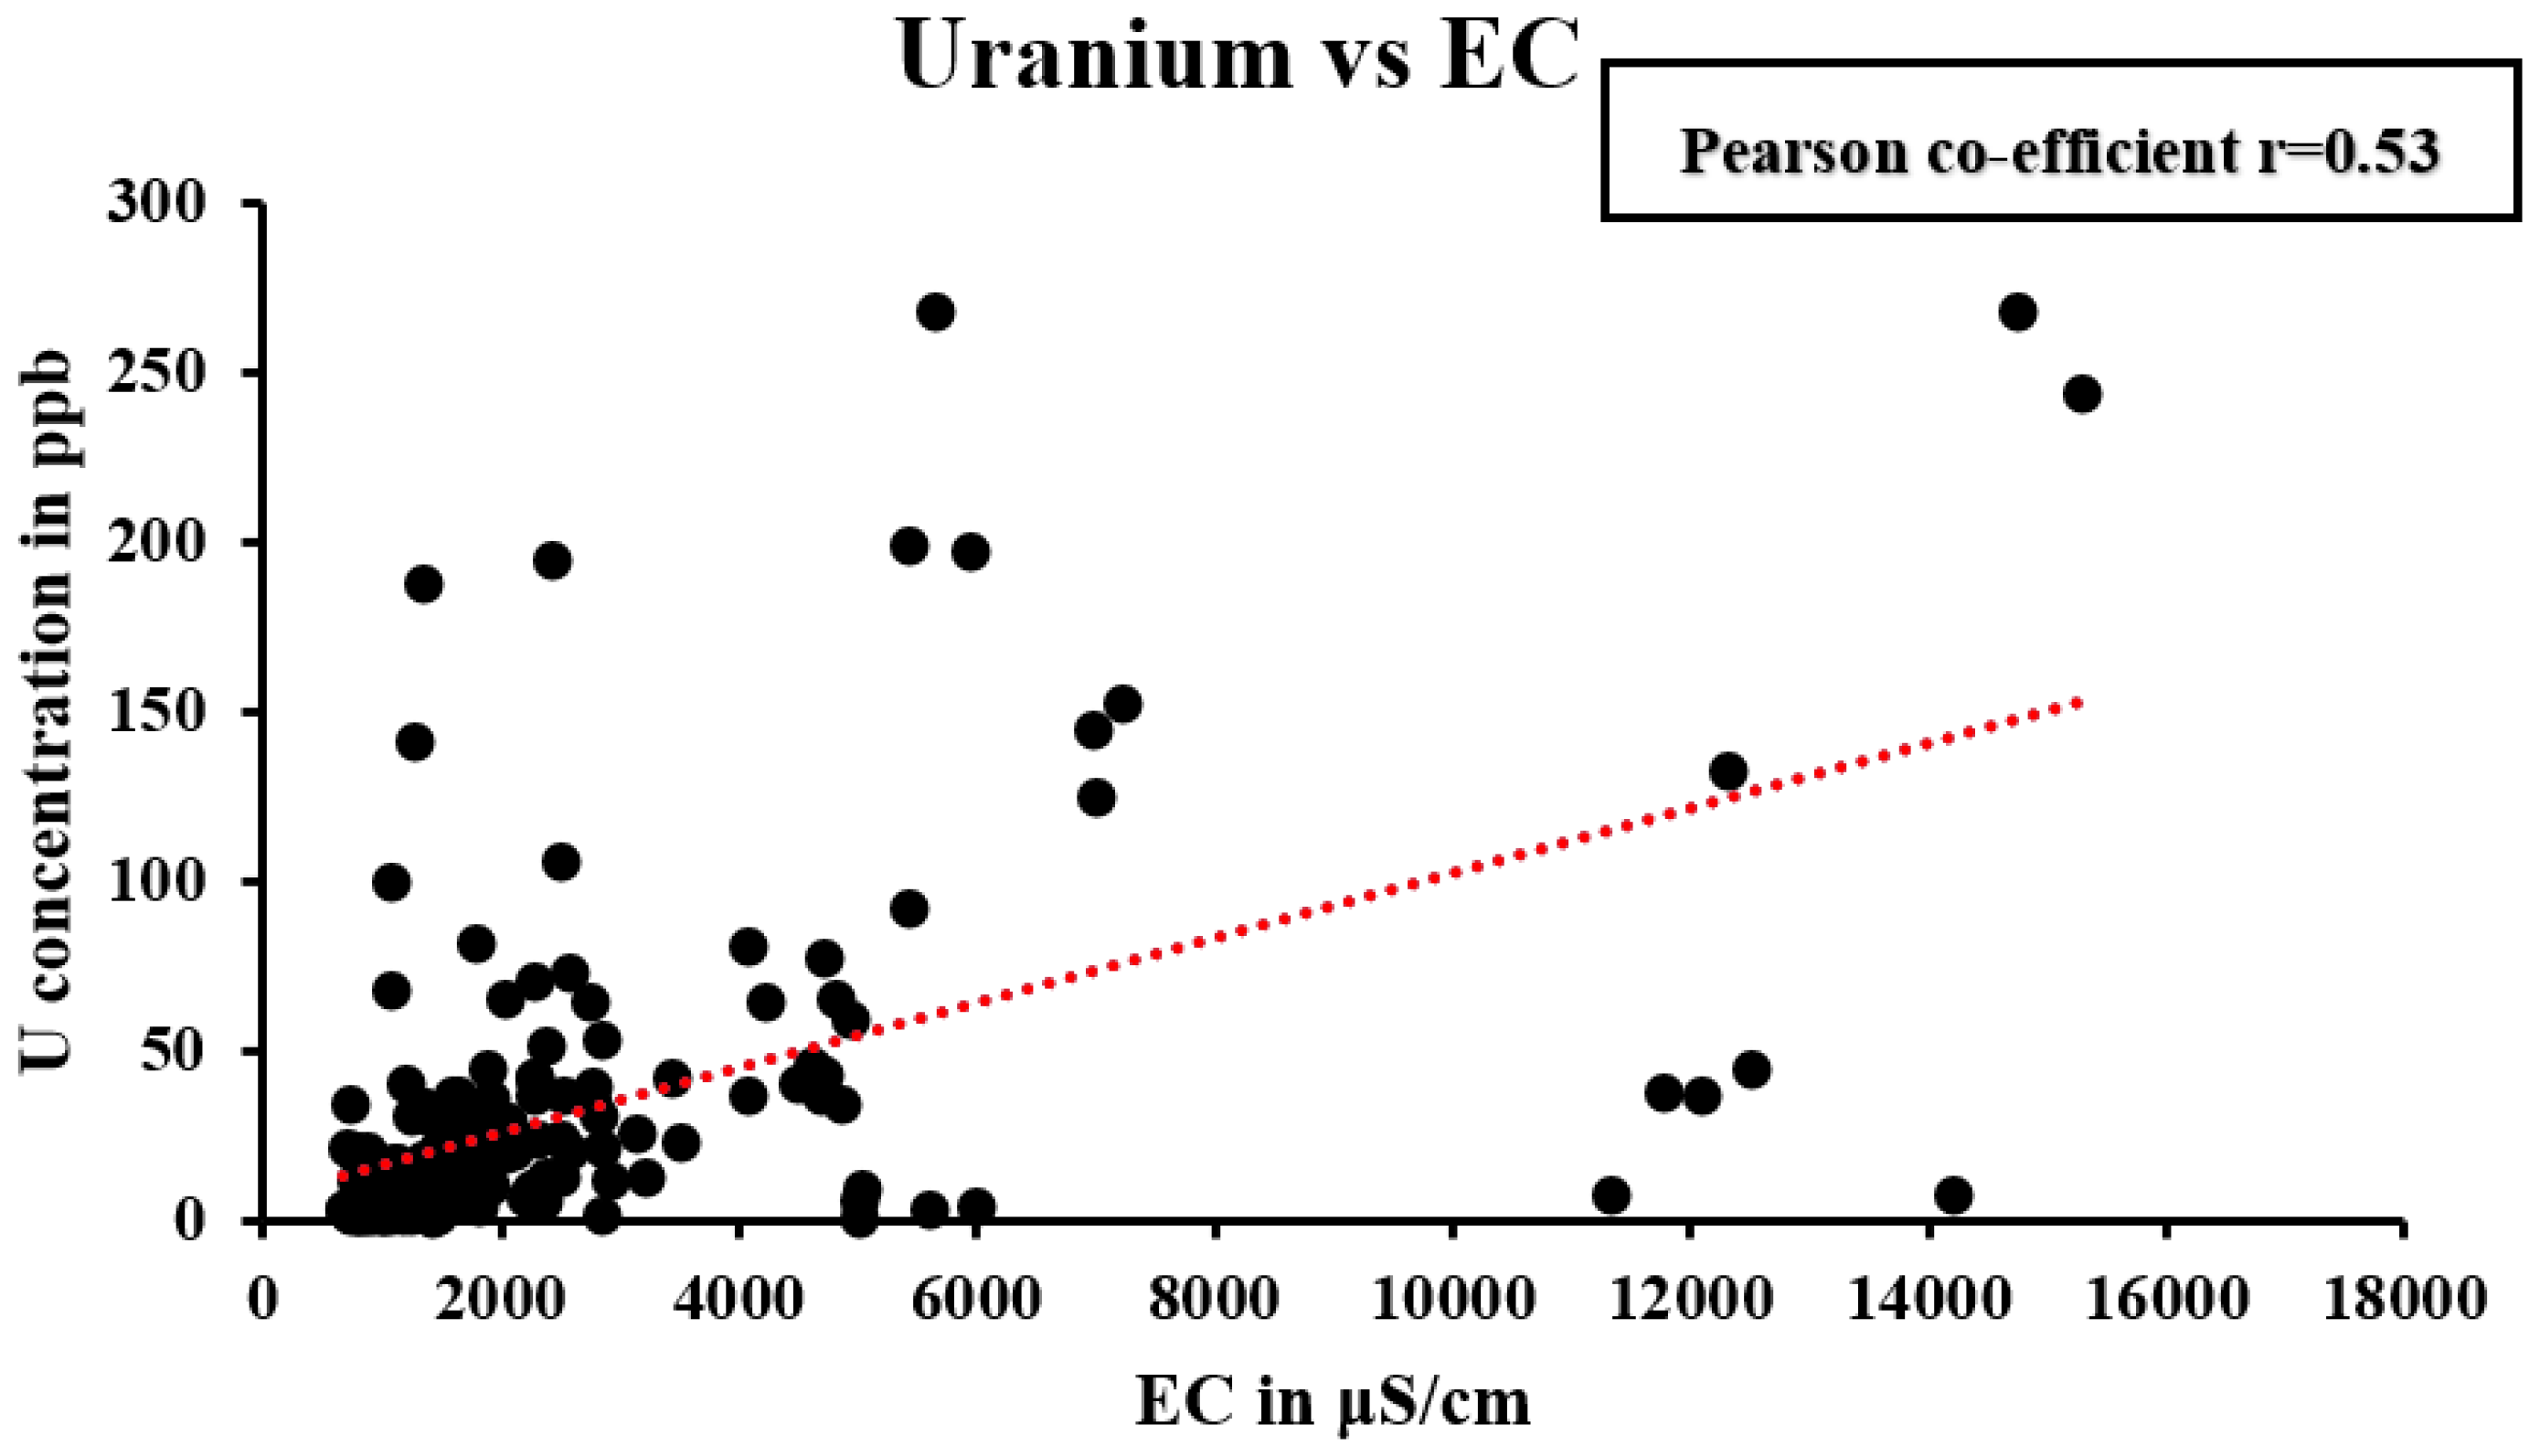
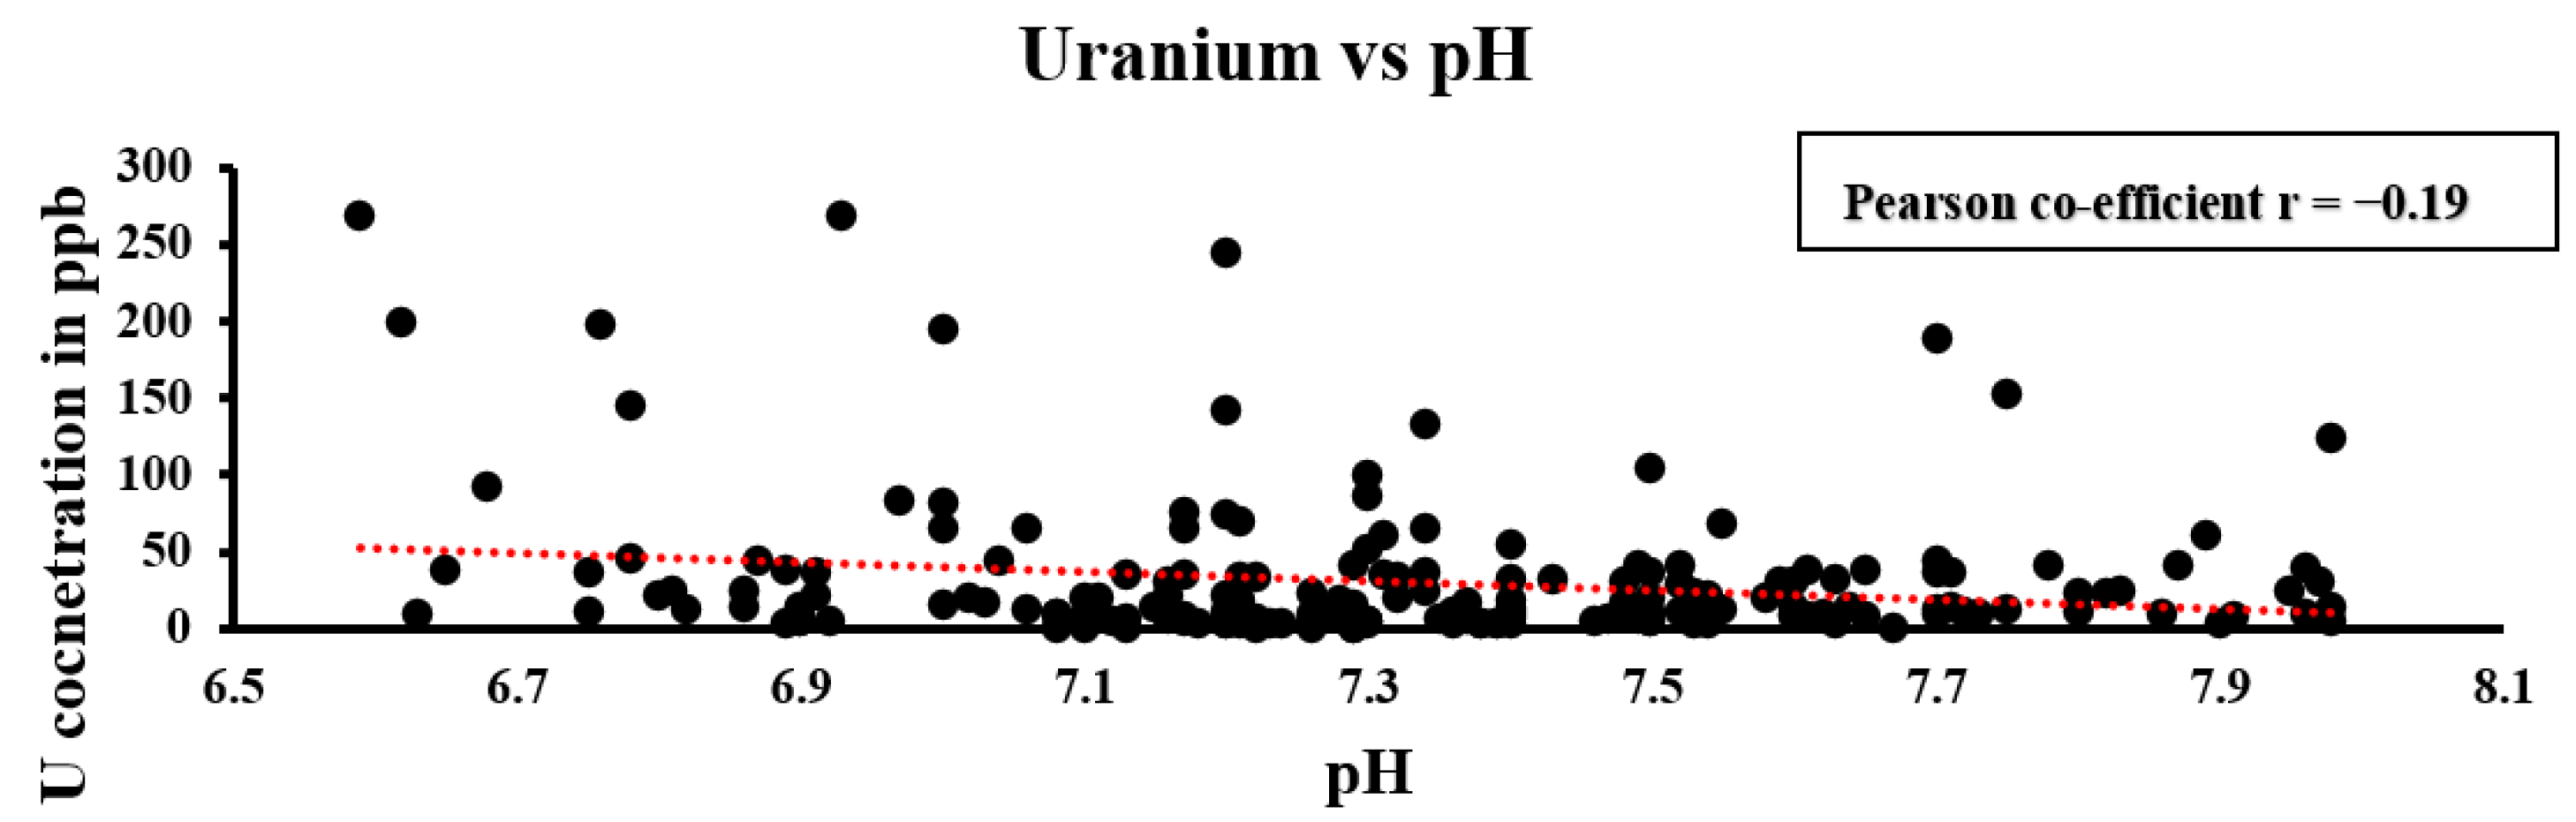
6.2. Relation among pH, EC, ORP, and Uranium

Uranium concentration in groundwater is generally controlled by the changes in pH, EC, and ORP, as uranium dissolution is highly dependent on the oxidation rate [30]. The collected field data being non-parametric in nature, Pearson’s correlation (Figure 6, Figure 7 and Figure 8) are used to study the relationship of uranium with ORP, EC and pH. Under moderately oxidizing conditions and near neutral pH range (5.8–8.0), U (VI) is highly soluble (Figure 6). In particular, elevated uranium concentrations due to the formation of highly soluble and stable tertiary calcium–uranium– carbonate complexes may be the reason for elevated levels of uranium in groundwater [31,32]. The chemistry of uranium is influenced by its ORP because of its redox dependency [33]. U(VI) solubility is extremely high, and oxidizing conditions enhance uranium movement [7]. A significant correlation (r = 0.53) was observed between uranium and EC, which implies that some dissolution process is taking place in the groundwater system, resulting in an elevated level of uranium (Figure 7). Uranium mobilization is studied by the various complexes formed by it in the water system depending on pH (Figure 8). At lower pH (<5), the dominant species of uranium is the Uranyl ion (UO22+). However, UO22+ forms complexes with carbonate, phosphate, and calcium at higher pHs [34,35]. Generally, pH plays a significant role in governing the dissolution of uranium in the groundwater and affects uranium speciation. The overall pH of groundwater measured during this study is alkaline, and alkaline pH increases uranium desorption leading to its dissolution. There is a negative correlation between uranium and pH (Figure 8); however, for individual wells, we observe a good temporal relationship (Figure 9). Uranium release from the soil matrix also depends on the oxidation and reduction reactions taking place (ORP). Stable uranium minerals are formed in low ORP conditions, causing uranium to precipitate out of the groundwater. In contrast, oxygenated groundwater (high ORP) helps in its dissolution and transportation [7]. In the current study (Figure 6 and Figure 8), it is observed that pH and ORP may provide favorable conditions for the release of uranium but are not the only controlling factors of uranium mobilization due to the oxic and alkaline nature of groundwater. It is generally believed that the higher the conductance, the higher the concentration of uranium in water. Uranium sorption to the sediment decreases with an increase in ionic strength because of greater competition among ions in the groundwater. When the ionic strength of oxidized solution increases, uranyl ion displacement takes place from the soil exchange locations by other ions such as Ca2+, Mg2+, and K+, which results in its mobilization as reported by ref. [36,37].

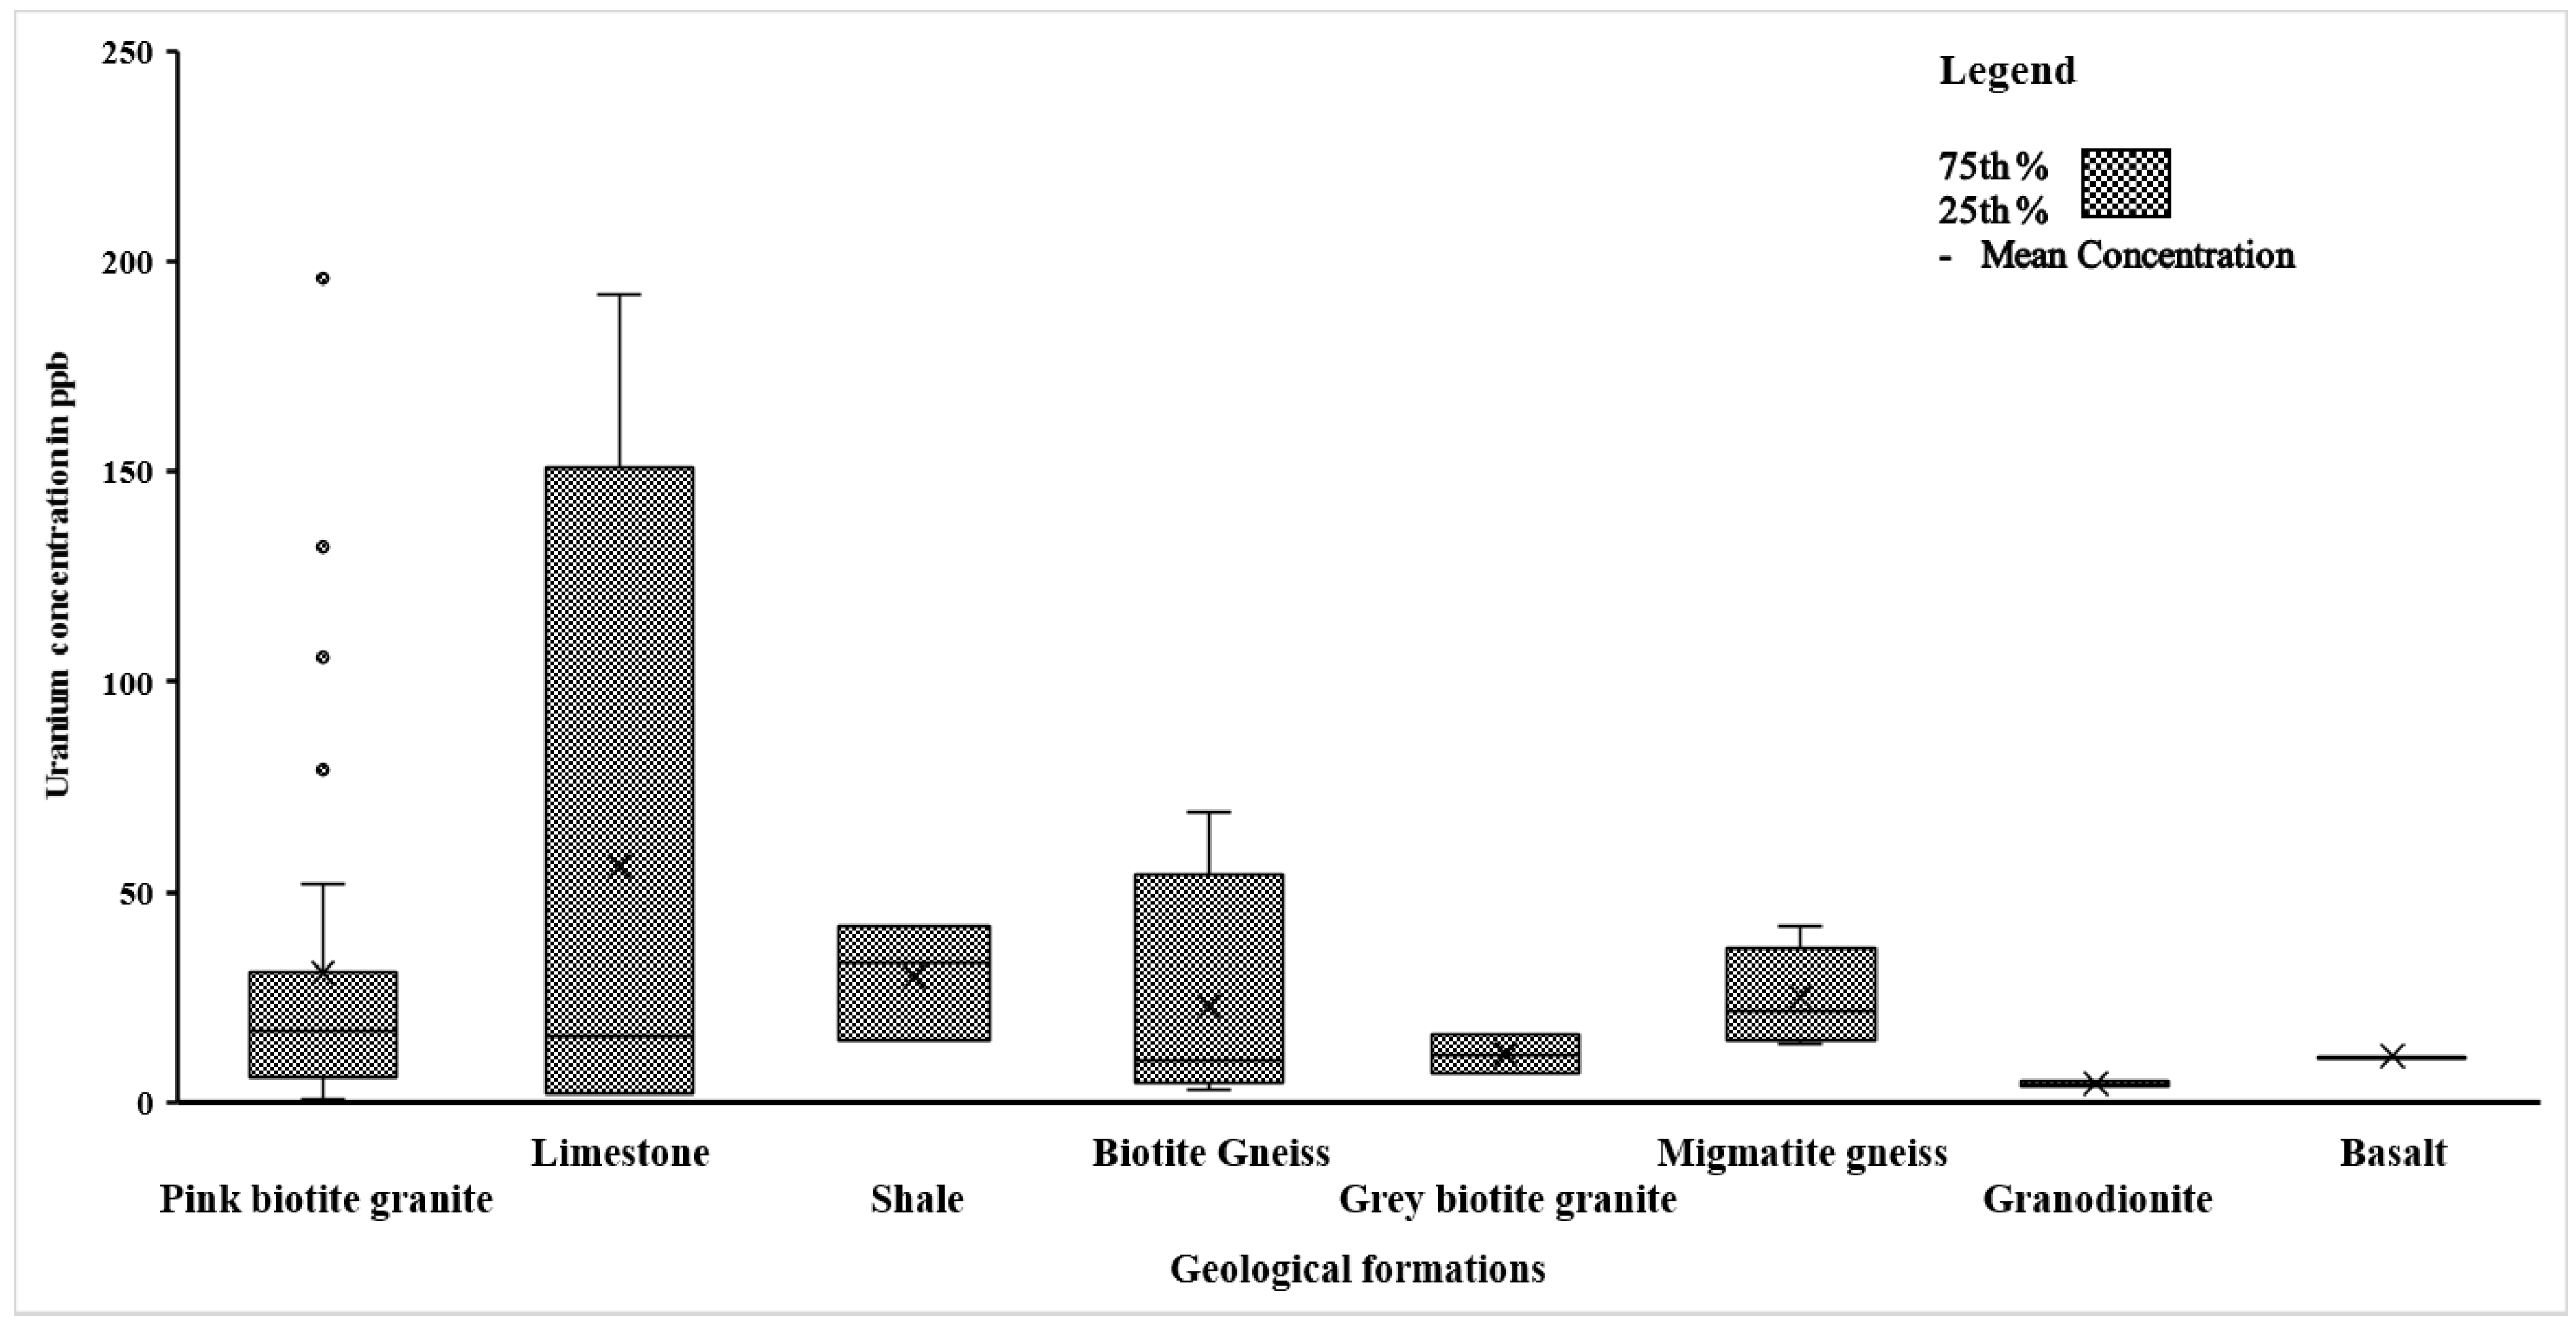
6.3. Uranium in Groundwater of Different Rock Formations

An environment with oxygen deficiency that has less permeable material and reducing agents such as carbonaceous material, hydrogen sulfide, and pyrite is considered the most favorable geologic environment for uranium ore deposition [38,39,40]. The migration of uranium in the water-rock systems is largely controlled by uranium solution–mineral equilibria and sorption reactions. A higher concentration of uranium is found in hard rocks due to the fractional crystallization of magma and partial melting, which causes uranium to be concentrated in silicate rocks [39]. But uranium concentrations greater than 30 μg/L were observed in areas 15 km south of mineralized regions of Gogi. Interaction between uranium-rich rocks with groundwater is the main reason for this region’s increase in uranium concentration. As already discussed, uranium is found as a vein-type deposit in the fault, which is the primary reason for the presence of uranium in groundwater near the mineralized region. While analyzing the uranium concentration in different geological formations that are above the drinking water permissible limits of 30 ppb according to the WHO standards, the values ranged from 31 ppb to a maximum of 267 ppb.
The maximum concentration was observed in the region of pink biotite granite and limestone (Figure 10). This can be attributed to the uranium present in dissolved and particulate form, which is dependent on the rock composition of the aquifer. Granitic rocks and gneiss are the predominant rock types present in this study area. In this region, granitic rocks contain a high concentration of uranium. The maximum concentration of uranium (267 ppb) is found to be in the pink biotite granite region. In sedimentary terrain, limestone and sandstone rocks act as water-bearing formations; hence, the elevated concentration of uranium was observed in some of the wells in this terrain.
In order to understand the mineralogical composition of rock types of the study region, thin section petrography, SEM micrograph, and XRD studies were carried out. As examples, the microscopic photographs under crossed nicols and XRD of granite and gneissic rock samples are shown in Figure 11 and Figure 12. The major minerals present in these rocks are quartz, orthoclase, albite, and biotite. In the thin sections, the quartz was identified easily due to the lack of cleavage, and biotite was identified due to high pleochroism. The feldspar minerals, such as orthoclase and albite, were identified from the presence of cleavages as well as twinning.
The XRD of these two rock samples in Figure 11 and Figure 12 confirms the dominance of minerals such as quartz, biotite, and orthoclase. Due to the relatively very low content of uranium-bearing minerals in the rocks dominated by quartz and feldspars, peaks at the expected wavelengths could not be seen (Figure 12). In the case of XRD of granite, the presence of uraninite could be confirmed by the peaks at different d-spacings (Figure 12).
An increase in the trend of uranium concentration generally was observed after the monsoon due to the loading of the uranium from the source during the groundwater recharge flow. Thus, the concentration of uranium in groundwater is comparatively less before the monsoon, and it increases after the monsoons. This indicates that an increase in rainfall recharge results in an increase in uranium concentration.
Very high concentrations of uranium were measured in well no.19, and a maximum of 267 ppb was observed in April 2020. Thus, in the entire study region, very high concentrations of uranium were observed in the groundwater of well no.19 during all four times of sampling carried out from January 2020 to October 2020. Even previous researchers [25] have reported the highest concentration of uranium at the same site. In order to evaluate the possible sources of uranium at this site, the available data and the land use around that were studied. The possibility of contamination of groundwater at this site by domestic sewage was also explored. There was no evidence of the impact of domestic sewage at this site noticed during field visits. This site is also similar in terms of the grade of weathering of rocks as compared to its surroundings. Hence, the possibility of leaching a higher amount of solutes due to weathering at this site is eliminated. The impact of the use of agrochemicals is also ruled out due to the absence of intensive agricultural practices around this well. The possibility of groundwater transporting uranium from the uraninites occurring along the Gogi-Kurlagere fault in the north was explored. If the groundwater is transporting uranium from the mineralized area to well no.19, the region in between should also have a progressive increase of uranium concentration in groundwater. However, the wells located between the uranium mineralized zone of the Gogi-Kurlagere fault and well no.19 have comparatively low concentrations of uranium (Figure 13). This confirms that the source for uranium at well no.19 is not due to the transport from the uranium mineralized region in the north. As the possibility of these sources is eliminated, the only other source is likely to be the presence of another uranium mineralized zone around well no.19. Thus, the highest concentration of uranium measured in well no.19 is likely to be derived from the uranium-rich rocks at this site. This indicates that a uranium mineralized zone may be present at this site. However, further investigation by drilling additional exploratory boreholes is necessary to confirm.

7. Conclusions

Uranium is a naturally occurring element in groundwater, especially in the hard rock terrains of southern India. Periodical monitoring of uranium concentration in groundwater was carried out from January 2020 to October 2020 once every three months from 52 wells in the Gogi region of Karnataka, India. The uranium concentration varied from 1.29 ppb to 267 ppb with a mean of 30 ppb. The uranium concentration of groundwater was compared with the maximum permissible limit put forth by the AERB and WHO/USEPA. The influence of regional geology on the concentration of uranium in groundwater was analyzed. Around 70% of samples were less than 30 ppb which is suitable for drinking. However, 20% of groundwater samples had concentration from 30 ppb to 60 ppb, which are considered suitable for drinking according to AERB drinking water standards, and the remaining 10% of samples range up to 267 ppb, which is about 10 times more than the permissible limit of uranium in drinking water. Relatively low concentration of uranium in groundwater over the uranium-mineralized belts at Gogi is interesting. This could be because of the occurrence of unoxidized uraninite that has not been released into groundwater on any significant scale and also due to the greater depth of occurrence of ore body. Very high concentrations of uranium were measured at a site that is away from the mineralized zone. The impact of domestic sewage, the possibility of leaching due to weathering, excessive use of agrochemicals, and the influence of the Gogi-Kurlagere uranium mineralized fault were ruled out after field investigations and comparing uranium concentrations along the groundwater flow path. Thus, the highest concentration of uranium is likely to be derived from the uranium-rich rocks at this site. Hence, the presence of uranium-rich groundwater at this site indicates the possible presence of another mineralized region in the study area, which needs to be confirmed by a detailed investigation. This study will serve as a baseline and will help to assess the impact of mining activities and other anthropogenic contributions of uranium in the future.

Author Contributions

R.B. collected samples, carried out analysis, interpreted data and drafted the manuscript. K.S. interpreted XRD data, SEM and petrological results of powdered rock samples. L.E. supervised the project, edited and reviewed the manuscript and acquired funding for the project. All authors have read and agreed to the published version of the manuscript.

Funding

This research was funded by Department of Atomic Energy: 36(4)/14/09/2018 dated 15 May 2018.

Data Availability Statement

Not applicable.

Conflicts of Interest

The authors declare no conflict of interest.

References

  1. World Nuclear Performance Report 2018. Available online: https://world-nuclear.org/getmedia/b392d1cd-f7d2-4d54-9355-9a65f71a3419/performance-report.pdf.aspx (accessed on 8 July 2022).
  2. Chen, B.; Roos, P.; Borggaard, O.K.; Zhu, Y.G.; Jakobsen, I. Myorrhiza and root hairs in barley enhance acquisition of phosphorus and uranium from phosphate rock but mycorrhiza decreases root to shoot uranium transfer. New Phytol. 2005, 165, 591–598. [Google Scholar] [CrossRef]
  3. James, L.J.; Sinha, A.K. Geochemical coupling of uranium and phosphorous in soils overlying an unmined uranium deposit: Coles Hill, Virginia. J. Geochem. Explor. 2006, 91, 56–70. [Google Scholar]
  4. Bhattacharya, P.; Chatterjee, D.; Jacks, G. Occurrence of arsenic contaminated groundwater in alluvial aquifers from the delta plains, eastern India: Options for safe drinking water supply. Water Resour. Dev. 1997, 13, 79–92. [Google Scholar] [CrossRef]
  5. Gunduz, O.; Simsek, C.; Hasozbek, A. Arsenic pollution in the groundwater of Simav Plain, Turkey: Its impact on water quality and human health. Water Air Soil Pollut. 2009, 205, 43–62. [Google Scholar] [CrossRef]
  6. Brindha, K.; Rajesh, R.; Murugan, R.; Elango, L. Fluoride contamination in groundwater in parts of Nalgonda district, Andhra Pradesh, India. Environ. Monit. Assess. 2011, 172, 481–492. [Google Scholar] [CrossRef] [PubMed]
  7. Alam, M.S.; Cheng, T. Uranium release from sediment to groundwater: Influence of water chemistry and insights into release mechanisms. J. Contam. Hydrol. 2014, 164, 72–87. [Google Scholar] [CrossRef] [PubMed]
  8. Liu, C.; Shi, Z.; Zachara, J.M. Kinetics of uranium (VI) desorption from contaminated sediments: Effect of geochemical conditions and model evaluation. Environ. Sci. Technol. 2009, 43, 6560–6566. [Google Scholar] [CrossRef] [PubMed] [Green Version]
  9. Qafoku, N.P.; Zachara, J.M.; Liu, C.; Gassman, P.L.; Qafoku, O.S.; Smith, S.C. Kinetic desorption and sorption of U (VI) during reactive transport in a contaminated Hanford sediment. Environ. Sci. Technol. 2005, 39, 3157–3165. [Google Scholar] [CrossRef] [Green Version]
  10. Abdurabu, W.A.; Saleh, M.A.; Ramli, A.T.; Heryansyah, A. Occurrence of natural radioactivity and corresponding health risk in groundwater with an elevated radiation background in Juban District, Yemen. Environ. Earth Sci. 2016, 75, 1360. [Google Scholar] [CrossRef]
  11. 2016 NEA Annual Report—Nuclear Energy Agency. Available online: https://www.oecd-nea.org/jcms/pl_15044/2016-nea-annual-report?details=true (accessed on 4 January 2022).
  12. Banerjee, D.C. Uranium Exploration in the Proterozoic Basins in India—Present Status and Future Strategy India; International Atomic Energy Agency (IAEA): Vienna, Austria, 20 August 1999. [Google Scholar]
  13. Chaki, A.; Purohit, R.K.; Mamallan, R. Low grade uranium deposits of India-a bane or boon. Energy Procedia 2011, 7, 153–157. [Google Scholar] [CrossRef] [Green Version]
  14. Kale, V.S.; Phansalkar, V.G. Purana basins of peninsular India: A review. Basin Res. 1991, 3, 1–36. [Google Scholar] [CrossRef]
  15. Kale, V.V.; Peshwa, V.V. Bhima Basin Field Guide; Geological Society of India: Bangalore, India, 1995. [Google Scholar]
  16. Achar, K.K.; Pandit, S.A.; Natarajan, V.; Kumar, M.K.; Dwivedy, K.K. Bhima Basin, Karnataka, India, Uranium Mineralisation in the Neoproterozoic. Assessment of Uranium Deposit Types and Resources—A Worldwide Perspective; International Atomic Energy Agency (IAEA): Vienna, Austria, 2001; pp. 129–140. [Google Scholar]
  17. Raju, R.D.; Kumar, M.K.; Babu, E.V.S.S.K.; Pandit, S.A. Uranium Mineralisation in the Neoproterozoic Bhima Basin at Gogi and near Ukinal: An Ore Petrological Study. Geol. Soc. India 2002, 59, 299–321. [Google Scholar]
  18. Chaki, A.; Pannerselvam, A.; Chavan, S.J. Uranium Exploration in the Upper Proterozoic Bhima Basin, Karnataka, India—A New Target Area. In Proceedings of the International Symposium on Uranium Raw Material for the Nuclear Fuel Cycle: Supply and Demand, Economics, the Environment and Energy Security; International Atomic Energy Agency: Vienna, Austria, 2005; pp. 183–194. [Google Scholar]
  19. Kerur, B.R.; Rajeshwari, T.; Nagabhushna, N.M.; Kumar, A.; Narayani, S.; Rekha, A.K. Radioactivity measurement in the granites of North Karnataka, India and its radiological implications. Indian J. Phys. 2010, 84, 1467–1480. [Google Scholar] [CrossRef]
  20. Yashodhara, I.; Karunakara, N.; Kumar, K.S.; Murthy, R.; Tripathi, R.M. Radiation levels and radionuclide distributions in soils of the gogi region, a proposed uranium mining region in north Karnataka. Radiat. Prot. Environ. 2011, 34, 267–269. [Google Scholar]
  21. Nagarajan, R.; Madhavaraju, J.; Nagendra, R.; Altrin, J.S.A.; Moutte, J. Geochemistry of Neoproterozoic shales of the Rabanpalli Formation, Bhima Basin, Northern Karnataka, southern India: Implications for provenance and paleoredox conditions. Rev. Mex. Cienc. Geológicas 2007, 24, 150–160. [Google Scholar]
  22. Latha, A.; Fahmi, A.K.S.S.; Kumar, K.S. Mineralogical, characterization of mine sample of uranium deposit Karnataka India. J. Appl. Geochem. 2012, 14, 316–323. [Google Scholar]
  23. Patnaik, S.; Hegde, G.N.; Panneerselvam, A.; Verma, M.B.; Mohanty, R.; Rai, A.K. Geochemical behaviour of LREE, Y and Zr in uranium mineralized and non-mineralized granite from Darshanapur area in the Gogi-Kurlagere fault zone, Bhima basin, Yadgiri district, Karnataka. J. Geol. Soc. India 2016, 88, 151–158. [Google Scholar] [CrossRef]
  24. Manoj, S.; Parimalarenganayaki, S.; Elango, L. Estimation of distribution coefficient of uranium in soil by batch tests. Mater. Sci. Eng. 2017, 263, 032016. [Google Scholar] [CrossRef]
  25. Manoj, S.; Thirumurugan, M.; Elango, L. An integrated approach for assessment of groundwater quality in and around uranium mineralized zone, Gogi region, Karnataka, India. Arab. J. Geosci. 2017, 10, 557. [Google Scholar] [CrossRef]
  26. Ramesh, R.; Subramanian, M.; Lakshmanan, E.; Subramaniyan, A.; Ganesan, G. Human health risk assessment using Monte Carlo simulations for groundwater with uranium in southern India. Ecotoxicol. Environ. Saf. 2021, 226, 112781. [Google Scholar] [CrossRef]
  27. Mishra, R.N.; Jayaprakash, A.V.; Hans, S.K.; Sundaram, V. Bhima Group of Upper Proterozoic-A stratigraphic puzzle. Mem. Geol. Soc. India 1987, 6, 227–237. [Google Scholar]
  28. CGWB 2020 Report, Uranium Occurrence in Shallow Aquifers in India. Available online: http://cgwb.gov.in/WQ/URANIUM_REPORT_2020.pdf (accessed on 9 February 2022).
  29. His, C.-K.D.; Langmuir, D. Adsorption of uranyl onto ferric oxyhydroxides: Application of the surface complexation site-binding model. Geochim. Cosmochim. Acta 1985, 49, 1931–1941. [Google Scholar] [CrossRef]
  30. Sahoo, P.K.; Virk, H.S.; Powell, M.A.; Kumar, R.; Pattanaik, J.K.; Salomão, G.N.; Mittal, S.; Chouhan, L.; Nandabalan, Y.K.; Tiwari, R.P. Meta-analysis of uranium contamination in groundwater of the alluvial plains of Punjab, northwest India: Status, health risk, and hydrogeochemical processes. Sci. Total Environ. 2022, 807, 151753. [Google Scholar] [CrossRef] [PubMed]
  31. Bernhard, G.; Geipel, G.; Brendler, V.; Nitsche, H. Speciation of uranium in seepage waters of a mine tailing pile studied by time-resolved laser-induced fluorescence spectroscopy (TRLFS). Radiochim. Acta 1996, 74, 87–92. [Google Scholar] [CrossRef]
  32. Kalmykov, S.N.; Choppin, G.R. Mixed Ca2+/UO22+/CO32- complex formation at different ionic strengths. Radiochim. Acta 2000, 88, 603–608. [Google Scholar] [CrossRef]
  33. Finch, R.; Murakami, T. Systematics and paragenesis of Uranium minerals. In Uranium: Mineralogy, Geochemistry and the Environment Reviews in Mineralogy; Burns, P.C., Finch, R.J., Eds.; De Gruyter: Berlin, Germany; Boston, MA, USA,, 1999; Volume 38, pp. 91–180. [Google Scholar] [CrossRef]
  34. Langmuir, D. Uranium solution-mineral equilibria at low temperatures with applications to sedimentary ore deposits. Geochem. Cosmochim. Acta 1978, 42, 547–569. [Google Scholar] [CrossRef]
  35. Porcelli, D.; Swarzenski, P.W. The behavior of U- and Th-series nuclides in groundwater. Rev. Miner. Geochem. 2003, 52, 317–361. [Google Scholar] [CrossRef]
  36. Kumar, A.; Tripathi, R.M.; Rout, S.; Mishra, M.K.; Ravi, P.M.; Ghosh, A.K. Characterization of groundwater composition in Punjab state with special emphasis on uranium content, speciation and mobility. Radiochim. Acta 2014, 102, 239–254. [Google Scholar] [CrossRef]
  37. Krupa, S.L.; Belanger, T.V.; Heck, H.H.; Brock, J.T.; Jones, B.J. Krupaseep—The next generation seepage meter. J. Coast Res. 1998, 26, 210–213. [Google Scholar]
  38. Rojas, J.L. Introduction to in Situ Leaching of Uranium: Tehcnical, Environemntal and Economic Aspects; IAEA Technical Document No.492; International Atomic Energy Agency: Vienna, Austria, 1989. [Google Scholar]
  39. Klepper, M.R.; Wyant, D.G. Notes on the Geology of Uranium; USGS numbered series 1046, index ID b1046F; U.S. Government Publishing Office: Washington, DC, USA, 1957; pp. 87–148. [CrossRef]
  40. Kim, Y.S.; Kim, H.S.; Park, J.Y.; Kim, S.K.; Park, B.W.; Cho, I.H.; Sung, D.C. Shin Health risk assessment for uranium in Korean groundwater. J. Environ. Radioact. 2004, 77, 77–85. [Google Scholar] [CrossRef] [PubMed]
Figure 1. Location and drainage of the study area.
Minerals 13 00157 g001
Figure 2. Lithology of the study area.
Minerals 13 00157 g002
Figure 3. Lineaments and sampling well locations in the study area.
Minerals 13 00157 g003
Figure 4. Geomorphology of the study area.
Minerals 13 00157 g004
Figure 5. Range of uranium concentration in groundwater.
Minerals 13 00157 g005
Figure 6. Pearson correlation between uranium concentration and ORP.
Minerals 13 00157 g006
Figure 7. Pearson correlation between uranium concentration and EC.
Minerals 13 00157 g007
Figure 8. Pearson correlation between uranium concentration and pH.
Minerals 13 00157 g008
Figure 9. Relationship between uranium concentration and pH.
Minerals 13 00157 g009
Figure 10. Uranium concentration in groundwater of wells located in different rock types.
Minerals 13 00157 g010
Figure 11. (a) Petrographic thin section; (b) SEM micrograph, and (c) XRD of gneissic rock sample from the study area.
Minerals 13 00157 g011
Figure 12. (a) Petrographic thin section; (b) SEM micrograph; (c) XRD of granite rock sample from the study area.
Minerals 13 00157 g012
Figure 13. Average uranium concentration in the wells with concentration above 30 ppb.
Minerals 13 00157 g013
Table 1. Lithostratigraphic sequence of the Bhima basin (after [27]).
GroupSubgroupFormationMember
Bhima GroupAndola SubgroupHarwal-Gogi formation
Katamdevarhalli formation
Halkal formationFissile shale
Orthoquartzite
Chert pebble conglomerate
~~~~~~~~~~~~gradational and transitional contact~~~~~~~~~~~~~~~~~~
Sedam subgroupShahabad formationFlaggy, dark grey, and argillaceous micritic limestone
Massive dark grey and bluish grey limestone
Variegated and siliceous/cherty limestone
Blocky, light grey to bluish grey limestone
Slabby and cherty limestone
Rabanapalli formationPurple shale
Green/Yellow shale
Siltstone
Quarzitic sandstone
Conglomerate/Grit
~~~~~~~~~~~~~~~~~~~~~~~~~~~~~~~~~~~~~~~~~~~~~
Basement crystallineYounger granites, Peninsular gneisses
Disclaimer/Publisher’s Note: The statements, opinions and data contained in all publications are solely those of the individual author(s) and contributor(s) and not of MDPI and/or the editor(s). MDPI and/or the editor(s) disclaim responsibility for any injury to people or property resulting from any ideas, methods, instructions or products referred to in the content.

