Article

A Research of Emeralds from Panjshir Valley, Afghanistan

1
Gemological Institute, China University of Geosciences, Wuhan 430074, China
2
School of Jewelry, West Yunnan University of Applied Sciences, Baoshan 679100, China
3
College of Earth Sciences, Guilin University of Technology, Guilin 541006, China
4
School of Jewelry, Shanghai Jianqiao University, Shanghai 201306, China
*
Author to whom correspondence should be addressed.
Minerals 2023, 13(1), 63; https://doi.org/10.3390/min13010063
Submission received: 15 November 2022 / Revised: 27 December 2022 / Accepted: 27 December 2022 / Published: 30 December 2022
(This article belongs to the Special Issue Gem Characterisation)

Abstract

:
In recent years, emeralds from the Panjshir Valley in Afghanistan have taken a large share of the market, with high-quality emeralds comparable to Colombian emeralds. In order to meet the market demand for tracing the origin of emeralds, 20 emeralds from the region were tested using conventional gemology, laser Raman spectroscopy, Fourier infrared spectroscopy, ultraviolet-visible-near-infrared spectroscopy, and laser ablation plasma-mass spectrometry. The results show that the contents of the samples are mainly serrated three-phase inclusions, which are similar to those of Colombian emeralds. There are multiple solid inclusions and two liquids in the serrated voids. The main coloring elements of the sample are chromium and vanadium. The alkali metal content is moderate, among which rubidium (average content: 25.72 ppm) and cesium (average content: 33.15 ppm) content is lower. The near-infrared spectrum reveals that the absorption characteristic was dominated by type I water. A chemical composition analysis indicates that the chemical composition of Panjshir emeralds is similar to that of the emeralds of Davdar Township in China and Coscuez in Colombia, but they could be distinguished by an Na-Sc and Rb-Ga diagram.

1. Introduction

Emerald, known as the “king of green gems”, is a kind in the beryl family, and its ideal chemical formula is Be3Al2SiO18. Emerald is a hexagonal crystal system, which is a cyclic silicate mineral. Its structure is formed by stacking hexagonal rings composed of silicon tetrahedrons, which leads to the existence of a channel parallel to the c-axis in the structure, in which many ions and molecules can exist. Emeralds are produced in five continents of the world. At present, emeralds with high quality and of a large quantity in the market mainly come from Colombia, Zambia, Afghanistan, and Pakistan.
Historically, Afghanistan has been known for its lapis lazuli deposits, but since the discovery of gem-grade emeralds in 1970 [1], a large number of high-quality emeralds have emerged (Figure 1). In 2015, Christie’s Auction House sold a ring inlaid with 10.11 ct emerald, cutting emerald at the price of HKD17560000. Emeralds are produced in the Panjshir Valley, which is about 110 km northeast of Kabul. In 1977 and 2015, there were five emerald mining areas in the Panjshir Valley—Darkhenj, Mikeni, Yaknow, Buzmal and Darun, which are to the east of Panjshir River (Figure 2) [2].
Previous reports on the emeralds in the Panjshir Valley of Afghanistan are mostly about the geological deposits, mining environment, and mineralogical properties [3,4,5,6] but seldom on gemological characteristics, spectral characteristics, and color origin. Emerald color is associated with the presence of trace chemical elements, and chemical element and inclusion characteristics are linked to their geographical origin. These characteristics can expand the existing emerald origin database and have a great impact on the origin traceability of emeralds.
Afghan emeralds are becoming more and more popular in the Chinese market and favored by Chinese consumers. Therefore, it is necessary to trace the origin of emeralds in this area. We have carried out a detailed study on the gemological characteristics of emeralds in this area; supplemented it with more-detailed inclusion characteristics, chemical composition data, and spectral information; and preliminarily summarized a set of tracing processes for emeralds in this area. In this study, the history, geology, and exploitation of emeralds in this area are introduced. The gemological properties of emeralds are determined by conventional gemological instruments, the inclusions are identified by Raman spectrometer, and the spectral characteristics of emeralds are determined by infrared spectrometer. The chemical composition and color origin of emeralds with color zonation are studied by using an ultraviolet-visible-near-infrared spectrometer and a laser denudation plasma-mass spectrometer.

2. History

Most people believe that in ancient Greece and Rome, the real emeralds came from Egypt [7]. However, in the first century CE, Pliny’s Natural History [3] and Theophrastus’s Stone Theory [8] both referred to “Smaragdus,” a Latin term that in ancient times referred to emeralds and other green gemstones. It came from the Bactria of what is now Iran and Afghanistan. This suggests that emeralds were known to have been produced in Afghanistan as early as Roman times.
Nevertheless, only Marco Polo mentioned silver ore, Balas rubies, and lapis lazuli from Bactria in his travelogues in 1265 CE. He wrote that “this gem called Balas ruby comes from this province (Bactria)”, “And also, there are veins in this mountain, from which a large amount of silver, copper and lead can be obtained” (Biography of Marco Polo). It is believed that Bactrian emeralds might be those from Pakistan and Afghanistan [9]. Nevertheless, we do not know whether there was an emerald trade in Afghanistan at that time. Using oxygen isotope analysis, Giuliani and other gemologists discovered that the antique emeralds in the Nizam treasure from Hyderabad (India) may have come from the Panjshir Valley in Afghanistan [9]. This means that the Panjshir Valley produced high-quality emeralds at least as far back as the 18th century [10].
Over the next hundred years, the Panjshir Valley gems were rarely reported. At the beginning of the 20th century, geologists from Britain, France, the United States, and other countries reported on the geological conditions of Afghanistan [11,12]. At the start of the 1970s, emeralds were discovered in the Buzmal mine, east of Dest-e-Rewat village in the Panjshir Valley. It has been systematically investigated by Russian and Afghan geologists [13,14]. Although the local political situation in Afghanistan affected the geological work, the United Nations Development Programme also published the name and location of the emerald deposit in the report of 1977 [2].
Agnew first discussed emerald deposits in Afghanistan in 1982 [3]. Over the past decade, scholars ventured into Afghanistan one after another at the risk of war to discover the secrets of emeralds and report extensively on their mineral deposits and gemological characteristics [3,4,5,10,15]. In 1990, Ward predicted that emeralds from Afghanistan could have a huge impact on the future gem market [3]. At the 2016 Toussaint show, Arthur Groom, Jr., the dealer (distributor) of Eternal Natural Emerald, believed that Afghanistan emeralds were one of his biggest sources of goods [16]. The Panjshir emerald, which entered the market in 2017, is comparable in quality to the Colombian emerald [10]. Today, Afghan emeralds have occupied a large market share, and it is necessary to study them because of their similarities to Colombian emeralds.

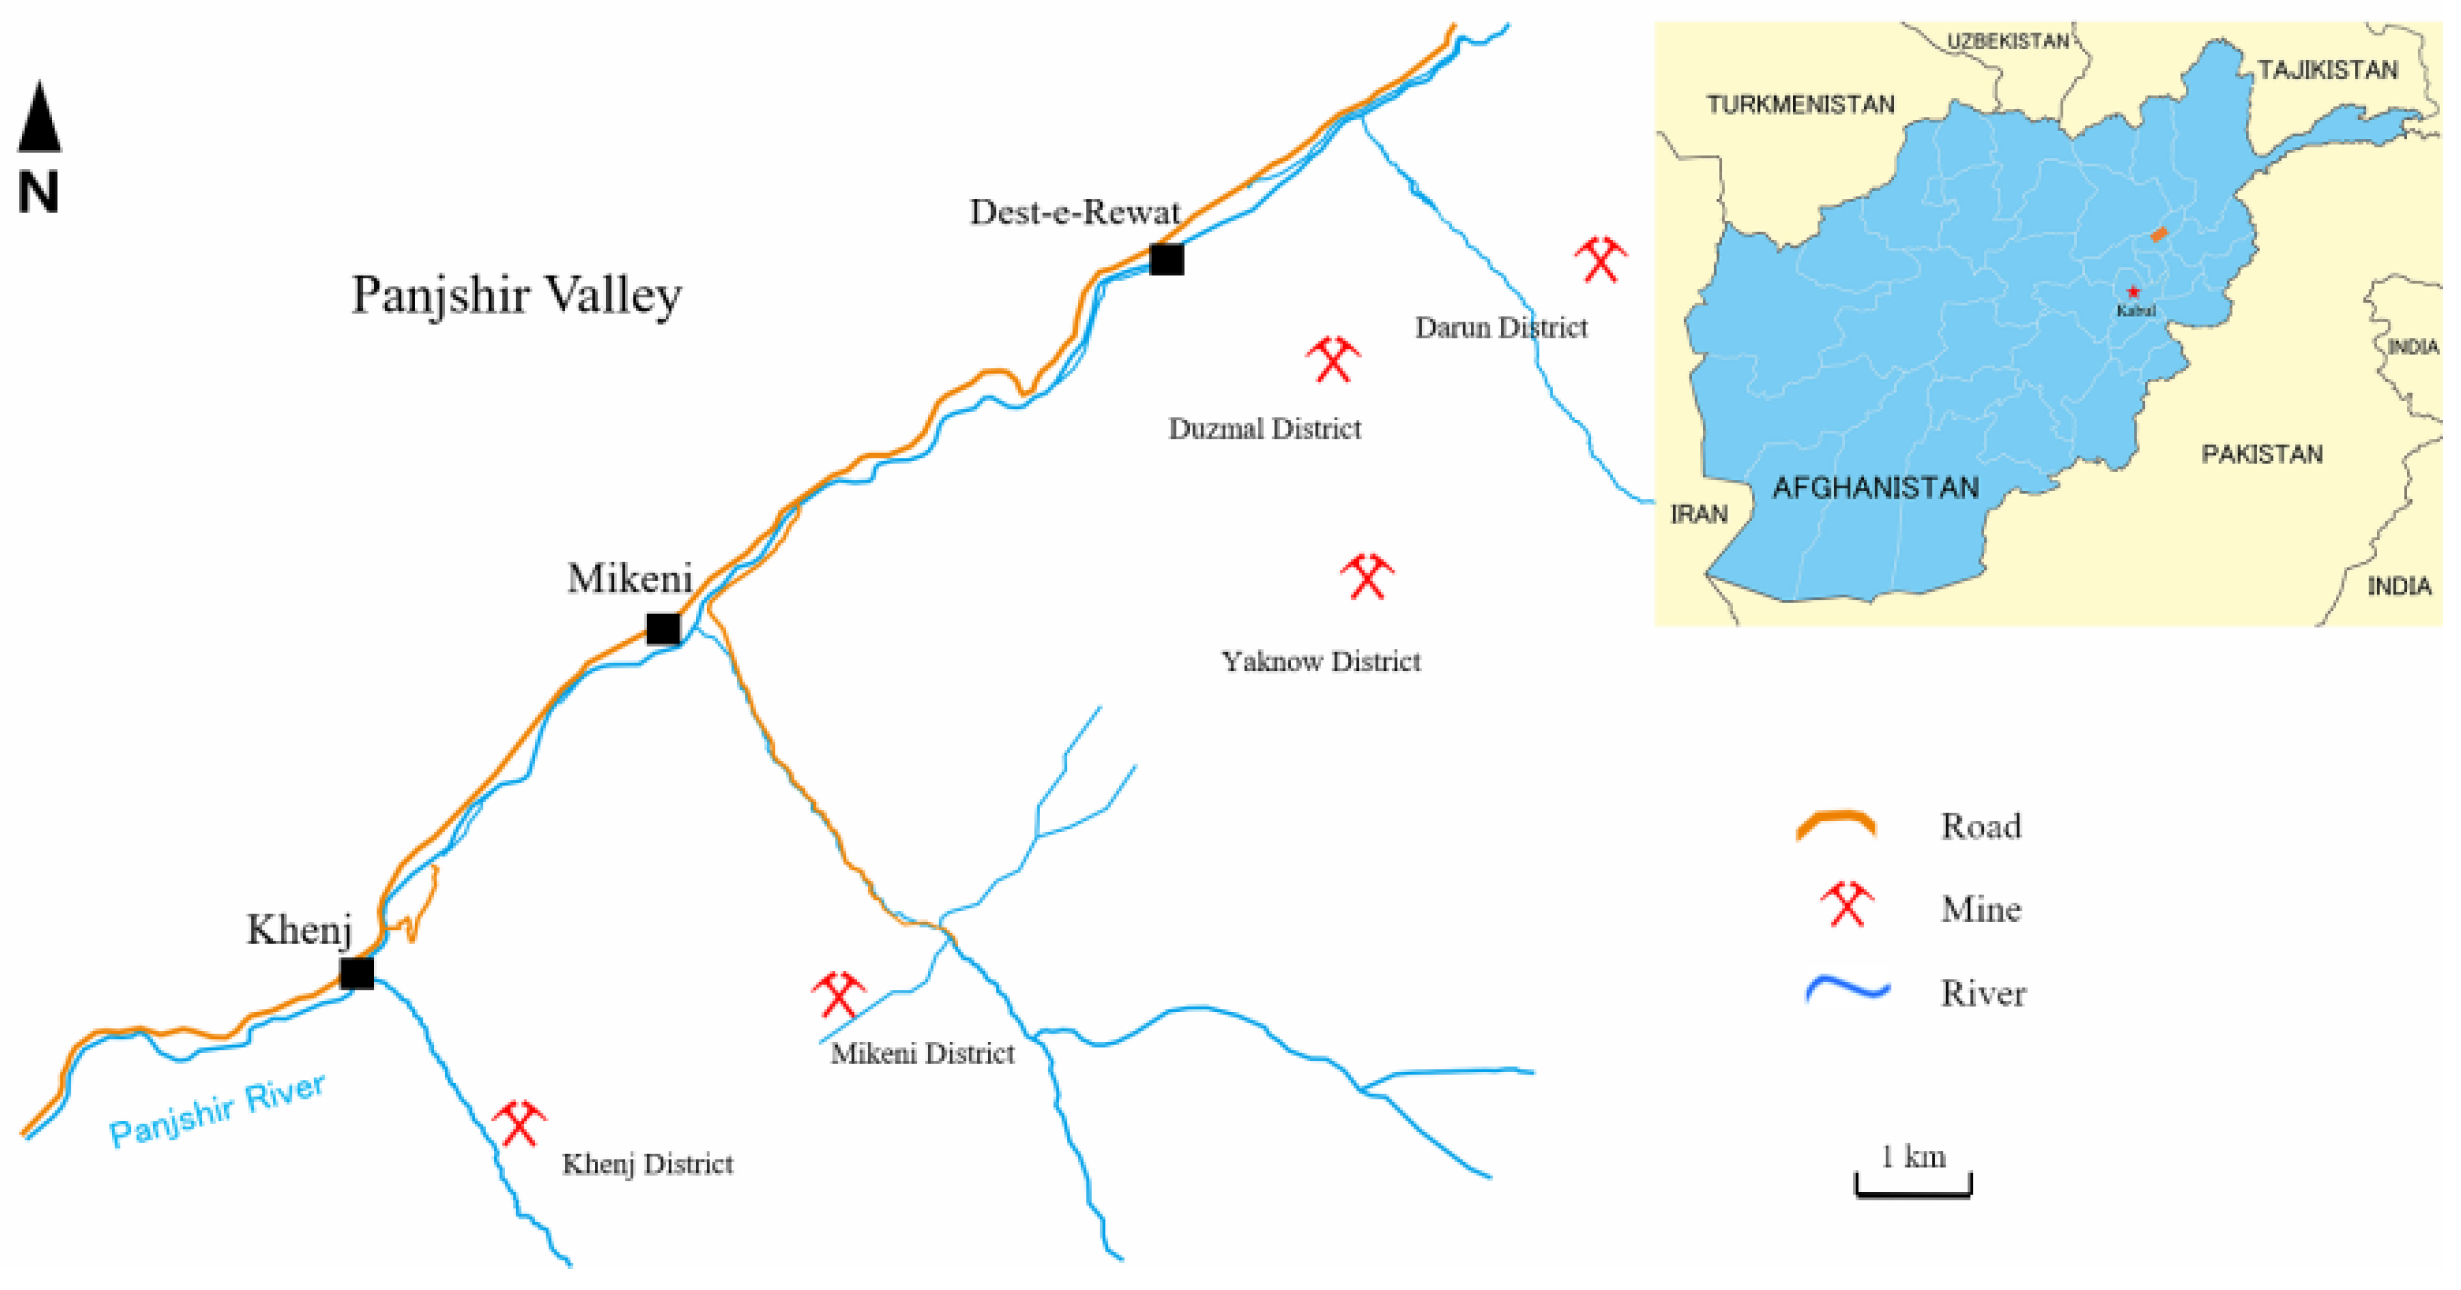
3. Geological Setting

The emerald mine in Panjshir Valley, Afghanistan, is located about 113 km northeast of Kabul [5], on a hillside southeast of Panjshir, at an elevation of about 3135 to 4270 m (Figure 2) [3]. The Panjshir Valley is a major fault zone between two crustal plates, the Paleo-Asian plate, and the Neo-Merian plate, which Rossovskiy and Konovalenko [17] suggest may be related to Himalayan orogenic events.
The Panjshir emerald deposit is located in the southeastern part of the Panjshir fracture zone, the veins cut through host rocks consisting of metamorphosed limestones, calcareous slates, phyllites, and micaceous schists of the Silurian-Devonian age [5]. The deposits have been affected by intense fracturing, fluid circulation, and hydrothermal alteration, resulting in intense albitization and muscovite-tourmaline replacements [18]. Emerald-bearing rocks throughout the Panjshir Valley are pervasively cut by hydrothermal veins. Emeralds fill veins along fissures; the vein body is mainly composed of quartz and albite; and the exposed thickness can be up to 15 cm. Emeralds are often associated with pyrite but are also found in phlogopite, tourmaline, and carbonate [18].
Fluid inclusions in the emeralds are highly saline, which suggests that the Panjshir deposits, like those in Colombia, are linked to hydrothermal fluids [19]. Giuliani et al. (2019) proposed a new classification of emerald deposits [18], where the emerald occurrences and deposits are classified into two main types: (Type I) tectonic magmatic-related and (Type II) tectonic metamorphic-related. Meanwhile, the Panjshir deposit was classified as Type IIC, associated with metamorphic hydrothermal rocks. Emerald formation is due to the reaction of Be hydrothermal fluids flowing along the veins and the enclosed host rocks with the Cr-rich rocks. The numerous intrusive rocks, including quartz prophyries, of eastern Panjshir would be good sources for the beryllium-bearing hydrothermal fluid. Some of the highest-quality material is found in veinlet networks that cut metasomatically altered gabbro and metadolomite; ultramafic rocks are ideal sources of chromium [3].

4. Materials and Methods

The 20 original emerald samples in this study were provided by Mr. Xiao, a gem dealer (Figure 3). All crystals are hexagonal columns, about 1 cm in length and weigh from 0.15 to 0.38 ct (Figure 3). All the crystals show traces of oil, which fluoresces blue-white under long-wavelength ultraviolet light (Figure 4). Sample A-1, where obvious color banding can be observed, was selected and made into double-sided parallel-polished slices (1 mm thick) with vertical optical axis to study the cause of color banding (Figure 5).
The refractive index and birefringence were determined by a gem refractometer (FGR-003A, FABLE, Shenzhen, China). The dichroism of gemstones was observed under dichroic mirror, and colors were photographed by using a polarizing microscope (FID-1, FABLE, Shenzhen, China). The reaction of the gem was tested under a Charles filter (FCF-25, FABLE, Shenzhen, China). The specific gravity was measured by using hydrostatic weighing method. The inclusions were observed and photographed using the M205A microscope system, with bright field illumination, optical fiber illumination, the ZEISS AXIO Imager, and M2m polarizing microscope, using a maximum magnification of 256x. Since the crystals are too small, UV fluorescence was measured with an ultraviolet lamp pen, and their reactions under a Charles filter were observed.
The contents of trace elements in the samples were determined by the laser ablation inductively coupled plasma-mass spectrometer (LA-ICP-MS), which is composed of the GeolasPro laser denudation system and Agilent 7700 inductively coupled plasma test system (Agilent, Singapore). The excimer laser was COMPexPro 102 ARF 193 nm, and the optical system was MicroLas. In the process of denudation, helium was used as carrier gas, argon was used as compensation gas to adjust the sensitivity, and the denudation system was equipped with signal smoothing device [20]. The laser beam spot and frequency were 44 μm and 5 HZ, respectively. BHVO-2G, BCR-2G, and BIR-1G were used to calibrate the element concentration without internal standard. Each time-resolved analysis data of LA-ICP-MS includes approximately 20–30 blank signals and 50 sample signals. The offline analysis and processing of data (including the selection of samples and blank signals, instrument sensitivity drift correction, and element content calculation) is completed by ICPMSDataCal software (version 12.2, developed by State Key Laboratory of Geological Processes and Mineral Resources, China University of Geosciences, Wuhan, China). Al was used as the normalized element, and NIST 610 glass was used for time drift correction. The standard for LA-ICP-MS measurements is that the calibration values of the monitored reference materials agree within the error range within the recommended values. Quality control deviations: Major elements within 5% uncertainty and trace elements within 10% uncertainty. Three sites were tested in the clean zoning of sample A-2 and A-20, five sites were tested in the color band region of sample A-1, and UV-Vis-NIR spectra were also tested.
FTIR spectra of transmission were acquired from 5000–2000 cm−1 and 9000–4000 cm−1 using a Vertex-80 spectrometer (BRUKER OPTICS, Billerica, MA, USA) with 4 cm−1 resolution and 32 scanning frequency. The information on the water vibration and other molecular vibrations of the emerald channels was preliminarily obtained. At the same time, the spectra of transmission of 2 emeralds from Davdar Township, Xinjiang, China, and 5 emeralds from Swat, Pakistan, were acquired from 9000–4000 cm−1 for comparative analysis.
UV-Vis-NIR spectra were acquired using the Jasco MSV-5200 micro spectrometer equipped with a microscope and Glan-Taylor polarization system in the 250–900 nm spectral range with a spectral bandwidth of 0.5 nm and a scan rate of 1000 nm/min. The normal and extraordinary spectra of sample A-1 at each point were measured.
Raman spectra were acquired using the LabRAM HR Evolution with 325 nm and 532 nm lasers for testing inclusions and channel water types. Channel water types were identified from the 3800–3500 cm−1 range with a 325 nm laser, 1800/mm grating, 5.5 cm−1 resolution, and a 15× lens. Inclusions were excited at 2000–100 cm−1 range with a 532 nm laser, 600 mm grating, 6.4 cm−1 resolution, and a 50× lens. The scanning time was 20 s. The Raman shift was calibrated with monocrystalline silicon (at 521 cm−1).

5. Results

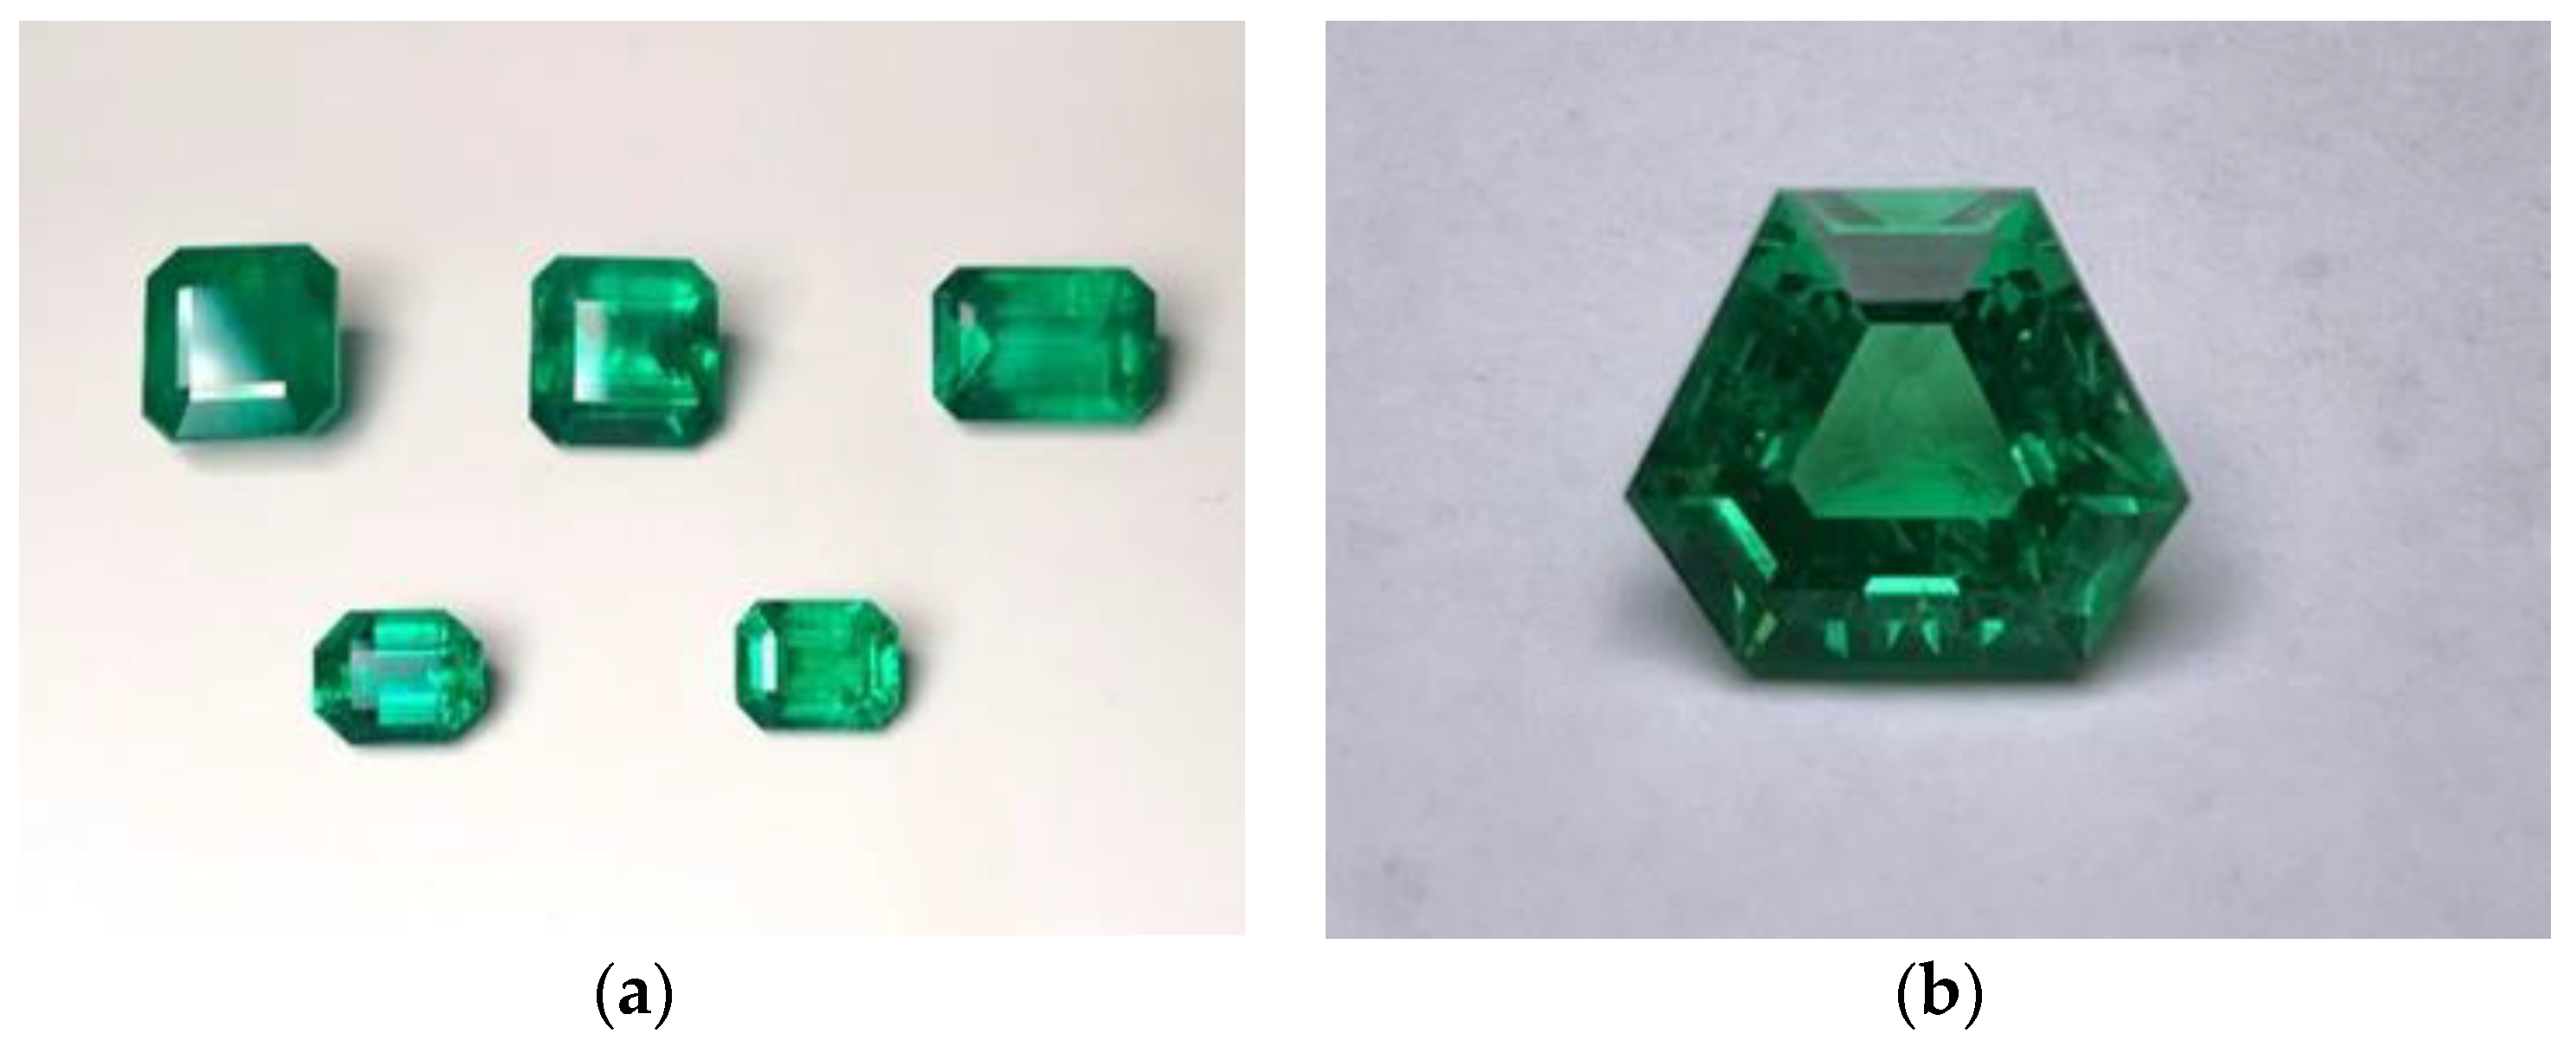
5.1. Gemological Properties

All 20 samples are blue-green in color, some crystals having distinct color bands, and the light hexagonal core and dark periphery are shown on the vertical c-axis (Figure 6). Most of the samples have fractures parallel to the c-axis, which were filled with colorless oil to mask the more obvious fractures. Most samples are transparent, with good hexagonal column habit, and some have the phenomenon of continuous growth.
The refractive index range was 1.575–1.580 under extraordinary-ray and 1.580–1.584 under ordinary-ray with a birefringence between 0.005 and 0.009. The variation range of specific gravity was 2.53–2.76. As the samples are less than 0.5 ct, there may be some errors in density measurement from using the hydrostatic weighing method. Some of the samples (A-2, A-4~A-6, A-12, and A-16) show a very faint red under the Charles filter. No fluorescence was observed under long-wave (365 nm) or short-wave (254 nm) ultraviolet light. Under the polarizing mirror, the samples can be seen as yellow-green in the vertical (perpendicular) c-axis and blue-green in the parallel c-axis. The gemological properties of emeralds from Panjshir Valley are summarized in Table 1.

5.2. Gemological Properties

Three-phase inclusions were the most common inclusions in emerald from this area, which contained three states: solid, liquid, and gas. The inclusions are tubular, needle-like, or fusiform, sometimes serrated and irregular (Figure 7b–d). The volume is usually tens to hundreds of microns long, and the width varies from a few microns to tens of microns. The bubbles are usually less than a quarter of the total volume of the inclusion and are circular, elliptical, or extruded because they are confined within the envelope (Figure 7a–d).
The most distinctive features of the three-phase inclusions in this origin emerald are the high number of solid crystals (Figure 7b,d), most of which are more than three and up to seven (Figure 7c). The size of the crystal varies with the shape of the inclusion: in long tubular inclusions, the crystal is the same width as the tube (Figure 7a–d); nevertheless, in serrated inclusions, the crystal is less than one-third the volume of the inclusion (Figure 7a,d). Most of the crystals are colorless lumps, and no results are obtained by Raman testing. According to the presence of cubic crystals, it is suggested that these inclusions may be NaCl [4]. Triangular growth characteristics parallel to the c-axis are found in sample A-1 (Figure 7e,f).

5.3. Chemical Composition Analysis

In Figure 8, the box diagram of trace element data of 20 emeralds from Panjshir Valley in Afghanistan were measured by LA-ICP-MS as part of a trace element analysis (Table 2). Figure 8 shows that the samples are rich in Mg (5154.67–11,610.89 ppm), with an average content of 7071.91 ppm; a small amount of P (47.37–273.85 ppm) has an average content of 157.88 ppm; a small amount of Sc (71.34–804.98 ppm) has an average content of 381.50 ppm; and Ga (15.34–34.95 ppm) has an average content of 27.22 ppm. The content of other trace elements, such as Ti, Mn, Ni, and Zn, are lower than 5 ppm. The alkali metal concentrations from the lowest to the highest are Rb 19.93–50.07 ppm (average 25.72 ppm), Cs 29.01–53.50 ppm (average 33.15 ppm), Li 74.83–131.01 ppm (average 84.14 ppm), K 194.96–1503.69 ppm (average 359.11 ppm), and Na 5586.07–11,219.99 ppm (average 7313.58 ppm). The total concentration of alkali metal elements ranges from 5904.80 to 12,958.26 ppm. The average is 7815.70 ppm.
In the emerald of the Panjshir Valley in Afghanistan, the content of transition metal elements is high, and Cr, V, and Fe may contribute to the color. Among them, Cr = 136.02–3896.84 ppm, with an average value of 1838.44 ppm; V = 275.03–1687.07 ppm, with an average value of 765.53 ppm; and Fe varied from 3173.22–15,030.29 ppm, with an average value of 4458.49 ppm. Cr/V range spans 0.3 to 3.7. Except for A-20, the content of Cr in all samples was higher than that of V.

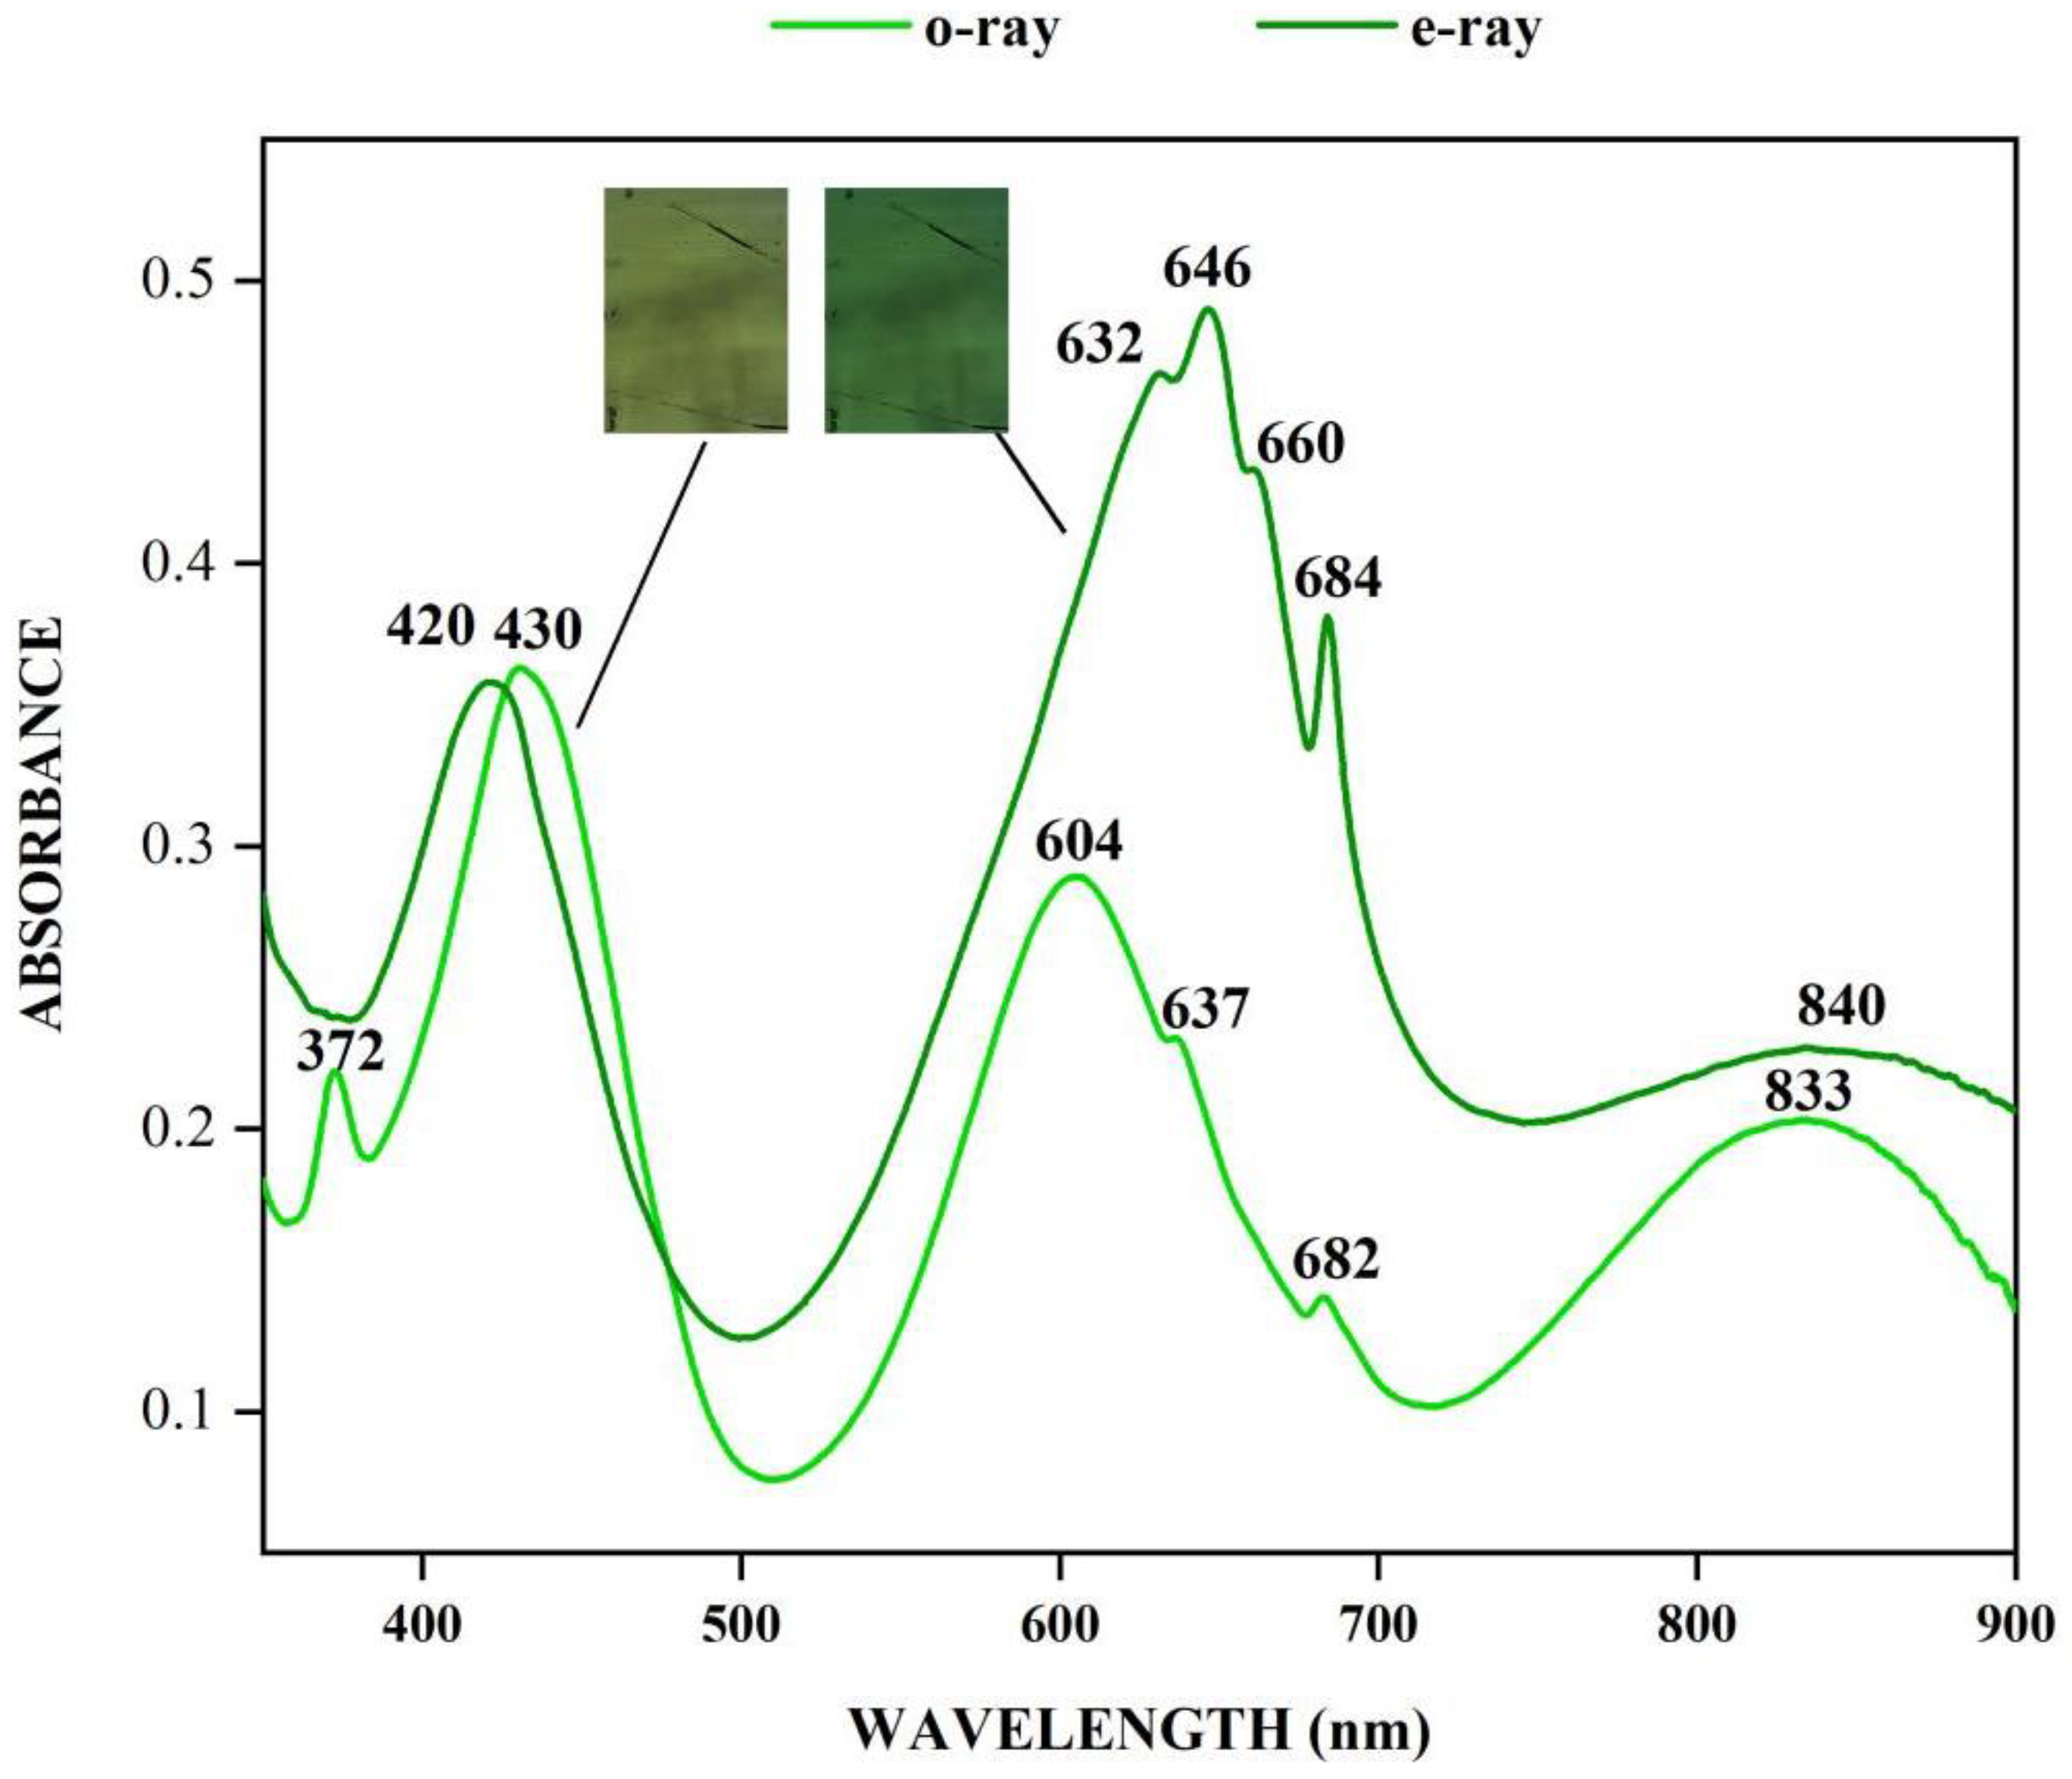
5.4. Ultraviolet Visible Near-Infrared Spectroscopy

Figure 9 showed the UV-Vis-NIR spectrum of sample A-1 with high Fe content, showing obvious absorption peaks of Fe2+, Fe3+, and Cr3+ (Figure 9). Under ordinary-ray, the spectrum has a wide absorption band of 430 and 604 nm; in extraordinary-ray, 420 and 632 nm wide absorption bands are displayed. George Bosshart (1991) believed that after the Cr and V spectra overlap, the positions of absorption bands will shift to each other’s peak positions and the slope of absorption peaks will become steeper. Therefore, the above absorption bands belong to the common absorption of V3+and Cr3+ [21]. The 637 and 682 nm absorption peaks displayed under ordinary-ray and 646, 660, and 684 nm absorption peaks displayed under extraordinary-ray belong to the Cr3+ absorption [22,23,24]. In sample A-1, Cr/V ≈ 1, and at Cr/V > 1, the V3+ absorption shoulder at 395 nm is not usually shown [3]. The sharp absorption peak at 370 nm displayed under ordinary-ray belongs to Fe3+, while this absorption peak is not displayed under extraordinary-ray. The medium absorption peak of 840 nm in extraordinary-ray and 833 nm in ordinary-ray is attributed to Fe2+ [25]. Most of the emeralds in Afghanistan showed obvious Fe absorption, and the absorption peak of Fe2+ under o-ray is steeper than that under e-ray, which is consistent with the higher Fe content.

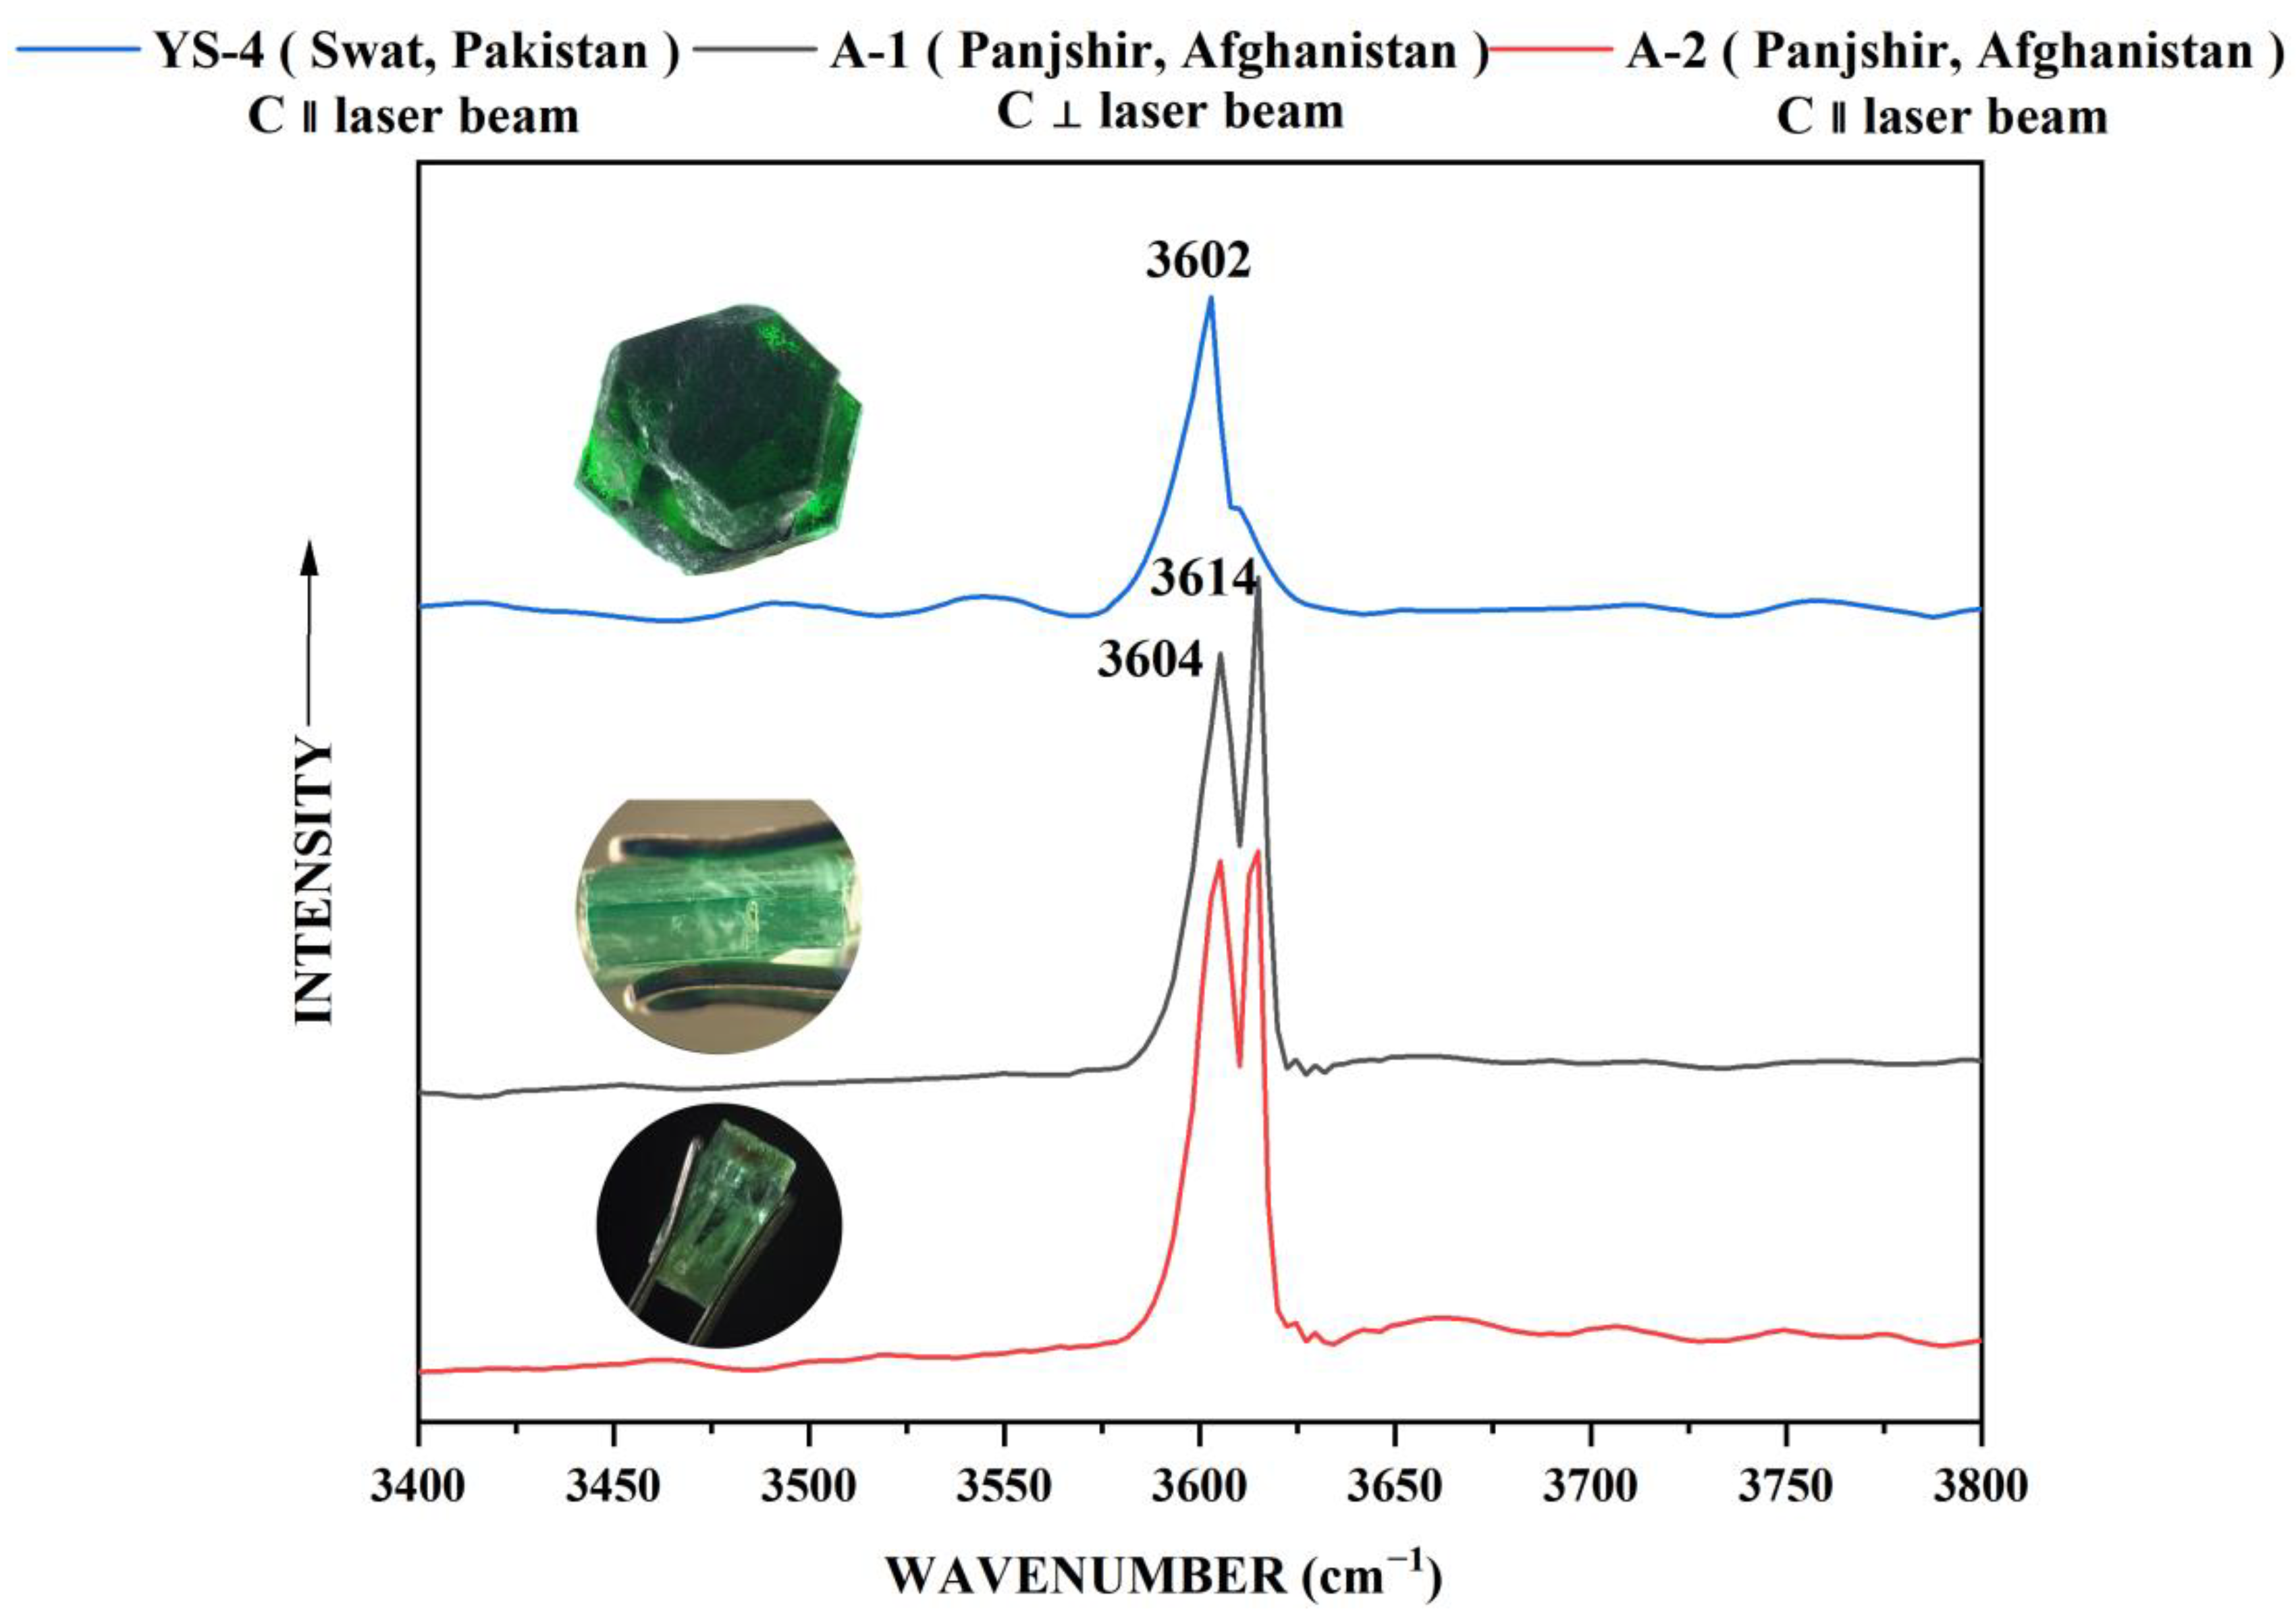
5.5. Infrared Spectrometry

The hexagonal ring structure of emerald leads to the existence of a structural channel parallel to the c-axis, in which alkali metal ions and water and other macromolecules exist to maintain the charge balance and structural stability of minerals. According to the different occupation directions and coexisting ion types of water molecules in the emerald channel, they can be divided into two types: type I water and type II water. The former axis of symmetry is perpendicular to the c-axis, showing mainly the characteristics of poor alkali, whereas the latter axis of symmetry is parallel to the c-axis, showing mainly the characteristics of rich alkali [24].
Figure 10 shows the IR spectra of Panjshir emeralds in the ranges of 5000–2000 cm−1 and 9000–4000 cm−1. The absorption peaks shown in the range of 5000–2000 cm−1 are related mainly to the stretching vibration of channel water, the vibration of chemical bonds formed between other alkali metal ions (such as K+, Na+, etc.) and water in the channel, and the vibration of CO2 molecules (Figure 10 left); the peak in the range of 4600–4000 cm−1 and the weak peak of 3110 cm−1 are attributed to the stretching vibration of M-OH. Meanwhile, the weak Na-H stretching vibration spectrum peak at 3164 cm−1 can be seen [22,26]. The spectrum peak in the range of 3900–3500 cm−1 belongs to the absorption of water in the emerald channels, and the weak absorption at 3521 cm−1 is the asymmetric stretching vibration of type I water. At the same time, owing to its fluorescence, the sample filled with colorless oil is obviously visible under the UV lamp pen, which belongs to the peak of organic matter in the range of 3000–2800 cm−1, and colorless oil peaks of 2812, 2852, 2923, and 2955 cm−1 can be found [27]. Spectral peaks of 2733 and 2669 cm−1 are related to the OD vibration of hydrogen isotope and oxygen atom. The higher strength of 3238 cm−1 is associated with the polymeric ion absorption of [Fe2(OH)4]2+, whereas 2474 cm−1 is associated with Cl, and 2356 cm−1 is related to CO2, which is sharp and weak.
In the near-infrared range of 9000–5000 cm−1, the absorption spectrum band of emerald is related mainly to the combined frequency and double-frequency vibration of structural water [28]. The right side of Figure 10 shows the near-infrared spectra of the parallel and vertical c-axis in the direction of optical vibration, separately. The sharp and strong spectral peaks of 7141 cm−1 and slightly weaker spectral peaks of 8700, 7274, and 6819 cm−1 of type I water can be observed [24,26]. The sharp and strong 5272 cm−1 is related to the cofrequency absorption of type I /II water, and the sharp bimodal of 7095, 7074 cm−1, and 5205 cm−1 are related to the double-frequency absorption of type II water [26].

5.6. Raman Spectroscopy

Figure 11 shows the Raman spectra of Afghanistan emeralds A-1 and A-2 and Pakistan emerald YS-4 in the range of 3500–3800 cm−1. According to Huong and Cui, the Raman peaks at 3598/3604 cm−1 were caused by type II water, and the Raman peaks at 3608/3614 cm−1 were caused by type I water [22,29,30,31]. The peak difference in the Raman shift that is used to characterize type I water and type II water in the literature is 6 cm−1, which should be caused by instrument calibration. As can be discovered from Figure 11, the emerald spectrum of Panjshir Valley in Afghanistan is dominated by type I water, which is consistent with the conclusion of the near-infrared region in the infrared spectrum. When compared to the Swat Valley emeralds in Pakistan, the latter showed peaks only in the 3602 cm−1 (type II water) band, yet the peaks of type I water are not obvious and could not be separated, because of instruments or conditions. However, the overall migration to type II water indicates that type II water is the dominant emerald in the Swat Valley of Pakistan, which is consistent with the NIR spectra and chemical composition analysis. As shown in Figure 11, the Raman shifts of samples YS-4, A-1, and A-2 are different, which may be caused by different crystal orientations during the test (the direction of the laser beam is parallel to the c-axis of sample YS-4 and perpendicular to the c-axis of samples A-1 and A-2).

6. Discussion

6.1. Chromogenic Cause of Panjshir Emerald

Figure 12 shows the variation of the content of the chromogenic elements Cr, V, and Fe contained in the different color bands in color-zoned sample A-1. From position 1 to 5, the color shades changed in line with the variation of Cr and V contents. In sample A-1, the concentrations of Cr2O3 and V2O3 are 0.02–0.23 wt% and 0.05–0.15 wt%, respectively. The darker green color at the edges is caused by higher levels of Cr and V. The UV-Vis-NIR spectra corresponding to the points analyzed for chemical composition indicated that the darker the color of the ribbon, the higher the content of Cr and V and the stronger their relative absorption (Figure 13). In addition, the spectrum also shows the absorption of Fe3+, but the variation of Fe content does not coincide with Cr and V, as seen in Figure 13, and the relative intensity of the absorption peak of Fe3+ at 370 nm is consistent in Figure 14.

6.2. The Relationship between the Type of Water and Its Related Alkali Metal Content

The thickness of samples A-20 and A-10 is about the same (about 6 mm), and YS-2 is thinner (about 2 mm). The thickness may have a certain impact on the absorption of the infrared projection spectrum. Figure 14 shows the infrared spectra of Panjshir emeralds A-10 and A-20 in the range of 9000–4000 cm−1 and emerald YS-2 from the Swat Valley, Pakistan. The double-peak splitting of 7095–7074 cm−1 is obvious in samples A-20 and A-10, but not in YS-2. Although the total alkali metal content in the A-20 and A-10 samples is different (the difference is 2000 ppm), the absorption peak position of the near-infrared spectrum is not different. It is speculated that the content difference is not large, the critical point for the difference of absorption peak is not reached, or the alkali metal does not completely exist in the emerald channels. The absorption peak at 7141 cm−1 is related to the stretching vibration caused by type I water molecules, and the peak at 7074 cm−1 is attributed to the stretching vibration of type II water molecules. A scatter plot is drawn with alkali metal content as the ordinate and I7141/I7074 as the abscissa to explore the relationship between alkali metal Na+K+Rb+Cs content in the infrared spectrum (Li usually exists in the tetrahedron in the way of replacing Be) and the channel’s water type (Figure 15). As shown in the Figure 15, the scatter plot of emerald data from three producing areas, namely 20 emerald crystals from the Panjshir Valley in Afghanistan, 2 emerald crystals from Xinjiang in China, and 5 emerald crystals from the Swat Valley in Pakistan, is negatively correlated, indicating that the content of type II water and alkali metal Na+K+Rb+Cs is positively correlated within a certain range and not linearly positively correlated, which is consistent with the assumption that alkali metals do not completely exist in the emerald channels.
According to [26], alkali metal ions enter the emerald structure channels by means of charge balance in an isomorphic substitution, which is mainly Al3+ = Mg2+ (Fe2+) + K+ (Na+). Additionally, the presence of alkali metals affects the O-H vibration of the water molecules in the channels, thus having a distinction between type I and type II water. Therefore, (Mg2++Fe2+) and (Na++K++Rb++Cs+); (Mg2++Fe2+) and I3598/I3608 or I3604/I3614; and (Na++K++Rb++Cs+) and I3598/I3608 or I3604/I3614 all have positive correlations within a certain range, as described above, the same as in the IR spectra. This is consistent with the results of Houng et al. (2010). As shown in Figure 16, the sum of alkali metal ions K and Na has a positive correlation with I3598/I3608 or I3604/I3614. The total alkali concentration of emeralds from the Panjshir Valley, Afghanistan, is lower than that of the Swat Valley, Pakistan, with a Raman spectral peak ratio around 1 (0.89–1.08); the Raman spectral peak ratio of emeralds from the Swat Valley, Pakistan, is significantly greater than 1 (≈3); and in Colombian emeralds, where the total alkali concentration is even lower, the Raman spectral peak ratio is less than 1. Therefore, as the alkali ion content increases, the proportion of type II water increases. In contrast, the alkali ion content is controlled by the Mg and Fe content of the host rock or mineralized fluid, which is more sensitive to the emerald-formation conditions [26] and can be used for origin tracing. At the same time, the formation of emeralds in a provenance is a dynamic process, its geographic environment will undergo various changes, and the elements contained in the mineralized fluid or host rock will change within a certain range during the dynamic process, which is the reason for the changes in emerald color, Raman spectral peak ratios, alkali metal content, and the ratio of type I and II water in a provenance.

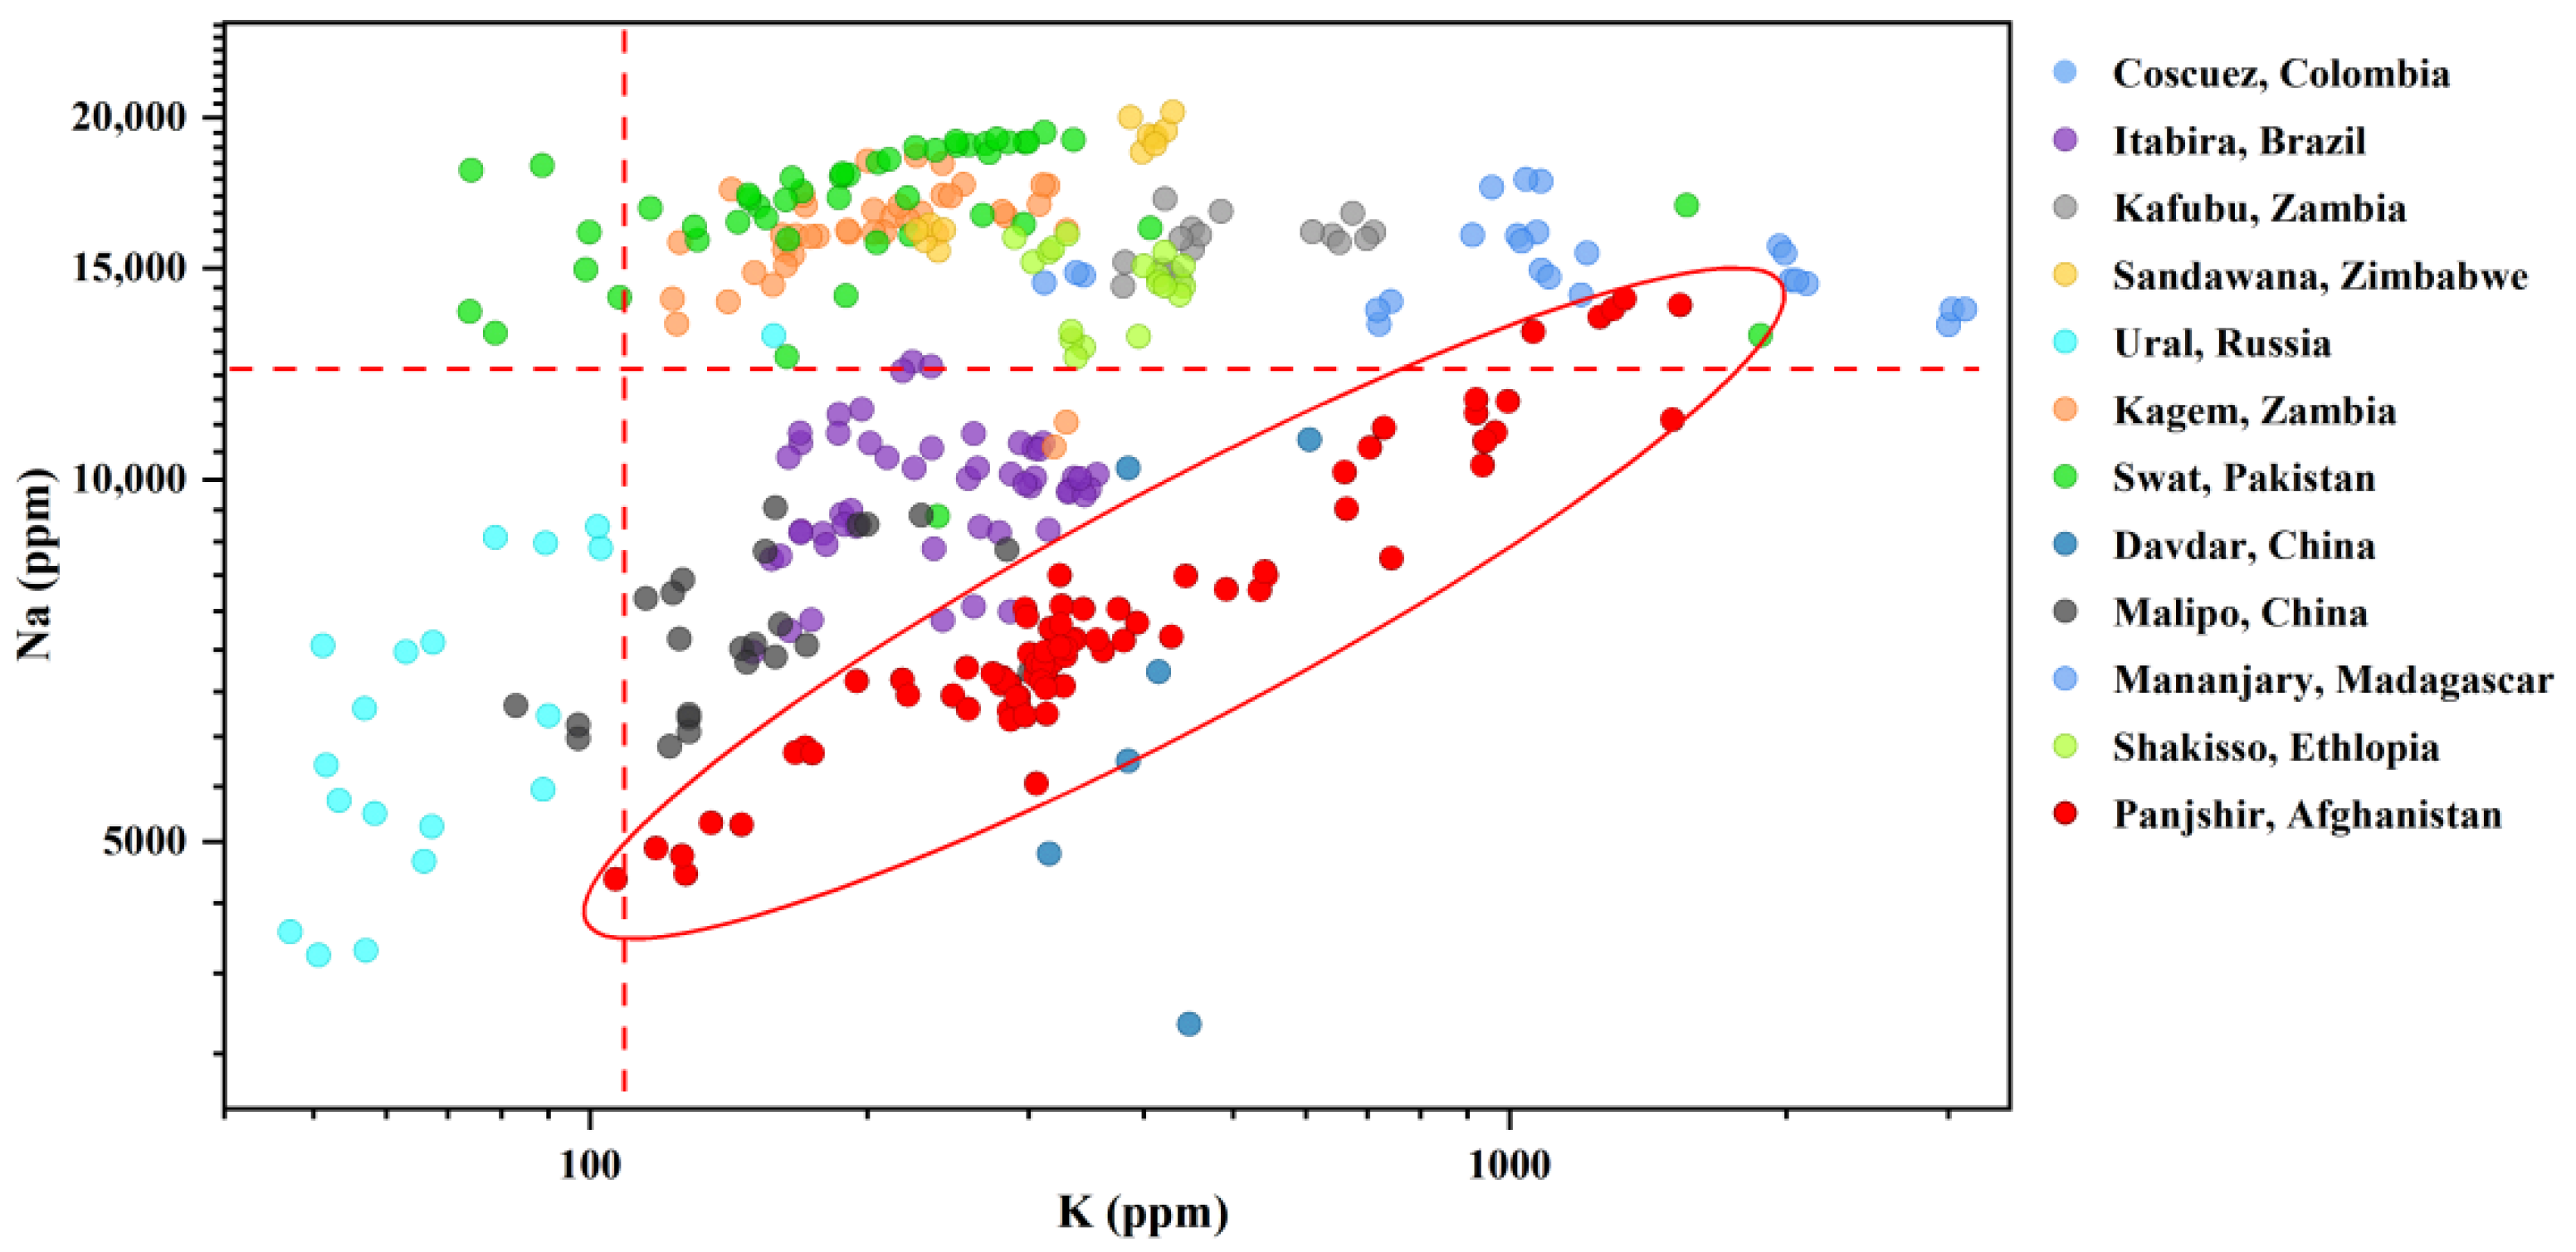
6.3. Origin Traceability Analysis

The identification of the origin of an emerald cannot be separated from the geological deposits of an emerald. Among all the classifications of emerald deposits, we quite agree with the view put forward by Giuliani et al. in 2019: the emerald can be divided into IA, IB, IC and IIA, IIB, and IID, according to the sedimentary type and host rock type [18,32]. According to their research, the emeralds in the Panjshir Valley in Afghanistan belong to class IIC, and the emeralds from Davdar deposit in China also belong to this class, which is the same as our conclusion. The chemical composition and inclusion composition of the emeralds from these two habitats are similar.
The element content of 20 emeralds in the Panjshir Valley, Afghanistan, measured in this study shows that compared with the research of Bowersox et al. in 1991 and 2015 [3,4], the content of elements Mg, Na, Fe, V, and Cr is relatively high, but it is consistent with the research of Saeseaw et al. in 2014 and 2019 [33,34], and the content of alkali metals in other previous research [33,34].
As mentioned above, the proportion of type II water increases with increasing alkali metal ion content in emeralds. Figure 17 shows that the 12 emerald deposits can be divided into two main categories, according to the total K and Na content.
(Type I) K + Na < 12,500 ppm: including Coscuez, Colombia; the Hill Valley and the Panjshir Valley, Afghanistan; Itabira, Brazil; Ural, Russia; Davdar Township, China; and Malipo, China.
(Type II) K + Na > 12,500 ppm: including Kafubu, Zambia; Kagem, Zambia; the Swat Valley, Pakistan; Mananjary, Madagascar; Shakisso, Ethiopia; and Sandawana, Zimbabwe.
In Type I, all deposits are associated with tectonic metamorphism, except for the Russian emerald deposits, and in Type II, all deposits are also associated with tectonic magma, except for the Pakistani emerald deposits (here cf Giuliani et al. 2019) [18]. Furthermore, as seen in Figure 14, emeralds from Panjshir, Afghanistan, are dominated by type I water, while emeralds from Swat, Pakistan, are dominated by type II water. Is Na + K = 12,500 ppm the cut-off value for the alkali metal content in the NIR spectrum of emeralds dominated by different types of water? This requires more analytical data. Could NIR spectra be used to determine the geographic origin of emeralds as well as UV-Vis spectra? Further research would be required.
Figure 18 shows a binary plot of K versus Na for the major emerald sources in the world. This plot allows the separation of Afghan emeralds from those from Zambia, Pakistan, Zimbabwe, and Ethiopia, because the former samples contain higher levels of sodium or potassium than the Afghan samples. The Russian emeralds can also be distinguished from the Afghan Panjshir emeralds thanks to their lower K content.
Figure 19 shows the distribution of Li and Cs in emeralds from the world’s major origins, from which emeralds can be distinguished from most of the world’s origins. For example, a part of the Colombian mines, because of their lower Li and Cs content than the Panjshir Valley emeralds’ content, while the Swat Valley in Pakistan and the Urals in Russia, Ethiopia, Sandawana, Madagascar, Zambia, and Malipo in China have higher Li and Cs content than that of the Panjshir Valley emeralds [23,33,34,35,36,37,38].
From the distribution maps of Na and Sc, among the provenances shown in Figure 20, the Panjshir Valley emerald from Afghanistan belongs to the medium-low Na and medium-high Sc, which can be distinguished from the Davdar Township emerald from China, but the sample data from Davdar Township, China, are too small to represent general conclusions. Meanwhile, the data for the Coscuez emerald from Colombia and the Panjshir emerald from Afghanistan overlap in this binary plot [34].
According to Figure 21, Rb and Ga can distinguish between the Colombian Coscuez and Afghan Panjshir Valley emeralds. In conclusion, it is possible to distinguish the emeralds of the Panjshir Valley in Afghanistan from those of most origins in the world by the content of the alkali metals Li, Na, K, Rb, and Cs, as well as Sc and Ga.
Krzemnicki et al. proposed a new type of emerald from Panjshir, Afghanistan, in 2021, but later, they assumed that this type of emerald might come from Musakashi, Zambia [40]. Both Hennebois et al. (2022) and Saeseaw et al. (2014, 2015) reported emeralds from this origin [33,41,42]. We compared our samples with those from Musakashi, Zambia, and believed that the Fe-K diagram can be used to distinguish emeralds from Panjshir, Afghanistan, and Musakashi, Zambia, which is consistent with the research conclusion of Saeseaw et al. in 2014. As shown in Figure 22, we can figure out that the emeralds we studied come from Panjshir Valley in Afghanistan rather than from Musakashi in Zambia.

7. Conclusions

Emeralds from the Panjshir Valley in Afghanistan differ slightly in gemological properties from those of other origins and can be distinguished and identified by their serrated, three-phase inclusions containing multiple crystals, type I water-dominated near-infrared spectral absorption, and medium to low Li and Cs, medium to high Sc, and medium to low Na. It is lighter in color, lower in alkali metals, and more complex in gas-liquid three-phase inclusions than the emeralds from the Swat Valley, Pakistan. The main chemical elements responsible for the color of Panjshir Valley emeralds are Cr3+, V3+, and Fe3+, where Cr and V are the most important ones. As a result of the low to moderate alkali metal content, the infrared spectrum indicates that it is a type I water-dominated emerald. In terms of inclusions characteristics, the Afghan Panjshir Valley emerald is similar to the Colombian emerald in that both contain jagged, three-phase inclusions, but the relatively high number of crystals that may be present in the inclusions and the relatively high alkali metal content can determine the origin of the emerald.

Author Contributions

Conceptualization, A.H.S., Q.C. and X.L.; Formal analysis, P.B.; Investigation, Y.L. and X.L.; Data curation, A.H.S. and R.G.; Writing—riginal draft, P.B. and X.L.; Writing—review & editing, Q.C., Y.B., X.G. and X.L.; Supervision, X.L. All authors have read and agreed to the published version of the manuscript.

Funding

The work has been funded by the Hubei Gem & Jewelry Engineering Technology Center (No. CIGTXM-03-202201 and No. CIGTXM-04-S202107), the Fundamental Research Funds for National University, China University of Geosciences (Wuhan) (No. CUGDCJJ202221), the Philosophy and Social Science Foundation of Hubei Province (No. 21G007), NSFC funding (No. 41874105), the Scientific Research Project of Shanghai Jianqiao University (No. 17001SJQ and No. BBYQ2104).

Acknowledgments

The publication of this article in the year 2022 marks the 30th anniversary of the Gemological Institute (Wuhan) and the 70th anniversary of the China University of Geosciences (Wuhan).

Conflicts of Interest

The authors declare no conflict of interest.

References

  1. Bariand, P.; Poullen, J.F. The pegmatites of Laghman, Nuristan, Afghanistan. Mineral. Rec. 1978, 9, 301–308. [Google Scholar]
  2. Neilson, J.B.; Cannon, P.J. Mineral Evaluation Project Afghanistan: Volume 2, Significant Mineral Occurrences; United Nations Development Programme: Toronto, ON, Canada, 1977. [Google Scholar]
  3. Bowersox, G.; Snee, L.W.; Foord, E.E.; Seal, R.R. Emeralds of the Panjshir Valley, Afghanistan. Gems Gemol. 1991, 27, 26–39. [Google Scholar] [CrossRef]
  4. Bowersox, G. The emerald mines of the Panjshir valley, Afghanistan. InColor 2015, 80–87. [Google Scholar]
  5. Bowersox, G.W. A Status Report on Gemstones from Afghanistan. Gems Gemol. 1985, 21, 192–204. [Google Scholar] [CrossRef] [Green Version]
  6. Giuliani, G.; France-Lanord, C.; Zimmermann, J.L.; Cheilletz, A.; Arboleda, C.; Charoy, B.; Coget, P.; Fontan, F.; Giard, D. Fluid Composition, δD of Channel H2O, and δ18O of Lattice Oxygen in Beryls: Genetic Implications for Brazilian, Colombian, and Afghanistani Emerald Deposits. Int. Geol. Rev. 2010, 39, 400–424. [Google Scholar] [CrossRef]
  7. Sinkankas, J. Emerald and Other Beryls; Chilton Book, Co.: Radnor, PA, USA, 1981. [Google Scholar]
  8. Forestier, F.H.; Piat, D.H. Emeraudes de Bactriane: Mythe ou réalité, La vallée du Panjshir (Afghanistan). In L’émeraude Connaissances Actuelles et Prospectives; Giard, D., Giuliani, G., Cheilletz, A., Fritsch, E., Gonthier, E., Eds.; Association Française de Gemmologie: Paris, French, 1998. [Google Scholar]
  9. Giuliani, G.; Chaussidon, M.; Schubnel, H.J.; Piat, D.H.; Rollion-Bard, C.; France-Lanord, C.; Giard, D.; de Narvaez, D.; Rondeau, B. Oxygen isotopes and emerald trade routes since antiquity. Science 2000, 287, 631–633. [Google Scholar] [CrossRef] [Green Version]
  10. Krzemnicki, M.S.; Wang, H.A.O.; Buche, S. A New Type of Emerald from Afghanistan’s Panjshir Valley. J. Gemmol. 2021, 37, 474–495. [Google Scholar] [CrossRef]
  11. Hayden, H.H. Notes on the Geology of Chitral, Gilgit, and the Pamirs. Rec. Geol. Surv. India 1916, 45, 271–335. [Google Scholar]
  12. Bordet, P.; Boutiere, A. Reconnaissance geologique dans I’Hindou Kouch oriental (Badakhchan, Afghanistan). Bull. De La Soc. De Geol. 1968, 10, 486–496. [Google Scholar] [CrossRef]
  13. Rossovskiy, L.N.; Chmyrev, V.M.; Salakh, A.S. New fields and belts of rare-metal pegmatites in the Hindu Kush (Eastern Afghanistan). Int. Geol. Rev. 2009, 18, 1339–1342. [Google Scholar] [CrossRef]
  14. Rossovskiy, L.N. Rare-metal pegmatites with precious stones and conditions of their formation (Hindu Kush). Int. Geol. Rev. 2010, 23, 1312–1320. [Google Scholar] [CrossRef]
  15. Krzemnicki, M.S. New Emerald from Afghanistan. SSEF Facet. 2018, 24, 12–13. [Google Scholar]
  16. Hsu, T.; Lucas, A. Tucson 2016. Gems Gemol. 2016, 52, 82–102. [Google Scholar]
  17. Rossovskiy, L.N.; Konovalenko, S.I. South Asian pegmatite belt. Akad. Nauk SSSR Dokl. Earth Sci. Sect. 1976, 229, 89–91. [Google Scholar]
  18. Giuliani, G.; Groat, L.A.; Marshall, D.; Fallick, A.E.; Branquet, Y. Emerald Deposits: A Review and Enhanced Classification. Minerals 2019, 9, 105. [Google Scholar] [CrossRef] [Green Version]
  19. Giuliani, G.; Schwarz, D.T. Emerald Deposits- A Review. Aust. Gemmol. 2001, 21, 17–23. [Google Scholar]
  20. Zong, K.; Klemd, R.; Yuan, Y.; He, Z.; Guo, J.; Shi, X.; Liu, Y.; Hu, Z.; Zhang, Z. The assembly of Rodinia: The correlation of early Neoproterozoic (ca. 900 Ma) high-grade metamorphism and continental arc formation in the southern Beishan Orogen, southern Central Asian Orogenic Belt (CAOB). Precambrian Res. 2017, 290, 32–48. [Google Scholar] [CrossRef]
  21. Bosshart, G. Emeralds from Colombia (Part 2). J. Gemmol. 1991, 22, 409–426. [Google Scholar] [CrossRef]
  22. Cui, D.; Liao, Z.; Qi, L.; Zhong, Q.; Zhou, Z. A Study of Emeralds from Davdar, North-Western China. J. Gemmol. 2020, 37, 374–392. [Google Scholar] [CrossRef]
  23. Hu, Y.; Lu, R. Unique Vanadium-Rich Emerald from Malipo, China. Gems Gemol. 2019, 55, 338–352. [Google Scholar] [CrossRef]
  24. Wood, D.L.; Nassau, K. Infrared Spectra of Foreign Molecules in Beryl. J. Chem. Phys. 1967, 47, 2220–2228. [Google Scholar] [CrossRef]
  25. Guo, H.; Yu, X.; Zheng, Y.; Sun, Z.; Ng, M.F.-Y. Inclusion and Trace Element Characteristics of Emeralds from Swat Valley, Pakistan. Gems Gemol. 2020, 56, 336–355. [Google Scholar] [CrossRef]
  26. Qiao, X.; Zhou, Z.; Schwarz, D.T.; Qi, L.; Gao, J.; Nong, P.; Lai, M.; Guo, K.; Li, Y. Study of the Differences in Infrared Spectra of Emerald from Different Mining Areas and the Controlling Factors. Can. Mineral. 2019, 57, 65–79. [Google Scholar] [CrossRef]
  27. Mashkovtsev, R.I.; Thomas, V.G.; Fursenko, D.A.; Zhukova, E.S.; Uskov, V.V.; Gorshunov, B.P. FTIR spectroscopy of D2O and HDO molecules in thec-axis channels of synthetic beryl. Am. Mineral. 2016, 101, 175–180. [Google Scholar] [CrossRef]
  28. Qiao, X.; Zhou, Z.; Nong, P.; Lai, M. Study on the Infrared Spectral Characteristics of H2O I-type Emerald and the Chontrolling Factors. Rock Miner. Anal. 2019, 38, 169–178. [Google Scholar]
  29. Huong, L.T.-T.; Häger, T.; Hofmeister, W. Confocal Micro-Raman Spectroscopy: A Powerful Tool to Identify Natural and Synthetic Emeralds. Gems Gemol. 2010, 46, 36–41. [Google Scholar] [CrossRef] [Green Version]
  30. Bersani, D.; Azzi, G.; Lambruschi, E.; Barone, G.; Mazzoleni, P.; Raneri, S.; Longobardo, U.; Lottici, P.P. Characterization of emeralds by micro-Raman spectroscopy. J. Raman Spectrosc. 2014, 45, 1293–1300. [Google Scholar] [CrossRef]
  31. Moroz, I.; Roth, M.; Boudeulle, M.; Panczer, G. Raman microspectroscopy and fluorescence of emeralds from various deposits. J. Raman Spectrosc. 2000, 31, 485–490. [Google Scholar] [CrossRef]
  32. Alonso-Perez, R.; Day, J.M.D. Rare Earth Element and Incompatible Trace Element Abundances in Emeralds Reveal Their Formation Environments. Minerals 2021, 11, 513. [Google Scholar] [CrossRef]
  33. Saeseaw, S.; Pardieu, V.; Sangsawong, S. Three-Phase Inclusions in Emerald and Their Impact on Origin Determination. Gems Gemol. 2014, 50, 114–132. [Google Scholar] [CrossRef] [Green Version]
  34. Saeseaw, S.; Renfro, N.D.; Palke, A.C.; Sun, Z.; McClure, S.F. Geographic Origin Determination of Emerald. Gems Gemol. 2019, 55, 614–646. [Google Scholar] [CrossRef] [Green Version]
  35. Aurisicchio, C.; Conte, A.M.; Medeghini, L.; Ottolini, L.; Vito, C.D. Major and trace element geochemistry of emerald from several deposits: Implications for genetic models and classification schemes. Ore Geol. Rev. 2018, 94, 351–366. [Google Scholar] [CrossRef]
  36. Groat, L.A.; Giuliani, G.; Marshall, D.D.; Turner, D. Emerald deposits and occurrences: A review. Ore Geol. Rev. 2008, 34, 87–112. [Google Scholar] [CrossRef]
  37. Groat, L.A.; Giuliani, G.; Stone-Sundberg, J.; Sun, Z.; Renfro, N.D.; Palke, A.C. A Review of Analytical Methods Used in Geographic Origin Determination of Gemstones. Gems Gemol. 2019, 55, 512–535. [Google Scholar] [CrossRef] [Green Version]
  38. Karampelas, S.; Al-Shaybani, B.; Mohamed, F.; Sangsawong, S.; Al-Alawi, A. Emeralds from the Most Important Occurrences: Chemical and Spectroscopic Data. Minerals 2019, 9, 561. [Google Scholar] [CrossRef] [Green Version]
  39. Hu, Y.; Lu, R. Color Characteristics of Blue to Yellow Beryl from Multiple Origins. Gems Gemol. 2020, 56, 54–65. [Google Scholar] [CrossRef]
  40. Krezemnicki, M.S. New Emeralds from Musakashi, Zambia, Appear on the Market. J. Gemmol. 2021, 37, 769–771. [Google Scholar] [CrossRef]
  41. Pardieu, V.; Detroyat, S.; Sangsawong, S.; Saeseau, S. Tracking emeralds from the Musakashi area of Zambia. InColor 2015, 29, 18–25. [Google Scholar]
  42. Henneebois, U.; Karampelas, S.; Delaunay, A. Caractéristiques des émraudes de Musakashi, Zambie. Revue De Gemmol. A. F. G. 2022, 216, 15–17. [Google Scholar]
Figure 1. High-quality emeralds. In the left photo (a), the weight from left to right and from top to bottom is 9.85, 8.18, 7.61, 2.39, and 2.58 ct, respectively. In the right picture (b), the weight of emerald is 3.27 ct. Photos by Peijin Bao.
Minerals 13 00063 g001
Figure 2. Location of the Panjshir Valley and mining areas related to emeralds. Picture: Ran Gao, Peijin Bao, modified from [3].
Minerals 13 00063 g002
Figure 3. Emerald samples from Panjshir Valley, Afghanistan. Most of the crystals are hexagonal columnar and 1 cm high, and the weight range is 0.15 to 0.38 ct. Photo by Peijin Bao.
Minerals 13 00063 g003
Figure 4. Left (a): oil-filled sample A-2; right (b): sample A-2 fluoresces blue-white under long-wavelength ultraviolet light. Photos by Peijin Bao.
Minerals 13 00063 g004
Figure 5. The Panjshir emeralds with color bands show a light blue-green core and green edges in a direction perpendicular to the c-axis. LA-ICP-MS and UV-Vis-NIR measurements were performed at five locations. Photo by Peijin Bao.
Minerals 13 00063 g005
Figure 6. Vertical c-axis sample A-1 shows light hexagonal core and dark periphery. Photo by Peijin Bao.
Minerals 13 00063 g006
Figure 7. Three-phase inclusions of various shapes in Panjshir emeralds. (a) Tubular three-phase inclusions; (b,c) needle-like three-phase inclusions containing bubbles and more than four crystals; (d) a serrated three-phase inclusion containing a circular bubble and a plurality of cubic crystals; (e,f) triangular growth characteristics. Photos by Peijin Bao.
Minerals 13 00063 g007aMinerals 13 00063 g007b
Figure 8. Box chart of trace elements in emeralds from the Panjshir Valley.
Minerals 13 00063 g008
Figure 9. UV-Vis-NIR spectra of sample A-1. It showed obvious Cr3+ absorption (646, 660, and 684 nm under ordinary-ray; 637 and 682 nm under extraordinary-ray), moderate Fe2+ absorption (830 nm under ordinary-ray), and moderate Fe3+ absorption (372 nm under ordinary-ray).
Minerals 13 00063 g009
Figure 10. Infrared spectrum of sample A-1. The spectral range is 5000–2000 cm−1 (a) and 9000–4000 cm−1 (b). Spectra in (b) are vertically offset for clarity.
Minerals 13 00063 g010
Figure 11. Raman spectra of samples A-1, A-2, and YS-4. Samples from different occurrences show Raman peaks for different types of water: 3602cm−1 of YS-4 corresponds to 3598/3604 cm−1, which characterize type II water; 3604 cm−1 of A-1 and A-2 corresponds to 3598/3604 cm−1, which characterize type II water; and 3614 cm−1 corresponds to 3608/3614 cm−1, which characterize type I water. Spectra are vertically offset for clarity.
Minerals 13 00063 g011
Figure 12. The chemical composition data of sample A-1 shows the change trend of the content of chromogenic ions Cr, V, and Fe with the color band.
Minerals 13 00063 g012
Figure 13. Ultraviolet visible spectrum of sample A-1 shows the changing trend of spectral absorption with color band. Spectra are vertically offset for clarity.
Minerals 13 00063 g013
Figure 14. The infrared spectra of Panjshir emeralds and Swat emeralds show the absorption of different types of water. Spectra are vertically offset for clarity.
Minerals 13 00063 g014
Figure 15. The relationship between the proportion of two water types in the infrared spectra of Panjshir, Swat, and Davdar emeralds and the content of alkali metal Na+K+Rb+Cs. The relative peak height ratio between 7141 and 7074 cm−1 is related to the type of water.
Minerals 13 00063 g015
Figure 16. This figure shows the relationship between the content of Na2O+K2O in emeralds from different regions and the intensity ratio of Raman peaks, representing different water types. The spectral peaks of 3598 cm−1 (or 3604 cm−1) and 3608 cm−1 (or 3614 cm−1) are related to type II water and type I water, respectively. Data source [22,29].
Minerals 13 00063 g016
Figure 17. Box diagram of total K and Na contents of emeralds from different occurrences. 1 = Coscuez, Colombia; 2 = Panjshir, Afghanistan; 3 = Itabira, Brazil; 4 = Kafubu, Zambia; 5 = Ural, Russia; 6 = Kagem, Zambia; 7 = Swat, Pakistan; 8 = Davdar, China; 9 = Malipo, China; 10 = Mananjary, Madagascar; 11 = Shakisso, Ethiopia; and 12 = Sandawana, Zimbabwe.
Minerals 13 00063 g017
Figure 18. The log binary graph of K and Na shows that it can distinguish Panjshir emeralds from Kagem emeralds in Zambia, Sandawana emeralds in Zimbabwe, Shakisso emeralds in Ethiopia, Kafubu emeralds in Zambia, and Ural emeralds in Russia. Data source: [33,34,35,36,37,38,39].
Minerals 13 00063 g018
Figure 19. The log binary graph of Li and Cs shows that Panjshir emeralds are similar to Davdar emeralds and Coscuez emeralds in this data. Data source: [33,34,35,36,37,38,39].
Minerals 13 00063 g019
Figure 20. The log binary graph of Na and Sc shows that Panjshir emeralds are similar to Coscuez emeralds and Malipo emeralds in this data. Data source: [23,33].
Minerals 13 00063 g020
Figure 21. The log binary graph of Rb and Ga shows that Panjshir emerald and Coscuez emerald are not similar in this data and can be distinguished. Data source: [33].
Minerals 13 00063 g021
Figure 22. The log binary graph of Fe and K shows that Panjshir emeralds and Kusakashi emeralds are quite different and can be distinguished. Data source: [33,41].
Minerals 13 00063 g022
Table 1. Gemological properties of emeralds from Panjshir Valley, Afghanistan.
ColorMedium bluish green to green
ClaritySlightly to heavily included
Refractive indicesno = 1.580–1.584; ne = 1.575–1.580
Birefringence0.005–0.009
Specific gravity2.47–2.89
PleochroismMedium yellowish green (o-ray) and greenish blue (e-ray)
FluorescenceInert to long-wave and short-wave UV radiation
Chelsea filterSlightly red or no reaction
Internal features
  • • Obvious colorless oil filling
  • • Obvious color bands
  • • Yellow matter seeping along the cracks
  • • Three-phase inclusions contained liquid, gas, and many solids; displayed tubular, needle-like, or fusiform; and were sometimes serrated and irregular
Table 2. LA-ICP-MS of samples in ppm.
SamplesElementMin–MaxAverage (SD)MedianLOD
Panjshir emeralds
20 samples
64 analyses
Li74.83~131.0186.14 (8.84)85.241.32~2.67
Na5586.07~11,615.127313.58 (1072.42)7245.9524.16~67.97
Mg5154.67~11,610.897071.91 (1010.51)6991.720.70~7.17
K194.96~1503.69159.11 (208.65)316.7823.16~37.41
Sc71.34~804.98381.50 (108.15)387.750.30~1.19
Ti1.52~14.725.95 (1.30)5.732.81~3.90
V275.03~1687.07765.53 (157.13)764.500.17~0.82
Cr136.02~3896.891838.44 (655.50)1866.087.06~21.71
Mn2.91~69.7613.78 (23.15)3.112.59~6.64
Fe3173.22~15,030.294458.49 (1704.49)4337.5038.05~80.04
Nibdlbdlbdl4.20~12.75
Zn1.31~3.823.22 (1.78)3.221.22~6.09
Ga15.34~34.9524.70 (2.82)24.580.31~2.05
Rb19.93~50.0725.72 (7.43)24.081.32~3.09
Cs29.01~54.9433.15 (4.70)32.260.74~2.01
SD = standard deviations; LOD = limit of detection; bdl = below detection limit.
Disclaimer/Publisher’s Note: The statements, opinions and data contained in all publications are solely those of the individual author(s) and contributor(s) and not of MDPI and/or the editor(s). MDPI and/or the editor(s) disclaim responsibility for any injury to people or property resulting from any ideas, methods, instructions or products referred to in the content.

