Article

Controls on Mg/Ca Ratios in Recent Stromatolites: Insights from Fluvial Systems in the Iberian Range (Spain)

1
Departamento de Ciencias de la Tierra, Universidad de Zaragoza, Pedro Cerbuna 12, 50009 Zaragoza, Spain
2
Institute for Research on Environmental Sciences of Aragón (IUCA) and Geotransfer Group, University of Zaragoza, 50009 Zaragoza, Spain
3
Division for Marine and Environmental Research, Ruder Bošković Institute, 10000 Zagreb, Croatia
4
Department of Environmental Sciences, Jožef Stefan Institute, Jamova cesta 39, 1000 Ljubljana, Slovenia
*
Author to whom correspondence should be addressed.
Deceased.
Minerals 2023, 13(1), 57; https://doi.org/10.3390/min13010057
Submission received: 30 November 2022 / Revised: 22 December 2022 / Accepted: 25 December 2022 / Published: 29 December 2022
(This article belongs to the Special Issue Geochemistry of Travertines and Calcareous Tufas)

Abstract

:
The utility of the Mg/Ca elemental ratio of calcite ((Mg/Ca)calcite) as a temperature indicator in continental carbonate deposits is a matter of debate due to the different results obtained by diverse authors. In this study, we aimed to test the reliability of the (Mg/Ca)calcite in fluvial carbonates. We selected the recent tufa stromatolite records of four rivers on the Iberian Peninsula for the trace element analysis based on six-monthly sampling. Previous sedimentary and hydrological studies on these fluvial basins provided the information for this work. The water temperature estimates for the stromatolite (Mg/Ca)calcite substantially differed from the measured water temperatures in most of the studied cases. We thus assessed other factors that participate in the control of the Mg partitioning between water and calcite. The correction of the detrital Mg content yielded water temperatures that matched the measured ones in one of the rivers. The (Mg/Ca)water, water discharge and calcite precipitation rates may also occasionally influence the (Mg/Ca)calcite. The six-month behaviour of some of these parameters could interfere with the relationship between the (Mg/Ca)calcite and water temperature. According to these results, and their comparison with other non-marine carbonates, the wide variety of parameters that are involved in the (Mg/Ca)calcite limit it as a geochemical thermometer in continental sedimentary environments.

1. Introduction

The use of trace elements in carbonate deposits as climate proxies has been a matter of debate for a long time. In the case of the Mg/Ca ratio in sedimentary nonmarine carbonates, we lack a consensus on its application to the geological record to obtain temperature data because of the varied and usually negative or inconclusive results that researchers have obtained in several studies [1,2,3,4,5,6,7,8]. One important problem is the presence of Mg-bearing clay minerals and other detrital particles (e.g., carbonates) that can be present in small amounts in the carbonate deposits, which is added, in the sample analysis, to the Mg incorporated in the calcite lattice (e.g., [6]) and produce misleading temperature results for the calcite precipitation. The estimation of the contribution of allochthonous Mg to the total amount of Mg in the rock is not straightforward and requires meticulous mineralogical analysis [1]. Moreover, the influence of the biological activity on the Mg partitioning [4,7,8], or the changes in the Mg/Ca ratios of the water that are not related to temperature [2,3], could affect the Mg/Ca ratios in fluvial carbonate deposits. These inconsistencies could be the result of the complex hydrology in carbonate aquifers, the seasonal patterns of the water recharge in some karst systems (e.g., [5]), prior calcite precipitation within the aquifer (e.g., [9]) or the anthropogenic contamination of the water (e.g., [3]). In some cases, the causes of the Mg/Ca variations in water and minerals over time cannot be depicted (e.g., [2]). The use of the isotope compositions of trace metals that coprecipitate with calcite (Mg, U) as a prospective method for estimating the sources of Mg in authigenic carbonates ([10,11,12] and the references therein) might be an additional way to clarify the sometimes-puzzling Mg/Ca variations in some tufa-precipitating systems.
In this work, we compared the recent fluvial stromatolite records from four river basins in the Iberian Range, Spain. The four basins have similar Mediterranean continental climate conditions. However, the deposition rates, stable isotope composition of the water and carbonate deposits formed in each case are noticeably different. The available data on the depositional rates and isotopic, hydrochemical and climatic parameters for each basin taken every six months, over a period from 3 to 13 years, as well as the corresponding recent stromatolite records, offer an excellent opportunity to decipher whether—or under which conditions—geochemical proxies, such as the Mg/Ca ratio, are reliable indicators of the climatic conditions in sedimentary carbonates.
Therefore, in this work, we aimed to test the reliability of the Mg/Ca ratio in fluvial tufa calcite as the depositional (detrital sediment input), hydrological (discharge, in-aquifer residence time of water) and climate (temperature, precipitation, evaporation) indicators of past environments. For this purpose, we analysed the Mg/Ca ratios of the recent six-month fluvial stromatolite records and their water counterparts obtained from 1999 to 2012 for four river valleys in the Iberian Range, Spain. We compared the calculated temperature values with the corresponding measured water temperatures and the water temperatures calculated from the tufa δ18Ocalcite in the same records by the authors of [13]. We analysed the influence of the different parameters on the tufa Mg content, and we compared the results with similar outcomes for other fluvial systems. According to our findings, the use of the Mg content in calcite as a temperature proxy is difficult because of the complex interplay of the other acting parameters (e.g., the water discharge and calcite precipitation rates). Specifically, the influence of the Mg derived from detrital minerals may be responsible for the generally higher temperatures yielded by this proxy.

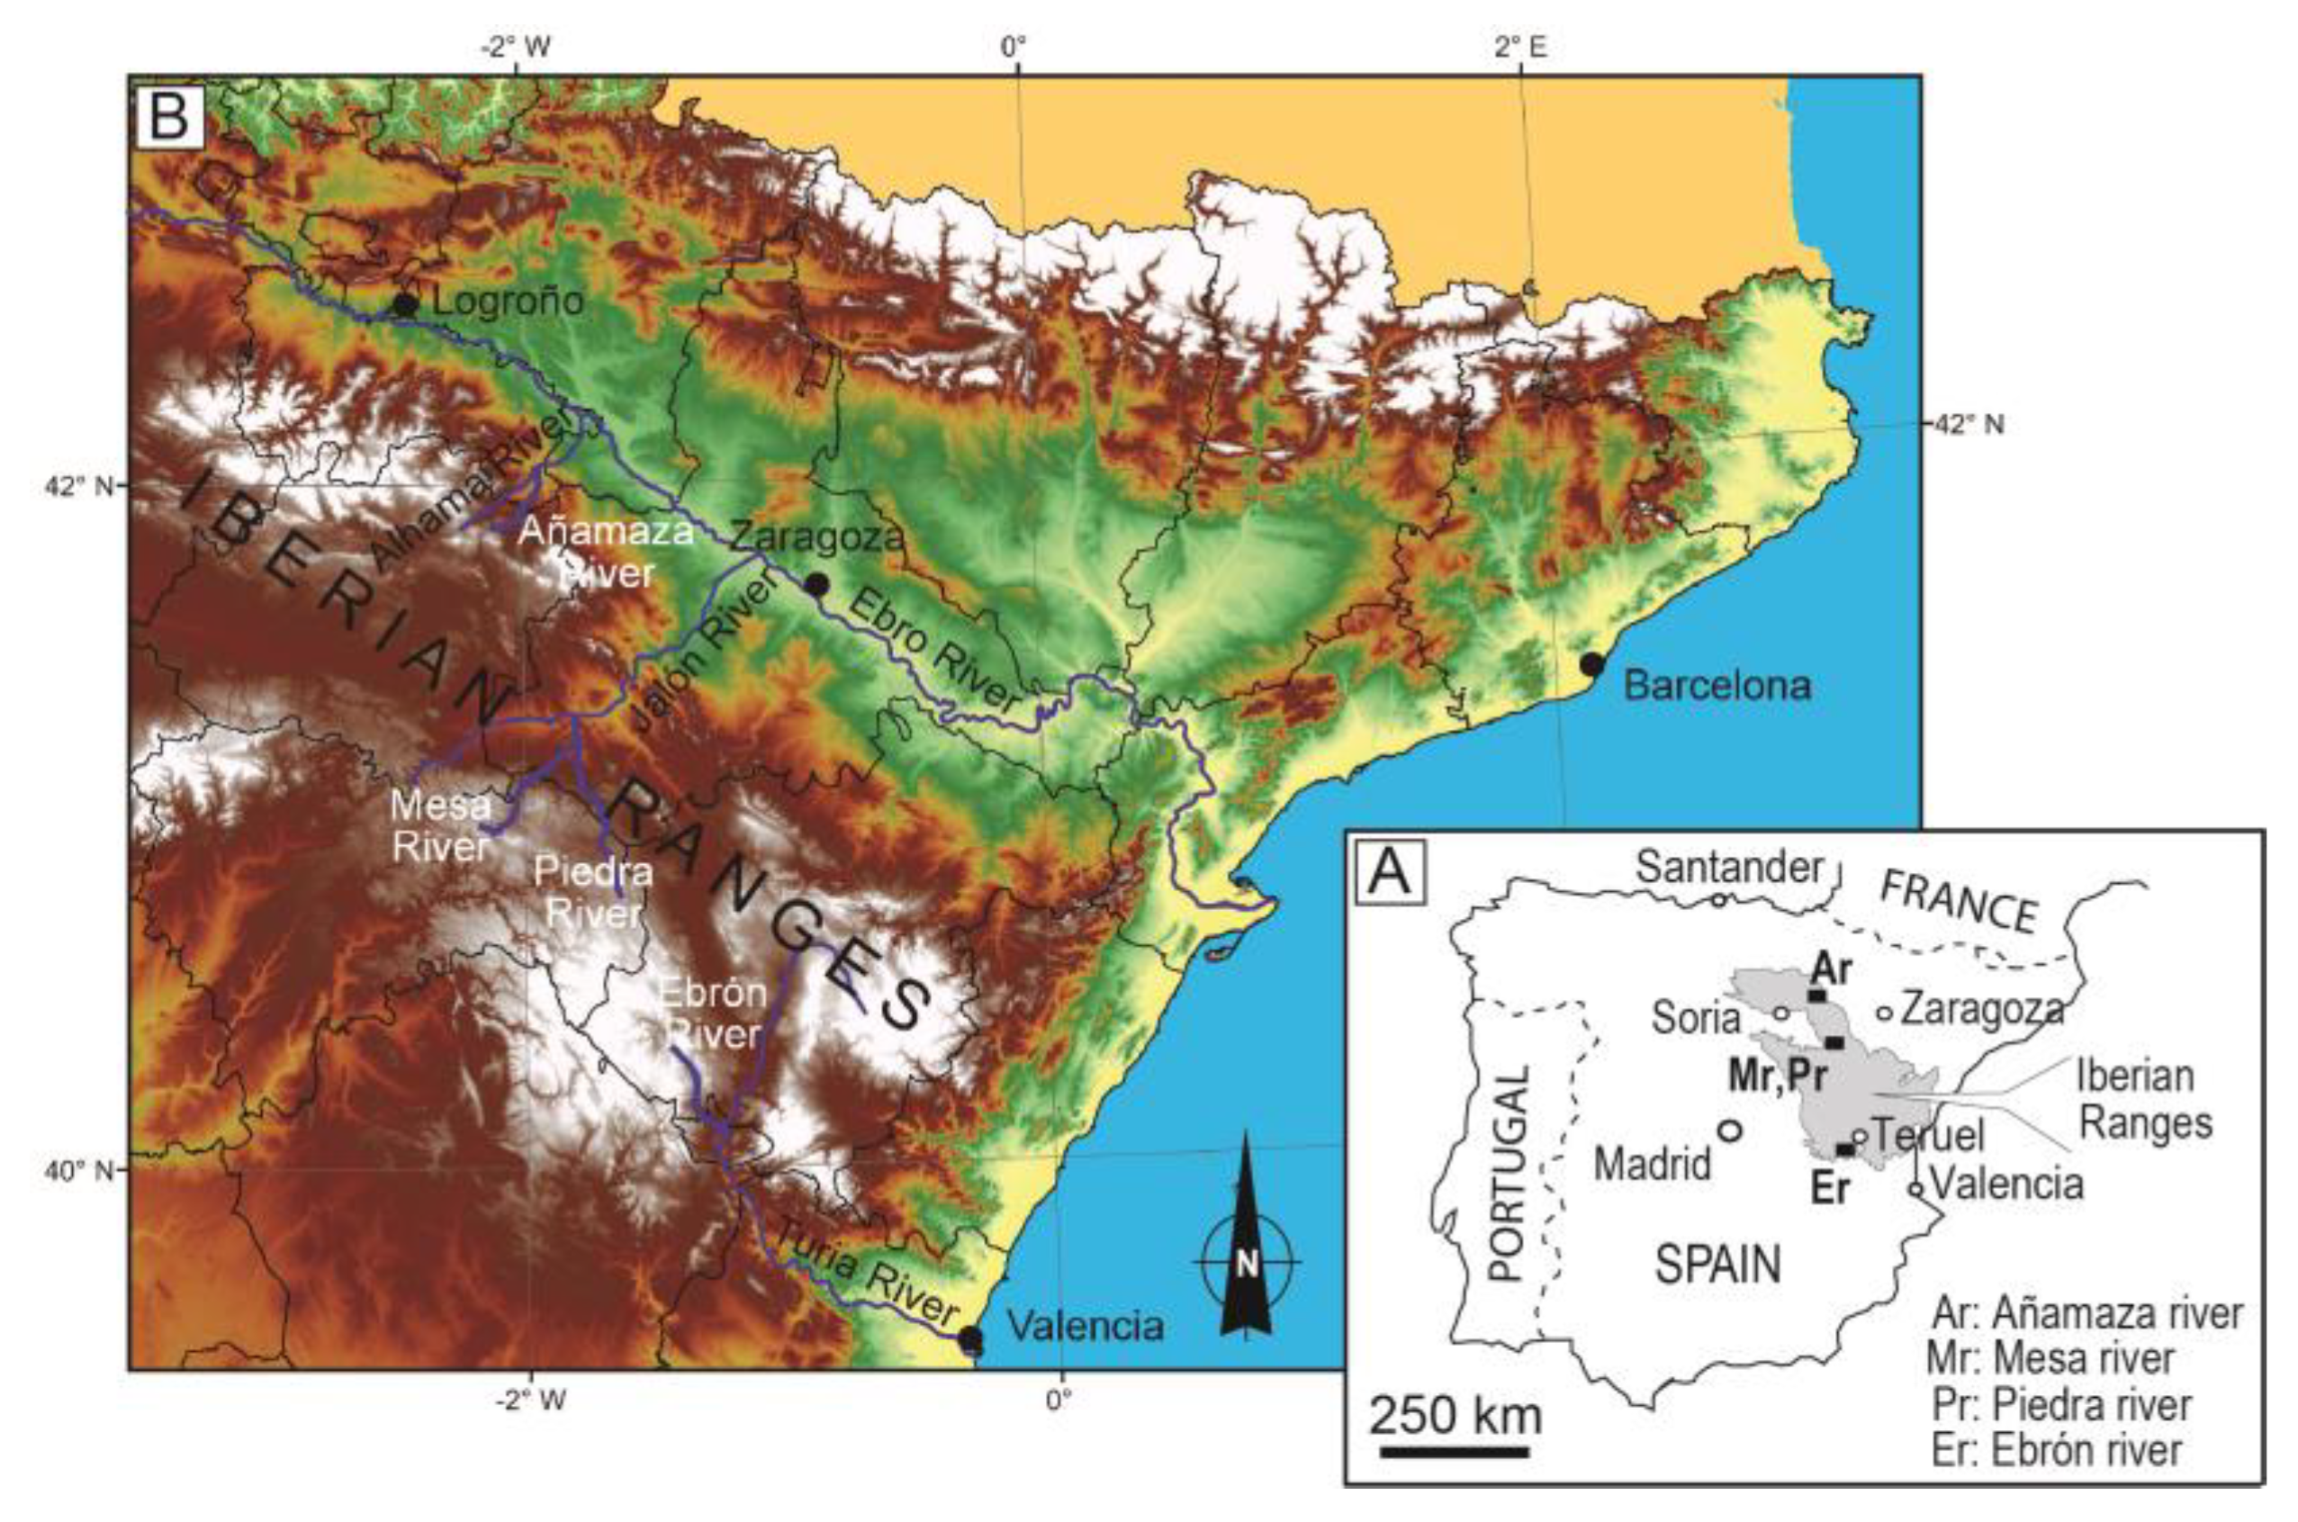
2. Location, Geological Context, Climate and Hydrology

The Añamaza, Piedra, Mesa and Ebrón Rivers are located along a 210 km long, nearly N–S transect across the Iberian Range (Figure 1). The Iberian Range is an Alpine intraplate mountain range that was formed as the result of the convergence of the Eurasian and Iberian plates [14]. The Paleozoic-to-Cenozoic succession is formed mainly of siliciclastic and carbonate sedimentary rocks. The Mesozoic sequence includes thick and extensive successions of carbonate rocks that make up most of the aquifers in the region. This sequence is overlain by Cenozoic fluvial and lacustrine detrital and carbonate rocks [14]. A number of valleys include Pleistocene and Holocene conspicuous tufa buildups [15,16,17,18,19]. In many of these valleys, the present-day rivers continue to form tufa deposits via a long stretch downstream of the headwater springs [19,20,21,22].
The river sections studied by the authors of [19,21,22,23] in the four fluvial basins (Añamaza, Piedra, Mesa and Ebrón) have similar lengths, elevations and topographies, and they share the general Mediterranean continental climate conditions. The four rivers are mainly sourced from Jurassic carbonate rock aquifers (plus Upper Cretaceous carbonate rock aquifers in the case of the Piedra and Mesa Rivers), which supply water of the HCO3–Ca (Piedra, Ebrón and Mesa) and SO4–HCO3–Ca (Añamaza) types. Most of the water is not only provided by the springs that are located in the uppermost reaches of each fluvial valley, but also by the variable contributions from the springs along the river paths, which are greater along the Ebrón River.
The Ebrón and Mesa Rivers have similar mean water discharge values (1.49 and 1.5 m3/s, respectively), which are slightly higher than that of the Piedra River (1.26 m3/s). The Añamaza River has a much smaller discharge value (0.21 m3/s). The longitudinal profile of the Añamaza River has the highest gradient (mean slope of 1.9%), those of the Ebrón and Piedra Rivers have more moderate gradients (1.4% and 1.3%, respectively) and that of the Mesa River has the lowest gradient (1%).

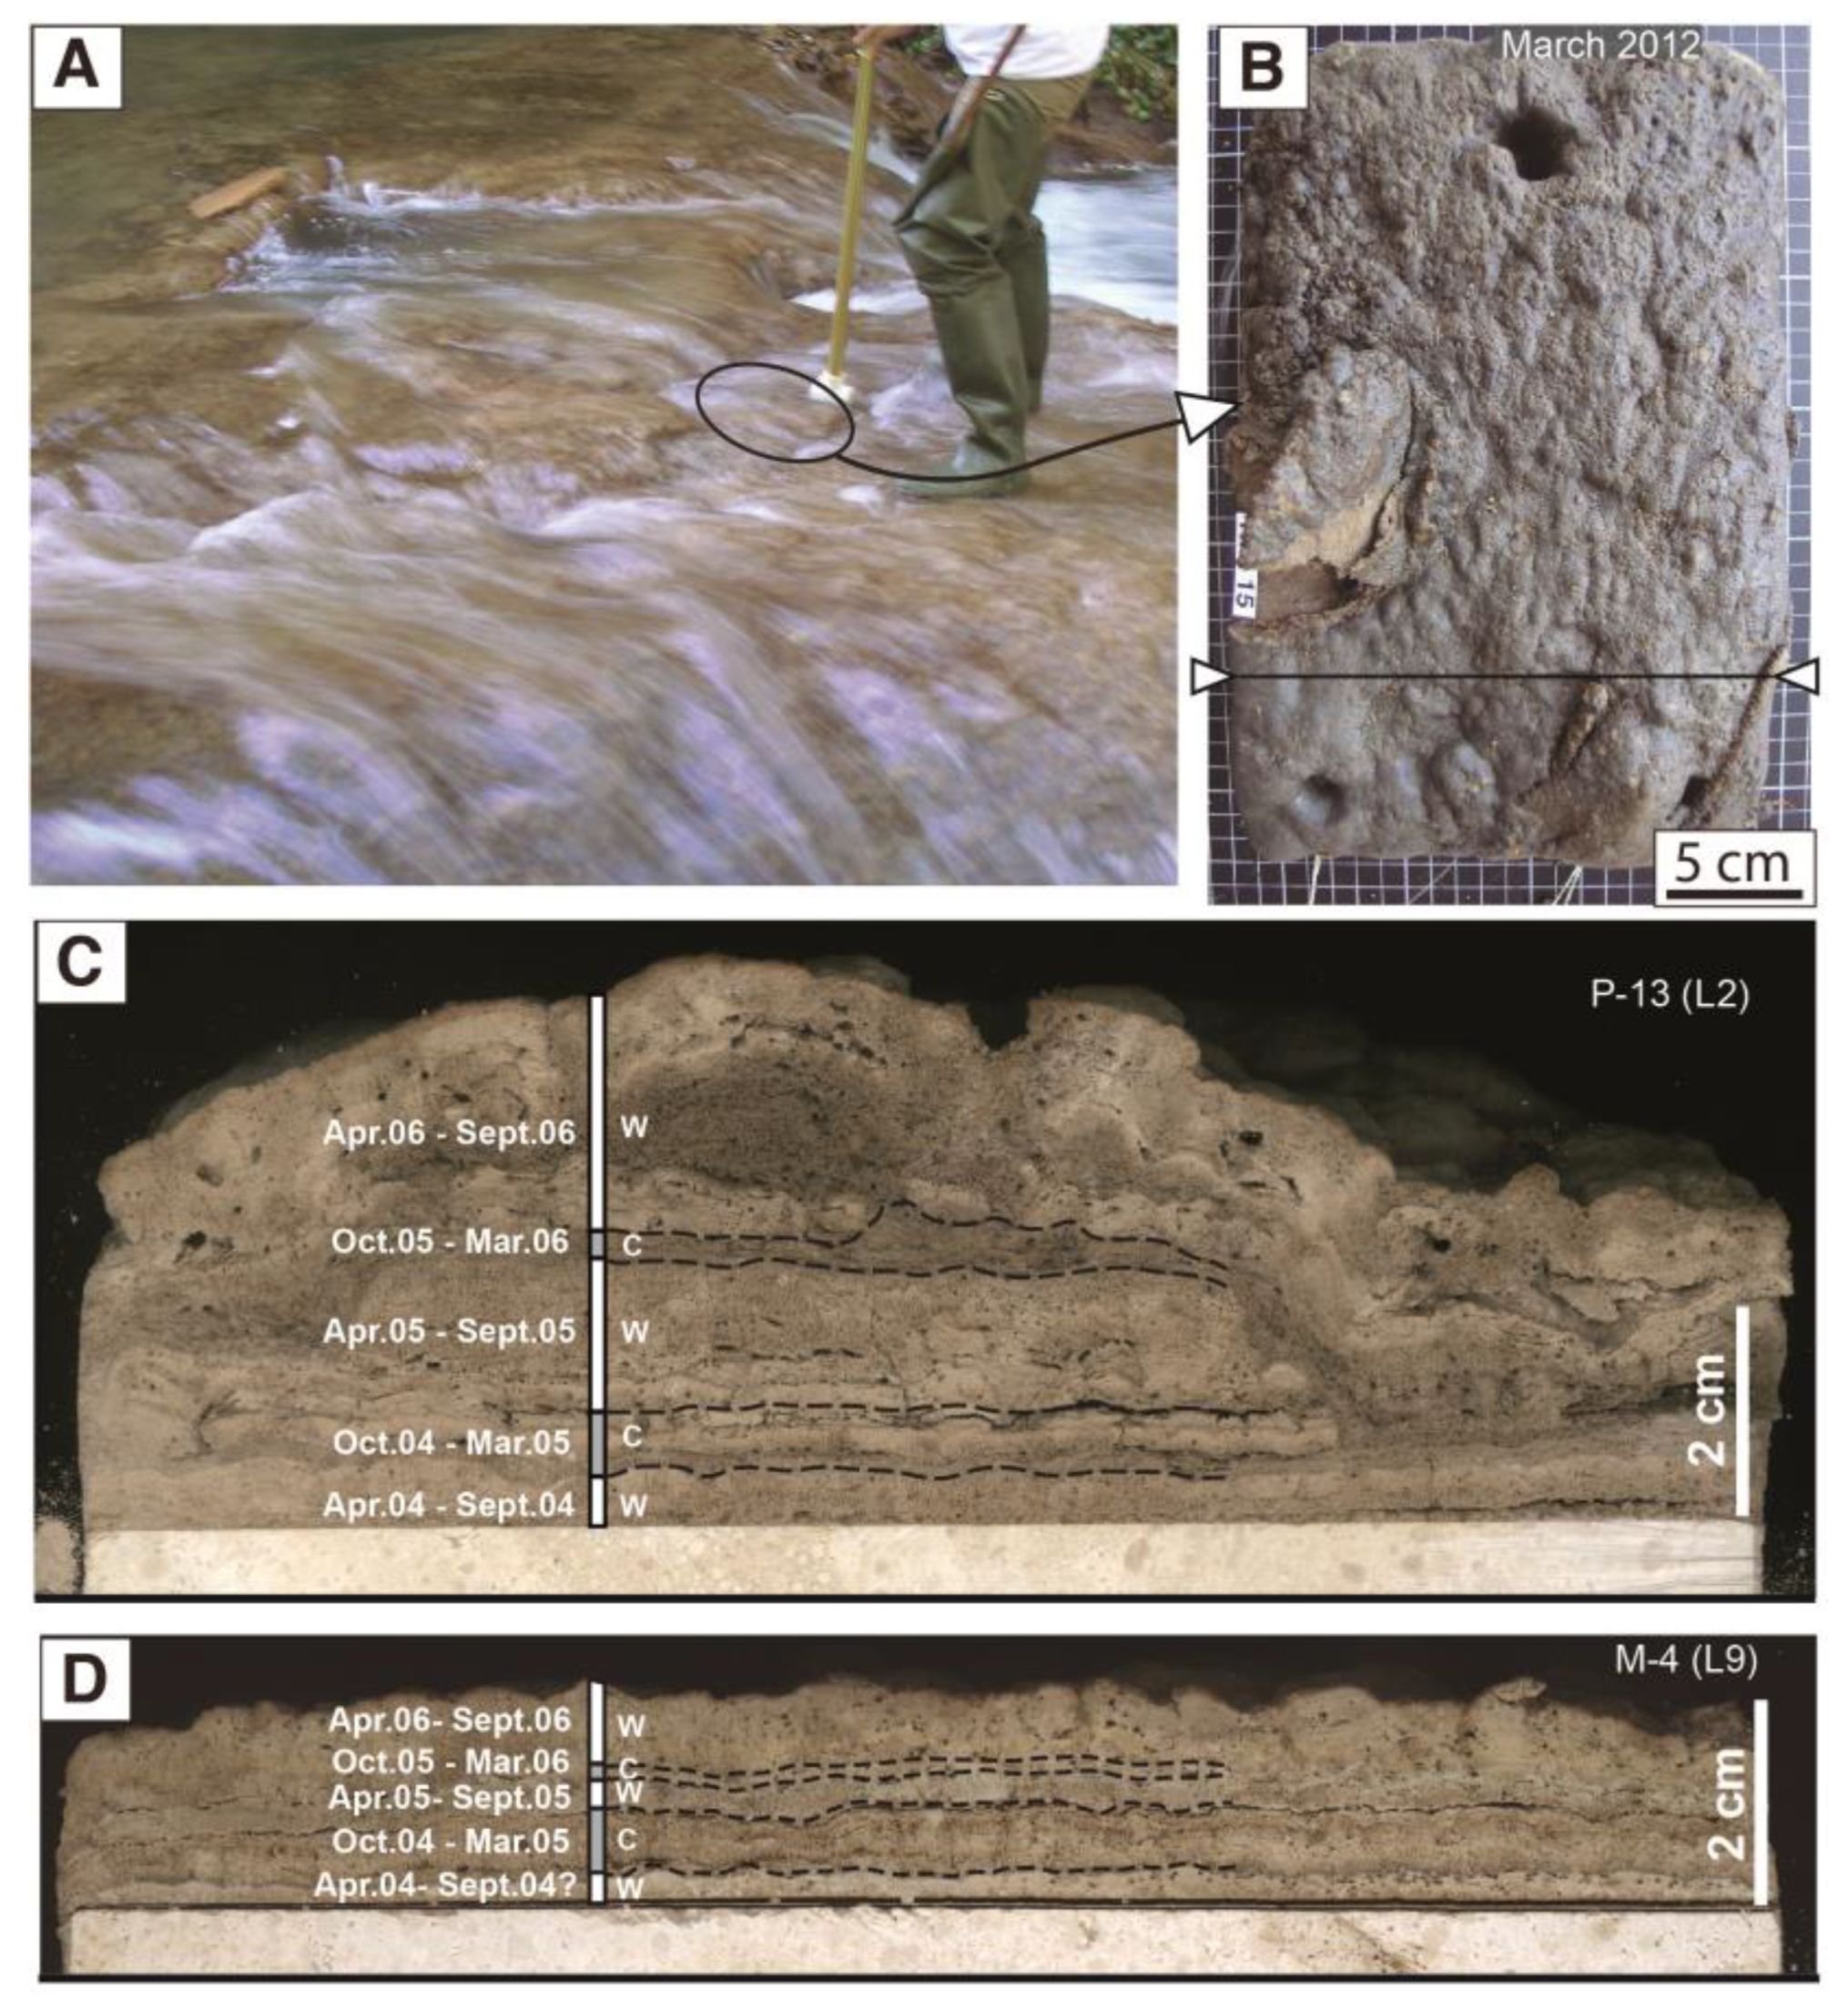
3. Characteristics of Stromatolite Formation in the Studied Rivers

The authors of [19,21,22,23] performed sedimentary and hydrochemical studies on the calcite-depositing rivers: Añamaza, Ebrón, Mesa and Piedra Rivers (hereafter referred to as RA, RE, RM and RP, respectively), and they indicated that the deposition rates were strongly controlled by the mechanical CO2 outgassing in the four cases, with minor contribution from the biological parameters, such as the photosynthetic CO2 uptake. The highest deposition rates corresponded to the fast flow conditions along the gently to highly inclined river sites in which the stromatolite deposits were formed (mean measured deposition rates: RM: 4.0 mm/y; RE: 4.4 mm/y; RP: 13.7 mm/y; RA: 18.3 mm/y). The researchers measured from moderate to high deposition rates in the varied-sized waterfalls with continuous and turbulent flows, in which crudely laminated deposits of moss, macroscopic algae and minor stromatolites had formed (mean measured deposition rates: RM: 2.4 mm/y; in RE: 7.4 mm/y; RP: 8.2 mm/y; RA: 8.4 mm/y). The lower rates were those of the slow flowing water areas, in which the sediment consisted of loose lime mud, small phytoclasts and oncoids, as well as uneven and thin stromatolites. Other contexts, such as spray areas or caves, yielded much smaller deposition rates. In all cases, the deposition rates were much higher in the warm periods (i.e., spring and summer months) than in the cool periods (i.e., autumn and winter months). The six-month difference was explained by the differential effects of the temperature and temperature-related parameters on the calcite solubility in the water and on the biota activity, the latter either through plants or prokaryotes that act as substrates for calcite precipitation, or even through the photosynthesis process [24,25]. However, despite these similarities, there are large variations in the deposition rates between the four rivers due to differences in the discharges, water chemical compositions, riverbed slopes and water temperatures [21]. Among the studied facies, the most continuous records were for the stromatolite deposits, which allowed for the identification of the successive six-month period intervals that were monitored on site and in the laboratory (Figure 2). Therefore, we selected a number of stromatolite deposits formed on tablets for this study. These stromatolite deposits consist of thicker and denser composite laminae that alternate with thinner and more porous composite laminae. The former includes up to six simple laminae, and the latter includes up to four [26]. The laminae primarily consist of cyanobacterial calcite tubes that form palisades, fan-shaped calcite bodies and/or intertwined-calcite-tube mats (Figure 3). According to the RNA determinations from the same sites as the tablets, most of the studied samples coincided with Phormidium incrustatum [27,28]. In addition, diatoms, insect cavities and extracellular polymeric substances (EPSs) were variably present between the tubes (Figure 3).
We selected the stromatolite records that were suitable for this study as follows: For the RE and RA rivers, the highest deposition rates were measured in Tablets RE-8 and RA-6 (8.44 mm/y over 3.5 years, and 18.3 mm/y over 3 years, respectively). For RP, Tablet R-14 provided the longest and most continuous record (12 years, with a mean rate of 16.02 mm/y). For the RM, Tablet M-4 had a continuous record that was suitable for this study (3.5 years, with a mean rate of 5.45 mm/y).

4. Methods

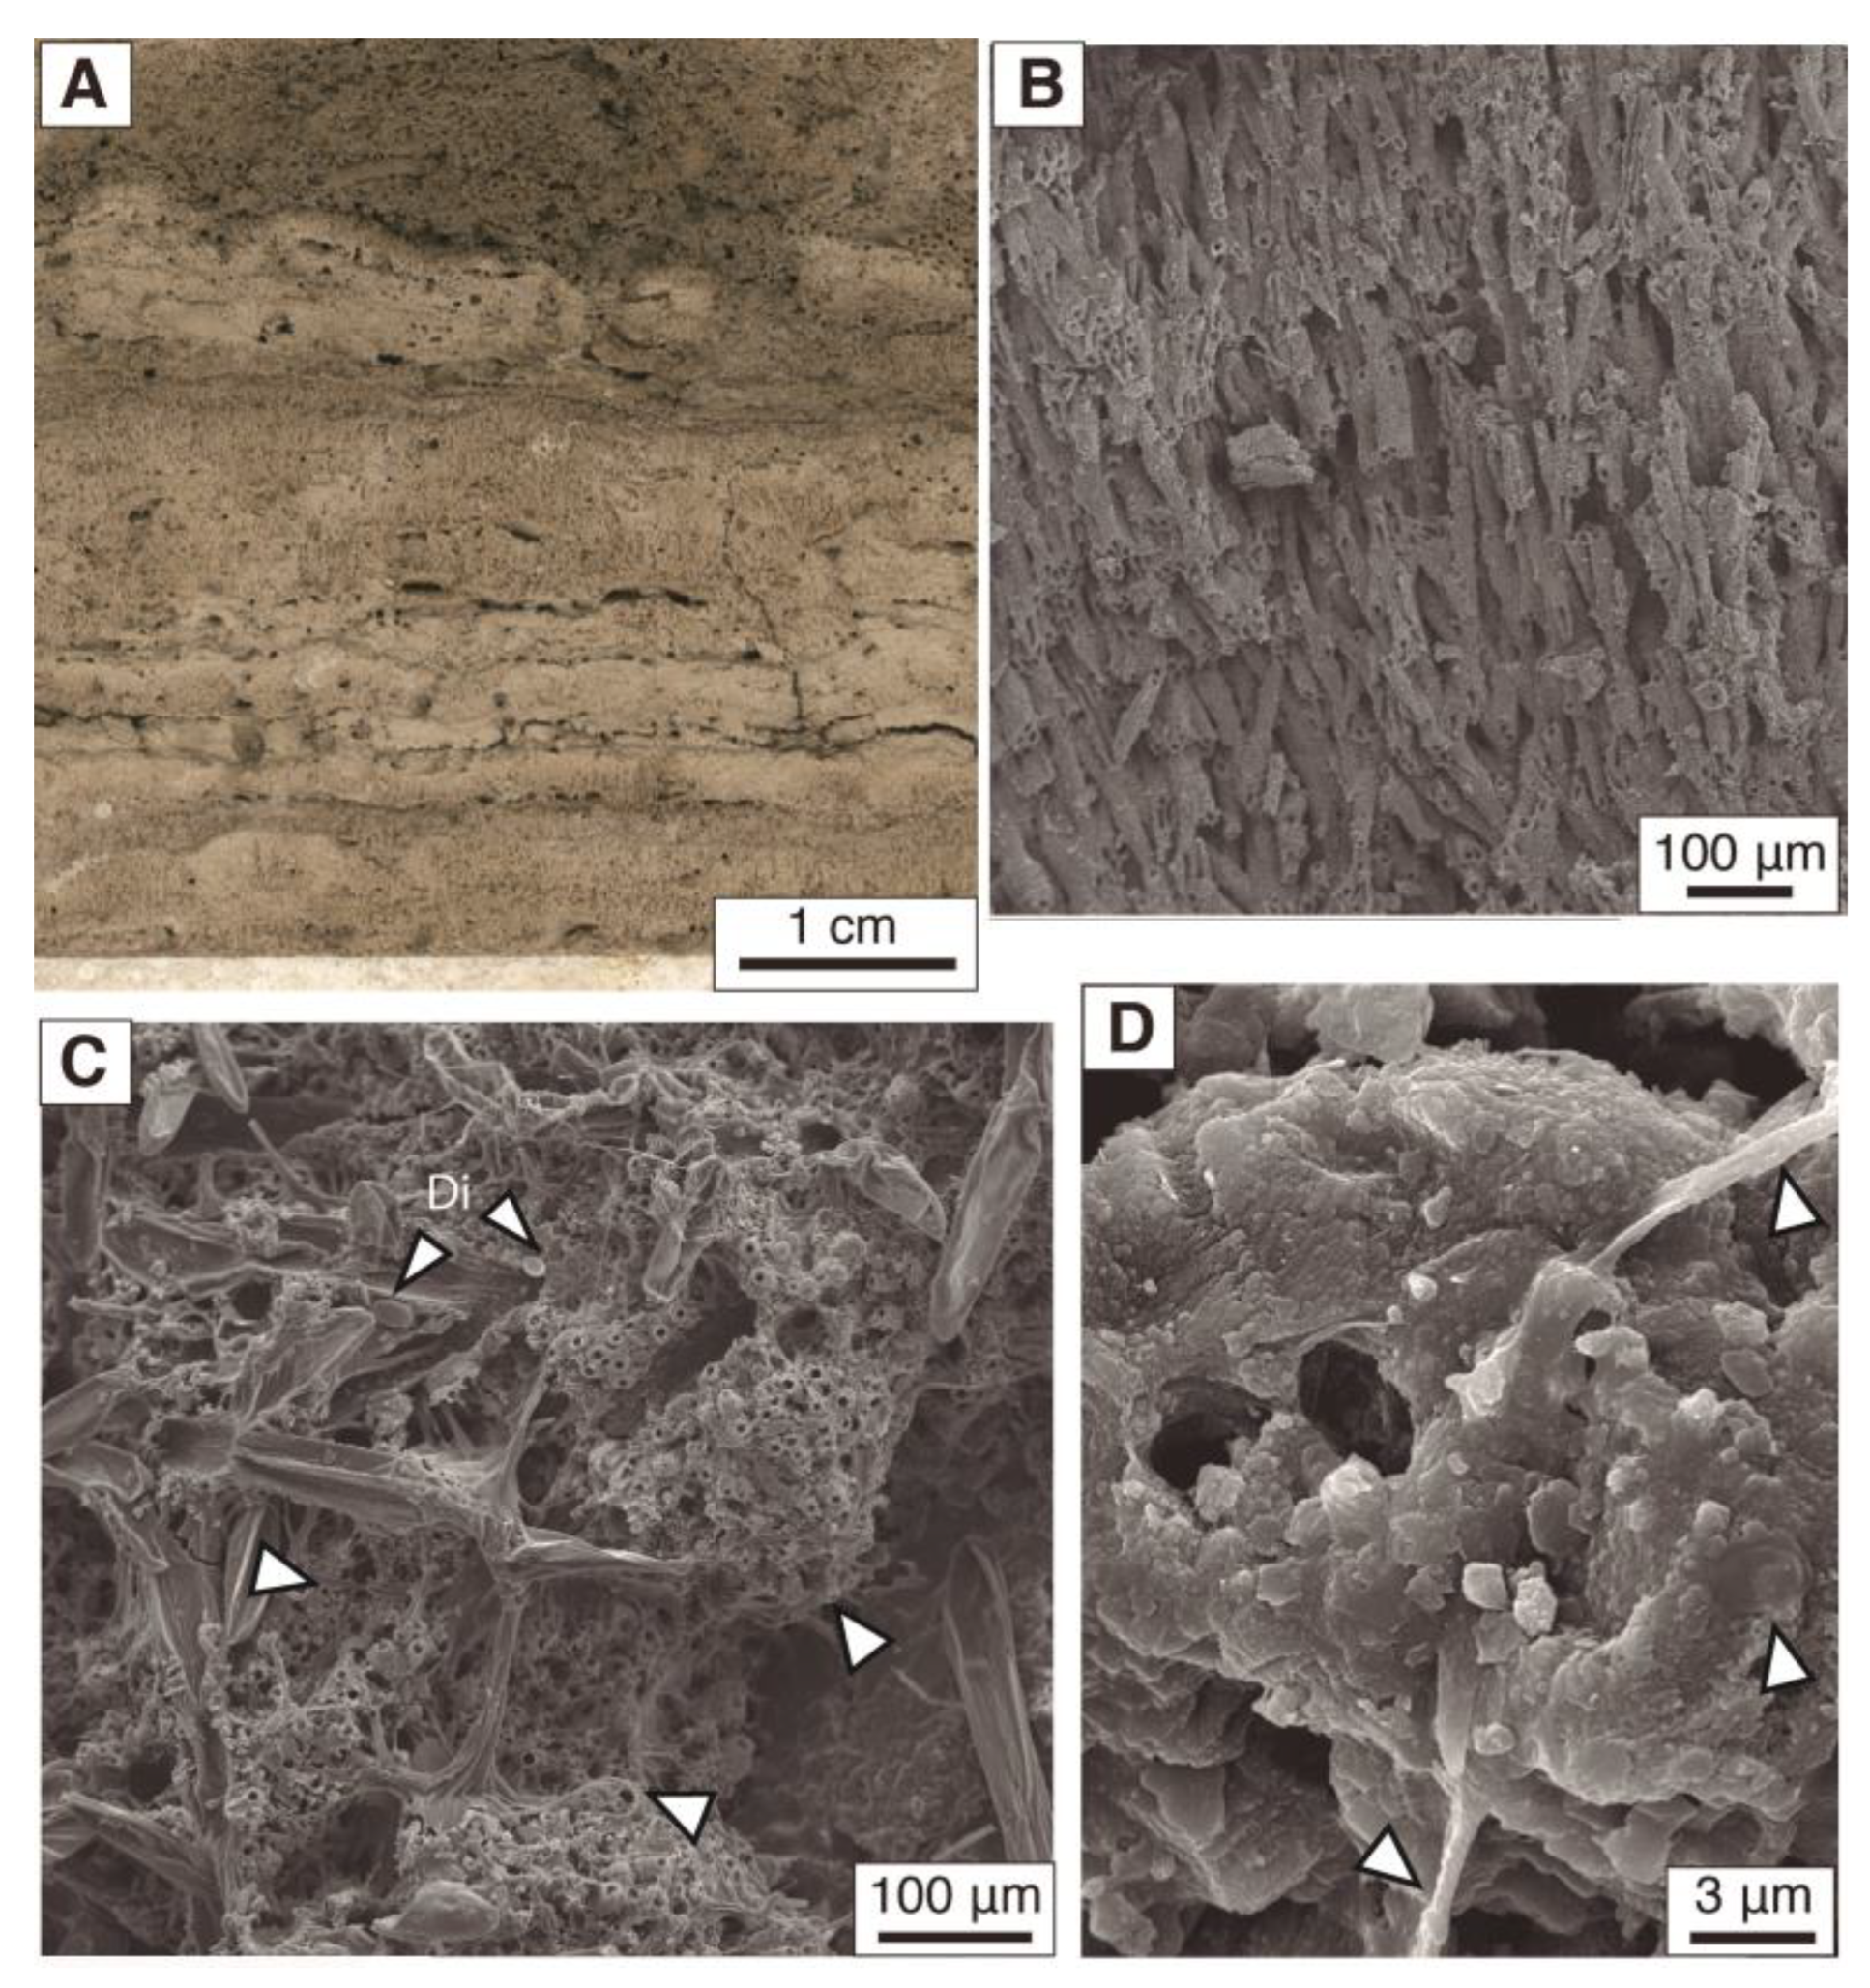
4.1. Sediment Sampling and Analyses

The researchers obtained the sediment samples from tufa stromatolites developed on limestone tablets. The authors of [13,19,21,22,23,25] gathered the sediment records and the related water parameters in a multidisciplinary study performed between 1999 and 2012. They installed the tablets (25 × 15 × 2 cm) on the riverbeds at several places that represented different environmental conditions. They set the tablets at the end of the winter, and they removed them at the end of the summer to measure their thickness in the laboratory. After a week, they returned the same tablets back to the same places until the next semester. The authors of [25] explain the procedure in detail. Once they definitively removed the tablets, they cut them perpendicular to the depositional surfaces, and they identified the six-month intervals (hereafter, we refer to spring and summer as the warm period, and we refer to autumn and winter as the cool period) by plotting the corresponding measurements on the raw cuts (see [29] for details).
From these sections, they took from one to two sediment samples from each six-month interval with a punch and a microdrill (Navfram model N120 Micromotor 25.000 rpm with electronic speed regulator, AB SHOT TECNICS SL, Cervello, Barcelona, Spain). They ground the powdered matter and sieved it through a 50 µm size mesh, and they then separated it for different uses.
For the Ca and Mg analyses, they homogenised each stromatolite sample. They digested the subsamples of approximately 0.2 g using a mixture of concentrated Suprapur nitric acid (2.5 mL) and hydrochloric acid (7.5 mL) (all Merck), in closed Teflon crucibles (V = 35 cm3) on a hotplate at a temperature of 170 °C, and then in open Teflon crucibles (V = 35 cm3) at a temperature of 220 °C.
The researchers used a high-resolution inductively coupled plasma mass spectrometer (HR ICP-MS) (Element 2, Thermo Finnigan, Bremen, Germany) for the determination of the Ca and Mg concentrations. We present the results for all the six-month sediment intervals recorded on the tablets of the four rivers in Table S1 (Supplementary Material).
The stable isotope composition values of the sediment and water (δ13C and δ18O ‰VPDB) of the RA, RE and RP used in this paper are those published in [13]. The stable isotope composition values of the sediment and water of the RM presented in this contribution were obtained with the same technique described by [13].
The researchers determined the bulk mineralogical composition of the sediment by powder X-ray diffraction using a Phillips PW 1729 diffractometer (Crystallography and Mineralogy Division of the University of Zaragoza, Spain). According to the X-ray diffraction, all the stromatolite samples were composed of low-Mg calcite with minor amounts of detrital particles such as quartz, clay minerals and, occasionally, dolomite [19,21,22,23]). To assess the possible contribution of these detrital minerals to the chemical composition of the analysed samples, the researchers studied the clay mineral content using the RP as an example. For this purpose, they took five sediment samples (stromatolites) along the river in July 2011. They ground and sieved the samples, and they separated the < 2 μm sediment fraction by centrifugation, and they then analysed it for both the mineral (by means of oriented aggregates) and chemical (with the same methodology indicated above for the stromatolite samples) compositions. They performed a semi-quantitative determination of the clay minerals with the reference intensity ratio (RIR) method, and by using the RIR values of [30] taken from [31].

4.2. Water Sampling and Analysis

The researchers obtained the water samples for the chemical analysis at the sites in the four rivers that coincided with the tablet sites. They conducted biannual sampling (approximately in the middle of the warm and cool periods, i.e., at the end of June and in January, respectively) from June 2004 to December 2009 at the RP, from June 2004 to June 2006 at the RM, from December 2007 to December 2009 at the RA and from June 2007 to December 2009 at the RE.
They measured the water temperature (Tw) and pH on site using a portable pH meter (Jenway 4200; Bibby Scientific Limited, Stone, UK). They filtered the samples using a 0.45 μm Millipore cellulose filter, and they acidified them with ultra-pure HNO3 to a pH of < 2 for the cation analyses. They determined the alkalinity, SO4, Cl, Ca, Mg, Na and K with the same protocols and analytical methods (as is detailed, for instance, in [19]) for the four rivers. The charge imbalance percentage for the analytical data used in this study was always below 10% as calculated with the PHREEQC code (see below). We present the analytical results for the study sites on the four rivers in Table S2 (Supplementary Material).

4.3. Geochemical Modelling Calculations

The researchers performed the speciation–solubility calculations to obtain the values of the calcite saturation index (SIc), total dissolved inorganic carbon (TDIC) and partial pressure of CO2 (pCO2) values for the water samples with the PHREEQC code [32], and with the WATEQ4F thermodynamic database distributed with the code.
They calculated the inorganic precipitation rate for the calcite (mmol/cm2/s) using the rate law in [33], which is commonly referred to as the PWP (Plummer, Wigley, Parkhurst) rate equation:
R = −κ1 aH+κ2 aH2 CO3*κ3 aH2O + κ4 aCa2+ aHCO3
where H2CO3* = H2CO30 + CO2(aq), and κ1, κ2, κ3 and κ4 are the empirically determined rate constants. They used the temperature functions proposed by Plummer et al. (1978) for the κ1, κ2 and κ3 rate constants [33]. The rate constant κ4 depends on the temperature and pCO2. The researchers used the equation proposed in [34] by fitting it to the empirical data of Plummer et al. (1978) [34].
The empirical rate (Equation (1)) was originally provided for calcite dissolution; however, it is also applicable to precipitation [33,35]. In the form presented in Equation (1), the negative values correspond to the dissolution rates and the positive values to the precipitation rates. Researchers frequently use this equation for tufa-depositing streams [2,19,21,23,36,37,38,39,40,41,42] because it provides the maximum rate of the inorganic precipitation in turbulent water [43]. The rate is usually larger than the actual precipitation rate; however, we can achieve a reasonable estimation by reducing the calculated PWP rate with Equation (1) by a factor of 10 [37,38,44]. The PWP values calculated in this study were transformed in this manner when they were assessed with the precipitation rates obtained in the literature by other methods.
We estimated the magnesium distribution coefficient between calcite and water from:
D Mg = ( Mg / Ca ) calcite ( Mg / Ca ) water  
where (Mg/Ca)calcite denotes the molar ratio of the Mg and Ca concentrations in the stromatolites and (Mg/Ca)water denotes the molar ratio of the total dissolved Ca and Mg contents in the water. According to the results from the speciation–solubility calculations, there were no meaningful differences between the molar ratios calculated with the free Ca2+ and Mg2+ ion concentrations and those obtained with the total dissolved Ca and Mg contents; thus, we can neglect the effects of the Ca and Mg complexation in the estimation of the distribution coefficient.

4.4. Mg/Ca Thermometry

When using the Mg/Ca ratio in calcite as a water palaeothermometer, it is conventionally assumed that it is predominantly controlled by the Mg/Ca in the solution and a temperature-dependent partition coefficient. Although researchers have widely used Mg/Ca palaeothermometry in marine settings, to date, only a few researchers have utilized the Mg/Ca ratio for freshwater tufa deposits (e.g., [6], and the references therein). Moreover, the available experimental data for the Mg partitioning behaviour under karst/speleothem-specific conditions (e.g., for calcite precipitation from solutions of low ionic strength) are scarce, and to the best of our knowledge, only two experimental works are available in the literature: the Mg distribution coefficient DMg–temperature (DMg-T) relationships obtained by [45] and by [46].
The DMg-T relationships obtained by these authors have important differences. The equation in [46] always provides higher temperatures than that in [45], and in our case, it provided exceedingly higher temperatures with respect to the measured ones (see Figure S2, Supplementary Material). Furthermore, researchers have only used the DMg-T relationships in [45] to calculate the water temperatures from the Mg concentrations of tufa samples (e.g., [1,3,6]).
Therefore, in this work, we only used the DMg-T relationship from [45], as adjusted by [3]:
T   ( ) = D Mg 0.001 0.0012
where DMg is the Mg distribution coefficient (see Equation (2)), which is used to calculate the river Tw from the measured Mg/Ca ratios of the waters. Despite the adjustment-derived uncertainties of this equation, researchers have repeatedly used it to estimate the Tw in fluvial environments [1,3,6].
We compared the Mg-derived Tw values with the water temperatures measured in the sampling moment, as well as with the Tw values estimated from the δ18O of both the stromatolite calcite and river water, by means of the formula in [47]. Except for the RM river, researchers have reported these temperatures in previous works (RP: [20]; RA: [23]; RE: [21]).
As the researchers measured most of the parameters on a six-month basis, we calculated the moving averages of two periods for the examined parameters, to remove the seasonality and to obtain the corresponding season-free evolutions.

5. Results

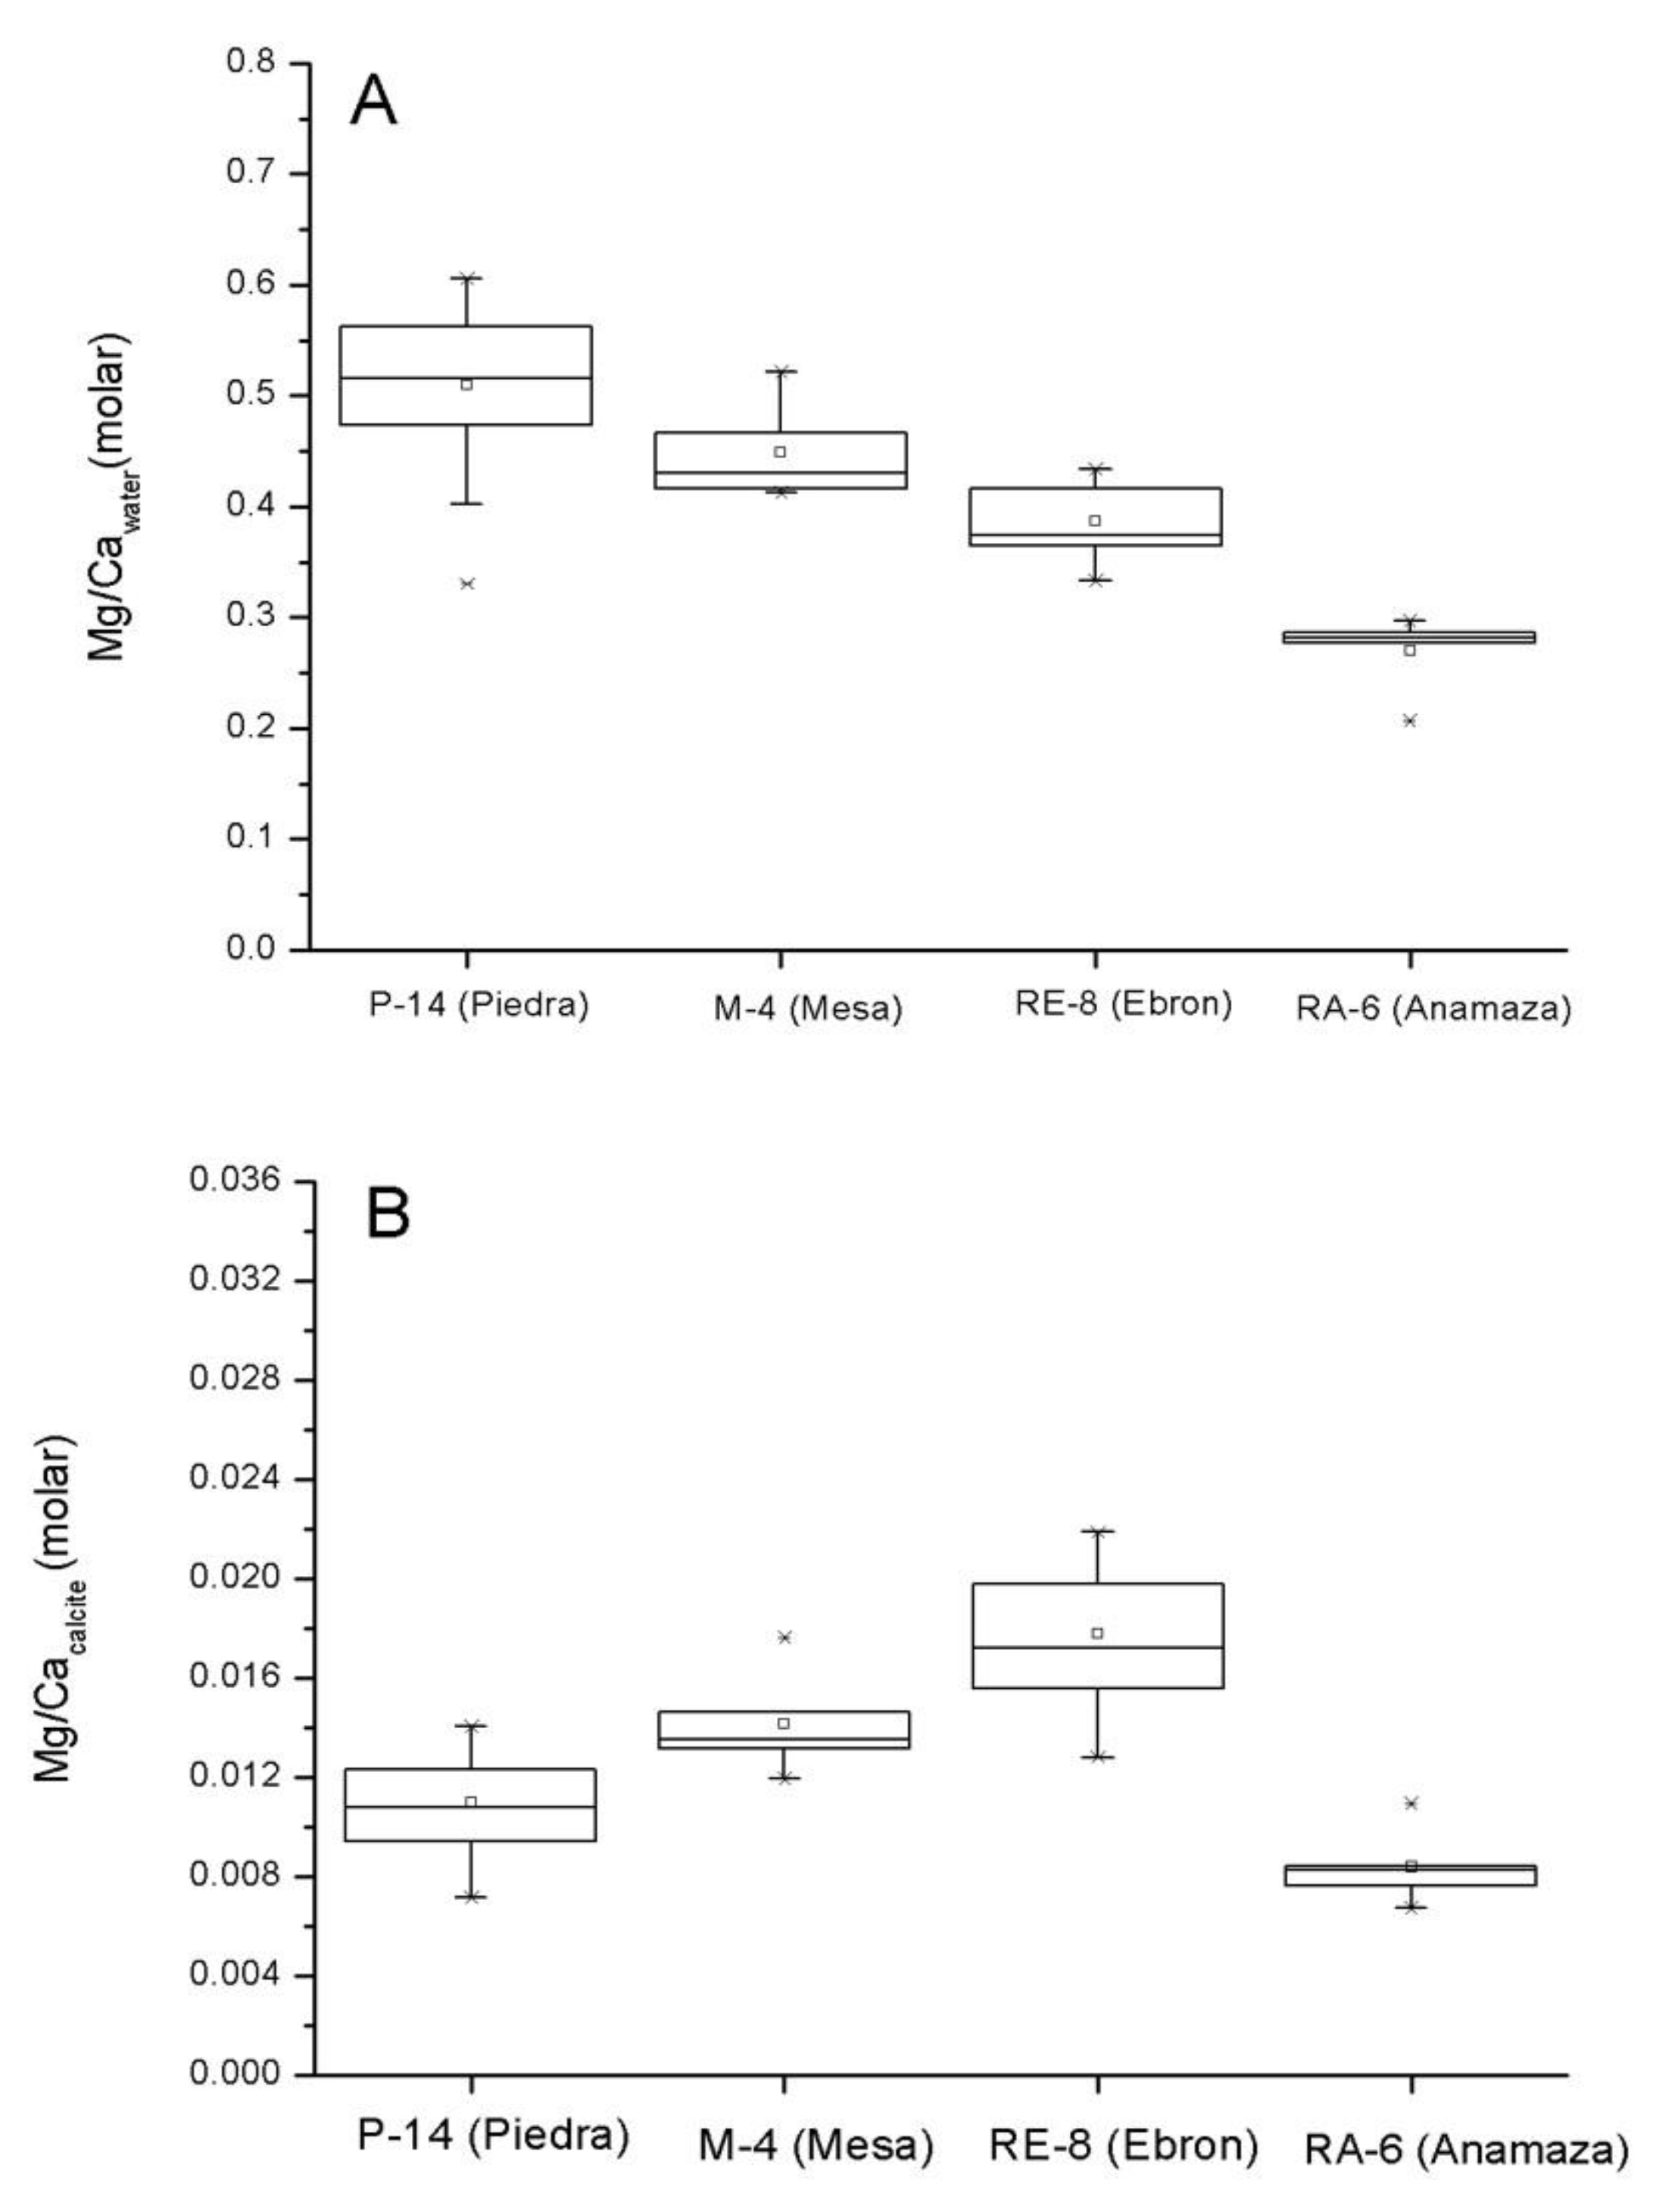
5.1. Hydrochemical Characteristics and Mg/Ca Ratios of the Waters

The hydrochemical characters of the waters at the studied sites are representative of the main compositional features of the four rivers. The water is of the HCO3Ca type in the cases of the RE, RM and RP. In the case of the RA, the water is of the SO4–HCO3–Ca type (see Figure S1 Supplementary Material), which is the result of the intense interaction between the groundwater feeding the river and the bedrock evaporitic materials (gypsum/anhydrite) [23].
The Tw ranges measured in June and January at the studied sites (see Table S2, Supplementary Material) were similar in the four rivers: from 8 to 18 °C in the cases of the RA, RM and RP, and a bit narrower in the case of the RE (from 10.7 to 16 °C). The Tw values had a clear seasonal pattern (Figure 4). The differences between the mean temperatures for the warm and the cool periods were slightly higher in the RA and RP (6.3 and 5.2 °C, respectively) and lower in the RE and RM (2.6 and 2.7 °C, respectively) (Table S3, Supplementary Material).
The dissolved Mg concentrations were relatively similar in the four studied rivers (mean values between 0.8 and 1.04 mmol/L (Table 1)). The dissolved Ca contents had greater differences (mean values between 1.95 and 3.24 mmol/L (Table 1)). As a consequence, there were differences between the rivers for the Mg/Ca ratios of the waters (Mg/Cawater) (Figure 5A and Table S2, Supplementary Material). The mean (Mg/Ca)water values exhibited an overall decreasing evolution from the RP to the RM, RE and RA, from 0.51 ± 0.08 in the RP to 0.27 ± 0.036 in the RA (Figure 5A, Table 1).
The (Mg/Ca)water values in the RE (RE-8) and RM (M-4) had a quasi-seasonal pattern, with higher values in the warm periods and lower values in the cool periods (Figure 4). This seasonal pattern was also present in the RP, from the beginning of the record until Cool 2007–2008; from this period onwards, the oscillations were wider than in the other rivers and did not present any regularity. Finally, the (Mg/Ca)water values in the RA (site RA-6) were rather constant over the periods, except for the last recorded period (Cool 2009–2010), which had a lower value (Figure 4).
The waters were always oversaturated with respect to calcite, with the highest SIc values in the RA at the RA-6 site (mean value of 0.89 ± 0.23), and intermediate values in the RE at the RE-8 site (mean value of 0.73 ± 0.28), and in the RP at the RP-14 site (mean value of 0.67 ± 0.33). The lowest values were for the RM at the M-4 site (mean value of 0.57 ± 0.33). The calculated partial pressure of CO2 (as log pCO2) was always higher than the atmospheric values (mean values: RE: −2.79 ± 0.28; RA: −2.92 ± 0.25; RM: −2.62 ± 0.44; RP: −2.71 ± 0.35).
The mean values of the calcite precipitation rate ranged from 1.40 × 10⁻⁸ ± 1.13 × 10⁻⁸ mmol/cm2/s in the RM to 3.09 × 10⁻⁷ ± 1.44 × 10⁻⁷ mmol/cm2/s in the RA, with intermediate values in the RE and RP (1.91 × 10⁻⁸ ± 1.02 × 10⁻⁸ and 1.73 × 10⁻⁸ ± 1.16 × 10⁻⁸ mmol/cm2/s, respectively).
With some exceptions, the dissolved Ca, HCO3 and TDIC concentrations at the studied sites had lower values in the warm periods due to the more intense calcite precipitation in these periods for most of the studied time intervals (which is in agreement with the overall trends previously detected in the studied rivers [19,20,21,22,23]). The PWP and SIc values are usually higher in the warm periods; however, in the case of Site M-4, the opposite trend was evident (Figure 4).

5.2. Geochemical Characteristics and Mg/Ca in Stromatolites

The calcium contents in the studied deposits ranged from 31.8 to 40 wt.% (Table S1, Supplementary Material), which corresponded to CaCO3 percentages in the sediment from 80 to 100 wt.% (calculation based on Ca analytical data). Overall, these contents were consistent with those found in other modern (Krka River or Kaisenger Creek, Table 1) and older tufa deposits (e.g., [24,48,49,50]).
Although the analysed samples were primarily formed of calcite, there were some differences among the studied deposits, whereas the Ca contents in the deposits from the RA, RE, and RM were relatively similar, with mean values of 34–35 wt.% (85–87.5 wt.% as CaCO3 (Table 1)), and the Ca concentrations in the stromatolite from the RP were higher, with a mean value of 37 wt.% (92.5 wt.% as CaCO3).
The magnesium concentrations ranged from 1.28 to 5.15 g/kg, with the highest values in the RE (3.75 ± 0.8 g/kg) and the lowest in the RA (1.73 ± 0.31) (Table 1). The MgCO3 contents (calculated assuming that Ca and Mg were the only elements in the carbonate fraction) ranged from 0.65 to 2.07 mol%, which indicated that the calcite in the stromatolites was low-Mg calcite.
The Mg/Ca ratio of the studied stromatolites (herein (Mg/Ca)calcite) also exhibited differences between the studied rivers (Figure 5B, Table S1, Supplementary Material). The highest mean (Mg/Ca)calcite values were in the RE (0.018 ± 0.004), and the lowest were in the RA (8.38 × 10⁻³ ± 1.6 × 10⁻³) (Table 1). Overall, these values did not show a systematic evolution with respect to the corresponding (Mg/Ca)water (compare Figure 5A,B). The RP had the highest (Mg/Ca)water value and the second lowest (Mg/Ca)calcite value.
The six-month (Mg/Ca)calcite pattern over time was not the same for the four rivers (Figure 4). In the RE, and partially in the RP, there were six-month patterns with lower (Mg/Ca)calcite values in the cool periods and with higher values in the warm periods. In RP, this pattern was more distinct from the Warm 2006 onwards, except for the last period (Cool 2009–2010). The (Mg/Ca)calcite values in the RM did not show a cyclic pattern, and the values increased over time. The RA values had little variation, except for the last period (Cool 2009–2010). The overall (Mg/Ca)calcite trends of the RM and RP were parallel (Figure 4).
The calculated DMg values for the studied stromatolites in the four rivers ranged from 0.012 to 0.053, with the lowest values in the RP (mean 0.023 ± 0.008) and the highest in the RE (mean 0.046 ± 0.009) (Table 1). Overall, these values were in the range of the DMg determined in the experimental studies (from 0.01 to 0.06, as reviewed in [8,45,51,52]) and in other natural fluvial tufa systems (from 0.011 to 0.058, as reviewed in [8]).
Most of the studied rivers had seasonal DMg patterns over time, except for the RA (Figure 4). Most of the examined record of RE revealed a six-month pattern with higher DMg values in the warm periods, and from Cool 2005–2006 to Warm 2009 in the RP. In the case of the RM, the DMg had a faint seasonal pattern, but with higher values in the cool periods.
We present the δ18Ocalcite and δ13Ccalcite of the stromatolite records in Table S4 (Supplementary Material) and Figure 4. The δ18Ocalcite values in the four rivers were similar, although there were slightly higher in the RP. In the four rivers, the δ18O patterns were evident in the alternating higher values in the cool periods and lower values in the warm periods, which is consistent with the temperature dependence of the oxygen isotope fractionation in calcite precipitation. Therefore, the stromatolite δ18O values reflected the water temperature signature. The temperatures estimated from the δ18Ocalcite and δ18Owater were close to the measured temperatures [13].
The δ13Ccalcite values were also similar in the four rivers, and the ranges of variation were narrower than in the δ18Ocalcite (Figure 4). The RM had the lowest values, and the RE and RA had the highest. In the RP, the δ13C had an oscillating pattern that was roughly parallel to the δ18O. In the RE, the δ18O and δ13C patterns were similar. In contrast, in the RM and RA, the δ18O and δ13C did not display any significant relationship.
The clay composition of the five analysed stromatolites were similar: only illite and chlorite were present. The average proportion of both minerals was 65% for the illite and 35% for the chlorite, and the mean Mg content in the clay fraction was about 10,000 mg/kg. Therefore, the stromatolite Mg/Ca analysis could have included Mg from chlorite. However, considering a maximum clay mineral content of 5%, the chlorite contribution to the stromatolite sample would be 500 ppm, which is significantly low with respect to the entire Mg content (Table S1, Supplementary Material).

6. Discussion

The (Mg/Ca)water for the studied sites at the four rivers cover a relatively wide range of values (Table 1). If the (Mg/Ca)calcite ratio primarily depends mainly on the Mg/Ca in the solution and on a temperature-dependent partition coefficient (Equation (2)), then the theoretical (Mg/Ca)calcite values for the mean (Mg/Ca)water for the rivers should parallel the decreasing (Mg/Ca)water trends that can be observed in Figure 5A from the RP to RA rivers (given that the mean water temperatures were similar at the four sites, from 12.2 to 13.5 °C). However, this is far from reality, and there was even an increasing trend from the RP to the RE (Figure 5B). Thus, we need to consider other factors that participate in the control of the Mg partitioning in calcite when analysing the Tw derived from the Mg content in carbonates.

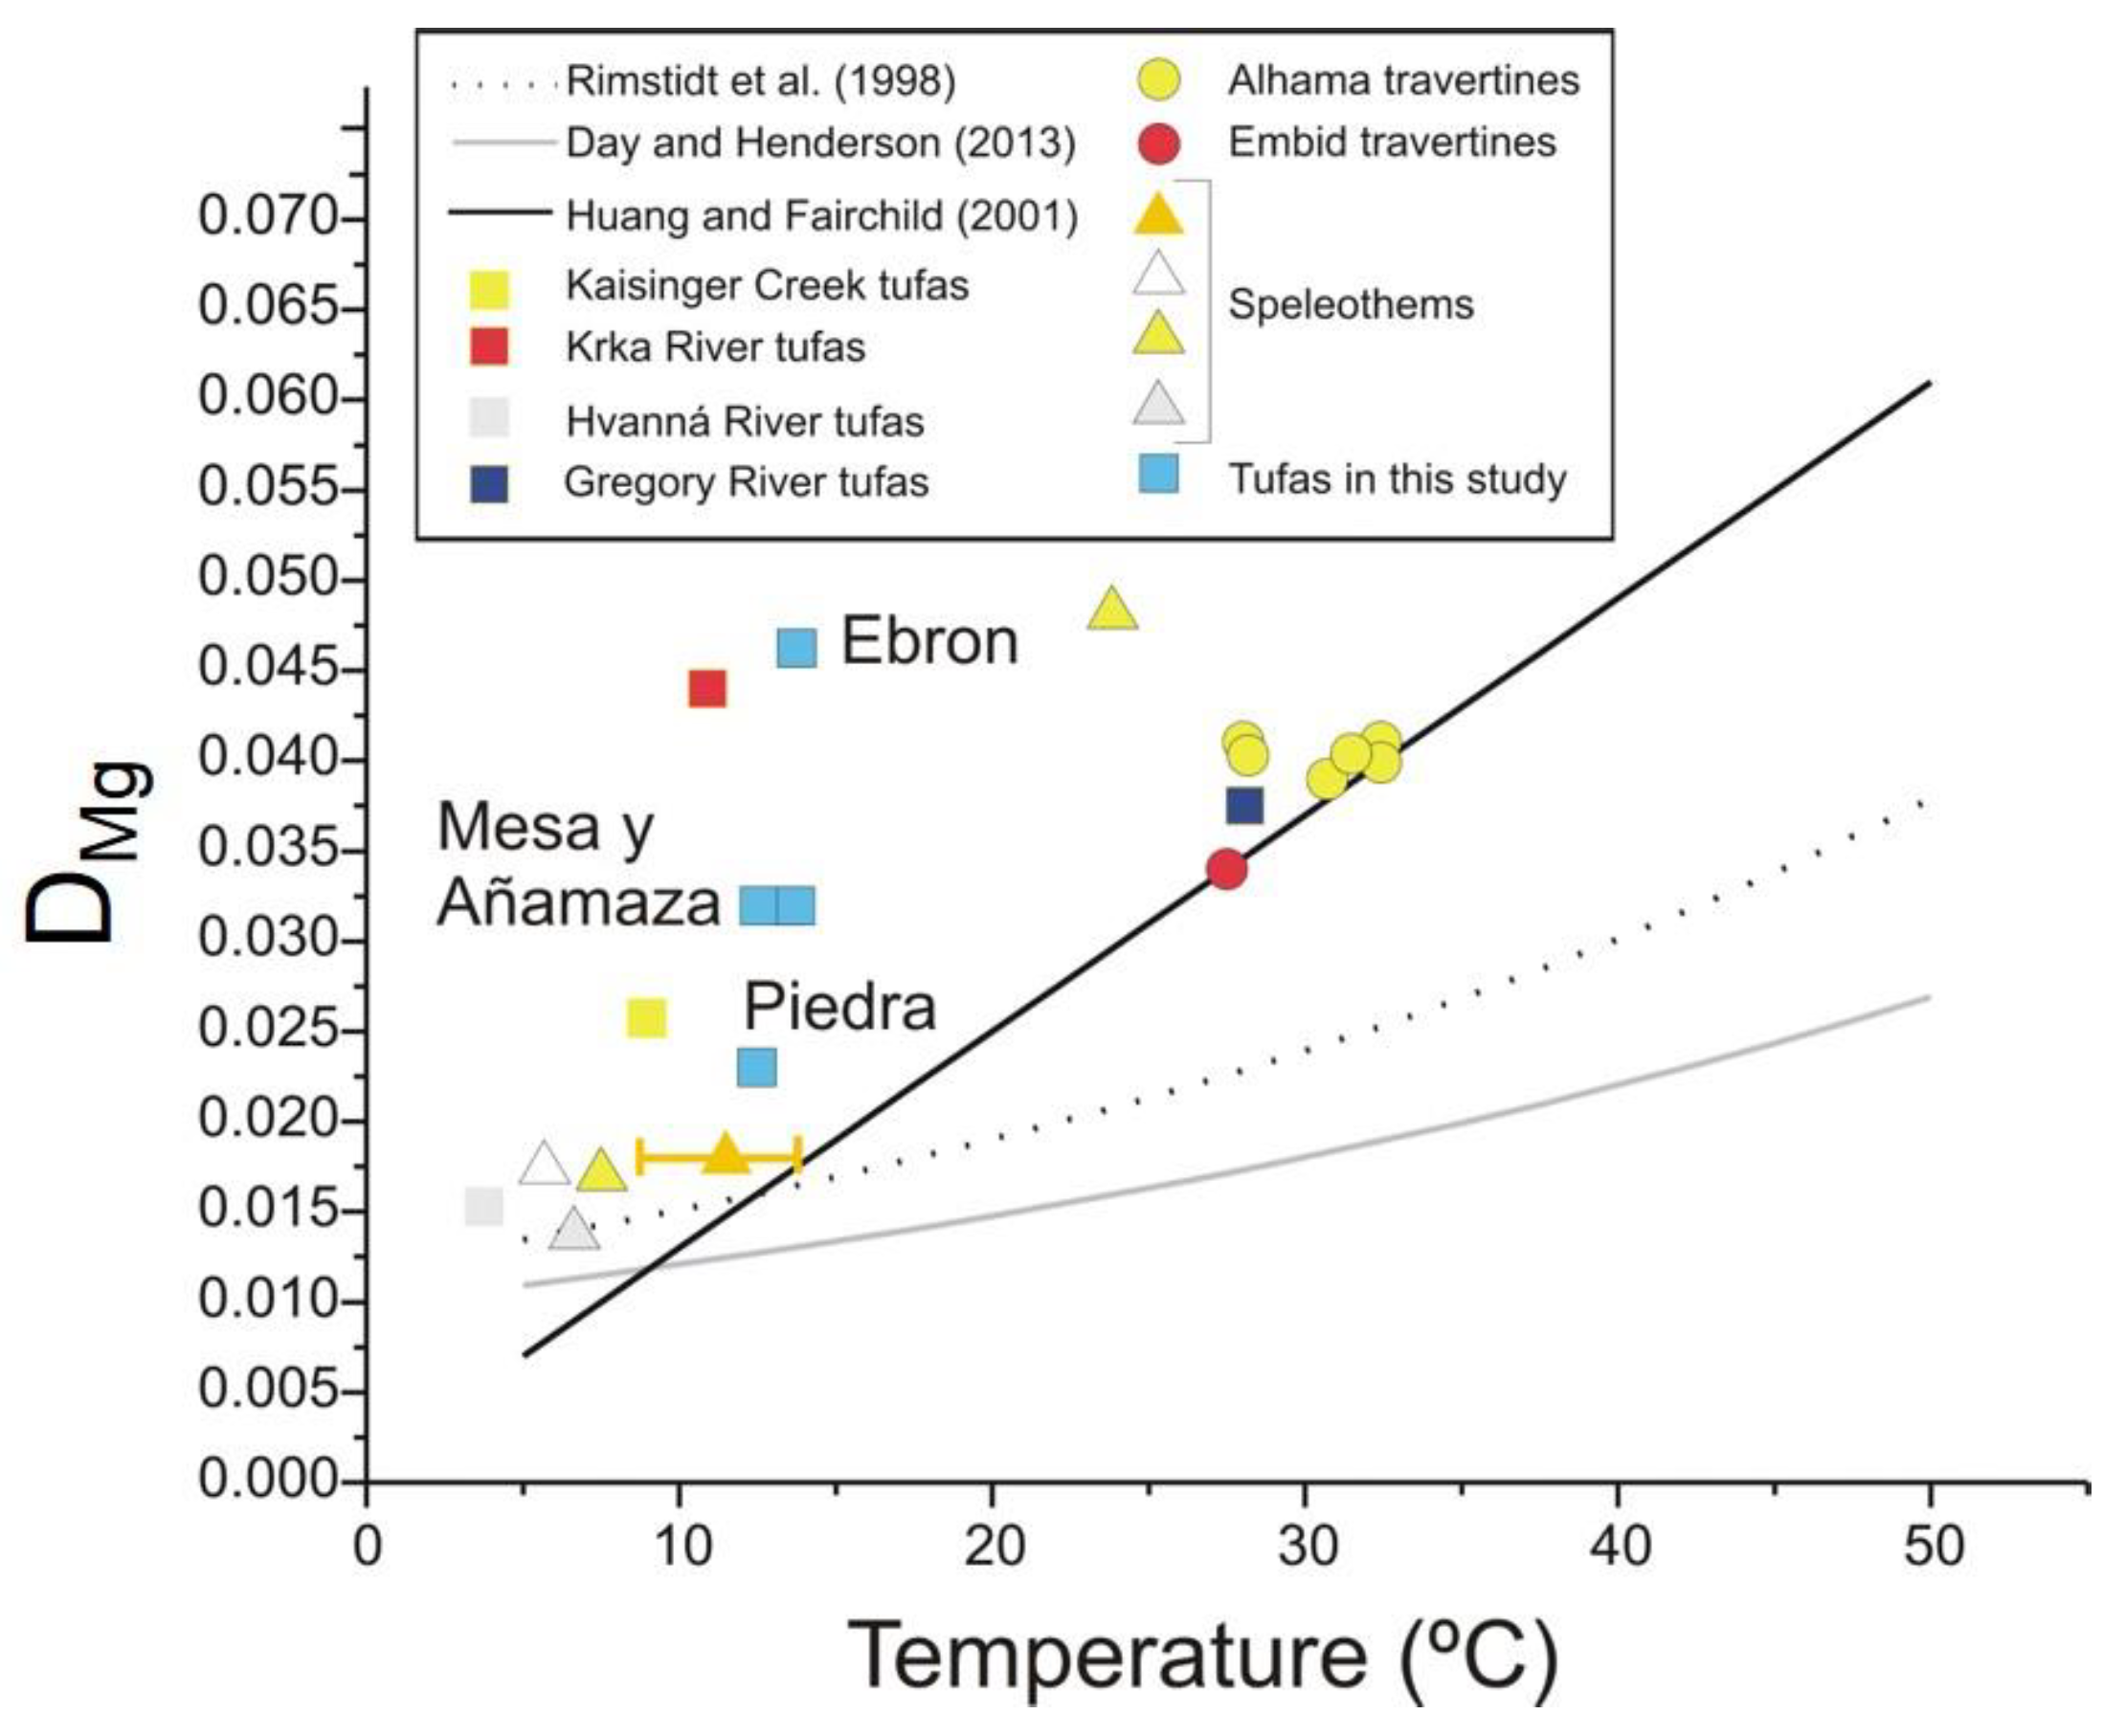
6.1. (Mg/Ca)calcite and Temperature

The temperatures derived from the stromatolite Mg/Ca content substantially differ from both the Tw calculated from the stromatolite δ18Ocalcite values and the measured Tw (Figure 4). Even in the RP, which had the best fitting between the Mg-derived Tw and measured Tw, the evolutions of the two temperatures were not parallel over time (Figure 6). Furthermore, in general, the Mg-derived Tw did not show the expected seasonality (e.g., higher values in the warm periods than in the cool periods), except partially in the RP. In the RE, the Mg-derived Tw had right oscillating behaviour in some periods. In the RA, there was no oscillation, and in the RM, the oscillation was reversed (Table S3, Supplementary Material, Figure 6).
The matching between the (Mg/Ca)calcite and measured Tw was of a diverse degree (Figure 4; Table 2), and with respect to the season-free evolutions, the (Mg/Ca)calcite and measured Tw exhibited a weaker similarity (Figure 6), even when there is a significant correlation between them (See Section A.1. in Appendix A for details). This inconsistency between the six-month pattern and the season-free evolution suggests that the correlation between the measured Tw and (Mg/Ca)calcite is caused by the common seasonal changes of both parameters, and not necessarily by the temperature dependence of the Mg partitioning. According to these results, it is clear that there is a complex interplay of diverse factors other than the temperature that influences the (Mg/Ca)calcite contents in the stromatolites and thus promotes different behaviours.
The abovementioned situation could explain the sparse results calculated with the DMg-T relation obtained by using the equation in [45]. The authors of [1] successfully used the DMg-T relationship to obtain the model temperatures from the Mg concentrations of tufa samples in Australia; however, there were discrepancies in the correlation between the tufa (Mg/Ca)calcite ratios and water temperature [1,7]. The use of the relationship described by the authors of [45] in other modern tufas has provided higher temperatures than the ones measured in rivers with temperature-controlled (Mg/Ca)water ratios (e.g., the Krka River in Croatia [3], and the Krka River in Slovenia [6]). The Mg/Ca paleothermometry in modern and ancient stream tufas is generally problematic due to the fact that the expected influence of the temperature on the (Mg/Ca)calcite can be obscured by diverse factors, such as the hydrogeochemical conditions, the changes in the (Mg/Ca)water and anthropogenic contamination [2,3,5,53], the influence of the microbial biofilm activity [4,7,8,54] and the presence of variable amounts of detrital limestone and dolomite in the tufa [12].

6.2. Other Factors That Influence (Mg/Ca)calcite

6.2.1. Mg/Ca of Water

The (Mg/Ca)calcite values not only depend on the temperature, but also on the (Mg/Ca)water. Moreover, the empirical partitioning coefficient (DMg) depends on the (Mg/Ca)water value (see Equation (2)). Accordingly, variations in the (Mg/Ca)water may be involved in the systematic offset with respect to the measured temperatures. The authors of [2] found that the (Mg/Ca)calcite ultimately relies on rainfall and aquifer processes, which determine the (Mg/Ca)water content. The authors of [53] established that the seasonal variations in the (Mg/Ca)calcite do not depend on the temperature, but on the seasonal (Mg/Ca)water variations, which are induced by the preferential leaching of Mg from carbonates in dry periods [9]. Calcite precipitation can also modify the (Mg/Ca)water along streams by removing Ca from the water [55].
Thus, the (Mg/Ca)water variation may interfere with the temperature-dependent (Mg/Ca)cacite content. In general, the (Mg/Ca)water increases in warm and/or dry periods due to the greater Ca extraction by the calcite precipitation under these conditions, and in-aquifer effects produce the same result [53,55,56]. From a theoretical point of view, the increase in the (Mg/Ca)water in warm periods emphasizes the increase in the derived (Mg/Ca)calcite because the Mg content in calcite increases with increasing temperature. As the empirical DMg (Equation (2)) is the ratio between these coupled varying parameters, the simultaneous increases in both parameters cancel each other out, at least partially, which results in a smoothed DMg. This only occurred in the first interval of the RP (from Warm 2004 to Warm 2006), when oscillations in (Mg/Ca)calcite flatten the expected seasonal oscillations of the Mg-derived Tw, although these values are close to the measured Tw. In the rest of the cases, the Mg-derived Tw are higher than the measured Tw due to the anomalously high (Mg/Ca)calcite. (See Section A.2. in Appendix A for details).

6.2.2. Detrital Minerals

Given the type of chemical attack used for the trace element analysis of the sediments, some detrital matter may have been dissolved and then included in the analysed aliquot, which may have caused the total Mg content to be higher than the total Mg in the calcite lattice. Moreover, the Al content of the analysed samples was significantly correlated to the (Mg/Ca)calcite in all the cases, except for the first time interval for the RP (RP from Warm 2004 to Warm 2006: r = 0.09; RP from Cool 2006–2007 to Cool 2009–2010: r = 0.62; RM: r = 0.88; RE: r = 0.96; RA: r = 0.87) (Table 3). Because of this, we cannot rule out the influence of Mg from a detrital source. The corresponding extra increase in the (Mg/Ca)calcite value may have been responsible for the anomalously higher-than-real Tw values observed in most of the cases. Moreover, the amount of detrital sediment may regularly oscillate and consequently overemphasize the (Mg/Ca)calcite values, and subsequently, the estimated Tw, while at least partially preserving the six-month oscillation, which may be the case for the RE, in which the (Mg/Ca)calcite exhibited a six-month oscillating pattern; however, the values were much higher than the expected ones from the measured (Mg/Ca)water.
Assuming that the Mg contents in the stromatolites included 500 ppm of clay-derived Mg (see Methods and Results), we can eliminate the corresponding contribution to the Tw calculation by subtracting this amount from the total measured Mg contents. Then, by recalculating the Tw with the corrected Mg values, the mean DMg decreases and, as a consequence, so does the estimated Tw. Inversely, we can estimate the Mg content that corresponds to the measured Tw from the measured (Mg/Ca)water by using Equations (2) and (3), and we can then express the Mg excess (See Section A.3. in Appendix A for details).
The correction for the noncarbonate-derived Mg in the stromatolites was only able to cancel out the temperature offset in the RP, and likely in the RA, with small amounts of detrital Mg. In the first time interval of the RP (from Warm 2002 to Warm 2006), the detrital Mg fraction corresponded to probably less than the 5% of the clay minerals considered in the correction. In the second time interval of the RP (from Cool 2006–2007 to Cool 2009–2010) and in the RA, the detrital Mg fraction should have been higher, and it should have included not only clay minerals but also dolomite. In the other rivers (RE and RM), we have to invoke, most likely, additional factors to explain the high (Mg/Ca)calcite.

6.2.3. Precipitation Rate

As stated above, in laboratory experiments, the (Mg/Ca)calcite ratio is predominantly controlled by the Mg/Ca in the solution and Tw, without the meaningful influence of other factors, such as the mineral precipitation rate (e.g., [6,7,57] and the references therein). However, according to the results obtained in natural settings, the (Mg/Ca)calcite values are dependent on additional factors, such as the mineral precipitation rate, crystal morphology and/or biological processes [7,8,57]. Furthermore, according to recent experimental results, the calcite precipitation rate may influence the (Mg/Ca)calcite and DMg under both biotic and abiotic conditions (e.g., [7,51]).
We can theoretically estimate the calcite precipitation rates (see Methods) as the PWP rates from the hydrochemical characteristics of the waters, or from the six-monthly thicknesses recorded on the tablets [13]. The deposition recorded on the tablets and PWP values are not fully equivalent because the latter corresponds to single sampling moments in the six-month periods, whereas the deposition rates from the tablets represent the six-month-period net deposition and could have been affected by erosive processes [21,23]. However, we use them in a complementary manner for the discussion.
In most of the studied cases, the thicknesses were higher in the warm periods than in the cool periods due to the influence of the temperature on the calcite precipitation, except for the RM [22]. This produced a six-month rhythmic pattern for the thicknesses that paralleled the (Mg/Ca)calcite in the cases in which the latter also exhibited a seasonal pattern (Figure 4). The PWP values, depending on the temperature and hydrochemical features, can also exhibit a six-month rhythmic pattern.
The calculated PWP values are in the upper range of the calculated precipitation rates in other tufa-depositing rivers (see the reviewed values in [8]). Overall, except for in the RM, there was a good correspondence between the PWP values and the thicknesses recorded on the tablets, with higher values in the warm periods (Figure 4) (See Section A.4. in Appendix A for details).
The best agreement between the measured thickness and PWP patterns occurred for the RP, for which both parameters exhibited six-month variations (Figure 4), especially for the first time interval (from Warm 2002 to Warm 2006). This differential behaviour of the RP with respect to the other rivers may be related to the lower partitioning coefficients (DMg) for this river. The inorganic precipitation rate influenced the Mg partitioning, at least in the RP, promoting a high (Mg/Ca)calcite and DMg values in the second time interval. According to recent experimental results, this issue may be related to the influence of the precipitation rate on the DMg values in abiotic conditions [51]. In this study we demonstrate, for the first time, the increase in the DMg values in calcite at 25 °C, with calcite precipitation rates from 5 × 10⁻¹⁰ to 2.5 × 10⁻⁸ mmol/cm2/s; this range includes the values calculated for the studied rivers herein. Furthermore, according to the control experiments (abiotic experiments) performed by the authors of [7], there was a significant linear increment between the (Mg/Ca)calcite and precipitation rates (at values from around 5 × 10⁻⁹ to 2.2 × 10⁻⁷ mmol/cm2/s). These results are also consistent with the theoretical fields [58] that predict an increase in the DMg values with the precipitation rate.
All these statements suggest a predominant inorganic precipitation rate control in the DMg values found in the RP, in which the abiotic parameters (e.g., temperature and CO2 outgassing) importantly condition the tufa dynamics along the river [19].

6.2.4. Discharge

With respect to the discharge, the influence on the calcite composition is usually explained through changes in the (Mg/Ca)water [55], due to the residence time of the water in the aquifer: a longer residence time permits the dissolution of higher proportions of Mg from carbonate rocks [53], and it yields higher (Mg/Ca)water values. The studied rivers for this contribution are primarily fed by groundwater, for which the discharge oscillations are not high, except for the high discharge events linked to the punctual heavy rains (see mean discharge values for these rivers in “Location, geological context, climate and hydrology” section). The six-month accumulated discharge variation throughout the study time did not display any clear six-month oscillations, and it did not present any significant relationships with the (Mg/Ca)water, except for some high discharge peaks (e.g., Ebrón: Cool 2009–2010, [21]; Añamaza: Cool 2008–2009; [23]) that coincided with decreases in the (Mg/Ca)water (Figure 4).

6.2.5. Sulphate Content

The onset of the calcite precipitation and the precipitation rate are inhibited by the presence of sulphate [59,60,61,62,63], and this effect could be significant in the rivers with a high sulphate-to-bicarbonate ratio (e.g., from 0.56 to 0.63 in the RA; from 0.18 to 0.33 in the RP and RE; from 0.09 to 0.15 in the RM); however, the authors of [45] did not take this into consideration in their experiment, in which they studied Mg partitioning during the precipitation from sulphate-free solutions.
In this study, the sulphate content in the water had a significant positive correlation with the Mg/Ca ratio of the water (R2 = 0.48), and it had a negative correlation with the DMg (R2 = 0.63) in the RP. In the RM, there was a negative correlation (R2 = 0.838) between the sulphate concentration and Mg/Ca ratio, while the sulphate and DMg did not show any correlation (R2 = 0.008). According to the data for the two sections investigated in the RA, there was no correlation between the dissolved SO4 and (Mg/Ca)water (R2 = 0.05) or DMg (R2 = 0.015). In the other investigated streams, the sulphate did not seem to have any influence on any of the measured (or calculated) parameters. According to a study on the effect of dissolved sulphate on the deposition of tufa in the Trabaque River in Spain [63], the presence of sulphate can either limit or favour the precipitation of CaCO3, depending on the occurrence of the incongruent dissolution of the bedrock dolomite, which subsequently either decreases or increases the DMg. However, the sulphate concentrations in our study were much lower than those discussed in [64] or [61], in which the authors found that the presence of sulphate decreased the calcite precipitation rate, which also affected the DMg.
Overall, the discussion on the effect of the sulphate ions on the Mg/Ca of the studied stromatolites requires more detailed hydrogeological study, which exceeds the scope of this paper.

6.2.6. Biogenic Influence on Stromatolite Mg/Ca

Biogenic processes, which arise from microbial metabolic activities and/or the presence of extracellular polymeric substances (EPSs), may also affect the DMg values through different mechanisms (e.g., the precipitation rate may be controlled by the biofilm growth rate [4,7] or by the presence of compositionally different EPSs [54]). Recently, the authors of [8] found that the spatial evolution of the DMg values along Kaisenger Creek (Germany) could be attributed to the changes in the relative proportions of the bioinfluenced and inorganically driven tufa formation processes, with a higher DMg when the bioinfluenced processes dominate.
Thus, we expected that the stromatolite formation would be enhanced, and higher DMg values would be favoured during the warm periods, whereas we expected lower DMg values in the cool periods, with reduced biological activity rates. If this is true, then the changes in the biological activity would move in the same direction as the observed seasonal effects of the inorganic precipitation rate and the decrease in the calcite solubility with higher temperatures.

6.3. Differential Behaviours of the Studied Rivers

6.3.1. Añamaza River

Neither the (Mg/Ca)water nor the (Mg/Ca)calcite exhibited seasonal evolution. Both had little variation, except in the last period (Cool 2009–2010), when they were inverse (Figure 4). The (Mg/Ca)calcite did not follow the temperature oscillations despite the (Mg/Ca)water stability. The sediment accumulation did not have any relationships with either the (Mg/Ca)water or (Mg/Ca)calcite (Figure 4). The Mg-derived Tw hardly showed seasonality (Table S3, Supplementary Material), and it was substantially higher than the measured Tw. Therefore, neither the temperature nor the (Mg/Ca)water controlled the (Mg/Ca)calcite. The water discharge in this river is relatively constant throughout the year (minimum ecological discharge), which may explain the lack of seasonal changes in the (Mg/Ca)water.

6.3.2. Ebrón River

The (Mg/Ca)calcite exhibited six-month oscillations that were parallel to the measured Tw, even in the season-free evolution (Figure 6). However, the Mg-derived Tw did not fully display the right seasonality, and the Tw values were systematically higher than the measured Tw, with differences of at least 17 °C (Table S3, Supplementary Material). Moreover, although the measured thickness data and (Mg/Ca)water had six-month oscillating patterns (Figure 4), their season-free evolutions were not parallel to the (Mg/Ca)calcite. The PWP values did not show an oscillating pattern (Figure 6).
These results indicate that the (Mg/Ca)calcite is controlled by seasonal factors other than the temperature and (Mg/Ca)water, which enhance the Mg content in the sediment. The six-month thickness evolution over time was opposite to the (Mg/Ca)calcite, which researchers have interpreted as a sign of rapid calcite precipitation in other cases [7]. The higher-than-expected (Mg/Ca)calcite values may reflect the input of the detrital material in the sediment, and likely with six-month variations.

6.3.3. Mesa River

The (Mg/Ca)calcite did not display a rhythmic pattern; thus, it did not reflect either the (Mg/Ca)water oscillating pattern or the measured Tw oscillations (Figure 4). The estimated DMg and, consequently, the Mg-derived Tw, had higher values in the cool periods and lower values in the warm periods, with substantially higher values than the measured Tw (Table S3, Supplementary Material). Moreover, the Mg-derived Tw displayed an increasing season-free evolution over time that paralleled the (Mg/Ca)calc and PWP values, but not the measured Tw (Figure 6). Therefore, we can infer that the stromatolite (Mg/Ca)calcite does not only directly depend on the water temperature but is also controlled by nonseasonal factors that are linked to calcite precipitation, such as changes in the water discharge. Due to the significant correlation between the Al and (Mg/Ca)calcite, we cannot rule out the influence of a Mg detrital source.

6.3.4. Piedra River

The (Mg/Ca)calcite follows a six-month pattern, which yielded the best agreement between the Mg-derived Tw and measured Tw (Figure 4), which occurred despite the fact that the (Mg/Ca)water was not stable and was even inverse with respect to the (Mg/Ca)calcite for many periods. In addition to the RA, this river had the lowest (Mg/Ca)calcite values, the lowest DMg and the more realistic Mg-derived Tw values.
According to the relationships between the (Mg/Ca)calcite and other parameters, we distinguished two different time intervals:
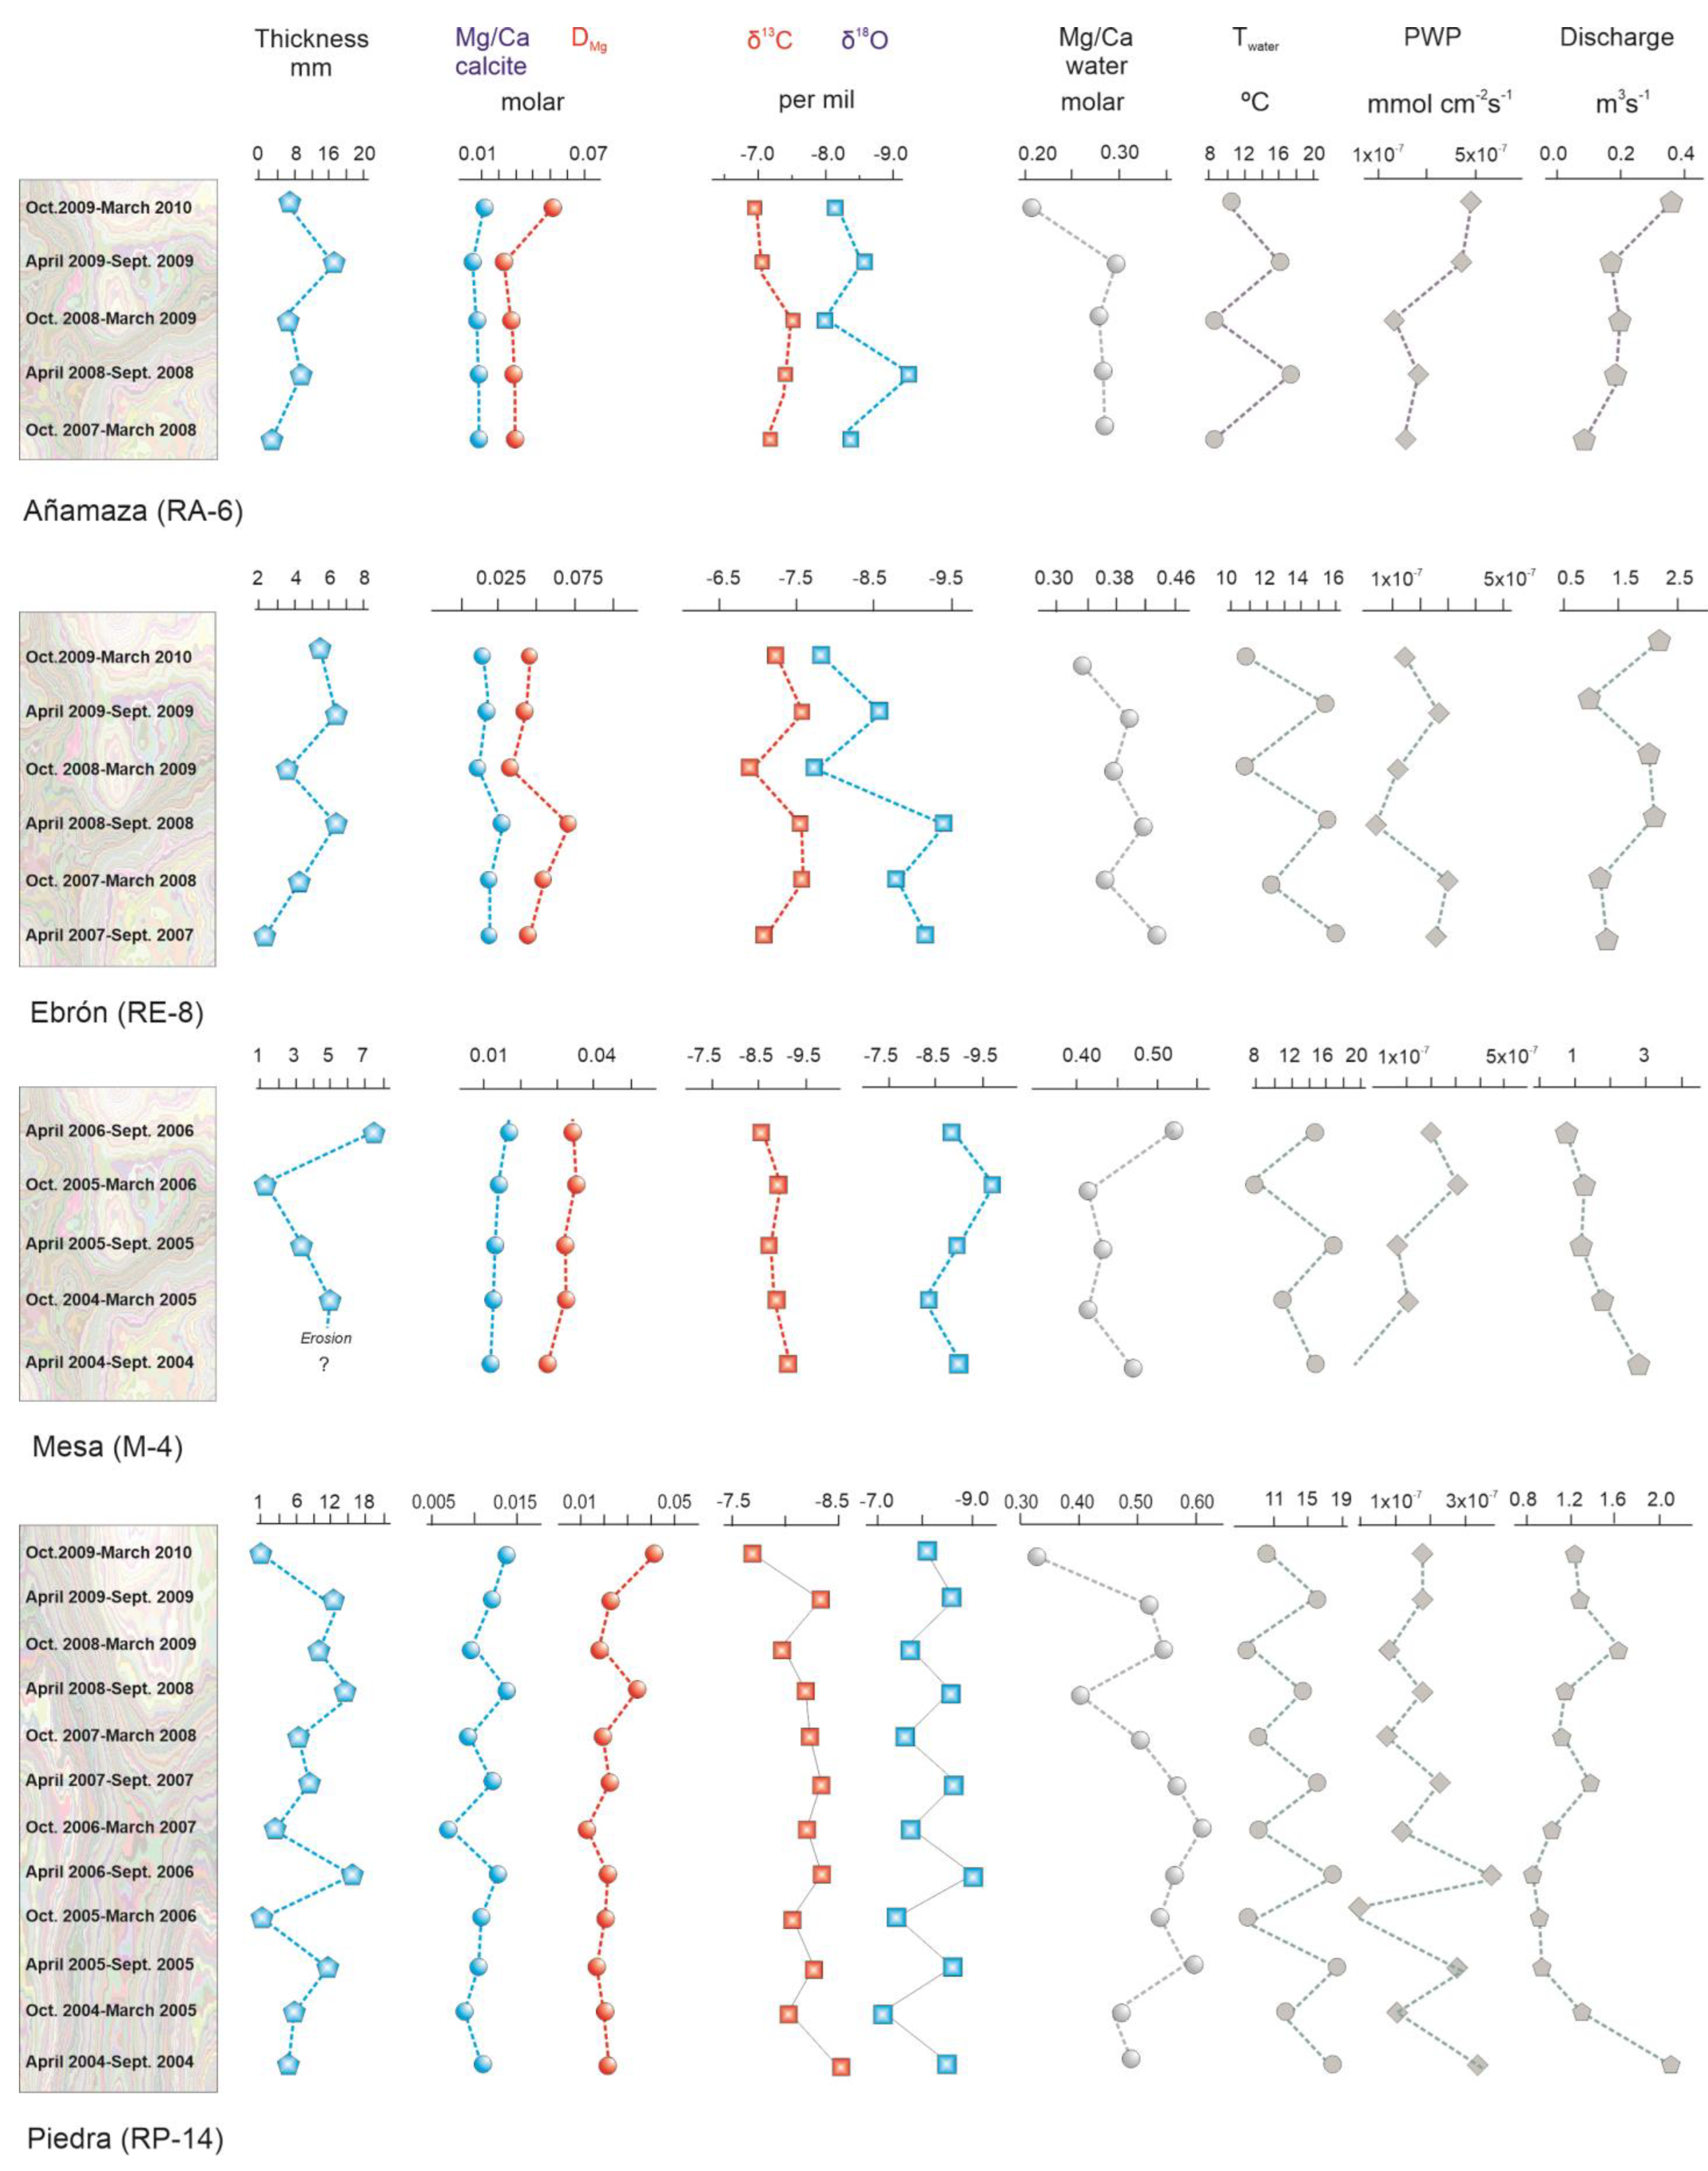
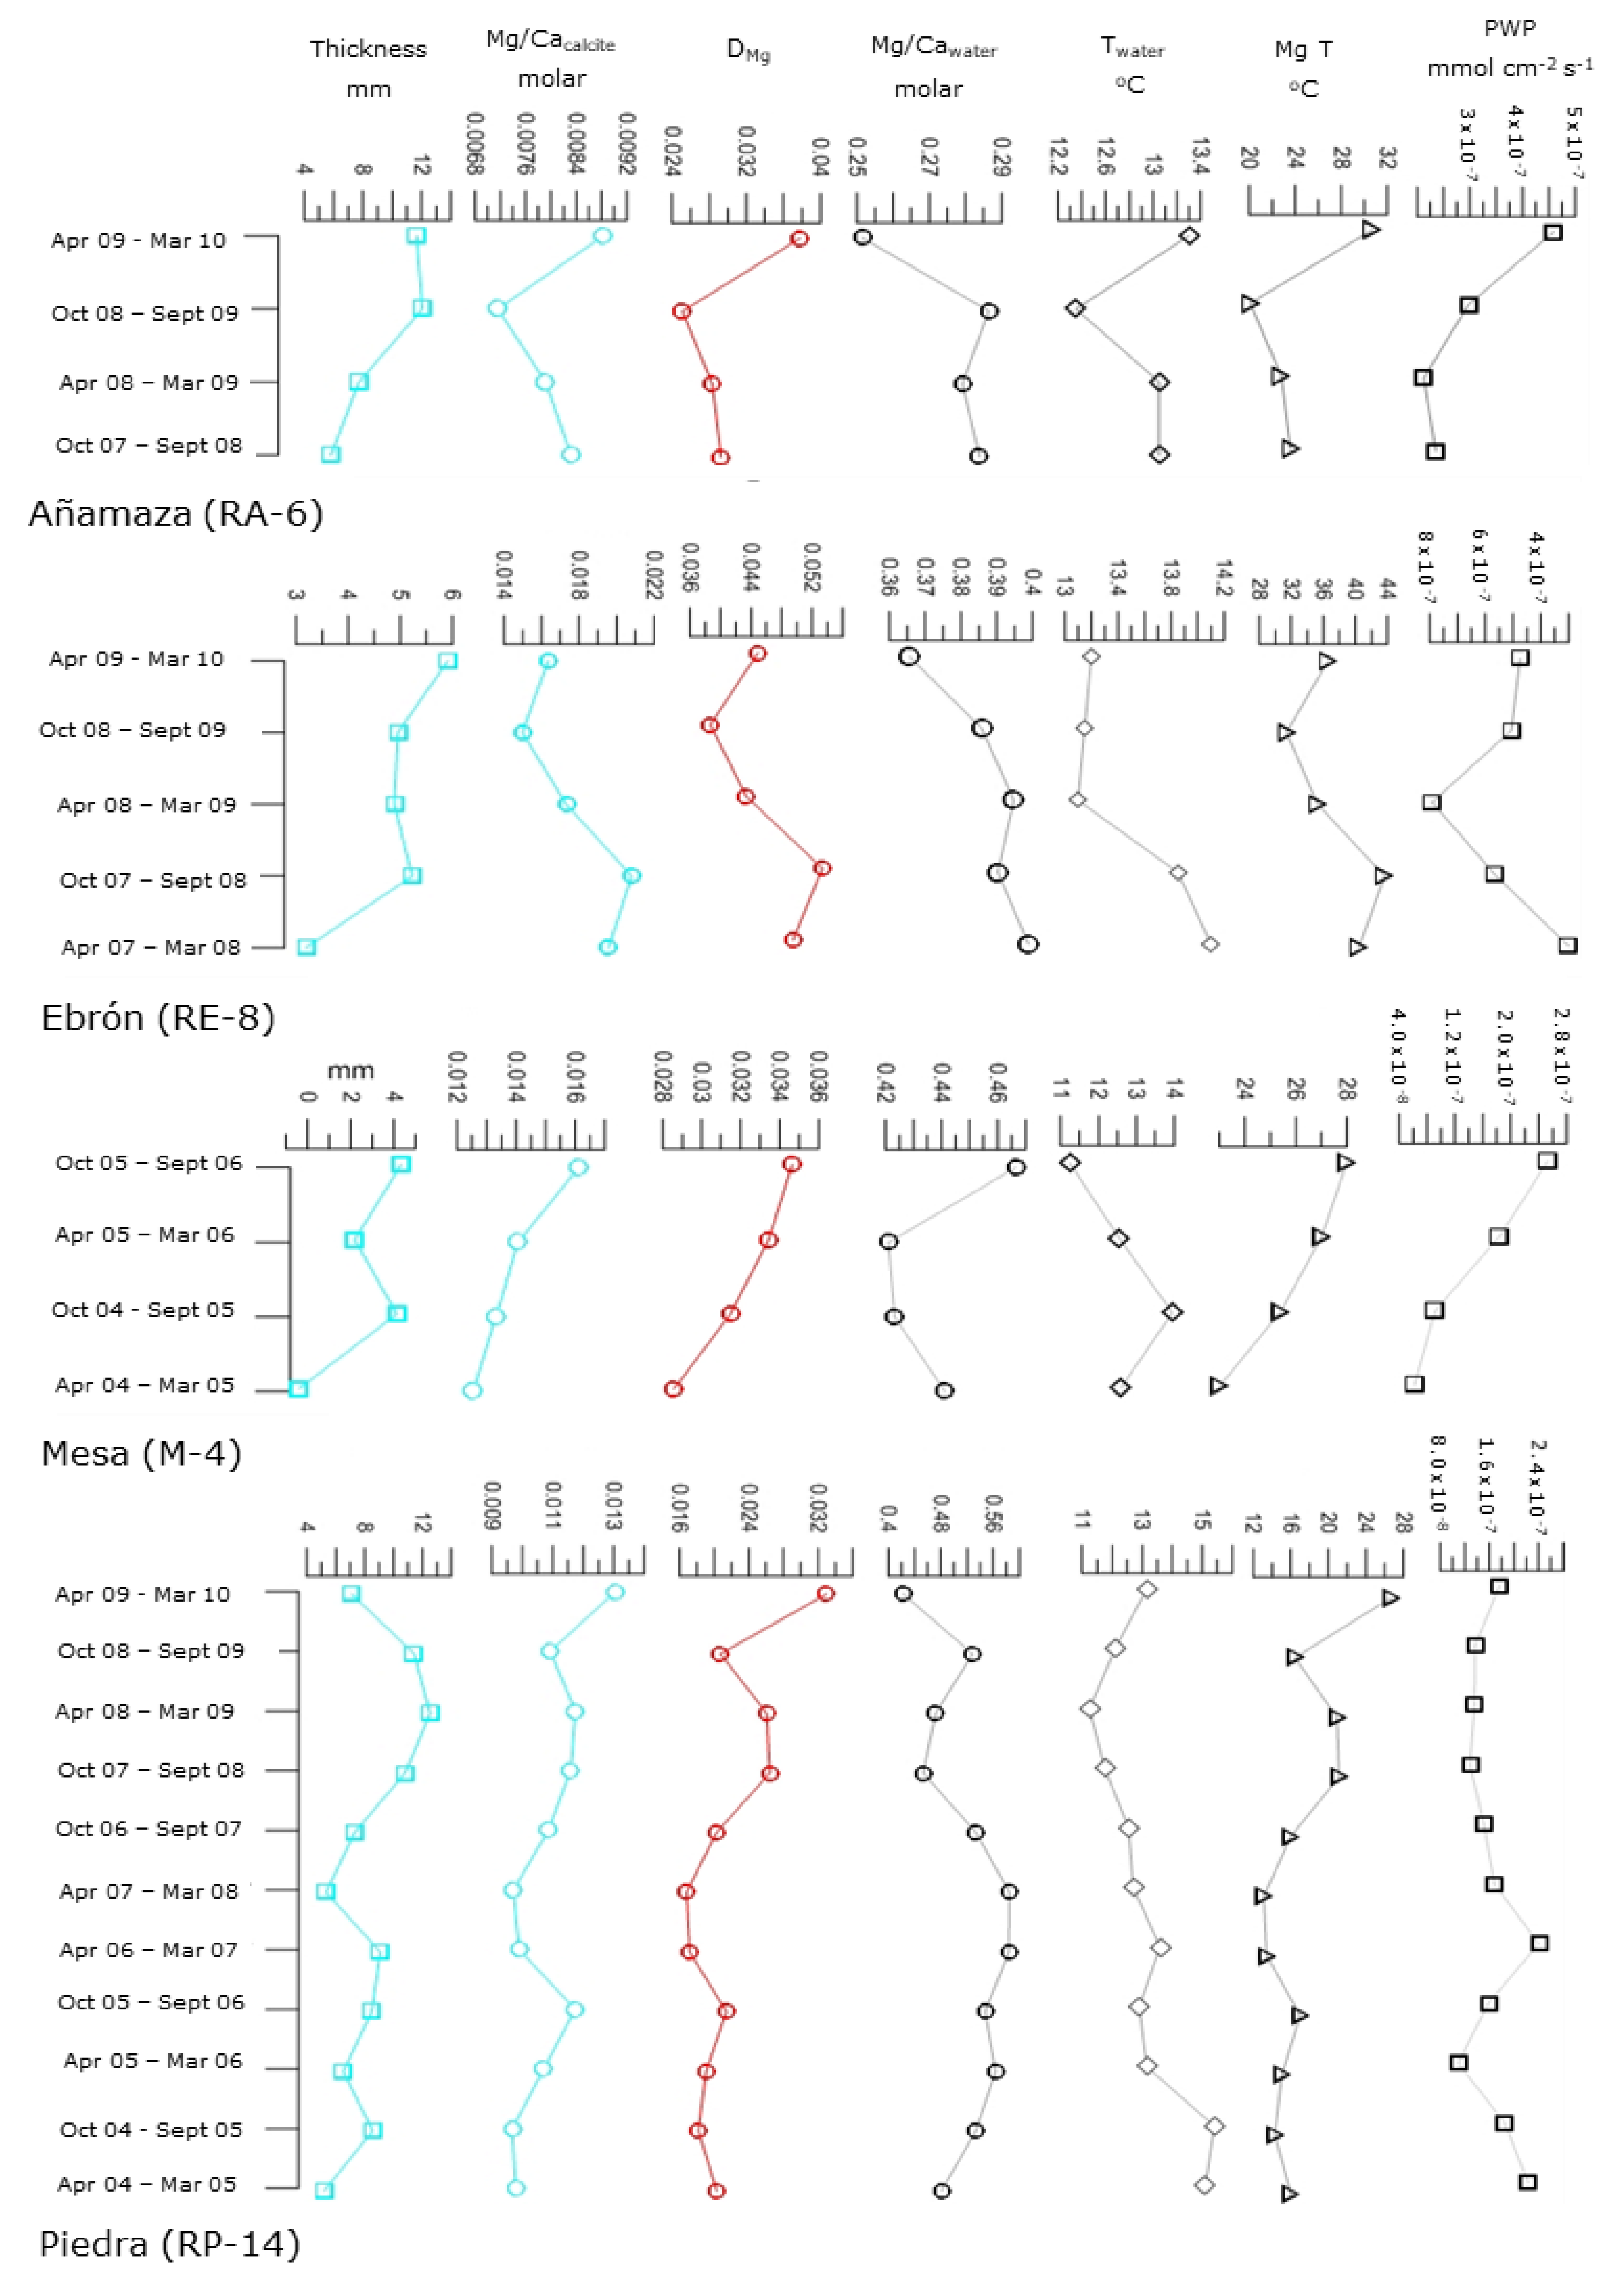
  • In the first time interval (from Warm 2004 to Warm 2006), the (Mg/Ca)water values were higher in the warm periods and had lower values in the cool periods (Figure 4), which highlight the temperature-partitioning effect (higher temperatures allow more Mg to enter into the calcite structure). However, the (Mg/Ca)calcite oscillations were small, and thus, the empirical DMg was flattened (Figure 4), which determined that the Mg-derived Tw did not exhibit seasonal changes. Nevertheless, the corresponding Mg-derived Tw was the closest to the measured Tw as compared with the other rivers (Table S3, Supplementary Material). The PWP and sediment thickness values paralleled the Tw, with wide oscillations (Figure 4). Their season-free evolutions were also roughly parallel (Figure 6). Therefore, the (Mg/Ca)calcite maintains the general Tw signature, although the parallel evolution of the (Mg/Ca)water and (Mg/Ca)calcite can erase the six-month changes in the estimated Tw. We found no evidence of detrital Mg in the corresponding sediment.
  • In the second time interval (from Cool 2006–2007 to Cool 2009–2010), the (Mg/Ca)water pattern did not match the (Mg/Ca)calcite variation, and it was even opposite to both the calculated and measured Tw. Therefore, the empirical DMg oscillations were amplified by the high (Mg/Ca)water values in the cool periods, when the (Mg/Ca)calcite was lower. The Tw values obtained from this DMg, and from the formula in [45], exhibited the expected six-month oscillations; however, these were systematically higher (Table S3, Supplementary Material) not only in the warm periods, when the estimated DMg was too high, but also in the cool periods, which means that the stromatolite (Mg/Ca)calcite was still higher than it should have been for the (Mg/Ca)water and water temperature at which it was formed. Despite the six-month oscillation of the Mg-derived Tw, the corresponding season-free evolution was not parallel to the measured Tw (Figure 6). Therefore, another control over Mg entry into the calcite lattice has overprinted the influence of temperature on the (Mg/Ca)calcite. The significant correlation between the contents in Al and (Mg/Ca)calcite (Table 3) and the enhanced six-month oscillations of the (Mg/Ca)calcite (with respect to the first time interval) point to the influence of a Mg detrital source.
In the RP, the six-month thickness and PWP values mimic the (Mg/Ca)calcite pattern, except in the Cool 2009–2010 period, during which the (Mg/Ca)calcite and Mg-derived Tw were also anomalous (Figure 4). However, the PWP season-free evolution matched the measured Tw evolution (Figure 6), while the six-month thickness evolution was not well marked in any of the periods of this second time-interval (from Cool 2006–2007 to Cool 2009–2010). During this time interval, the sediment thickness increased and had high values, even for the cool periods. The influence of the growth rate on the Mg content in the sediment through the Mg entry into the calcite in natural systems may be responsible for the increase in the stromatolite (Mg/Ca)calcite [8], which would at least partially explain the anomalously high Mg-derived Tw. We cannot rule out the presence of a certain amount of Mg of detrital origin, as well as the biological influence.
In summary, the RP has the best adjustment between the Mg-derived and measured Tw. In addition, it also had the lowest estimated DMg, which was mostly below 0.025. According to the relationship between the Mg-derived and measured Tw, we distinguished two time intervals. In the first time interval (from Warm 2004 to Warm 2006), the Mg-derived Tw fit quite closely to the measured Tw, although neither of them exhibited seasonal oscillations. In the second time interval (from Cool 2006–2007 to Cool 2009–2010), the Mg-derived Tw displayed six-month changes; however, the values overpassed the measured Tw, and the season-free evolutions were very different. In the first interval, the (Mg/Ca)calcite reflected the average Tw, although it did not show a seasonal pattern linked to the (Mg/Ca)water six-month oscillations. In the second time interval, the different influences on the (Mg/Ca)calcite emphasize the six-month oscillations and magnify the Mg entry into the sediment. The presence of Mg from detrital particles (dolomite and chlorite) could have also contributed to the increase in the (Mg/Ca)calcite.

6.4. Comparison with Other Systems

Until now, only a few researchers have investigated tufas and water chemistry in enough detail to evaluate the behaviour of the trace elements, such as Mg, as proxies of tufa palaeothermometry through the calculation of the DMg (e.g., [6,8]).
We present the mean DMg and Tw values obtained in other tufa-depositing rivers and streams from the scarce data in the literature [1,6,8,65] in Figure 7, which we compared with the mean values from the tufa deposits and rivers in this study. In addition, we included the values obtained from travertine deposits in low-temperature thermal waters [66] and speleothems [9,45,67,68] for comparison.
As we can see in Figure 7, the DMg values of the stromatolites in the RE were the highest out of the four compared examples, although they were only slightly higher than those found in the Krka River (Slovenia) by the authors of [6]. The partition coefficients in other tufa-depositing rivers (Hvanná, Krka, Gregory and Kainsinger) had an even wider range than of the rivers studied herein. Moreover, the DMg values of the compared speleothems had an even a wider range than those in tufas and travertines, although most of them (excluding the data from the cave in Jamaica studied in [67]) are usually lower.
The distribution of the plotted DMg-T points in Figure 7 again suggests that the temperature is not the only/main factor that conditions the partition coefficient values for the compared tufas, which explains the unrealistically high temperatures that were obtained from the available DMg-T experimental relationships (also presented in Figure 7).
However, the results obtained from the recent travertine deposits at the Embid and Alhama thermal springs almost perfectly fit with the DMg-T relationship in [45], as adjusted by the authors of [3]. The low-temperature thermal waters at Embid and Alhama are also dilute waters of the SO4–HCO3–Ca type, with constant temperatures (between 27.2 and 32.4 °C at the studied springs) and chemical compositions over time (e.g., [66]). The values of the travertine samples plotted in Figure 7 correspond to the deposits that precipitate near the spring orifice, and in most cases, they are of inorganic origin (or with minor biological participation and without the contribution of detrital sediment). Thus, it appears that the constant temperature and chemical composition (e.g., (Mg/Ca)water values (mostly around 0.7) [66]) of the waters during the precipitation process would favour the dominant role of the temperature over the Mg partitioning in the travertines, which additionally support the experimental DMg-T relationship in [45].
The travertine points in Figure 7 are also close to the Gregory River mean DMg and temperature values provided in [1]. This study is the only successful “thermometrical” application of the Mg partitioning in fluvial tufas from the literature. As in other tufa deposits, other factors besides the temperature may influence Mg partitioning (e.g., the biological influence through the effects of EPSs); however, the high deposition temperature in the Gregory River (with a mean value of 27.7 °C for the studied period, which was the highest among all of the compared rivers (Figure 7)) apparently dominates the partitioning process. Whether this high-temperature value is enough to dominate the process or whether the effects of other influencing processes must decrease at the same time should be further studied.

7. Conclusions

We analysed the Mg/Ca ratios of the recent stromatolite records of four rivers on the Iberian Peninsula and the different linked parameters, and we compared them to similar systems. We derived several conclusions from this work:
  • We tested the equation in [45] in four different fluvial stromatolite records, and we found limited application. Except for the work of [1], this study is one of the few cases (i.e., Piedra River) in which the Mg-derived water temperatures match the measured ones, in the fluvial environment.
  • The degree of the consistency between the Mg-derived water temperatures and measured water temperatures was variable, depending on the studied cases, which indicates that factors other than the temperature influence the (Mg/Ca)calcite. This result is contrary to the high degree of agreement between the δ18O-derived and measured temperatures for the same samples.
  • The Mg contents of detrital minerals were responsible for the offset of the Mg-derived water temperatures towards higher values than the measured water temperatures in at least one of the studied rivers (Piedra River), in which the correction of the detrital Mg content yielded water temperatures that matched the measured ones.
  • In the three other studied cases, we need to consider the interference of several other factors, either seasonal or not, to explain the lack of agreement between the estimated and measured temperatures, such as the changes in the calcite precipitation rates and water discharges. The seasonal behaviour of the Mgcalcite, and its circumstantial correlation with the temperature, may be due to the influence of other seasonal parameters.
  • The presence of noncarbonate Mg (and Ca) minerals, and the occurrence of nonequilibrium conditions in natural systems (e.g., variable flow rates, turbulent flows, the presence of biofilms or plant substrates), substantially limit the use of the (Mg/Ca)cacite as a geochemical thermometer in continental sedimentary environments, except for well-defined systems (e.g., laminar flow, small seasonal variations, and in some hydrothermal systems).
  • For the first time, we demonstrate the seasonal variation in the (Mg/Ca)calcite and DMg in fluvial carbonates. Moreover, the seasonal variations in these two parameters are not necessarily associated with the temperature or temperature-dependent parameters, which researchers have recorded in the Piedra River and partially in the Ebrón River stromatolite records.

Supplementary Materials

The following supporting information can be downloaded at: https://www.mdpi.com/article/10.3390/min13010057/s1, Figure S1: Piper diagrams for the waters of (A) Piedra, (B) Mesa, (C) Ebrón and (D) Añamaza Rivers; Figure S2: Box-and-whisker plots of the statistical distribution of Mg/Ca values in water samples biannually taken at studied sites in Piedra, Mesa, Ebron and Añamaza Rivers (P-14, M-4, RE-8 and RA-6, respectively); Figure S3: Experimental relationships between water temperature and magnesium partition coeficient DMg determined in [45,46] under karst/speleothem-analogue conditions. Table S1: Concentrations of Ca and Mg (in mg/kg) in the tufa samples recorded on Tablets P-14 (Piedra River), M-4 (Mesa River), RA-6 (Añamaza River) and RE-8 (Ebrón River) over time; Table S2: Hydrochemical characteristics of monitored sites in Piedra, Mesa, Añamaza and Ebrón Rivers. Concentrations in ppm; Table S3: Measured water (Tw), calculated TMg (using DMg–T relationship in [45]) and calculated T18O (from δ18O values in calcite and water, using the equation of [47]) temperatures for studied sites at Piedra, Mesa, Añamaza and Ebrón Rivers; Table S4. Values of δ18 O and δ13 C (in ‰ VPDB) of tufa calcite recorded over time on Tablets P-14 (Piedra River), M-4 (Mesa River), RA-6 (Añamaza River) and RE-8 (Ebrón River).

Author Contributions

C.A., L.F.A., M.C.O. and C.S. performed the field work, laboratory sampling and the interpretation of the sediment and water results. N.C. performed the trace element analyses of the sediment and water. S.L. participated in the analysis of the stable isotope compositions of the sediment samples. All authors have read and agreed to the published version of the manuscript.

Funding

This research was funded by the Spanish Ministry through grants REN2002-3575/CLI, CGL2006-05063/BTE, CGL2009-09216/BTE and PID2019-106440GB-C22 (MCIN/AEI/ 10.13039/501100011033) and by the Slovenian Research Agency, research project J1-2478 and research program P1-0143.

Data Availability Statement

The data are reported either in the main text or in the Supplementary Materials.

Acknowledgments

The authors would like to acknowledge the use of the Servicio General de Apoyo a la Investigación-SAI, Universidad de Zaragoza, Spain, and the Servicios Científico-Técnicos (CCIT-UB Serveis), University of Barcelona, Spain. We are grateful to the management and staff of the Monasterio de Piedra Natural Park for facilitating our fieldwork. We would like to kindly acknowledge Marta Vázquez Urbez for her scientific help and the two anonymous reviewers for their comments on the manuscript. This paper is dedicated to the memory of our colleague and friend, Carlos Sancho, who passed away during the preparation of this manuscript.

Conflicts of Interest

The authors declare no conflict of interest.

Appendix A. Influence of the Parameters Controlling (Mg/Ca)calcite on the Four Rivers

Appendix A.1. (Mg/Ca)calcite and Measured Tw

The RE values had the highest direct correlation between the (Mg/Ca)calcite and measured Tw (r = 0.69, N = 6), and both patterns were roughly parallel. In the RM, there was no correlation (r = −0.02, N = 5), and in the RA, there was a hardly significant correlation (r = −0.31, N = 5). In the RP, the correlation was r = 0.39 (N = 12); however, it was poorer over the first interval (from Warm 2004 to Warm 2006) (r = 0.38, N = 5) and higher over the second interval (from Cool 2006–2007 to Cool 2009–2010) (r = 0.57, N = 7). The significant positive correlations do not necessarily imply the dependence of the (Mg/Ca)calcite on the temperature; however, they may depend on the six-month oscillations of both the (Mg/Ca)calcite and Tw parameters. In the RE, which had the highest differences between the (Mg/Ca)calcite-based, estimated Tw and the measured Tw (Figure 4), the highest correlation was between the Tw and (Mg/Ca)calcite, and it had the clearest (Mg/Ca)calcite pattern. On the contrary, the RP only had a roughly rhythmic (Mg/Ca)calcite pattern, and it exhibited the lowest differences between the (Mg/Ca)calcite-derived and measured Tw. In the RA and RM, there were no six-month variations in the (Mg/Ca)calcite, and there was no significant correlation between the (Mg/Ca)calcite and measured Tw.
With respect to the season-free evolutions, in the RE and RA, the (Mg/Ca)calcite and measured Tw were only vaguely parallel. (Figure 6). In the RM, the evolutions of the (Mg/Ca)calcite and Tw were opposite. Even in the RP, which had the best fitting between the Mg-derived Tw and measured Tw, the season-free evolutions were not parallel.

Appendix A.2. Mg/Ca of Water

In the RE, the (Mg/Ca)water and (Mg/Ca)calcite had seasonal variations, and although the correlation was not strong (r = 0.55, N = 6), both had similar season-free evolutions (Figure 6). Moreover, the corresponding DMg parallels the (Mg/Ca)calcite, especially in terms of the season-free evolution (Figure 6). Therefore, the Mg-derived Tw, through the DMg, exhibited a broad six-month oscillation, with some exceptions. Despite this positive outcome, the estimated Tw values (minimum value = 27.7 °C, maximum value = 44.4 °C) were not plausible, due to the high (Mg/Ca)calcite values with respect to the (Mg/Ca)water values (Table 1), which is why the DMg predominantly reflects the (Mg/Ca)calcite pattern.
According to these results, additional factors other than the temperature and (Mg/Ca)water influence the (Mg/Ca)calcite, and these also operate on a seasonal basis. Unlike in the RP, in the RE, the incorporation of Mg into calcite was favoured above the theoretical partitioning values.
In the RA, in which the (Mg/Ca)water was quite constant over time, the (Mg/Ca)calcite was also constant, except in the last period (Cool 2009–2010), when both parameters and their inter-annual evolutions were opposite (Figure 4). The ratio of these parameters results is a quasistable DMg, with a sharp increase in the last period and the consequent temperature spikes over 43 °C (Table S3, Supplementary Materials). The DMg (and the Mg-derived Tw) mimics the (Mg/Ca)calcite variations; therefore, the Mg-derived Tw values did not exhibit six-month oscillations, and they were also higher than the real ones, which means that the (Mg/Ca)calcite was higher than it should have been with respect to the (Mg/Ca)water.
In these cases, the temperature effect on Mg partitioning in calcite was overprinted by the influence of parameters other than the (Mg/Ca)water on the (Mg/Ca)calcite content. Unlike the first time interval of the RP (from Warm 2004 to Warm 2006), the Mg-derived Tw were higher than the measured Tw, evidencing higher (Mg/Ca)calcite values than were expected from the (Mg/Ca)water content. In the RA, there was no relationship between the (Mg/Ca)calcite and Tw measures.
In the RM, the (Mg/Ca)water had a dizzy seasonal pattern; however, the oscillations were small, except in the last period (Warm 2006) (Figure 4). Like in the RA, there was no apparent influence of the (Mg/Ca)water variations on the (Mg/Ca)calcite of the RM. Thus, the (Mg/Ca)calcite irregularly varied with respect to the (Mg/Ca)water (Figure 4), and its season-free evolutions were apparently not related to each other (Figure 6). The result was an oscillating DMg with an increasing season-free evolution, which mimicked the (Mg/Ca)calcite season-free evolution (Figure 6). Consequently, the Mg-derived Tw had a reversed oscillating pattern, with higher values in the cool periods (Table S3, Supplementary Materials), and a range that was narrower than that of the measured Tw.
In the RP, in the first interval (from Warm 2004 to Warm 2006), when both the (Mg/Ca)water and (Mg/Ca)calcite displayed parallel six-month oscillations (r = 0.59 (N = 5)), the six-month changes were almost fully compensated for the DMg calculation. As a consequence, the Mg-derived Tw (Equation (3)) did not show six-month variations, although the calculated Tw values fit quite closely with the average measured Tw values. On the contrary, in the interval spanning from Cool 2006-2007 to Cool 2009-2010, which had one of the highest correlations between the (Mg/Ca)calcite and measured Tw (r = 0.57, N = 7), the (Mg/Ca)water was negatively correlated to the (Mg/Ca)calcite (r = −79, N = 7), and their season-free evolutions were almost opposite (Figure 6). Therefore, the high (Mg/Ca)water in the cool periods should, to some extent, compensate for the temperature Mg-partitioning effects and produce a relatively stable (Mg/Ca)calcite pattern. On the contrary, in this time interval, the six-month oscillations of the (Mg/Ca)calcite were wider than in the first interval (from Warm 2002 to Warm 2006) (Figure 4), and this amplitude was transferred to the empirical DMg. The highest DMg values corresponded to Warm 2008 and Warm 2009 (Figure 4), in which the minimum (Mg/Ca)water values coincided with the maximum (Mg/Ca)cacite values. Therefore, although the Mg-derived Tw values had a realistic, six-month oscillating pattern, the estimated Tw values were substantially higher than the measured Tw, and the season-free evolution of the Mg-derived Tw was not parallel to the measured Tw (Figure 6). The different behaviours during the two time intervals in the same river suggest a quick change in the controls on the (Mg/Ca)calcite, which in the second time interval (from Cool 2006–2007 to Cool 2009–2010), overprint the variations in the (Mg/Ca)water.

Appendix A.3. Detrital Minerals

If the Tw is recalculated after subtracting 500 ppm from the Mg values, the mean DMg and the corresponding estimated Tw decreases in the four rivers:
  • In the RP, the mean DMg decreases from 0.023 to 0.018, and the calculated Mg-derived Tw is 3.7 °C lower. This value cancels out the mean difference between the estimated and measured Tw in the first time interval (from Warm 2004 to Warm 2006) (3.02 °C, Table 2); in the second time interval (from Cool 2006–2007 to Cool 2009–2010), the difference of 7.6 °C is substantially reduced with this correction.
  • In the RE, the mean DMg decreases from 0.046 to 0.040, and the calculated Tw is 5 °C lower. These temperatures are still far from the measured ones, which are 27 °C lower as an average. Therefore, a larger amount of detrital matter would be required to fit that value.
  • In the RA, the mean DMg decreases from 0.032 to 0.023, and the calculated Tw is 7.4 °C lower. Again, this value is rather behind 13.9 °C, which is the mean difference between the estimated and measured Tw.
  • In the RM, the mean DMg decreases from 0.032 to 0.026, and the calculated Tw is 4.2 °C lower than the previously estimated value. This correction does not compensate for the 12.7 °C offset between the measured and calculated Tw.
If the Mg content corresponding to the measured Tw is estimated from the measured (Mg/Ca)water, by using Equations (2) and (3), it can be shown that the first time interval for the RP (from Warm 2002 to Warm 2006) had the smallest mean Mg excess (568 ppm), which was quite close to the Mg that corresponded to the detrital fraction; the second interval (from Cool 2006–2007 to Cool 2009–2010) had a higher Mg excess (1003 ppm), which was similar to that of the RA (959 ppm). This Mg excess was much higher in the RM (1608 ppm) and, especially, in the RE (2494 ppm). The latter values are difficult to explain based on the Mg content from the detrital fraction, even though there was a larger proportion of detrital Mg (from both clay minerals and dolomite) in the sample.

Appendix A.4. Precipitation Rate

In the RA, both measured thicknesses and calculated PWP values displayed the expected rhythmic pattern (higher in the warm periods), except for the PWP values in the last period (Cool 2009–2010) (Figure 4). Therefore, there was a good correspondence between the calculated PWP values (higher in the warm periods) and measured thicknesses. However, their season-free evolutions were not parallel to each other. The (Mg/Ca)calcite and DMg values only had minor variations over time, for which they did not mimic either of the two growth rates. The (Mg/Ca)calcite season-free evolution was closer to the PWP value than to the sediment thickness, which was opposite to the (Mg/Ca)calcite (Figure 6).
In the RE, the measured thickness had the expected six-month rhythmic pattern, only it was reversed in the first period, and the PWP values only displayed this pattern in the last three periods (Figure 4). Thus, they had neither parallel patterns, nor parallel season-free evolutions (Figure 6). The (Mg/Ca)calcite had six-month variations, and it matched the thicknesses measured on the tablets (except for Warm 2007) and the PWP values in the last three periods. However, the corresponding season-free evolutions of the (Mg/Ca)calcite and thicknesses were not parallel; the measured thicknesses and the season-free evolution were opposite to the (Mg/Ca)calcite. Researchers have described this reverse relationship between the (Mg/Ca)calcite and both types of deposition rates for other tufa sediments, in which the kinetic effects of the rapid calcite precipitation yield to a Mg-impoverished calcite [7].
In the RM, the rhythmic pattern of the PWP values was reversed compared with the other studied rivers, (i.e., higher values for the cool periods and lower values for the warm periods; Figure 4). Thus, the PWP patterns did not match the measured thickness rates, although both displayed increasing season-free evolutions (Figure 6). The PWP values paralleled the reversed pattern of the DMg. Contrarily, the (Mg/Ca)calcite values did not mimic the PWP pattern; however, their corresponding season-free evolutions followed parallel trends (Figure 6), as did the measured thickness rates, despite the fact that we detected erosional processes in this record.
The best agreement between the measured thickness and PWP patterns occurred for the RP, for which both parameters exhibited six-month variations (Figure 4). However, their season-free evolutions were not fully parallel (Figure 6): in the second time interval (from Cool 2006–2007 to Cool 2009–2010), they were reversed. The (Mg/Ca)calcite was broadly coupled with the sediment thickness and PWP values in this second time interval, in which it exhibited a six-month oscillation. In this time interval, the season-free evolution of the (Mg/Ca)calcite roughly paralleled the sediment thickness, but not the PWP values. This time interval coincided with an increase in the sediment accumulation, which was higher than those in the RE and RM and similar to that of the RA.

References

  1. Ihlenfeld, C.; Norman, M.D.; Gagan, M.K.; Drysdale, R.N.; Maas, R.; Webb, J. Climatic significance of seasonal trace element and stable isotope variations in a modern freshwater tufa. Geochim. Cosmochim. Acta 2003, 67, 2341–2357. [Google Scholar] [CrossRef]
  2. Kawai, T.; Kano, A.; Matsuoka, J.; Ihara, T. Seasonal variation in water chemistry and depositional processes in a tufa-bearing stream in SW-Japan, based on 5 years of monthly observations. Chem. Geol. 2006, 232, 33–53. [Google Scholar] [CrossRef]
  3. Lojen, S.; Trkov, A.; Scancar, J.; Vázquez-Navarro, J.A.; Cukrov, N. Continuous 60-year stable isotopic and earth-alkali element records in a modern laminated tufa (Jaruga, river Krka, Croatia): Implications for climate reconstruction. Chem. Geol. 2009, 258, 242–250. [Google Scholar] [CrossRef]
  4. Rogerson, M.; Pedley, H.M.; Wadhawan, J.D.; Middleton, R. New insights into biological influence on the geochemistry of freshwater carbonate deposits. Geochim. Cosmochim. Acta 2008, 72, 4976–4987. [Google Scholar] [CrossRef]
  5. Brasier, A.T.; Andrews, J.E.; Marca-Bell, A.D.; Dennis, P.F. Depositional continuity of seasonally laminated tufas: Implications for δ18O based palaeotemperatures. Glob. Planet. Change 2010, 71, 160–167. [Google Scholar] [CrossRef]
  6. Zavadlav, S.; Rožič, B.; Dolenec, M.; Lojen, S. Stable isotopic and elemental characteristics of recent tufa from a karstic Krka River (south-east Slovenia): Useful environmental proxies? Sedimentology 2017, 64, 808–831. [Google Scholar] [CrossRef]
  7. Saunders, P.; Rogerson, M.; Wadhawan, J.D.; Greenway, G.; Pedley, H.M. Mg/Ca ratios in freshwater microbialcarbonates: Thermodynamic, kinetic and vital effects. Geochim. Cosmochim. Acta 2014, 147, 107–118. [Google Scholar] [CrossRef]
  8. Ritter, S.M.; Isenbeck-Schröter, M.; Schröder-Ritzrau, A.; Scholz, C.; Rheinberger, S.; Höfle, B.; Frank, N. Trace element partitioning in fluvial tufa reveals variable portions of biologically influenced calcite precipitation. Geochim. Cosmochim. Acta 2018, 225, 176–191. [Google Scholar] [CrossRef]
  9. Fairchild, I.J.; Borsato, A.; Tooth, A.F.; Frisia, S.; Hawkesworth, C.J.; Huang, Y.-M.; McDermott, F.; Spiro, B. Controls on trace element (Sr-Mg) compositions of carbonate cave waters: Implications for speleothem climatic records. Chem. Geol. 2000, 166, 255–269. [Google Scholar] [CrossRef]
  10. Pogge von Strandmann, P.; Burton, K.; Snæbjörnsdóttir, S.O.; Sigfusson, B.; Aradottir, E.; Gunnarsson, I.; Alfredsson, H.; Mesfin, K.; Oelkers, E.; Gislason, S. Rapid CO2 mineralisation into calcite at the CarbFix storage site quantified using calcium isotopes. Nat. Commun. 2019, 10, 1983. [Google Scholar] [CrossRef]
  11. Zhao, M.; Zheng, Y.F.; Zhao, Y. Seeking a geochemical identifier for authigenic carbonate. Nat. Commun. 2016, 7, 10885. [Google Scholar] [CrossRef] [PubMed] [Green Version]
  12. Rovan, L.; Zuliani, T.; Horvat, B.; Kanduč, T.; Vreča, P.; Jamil, Q.; Čermelj, B.; Bura-Nakić, E.; Cukrov, N.; Štrok, M.; et al. Uranium isotopes as a possible tracer of terrestrial authigenic carbonate. Sci. Total Environ. 2021, 797, 194103. [Google Scholar] [CrossRef]
  13. Osácar, M.C.; Arenas, C.; Auqué, L.; Sancho, C.; Pardo, G.; Vázquez-Urbez, M. Discerning the interactions between environmental parameters reflected in δ13C and δ18O of recent fluvial tufas: Lessons from a Mediterranean climate región. Sediment. Geol. 2016, 345, 126–144. [Google Scholar] [CrossRef] [Green Version]
  14. Vera, J.A. Geología de España; SGE-IGME: Madrid, Spain, 2004; p. 884. [Google Scholar]
  15. Lozano, M.V.; Sancho, C.; Arenas, C.; Vázquez-Urbez, M.; Ortiz, J.E.; Torres, T.; Pardo, G.; Osácar, M.C.; Auqué, L. Analisis preliminar de las tobas cuaternarias del Río Ebrón (Castielfabib, Valencia, Cordillera Ibérica). Geogaceta 2012, 51, 51–54. [Google Scholar]
  16. Vázquez-Úrbez, M.; Arenas, C.; Pardo, G. A sedimentary facies model for stepped, fluvial tufa systems in the Iberian Range (Spain): The Quaternary Piedra and Mesa valleys. Sedimentology 2012, 59, 502–526. [Google Scholar] [CrossRef]
  17. Rico, M.T.; Sancho-Marcén, C.; Arenas-Abad, M.C.; Vázquez-Urbez, M.; Valero-Garcés, B.L. El sistema de barreras tobáceas Holocenas de las Parras de Martín (Cordillera Ibérica, Teruel). Cuad. Investig. Geogr. 2013, 39, 141–158. [Google Scholar] [CrossRef] [Green Version]
  18. Luzón, M.A.; Pérez, A.; Borrego, A.G.; Mayayo, M.J.; Soria, A.R. Interrelated continental sedimentary environments in the central Iberian Range (Spain): Facies characterization and main palaeoenvironmental changes during the Holocene. Sediment. Geol. 2011, 239, 87–103. [Google Scholar] [CrossRef]
  19. Arenas, C.; Vázquez-Urbez, M.; Auqué, L.; Sancho, C.; Osácar, M.C.; Pardo, G. Intrinsic and extrinsic controls of spatial and temporal variations in modern fluvial tufa sedimentation: A thirteen-year record from a semi-arid environment. Sedimentology 2014, 61, 90–132. [Google Scholar] [CrossRef] [Green Version]
  20. Osácar, C.; Arenas, C.; Vázquez-Urbez, M.; Sancho, C.; Auqué, L.F.; Pardo, G. Environmental factors controlling the δ13C and δ18O variations of recent fluvial tufas: A 12-year record from the Monasterio de Piedra Natural Park (NE Iberian Peninsula). J. Sediment. Res. 2013, 83, 309–322. [Google Scholar] [CrossRef]
  21. Arenas, C.; Auqué, L.; Osácar, M.C.; Sancho, C.; Lozano, M.V.; Vázquez-Urbez, M.; Pardo, G. Current tufa sedimentation in a high discharge river: A comparison with other synchronous tufa records in the Iberian Range (Spain). Sediment. Geol. 2015, 325, 132–157. [Google Scholar] [CrossRef]
  22. Auqué, L.; Arenas, C.; Osácar, M.C.; and Pardo, G.; Sancho, C.; Vázquez-Urbez, M. Tufa sedimentation in changing hydrological conditions: The River Mesa (Spain). Geol. Acta 2013, 11, 85–102. [Google Scholar]
  23. Auqué, L.; Arenas, C.; Osácar, C.; Pardo, G.; Sancho, C.; Vázquez-Urbez, M. Current tufa sedimentation in a changing-slope valley: The River Añamaza (Iberian Range, NE Spain). Sediment. Geol. 2014, 303, 26–48. [Google Scholar] [CrossRef]
  24. Pentecost, A. Travertine; Springer: Berlin/Heidelberg, Germany; New York, NY, USA,, 2005; 445p. [Google Scholar]
  25. Vázquez-Urbez, M.; Arenas, C.; Sancho, C.; Osácar, C.; Auqué, L.; Pardo, G. Factors controlling present-day tufa dynamics in the Monasterio de Piedra Natural Park (Iberian Range, Spain): Depositional environmental settings, sedimentation rates and hydrochemistry. Int. J. Earth Sci. 2010, 99, 1027–1049. [Google Scholar] [CrossRef]
  26. Arenas, C.; Jones, B. Temporal and environmental significance of microbial lamination: Insights from Recent fluvial stromatolites in the River Piedra, Spain. Sedimentology 2017, 64, 1597–1629. [Google Scholar] [CrossRef]
  27. Beraldi-Campesi, H.; Arenas-Abad, C.; Garcia-Pichel, F.; Arellano-Aguilar, O.; Auque, L.; Vazquez-Urbez, M.; Sancho, C.; Osácar, C.; Ruiz-Velasco, S. Benthic bacterial diversity from freshwater tufas of the Iberian Range (Spain). FEMS Microbiol. Ecol. 2012, 80, 363–379. [Google Scholar] [CrossRef] [PubMed]
  28. Berrendero, E.; Arenas, C.; Matero, P.; Jones, B. Cyanobacterial diversity and related sedimentary facies as a function of water flow conditions: Example from the Monasterio de Piedra Natural Park (Spain). Sediment. Geol. 2016, 337, 12–28. [Google Scholar] [CrossRef]
  29. Arenas, C.; Osácar, C.; Sancho, C.; Vázquez-Urbez, M.; Auqué, L.; Pardo, G. Seasonal record from recent fluvial tufa deposits (Monasterio de Piedra, NE Spain): Sedimentological and stable isotope data. Geol. Soc. Lond. Spec. Publ. 2010, 336, 119–142. [Google Scholar] [CrossRef]
  30. Moore, D.M.; Reynolds, R.C., Jr. X-ray Diffraction and the Identification and Analysis of Clay Minerals, 2nd ed.; Oxford University Press: Oxford, UK, 1997; pp. xvii + 378. [Google Scholar]
  31. Hillier, S. Quantitative Analysis of Clay and Other Minerals in Sandstones by X-ray Powder Diffraction (XRPD). In Clay Minerals Cements in SANDSTONES. Int. Assoc. Sedimento; Worden, R.H., Morad, S., Eds.; Blackwell Science Ltd.: Hoboken, NJ, USA, 2003; Volume 34, pp. 213–251. [Google Scholar]
  32. Parkhurst, D.L.; Appelo, C.A.J. Description of Input and Examples for PHREEQC Version 3. A Computer Program for Speciation, Batch Reaction, One Dimensional Transport, and Inverse Geochemical Calculations. In Techniques and Methods, Book 6, Chap. A43; U.S. Geological Survey, Ed.; U.S. Geological Survey: Denver, CO, USA, 2013; 497p. Available online: https://www.usgs.gov/software/phreeqc-version-3 (accessed on 28 December 2022).
  33. Plummer, L.N.; Wigley, T.M.L.; Parkhurst, D.L. The kinetics of calcite dissolution in CO2–water system at 5° to 60 C and 0.0 to 1.0 atm CO2. Am. J. Sci. 1978, 278, 179–216. [Google Scholar] [CrossRef]
  34. Kaufmann, G.; Dreybrodt, W. Calcite dissolution kinetics in the system CaCO3–H2O–CO2 at high undersaturation. Geochim. Cosmochim. Ac. 2007, 71, 1398–1410. [Google Scholar] [CrossRef]
  35. Reddy, M.M.; Plummer, L.N.; Busenberg, E. Crystal growth of calcite from calcium bicarbonate solutions at constant PCO2 and 25 °C: A test of a calcite dissolution model. Geochim. Cosmochim. Acta 1981, 45, 1281–1289. [Google Scholar] [CrossRef]
  36. Lorah, M.M.; Herman, J.S. The chemical evolution of a travertine depositing stream: Geochemical processes and mass transfer reactions. Water Resour. Res. 1988, 24, 1541–1552. [Google Scholar] [CrossRef]
  37. Dreybrodt, W.; Buhmann, D.; Michaelis, J.; Usdowski, E. Geochemically controlled calcite precipitation by CO2 outgassing: Field measurements of precipitation rates in comparison to theoretical predictions. Chem. Geol. 1992, 97, 285–294. [Google Scholar] [CrossRef]
  38. Liu, Z.; Svensson, U.; Dreybrodt, W.; Yuan, D.; Buhmann, D. Hydrodynamic control of inorganic calcite precipitation in Huanglong ravine, China: Field measurements and theoretical prediction of deposition rates. Geochim. Cosmochim. Acta 1995, 59, 3087–3097. [Google Scholar]
  39. Kano, A.; Matsuoka, J.; Kojo, T.; Fujii, H. Origin of annual laminations in tufa deposits, southwest Japan. Palaeogeogr. Palaeocl. Palaeoecol. 2003, 191, 243–262. [Google Scholar] [CrossRef]
  40. Kano, A.; Hagiwara, R.; Kawai, T.; Hori, M.; Matsuoka, J. Climatic conditions and hydrological change recorded in a high-resolution stable-isotope profile of a recent laminated tufa on a subtropical island, southern Japan. J. Sediment. Res. 2007, 77, 59–67. [Google Scholar] [CrossRef]
  41. Kawai, T.; Kano, A.; Hori, M. Geochemical and hydrological controls on biannual lamination of tufa deposits. Sediment. Geol. 2009, 213, 41–50. [Google Scholar] [CrossRef]
  42. Shiraishi, F.; Reimer, A.; Bisset, A.; de Beer, D.; Arp, G. Microbial effects on biofilm calcification, ambient water chemistry and stable isotope records in a highly supersaturated setting (Westerhöfer Bach, Germany). Palaeogeogr. Palaeocl. Palaeoecol. 2008, 262, 91–106. [Google Scholar] [CrossRef]
  43. Dreybrodt, W.; Buhmann, D. A mass transfer model for dissolution and precipitation of calcite from solutions in turbulent motion. Chem. Geol. 1991, 90, 107–122. [Google Scholar] [CrossRef]
  44. Lu, G.; Zheng, C.; Donahoe, R.J.; Lyons, B.W. Controlling processes in a CaCO3 precipitating stream in Huanglong Natural Scenic District, Sichuan, China. J. Hydrol. 2000, 230, 34–54. [Google Scholar] [CrossRef]
  45. Huang, Y.M.; Fairchild, I.J. Partitioning of Sr2+ and Mg2+ into calcite under karst-analogue experimental conditions. Geochim. Cosmochim. Acta 2001, 65, 47–62. [Google Scholar] [CrossRef]
  46. Day, C.C.; Henderson, G.M. Controls on trace-element partitioning in cave-analogue calcite. Geochim. Cosmochim. Acta 2013, 120, 612–627. [Google Scholar] [CrossRef]
  47. O’Brien, G.R.; Kaufman, D.S.; Sharp, W.D.; Atudorei, V.; Parnell, R.A.; Crossell, L.J. Oxygen isotope composition of annually banded modern and mid-Holocene travertine and evidence of paleomonsoon floods, Grand Canyon, Arizona, USA. Quat. Res. 2006, 65, 366–379. [Google Scholar] [CrossRef]
  48. Özkul, M.; Gökgöz, A.; Horvatinčić, N. Depositional properties and geochemistry of Holocene perched springline tufa deposits and associated spring waters: A case study from the Denizli Province, Western Turkey. In Tufas and Speleothems: Unravelling the Microbial and Physical Controls; Pedley, H.M., Rogerson, M., Eds.; Geological Society: London, UK, 2010; Volume 336, pp. 245–262. [Google Scholar]
  49. Dabkowski, J.; Limondin-Lozouet, N.; Andrews, J.; Marca-Bell, A.; Antoine, A. Climatic and environmental variations during the last interglacial recorded in a Northern France tufa (Caours, Somme basin). Comparisons with regional records. Quaternaire 2016, 27, 249–261. [Google Scholar] [CrossRef]
  50. Dabkowski, J.; Frodlová, J.; Hájek, M.; Hájková, P.; Petr, L.; Fiorillo, D.; Dudová, L.; Horsák, M. A complete Holocene climate and environment record for the Western Carpathians (Slovakia) derived from a tufa deposit. Holocene 2018, 29, 493–504. [Google Scholar] [CrossRef]
  51. Mavromatis, V.; Gautier, Q.; Bosc, O.; Schott, J. Kinetics of Mg partition and Mg stable isotope fractionation during its incorporation in calcite. Geochim. Cosmochim. Acta 2013, 114, 188–203. [Google Scholar] [CrossRef]
  52. Wassenburg, J.A.; Riechelman, S.; Schoder-Ritzrau, A.; Riechelman, D.F.C.; Richter, D.K.; Immenhauser, A.; Terente, M.; Constantin, S.; Hachenberg, A.; Hansen, M.; et al. Calcite Mg and Sr partition coefficients in cave environments: Implications for interpreting prior calcite precipitation in speleothems. Geochim. Cosmochim. Acta 2020, 269, 581–596. [Google Scholar] [CrossRef]
  53. Garnett, E.R.; Andrews, J.E.; Preece, R.C.; Dennis, P.F. Climatic change recorded by stable isotopes and trace elements in a British Holocene tufa. J. Quat. Sci. 2004, 19, 251–262. [Google Scholar] [CrossRef]
  54. Rogerson, M.; Pedley, H.M.; Greenway, G.M.; Wadhawan, J.D. Interaction of temperature, salinity and extracellular polymeric substances controls trace element incorporation into tufa calcite. Depos. Rec. 2022, 8, 210–219. [Google Scholar] [CrossRef]
  55. Sironić, A.; Barešić, J.; Horvatinčić, N.; Brozinčević, A.; Vurnek, M.; Kapelj, S. Changes in the geochemical parameters of karst lakes over the past three decades. The case of Plitvice Lakes, Croatia. Appl. Geochem. 2017, 78, 12–22. [Google Scholar] [CrossRef]
  56. Karmann, I.; Cruz, F.W., Jr.; Viana, O., Jr.; Burns, S.J. Climate influence on geochemistry parameters of waters from Santana–Pérolas cave system, Brazil. Chem. Geol. 2007, 244, 232–247. [Google Scholar] [CrossRef]
  57. Fairchild, I.J.; Treble, P.C. Trace elements in speleothems as recorders of environmental change. Quat. Sci. Rev. 2009, 28, 449–468. [Google Scholar] [CrossRef]
  58. Rimstidt, J.D.; Balog, A.; Webb, J. Distribution of trace elements between carbonate minerals and aqueous solutions. Geochim. Cosmochim. Acta 1998, 62, 1851–1863. [Google Scholar] [CrossRef]
  59. Walter, L.M. Relative efficiency of carbonate dissolution and precipitation during diagenesis: A progress report on the role of solution chemistry. In Roles of Organic Matter in Sediment Diagenesis; Gautier, D.L., Ed.; Society of Economic Paleontologists and Mineralogists Special Publication: Tulsa, OK, USA, 1986; Volume 38, pp. 1–11. [Google Scholar]
  60. Sheikholeslami, R.; M. Ng. Calcium Sulfate Precipitation in the Presence of Nondominant Calcium Carbonate:  Thermodynamics and Kinetics. Ind. Eng. Chem. Res. 2001, 40, 3570–3578. [Google Scholar] [CrossRef]
  61. Flaathen, T.K.; Oelkers, E.H.; Gislason, S.R.; Aagaard, P. The effect of dissolved sulphate on calcite precipitation kinetics and consequences for subsurface CO2 storage. Enrgy. Proced. 2011, 4, 5037–5043. [Google Scholar] [CrossRef] [Green Version]
  62. Mejri, W.; Korchef, A.; Tlili, M.; Ben Amor, M. Effects of temperature on precipitation kinetics and microstructure of calcium carbonate in the presence of magnesium and sulphate ions. Desalin. Water Treat. 2014, 52, 25–27. [Google Scholar] [CrossRef]
  63. Cuesta-Mayorga, I.; Astilleros, J.M. Fernández-Díaz, L Precipitation of CaCO3 Polymorphs from Aqueous Solutions: The Role of pH and Sulphate Groups. Minerals 2019, 9, 178. [Google Scholar] [CrossRef] [Green Version]
  64. Domínguez-Villar, D.; Vázquez-Navarro, J.A.; Krklec, K. The role of gypsum and/or dolomite dissolution in tufa precipitation: Lessons from the hydrochemistry of a carbonate-sulphate karst system. Earth Surf. Proc. Land. 2017, 42, 245–258. [Google Scholar] [CrossRef]
  65. Olsson, J.; Stipp, S.L.S.; Makovicky, E.; Gislason, S.R. Metal scavenging by calcium carbonate at the Eyjafjallajökull volcano: A carbon capture and storage analogue. Chem. Geol. 2014, 384, 135–148. [Google Scholar] [CrossRef] [Green Version]
  66. Asta, M.P.; Auqué, L.F.; Sanz, F.J.; Gimeno, M.J.; Acero, P.; Blasco, M.; García-Alix, A.; Gómez, J.; Delgado-Huertas, A.; Mandado, J. Travertines associated with the Alhama-Jaraba thermal Waters (NE, Spain): Genesis and geochemistry. Sediment. Geol. 2017, 347, 100–116. [Google Scholar] [CrossRef] [Green Version]
  67. Gascoyne, M. Trace-element partition coefficients in the calcite-water system and their paleoclimatic significance in cave studies. J. Hydrol. 1983, 61, 213–222. [Google Scholar] [CrossRef]
  68. Riechelmann, D.F.C.; Deininger, M.; Scholz, D.; Riechelmann, S. Schröder-Ritzrau, A.; Spötl, C.; Richter, D.K.; Mangini, A.; Immenhauser, A. Disequilibrium carbon and oxygen isotope fractionation in recent cave calcite: Comparison of cave precipitates and model data. Geochim. Cosmochim. Acta 2013, 103, 232–244. [Google Scholar] [CrossRef]
Figure 1. (A,B) Locations of the studied rivers in Iberian Ranges (NE Iberian Peninsula).
Minerals 13 00057 g001
Figure 2. (A) Field view of site where Tablet RP-16 was installed in the River Piedra [19]; (B) Plan view of Tablet RP-16 once removed from the river. Line indicates position for cutting; (C,D) Cross sections of Tablets RP-16 (P-13) and M-4, with sections perpendicular to flow direction. We indicate the thickness of each six-month interval measured at corresponding cutting sections.
Minerals 13 00057 g002
Figure 3. (A) Detail of lamination in cross-section of Tablet RP-16 [19] (six-month intervals as in Figure 2A); (B) SEM image of Tablet RP-14: palisades of calcite tubes from filamentous cyanobacteria; top is upward; (C,D) SEM images of Tablet M-4; (C) Calcite tubes (plan view) and EPS-containing diatoms. (D) Detail of calcite tubes and EPS (arrows).
Minerals 13 00057 g003
Figure 4. Temporal evolution of some parameters during examined sampling periods in water and stromatolites for the studied tablets. We present temperatures, Mg/Ca ratios, precipitation rates (as PWP values) and discharge values for waters, and six-month accumulated thicknesses, Mg/Ca ratios and δ18O and δ13C values for stromatolites. We indicate the units in the figure.
Minerals 13 00057 g004
Figure 5. Box-and-whisker plots of statistical distributions of the Mg/Ca values in (A) waters and (B) stromatolites at studied sites in rivers. Statistical measures plotted are median (horizontal line inside the box), the 25th and 75th percentiles (bottom and top of the box respectively), mean (square), the 5th and 95th percentiles (“whiskers”), the 1st and 99th percentiles (crosses) and the maximum and minimum values (horizontal bars).
Minerals 13 00057 g005
Figure 6. Temporal evolution of season-free interannual evolutions of some parameters during examined sampling periods in water and stromatolites for studied tablets. We present the six-month accumulated thicknesses, Mg/Cacalcite ratios, DMg, Mg/Cawater ratios, measured water temperatures, Mg-derived water temperatures and stromatolite precipitation rates (as PWP values). We indicate the units in the figure.
Minerals 13 00057 g006
Figure 7. Mean DMg and water temperature values obtained for tufa deposits in studied rivers compared with available data for other tufa-depositing rivers and streams, for thermal spring deposits (travertines) and some cave speleothems. We present experimental relationships between water temperature and magnesium partition coefficient (DMg) determined by the authors of [45,46] under karst/speleothem-analogue conditions, as well as exponential best-fit curve to the data in [58], obtained by the authors of [46]. Data for the tufa deposits. Mean DMg and temperature values for Kainsinger Creek (Germany) were calculated from the data in [8] for sections T1, T2 and T3. Values for Krka River (Slovenia) were obtained from data presented in [6] at sampling points T1–T10 (see Table S3 in [6]) and excluding highest DMg values obtained at T11–T13 sampling points with the greatest dolomite contents. Values for Gregory River (Australia) obtained from data presented in [1] for tufa deposits at one sampling point: mean DMg value is that obtained in the review in [8], and mean water temperature value corresponds to the mean measured value (27.7 °C) for the studied period in [1]. Finally, the data for the calcite precipitated in Hvanná River (in the vicinity of the Eyjafjallajökull volcano, Iceland) were obtained from the range of DMg values presented in [65] and the measured temperatures at Sites 2–9 (see Table 1 and Table 3 in [65]). Data for the travertine deposits. These data correspond to deposits sampled at the Alhama thermal spring system and at the Embid thermal spring (both in Zaragoza, Spain), presented in [66]. We only plotted samples consisting of pure calcite and precipitating near the orifices of the springs and from natural waters (e.g., not overheated) in the figure. We obtained the DMg values from the specific Mg/Ca values analysed in each deposit and the associated spring (water sample). Data for speleothems. Orange-filled triangle: mean DMg (0.0178 ± 0.0005) and cave temperature values presented in [68] from recent carbonate crystals precipitated on watch glasses and glass plates in seven caves in Germany, Morocco and Romania; we also indicate a range of cave temperatures. Empty triangle: mean DMg and drip water temperature presented in [9] for annually laminated stalagmites in Alpine cave (Obir, Austria). Yellow-filled triangles: mean DMg and temperature values for seepage waters and associated calcites in speleothems from caves on Vancouver Island and in Jamaica studied in [67]. Grey-filled triangle: mean DMg values and cave air temperature (assumed to be constant) presented in [45] for modern speleothems in Grotta di Ernesto cave (Italy).
Minerals 13 00057 g007
Table 1. Mean values (mean ± 1 σ) for dissolved Mg, Ca and Mg/Ca ratios in waters (Mgwater, Cawater and Mg/Cawater) and stromatolites (Mgcalcite, Cacalcite and Mg/Cacalcite), and for the distribution coefficients in the studied sites at Piedra, Mesa, Añamaza and Ebrón Rivers. We also include data for the Kaisinger Creek [8] and Krka River [6] for comparison.
Chemical
Components
Piedra RiverMesa RiverAñamaza RiverEbrón RiverKaisinger CreekKrka (2)
River
Mgwater (mmol/L)1.04 ± 0.190.87 ± 0.0340.87 ± 0.070.80 ± 0.0540.32 ± 0.030.94 ± 0.15
Cawater (mmol/L)2.04 ± 0.171.95 ± 0.223.24 ± 0.232.08 ± 0.173.16 ± 0.231.66 ± 0.1
Mg/Cawater
(molar)
0.51 ± 0.080.449 ± 0.0450.27 ± 0.0360.386 ± 0.0330.101 ± 0.010.56 ± 0.08
Cacalcite (wt%)37.0 ±2.5635.2 ± 0.9734.05 ± 2.0834.8 ±2.5337.1 ± 0.9934.02 ±1.04
Mgcalcite (g/kg)2.46 ± 0.473.01 ± 0.381.73 ± 0.313.75 ± 0.80.58 ± 0.055.48 ± 0.71
Mg/Cacalcite
(molar)
0.011 ± 0.0020.014 ± 0.0028.38 × 10−3 ± 1.6 × 10−30.018 ± 0.0042.58 × 10−3 ± 0.27 × 10−30.027 ± 0.004
DMg0.023 ± 0.0080.032 ± 0.040.032 ± 0.0120.046 ± 0.0090.025 ± 0.003 (1)0.044 ± 0.0068
(1) Averages from the tufas in three different sections of the Kaisinger Creek (from the data presented in [8]). (2) Data taken from [6] in Table 1 and Table S3. For Ca, Mg and Mg/Ca values in waters, we present values from the sampling site W3. For Ca, Mg and Mg/Ca ratios in tufa in Table S3, samples from T1 to T10 are considered.
Table 2. Correlations between some analytical parameters of studied tufa samples.
River
(Number of Samples)
Mg/Cawater
vs. T
Mg/Catufa
vs. T
Mg/Catufa vs. Mg/CawaterDMg vs. TPWP vs. TTcalc-T measured
Mean
Piedra
(n = 12)
+0.15 (p = 0.627)+0.391 (p = 0.208)−0.577 (p = 0.049)+0.064 (p = 0.845)+0.863 (p = 0.0003)4.89
Piedra
Cool 06-07 to Cool 09-10
(n = 5)
−0.03 (p = 0.945)0.576
(p = 0.176)
−0.787
(p = 0.036)
0.213
(p = 0.646)
+0.842
(p = 0.017)
+7.57
Piedra
Warm 04 to Warm 06
(n = 7)
+0.346 (p = 0.568)+ 0.379 (p = 0.529)0.587 (p = 0.298)0.27 (p = 0.66)+0.967 (p = 0.007)+1.15
Añamaza
(n = 5)
+0.326 (p = 0.59)−0.338 (p = 0.577)−0.939 (p = 0.018)−0.312 (p = 0.608)+0.39 (p = 0.516)13.9
Mesa
(n = 56)
+0.479 (p = 0.414)−0.023 (p = 0.971)+0.61 (p = 0.273)−0.48 (p = 0.40)−0.663
(p = 0.222)
12.5
Ebrón
(n = 6)
+0.892 (p = 0.017)+0.691 (p = 0.128)+0.551 (p = 0.256)+0.269 (p = 0.28)+0.103 (p = 0.845)24.0
Table 3. Trends and correlations for some analytical parameters of studied tufa samples.
RiverMg/CatufaAl Contents in TufasMg and Al Contents in TufasCorrelation Coefficient (R, Pearson) for Al vs Mg/Ca (2) in Tufas
All PeriodsWarm 04 to Warm 06 Cool 2006–07 to Cool 2009–10
PiedraAlmost seasonal (1)Not seasonalAl > Mg0.5980.0550.756
EbronAlmost seasonal (1)Almost seasonal (1) Al > Mg+0.88
AñamazaNot seasonalSeasonal (2)Al > Mg+0.965
MesaNot seasonalAlmost seasonal (2)Mg ≈ Al+0.93
(1) Higher values in the warm periods. (2) Higher values in the cool periods.
Disclaimer/Publisher’s Note: The statements, opinions and data contained in all publications are solely those of the individual author(s) and contributor(s) and not of MDPI and/or the editor(s). MDPI and/or the editor(s) disclaim responsibility for any injury to people or property resulting from any ideas, methods, instructions or products referred to in the content.

