
Stable Isotopic, Micro-FTIR, and Geochemical Characteristics of the Permian Madzaringwe Shale of Tuli Basin, South Africa: Implications for Organic-Rich Shale Provenance
 ,
,
Abstract
:1. Introduction
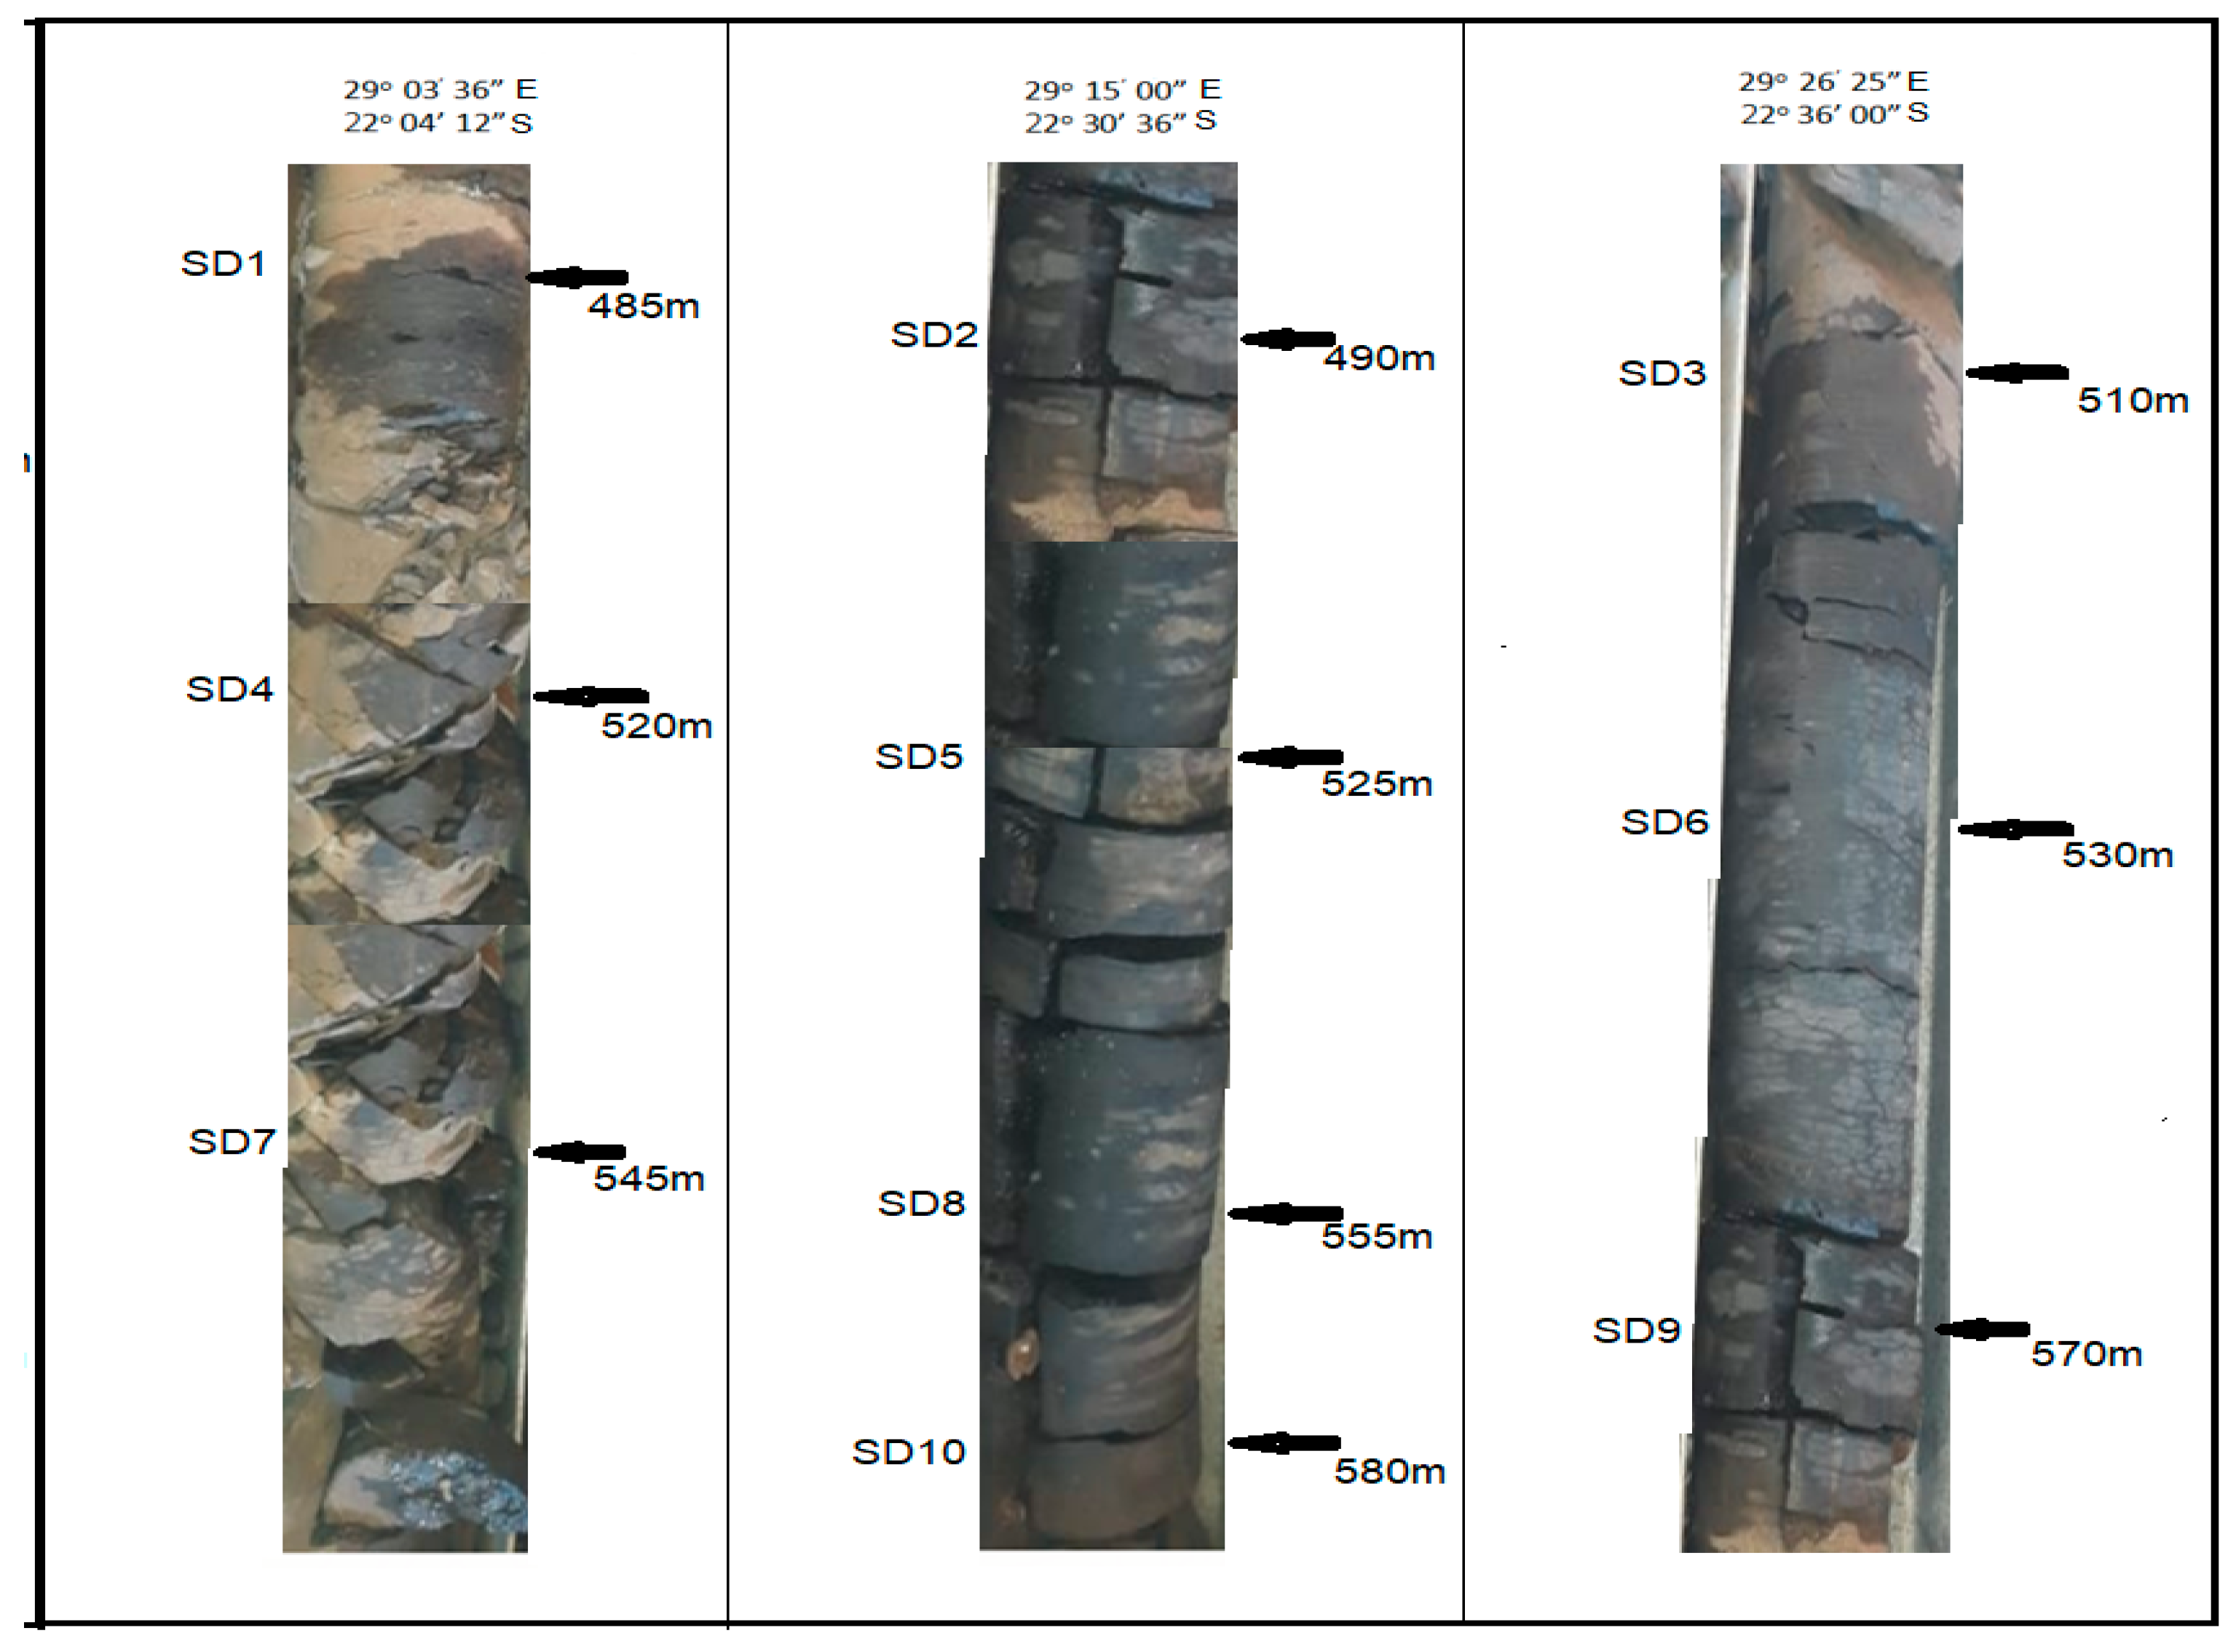
2. Study Area
3. Materials and Methods
4. Results
5. Discussion
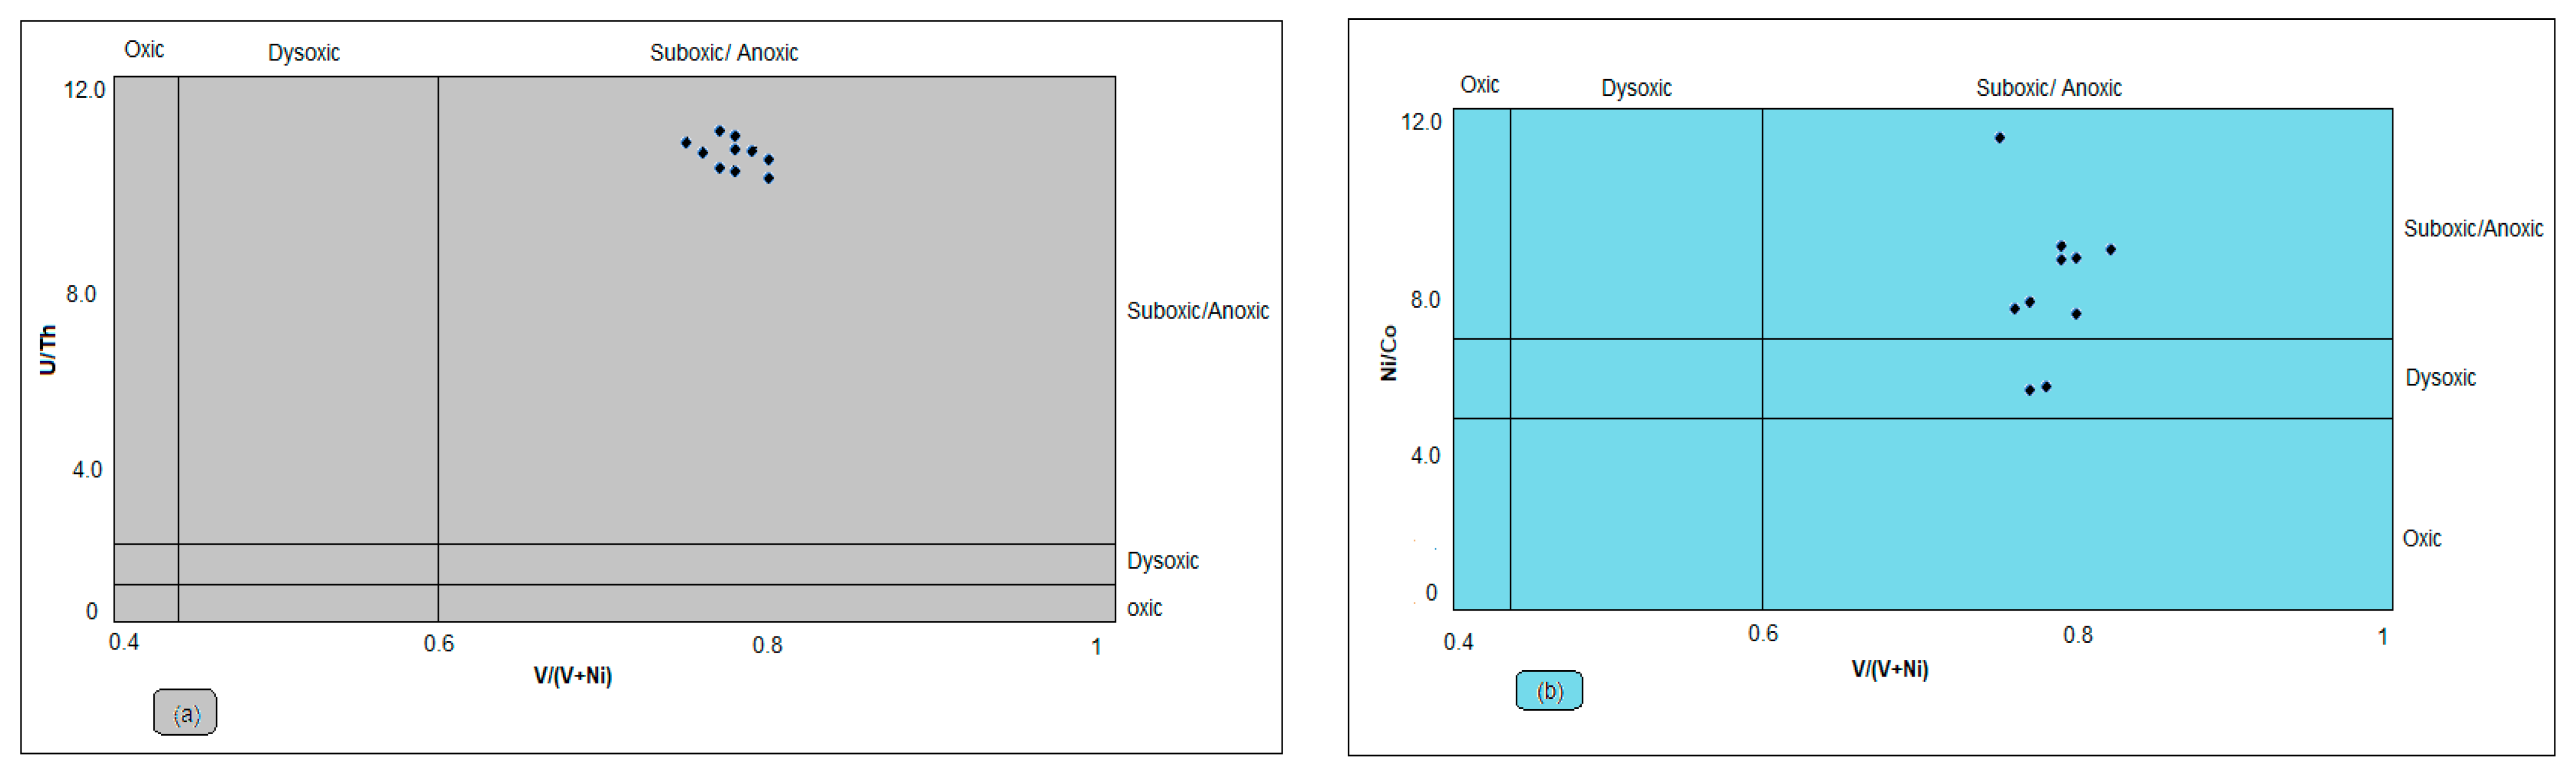
5.1. Paleo-Redox Condition of the Depositional Environment
5.2. Hydrothermal Activity and Paleo-Productivity
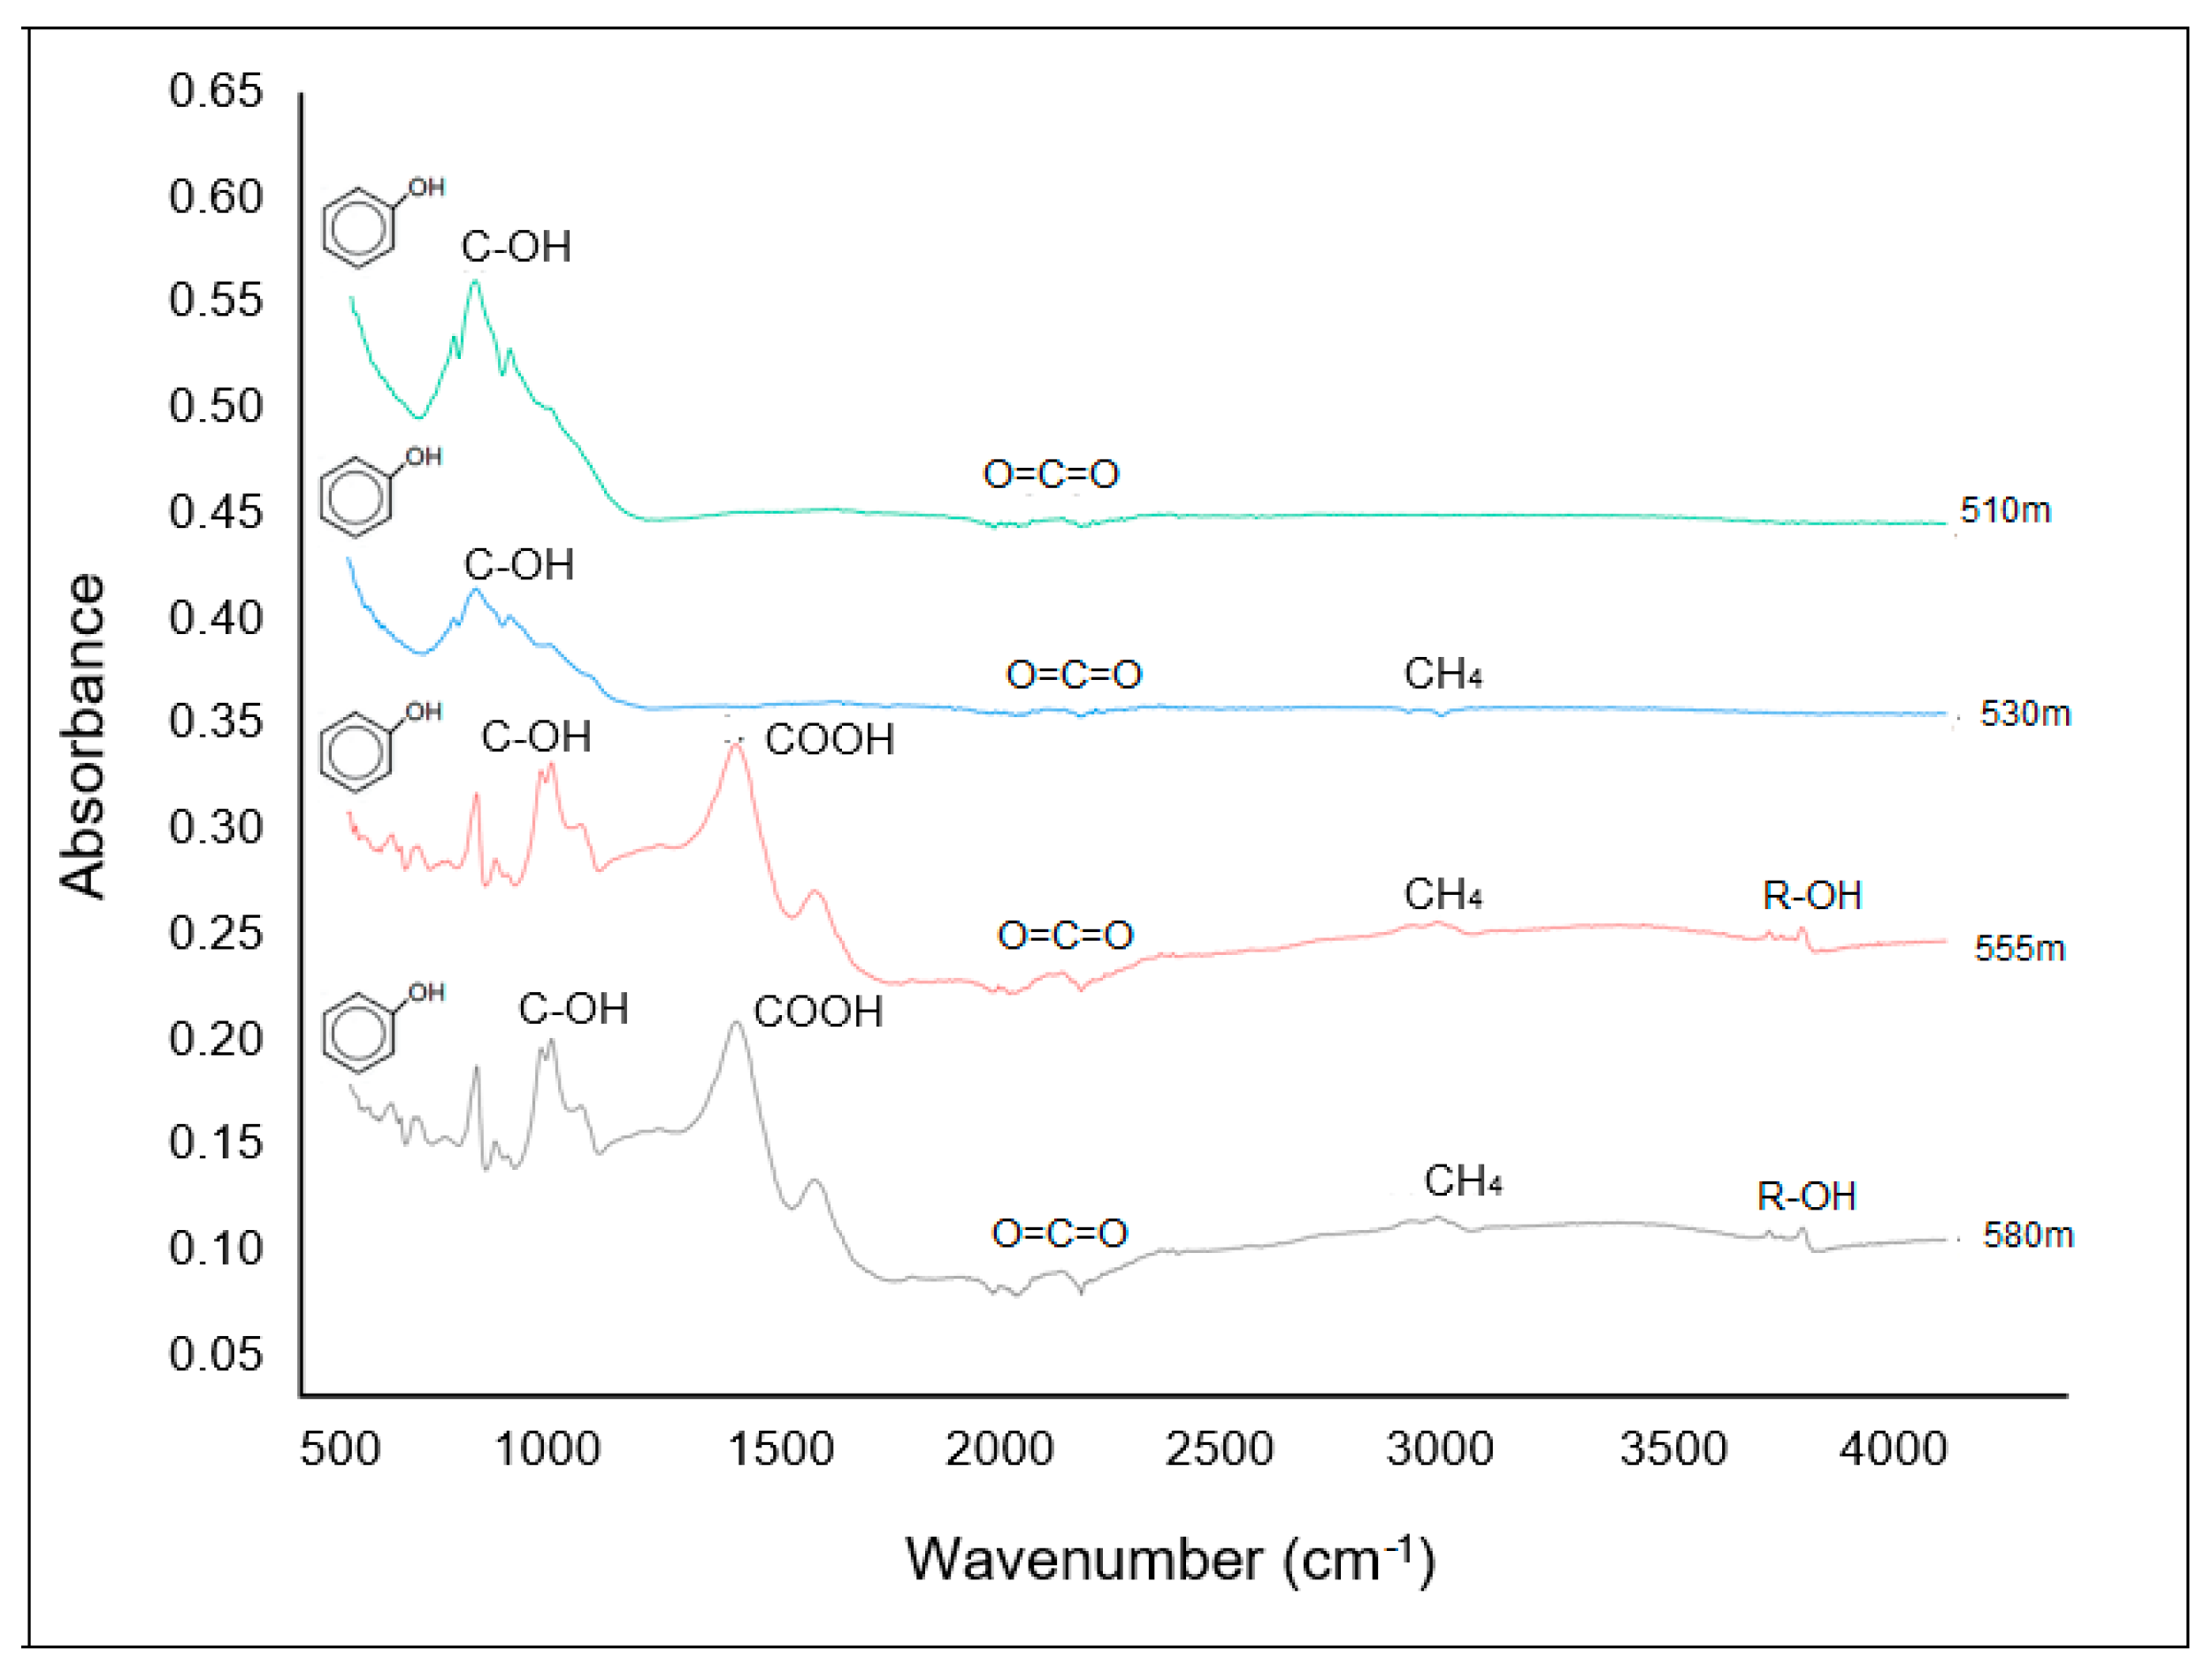
5.3. Aliphatic Hydrocarbon Potentials
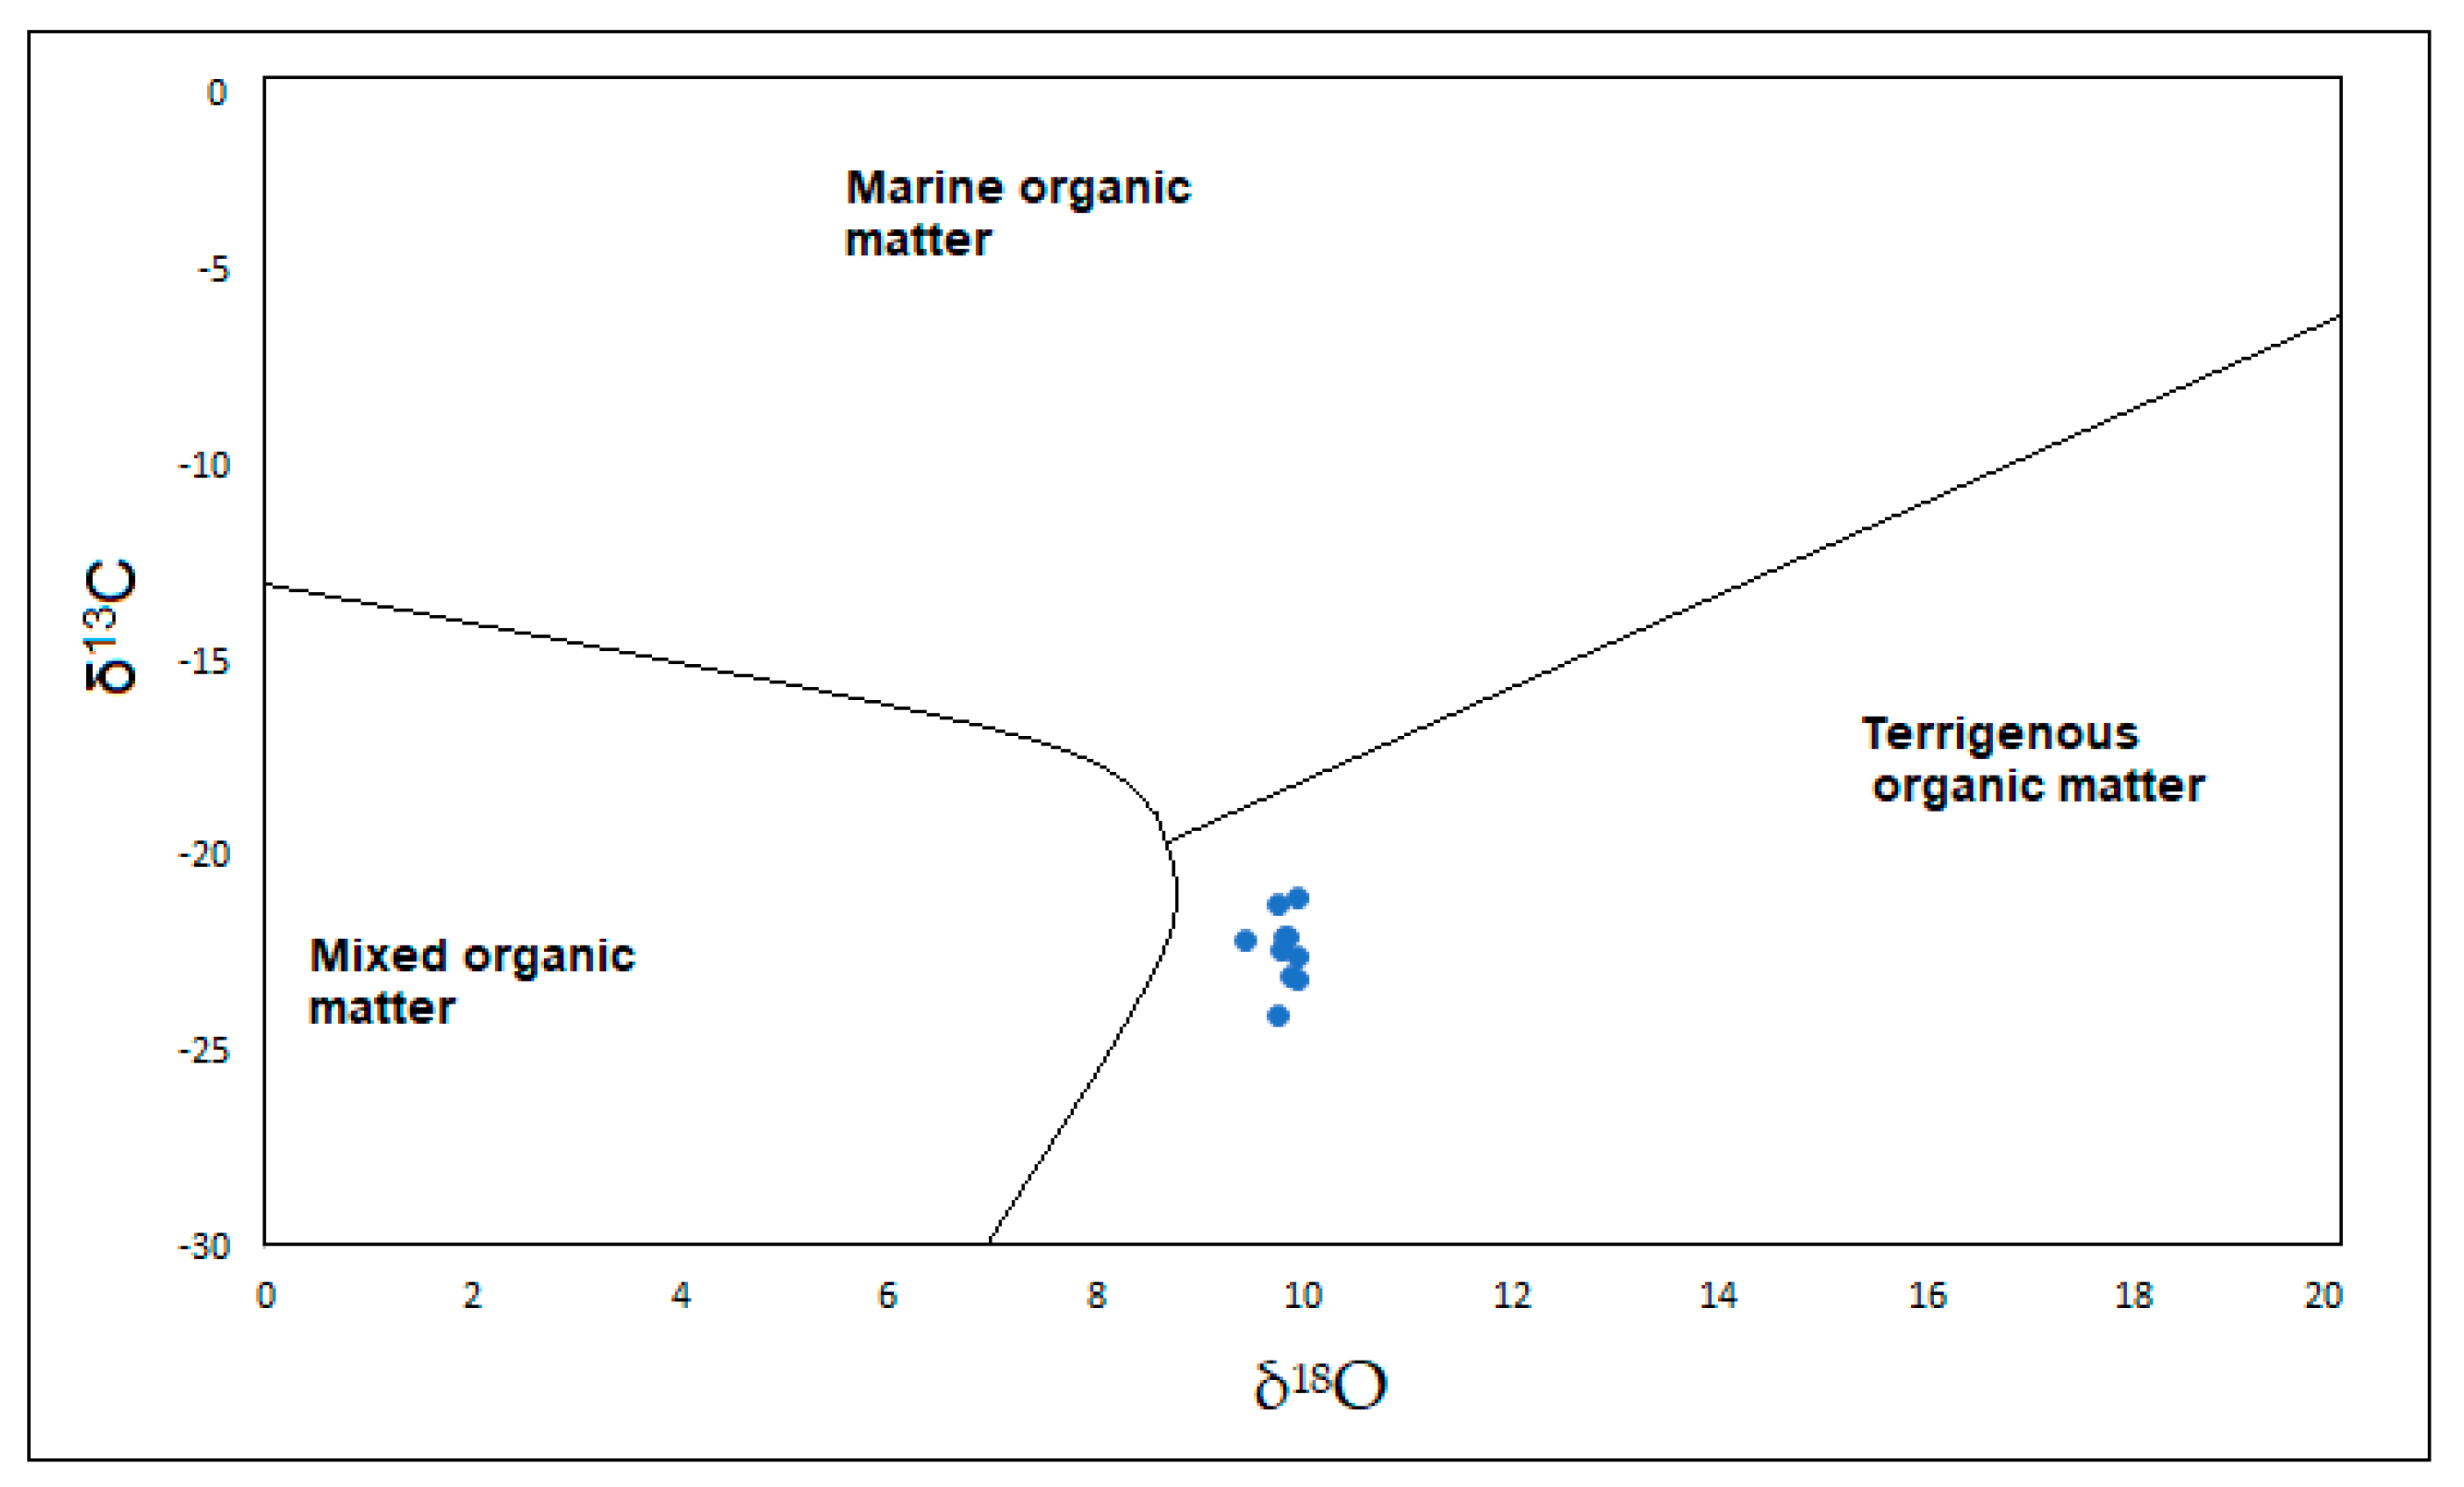
5.4. Stable Isotopic Signatures of an Anoxic Depositional Environment
5.5. Comparison of the Permian Madzaringwe Shale with Selected Permian Southern Gondwana Basin
6. Conclusions
Author Contributions
Funding
Acknowledgments
Conflicts of Interest
References
- Agrawal, V.; Sharma, S. Molecular characterization of kerogen and its implications for determining hydrocarbon potential, organic matter sources and thermal maturity in Marcellus Shale. Fuel 2018, 228, 429–437. [Google Scholar] [CrossRef]
- Wei, L.; Wang, Y.; Mastalerz, M. Comparative optical properties of macerals and statistical evaluation of mis-identification of vitrinite and solid bitumen from early mature Middle Devonian–Lower Mississippian New Albany Shale: Implications for thermal maturity assessment. Int. J. Coal Geol. 2016, 168, 222–236. [Google Scholar]
- Sun, C.; Nie, H.; Dang, W.; Chen, Q.; Zhang, G.; Li, W.; Lu, Z. Shale gas exploration and development in China: Current status, geological challenges, and future directions. Energy Fuels 2021, 35, 6359–6379. [Google Scholar] [CrossRef]
- Qiao, J.; Baniasad, A.; Zieger, L.; Zhang, C.; Luo, Q.; Littke, R. Paleo-depositional environment, origin and characteristics of organic matter of the Triassic Chang 7 Member of the Yanchang Formation throughout the mid-western part of the Ordos Basin, China. Int. J. Coal Geol. 2021, 237, 103636. [Google Scholar] [CrossRef]
- Hakimi, M.H.; Abdullah, W.H.; Alqudah, M.; Makeen, Y.M.; Mustapha, K.A. Organic geochemical and petrographic characteristics of the oil shales in the Lajjun area, Central Jordan: Origin of organic matter input and preservation conditions. Fuel 2016, 181, 34–45. [Google Scholar] [CrossRef]
- Małachowska, A.; Lis, G.; Mastalerz, M.; Goodarzi, F.; Sanei, H. The effect of paleo-environment on hydrocarbon generation potential: Example from Vaca Muerta Formation, Neuquén Basin, Argentina. J. Pet. Sci. Eng. 2022, 208, 109342. [Google Scholar] [CrossRef]
- Zhao, W.; Wen, Z.; Zhang, H.; Wu, C.; Liu, Y.; Song, H.; Zhang, L.; Xi, Y.; Sun, L. Integrated Assessment of Marine-Continental Transitional Facies Shale Gas of the Carboniferous Benxi Formation in the Eastern Ordos Basin. Energies 2021, 14, 8500. [Google Scholar] [CrossRef]
- Liang, C.; Jiang, Z.; Cao, Y.; Zhang, J.; Guo, L. Sedimentary characteristics and paleoenvironment of shale in the Wufeng-Longmaxi Formation, North Guizhou Province, and its shale gas potential. J. Earth Sci. 2017, 28, 1020–1031. [Google Scholar] [CrossRef]
- Wang, S.; Zhao, W.; Zou, C.; Dong, D.; Wang, Y.; Li, X.; Guan, Q. Organic carbon and stable CO isotopic study of the Lower Silurian Longmaxi Formation black shales in Sichuan Basin, SW China: Paleoenvironmental and shale gas implications. Energy Explor. Exploit. 2015, 33, 439–457. [Google Scholar] [CrossRef]
- Wright, M.; Mu, G.; Wang, S.; Liu, B.; Davies, E.; Singh, N. Chemostratigraphy and Sequence Stratigraphic Investigation of the Lower Silurian-Upper Ordovician Hot Shale, Southeastern of the Sichuan Basin. In Proceedings of the SPE Unconventional Resources Conference and Exhibition-Asia Pacific, Brisbane, Australia, 11–13 November 2013. [Google Scholar]
- Bordy, E.M.; Catuneanu, O. Sedimentology of the Beaufort-Molteno Karoo fluvial strata in the Tuli Basin, South Africa. S. Afr. J. Geol. 2002, 105, 51–66. [Google Scholar]
- Johnson, M.; Van Vuuren, C.; Hegenberger, W.; Key, R.; Show, U. Stratigraphy of the Karoo Supergroup in southern Africa: An overview. J. Afr. Earth Sci. 1996, 23, 3–15. [Google Scholar] [CrossRef]
- Burke, K.; Dewey, J. Plume-generated triple junctions: Key indicators in applying plate tectonics to old rocks. J. Geol. 1973, 81, 406–433. [Google Scholar] [CrossRef] [Green Version]
- Bordy, E.M.; Catuneanu, O. Sedimentology and palaeontology of upper Karoo aeolian strata (Early Jurassic) in the Tuli Basin, South Africa. J. Afr. Earth Sci. 2002, 35, 301–314. [Google Scholar] [CrossRef]
- Chidley, C. The Geology of the Country around Evangelina and Pontdrift (1: 50,000 Sheets 2228BD and 2229A); Unpublished South African Geological Survey Report; South Africa Geological Survey: Johannesburg, South Africa, 1985. [Google Scholar]
- Johnson, M.; Anhauesser, C.; Thomas, R.J. The Geology of South Africa; Geological Society of South Africa: Johannesburg, South Africa, 2006; pp. 490–491. ISBN1 1-919908-77-3. ISBN2 978-1-919908-77-9. [Google Scholar]
- Ortlepp, G. Limpopo Coalfield. Mineral Deposits of Southern Africa. Ph.D. Thesis, Rhodes University, Grahamstown, Eastern Cape Province, South Africa, 1986. [Google Scholar]
- Mtimkulu, M.N. A Provisional Basinal Study of the Waterberg-Karoo; University of Pretoria: Pretoria, South Africa, 2010. [Google Scholar]
- Bordy, E.M. Sedimentology of The Karoo Supergroup in The Tuli Basin. Ph.D. Thesis, Rhodes University, Grahamstown, Eastern Cape Province, South Africa, 2000. (Unpublished). [Google Scholar]
- Lebena, K.; Mõtlepa, R.; Paavera, P.; Konistb, A.; Kalle Kirsimäea, T.P. Geochemical study of stable carbon and oxygen isotopes in landfilled Carich oil shale ash. Est. J. Earth Sci. 2020, 69, 134–142. [Google Scholar] [CrossRef]
- Mesquita, C.J.S.; Dall’Agnol, R.; Almeida, J.d.A.C.d. Mineral chemistry and crystallization parameters of the A-type Paleoproterozoic Bannach granite, Carajás province, Pará, Brazil. Braz. J. Geol. 2018, 48, 575–601. [Google Scholar] [CrossRef]
- Hanor, J.S. Barite–celestine geochemistry and environments of formation. Rev. Mineral. Geochem. 2000, 40, 193–275. [Google Scholar] [CrossRef]
- Saba, T. Hydraulic Fracturing: Data Analysis Methods to Identify Sources of Dissolved Gas and Chemical Compounds in Drinking Water Wells. In Introduction to Environmental Forensics; Elsevier: Amsterdam, The Netherlands, 2015; pp. 513–529. [Google Scholar]
- Li, Y.; Zhang, T.; Ellis, G.S.; Shao, D. Depositional environment and organic matter accumulation of Upper Ordovician–Lower Silurian marine shale in the Upper Yangtze Platform, South China. Palaeogeogr. Palaeoclimatol. Palaeoecol. 2017, 466, 252–264. [Google Scholar] [CrossRef]
- Wu, C.; Tuo, J.; Zhang, M.; Liu, Y.; Xing, L.; Gong, J.; Qiu, J. Multiple controlling factors of lower Palaeozoic organic-rich marine shales in the Sichuan Basin, China: Evidence from minerals and trace elements. Energy Explor. Exploit. 2017, 35, 627–644. [Google Scholar] [CrossRef]
- Frape, S.K.; Blyth, A.; Blomqvist, R.; Mcnutt, R.H.; Gascoyne, M. Deep Fluids in Continents: II Crystalline Rocks. In Surface and Groundwater, Weathering, and Soils, Vol. 5. Treatise on Geochemistry; Drever, J.I., Ed.; Elsevier-Pergamon: Oxford, UK, 2003. [Google Scholar]
- Ferriday, T.; Montenari, M. Chemostratigraphy and Chemofacies of Source Rock Analogues: A High-Resolution Analysis of Black Shale Successions from the Lower Silurian Formigoso Formation (Cantabrian Mountains, NW Spain). In Stratigraphy & Timescales; Elsevier: Amsterdam, The Netherlands, 2016; pp. 123–255. [Google Scholar]
- Akintola, G.O.; Amponsah-Dacosta, F.; Rupprecht, S.; Palaniyandy, N.; Mhlongo, S.E.; Gitari, W.M.; Edokpayi, J.N. Methanogenesis Potentials: Insights from Mineralogical Diagenesis, SEM and FTIR Features of the Permian Mikambeni Shale of the Tuli Basin, Limpopo Province of South Africa. Minerals 2021, 11, 651. [Google Scholar] [CrossRef]
- Naseem, A.; Tabasum, S.; Zia, K.M.; Zuber, M.; Ali, M.; Noreen, A. Lignin-derivatives based polymers, blends and composites: A review. Int. J. Biol. Macromol. 2016, 93, 296–313. [Google Scholar] [CrossRef]
- Washburn, K.E.; Birdwell, J.E. Multivariate analysis of ATR-FTIR spectra for assessment of oil shale organic geochemical properties. Org. Geochem. 2013, 63, 1–7. [Google Scholar] [CrossRef]
- Buchardt, B.; Clausen, J.; Thomsen, E. Carbon isotope composition of Lower Palaeozoic kerogen: Effects of maturation. Org. Geochem. 1986, 10, 127–134. [Google Scholar] [CrossRef]
- Singh, P.K.; Singh, M.; Prachiti, P.; Kalpana, M.; Manikyamba, C.; Lakshminarayana, G.; Singh, A.K.; Naik, A. Petrographic characteristics and carbon isotopic composition of Permian coal: Implications on depositional environment of Sattupalli coalfield, Godavari Valley, India. Int. J. Coal Geol. 2012, 90, 34–42. [Google Scholar] [CrossRef]
- Whiticar, M.J. Stable isotope geochemistry of coals, humic kerogens and related natural gases. Int. J. Coal Geol. 1996, 32, 191–215. [Google Scholar] [CrossRef]
- Schröder, S.; Grotzinger, J. Evidence for anoxia at the Ediacaran–Cambrian boundary: The record of redox-sensitive trace elements and rare earth elements in Oman. J. Geol. Soc. 2007, 164, 175–187. [Google Scholar] [CrossRef]
- Hu, J.; Huang, D. The Foundation of China Continental Petroleum Geology Theory; Petroleum Industry Press: Beijing, China, 1991. [Google Scholar]
- Faure, K.; Harris, C.; Willis, J.P. A profound meteoric water influence on genesis in the Permian Waterberg Coalfield, South Africa; evidence from stable isotopes. J. Sediment. Res. 1995, 65, 605–613. [Google Scholar]
- Sun, Z.; Wang, Y.; Wei, Z.; Zhang, M.; Wang, G.; Wang, Z. Characteristics and origin of desorption gas of the Permian Shanxi Formation shale in the Ordos Basin, China. Energy Explor. Exploit. 2017, 35, 792–806. [Google Scholar] [CrossRef]
- Roser, B.P.; Korsch, R.J. Provenance signatures of sandstone-mudstone suites determined using discriminant function analysis of major-element data. Chem. Geol. 1988, 67, 119–139. [Google Scholar] [CrossRef]
- Pieta, I.S.; Rathi, A.; Pieta, P.; Nowakowski, R.; Hołdynski, M.; Pisarek, M.; Kaminska, A.; Gawande, M.B.; Zboril, R. Electrocatalytic methanol oxidation over Cu, Ni and bimetallic Cu-Ni nanoparticles supported on graphitic carbon nitride. Appl. Catal. B Environ. 2019, 244, 272–283. [Google Scholar] [CrossRef]
- Hatch, J.; Leventhal, J. Relationship between inferred redox potential of the depositional environment and geochemistry of the Upper Pennsylvanian (Missourian) Stark Shale Member of the Dennis Limestone, Wabaunsee County, Kansas, USA. Chem. Geol. 1992, 99, 65–82. [Google Scholar] [CrossRef]
- Tanwar, R.; Mandal, U.K. Photocatalytic activity of Ni 0.5 Zn 0.5 Fe 2 O 4@ polyaniline decorated BiOCl for azo dye degradation under visible light–integrated role and degradation kinetics interpretation. RSC Adv. 2019, 9, 8977–8993. [Google Scholar] [CrossRef]
- Tyson, R. Sedimentary Organic Matter: Organic Facies and Palynofacies; Springer Science & Business Media: Cham, Switzerland, 2012. [Google Scholar]
- Dean, W.E.; Arthur, M.A. Iron-sulfur-carbon relationships in organic-carbon-rich sequences I: Cretaceous Western Interior Seaway. Am. J. Sci. 1989, 289, 708–743. [Google Scholar] [CrossRef]
- Dar, S.A.; Khan, K.; Birch, W. Sedimentary: Phosphates. In Reference Module in Earth Systems and Environmental Sciences; Elsevier: Amsterdam, The Netherlands, 2017; Volume 10. [Google Scholar]
- Capotondi, L.; Girone, A.; Lirer, F.; Bergami, C.; Verducci, M.; Vallefuoco, M.; Afferri, A.; Ferraro, L.; Pelosi, N.; De Lange, G.J. Central Mediterranean Mid-Pleistocene paleoclimatic variability and its association with global climate. Palaeogeogr. Palaeoclimatol. Palaeoecol. 2016, 442, 72–83. [Google Scholar] [CrossRef]
- Gallagher, S.J.; Kitamura, A.; Iryu, Y.; Itaki, T.; Koizumi, I.; Hoiles, P.W. The Pliocene to recent history of the Kuroshio and Tsushima Currents: A multi-proxy approach. Prog. Earth Planet. Sci. 2015, 2, 1–23. [Google Scholar] [CrossRef]
- Sabino, M.; Schefuß, E.; Natalicchio, M.; Pierre, F.D.; Birgel, D.; Bortels, D.; Schnetger, B.; Peckmann, J. Climatic and hydrologic variability in the northern Mediterranean across the onset of the Messinian salinity crisis. Palaeogeogr. Palaeoclimatol. Palaeoecol. 2020, 545, 109632. [Google Scholar] [CrossRef]
- Natalicchio, M.; Pierre, F.D.; Birgel, D.; Brumsack, H.; Carnevale, G.; Gennari, R.; Gier, S.; Lozar, F.; Pellegrino, L.; Sabino, M. Paleoenvironmental change in a precession-paced succession across the onset of the Messinian salinity crisis: Insight from element geochemistry and molecular fossils. Palaeogeogr. Palaeoclimatol. Palaeoecol. 2019, 518, 45–61. [Google Scholar] [CrossRef]
- Reolid, M.; Duarte, L.; Rita, P. Changes in foraminiferal assemblages and environmental conditions during the T-OAE (Early Jurassic) in the northern Lusitanian Basin, Portugal. Palaeogeogr. Palaeoclimatol. Palaeoecol. 2019, 520, 30–43. [Google Scholar] [CrossRef]
- Abanda, P.A.; Hannigan, R.E. Effect of diagenesis on trace element partitioning in shales. Chem. Geol. 2006, 230, 42–59. [Google Scholar] [CrossRef]
- Algeo, T.J.; Maynard, J.B. Trace-element behavior and redox facies in core shales of Upper Pennsylvanian Kansas-type cyclothems. Chem. Geol. 2004, 206, 289–318. [Google Scholar] [CrossRef]
- März, C.; Poulton, S.W.; Beckmann, B.; Küster, K.; Wagner, T.; Kasten, S. Redox sensitivity of P cycling during marine black shale formation: Dynamics of sulfidic and anoxic, non-sulfidic bottom waters. Geochim. Cosmochim. Acta 2008, 72, 3703–3717. [Google Scholar] [CrossRef]
- Pi, D.-H.; Liu, C.-Q.; Shields-Zhou, G.A.; Jiang, S.-Y. Trace and rare earth element geochemistry of black shale and kerogen in the early Cambrian Niutitang Formation in Guizhou province, South China: Constraints for redox environments and origin of metal enrichments. Precambrian Res. 2013, 225, 218–229. [Google Scholar] [CrossRef]
- Charriau, A.; Lesven, L.; Gao, Y.; Leermakers, M.; Baeyens, W.; Ouddane, B.; Billon, G. Trace metal behaviour in riverine sediments: Role of organic matter and sulfides. Appl. Geochem. 2011, 26, 80–90. [Google Scholar] [CrossRef]
- Lipinski, M.; Warning, B.; Brumsack, H.-J. Trace metal signatures of Jurassic/Cretaceous black shales from the Norwegian Shelf and the Barents Sea. Palaeogeogr. Palaeoclimatol. Palaeoecol. 2003, 190, 459–475. [Google Scholar] [CrossRef]
- Zhang, K.; Liu, R.; Liu, Z.; Li, B.; Han, J.; Zhao, K. Influence of volcanic and hydrothermal activity on organic matter enrichment in the Upper Triassic Yanchang Formation, southern Ordos Basin, Central China. Mar. Pet. Geol. 2020, 112, 104059. [Google Scholar] [CrossRef]
- Yin, J.; Xu, C.; Hao, F.; Wang, Q.; Miao, Q.; Wang, Z.; Zou, H. Controls on organic matter enrichment in source rocks of the Shahejie Formation in the southwestern Bozhong Sag, Bohai Bay Basin, China. Palaeogeogr. Palaeoclimatol. Palaeoecol. 2020, 560, 110026. [Google Scholar] [CrossRef]
- AE, T.; Olivier, J. Sagole Spa Resort, Current and Potential Uses. In Proceedings of the World Geothermal Congress, Bali, Indonesia, 25–29 April 2010; pp. 25–29. [Google Scholar]
- Ren, J.; Guo, P.; Peng, S.; Yang, C. Investigation on permeability of shale matrix using the lattice Boltzmann method. J. Nat. Gas Sci. Eng. 2016, 29, 169–175. [Google Scholar] [CrossRef]
- Raffensperger, J.P.; Vlassopoulos, D. The potential for free and mixed convection in sedimentary basins. Hydrogeol. J. 1999, 7, 505–520. [Google Scholar] [CrossRef]
- Zhao, J.; Jin, Z.; Jin, Z.; Geng, Y.; Wen, X.; Yan, C. Applying sedimentary geochemical proxies for paleoenvironment interpretation of organic-rich shale deposition in the Sichuan Basin, China. Int. J. Coal Geol. 2016, 163, 52–71. [Google Scholar] [CrossRef]
- Wen, H.; Zheng, R.; Tang, F.; Zheng, A.; Sang, T.; Chen, S.; Li, G.; Li, Z. Reconstruction and analysis of paleosalanity and paleoenvironment of the Chang 6 member in the Gengwan region, Ordos basin. J. Mineral. Petrol. 2008, 28, 114–120. [Google Scholar]
- Zuo, X.; Li, C.; Zhang, J.; Ma, G.; Chen, P. Geochemical characteristics and depositional environment of the Shahejie Formation in the Binnan Oilfield, China. J. Geophys. Eng. 2020, 17, 539–551. [Google Scholar] [CrossRef]
- Baker, M.J.; Trevisan, J.; Bassan, P.; Bhargava, R.; Butler, H.J.; Dorling, K.M.; Fielden, P.R.; Fogarty, S.W.; Fullwood, N.J.; Heys, K.A. Using Fourier transform IR spectroscopy to analyze biological materials. Nat. Protoc. 2014, 9, 1771. [Google Scholar] [CrossRef]
- Günzler, H.; Gremlich, H.-U. IR Spectroscopy. An Introduction. Wiley-VCH: Weinheim, Germany, 2002; Volume 34, 374p. [Google Scholar]
- Coenen, K.; Gallucci, F.; Mezari, B.; Hensen, E.; van Sint Annaland, M. An in-situ IR study on the adsorption of CO2 and H2O on hydrotalcites. J. CO2 Util. 2018, 24, 228–239. [Google Scholar] [CrossRef]
- Hillel, D.; Hatfield, J.L. Encyclopedia of Soils in the Environment; Elsevier: Amsterdam, The Netherlands, 2005; Volume 3. [Google Scholar]
- Martini, A.M.; Budai, J.M.; Walter, L.M.; Schoell, M. Microbial generation of economic accumulations of methane within a shallow organic-rich shale. Nature 1996, 383, 155–158. [Google Scholar] [CrossRef]
- Wang, H.; Xiao, E.; Li, Y.; Latif, K.; Riaz, M. New Advances and Existed Problems for the Forming Mechanism of the Microbial Dolomite. sedimentology 2018, 2, 5. [Google Scholar]
- Li, C.; Sessions, A.L.; Kinnaman, F.S.; Valentine, D.L. Hydrogen-isotopic variability in lipids from Santa Barbara Basin sediments. Geochim. Cosmochim. Acta 2009, 73, 4803–4823. [Google Scholar] [CrossRef]
- Wang, N.; Wen, L.; Li, M.; Dai, X.; Xu, Y.; Ming, Y.; Yang, S. The origin of abnormally 13C-depleted organic carbon isotope signatures in the early Cambrian Yangtze Platform. Mar. Pet. Geol. 2021, 128, 105051. [Google Scholar] [CrossRef]
- Cassel, M.C.; Lavina, E.L.; Cagliari, J.; Rodrigues, R.; Pereira, E. Anoxia and salinity changes: A new Permian catastrophe record. Clim. Past Discuss. 2019, 46, 1–20. [Google Scholar]
- dos Reis, D.E.; Rodrigues, R.; Moldowan, J.M.; Jones, C.M.; Brito, M.; da Costa Cavalcante, D.; Portela, H.A. Biomarkers stratigraphy of Irati Formation (lower permian) in the southern portion of Paraná Basin (Brazil). Mar. Pet. Geol. 2018, 95, 110–138. [Google Scholar] [CrossRef]
- Dixon, D.A.; Pope, G.J. Oil shale of the Duaringa Basin, Central Queensland. Fuel 1987, 66, 305–308. [Google Scholar] [CrossRef]
- Alison, T. Petroleum Plays of the Bowen and Surat Basins Summary; Australian Society of Exploration Geophysicist: Sydney, Australia, 2018; Volume 20, p. 3676. [Google Scholar]
- De Kock, M.O.; Beukes, N.J.; Adeniyi, E.O.; Cole, D.; Gotz, A.E.; Geel, C.; Ossa, F.-G. Deflating the shale gas potential of South Africa's Main Karoo basin. S. Afr. J. Sci. 2017, 113, 1–12. [Google Scholar] [CrossRef]
- Geel, C.; Schulz, H.-M.; Booth, P.; deWit, M.; Horsfield, B. Shale gas characteristics of Permian black shales in South Africa: Results from recent drilling in the Ecca Group (Eastern Cape). Energy Procedia 2013, 40, 256–265. [Google Scholar] [CrossRef]
- Catuneanu, O. Retroarc foreland systems––evolution through time. J. Afr. Earth Sci. 2004, 38, 225–242. [Google Scholar] [CrossRef]
- Cagliari, J.; Serratt, H.; Cassel, M.C.; Schmitz, M.D.; Chemale Jr, F. New high-precision U-Pb zircon age of the Irati Formation (Paraná Basin) and implications for the timing of the Kungurian anoxic events recorded in southern Gondwana. Gondwana Res. 2022, 107, 134–145. [Google Scholar] [CrossRef]
- Ruckwied, K.; Götz, A.E.; Jones, P. Palynological records of the Permian Ecca Group (South Africa): Utilizing climatic icehouse–greenhouse signals for cross basin correlations. Palaeogeogr. Palaeoclimatol. Palaeoecol. 2014, 413, 167–172. [Google Scholar] [CrossRef]
- Stephenson, M.H. Permian palynostratigraphy: A global overview. Geol. Soc. Lond. Spec. Publ. 2018, 450, 321–347. [Google Scholar] [CrossRef]
- Holz, M.; França, A.B.; Souza, P.A.; Iannuzzi, R.; Rohn, R. A stratigraphic chart of the Late Carboniferous/Permian succession of the eastern border of the Paraná Basin, Brazil, South America. J. S. Am. Earth Sci. 2010, 29, 381–399. [Google Scholar] [CrossRef]
- Holz, M.; Souza, P.A.; Iannuzzi, R.; Fielding, C.R.; Frank, T.D.; Isbell, J.L. Sequence stratigraphy and biostratigraphy of the Late Carboniferous to Early Permian glacial succession (Itararé subgroup) at the eastern-southeastern margin of the Paraná Basin, Brazil. In Resolving the Late Paleozoic Ice Age in Time and Space; Special Paper; Geological Society of America: Boulder, CO, USA, 2008; pp. 115–129. [Google Scholar]
- Souza, R.I.P.A. Floral succession in the lower permian deposits of the brazilian paraná basin: Anup-to-date overview. In Nonmarine Permian: Bulletin; New Mexico Museum of Natural History and Science: Albuquerque, NM, USA, 2005; Volume 30, p. 144. [Google Scholar]
- Cúneo, N.R.; Isbell, J.; Taylor, E.L.; Taylor, T.N. The Glossopteris flora from Antarctica: Taphonomy and paleoecology. Comptes Rendus XII ICC-P 1993, 2, 13–40. [Google Scholar]
- Tewari, R.; Chatterjee, S.; Agnihotri, D.; Pandita, S.K. Glossopteris flora in the Permian Weller Formation of Allan Hills, South Victoria Land, Antarctica: Implications for paleogeography, paleoclimatology, and biostratigraphic correlation. Gondwana Res. 2015, 28, 905–932. [Google Scholar] [CrossRef]
- Geel, C.; De Wit, M.; Booth, P.; Schulz, H.; Horsfield, B. Palaeo-environment, diagenesis and characteristics of Permian black shales in the Lower Karoo Supergroup flanking the Cape Fold Belt near Jansenville, eastern Cape, South Africa: Implications for the shale gas potential of the Karoo Basin. S. Afr. J. Geol. 2015, 118, 249–274. [Google Scholar] [CrossRef]
- Zagorski, W.A.; Wrightstone, G.R.; Bowman, D.C. The Appalachian Basin Marcellus Gas Play: Its History of Development, Geologic Controls on Production, and Future Potential as a World-class Reservoir. In Shale Reservoirs: Giant Resources for the 21st Century; American Association of Petroleum Geologists (APPG): Tulsa, OK, USA, 2012; pp. 172–200. [Google Scholar] [CrossRef]
- Chabalala, V.P.; Wagner, N.; Malumbazo, N.; Eble, C.F. Geochemistry and organic petrology of the permian whitehill formation, Karoo Basin (RSA) and the Devonian/Carboniferous shale of the Appalachian Basin (USA). Int. J. Coal Geol. 2020, 232, 103612. [Google Scholar] [CrossRef]
- Anthony, D. A Review of Recent Conventional Petroleum Exploration and In-Field Gas Reserves Growth in the Denison Trough, Queensland; Petroleum Exploration Society of Australia Inc.: Queensland, Australia, 2004. [Google Scholar]


| Sample ID | Depth (m) | Major Oxides Composition (%) | LOI (%) | K2O /Al2O3 | Fe/(Fe + Mg) | ICV | |||||||||
|---|---|---|---|---|---|---|---|---|---|---|---|---|---|---|---|
| Al2O3 | CaO | Fe2O3 | K2O | MgO | MnO | Na2O | P2O5 | SiO2 | TiO2 | ||||||
| SD1 | 485 | 29.17 | 0.28 | 1.10 | 0.98 | 0.12 | 0.01 | 0.11 | 0.22 | 52.26 | 1.19 | 15.04 | 0.03 | 0.90 | 0.09 |
| SD2 | 490 | 29.24 | 0.28 | 1.16 | 0.98 | 0.13 | 0.01 | 0.11 | 0.22 | 52.45 | 1.19 | 15.11 | 0.03 | 0.90 | 0.09 |
| SD3 | 510 | 29.16 | 0.28 | 1.13 | 0.98 | 0.12 | 0.01 | 0.10 | 0.22 | 52.18 | 1.20 | 15.10 | 0.03 | 0.90 | 0.09 |
| SD4 | 520 | 29.23 | 0.29 | 1.12 | 0.97 | 0.13 | 0.01 | 0.11 | 0.21 | 52.18 | 1.19 | 15.06 | 0.03 | 0.90 | 0.09 |
| SD5 | 525 | 29.19 | 0.28 | 1.13 | 0.97 | 0.13 | 0.01 | 0.10 | 0.21 | 52.26 | 1.19 | 14.95 | 0.03 | 0.90 | 0.09 |
| SD6 | 530 | 29.12 | 0.28 | 1.14 | 0.98 | 0.13 | 0.01 | 0.10 | 0.21 | 52.50 | 1.19 | 15.06 | 0.03 | 0.90 | 0.09 |
| SD7 | 545 | 29.14 | 0.29 | 1.11 | 0.97 | 0.13 | 0.01 | 0.12 | 0.21 | 52.30 | 1.18 | 14.97 | 0.03 | 0.90 | 0.09 |
| SD8 | 555 | 29.11 | 0.28 | 1.12 | 0.97 | 0.13 | 0.01 | 0.09 | 0.21 | 52.34 | 1.18 | 15.06 | 0.03 | 0.90 | 0.09 |
| SD9 | 570 | 29.25 | 0.28 | 1.12 | 0.98 | 0.13 | 0.01 | 0.10 | 0.22 | 52.25 | 1.18 | 15.03 | 0.03 | 0.90 | 0.09 |
| SD10 | 580 | 29.18 | 0.28 | 1.09 | 0.98 | 0.13 | 0.01 | 0.10 | 0.21 | 52.37 | 1.19 | 15.03 | 0.03 | 0.89 | 0.09 |
| Max | 29.25 | 0.29 | 1.16 | 0.98 | 0.13 | 0.01 | 0.12 | 0.22 | 52.50 | 1.2 | 15.11 | ||||
| Min | 29.11 | 0.28 | 1.09 | 0.97 | 0.12 | 0.01 | 0.09 | 0.21 | 52.18 | 1.18 | 14.95 | ||||
| Sample | Sc | V | Cr | Co | Ni | Cu | Zn | Rb | Sr | Y | Zr | Nb | Mo | Cs | Ba | La | Ce | Pr | Nd | Ni/Co |
|---|---|---|---|---|---|---|---|---|---|---|---|---|---|---|---|---|---|---|---|---|
| SD1 | 25.19 | 151.88 | 82.80 | 5.51 | 45.09 | 43.09 | 65.30 | 69.77 | 328.15 | 56.63 | 314.58 | 29.64 | 1.37 | 9.15 | 557.17 | 91.48 | 168.57 | 19.27 | 63.60 | 8.18 |
| SD2 | 25.91 | 153.51 | 83.96 | 5.89 | 51.29 | 77.11 | 64.17 | 69.65 | 344.91 | 57.09 | 328.64 | 32.17 | 1.95 | 9.68 | 547.99 | 93.19 | 172.81 | 19.43 | 67.04 | 8.71 |
| SD3 | 23.44 | 150.94 | 73.08 | 5.34 | 39.04 | 39.92 | 65.37 | 67.69 | 336.77 | 53.99 | 317.59 | 28.83 | 1.87 | 9.76 | 550.62 | 91.01 | 170.72 | 19.21 | 64.11 | 7.31 |
| SD4 | 25.40 | 156.69 | 76.64 | 5.16 | 39.53 | 29.04 | 59.03 | 68.58 | 335.61 | 56.71 | 325.10 | 29.21 | 1.95 | 9.21 | 560.83 | 93.05 | 173.01 | 19.35 | 63.31 | 7.66 |
| SD5 | 25.22 | 156.61 | 78.22 | 5.96 | 43.54 | 39.45 | 57.46 | 70.11 | 325.77 | 58.22 | 315.47 | 29.52 | 1.89 | 9.32 | 527.61 | 92.60 | 170.34 | 19.62 | 66.19 | 7.31 |
| SD6 | 25.39 | 155.86 | 81.64 | 5.93 | 48.40 | 44.27 | 62,05 | 68.06 | 340.61 | 55.66 | 316.38 | 30.08 | 1.90 | 9.92 | 513.85 | 91.71 | 164.63 | 18.33 | 64.44 | 8.16 |
| SD7 | 25.09 | 156.88 | 86.66 | 5.79 | 45.75 | 37.30 | 58.51 | 73.87 | 343.57 | 59.75 | 341.73 | 31.51 | 2.27 | 9.65 | 560.88 | 93.34 | 173.39 | 19.40 | 64.70 | 7.90 |
| SD8 | 25.82 | 153.66 | 80.84 | 6.03 | 44.29 | 36.21 | 67.09 | 68.00 | 342.15 | 57.76 | 319.57 | 30.33 | 1.93 | 9.61 | 550.97 | 93.58 | 168.96 | 19.28 | 63.59 | 7.34 |
| SD9 | 23.49 | 155.09 | 85.37 | 5.49 | 43.44 | 37.23 | 59.86 | 68.15 | 339.71 | 58.51 | 328.14 | 30.40 | 1.57 | 9.50 | 554.09 | 92.30 | 175.01 | 19.51 | 63.83 | 7.91 |
| SD10 | 23.45 | 156.02 | 85.12 | 4.85 | 39.50 | 33.12 | 61.89 | 73.00 | 333.74 | 56.50 | 316.50 | 30.53 | 1.97 | 9.55 | 533.70 | 88.48 | 174.55 | 19.61 | 61.87 | 8.14 |
| Contd | Sm | Eu | Gd | Tb | Dy | Ho | Er | Tm | Yb | Lu | Hf | Ta | Pb | Th | U | V/(V + Ni) | V/Cr | (Eu/Eu *) | (Ce *) | U/Th |
| SD1 | 12.14 | 2.57 | 10.75 | 1.57 | 9.49 | 2.07 | 4.87 | 0.72 | 5.30 | 0.76 | 8.73 | 2.01 | 30.62 | 29.52 | 6.67 | 0.77 | 3.37 | 0.05 | 14.44 | 0.23 |
| SD2 | 12.99 | 2.47 | 10.47 | 1.50 | 9.16 | 1.95 | 5.31 | 0.83 | 5.13 | 0.78 | 7.70 | 2.20 | 35.22 | 30.58 | 6.73 | 0.75 | 2.99 | 0.05 | 14.62 | 0.22 |
| SD3 | 12.92 | 2.44 | 10.69 | 1.55 | 9.27 | 1.95 | 5.06 | 0.79 | 4.90 | 0.78 | 8.23 | 2.14 | 35.11 | 29.85 | 6.45 | 0.79 | 3.87 | 0.05 | 14.54 | 0.22 |
| SD4 | 13.28 | 2.50 | 10.85 | 1.76 | 9.51 | 2.09 | 5.39 | 0.93 | 6.00 | 0.79 | 8.14 | 2.11 | 33.49 | 31.76 | 6.47 | 0.80 | 3.96 | 0.05 | 14.63 | 0.20 |
| SD5 | 12.53 | 2.20 | 11.94 | 1.72 | 9.69 | 1.99 | 5.14 | 0.79 | 5.49 | 0.68 | 8.11 | 2.14 | 32.55 | 30.63 | 6.65 | 0.78 | 3.60 | 0.04 | 14.52 | 0.22 |
| SD6 | 12.75 | 2.27 | 11.01 | 1.64 | 9.55 | 1.99 | 5.25 | 0.77 | 4.49 | 0.77 | 8.07 | 2.02 | 33.74 | 29.44 | 6.35 | 0.76 | 3.22 | 0.04 | 14.27 | 0.22 |
| SD7 | 14.06 | 2.24 | 10.76 | 1.69 | 9.75 | 2.00 | 4.95 | 0.77 | 5.31 | 0.85 | 7.81 | 2.18 | 31.95 | 31.88 | 6.65 | 0.77 | 3.43 | 0.04 | 14.65 | 0.21 |
| SD8 | 12.28 | 2.48 | 11.76 | 1.68 | 10.13 | 1.96 | 5.42 | 0.83 | 5.68 | 0.86 | 8.23 | 2.11 | 32.13 | 30.59 | 6.33 | 0.78 | 3.47 | 0.05 | 14.46 | 0.21 |
| SD9 | 13.55 | 2.20 | 10.48 | 1.74 | 9.13 | 1.89 | 5.42 | 0.84 | 5.10 | 0.80 | 8.44 | 2.13 | 32.98 | 29.26 | 6.53 | 0.78 | 3.57 | 0.04 | 14.72 | 0.22 |
| SD10 | 13.33 | 2.71 | 10.35 | 1.57 | 8.88 | 1.91 | 5.25 | 0.90 | 5.39 | 0.79 | 8.22 | 1.99 | 29.63 | 29.36 | 6.24 | 0.80 | 3.95 | 0.05 | 14.70 | 0.21 |
| Samples | SD1 | SD2 | SD3 | SD4 | SD5 | SD6 | SD7 | SD8 | SD9 | SD10 |
|---|---|---|---|---|---|---|---|---|---|---|
| δ 13C (‰) | −22.4 | −22.08 | −22.04 | −23.1 | −24.0 | −22.5 | −23.02 | −22.01 | −21.15 | −21.06 |
| δ 18O (‰) | 9.80 | 9.45 | 9.82 | 9.96 | 9.75 | 9.94 | 9.89 | 9.87 | 9.76 | 9.95 |
Publisher’s Note: MDPI stays neutral with regard to jurisdictional claims in published maps and institutional affiliations. |
© 2022 by the authors. Licensee MDPI, Basel, Switzerland. This article is an open access article distributed under the terms and conditions of the Creative Commons Attribution (CC BY) license (https://creativecommons.org/licenses/by/4.0/).
Share and Cite
Akintola, G.O.; Amponsah-Dacosta, F.; Rupprecht, S.; Mhlongo, S.E. Stable Isotopic, Micro-FTIR, and Geochemical Characteristics of the Permian Madzaringwe Shale of Tuli Basin, South Africa: Implications for Organic-Rich Shale Provenance. Minerals 2022, 12, 1160. https://doi.org/10.3390/min12091160
Akintola GO, Amponsah-Dacosta F, Rupprecht S, Mhlongo SE. Stable Isotopic, Micro-FTIR, and Geochemical Characteristics of the Permian Madzaringwe Shale of Tuli Basin, South Africa: Implications for Organic-Rich Shale Provenance. Minerals. 2022; 12(9):1160. https://doi.org/10.3390/min12091160
Chicago/Turabian StyleAkintola, George Oluwole, Francis Amponsah-Dacosta, Steven Rupprecht, and Sphiwe Emmanuel Mhlongo. 2022. "Stable Isotopic, Micro-FTIR, and Geochemical Characteristics of the Permian Madzaringwe Shale of Tuli Basin, South Africa: Implications for Organic-Rich Shale Provenance" Minerals 12, no. 9: 1160. https://doi.org/10.3390/min12091160