
Ore Genesis of the Toudaochuan Gold Deposit in Central Jilin Province, NE China: Constraints from Fluid Inclusions and C–H–O–S–Pb Isotopes


Abstract
:1. Introduction
2. Regional Geology
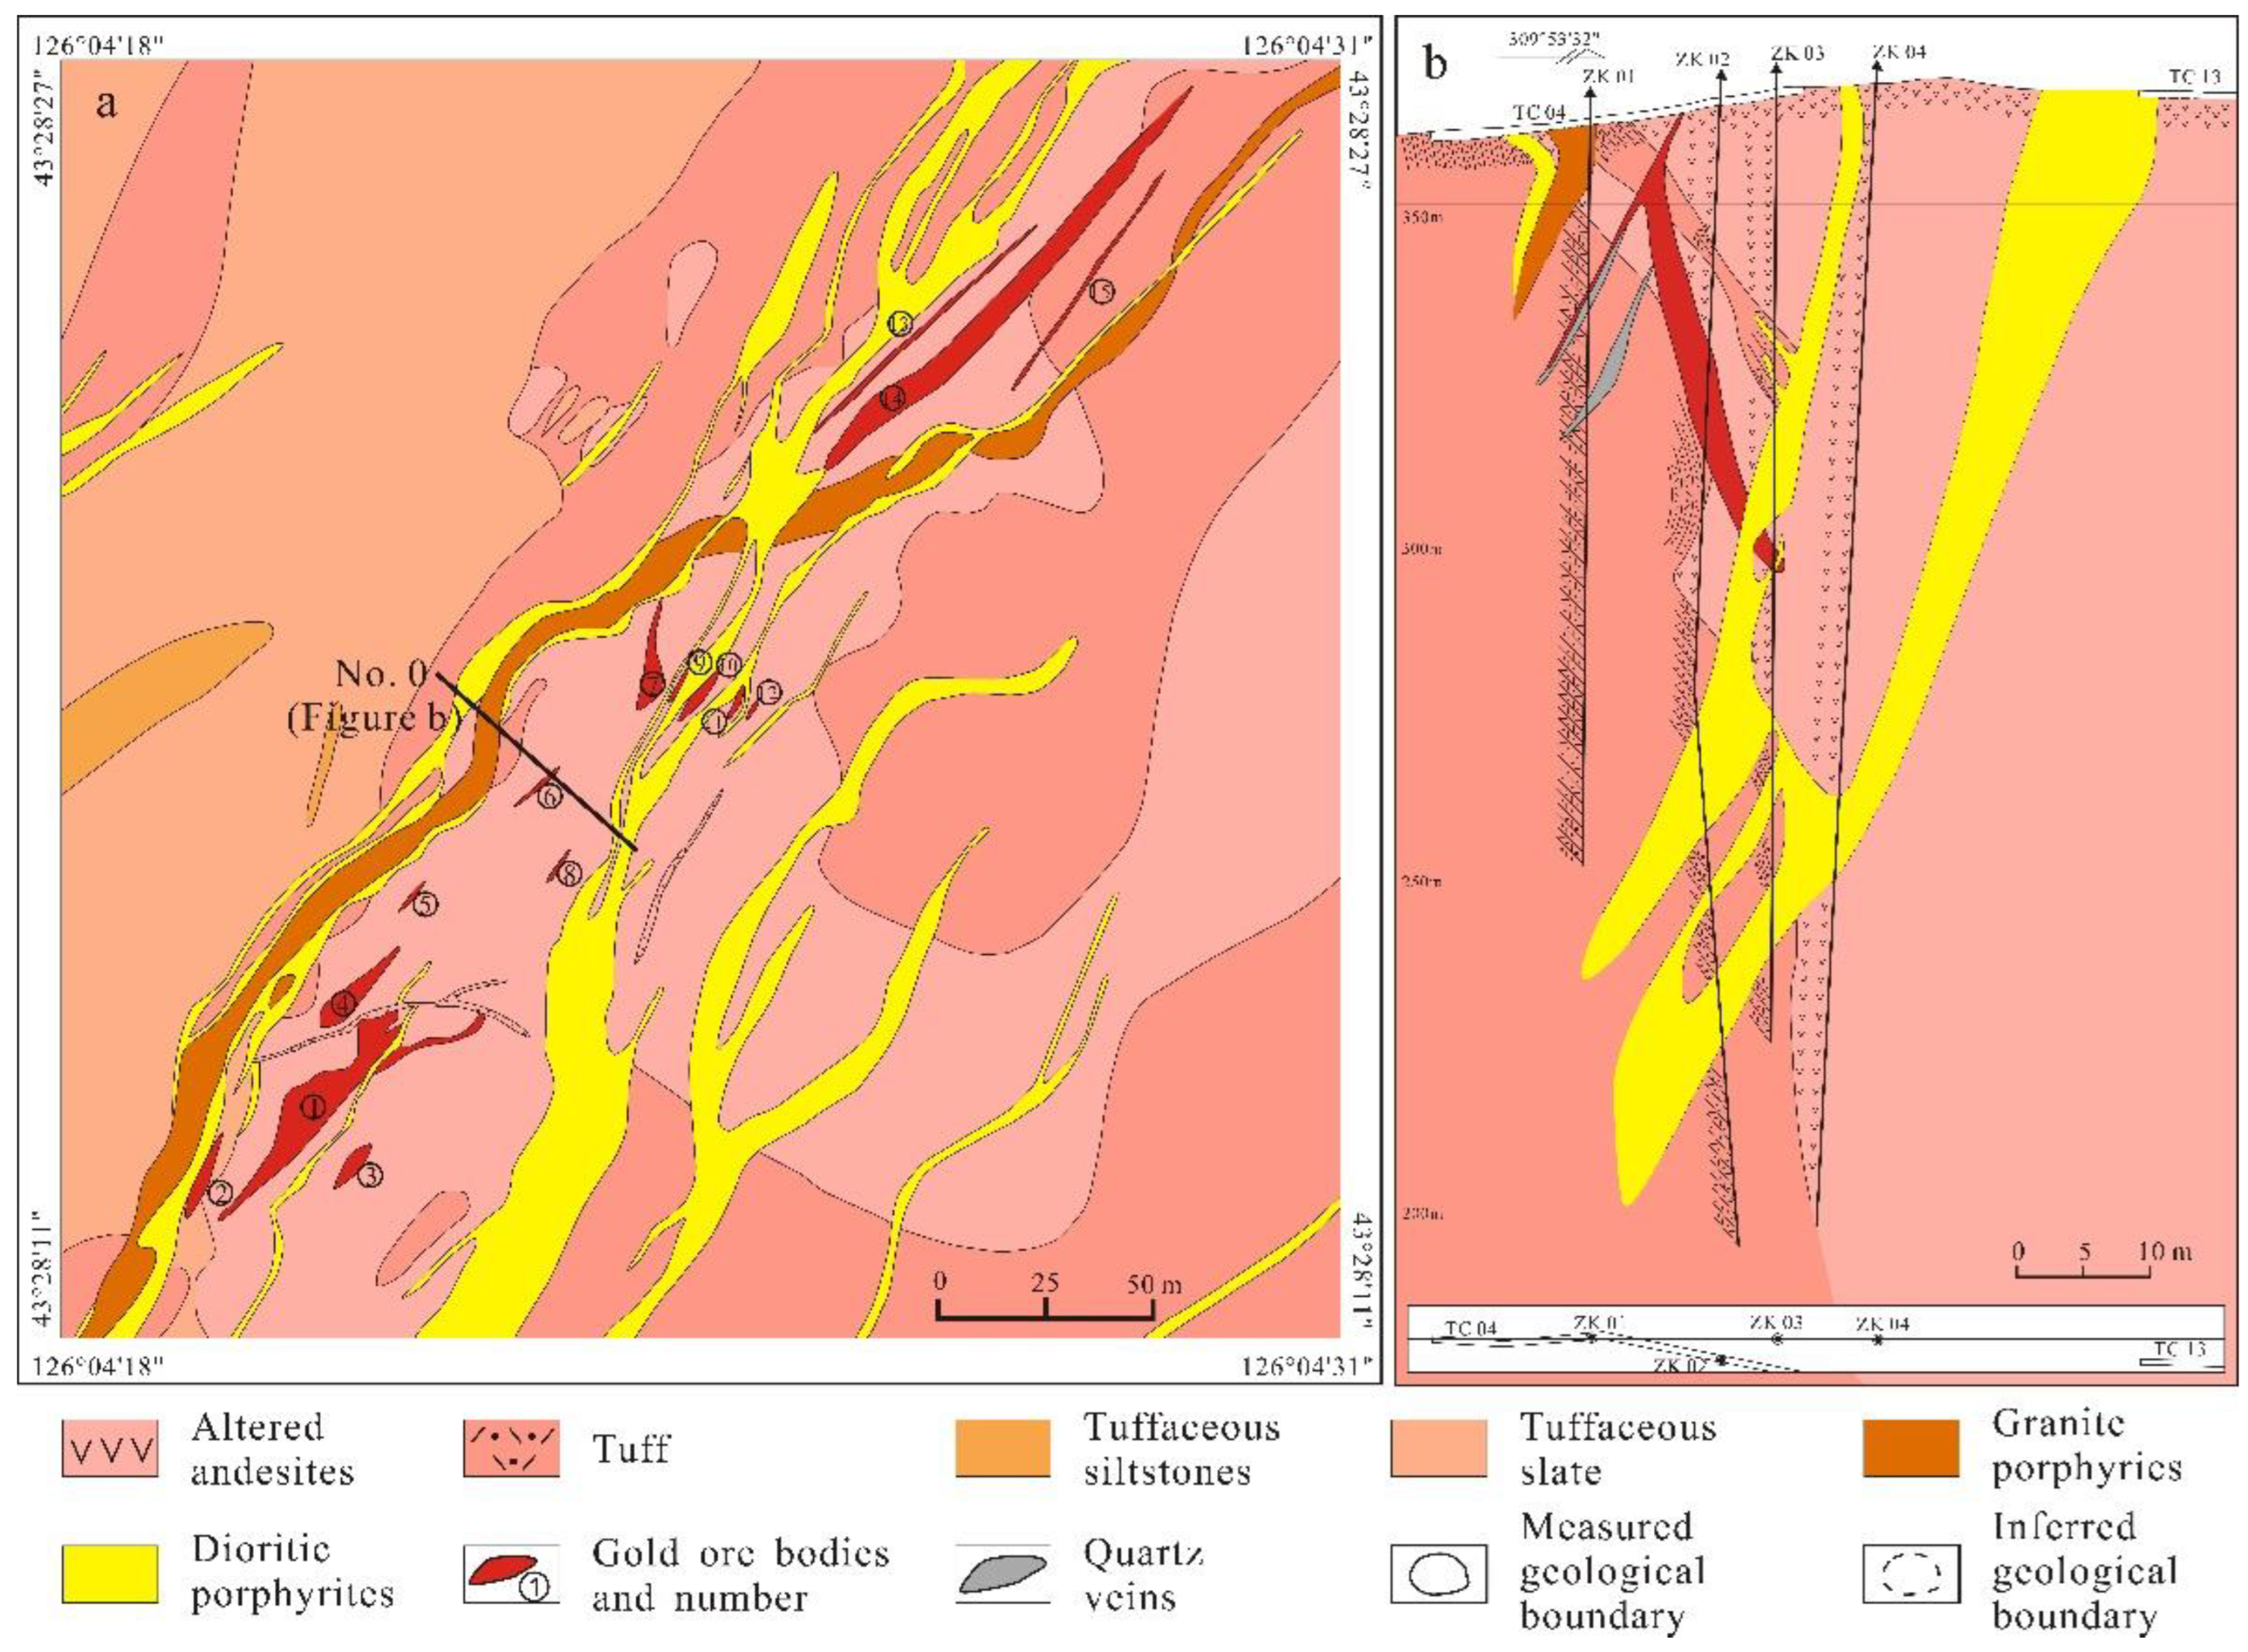
3. Toudaochuan Ore Deposit Geology
4. Samples Description and Analytical Methods
4.1. Fluid Inclusions
4.2. C–H–O Isotope Analysis
4.3. S, Pb Isotope Analysis
5. Results
5.1. Fluid Inclusions Analysis
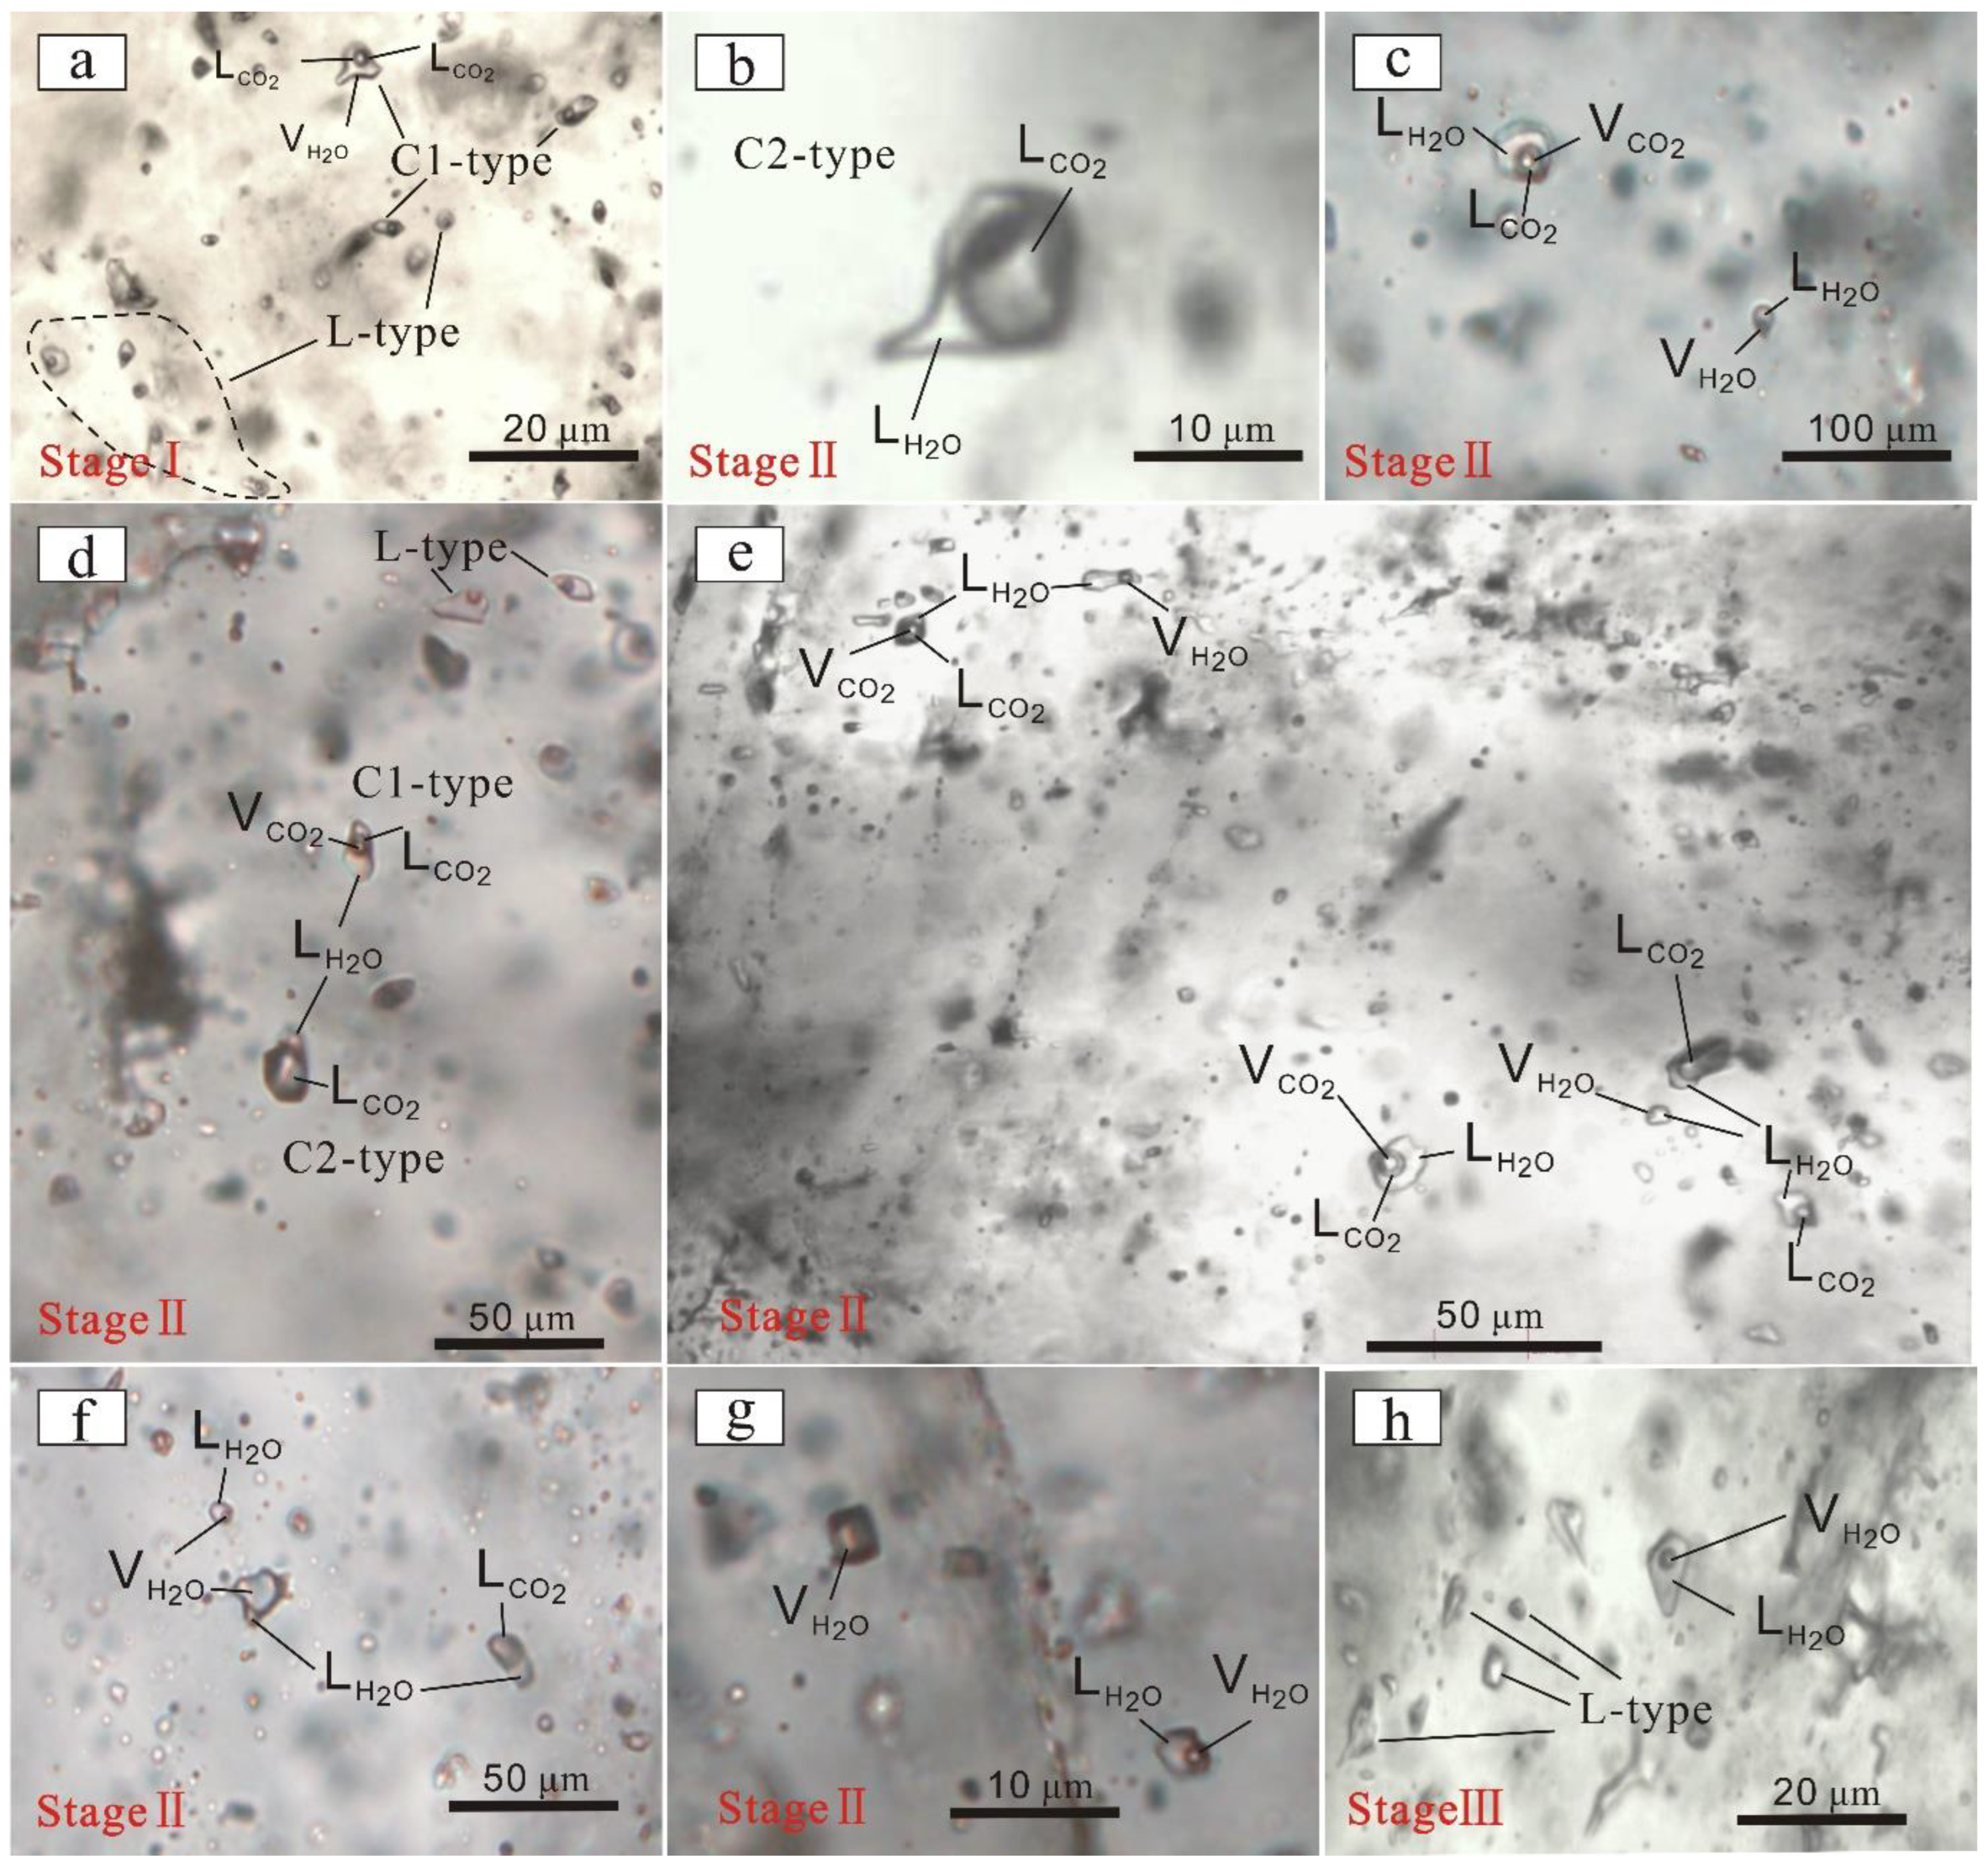
5.1.1. Petrographic Characteristics
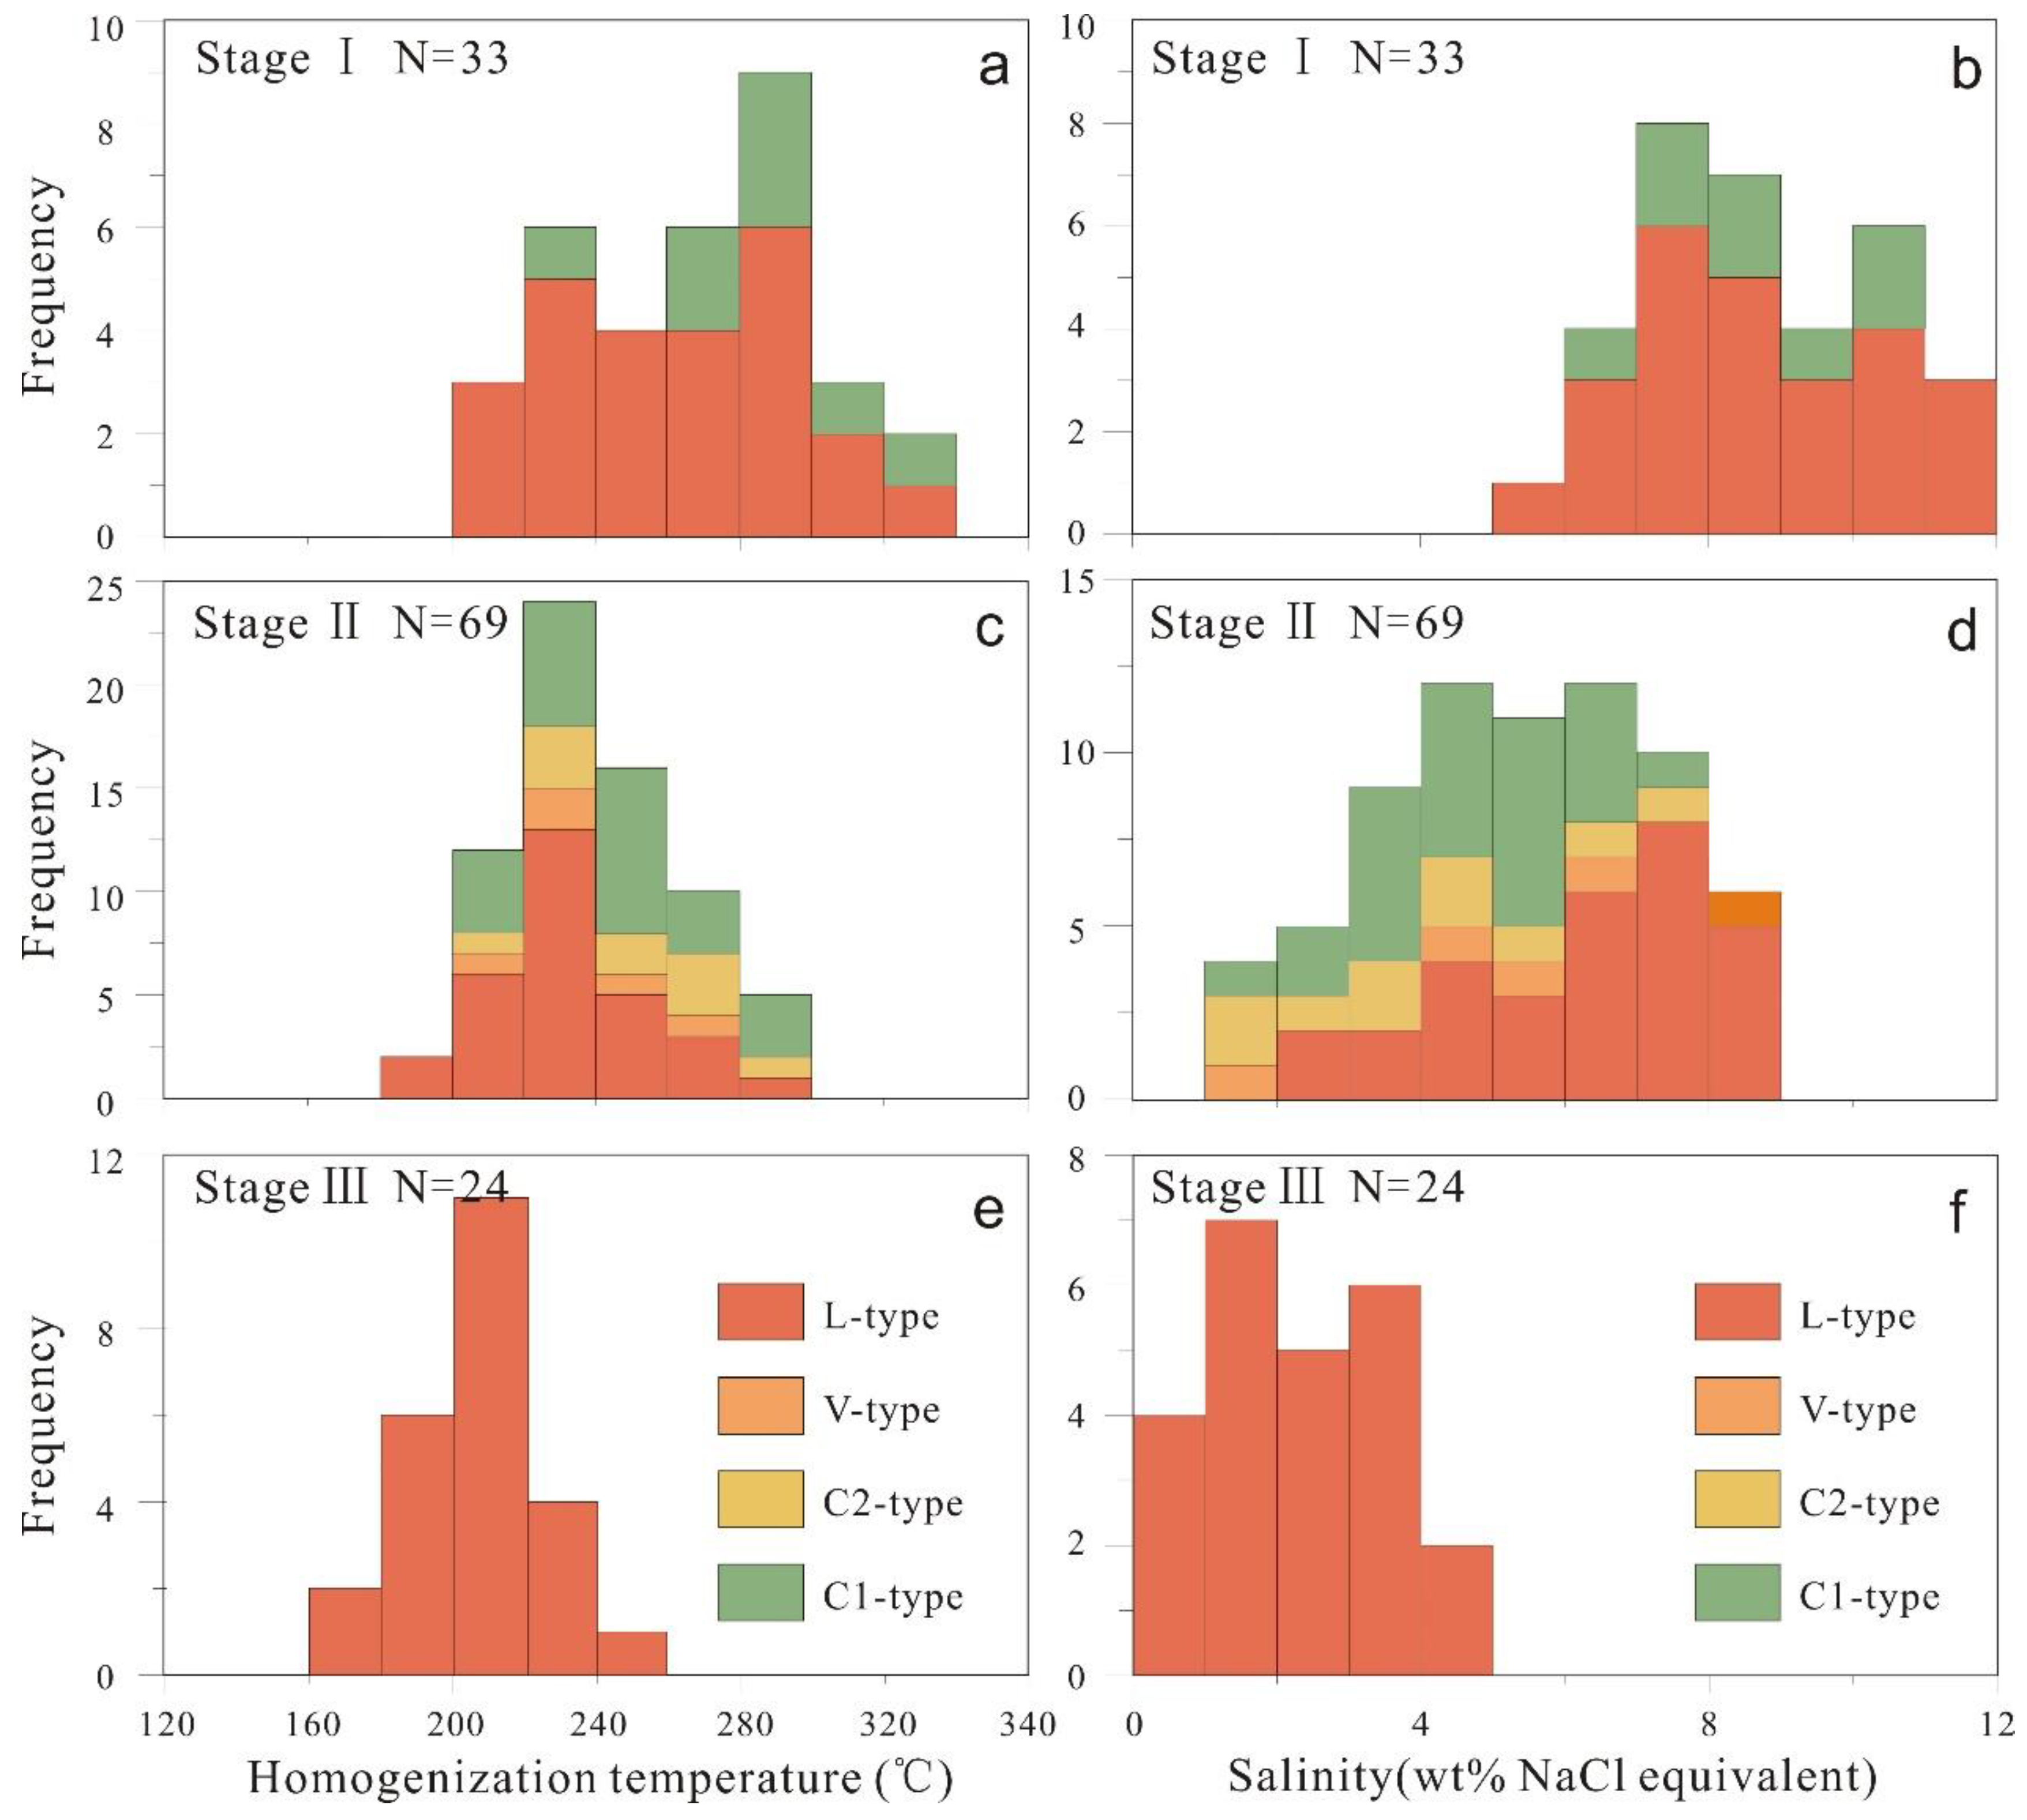
5.1.2. Microthermometry Results
5.1.3. Laser Raman Spectroscopy
5.2. C–H–O Isotope Compositions
5.3. S, Pb Isotope Compositions
6. Discussion
6.1. Sources of Ore-Forming Fluids and Materials
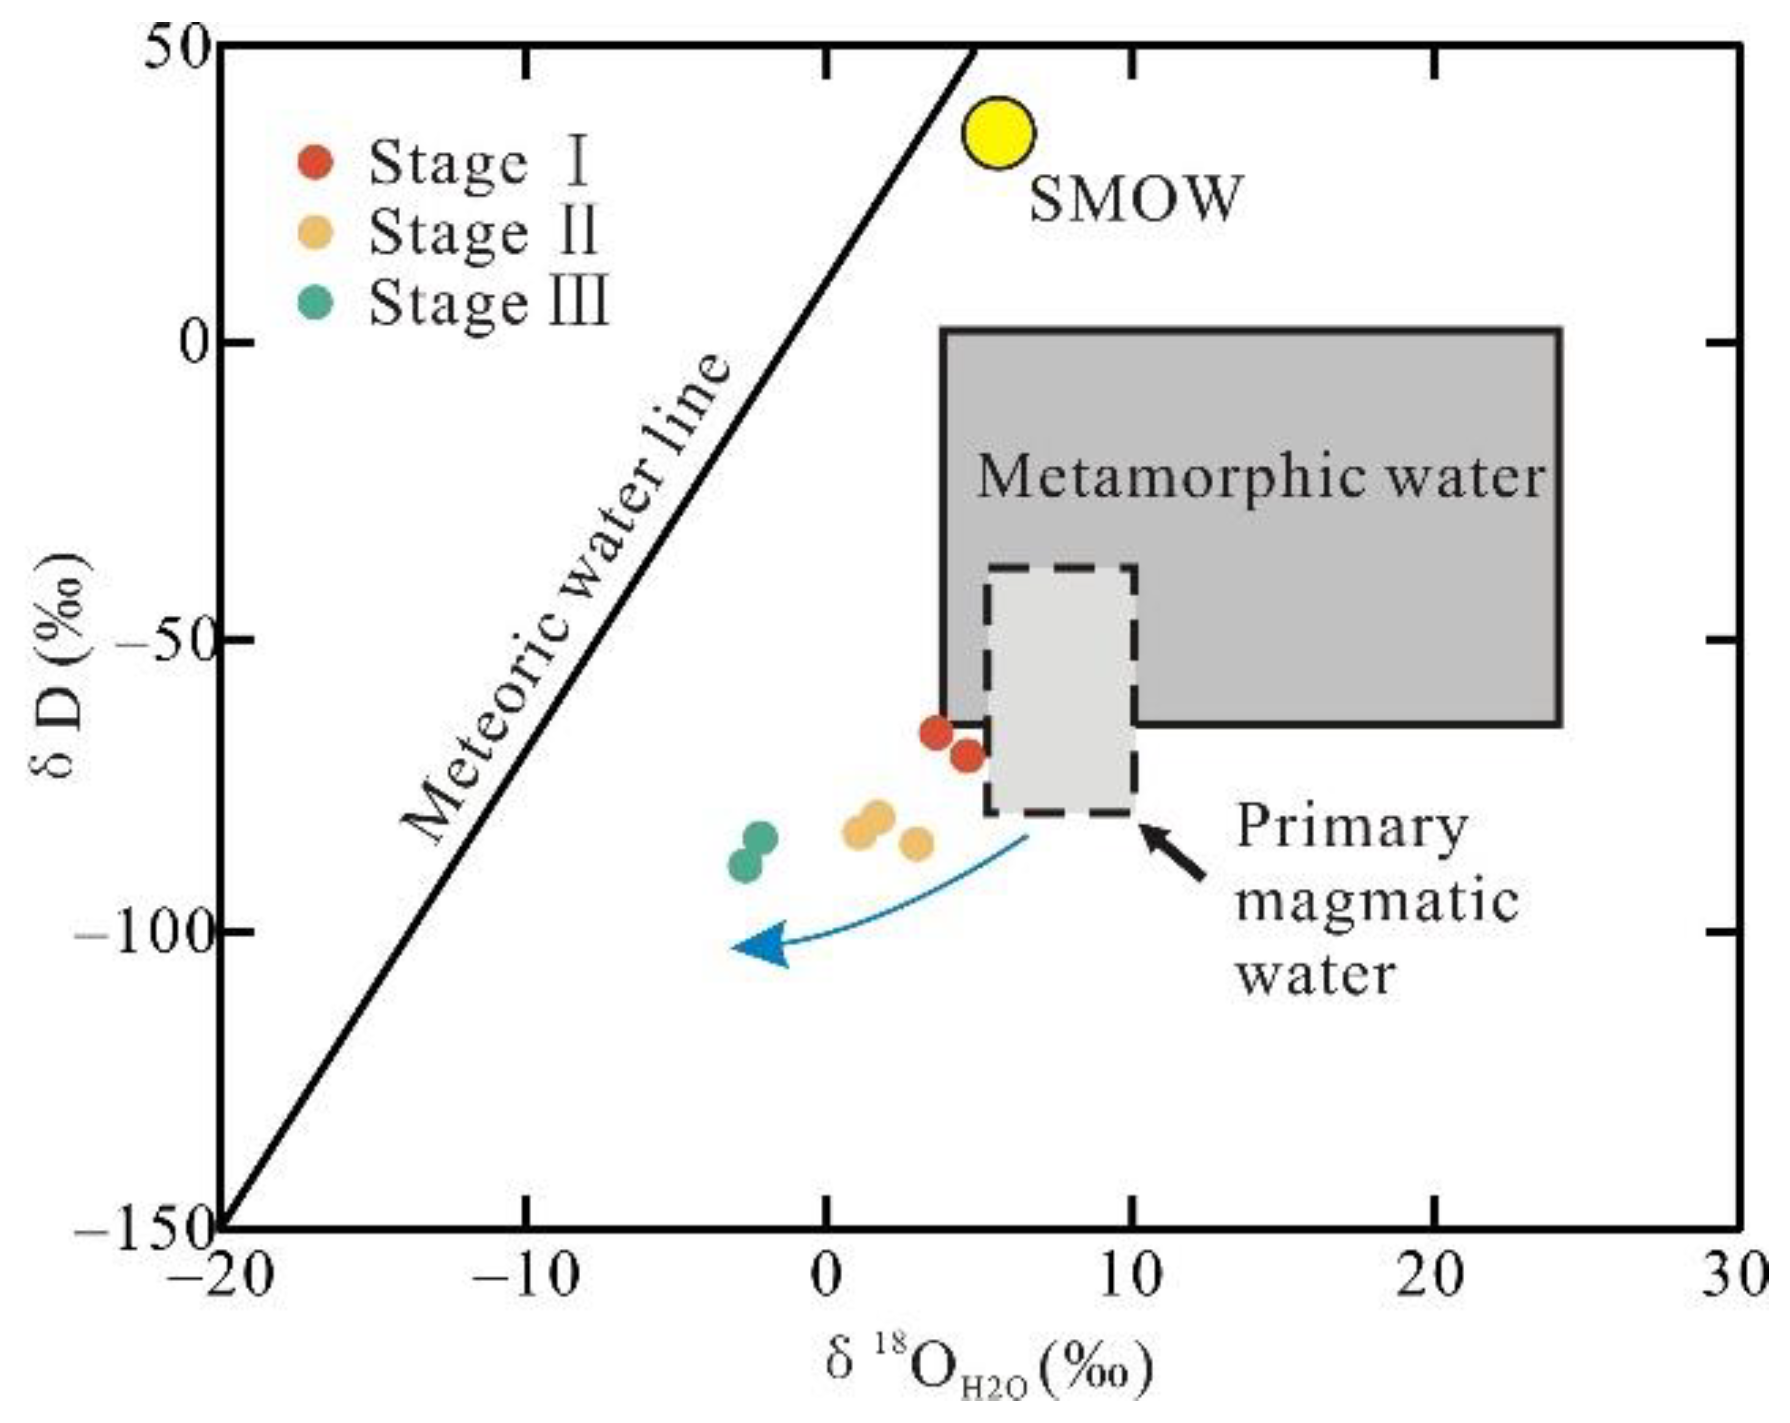
6.1.1. Ore-Forming Fluids
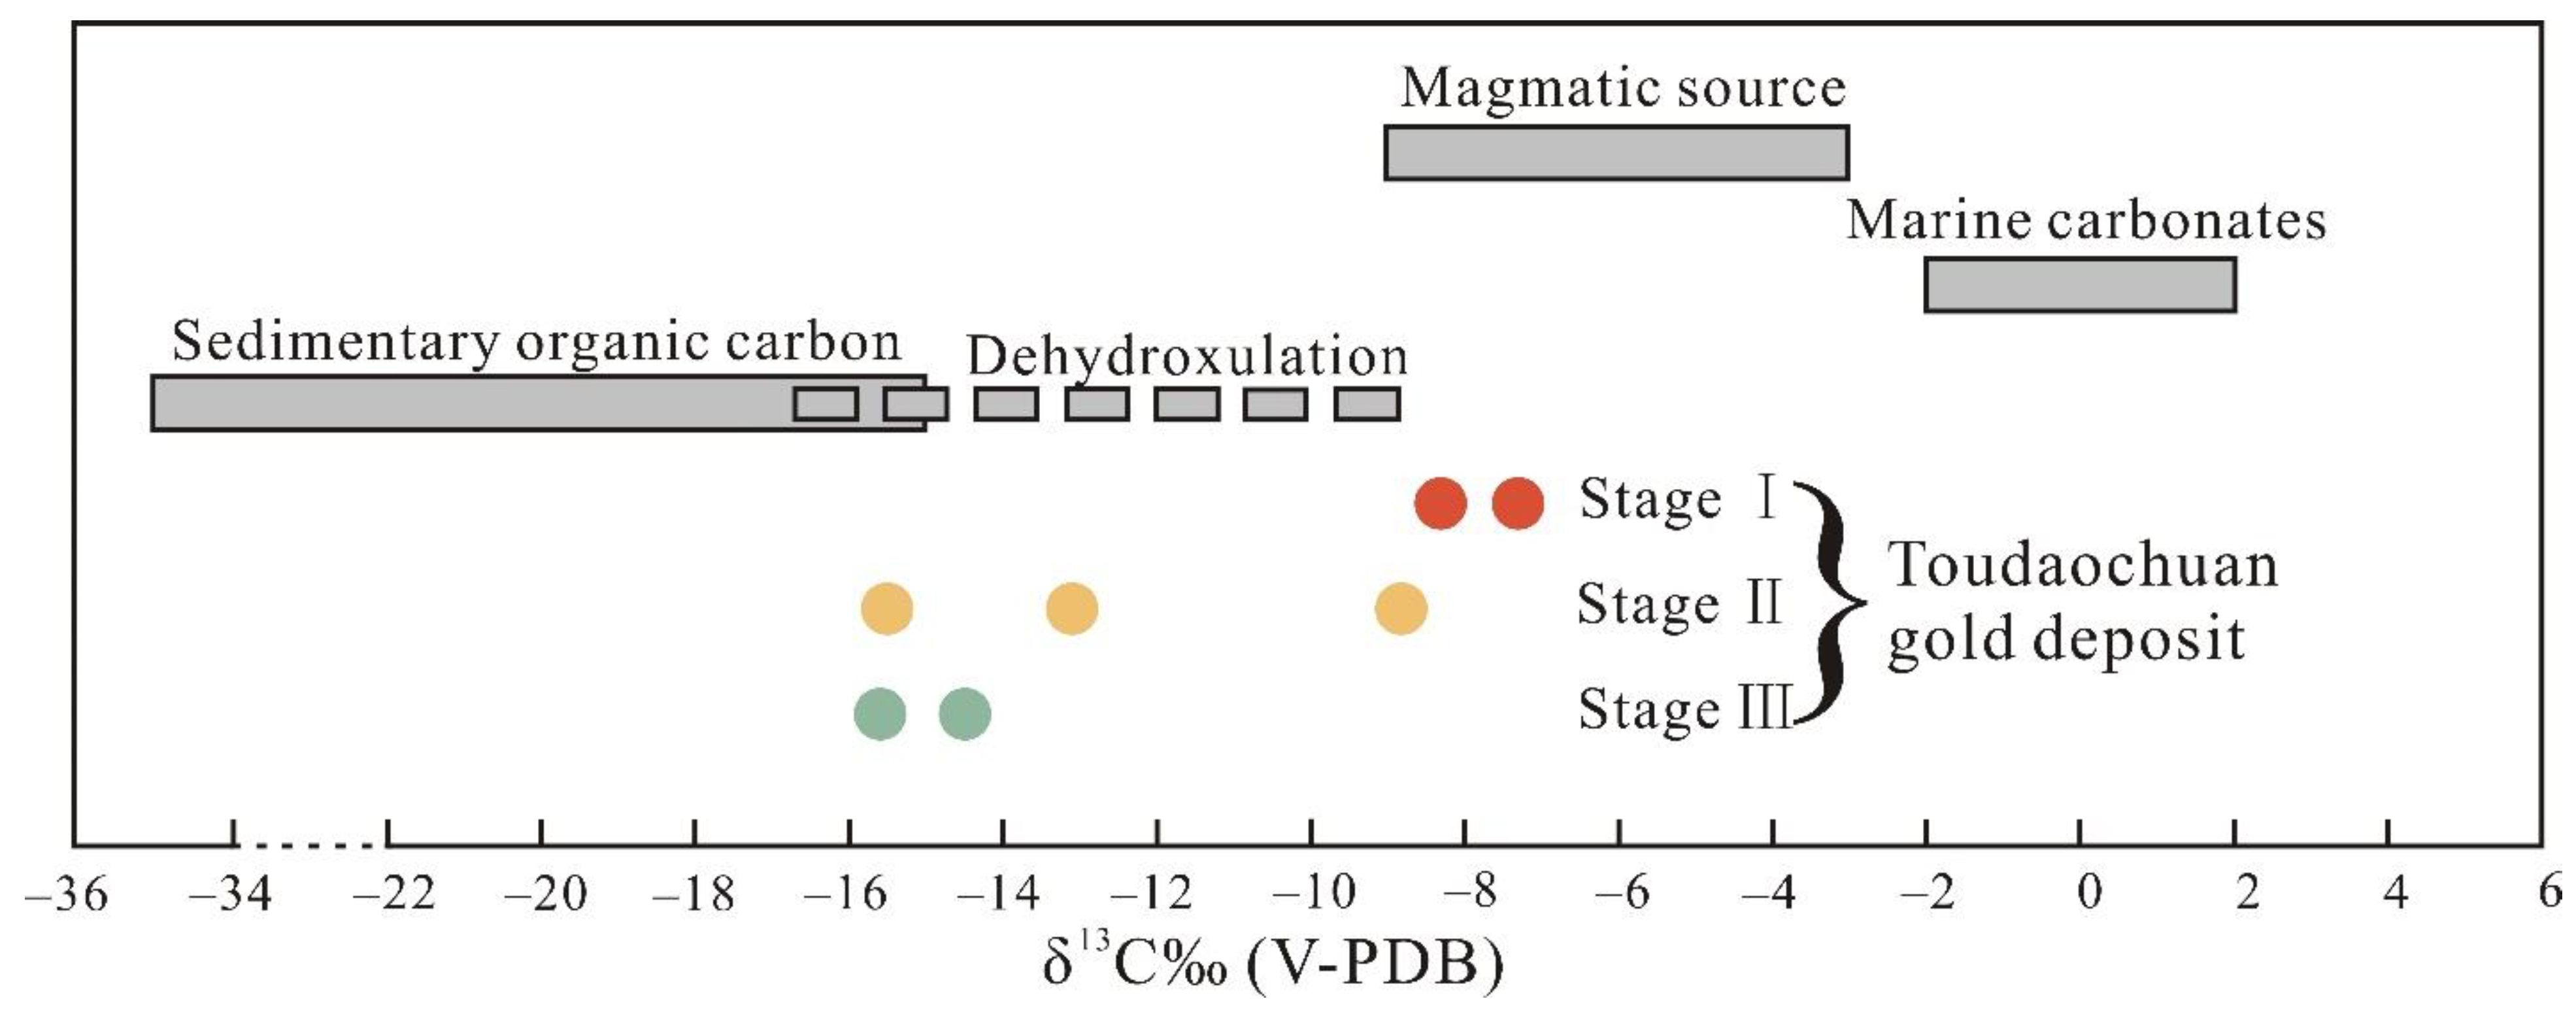
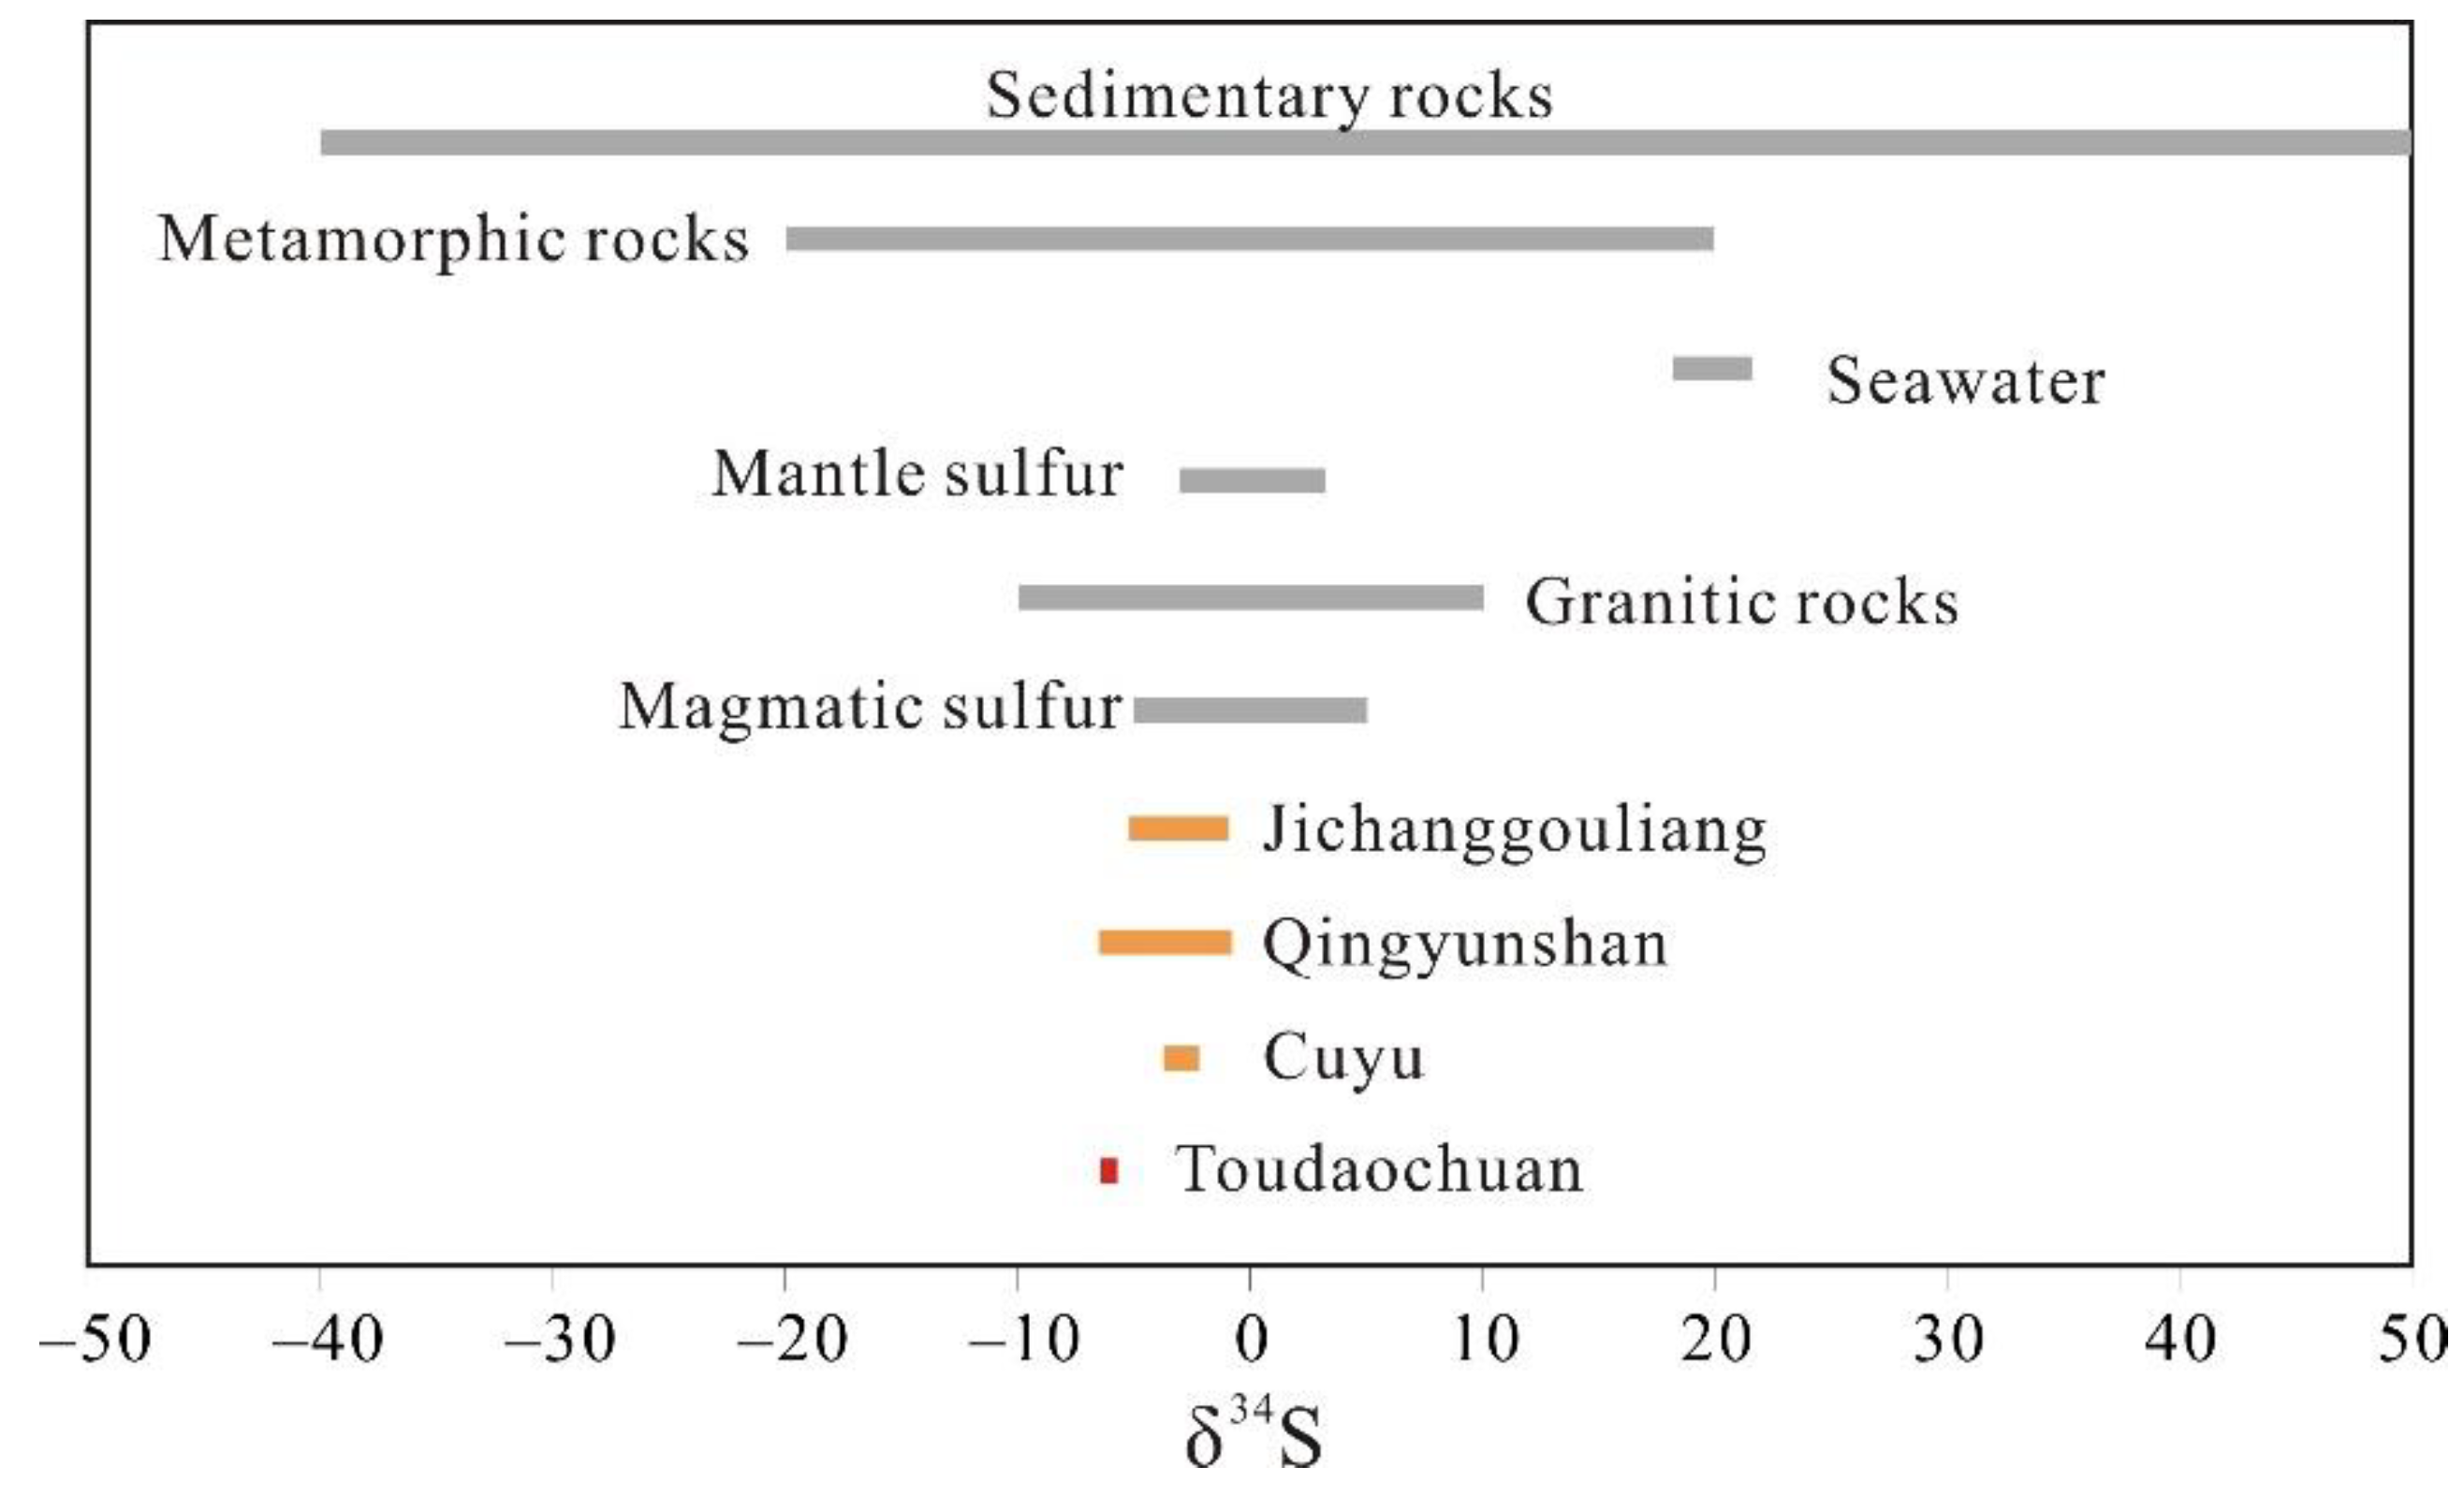
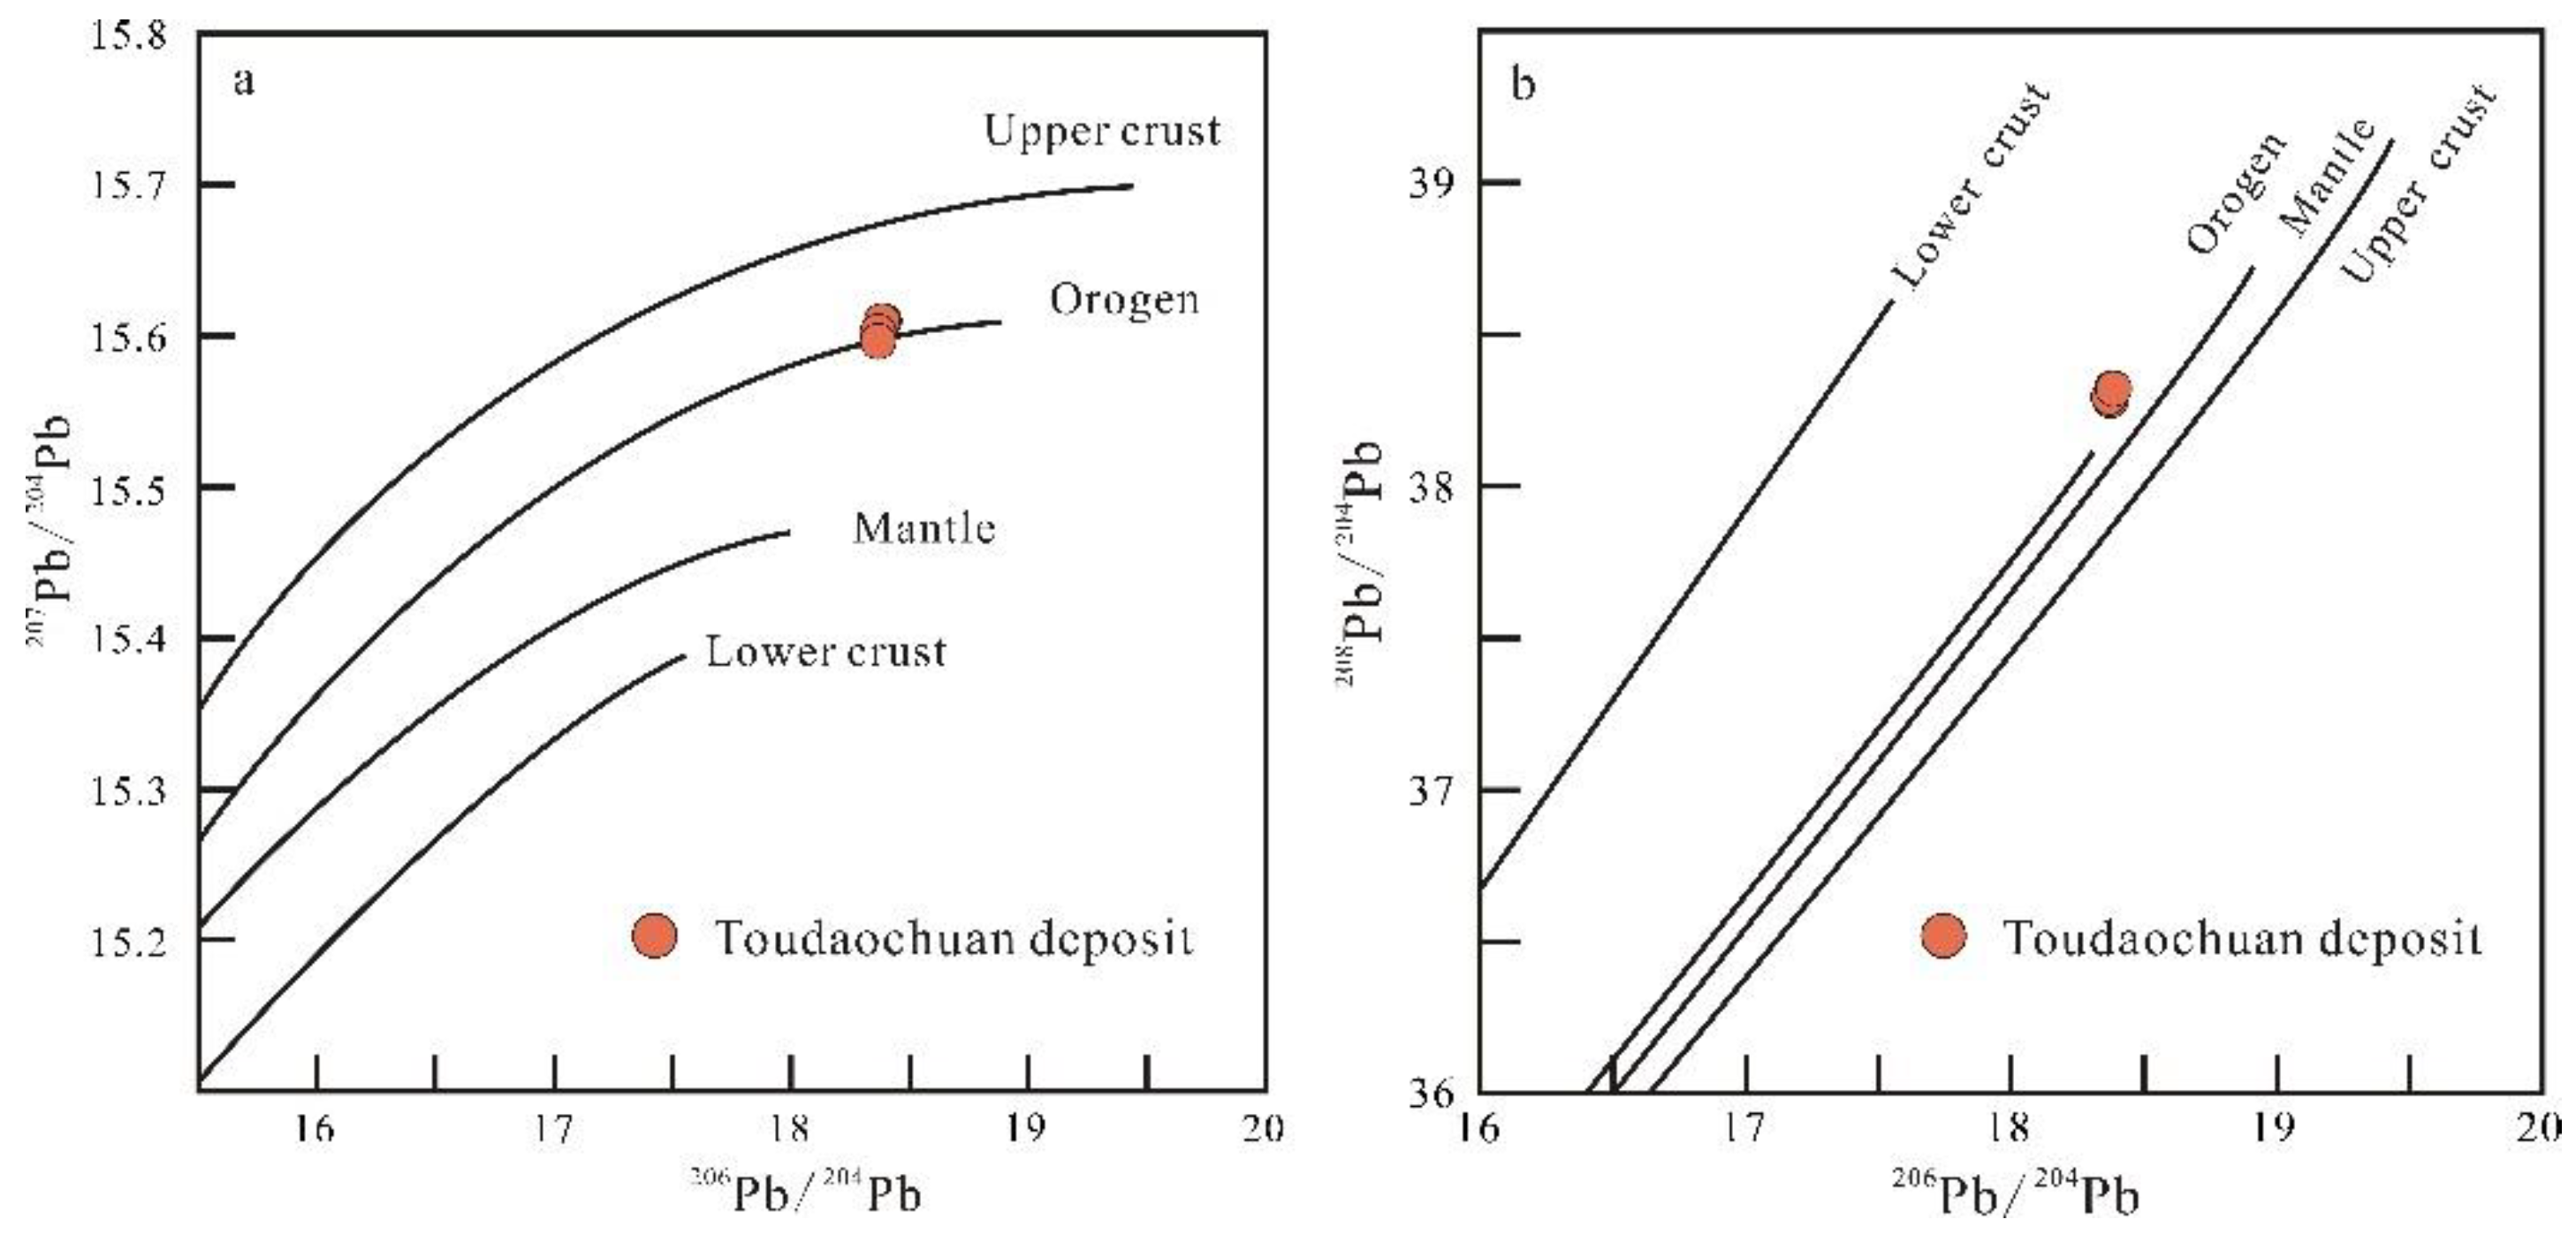
6.1.2. Ore-Forming Materials
6.2. Fluids Evolution and Gold Precipitation Mechanism
6.3. Genetic Type and Ore-Forming Process
7. Conclusions
Author Contributions
Funding
Data Availability Statement
Acknowledgments
Conflicts of Interest
References
- Zhou, L.L.; Zeng, Q.D.; Liu, J.M.; Friis, H.; Zhang, Z.L.; Duan, X.X. Ore genesis and fluid evolution of the Daheishan giant porphyry molybdenum deposit, NE China. J. Asian Earth Sci. 2015, 97, 486–505. [Google Scholar] [CrossRef]
- Wang, Z.G.; Wang, K.Y.; Wan, D.; Konare, Y.; Liang, Y.H. Metallogenic age and hydrothermal evolution of the Jidetun Mo deposit in central Jilin Province, northeast China: Evidence from fluid inclusions, isotope systematics, and geochronology. Ore Geol. Rev. 2017, 89, 731–751. [Google Scholar] [CrossRef]
- Lü, L.S.; Mao, J.W.; Li, H.B. Pyrrhotite Re-Os and SHRIMP zircon U-Pb dating of the Hongqiling Ni-Cu sulfide deposits in Northeast China. Ore Geol. Rev. 2011, 43, 106–119. [Google Scholar] [CrossRef]
- Han, C.M.; Xiao, W.J.; Zhao, G.C.; Su, B.X.; Ao, S.J.; Zhang, J.E.; Wan, B.; Wang, Z.M.; Ding, J.X.; Qu, W.J.; et al. Re-Os Isotopic Age of the Hongqiling Cu-Ni Sulfide Deposit in Jilin Province, NE China and its Geological Significance. Res. Geol. 2014, 64, 247–261. [Google Scholar] [CrossRef] [Green Version]
- Yang, Q.; Ren, Y.S.; Li, Y.; Hao, Y.J.; Li, J.M. Age and Tectonic Setting of Mesothermal Magmatic Hydrothermal Vein-Type Pb–Zn-(Ag) Mineralization in the Xiaohongshilazi Deposit, Central Jilin Province, Northeast China. Res. Geol. 2020, 70, 70–88. [Google Scholar] [CrossRef]
- Miao, L.C.; Qiu, Y.M.; Fan, W.M.; Zhang, F.Q.; Zhai, M.G. Geology, geochronology, and tectonic setting of the Jiapigou gold deposits, southern Jilin Province, China. Ore Geol. Rev. 2005, 26, 137–165. [Google Scholar] [CrossRef]
- Zhai, D.G.; Williams-Jones, A.E.; Liu, J.J.; Selby, D.; Li, C.; Huang, X.W.; Qi, L.; Cuo, D.H. Evaluating the Use of the Molybdenite Re-Os Chronometer in Dating Gold Mineralization: Evidence from the Haigou Deposit, Northeastern China. Econ. Geol. 2019, 114, 897–915. [Google Scholar] [CrossRef] [Green Version]
- Zeng, Q.D.; He, H.Y.; Zhu, R.X.; Zhang, S.; Wang, Y.B.; Su, F. Origin of ore-forming fluids of the Haigou gold deposit in the eastern Central Asian Orogenic belt, NE China: Constraints from H-O-He-Ar isotopes. J. Asian Earth Sci. 2017, 144, 384–397. [Google Scholar] [CrossRef]
- Li, L.; Sun, J.G.; Men, L.J.; Chai, P. Genesis of the Haigou gold deposit, Jilin Province, NE China: Evidence from fluid inclusions, 40Ar/39Ar geochronology and isotopes. Geol. J. 2017, 52, 992–1008. [Google Scholar] [CrossRef]
- Li, L.; Sun, J.G.; Men, L.J.; Chai, P. Origin and evolution of the ore-forming fluids of the Erdaogou and Xiaobeigou gold deposits, Jiapigou gold province, NE China. J. Asian Earth Sci. 2016, 129, 170–190. [Google Scholar] [CrossRef]
- Zeng, Q.D.; Wang, Z.C.; He, H.Y. Multiple isotope composition (S, Pb, H, O, He, and Ar) and genetic implications for gold deposits in the Jiapigou gold belt. Northeast China. Miner. Depos. 2014, 49, 145–164. [Google Scholar] [CrossRef]
- Wang, Z.H.; Song, Q.H.; Yu, C. Division of gold metallogenic zonation of Jilin Province. Jilin Geol. 2011, 4, 10–14, (In Chinese with English Abstract). [Google Scholar]
- Li, N.; Zhuang, Y.M.; Li, C.X. Formation structure and mineralization of Panshi Shizui-Guanma area, Jilin Province. Jilin Geol. 2012, 31, 15–16, 35, (In Chinese with English Abstract). [Google Scholar]
- Wang, S.D.; Chen, H.C. Some problems on searching for gold deposits in Jilin Province. Jilin Geol. 1988, 2, 115–123, 29. (In Chinese) [Google Scholar]
- Şengör, A.M.C.; Natal’in, B.A.; Burtman, V.S. Evolution of the Altaid tectonic collage and Palaeozoic crustal growth in Eurasia. Nature 1993, 364, 299–307. [Google Scholar] [CrossRef]
- Safonova, I.Y.; Santosh, M. Accretionary complexes in the Asia–Pacific region: Tracing archives of ocean plate stratigraphy and tracking mantle plumes. Gondwana Res. 2014, 25, 126–158. [Google Scholar] [CrossRef]
- Wu, F.Y.; Sun, D.Y.; Ge, W.C.; Zhang, Y.B.; Grant, M.L.; Wilde, S.A.; Jahn, B.M. Geochronology of the Phanerozoic granites in northeastern China. J. Asian Earth Sci. 2011, 41, 1–30. [Google Scholar] [CrossRef] [Green Version]
- Wu, F.Y.; Zhao, G.C.; Sun, D.Y.; Wilded, S.A.; Yang, J.H. The Hulan Group: Its role in the evolution of the Central Asian Orogenic Belt of NE China. J. Asian Earth Sci. 2007, 30, 542–556. [Google Scholar] [CrossRef]
- Yang, Q.; Ren, Y.S.; Huizenga, J.M.; Li, J.M.; Wang, E.D.; Wang, X.; Wang, B. Geological significance of Early Triassic porphyry Cu mineralization in the eastern Xar Moron–Changchun Metallogenic Belt, northeast China: A case study of the newly-discovered Guokuidingzi Cu deposit. Ore Geol. Rev. 2021, 133, 104092. [Google Scholar] [CrossRef]
- JBGMR (Jilin Bureau of Geology and Mineral Resources). Lithostratigraphy of Jilin Province; China University of Geoscience Press: Wuhan, China, 1997; pp. 1–324. (In Chinese)
- Kröner, A.; Compston, W.; Zhang, G.W.; Guo, A.L.; Todt, W. Age and tectonic setting of Late Archean greenstone–gneiss terrain in Henan Province, China, as revealed by single-grain zircon dating. Geology 1988, 16, 211–215. [Google Scholar] [CrossRef]
- Zhao, G.C.; Wilde, S.A.; Cawood, P.A.; Sun, M. Archean blocks and their boundaries in the North China Craton: Lithological, geochemical, structural and P-T path constraints and tectonic evolution. Precambrian Res. 2001, 107, 45–73. [Google Scholar] [CrossRef]
- Zhai, M.G.; Santosh, M. The early Precambrian odyssey of the North China Craton: A synoptic overview. Gondwana Res. 2011, 20, 6–25. [Google Scholar] [CrossRef]
- Zhai, M.G.; Santosh, M. Metallogeny of the North China Craton: Link with secular changes in the evolving Earth. Gondwana Res. 2013, 24, 275–297. [Google Scholar] [CrossRef]
- Zhu, R.X.; Yang, J.H.; Wu, F.Y. Timing of destruction of the North China Craton. Lithos 2012, 149, 51–60. [Google Scholar] [CrossRef]
- Zhu, R.X.; Zhang, H.F.; Zhu, G.; Meng, Q.R.; Fan, H.R.; Yang, J.H.; Wu, F.Y.; Zhang, Z.Y.; Zheng, T.Y. Craton destruction and related resources. Int. J. Earth Sci. 2017, 106, 2233–2257. [Google Scholar] [CrossRef]
- Yang, J.H.; Wu, F.Y.; Wilde, S.A. A review of the geodynamic setting of large-scale Late Mesozoic gold mineralization in the North China Craton: An association with lithospheric thinning. Ore Geol. Rev. 2003, 23, 125–152. [Google Scholar] [CrossRef]
- Zhang, S.H.; Zhao, Y.; Song, B.; Hu, J.M.; Liu, S.W.; Yang, Y.H.; Chen, F.K.; Liu, X.M.; Liu, J. Contrasting Late Carboniferous and Late Permian–Middle Triassic intrusive suites from the northern margin of the North China craton: Geochronology, petrogenesis, and tectonic implications. Geol. Soc. Am. Mem. 2009, 121, 181–200. [Google Scholar] [CrossRef]
- Zhang, X.H.; Yuan, L.L.; Xue, F.H.; Zhang, Y.B. Contrasting Triassic ferroan granitoids from northwestern Liaoning, North China: Magmatic monitor of Mesozoic decratonization and a craton–orogen boundary. Lithos 2012, 144, 12–23. [Google Scholar] [CrossRef]
- Wu, F.Y.; Sun, D.Y.; Li, H.M.; Jahn, B.M.; Wilde, S.A. A-type granites in northeastern China: Age and geochemical constraints on their petrogenesis. Chem. Geol. 2002, 187, 143–173. [Google Scholar] [CrossRef]
- Liu, S.; Hu, R.Z.; Gao, S.; Feng, C.X.; Feng, G.Y.; Coulson, I.M.; Li, C.; Wang, T.; Qi, Y.Q. Zircon U-Pb age and Sr–Nd–Hf isotope geochemistry of Permian granodiorite and associated gabbro in the Songliao Block, NE China and implications for growth of juvenile crust. Lithos 2010, 114, 423–436. [Google Scholar] [CrossRef]
- Xu, W.L.; Wang, F.; Pei, F.P.; Meng, E.; Tang, J.; Xu, M.J.; Wang, W. Mesozoic tectonic regimes and regional ore-forming background in NE China: Constraints from spatial and temporal variations of Mesozoic volcanic rock associations. Acta Petrol. Sin. 2013, 29, 339–353, (In Chinese with English Abstract). [Google Scholar]
- Eizenhöfer, P.R.; Zhao, G.C.; Zhang, J.; Sun, M. Timing of final closure of the PaleoAsian Ocean along the Solonker Suture Zone: Constraints from the provenance analysis of detrital zircons from Permian sedimentary rocks. Tectonics 2014, 33, 441–463. [Google Scholar] [CrossRef] [Green Version]
- Zhou, J.B.; Li, L. The Mesozoic accretionary complex in Northeast China: Evidence for the accretion history of Paleo-Pacific subduction. J. Asian Earth Sci. 2017, 145, 91–100. [Google Scholar] [CrossRef]
- Zhou, J.B.; Wilde, S.A. The crustal accretion history and tectonic evolution of the NE China segment of the Central Asian Orogenic Belt. Gondwana Res. 2013, 23, 1365–1377. [Google Scholar] [CrossRef]
- Ge, X.H. Geotectonics and tectonic evolution of eastern Jilin Province. Geoscience 1990, 1, 107–113, (In Chinese with English abstract). [Google Scholar]
- Zhao, C.J.; Peng, Y.J.; Dang, Z.X. Tectonic Framework and Crust Evolution of Eastern Jilin and Shenyang; Liaoning University Press: Jinzhou, China, 1996. (In Chinese) [Google Scholar]
- Gao, N.N.; Fan, X.X.; Shan, X.L. Tectonic evolution history of Yongji basin in Central Jilin. Gansu Sci. Technol. 2019, 35, 28–31. (In Chinese) [Google Scholar]
- Yang, Q. Late Paleozoic to Early Mesozoic Copper-Gold Polymetallic Metallogeny and Metallogenic Regularity in Central Jilin Province, Northeast China. Ph.D. Thesis, Jilin University, Changchun, China, 2020. (In Chinese with English Abstract). [Google Scholar]
- Sun, D.Y.; Wu, F.Y.; Zhang, Y.B.; Gao, S. The final closing time of the west Lamulun River–Changchun–Yanji plate suture zone—Evidence from the Dayushan granitic pluton, Jilin Province. J. Jilin Univ. (Earth Sci. Ed.) 2004, 34, 174–181, (In Chinese with English Abstract). [Google Scholar]
- Cao, H.H. Geochronology and Geochemistry of the Late Paleozoic–Early Mesozoic Igneous Rocks in the Eastern Segment of the Northern Margin of the North China Block. Ph.D. Thesis, Jilin University, Changchun, China, 2013. (In Chinese with English Abstract). [Google Scholar]
- Cao, H.H.; Xu, W.L.; Pei, F.P.; Wang, Z.W.; Wang, F.; Wang, Z.J. Zircon U-Pb geochronology and petrogenesis of the Late Paleozoic-Early Mesozoic intrusive rocks in the eastern segment of the northern margin of the North China Block. Lithos 2013, 170–171, 191–207. [Google Scholar] [CrossRef]
- Zhang, H.H.; Wang, F.; Xu, W.L.; Cao, H.H.; Pei, F.P. Petrogenesis of Early–Middle Jurassic intrusive rocks in northern Liaoning and central Jilin provinces, northeast China: Implications for the extent of spatial–temporal overprinting of the Mongol–Okhotsk and Paleo-Pacific tectonic regimes. Lithos 2016, 256, 132–147. [Google Scholar] [CrossRef]
- JBGMR (Jilin Bureau of Geology and Mineral Resources). General Survey and Evaluation Report on Toudaochuan Gold Deposit and its Periphery in Yongji County, Jilin Province; JBGMR: Jilin, China, 1983. (In Chinese)
- Clayton, R.N.; Mayeda, T.K. The use of bromine pentafluoride in the extraction of oxygen from oxides and silicates for isotopic analysis. Geochim. Cosmochim. Acta 1963, 27, 43–52. [Google Scholar] [CrossRef]
- Clayton, R.N.; O’Neil, J.R.; Mayeda, T.K. Oxygen isotope exchange between quartz and water. Geophys. Res. Lett. 1972, 77, 3057–3067. [Google Scholar] [CrossRef]
- Lu, Y.F. GeoKit—A geochemical toolkit for Microsoft Excel. Geochimica 2004, 5, 459–464, (In Chinese with English Abstract). [Google Scholar]
- Roedder, E. Fluid inclusions. Rev. Miner. 1984, 12, 1–644. [Google Scholar]
- Lu, H.Z.; Fan, H.R.; Ni, P.; Qu, G.X.; Shen, K.; Zhang, W.H. Fluid Inclusion; Science Press: Beijing, China, 2004; pp. 193–200. (In Chinese) [Google Scholar]
- Taylor, H.P. The application of oxygen and hydrogen isotope studies to problems of hydrothermal alteration and ore deposition. Econ. Geol. 1974, 69, 843–883. [Google Scholar] [CrossRef]
- Niu, P.P.; Jiang, S.Y. Fluid inclusion and stable isotope (C-H-O-S) constraints on the genesis of the Heilongtan-Xiejiagou Au deposit, northern Hubei, China. Ore Geol. Rev. 2022, 144, 104841. [Google Scholar] [CrossRef]
- Zhang, X.T.; Sun, J.G.; Han, J.L.; Feng, Y.Y. Genesis and ore-forming process of the Benqu mesothermal gold deposit in the Jiapigou ore cluster, NE China: Constraints from geology, geochronology, fluid inclusions, and whole-rock and isotope geochemistry. Ore Geol. Rev. 2021, 130, 103956. [Google Scholar] [CrossRef]
- Hoefs, J. Stable Isotope Geochemistry, 2nd ed.; Springer: Berlin/Heidelberg, Germany, 1980; pp. 1–208. [Google Scholar]
- Zartman, R.E.; Doe, B.R. Plumbotectonics-the model. Tectonophysics 1981, 75, 135–162. [Google Scholar] [CrossRef]
- Pirajno, F. Hydrothermal Processes and Mineral Systems; Springer: Berlin/Heidelberg, Germany, 2009; pp. 535–580. [Google Scholar]
- Hoefs, J. Stable Isotope Geochemistry, 7th ed.; Springer International Publishing: Cham, Switzerland, 2015. [Google Scholar]
- Ohmoto, H. Stable isotope geochemistry of ore deposits. Rev. Mineral. Geochem. 1986, 16, 491–559. [Google Scholar]
- Sheppard, S.M.F. Characterization and isotopic variations in natural waters. Rev. Mineral. Geochem. 1986, 16, 165–183. [Google Scholar]
- Han, J.L.; Sun, J.G.; Liu, Y.; Zhang, X.T.; He, Y.P.; Yang, F.; Chu, X.L.; Wang, L.L.; Wang, S.; Zhang, X.W.; et al. Genesis and age of the Toudaoliuhe breccia-type gold deposit in the Jiapigou mining district of Jilin Province, China: Constraints from fluid inclusions, H-O–S–Pb isotopes, and sulfide Rb–Sr dating. Ore Geol. Rev. 2020, 118, 103356. [Google Scholar] [CrossRef]
- Hoefs, J. Stable Isotope Geochemistry, 4th ed.; Springer: Berlin/Heidelberg, Germany, 1997; p. 201. [Google Scholar]
- Faure, G. Principles of Isotope Geology; John Wiley and Sons Inc.: New York, NY, USA, 1986. [Google Scholar]
- Rye, R.O.; Ohmoto, H. Sulfur and carbon isotopes and ore genesis: A review. Econ. Geol. 1974, 69, 826–842. [Google Scholar] [CrossRef]
- Ohmoto, H.; Goldhaber, M.B. Sulfur and carbon Isotopes. In Geochemistry of Hydrothermal Ore Deposits, 3rd ed.; Barnes, H.L., Ed.; John Wiley: New York, NY, USA, 1997; pp. 517–611. [Google Scholar]
- Ohmoto, H. Systematics of sulfur and carbon isotopes in hydrothermal ore deposits. Econ. Geol. 1972, 67, 551–578. [Google Scholar] [CrossRef]
- Kelly, W.C.; Rye, R.O. Geologic fluid inclusion and stable isotope studies of the tin-tungsten deposits of Panasqueira. Portual. Econ. Geol. 1979, 74, 1721–1822. [Google Scholar] [CrossRef]
- Ohmoto, H.; Rye, R.O. Isotopes of sulfur and carbon. In Geochemistry of Hydrothermal Ore Deposit; Barnes, H.L., Ed.; Wiley: New York, NY, USA, 1979; pp. 509–567. [Google Scholar]
- Ripley, E.M. Origin and concentration mechanisms of copper and nickel in Duluth Complex sulfide zones, a dilemma. Econ. Geol. 1986, 81, 974–978. [Google Scholar] [CrossRef]
- Xiao, F.; Fan, F.P.; Xing, G.F.; Jiang, S.Y. Ore genesis of Qingyunshan Cu-Au deposit in the Dehua-Youxi area of Fujian Province, southeastern China: Constraints from U-Pb and Re-Os geochronology, fluid inclusions, and H-O-S-Pb isotope data. Ore Geol. Rev. 2021, 132, 104006. [Google Scholar] [CrossRef]
- Liu, L.; Gu, X.X.; Zhang, Y.M.; Ouyang, X.; Wang, L.Z.; Gao, L.Y. Genesis of the Jinchanggouliang gold deposit, Chifeng, China: Constraints from Fluid inclusions and isotopic geochemistry. Ore Geol. Rev. 2019, 115, 103180. [Google Scholar] [CrossRef]
- Doe, B.R.; Zartman, R.E. Plumbotectonics, the Phanerozoic. In Geochemistry of Hydrothermal Ore Deposit; Barnes, H.L., Ed.; Wiley: New York, NY, USA, 1979; pp. 22–70. [Google Scholar]
- Lu, H.Z. Fluids immiscibility and fluids inclusions. Acta Petrol. Sin. 2011, 27, 1253–1261. [Google Scholar]
- Pirajno, F.; Ernst, R.E.; Borisenko, A.S.; Fedoseev, G.; Naumov, E.A. Intraplate magmatism in Central Asia and China and associated metallogeny. Ore Geol. Rev. 2009, 35, 114–136. [Google Scholar] [CrossRef]
- Stefánsson, A.; Seward, T.M. Gold(I) complexing in aqueous sulphide solutions to 500 °C at 500 bar. Geochim. Cosmochim. Acta 2004, 68, 4121–4143. [Google Scholar] [CrossRef]
- Williams-Jones, A.E.; Bowell, R.J.; Migdisov, A.A. Gold in solution. Elements 2009, 5, 281–287. [Google Scholar] [CrossRef]
- Benning, L.G.; Seward, T.M. Hydrosulfide complexing of Au (I) in hydrothermal solutions from 150 to 400 °C and 500–1500 bar. Geochim. Cosmochim. Acta 1996, 60, 1849–1871. [Google Scholar] [CrossRef]
- Phillips, G.N.; Evans, K.A. Role of CO2 in the formation of gold deposits. Nature 2004, 429, 860–863. [Google Scholar] [CrossRef] [PubMed]
- Cole, D.R.; Drummond, S.E. The effect of transport and boiling on Ag/Au ratios in hydrothermal solutions: A preliminary assessment and possible implications for the formation of epithermal precious-metal ore deposits. J. Geochem. Explor. 1986, 25, 45–79. [Google Scholar] [CrossRef]
- Spycher, N.F.; Reed, M.H. Evolution of a broadlands-type epithermal ore fluid along alternative PT paths; implications for the transport and deposition of base, precious, and volatile metals. Econ. Geol. 1989, 84, 328–359. [Google Scholar] [CrossRef]
- Lowenstern, J.B. Carbon dioxide in magmas and implications for hydrothermal systems. Miner. Depos. 2001, 36, 490–502. [Google Scholar] [CrossRef]
- Hagemann, S.G.; Lüders, V. PTX conditions of hydrothermal fluids and precipitation mechanism of stibnite-gold mineralization at the Wiluna lode-gold deposits, Western Australia: Conventional and infrared microthermometric constraints. Miner. Depos. 2003, 38, 936–952. [Google Scholar] [CrossRef]
- Heinrich, C.A. Fluid-fluid interactions in magmatic-hydrothermal ore formation. Rev. Mineral. Geochem. 2007, 65, 363–387. [Google Scholar] [CrossRef]
- Wagner, T.; Mlynarczyk, M.S.J.; Williams-Jones, A.E.; Boyce, A.J. Stable isotope constraints on ore formation at the San Rafael tin–copper deposit, southeast Peru. Econ. Geol. 2009, 104, 223–248. [Google Scholar] [CrossRef]
- Thompson, J.F.H.; Sillitoe, R.H.; Baker, T. Intrusion-related gold deposits associated with tungsten-tin provinces. Miner. Depos. 1999, 34, 323–334. [Google Scholar] [CrossRef]
- Lang, J.R.; Baker, T. Intrusion-related gold systems: The present level of understanding. Miner. Depos. 2001, 36, 477–489. [Google Scholar] [CrossRef]
- Yang, Q.; Ren, Y.S.; Hao, Y.J.; Wang, B.; Sun, Z.M.; Li, J.M. Ore fluid, geochronology and tectonic setting of mesothermal gold metallogeny in southeastern Jilin Province, Northeast China: A case study of the Shajingou gold deposit. Ore Geol. Rev. 2019, 109, 229–252. [Google Scholar] [CrossRef]
- Zhu, X.Q.; Wang, J.B.; Pang, Z.S.; Zhen, S.M.; Yang, F.; Xue, J.L.; Jia, H.X.; Shi, G.Y. Ore geology, fluid inclusion microthermometry and H-O-S isotopes of the Liyuan gold deposit, central Taihang Mountains, North China Craton. Minerals 2019, 9, 606. [Google Scholar] [CrossRef] [Green Version]
- Cepedal, A.; Fuertes-Fuente, M.; Martín-Izard, A.; García-Nieto, J.; Boiron, M.C. An intrusion-related gold deposit (IRGD) in the NW of Spain, the Linares deposit: Igneous rocks, veins and related alterations, ore features and fluids involved. J. Geochem. Explor. 2013, 124, 101–126. [Google Scholar] [CrossRef]
- Groves, D.I.; Goldfarb, R.J.; Gebre-Mariam, M.; Hagemann, S.G.; Robert, F. Orogenic gold deposits: A proposed classification in the context of their crustal distribution and relationship to other gold deposit types. Ore Geol. Rev. 1998, 13, 7–27. [Google Scholar] [CrossRef]
- Goldfarb, R.J.; Groves, D.I.; Cardoll, S. Orogenic Au and geologic time: A global synthesis. Ore Geol. Rev. 2001, 18, 1–75. [Google Scholar] [CrossRef]
- So, C.S.; Yun, S.T. Jurassic Mesothermal gold mineralization of the Samhwanghak Mine, Youngdong Area, Republic of Korea: Constraints on hydrothermal fluid geochemistry. Econ. Geol. 1997, 92, 60–80. [Google Scholar] [CrossRef]


| Stages | Samples | Type | Quantity | Tm-ice (°C) | Tm-CO2 (°C) | Tm-cla (°C) | Th-CO2 (°C) | Th-total (°C) | Salinity (%) |
|---|---|---|---|---|---|---|---|---|---|
| Stage I | quartz | L-type | 25 | −7.9–−3.2 | 212.6–322.8 | 5.2–11.6 | |||
| C1-type | 8 | −58.0–−56.8 | 4.1–6.5 | 25.6–29.8 | 235.0–335.8 | 6.6–10.4 | |||
| Stage II | quartz | L-type | 30 | −5.7–−1.2 | 195.7–282.0 | 2.1–8.8 | |||
| V-type | 5 | −5.3–−1.1 | 202.5–275.4 | 1.9–8.3 | |||||
| C1-type | 24 | −58.0–−57.0 | 6.0–9.1 | 26.7–30.0 | 210.0–298.5 | 1.8–7.5 | |||
| C2-type | 10 | −58.2–−56.9 | 6.1–9.4 | 26.8–30.0 | 212.5–286.2 | 1.2–7.3 | |||
| Stage III | quartz | L-type | 24 | −2.7–−0.3 | 154.0–229.4 | 0.5–4.5 |
| Stages | Sample Description | δ13CV-PDB (‰) | δ18OV-SMOW (‰) | δDV-SMOW (‰) | Th (°C) | δ18OH2O (‰) |
|---|---|---|---|---|---|---|
| Stage I | sulfide-poor quartz veins | −8.3 | 11.9 | −70.2 | 290 | 4.64 |
| −7.7 | 10.9 | −66.3 | 290 | 3.64 | ||
| Stage II | Au-bearing quartz veins | −13.1 | 12.7 | −84.7 | 235 | 3.00 |
| −15.5 | 11.4 | −80.8 | 235 | 1.70 | ||
| −8.8 | 10.8 | −83.4 | 235 | 1.10 | ||
| Stage III | Quartz veins | −15.6 | 10.2 | −84.3 | 190 | −2.17 |
| −14.5 | 9.7 | −89 | 190 | −2.67 |
| Sample Number | Sample Description | Samples | δ34S (‰) | 206Pb/204Pb | 207Pb/204Pb | 208Pb/204Pb |
|---|---|---|---|---|---|---|
| 8TDC-5-1 | massive ores | chalcopyrite | −6.3 | 18.370 | 15.574 | 38.295 |
| 8TDC-5-2 | chalcopyrite | −5.8 | 18.374 | 15.567 | 38.286 | |
| 8TDC-8-1 | chalcopyrite | −5.8 | 18.388 | 15.582 | 38.324 | |
| 8TDC-8-2 | chalcopyrite | −6.2 | 18.386 | 15.582 | 38.323 |
| Deposits | Ore-Hosting Rocks | Orebodies Shape | Ores Structures and Textures | Metal Mineral Assembles | Wall Rock Alterations | FIs Characteristics | Source of Ore-Forming Fluids | Source of Ore-Forming Materials | Ore Genesis | References |
|---|---|---|---|---|---|---|---|---|---|---|
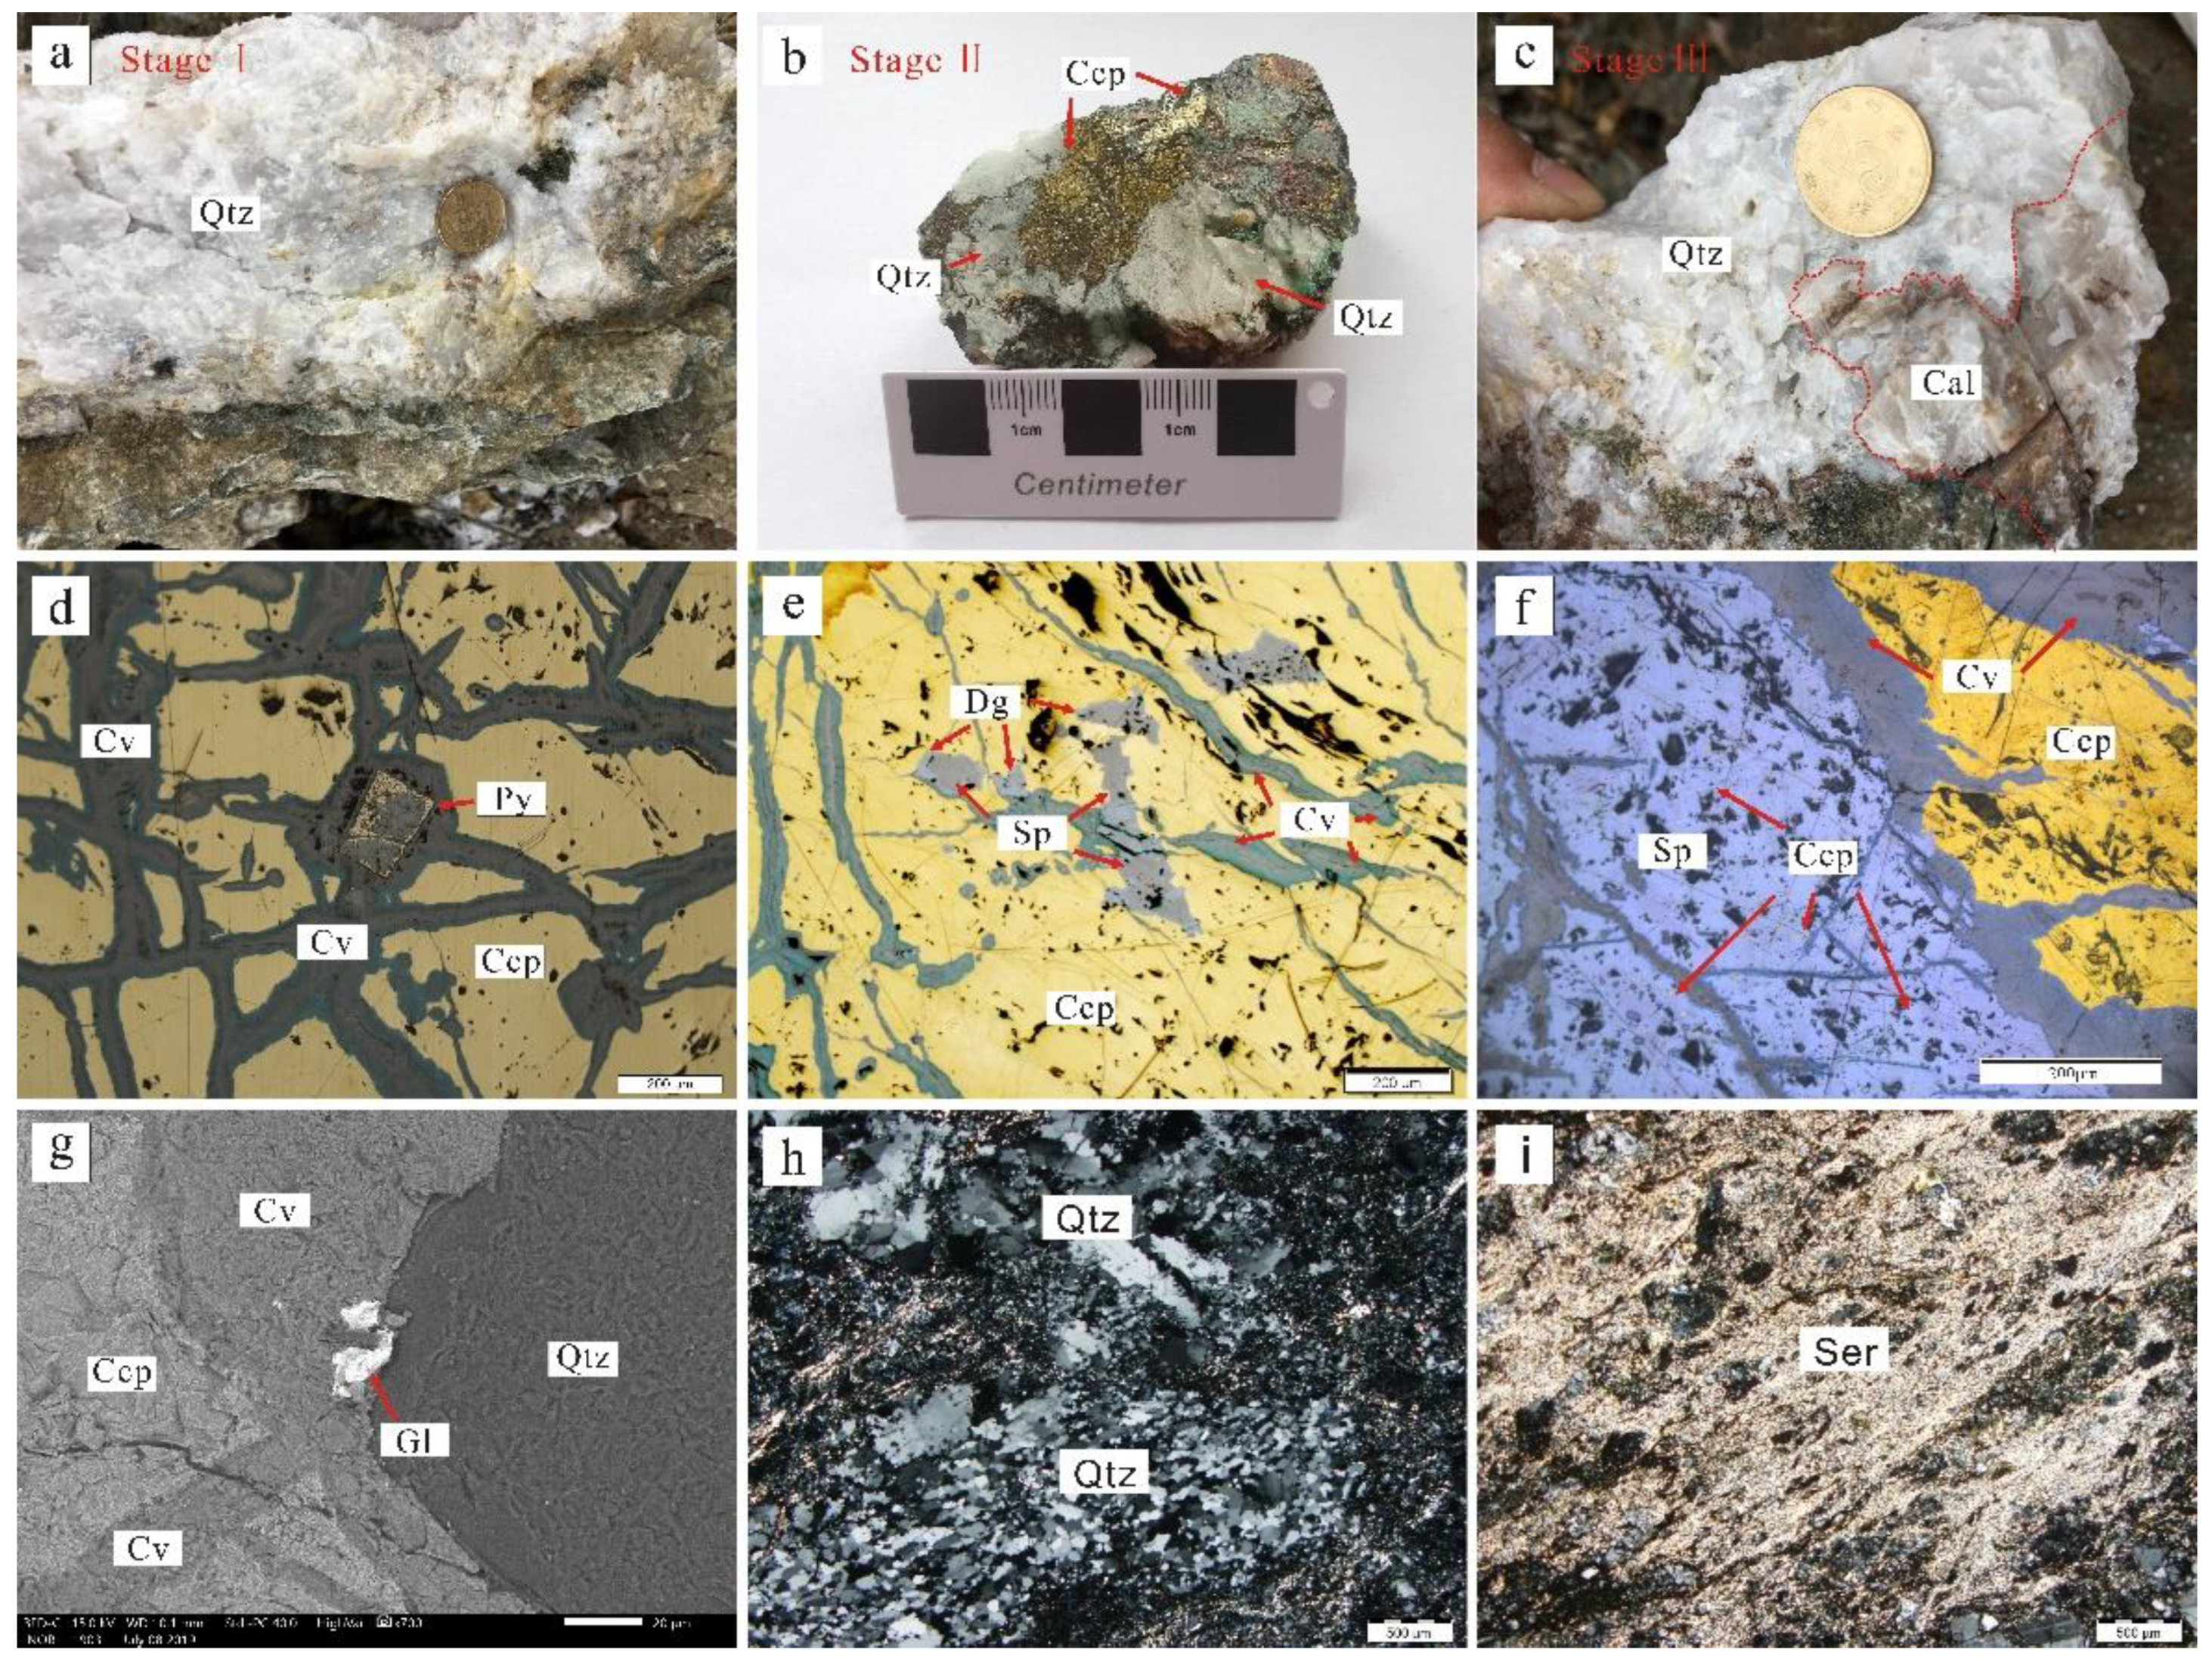
| Toudaochuan | Intermediate–basic volcanic rocks, metamorphosed tuff and tuffaceous slate and siltstone of Yufutun formation | Irregular veined, stockwork and lens shape | Massive, veinlet, and miarolitic structures; euhedral-subhedral–anhedral granular texture and metasomatic texture | chalcopyrite, pyrite, sphalerite, galena, hessite, petzite, and native gold | Silicification, chloritization, sericitization, carbonation | Liquid-rich aqueous, vapor-rich aqueous, CO2-rich and CO2-bearing FIs; medium–low temperature, medium–low salinity H2O-CO2-NaCl fluids | Magmatic water and mixing of the meteoric water | A mixed source of mantle and crust | Mesothermal magmatic–hydrothermal deposit | This paper |
| Shajingou | Middle Jurassic diorite | Veined | Disseminated, vein, veinlet, taxitic and nodular structures; euhedral–subhedral granular, cataclastic, and metasomatic textures | Pyrrhotite, chalcopyrite, pyrite, native gold | Silicification, chloritization and sericitization | Liquid-rich aqueous, CO2-pure, CO2-rich and CO2-bearing FIs; medium–high temperature, medium–low salinity H2O-CO2-NaCl fluids | Dominantly from magmatic fluid and mixed with meteoric water | - | Mesothermal magmatic–hydrothermal quartz-vein deposit | [85] |
| Jinchanggouliang | Xiaotazigou metamorphic rocks of the Archean Jianping Group, including biotite hornblende and plagioclase gneiss | Veined | Veinlet, banded, disseminated, brecciated and massive structures; metasomatic relict, anhedral granular, exsolution textures | Pyrite, chalcopyrite, galena, sphalerite, and native gold | Silicification, sericitization, pyritization, chloritization and carbonatization | halite-bearing inclusions, aqueous inclusions, and CO2-H2O inclusions; moderate–high temperature and great fluctuating salinity H2O-CO2-NaCl fluids | Magmatic water | derived from deep magma | Magmatic–hydrothermal deposit | [69] |
| Heilongtan-Xiejiagou (China) | Middle–low grade metamorphosed volcanic rocks of Wudang group and low-grade metamorphic rocks of Yaolinghe group | Bedded, lentoid, and veined | - | Sphalerite, chalcopyrite, pyrite, galena, tetrahedrite | Potassic feldspathization, silicification, sericitization, carbonation | Aqueous, CO2-pure and CO2-bearing FIs; medium–low temperature, medium–low salinity H2O-CO2-NaCl fluids | dominantly from magmatic fluid and mixed with meteoric water | Mixture of magma and surrounding metamorphic rocks | Magmatic–hydrothermal vein-type deposit | [51] |
| Samhwanghak (Korea) | Precambrian metamorphic rock and granodiorite batholith | Veins | Massive and ribbon structures | Sphalerite, pyrrhotite, chalcopyrite, pyrite, galena, tetrahedrite | Silicification, chloritization, sericitization, carbonation, kaolinization, illitization | CO2 (±CH4)-rich, aqueous FIs; Medium–high temperature, low salinity H2O-CO2-NaCl fluids | Magmatic water | Magmatic sulfur | Mesothermal magmatic–hydrothermal deposit | [90] |
Publisher’s Note: MDPI stays neutral with regard to jurisdictional claims in published maps and institutional affiliations. |
© 2022 by the authors. Licensee MDPI, Basel, Switzerland. This article is an open access article distributed under the terms and conditions of the Creative Commons Attribution (CC BY) license (https://creativecommons.org/licenses/by/4.0/).
Share and Cite
Li, J.; Ren, Y.; Yang, Q.; Sun, X. Ore Genesis of the Toudaochuan Gold Deposit in Central Jilin Province, NE China: Constraints from Fluid Inclusions and C–H–O–S–Pb Isotopes. Minerals 2022, 12, 964. https://doi.org/10.3390/min12080964
Li J, Ren Y, Yang Q, Sun X. Ore Genesis of the Toudaochuan Gold Deposit in Central Jilin Province, NE China: Constraints from Fluid Inclusions and C–H–O–S–Pb Isotopes. Minerals. 2022; 12(8):964. https://doi.org/10.3390/min12080964
Chicago/Turabian StyleLi, Jingmou, Yunsheng Ren, Qun Yang, and Xinhao Sun. 2022. "Ore Genesis of the Toudaochuan Gold Deposit in Central Jilin Province, NE China: Constraints from Fluid Inclusions and C–H–O–S–Pb Isotopes" Minerals 12, no. 8: 964. https://doi.org/10.3390/min12080964