Article

A 3D Predictive Method for Deep-Seated Gold Deposits in the Northwest Jiaodong Peninsula and Predicted Results of Main Metallogenic Belts

1
Shandong Provincial No. 6 Exploration Institute of Geology and Mineral Resources, Weihai 264209, China
2
College of Earth Sciences, Jilin University, Changchun 130061, China
3
Shandong Institute of Geophysical and Geochemical Exploration, Jinan 250013, China
4
College of Earth Sciences and Resources, China University of Geoscience, Beijing 100083, China
5
Shandong Gold Group Co., Ltd., Jinan 250014, China
*
Author to whom correspondence should be addressed.
Minerals 2022, 12(8), 935; https://doi.org/10.3390/min12080935
Submission received: 24 May 2022 / Revised: 19 July 2022 / Accepted: 21 July 2022 / Published: 25 July 2022
(This article belongs to the Special Issue 3D/4D Geological Modeling for Mineral Exploration)

Abstract

:
With the rapid depletion of mineral resources, deep prospecting is becoming a frontier field in international geological exploration. The prediction of deep mineral resources is the premise and foundation of deep prospecting. However, conventional metallogenic predictive methods, which are mainly based on surface geophysical, geochemical, and remote sensing data and geological information, are no longer suitable for deep metallogenic prediction due to the large burial depth of deep-seated deposits. Consequently, 3D metallogenic prediction becomes a critical method for delineating deep prospecting target areas. As a world-class giant gold metallogenic province, the Jiaodong Peninsula is at the forefront in China in terms of deep prospecting achievements and exploration depth. Therefore, it has unique conditions for 3D metallogenic prediction and plays an important exemplary role in promoting the development of global deep prospecting. This study briefly introduced the method, bases, and results of the 3D metallogenic prediction in the northwest Jiaodong Peninsula and then established 3D geological models of gold concentration areas in the northwest Jiaodong Peninsula using drilling combined with geophysics. Since gold deposits in the northwest Jiaodong Peninsula are often controlled by faulting in the 3D space, this study proposed a method for predicting deep prospecting target areas based on a stepped metallogenic model and a method for predicting the deep resource potential of gold deposits based on the shallow resources of ore-controlling faults. Multiple characteristic variables were extracted from the 3D geological models of the gold concentration areas, including the buffer zone and dip angle of faults, the changing rate of fault dip angle, and the equidistant distribution of orebodies. Using these characteristic variables, five deep prospecting target areas in the Jiaojia and Sanshandao faults were predicted. Moreover, based on the proven gold resources at an elevation of −2000 m and above, the total gold resources of the Sanshandao, Jiaojia, and Zhaoping ore-controlling faults at an elevation of −5000–−2000 m were predicted to be approximately 3377–6490 t of Au. Therefore, it is believed that the total gold resources in the Jiaodong Peninsula are expected to exceed 10,000 t. These new predicted results suggest that the northwest Jiaodong Peninsula has huge potential for the resources of deep gold deposits, laying the foundation for further deep prospecting.

1. Introduction

The supply of gold in China does not meet the present demand. In 2021, the gold production in China was 330 t, while the gold consumption was 1121 t. As the shallow-surface mineral resources in East China are increasingly low, deep prospecting has inevitably become a method for resolving the resource crisis. The prediction of deep mineral resources is the premise and foundation of deep prospecting. However, metallogenic prediction is a complex engineering task [1,2]. As relevant methods, technologies progress and geological understandings deepen, the predicted and prospecting results will change significantly. As the most important base of gold in China, the Jiaodong Peninsula has witnessed the complexity and uncertainty of metallogenic prediction in its prospecting and metallogenic prediction history. At the beginning of the 21st century, the gold resources in the northwest Jiaodong Peninsula were predicted to be 2492 t of Au in total, based on previous regional metallogenic predictions [3,4]. During 2007–2012, the gold resources at a depth of 0–2000 m in the Jiaodong Peninsula were predicted to be 3963 t of Au using the “three-in-one” prospecting prediction theory that integrates metallogenic geological bodies, metallogenic structural plane, and metallogenic characteristics [5]. At present, the accumulative proven gold resources in the Jiaodong Peninsula total more than 5000 t of Au [6], far exceeding previously predicted results. Since the Jiaodong Peninsula is a world-class giant gold metallogenic province, the scientific and accurate assessment of gold resource potential in this area plays an important exemplary role in promoting the development of deep prospecting.
Deep-seated gold orebodies are covered by rock layers with a thickness of more than 1000 m or even thousands of meters. The mineralization information is strongly suppressed, thus, metallogenic predictive methods based on surface geophysical, geochemical, remote-sensing data and geological information are ineffective. High-precision deep geophysical exploration (gravity, electromag, seismic) and 3D visualization analysis are effective for predicting and exploring deep resources [7,8,9,10,11]. Furthermore, 3D metallogenic prediction based on 3D geological modeling and fault ore-controlling law has achieved important research achievements in many areas of the world [12,13,14,15,16,17,18,19]. Based on the deep geophysical exploration and 3D modeling of gold concentration areas in the northwest Jiaodong Peninsula, this study proposed two new methods: a method for predicting deep prospecting target areas based on a stepped metallogenic model and a method for predicting the deep resource potential based on gold resources in shallow parts. Applying both methods, this study predicted the deep prospecting target areas and resource potential of major gold metallogenic belts in the northwest Jiaodong Peninsula, revealing an exciting deep prospecting prospect. This study lays the foundation for further deep prospecting in the Jiaodong Peninsula.

2. Geological Background and Overview of Gold Deposits

The Jiaodong Peninsula lies at the southeastern margin of the North China Craton and at the northeastern end of the Dabie-Sulu ultrahigh-pressure (UHP) metamorphic belt [20]. The Jiaobei terrane in the western Jiaodong Peninsula and the Weihai terrane in the eastern Jiaodong Peninsula fall in the North China Craton and the Sulu UHP metamorphic belt, respectively. Moreover, the Jiaolai Basin is superimposed on the Jiaobei terrane and the southern part of the Weihai terrane (Figure 1). The Jiaobei terrane mainly consists of Neoarchean granite-greenstone belts and Paleoproterozoic-Neoproterozoic metamorphic strata, the Weihai terrane is mainly composed of Neoproterozoic granitic gneiss bearing UHP eclogites, and the Jiaolai Basin mainly includes Cretaceous volcanic-sedimentary rock series [21,22,23,24]. Jurassic-Cretaceous granitic intrusive rocks are widely emplaced in the Jiaobei and Weihai terranes [25,26,27,28,29,30,31,32], whereas only a small number of Triassic granitoids are exposed in the Weihai terrane.
Faults are well-developed in the Jiaodong Peninsula. Among them, NE-NNE-trending faults with dip of SE or NW are the most developed. They are followed by nearly EW-NEE-trending faults. Additionally, EW-trending faults are sporadically exposed, showing poor continuity. The gold deposits in the Jiaodong Peninsula are mainly controlled by NE-NNE faults including the Sanshandao, Jiaojia, Zhaoping, Xilin-Douya, and Jinniushan faults [32,33,34,35].
There are more than 200 gold deposits with proven resources in the Jiaodong Peninsula (Figure 1), with gold resources greater than 5000 t [6]. The gold deposits in this peninsula are intensively distributed and are divided into three metallogenic sub-regions, namely Jiaoxibei (Laizhou-Zhaoyuan), Qipengfu (Qixia-Penglai-Fushan), and Muru (Muping-Rushan). These three regions consist of six metallogenic belts, namely Sanshandao, Jiaojia, Zhaoping, Qixia-Daliuhang, Taocun, and Muru. These metallogenic belts are composed of 13 gold orefields, namely Sanshandao, Jiaojia, Lingbei, Anshi, Dazhuangzi, Linglong, Dayingezhuang, Jiudian, Qixia, Daliuhang, Laishan, Pengjiakuang, and Denggezhuang. The gold mineralization in the Jiaodong Peninsula primarily include altered rock in fractured zones and quartz vein, followed by a small quantity of altered breccia, altered conglomerate, interlayer decollement-detachment zone, and pyrite-carbonate vein types. The characteristics, ore-controlling regularity and genesis of Jiaodong gold deposits have been studied extensively by predecessors [36,37,38,39,40,41]. The deep prospecting carried out in the peninsula since the beginning of this century has discovered more than 3000 t of proven gold resources at a depth of 600–2000 m, exceeding the previously proven gold resources at a depth of 500 m and less [6,42].

3. 3D Predictive Method of Deep-Seated Gold Deposits

3.1. 3D Modeling of Main Gold Concentration Areas in the Northwest Jiaodong Peninsula

This study established the geological models of the Sanshandao supergiant gold deposit in the Sanshandao fault zone, the Jiaojia supergiant gold deposit in the Jiaojia fault zone, and the Lingnan-Shuiwangzhuang and Dayingezhuang gold deposits in the Zhaoping fault zone.
The basic data used for modeling included regional geological data on scales of 1:50,000 and 1:10,000, exploration line sections, borehole histograms, digital elevation data, and high-precision geophysical profiles. The modeling parameters included the scale of planar geological maps of 1:10,000, the scale of exploration line sections of 1:2000, and the grid density in the horizontal direction of 60 m × 60 m. Meanwhile, the minimum thickness was set to be 0.1 m.
The 3D geological models of the Sanshandao, Jiaojia, Lingnan-Lijiazhuang, and Dayingezhuang gold deposits were established using data of 311, 500, 680, and 291 boreholes, respectively, as well as the basic data used for modeling. For example, Figure 2 shows the 3D geological model of the Sanshandao gold deposit (Figure 2a) and the superposition of gold orebodies on the plane of the Sanshandao fault (Figure 2b). Each of the 3D geological models was composed of two parts: the known model of the shallow part and the inferred model of the deep part. The former was controlled by systematic drilling engineering. As a known part, it was used to summarize metallogenic rules and extract favorable metallogenic information through spatial comprehensive analysis. The latter, which was constructed based on the former and relevant geophysical interpretation and inference, was used to provide intuitive attributes for deep metallogenic prediction.

3.2. Method for Predicting Deep Metallogenic Target Areas Based on a Stepped Metallogenic Model

3.2.1. Overview of Predictive Method

Breakthroughs have been made in deep prospecting in the Jiaodong Peninsula since the beginning of the 21st century, leading to the discovery of large-scale gold resources mainly at a depth of 700–2000 m. Based on the study of the characteristics and ore-hosting regularity of deep faults, Song MC et al. [41] proposed a stepped metallogenic model of deep-seated gold deposits. Specifically, ore-controlling faults show a stepped pattern due to alternate steep-gentle dip angles, and gold orebodies are mainly rich in stepped fault parts with gentle dip angles and the fault parts with a transition between steep-gentle dip angles. Given that it is difficult to capture the mineralization-related predictive information on the ground surface due to the large burial depth of deep-seated gold deposits, this study proposed a method based on the stepped metallogenic model according to the following three characteristics [43]. First, ore-controlling faults of gold deposits have large scales. Second, the hanging walls and footwalls of the faults are composed of Early Precambrian metamorphic rock series and Jurassic-Cretaceous granitoids, which greatly differ in physical properties. Third, the deep locations and morphological characteristics of faults can be detected using high-precision geophysical methods (gravity, electromag, seismic). This predictive method is designed to extract the predictive factors for identifying ore-controlling faults and the characteristics of metallogenic plane based on deep exploration and 3D geological modeling and to delineate the favorable ore-hosting locations of faults as prospecting target areas.
The 3D geological models of known gold concentration areas and their deep parts were divided into large numbers of 3D cubic blocks (120 m × 120 m × 10 m or 120 m × 120 m × 15 m). Each block was regarded as a homogeneous body with consistent properties, and thus the regularity of change in the properties of all blocks approximately reflected the regularity of internal change in geological bodies. Such cube blocks are called cell blocks. The storage address in a computer of each cell block corresponds to its location in the natural deposit. The prospecting target areas were determined as follows. Firstly, various quantitative information for deep prospecting assessment was comprehensively analyzed and processed according to the ore-controlling geological conditions of known deposits and the regularity of spatial (especially deep) change in prospecting indicators, and accordingly, 3D prospecting predictive models were established. Subsequently, the quantitative information described in Section 3.2.2. was assigned to each cell block, i.e., each favorable indicator is coded. Once the coding of the many prospective indicators is finished, a global favorable indicator is computed by combining the favorable coded indicator on each cell. Finally, the areas with higher prospective global scores were identified as prospecting target areas.

3.2.2. Main Predictive Bases

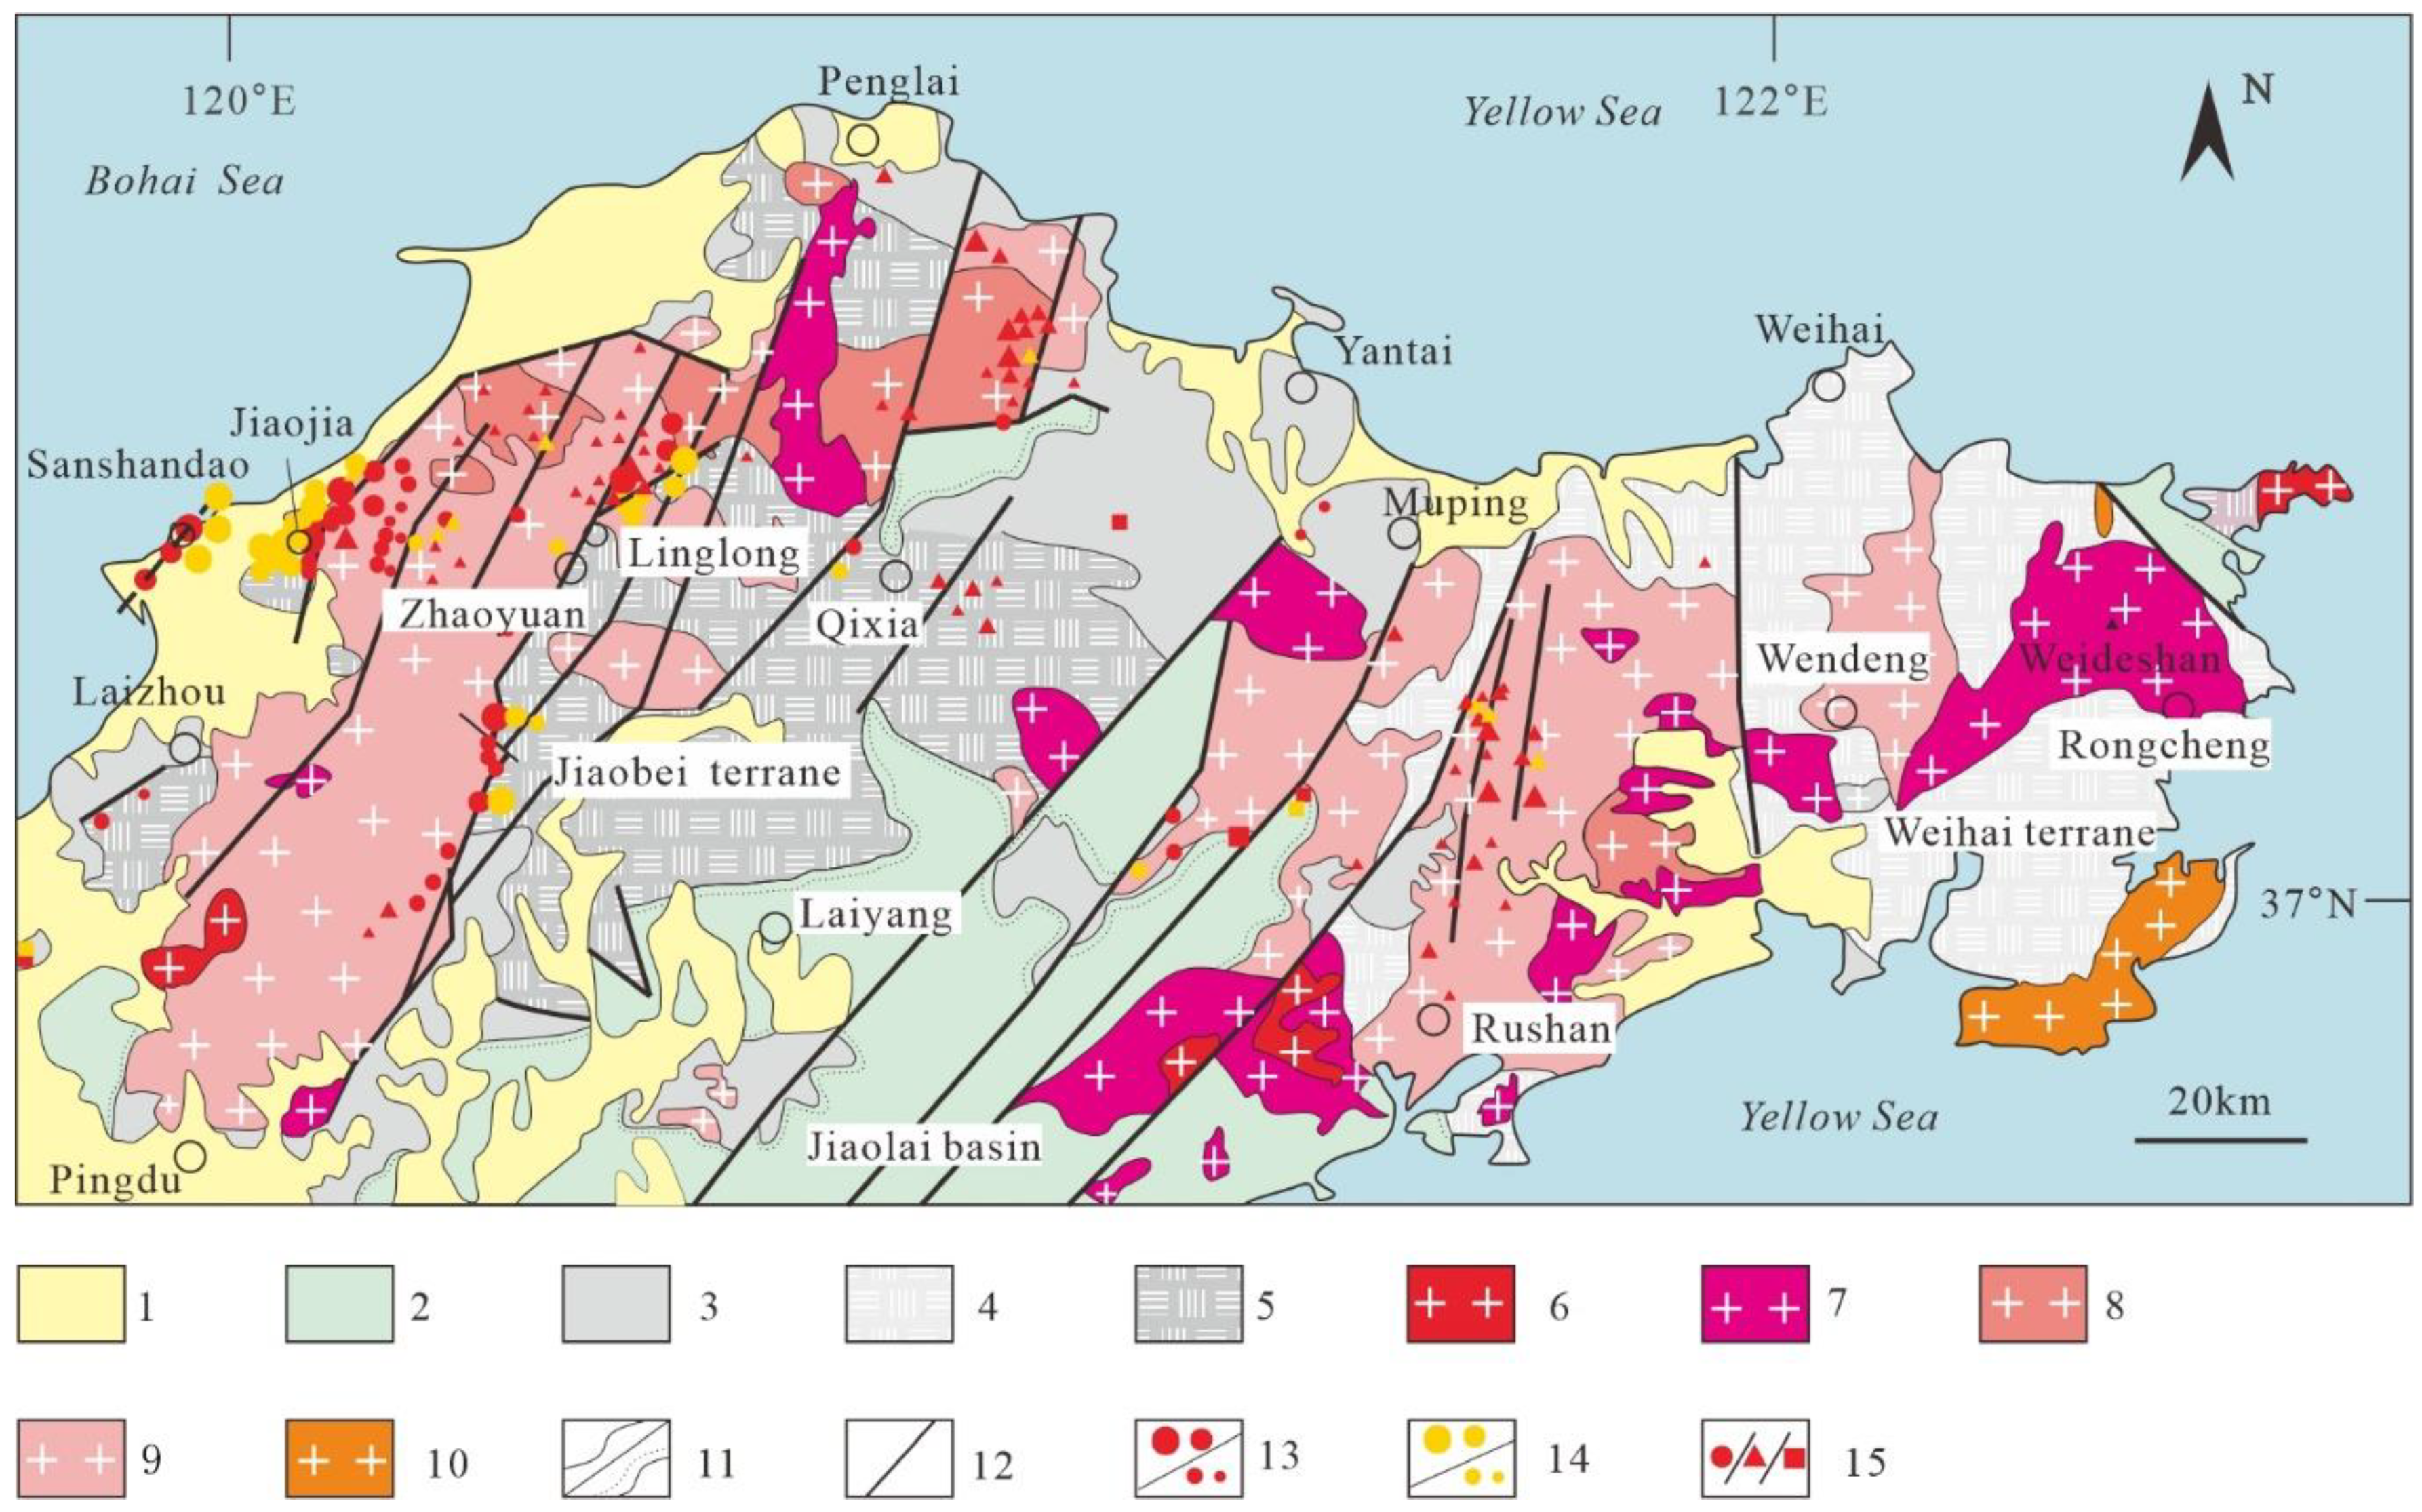
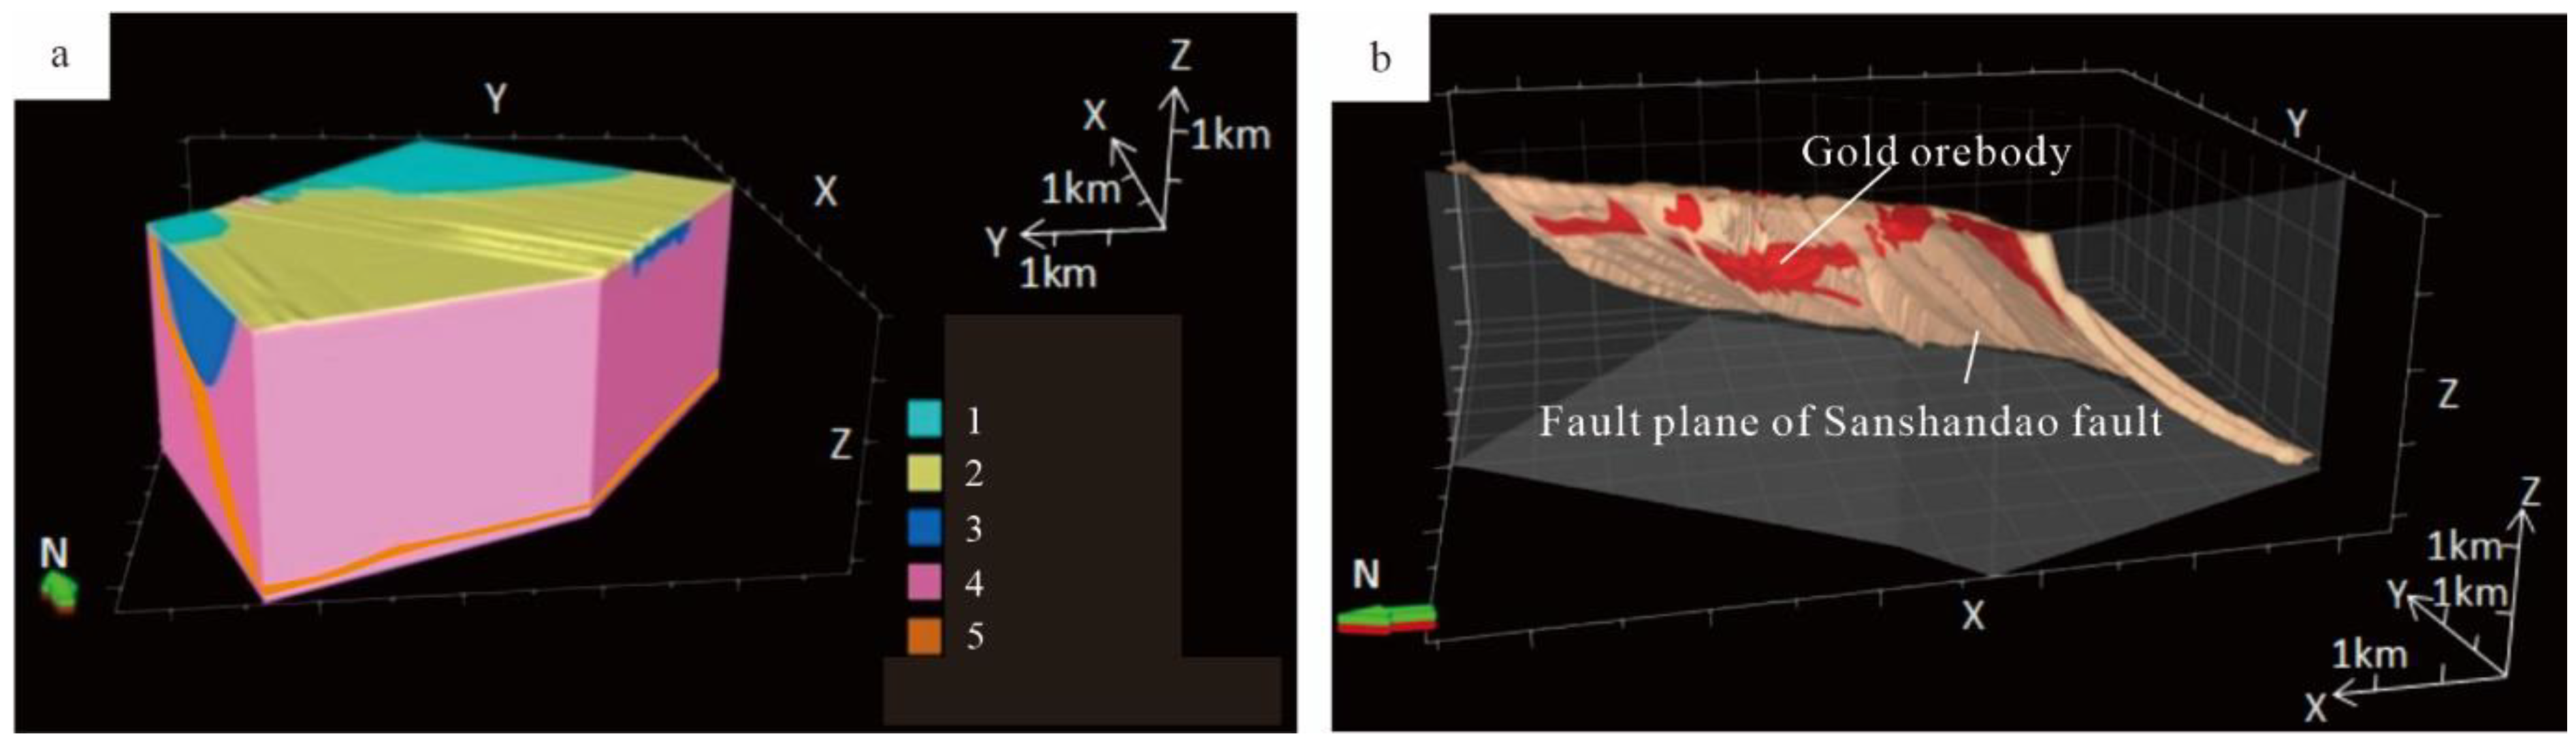
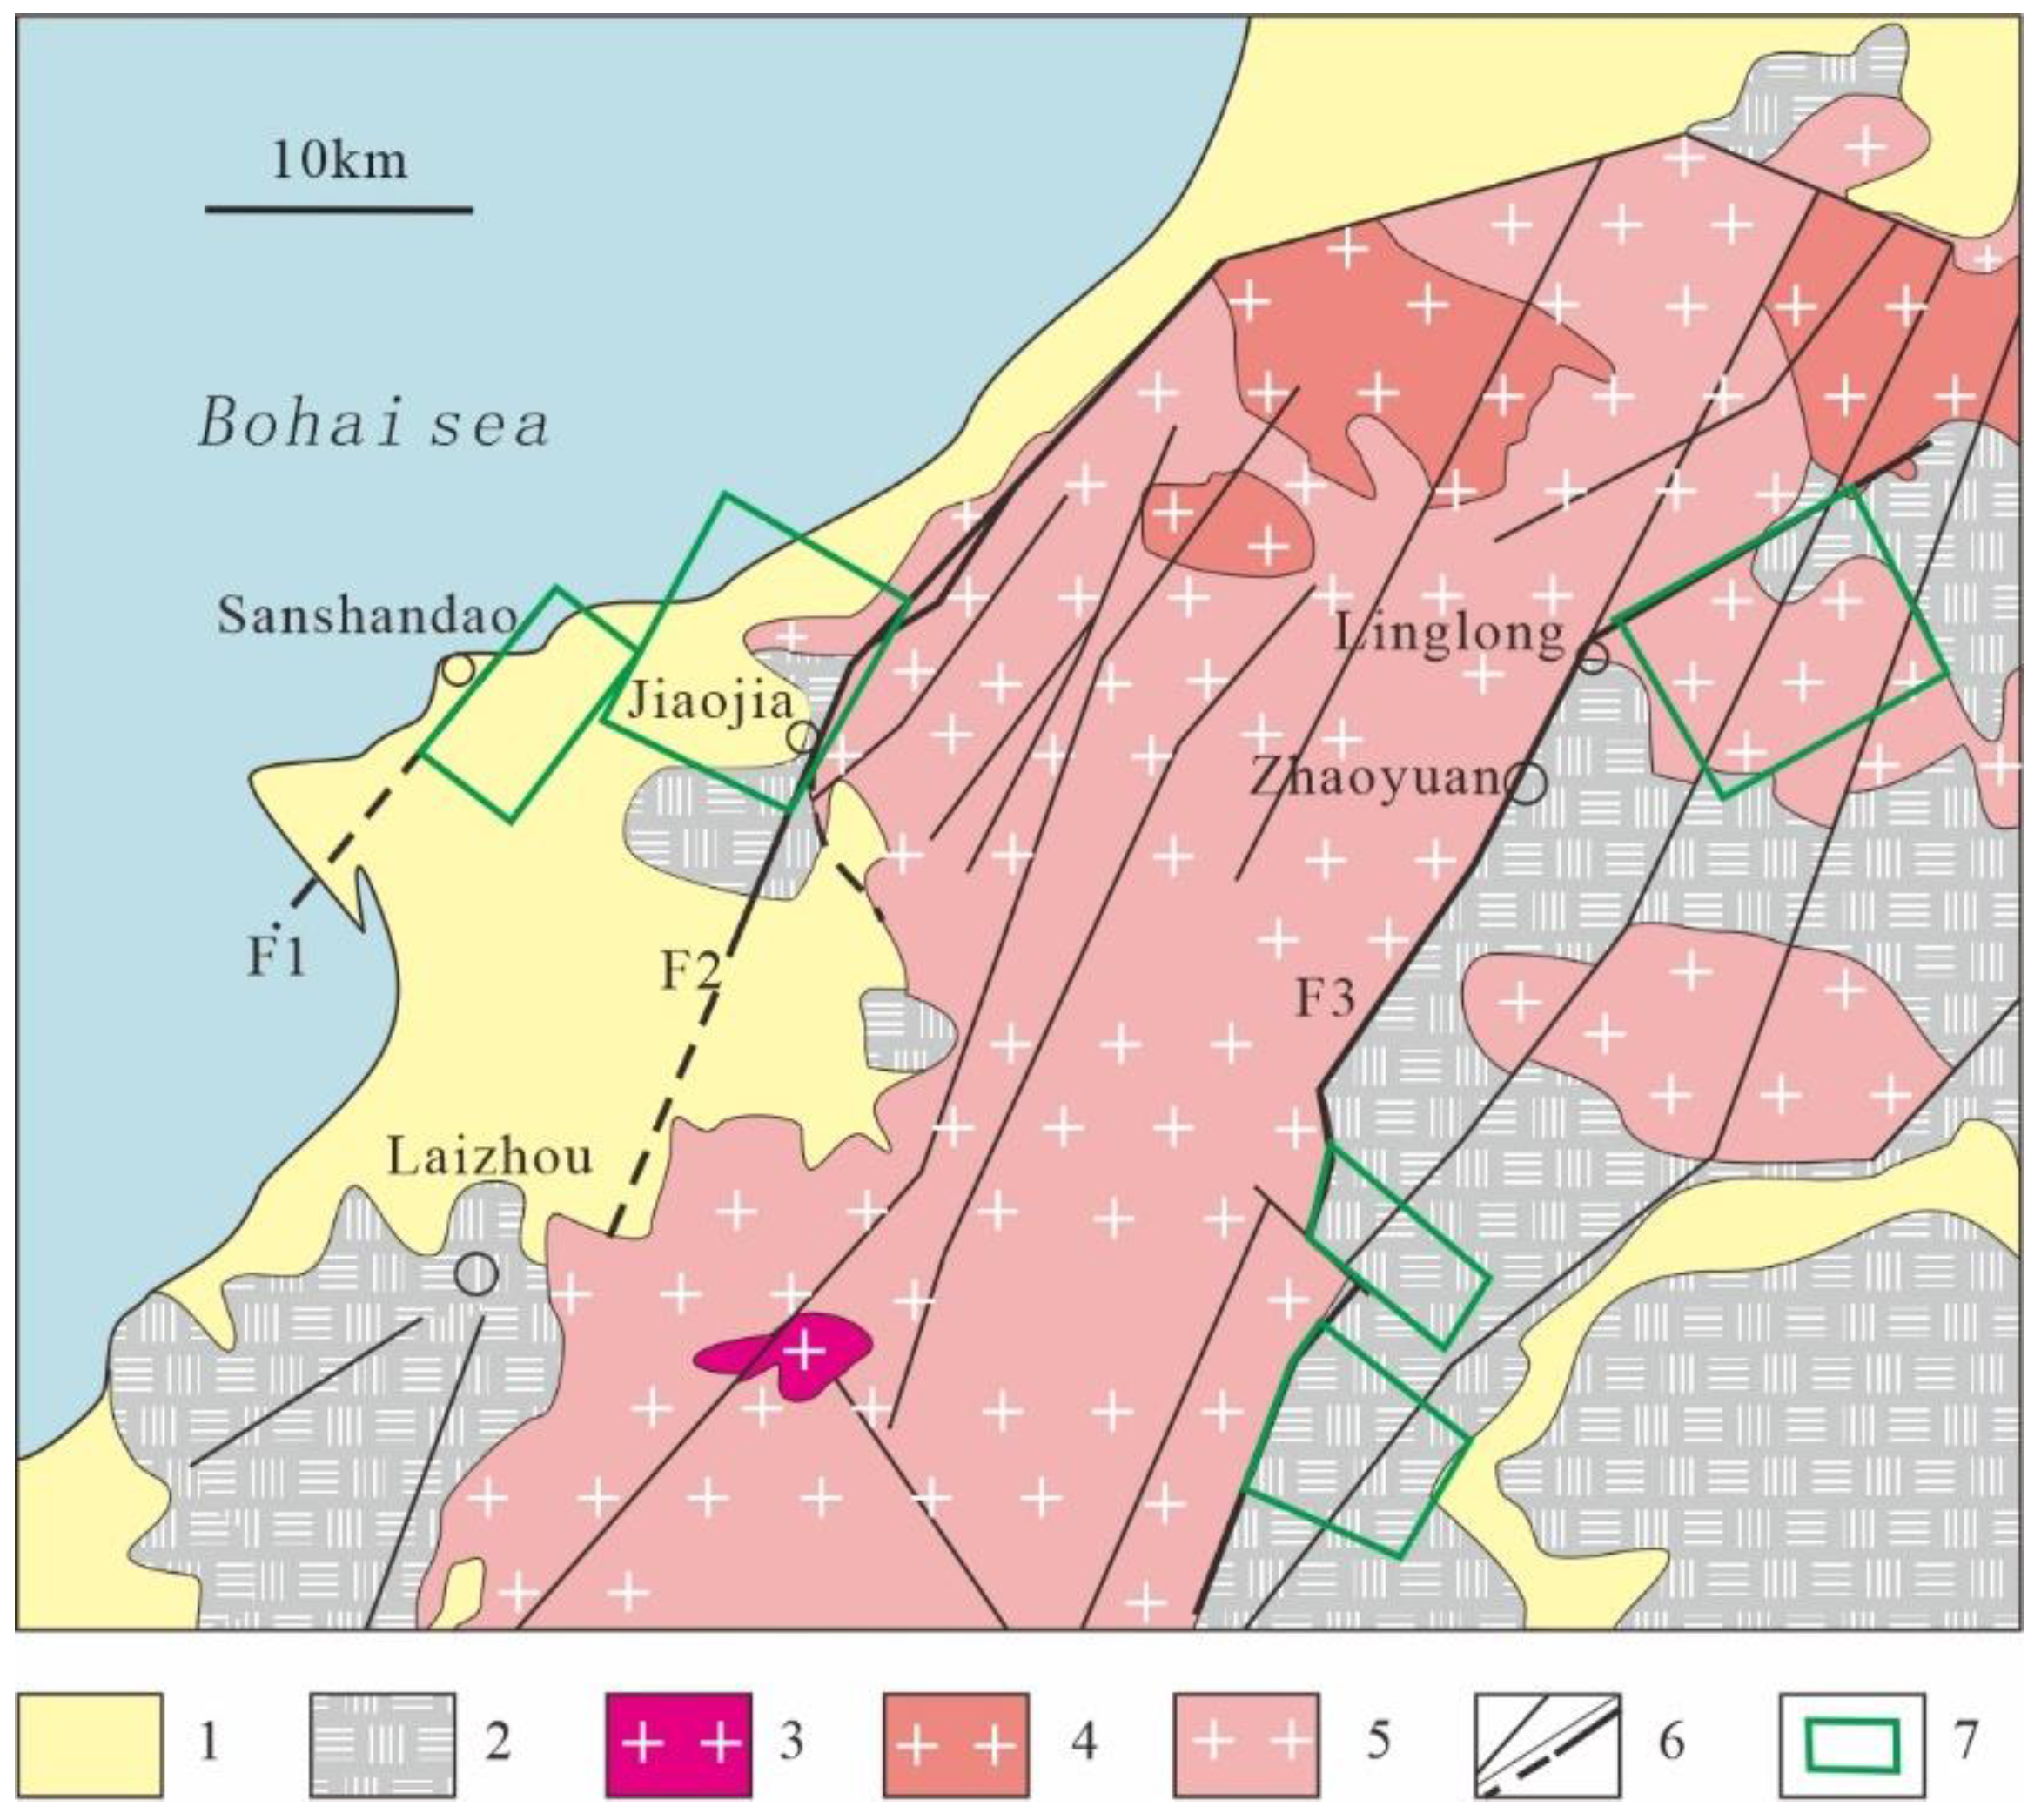
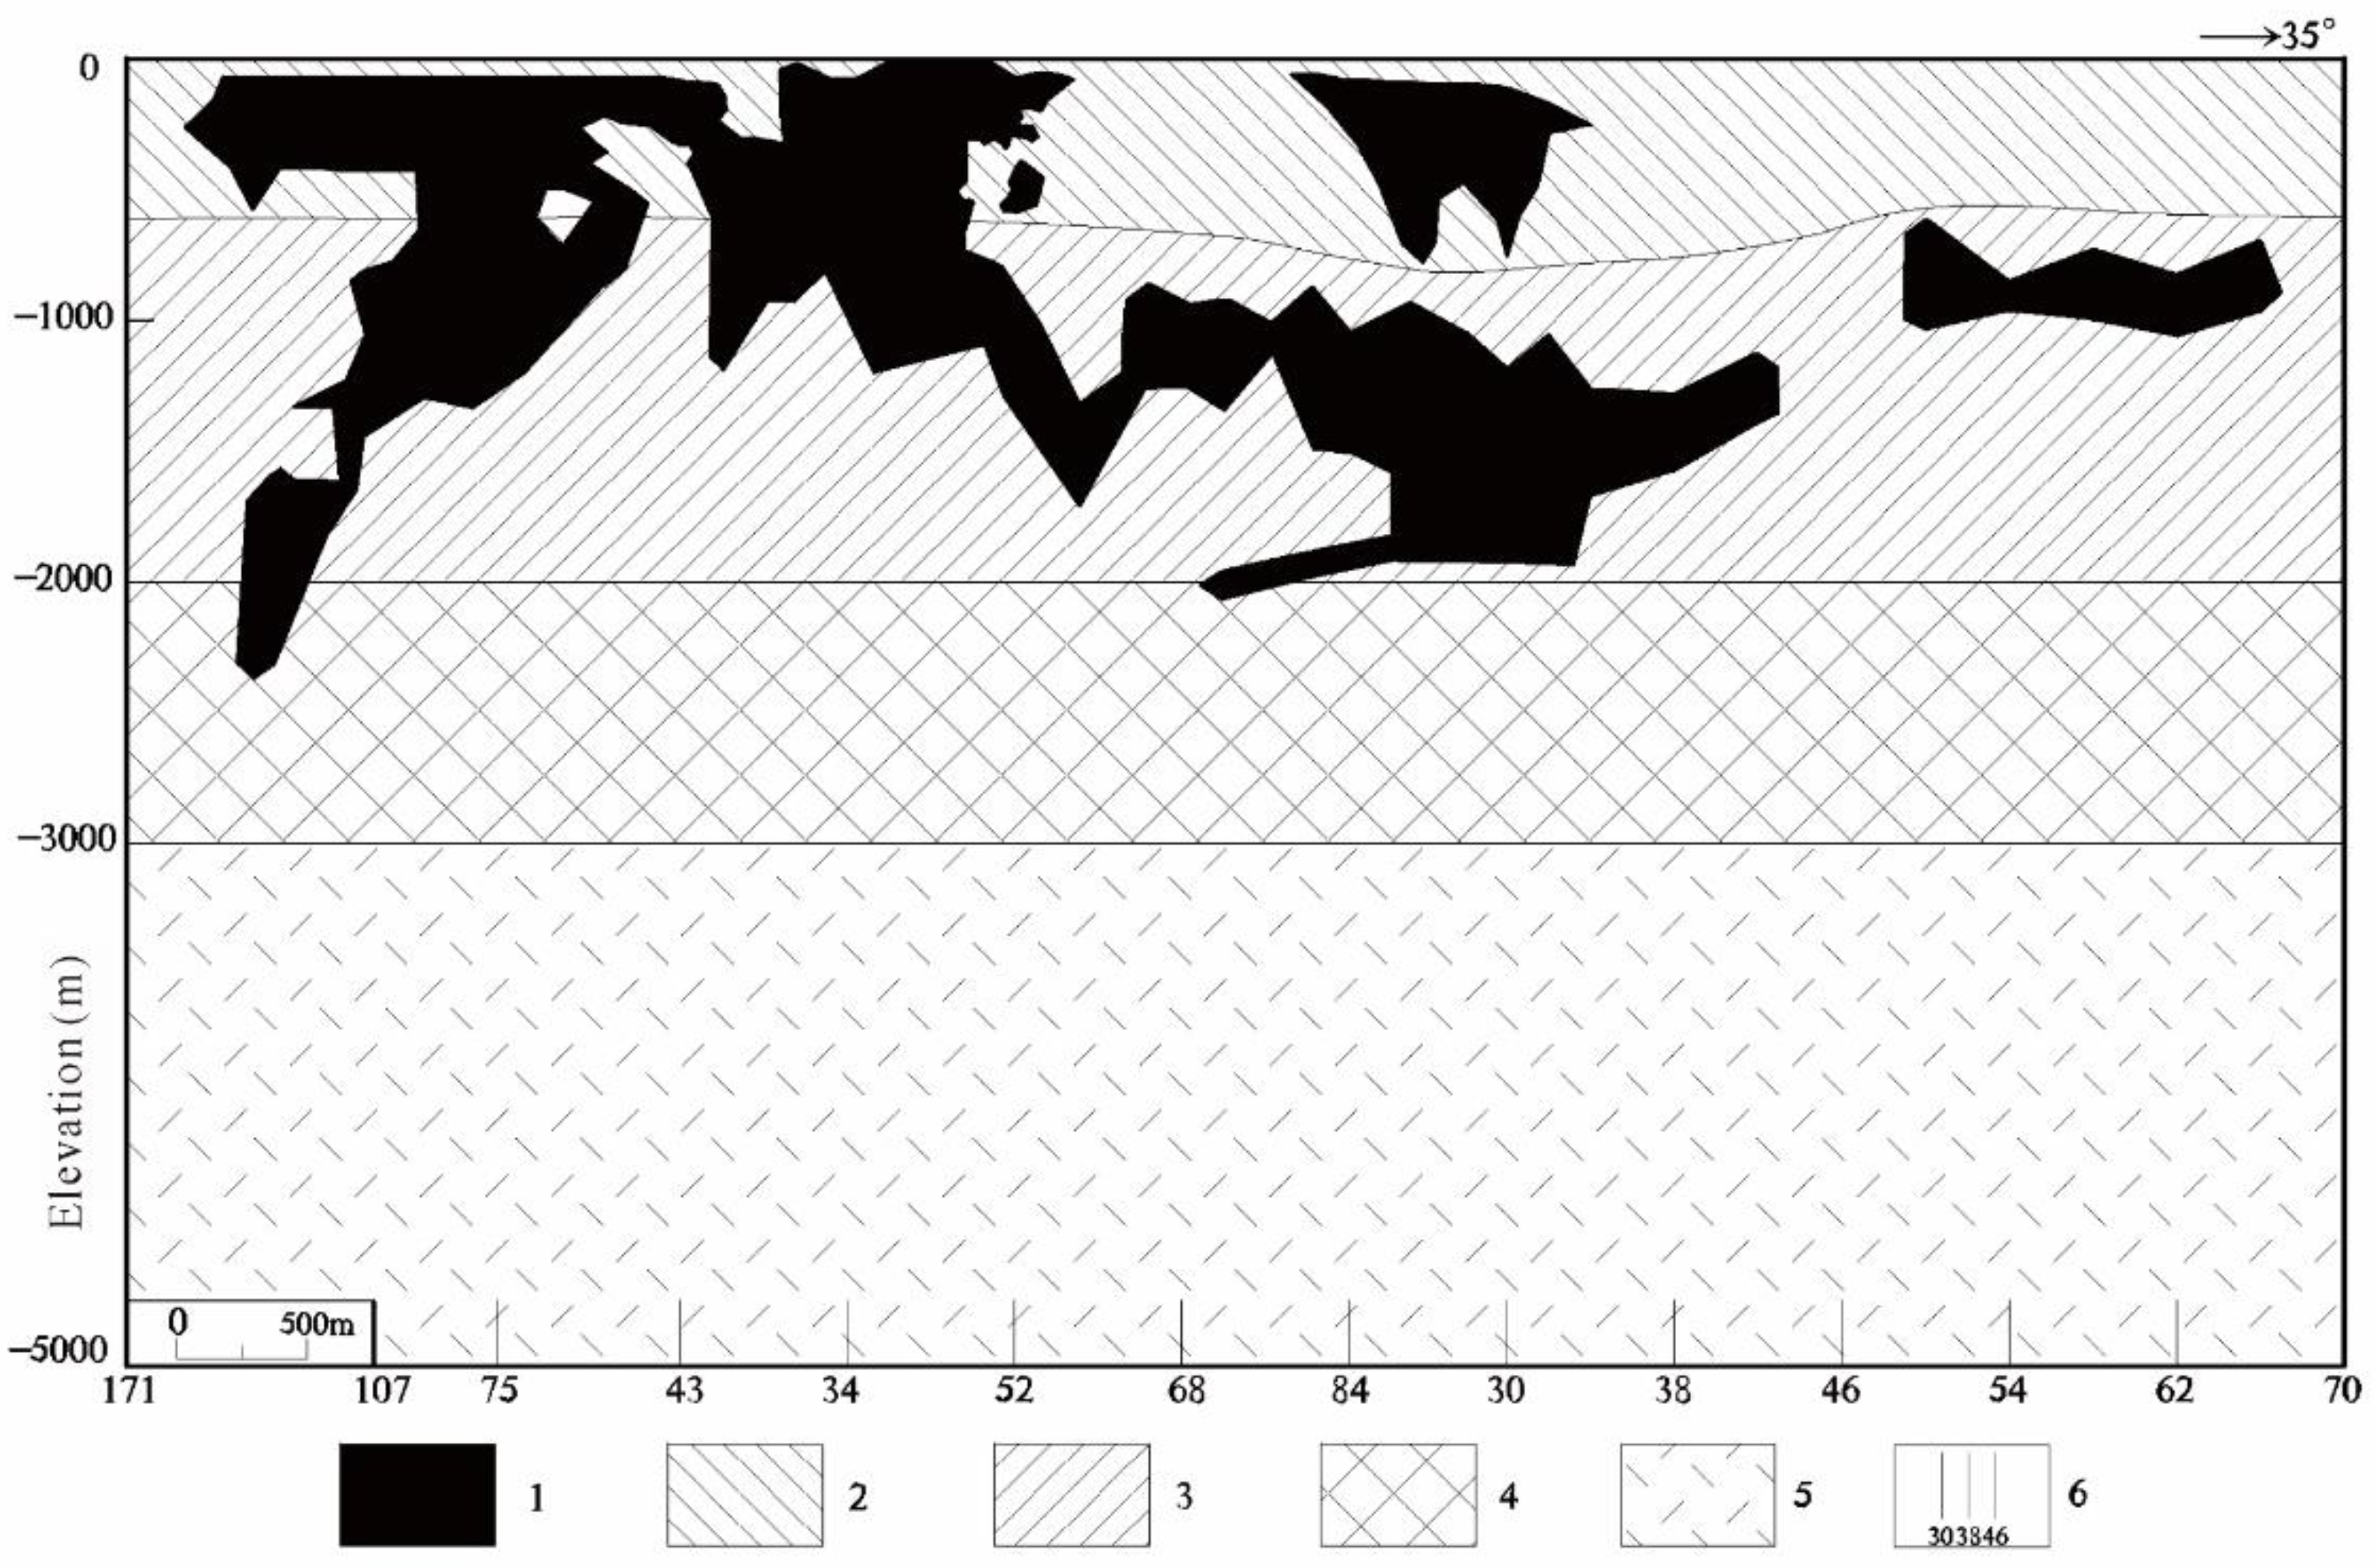
  • Favorable ore-hosting parts of faults. ① The altered-rock-type gold deposits in fractured zones in the Jiaodong Peninsula are mainly controlled by large-scale regional detachment faults in the NNE trending [33,44,45,46]. The fissure space in the fractured zones is favorable for the enrichment of gold-rich fluids [26]. The gold orebodies in these gold deposits mainly occur in the fractured alteration zones on the footwall of the main fault plane, which has fault gouges as the roof; ② The junctions of EW- and NE-trending faults; ③ The bending and turning parts of faults along fault strikes. ④ The development parts of the secondary faults on the footwall of main fault plane, fault junctions, and parts where fault branches combine. By comparison, the parts closer to the major faults are more favorable ore-hosting parts. ⑤ Gold orebodies occur in fault parts where the dip directions and dip angles of faults change, and fault sections with gentle dip angles are favorable ore-hosting parts [41,46,47,48]. For example, the gold orebodies in the Sanshandao gold concentration area mainly occur in fault sections with a steep-to-gentle transition of fault dip angle and fault concave sections with a gentle fault dip (Figure 2b), i.e., open space in faulting/striking faults allowing mineralized fluid circulation;
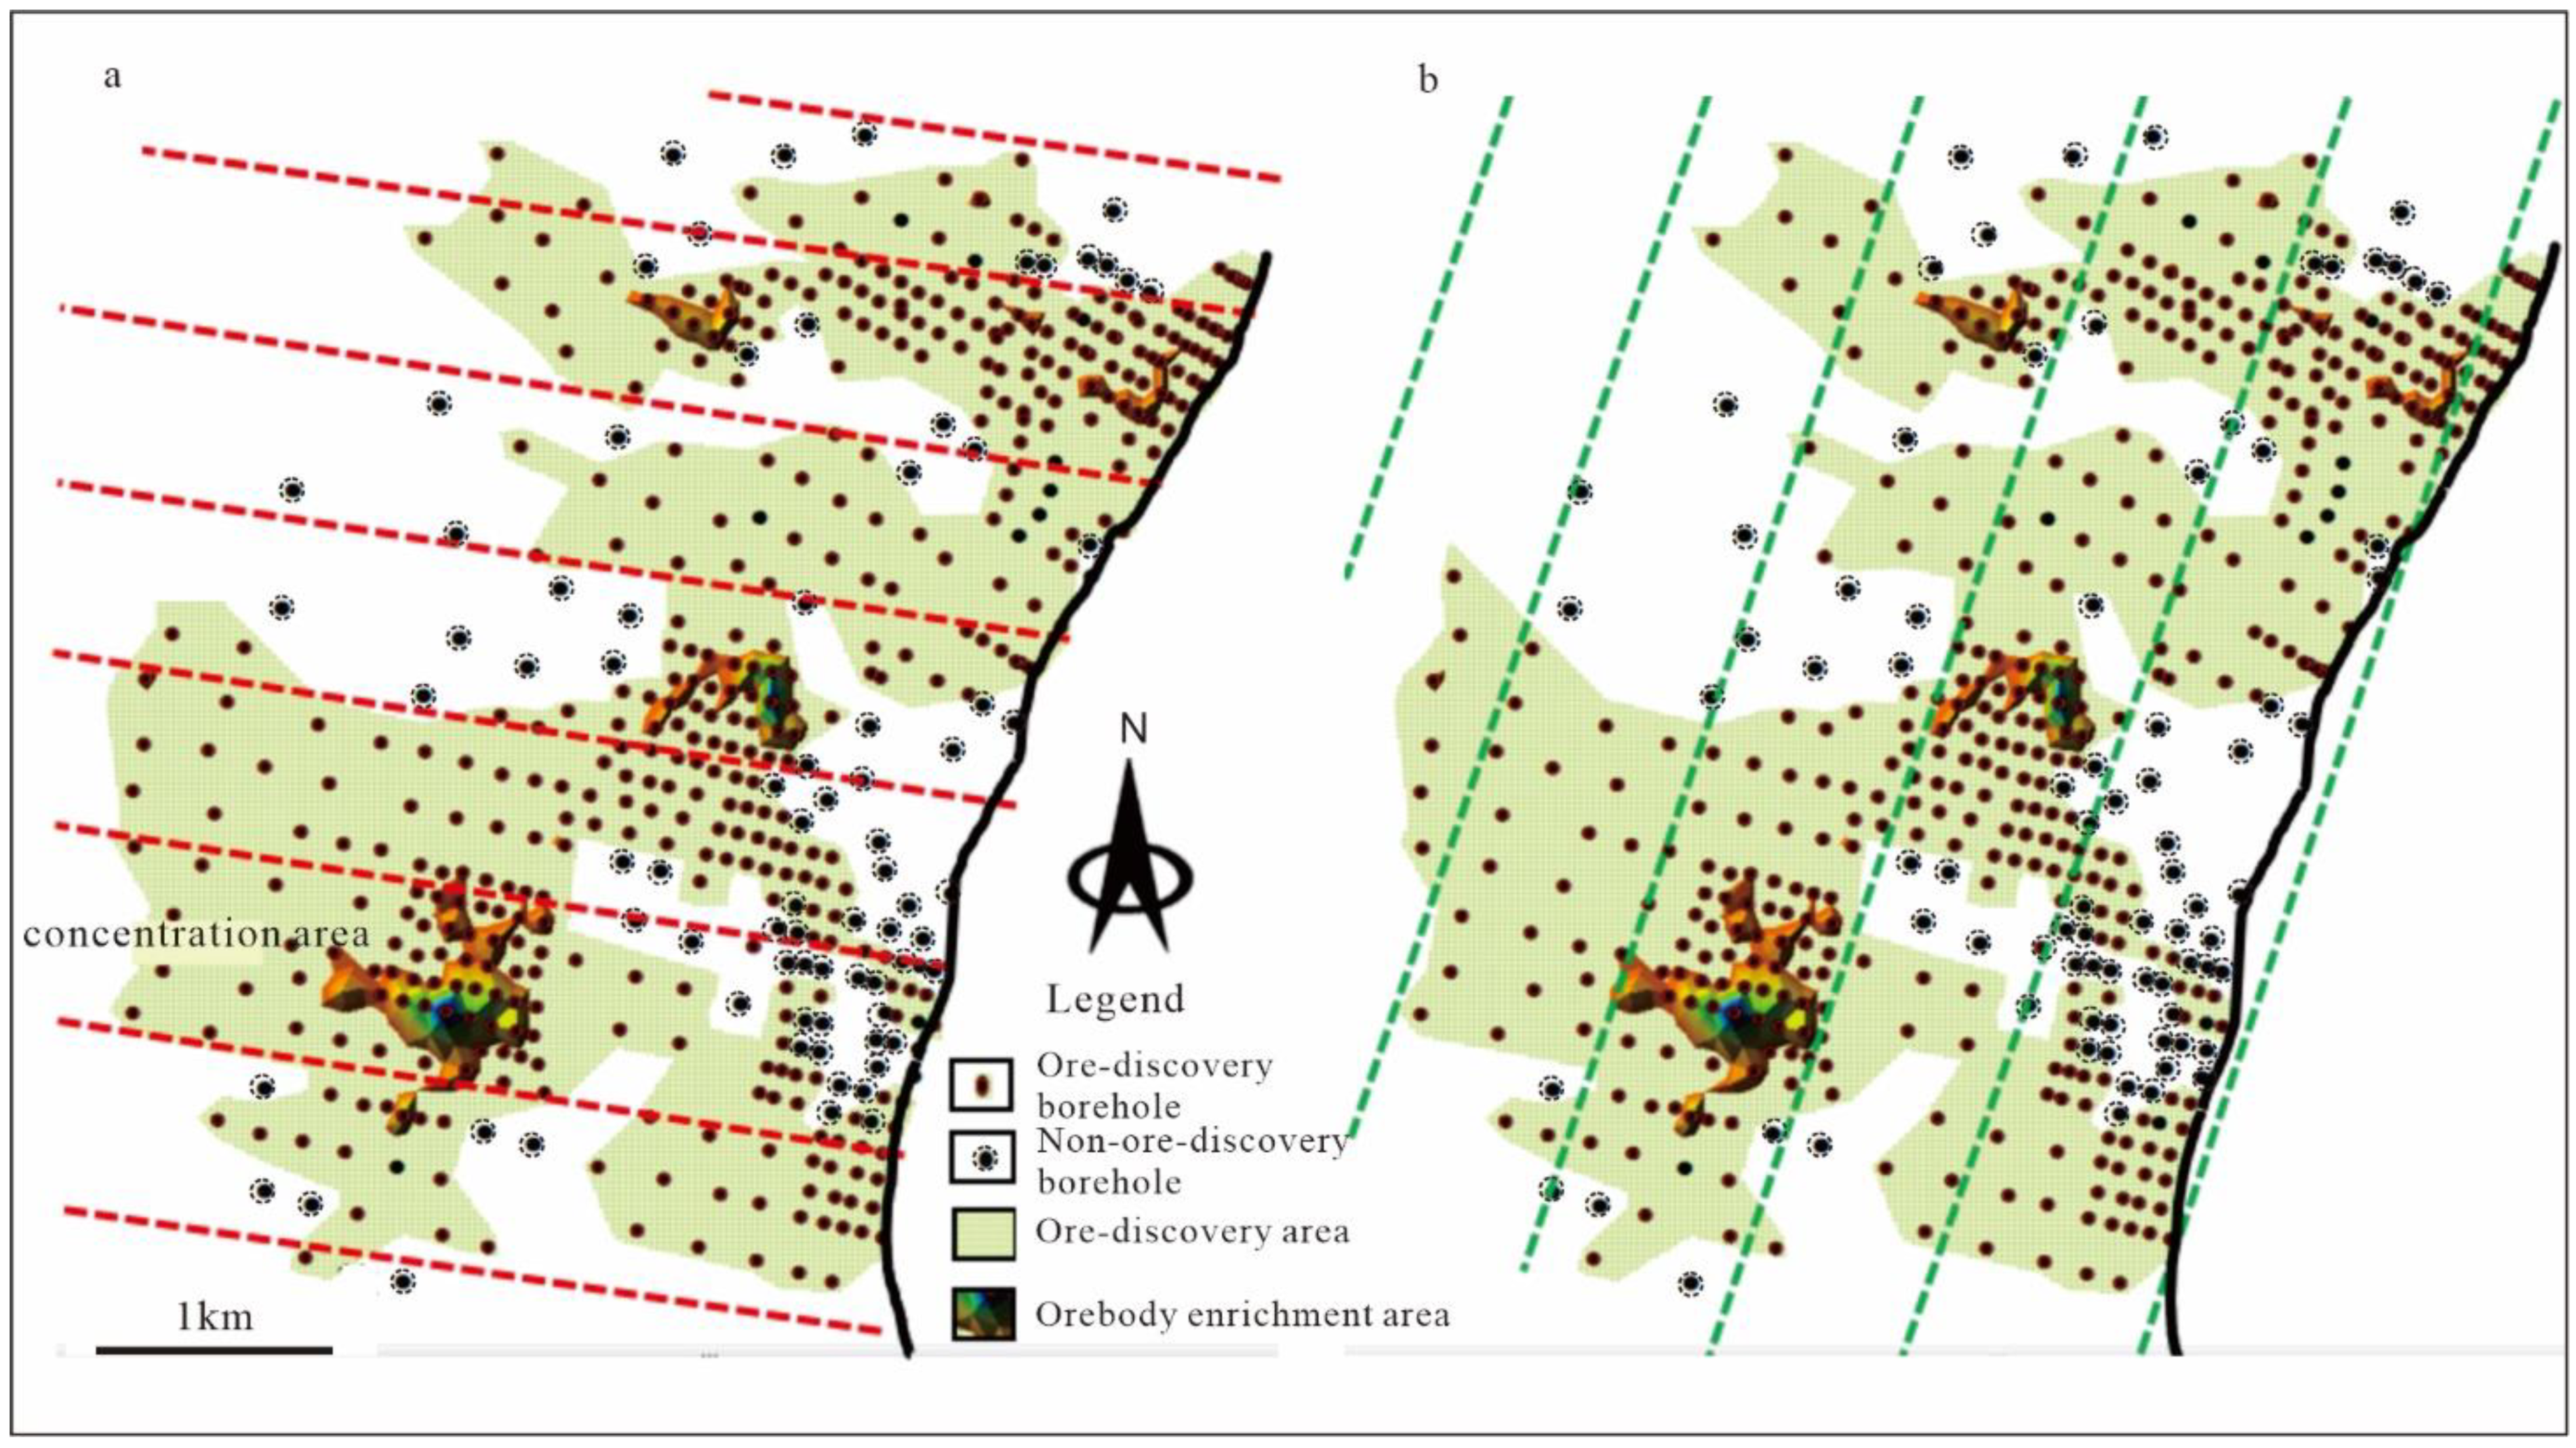
  • Distribution patterns of orebodies. ① The equidistant distribution pattern of orebodies. That is, deposits, orebodies, and mineralization enrichment zones in the Jiaodong Peninsula are roughly equidistantly distributed at about 500 m intervals. They are some similitudes with the Abitibi zone [13,14]; ② Pitching characteristics of orebodies [49,50]. Orebodies occurring in the NE- and NNE-trending faults pitch southwestward when the fault dip direction is NW and pitch northeastward when the fault dip direction is SE. Therefore, the orebodies roughly pitch in an SW-NE-trending straight line;
  • Ore-hosting geological bodies. ① The gold deposits in the Jiaodong Peninsula mainly occur in Jurassic Linglong-type granites, followed by Cretaceous Guojialing-type granites and Neoarchean-Paleoproterozoic metamorphic rock series. In addition, a few gold deposits occur at the bottom of the Early Cretaceous Laiyang Group. ② The contact zones between different geological bodies, especially those between the Early Precambrian metamorphic rock series and the Mesozoic granitoids, are favorable ore-hosting parts;
  • Geophysical bases. The efficiency of geophysical methods on gold prospecting is obvious [51,52,53,54,55,56,57,58,59,60]. The main geophysical indicators of gold prospecting in the Jiaodong Peninsula include the following aspects. ① Linear gradient zones of gravity anomalies. Favorable metallogenic parts mainly include the edges of zones with low gravity (i.e., the transition zones between gravity highs and gravity lows could indicate fossil hydrothermal zone with dissolved rocks) and the contact zones between large-scale gravity lows and gravity highs, especially the turning parts of the gradient zones. The favorable metallogenic parts of deep-seated gold deposits include moniliform and elongate zones with high-amplitude magnetic anomalies, especially the bending parts of magnetic anomaly contours (protruding and concave parts), the edges of blocky gravity and magnetic anomaly zones, and the edges of small-scale blocky and moniliform positive magnetic anomaly zones. The magnetic anomaly would be associated to magnetite/pyrrhotite minerals often associated to gold mineralization. ② The boundaries between high- and low-resistance electric fields. On the apparent resistivity sections, the sparse and wide contour lines that synchronously bend downward and show U- or V-shaped low resistance mark the parts favorable for the occurrence of gold deposits. Boundaries between low/high resistivity zones could be linked to the presence of conductive minerals such pyrite often pathfinder minerals for gold mineralization.

3.2.3. Prediction Process

  • Analysis and processing of the modeling data on typical ore deposits and their surrounding mining areas
Comprehensively collect the geological, geophysical, geochemical, and mineral data of prediction areas and their surrounding areas, and determine the basic characteristics of typical deposits. Then, study metallogenic geological bodies, metallogenic structures, metallogenic characteristics, and prospective indicators, as well as the vertical and horizontal mineralization zoning characteristics of deposits. Based on this, summarize metallogenic rules and establish metallogenic models;
b.
Deep geophysical exploration
Study the physical properties of ores and minerals and the geophysical fields of prediction areas; carry out measurements of deep geophysical profiles; extract key information for prospecting, and establish geophysical models. Classify different geological bodies and identify faults according to the main physical properties and geophysical models;
c.
3D modeling and 3D analysis of ore-hosting structures
Construct 3D geological models of deposits; emphatically analyze the coupling relationships between the changing characteristics of fault surfaces and the distribution and enrichment of orebodies; extract and assess predictive factors; identify areas with high prospecting information amounts as prospecting favorable areas and prospecting target areas.

3.3. Method for Predicting Deep Gold Resource Potential in the Ore-Controlling Fault Zones Based on Shallow Resources

3.3.1. Methodological Overview

According to the trend extrapolation principle, this predictive method was designed to extrapolate the resources in the deep prediction areas with metallogenic conditions similar to the shallow parts from the statistical analysis of the proven resources in the shallow parts.

3.3.2. Predictive Factors

The main predictive factors include ore-controlling faults, the cumulative proven gold resources at an elevation of approximately −2000 m and above, the average gold content per unit area at an elevation of approximately −2000 m and above, and the area of ore-controlling faults at an elevation of −5000–−2000 m on the vertical longitudinal projection map.
The deep resources were estimated using this equation: deep resources = ore-bearing rate × the area of the deep prediction areas. In this equation, the ore-bearing rate is equal to the average gold content per unit area in the shallow part, and the area of the deep prediction areas is equal to the area of ore-controlling faults at an elevation of −5000–−2000 m on the vertical longitudinal projection map. In other words, the vertical longitudinal projection map was obtained by cutting a 3D geological model. Then, the average gold content per unit area (i.e., ore-bearing rate) was determined based on the distribution of orebodies at different depths in the vertical longitudinal projection map. Subsequently, the boundaries of the ore-controlling faults in the vertical longitudinal projection map were reasonably determined based on the prediction depth, and then the area of the faults was accordingly calculated. Finally, the potential gold resources in the deep part were estimated by making an analogy with those in the known shallow area.

3.3.3. Prediction Process

The resource potential of deep-seated gold deposits of a fault was predicted as follows: 3D geological modeling → obtaining the statistics of accumulative proven resources in the shallow part using the 3D geological model → obtaining the vertical longitudinal projection map by cutting the 3D geological model → obtaining the statistics of the ore-bearing rate → determining the area of the deep prediction areas → estimating the resources in the deep part.

4. Prediction of Deep Prospecting Target Areas

4.1. Deep Prospecting Target Areas in the Jiaojia Fault

4.1.1. Determining Cell Blocks and Extracting Favorable Mineralization Information

The range and basic parameters of the modeling of the Jiaojia fault were determined based on the existing geological data of orebodies in the fault (especially the distribution of exploration lines), as well as the morphology, attitude, and spatial distribution of known orebodies. The established 3D geological model was divided into 660,800 cell blocks based on the line spacing × column spacing × layer spacing of 120 m × 120 m × 10 m. Among these cell blocks, 7263 were occupied by orebodies (also referred to as ore-hosting cell blocks). Ore-hosting cell blocks were assigned 1, while other cell blocks were assigned 0. Subsequently, the ore-controlling factors of ore-hosting cell blocks were extracted and their statistics were obtained, and accordingly, a quantitative predictive model was determined. Then, the predictive parameters were assigned to each cell block as per its attributes.
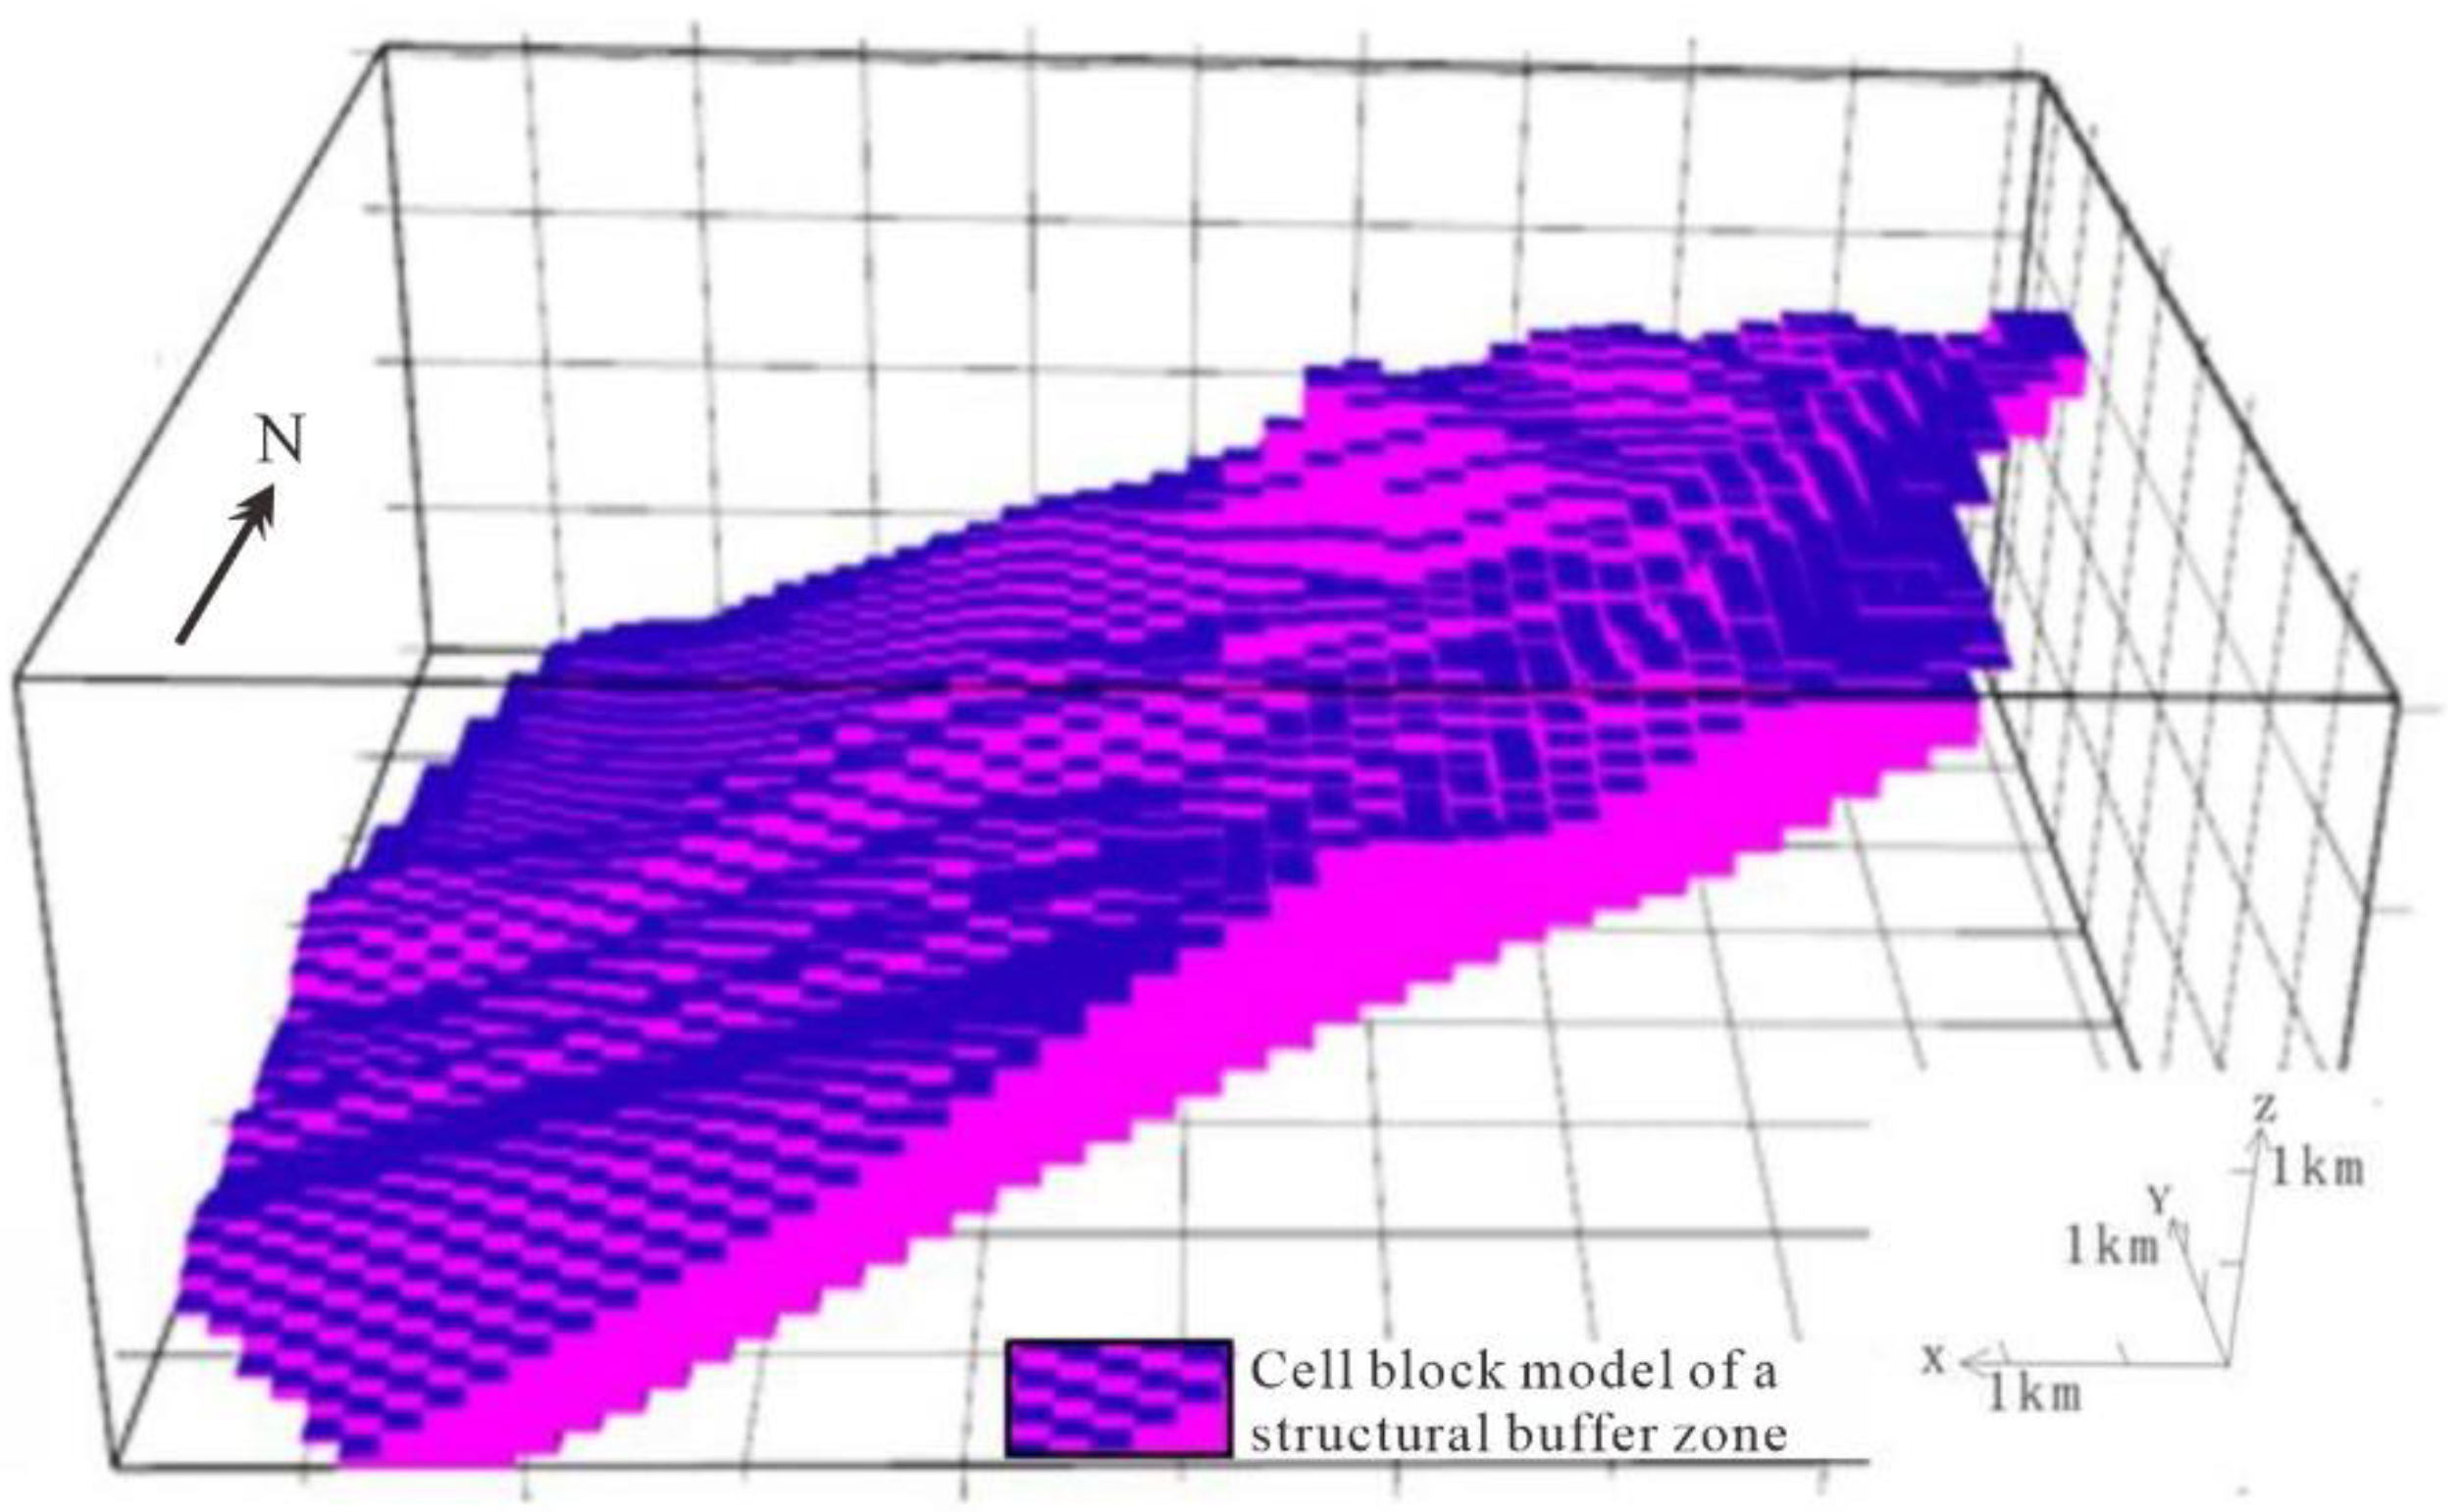
  • Cell blocks with favorable information of ore-hosting faults.
① Structural buffer zones. Gold deposits are strictly controlled by faults, and gold orebodies mainly occur in the fractured alteration zones on the footwall of the main fault plane with fault gouges as the roof, with a small number of gold orebodies occurring on the hanging walls of the main fault plane. Therefore, the zone between 300 m above the footwall and 100 m below the hanging wall of the main fault plane was defined as a structural buffer zone favorable for mineralization. In this study, the structural buffer zones covered 108,572 cell blocks (Figure 3), which accounted for 16.43% of the total cell blocks in the model (660,800). Moreover, the structural buffer zones included 7124 ore-hosting cell blocks, accounting for 98.09% of the total ore-hosting cell blocks (7263) in the model. ② The turning parts of the fault dip angles. Orebodies are mainly rich in stepped fault parts with gentle dip angles. In this study, the fault parts with a steep-to-gentle transition of fault dip angle covered 53,285 cell blocks, which accounted for 8.06% of the total cell blocks in the model. These parts included 2866 ore-hosting cell blocks, which accounted for 39.46% of the total ore-hosting cell blocks in the model. ③ The changing rate of fault dip angle. The fault surfaces were divided into a number of square blocks, to each of which a slope attribute was assigned. The variance of the slope values of square blocks within a fixed range was calculated to determine the changes in the fault surface. The changing rate of fault dip angle involved 99,776 cell blocks, which accounted for 15.10% of the total cell blocks in the model. Furthermore, the changing rate of fault dip angle involved 5670 ore-hosting cell blocks, which accounted for 78.07% of the total ore-hosting cell blocks in the model;
b.
Cell blocks with favorable information of orebody distribution.
By extracting the distribution range of ore bodies and mineralization enrichment areas, it can be seen that the ore body enrichment areas are nearly equally spaced along the strike and dip at about 500 m intervals (Figure 4). Accordingly, 273,240 cell blocks were divided along the strike with equal spacing, which accounted for 41.35% of the total cell blocks in the model. These cell blocks included 5932 ore-hosting cell blocks, which accounted for 81.67% of the total ore-hosting cell blocks. The orebody concentration areas showing equidistant distribution along fault dip directions included 251,856 cell blocks, which accounted for 38.11% of the total cell blocks in the model. These cell blocks included 5884 ore-hosting cell blocks, which accounted for 81.01% of the total ore-hosting cell blocks in the model.

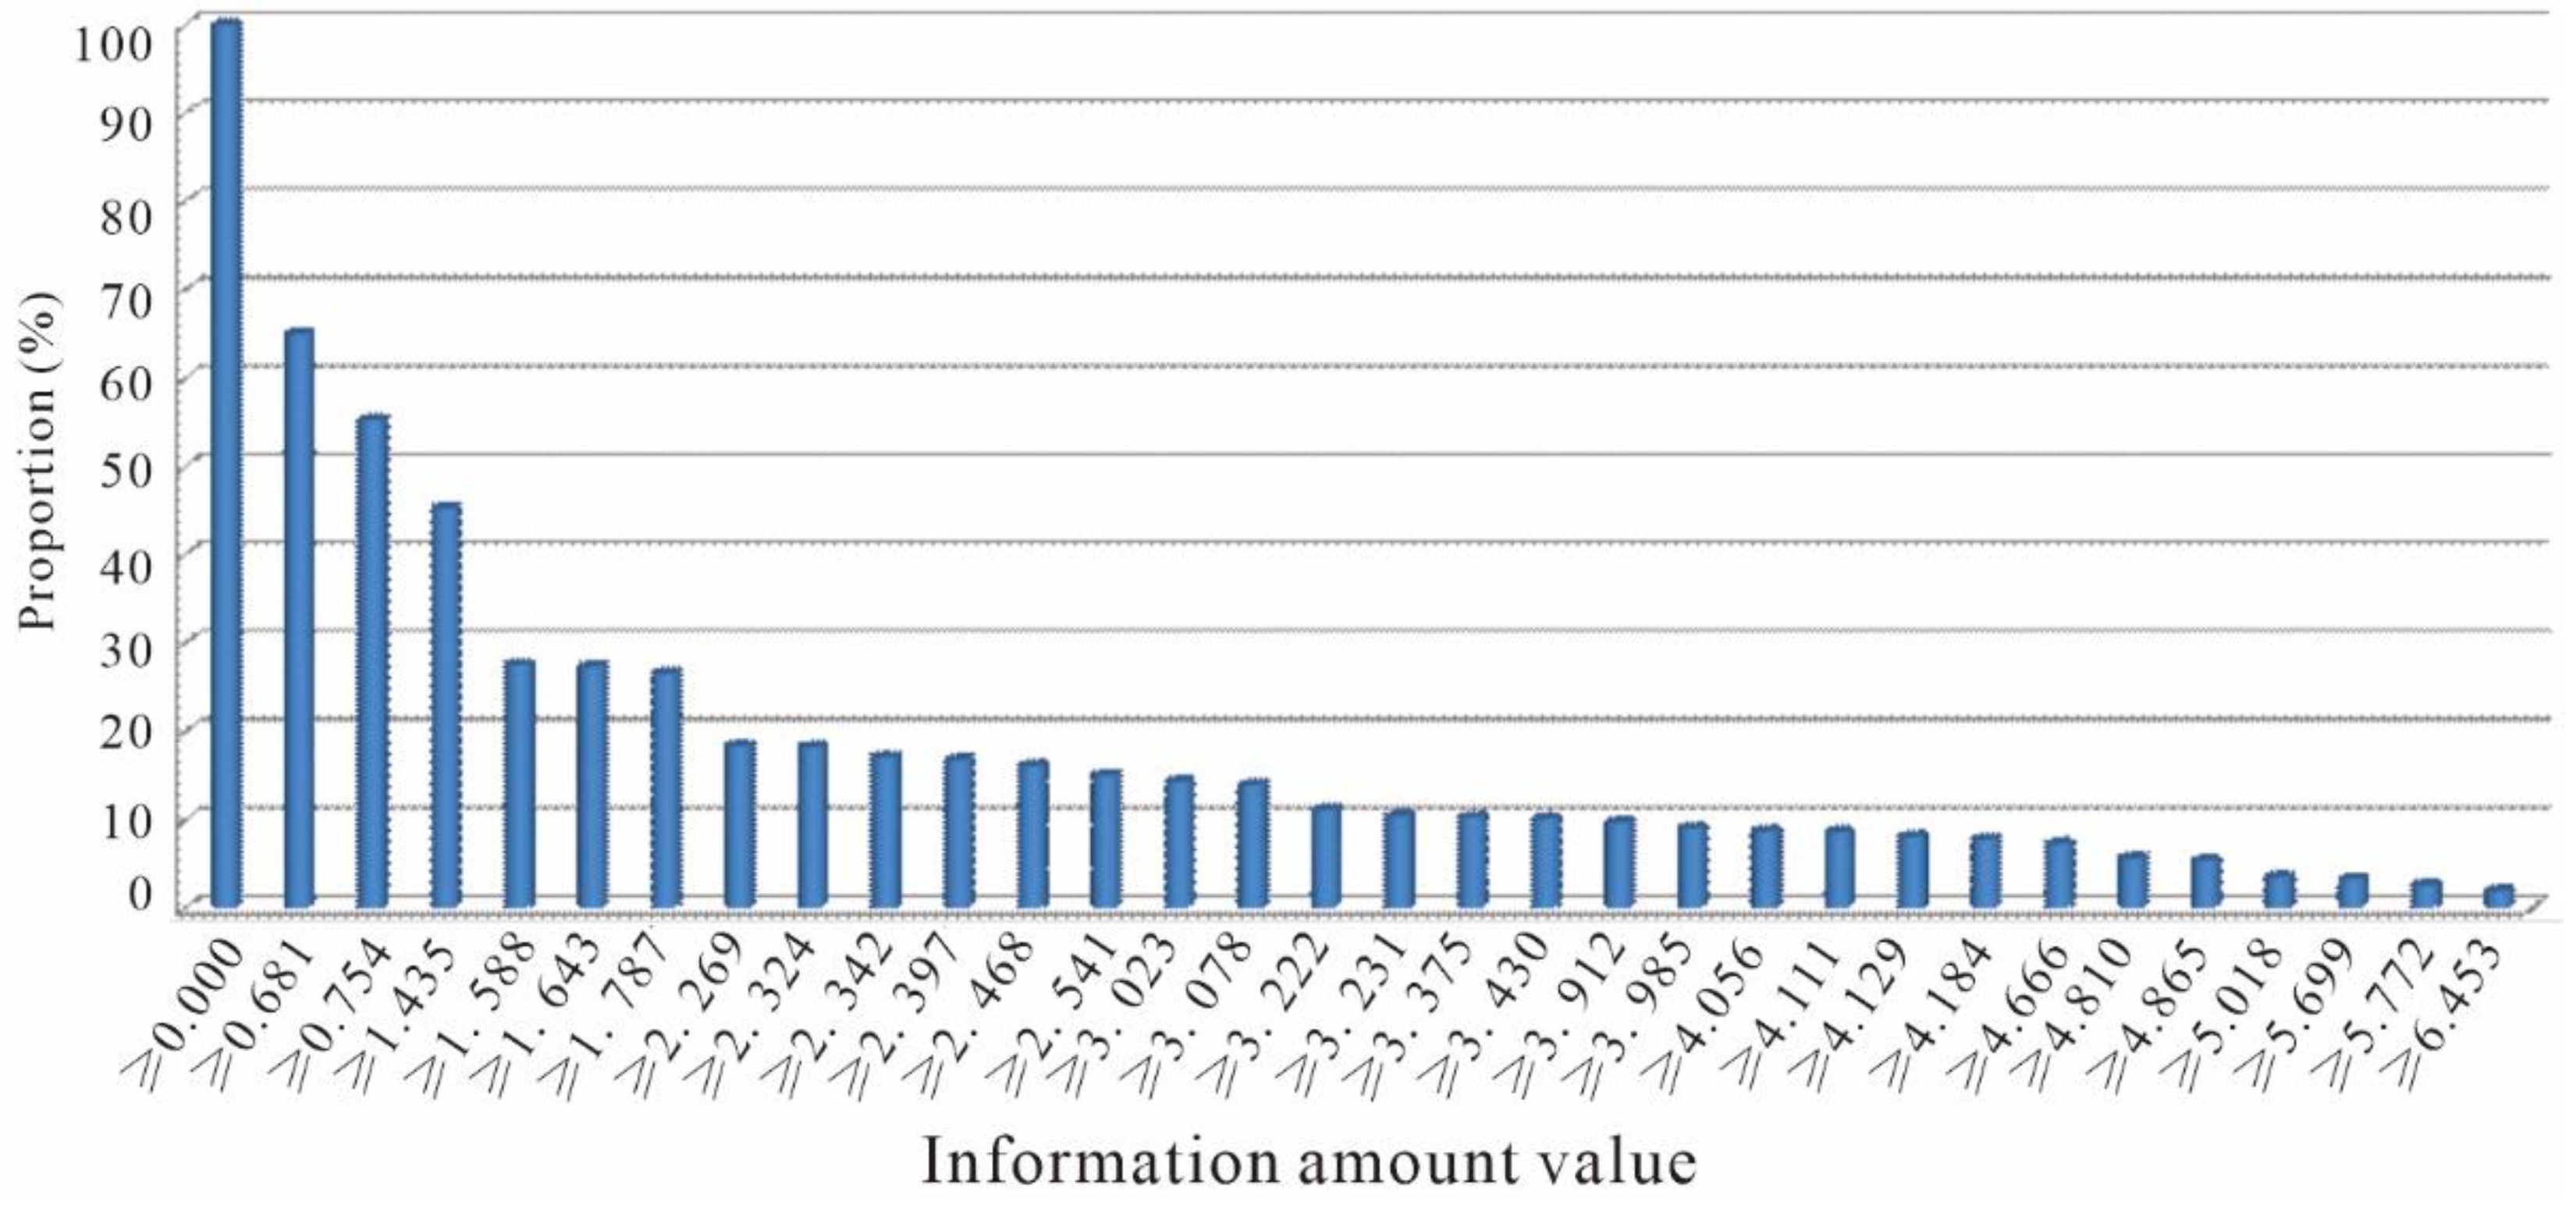
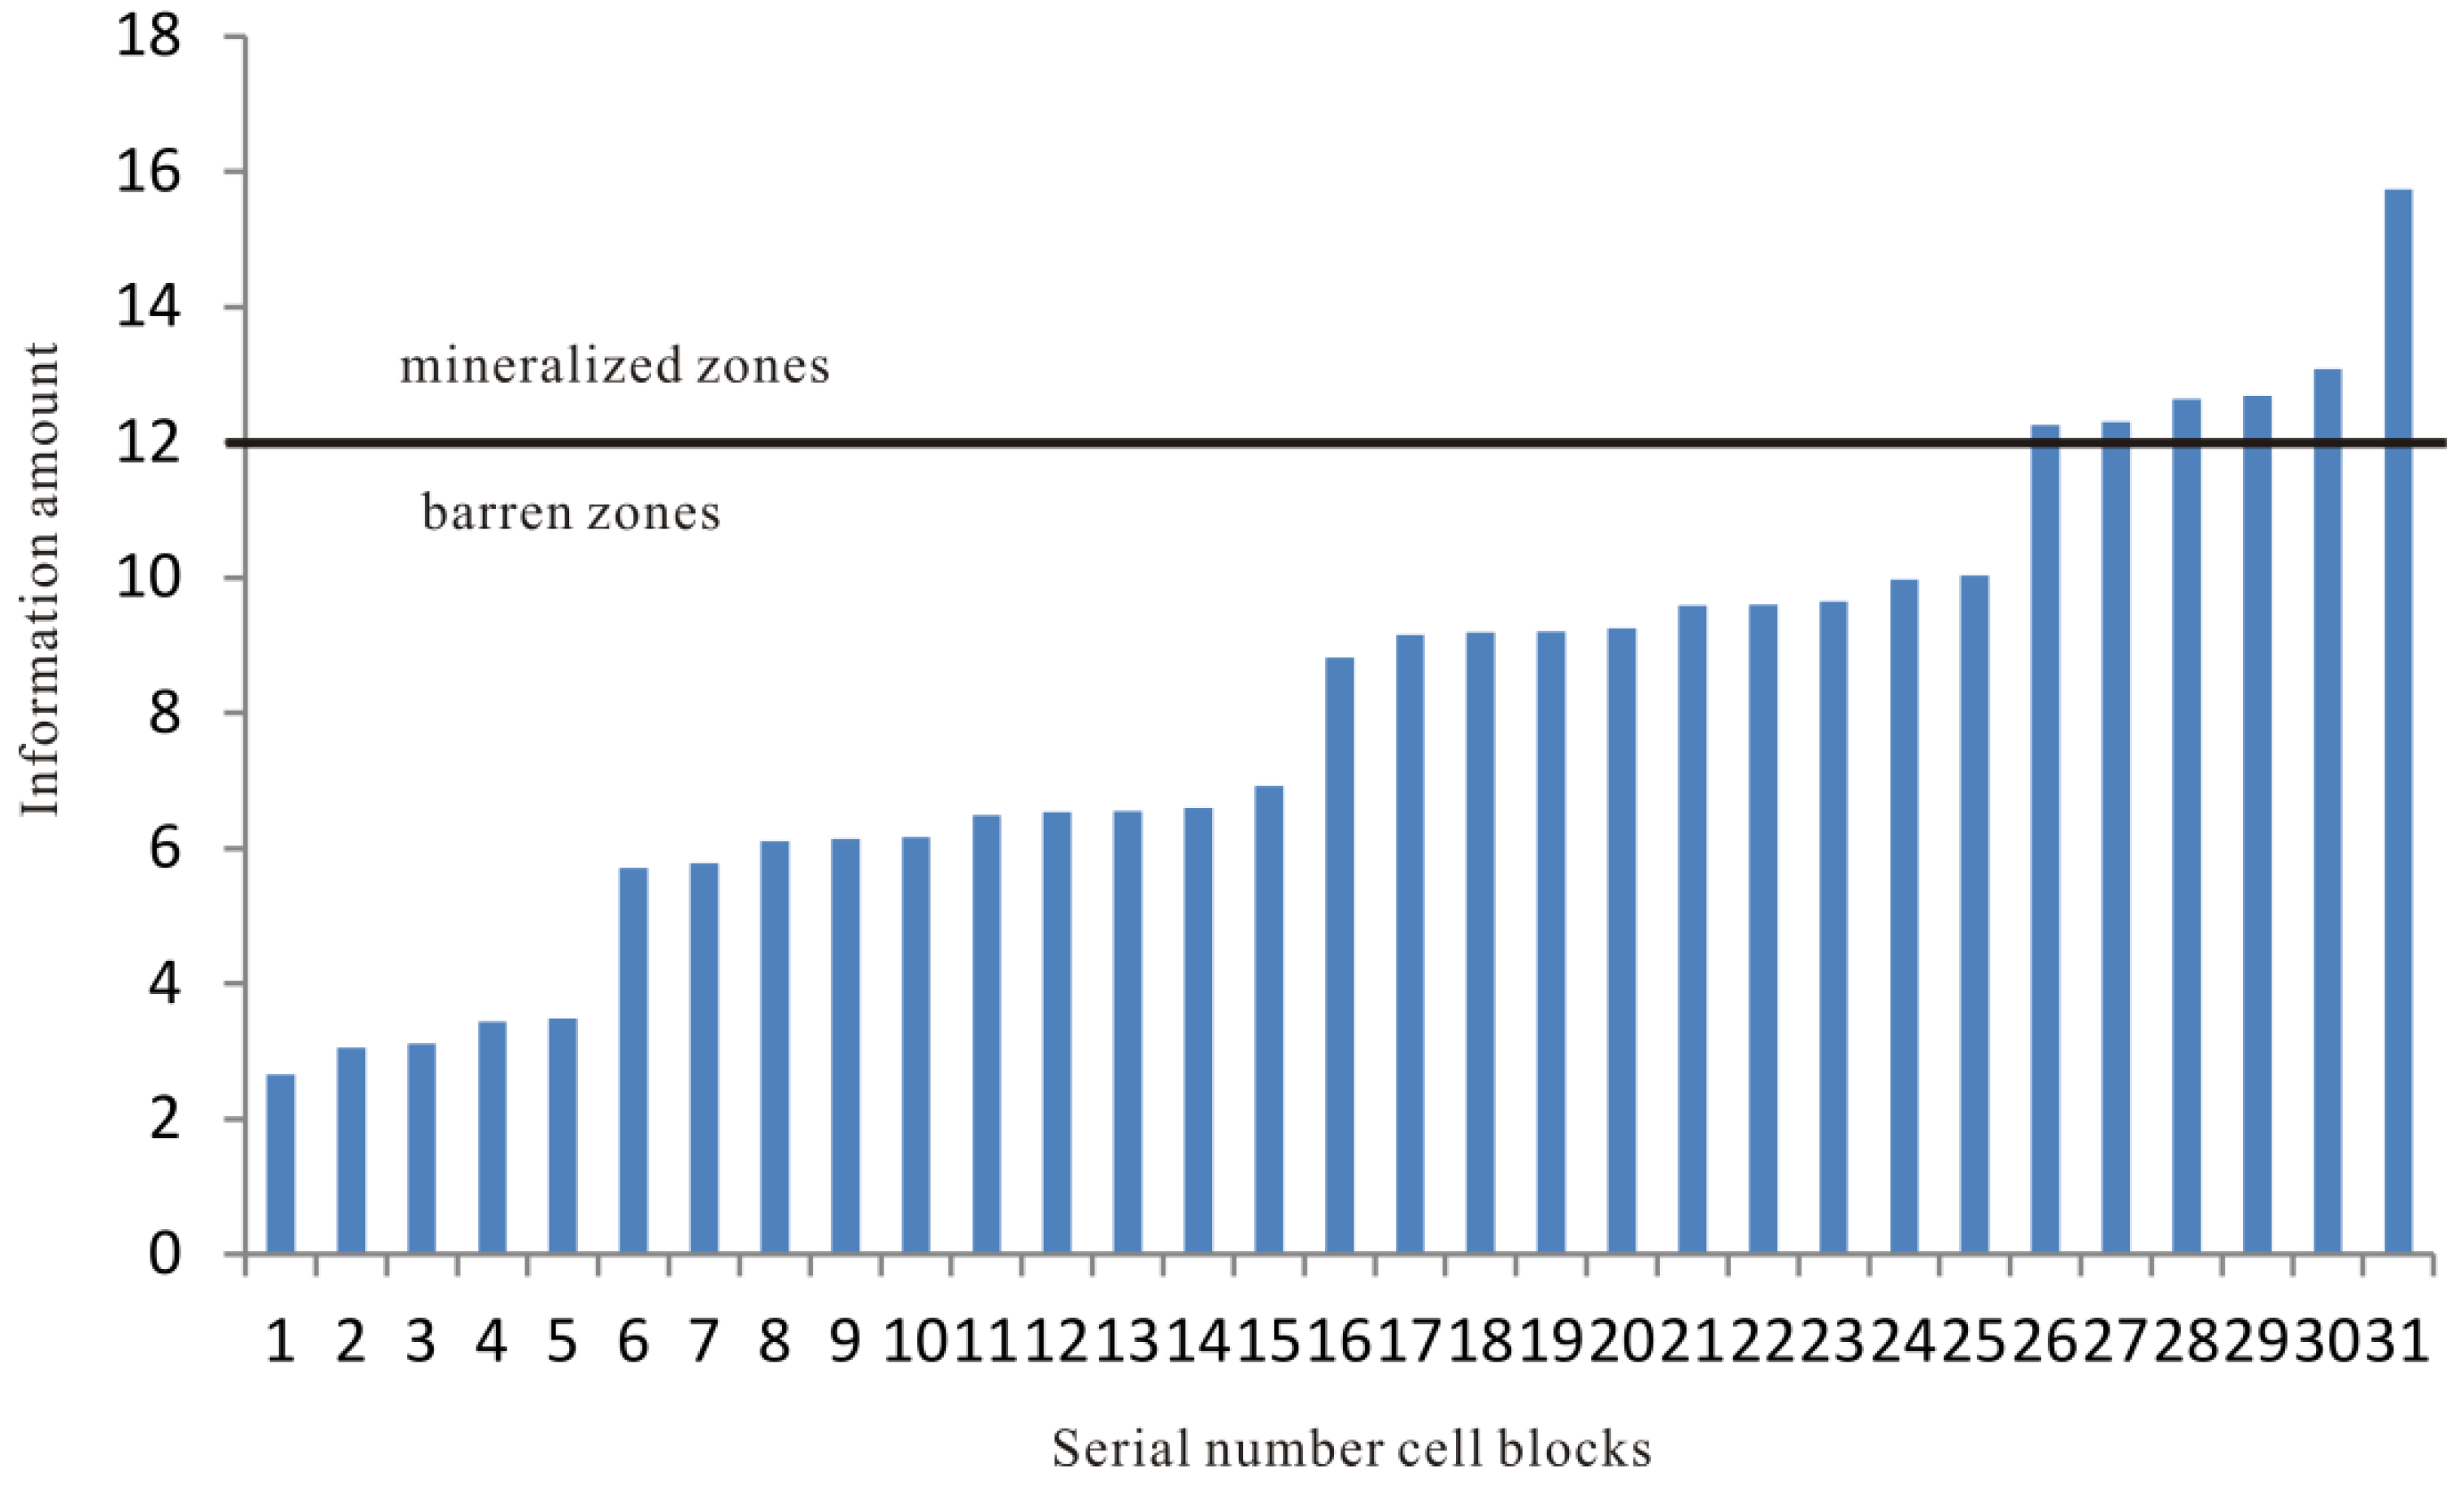
4.1.2. 3D Predictive Model and Statistics of Information Amounts

The deep prospecting predictive model of the Jiaojia fault (Table 1) was established based on the 3D geological model and the favorable metallogenic information extracted from the geological model. This predictive model involved eight characteristic variables for statistical analysis. They include Early Precambrian metamorphic rock series, Linglong granite, contact zone of Early Precambrian metamorphic rock series and Linglong granite, fault buffer zone, gentle part of a fault section with a steep-to-gentle transition of fault dip angle, changing rate of fault dip angle, equidistant distribution along fault strike and equidistant distribution along fault dip direction, respectively. Each characteristic variable was assigned 1 if it was true for a cell block and 0 otherwise. Based on the statistics of these characteristic variables of each cell block, the sum of the values of these characteristic variables of each cell block was calculated as the information amount for metallogenic prediction).

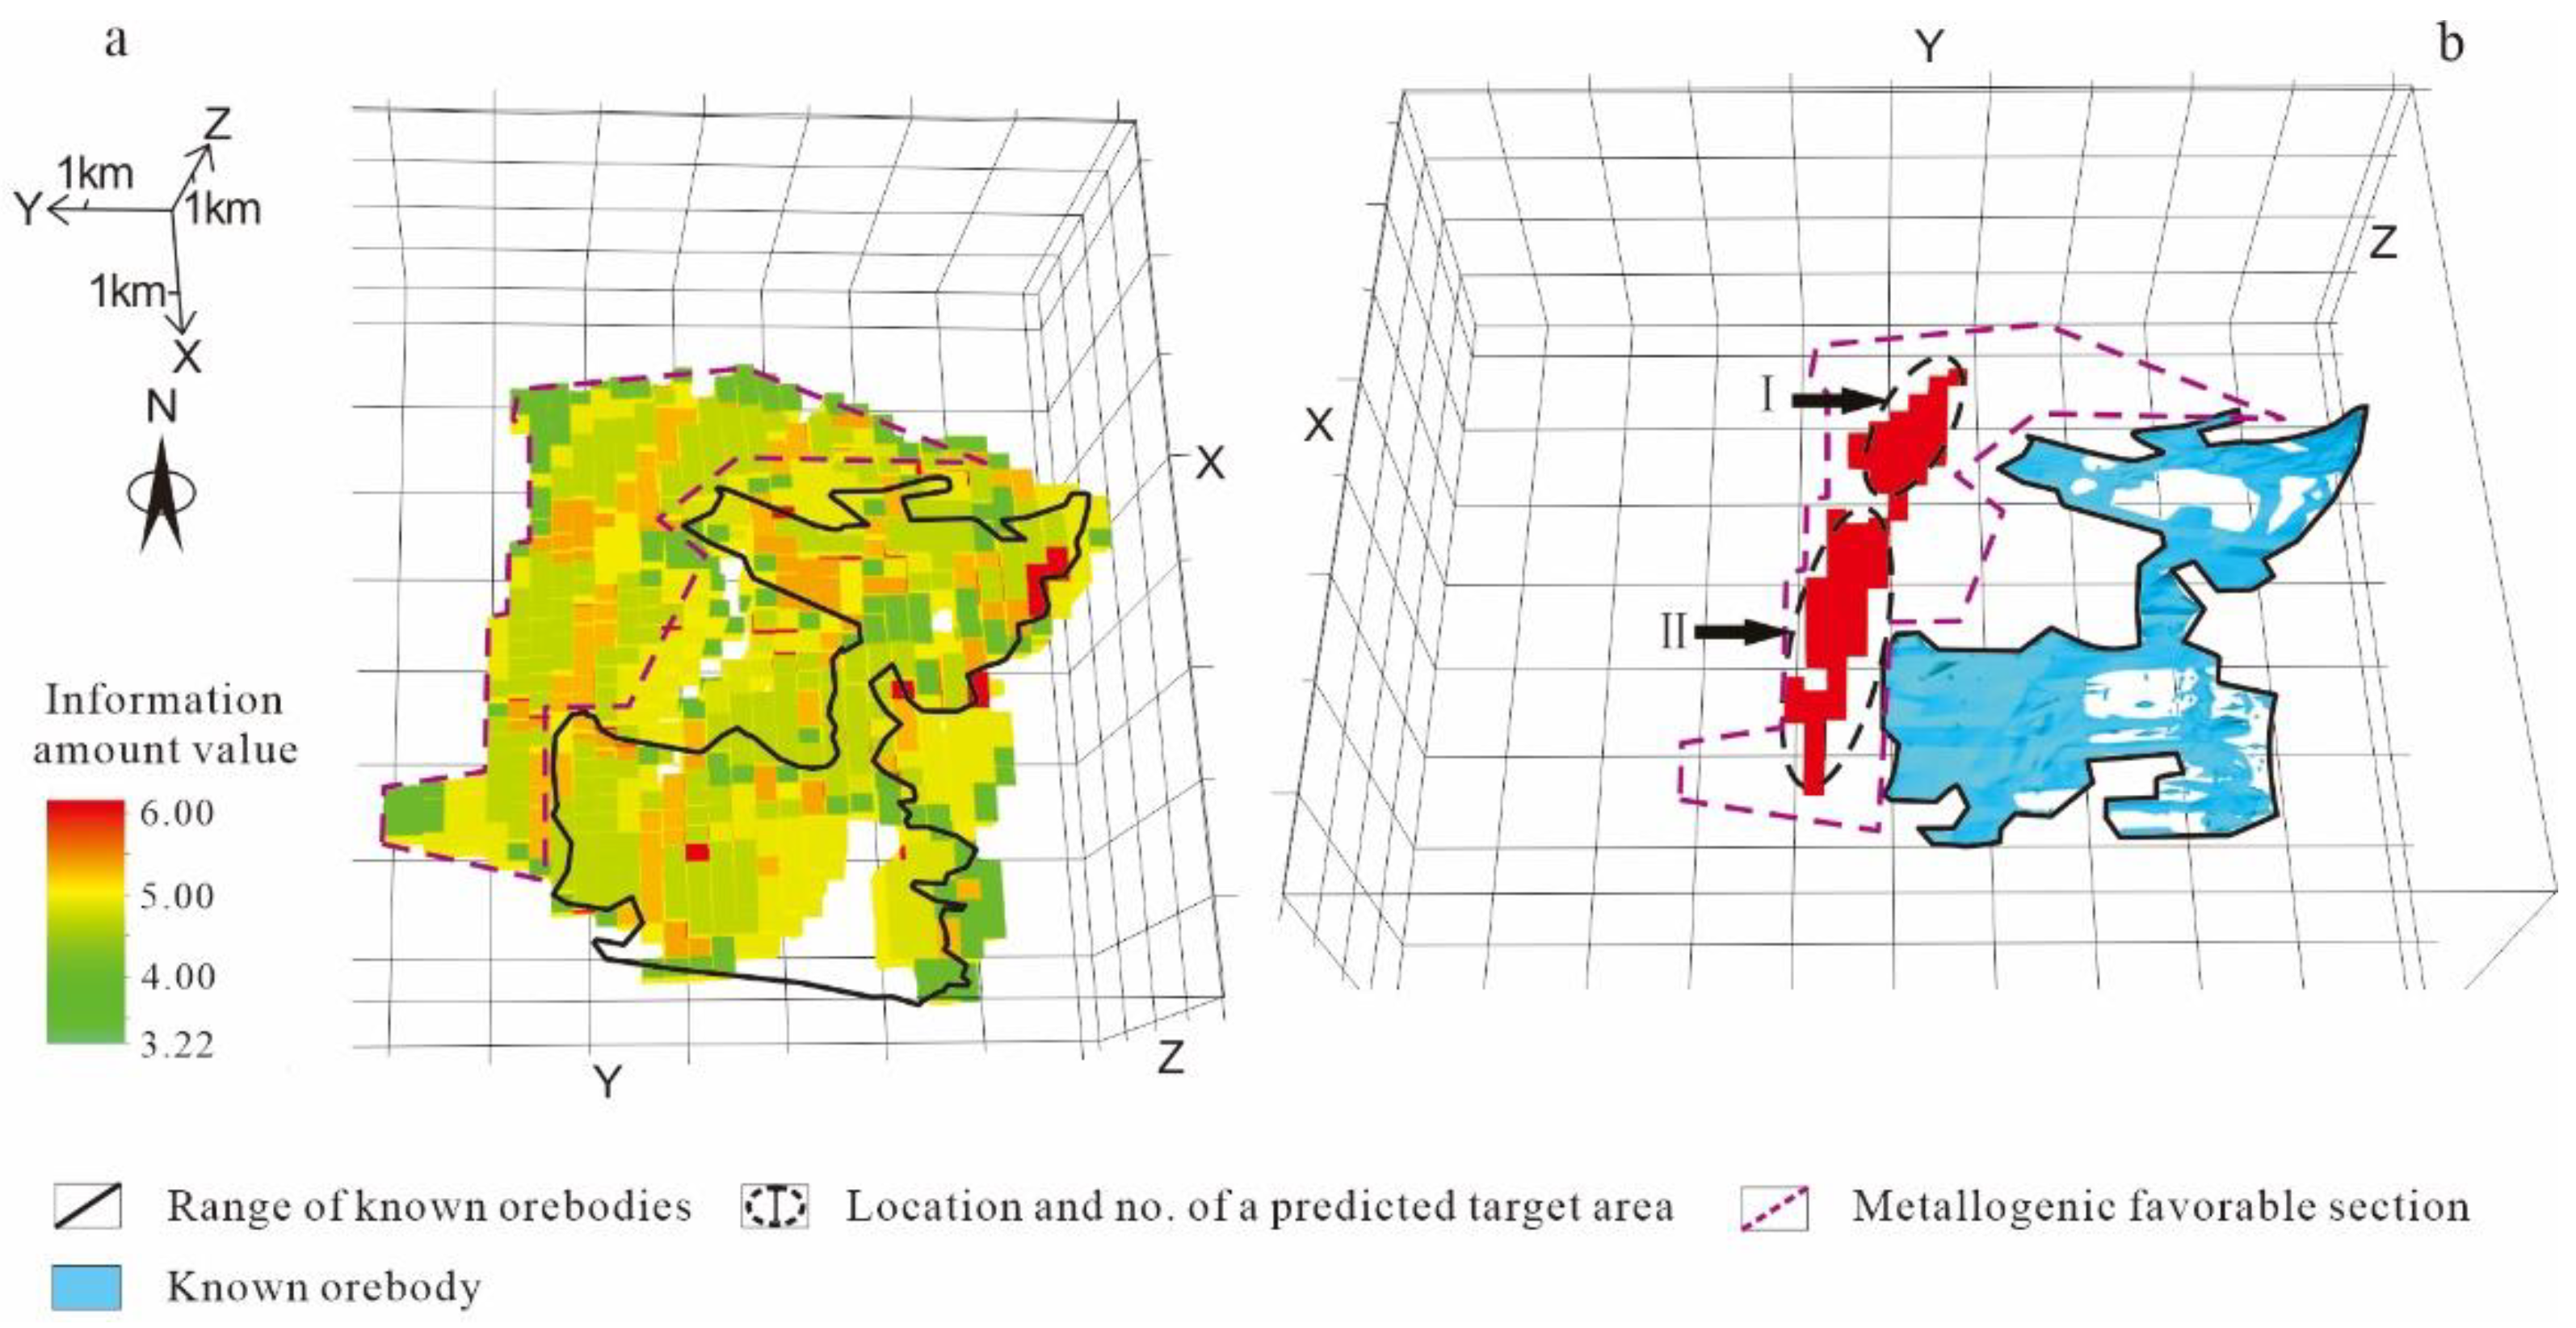
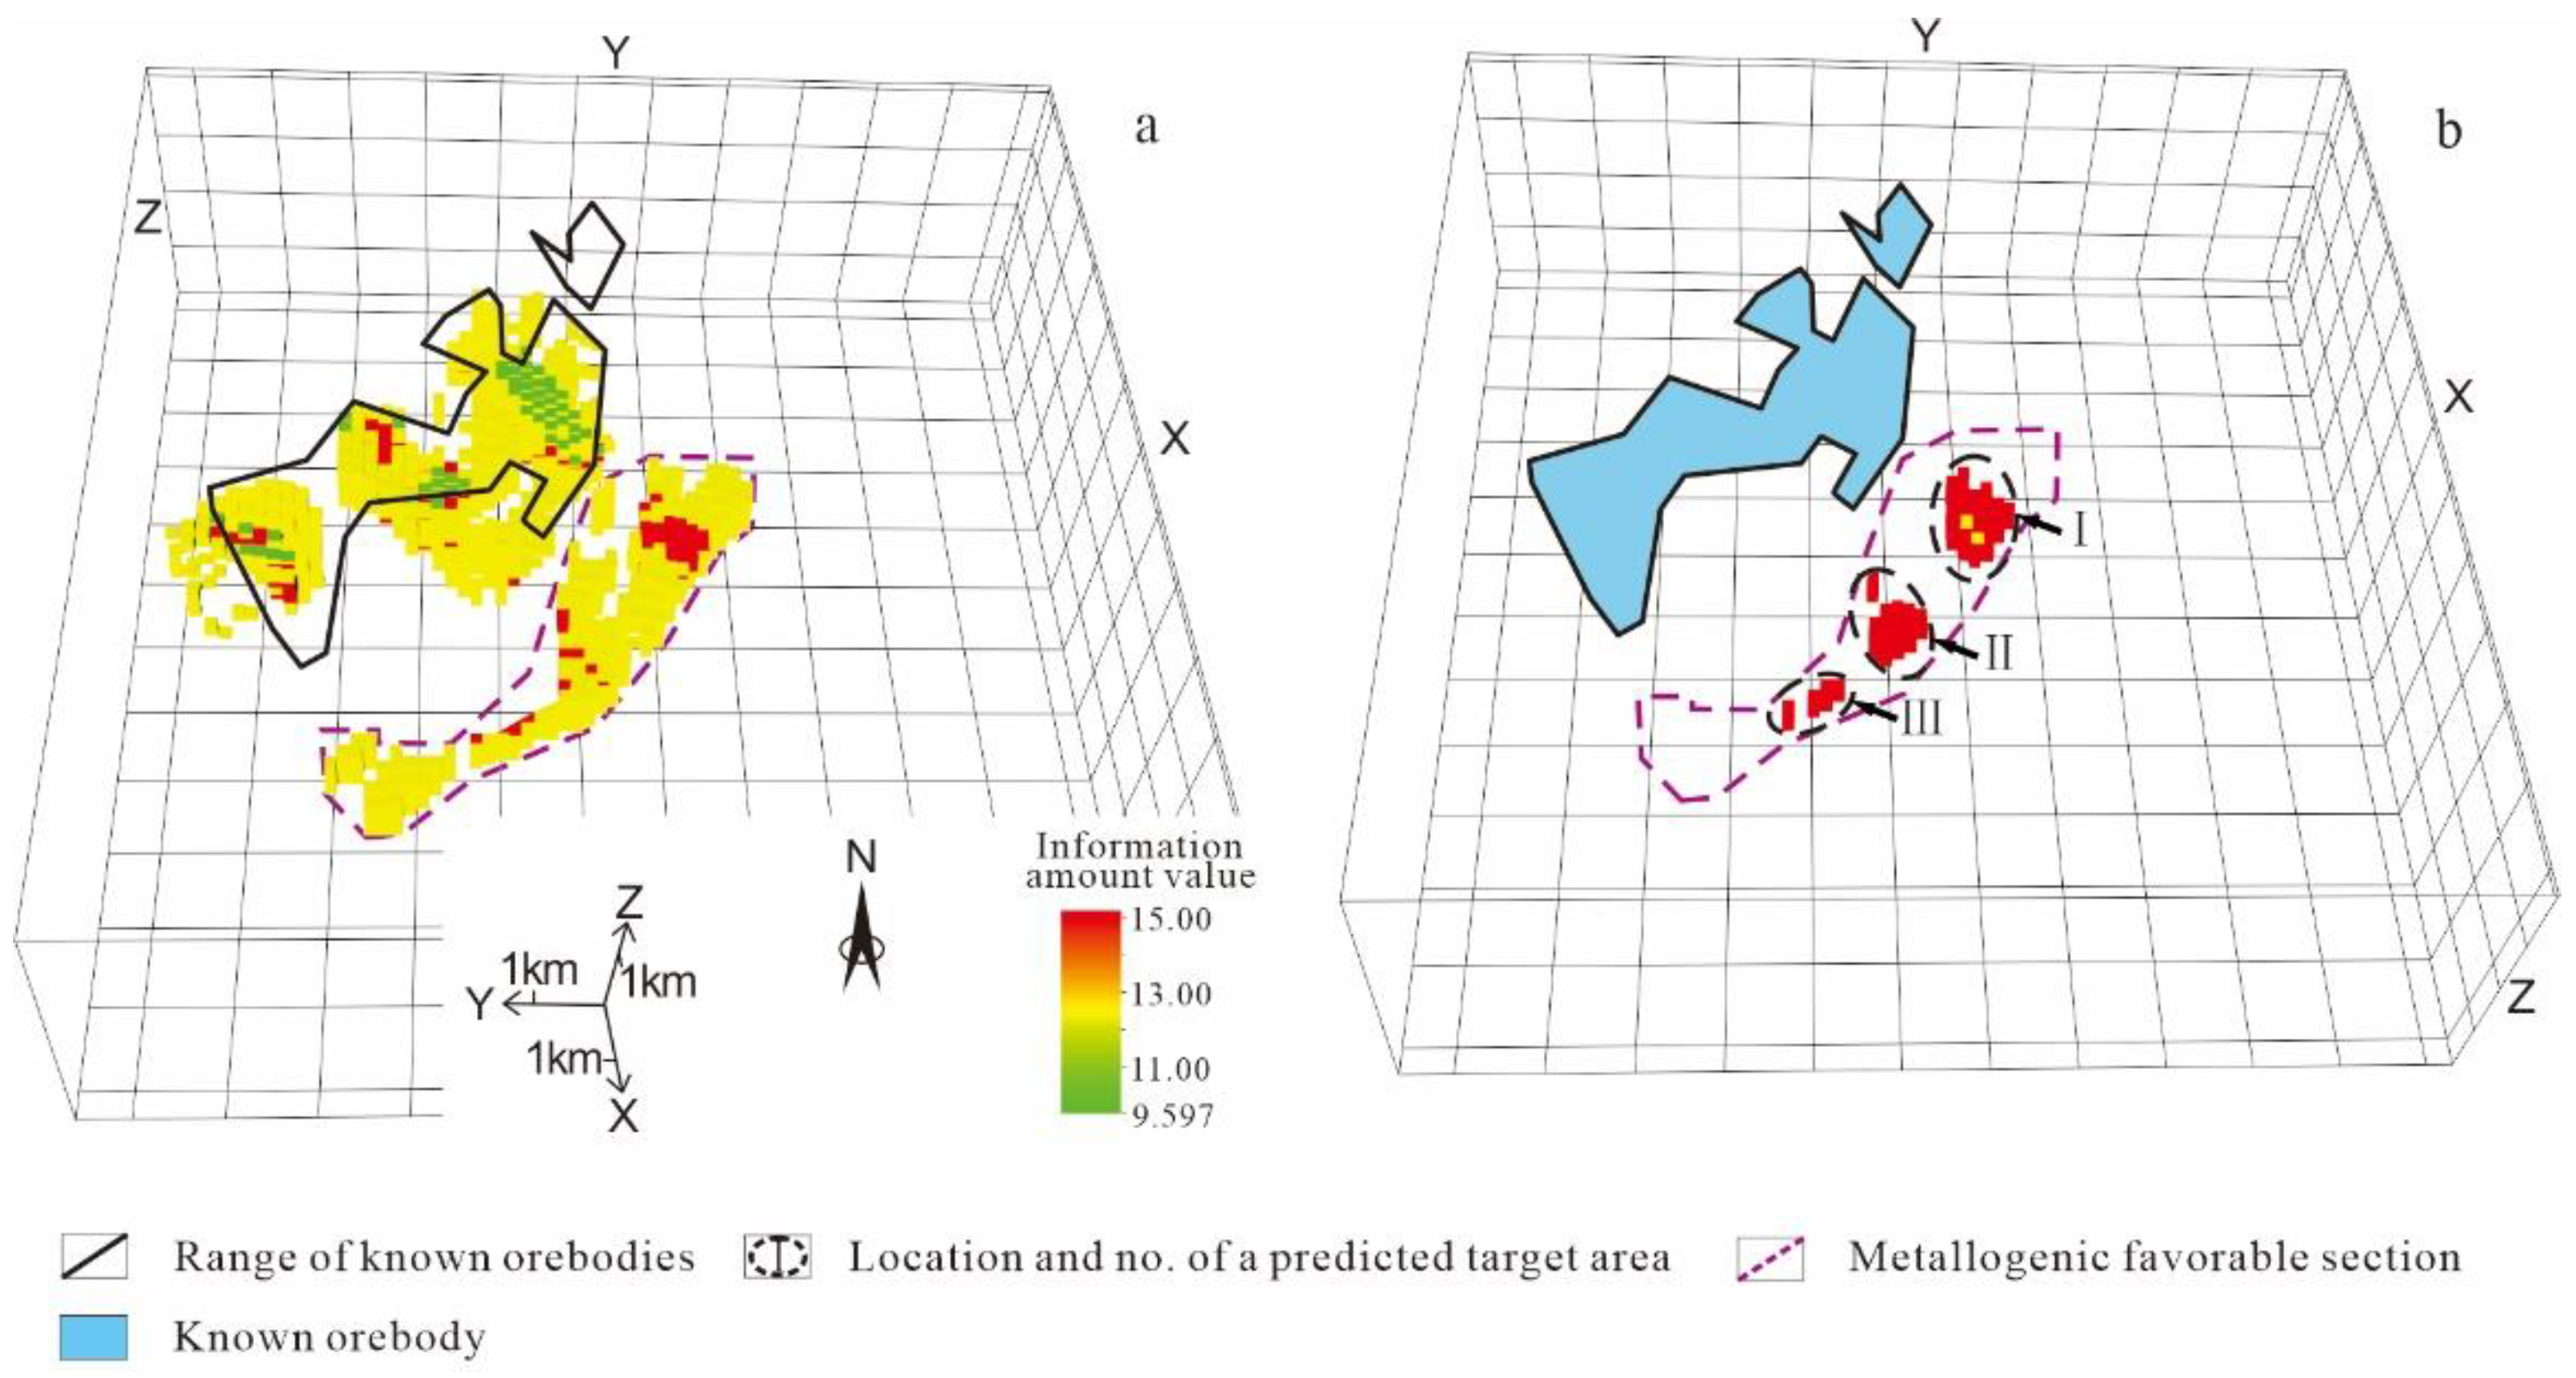
4.1.3. Predicted Results

All the eight characteristic variables were assessed using the information amount method, obtaining metallogenic information amounts, which were then assigned to block models. Cell blocks with high information amounts have a high mineralization probability. Table 2 shows the statistics of the proportion of various information amount intervals of cell blocks. The information amount scopes where the information amounts tend to stabilize and converge are favorable for mineralization. According to the stability analysis of the proportion statistics, the information amounts tended to stabilize and converge when they were ≥3.222 (Figure 5). Therefore, the information amount interval of ≥3.222 was the favorable interval for mineralization (Figure 6a). This information amount interval was divided into three grades: 3.222–4.184, 4.184–5.018, and ≥5.018. The information amount range of ≥5.018 was regarded as the range of predicted target areas based on the comparison with known mineralized zones which are generally greater than 4.5 (Figure 7). As a result, two predicted target areas were delineated in the Jiaojia fault (Figure 6b).
Target area I (Beijueyujia) is located in Beijueyujia Village, Jincheng Town, Laizhou City. It has an elevation of −2349–−1154 m and included 1201 predicted ore-hosting cell blocks. Target area II (Xiji) lies in Xiji Village, Jincheng Town, Laizhou City. It has an elevation range of −2490–−2000 m and includes 1588 predicted ore-hosting cell blocks.

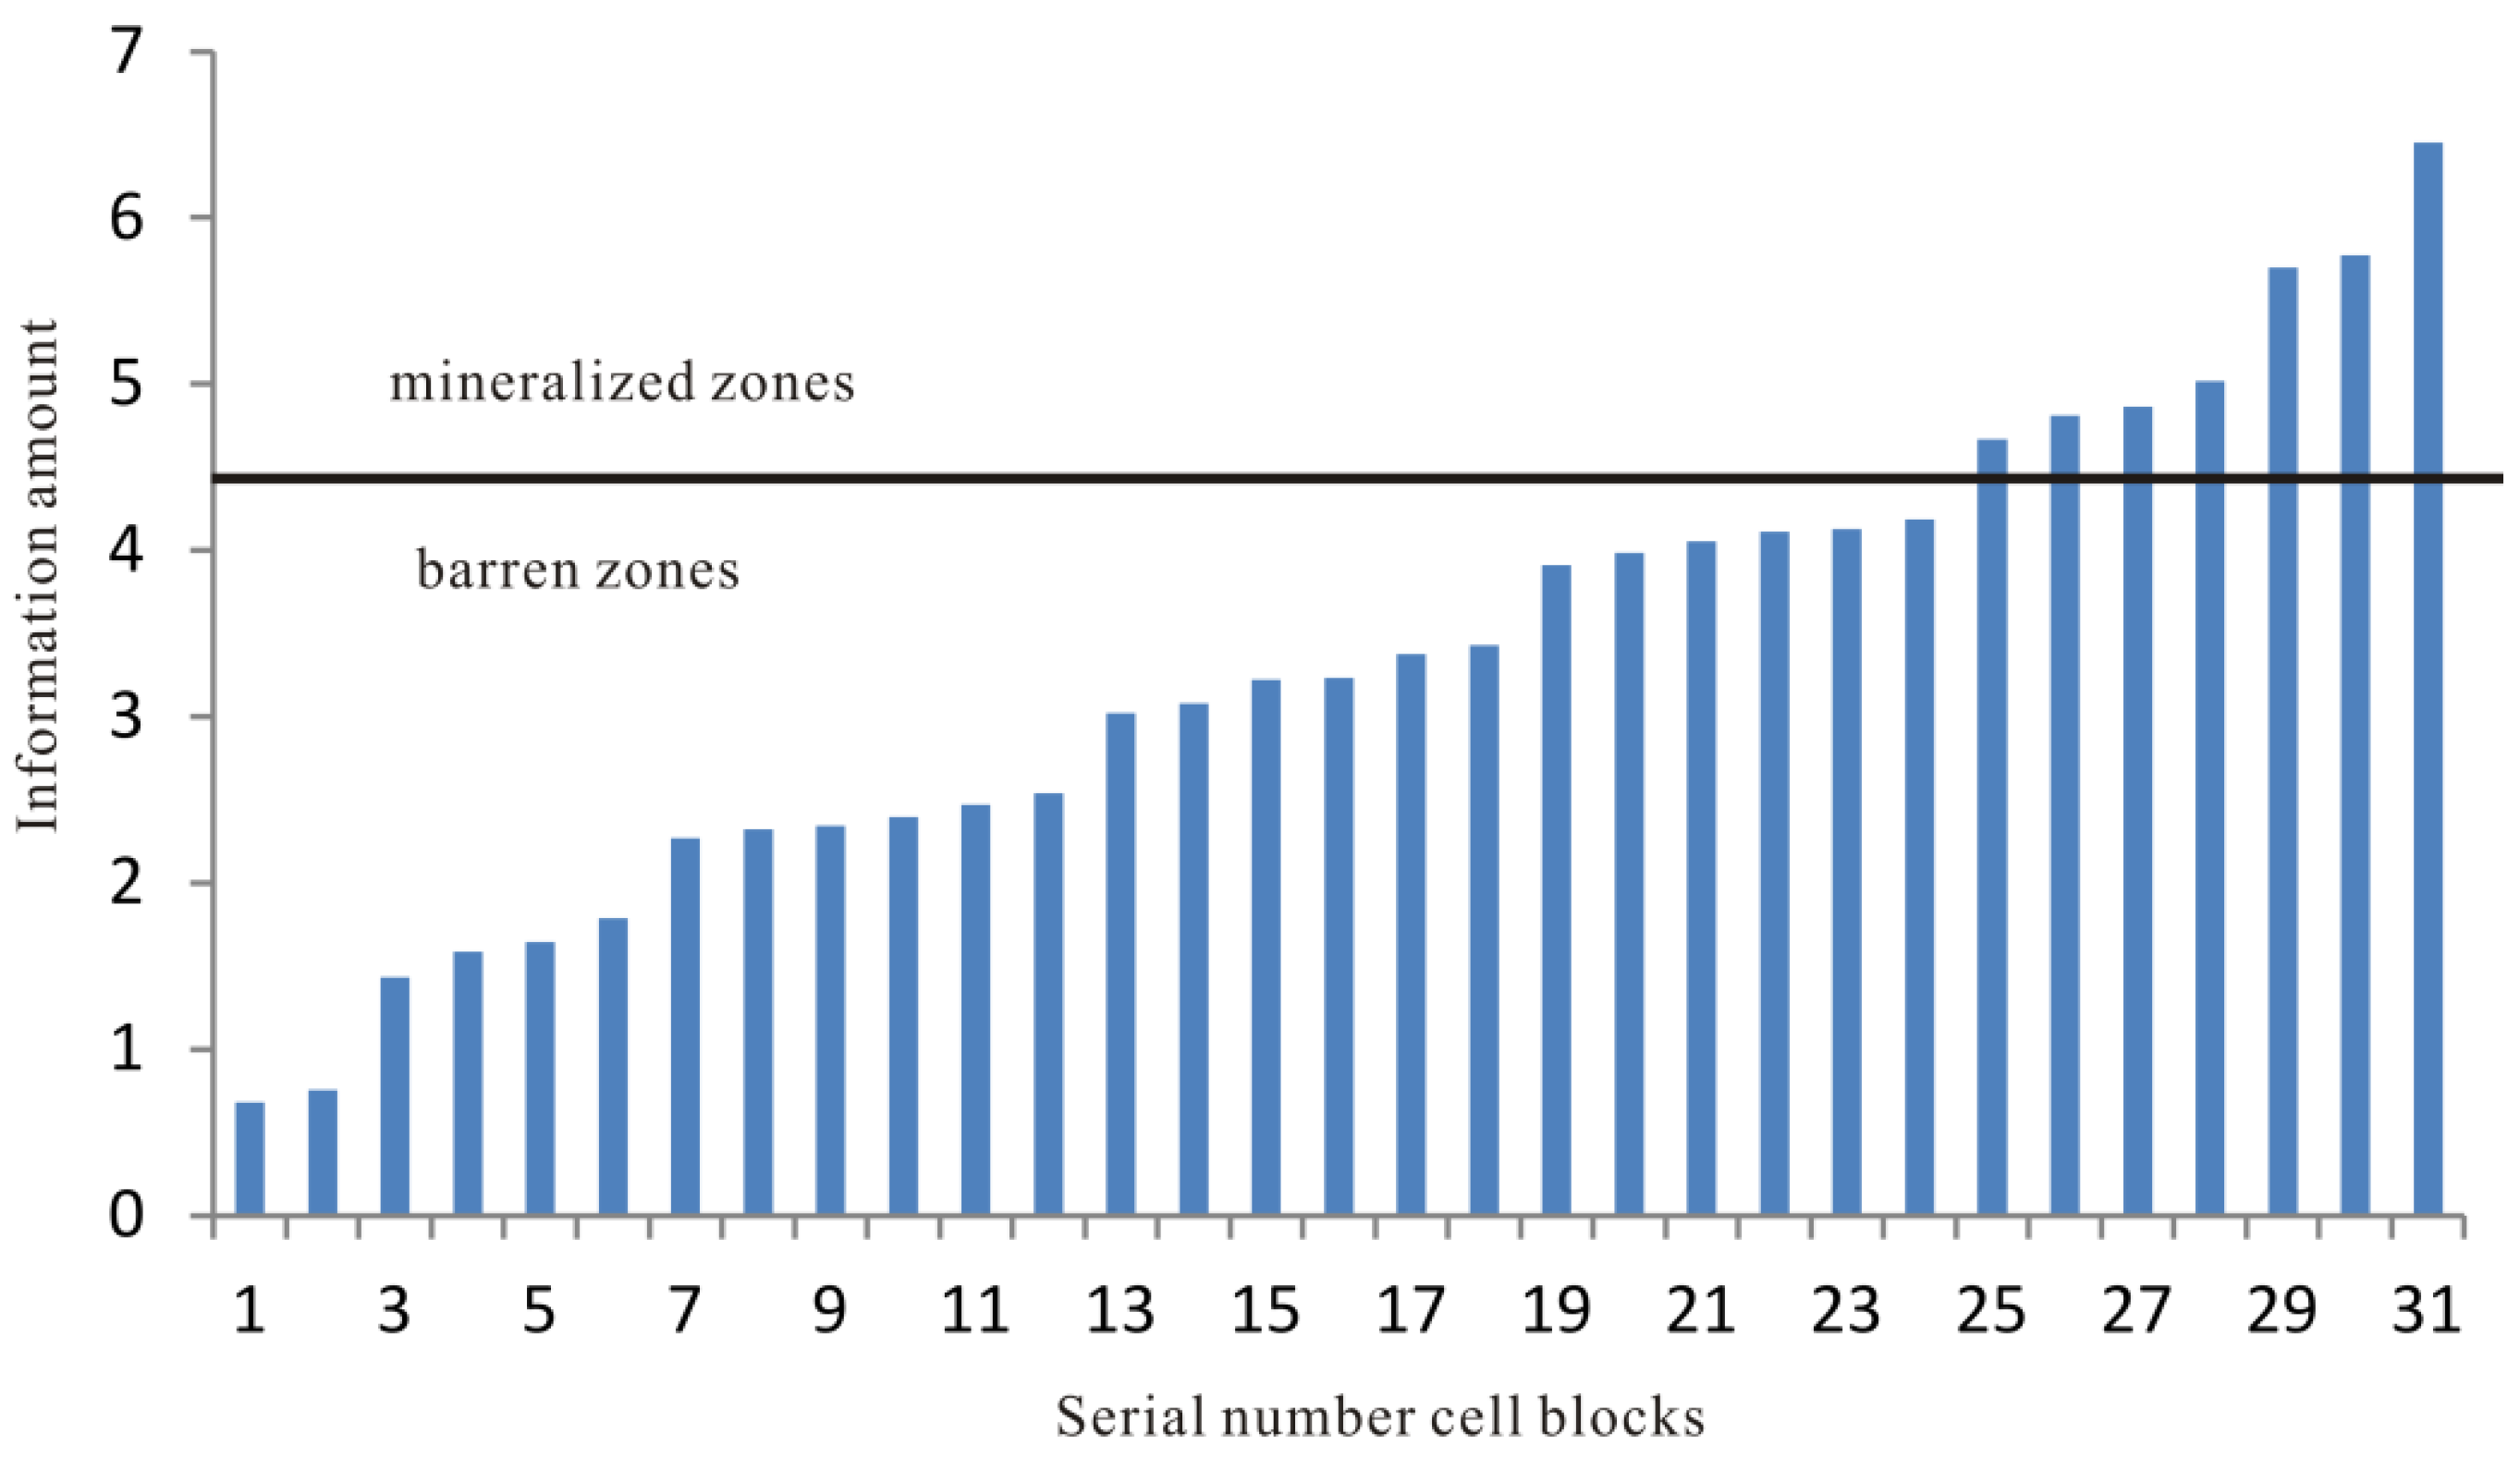
4.1.4. Probability and Verification of Prediction Results

The information amount used in this paper to delineate the predicted target area is determined according to the information amount of the known ore body. Statistics show that the information amount of the known ore body unit is generally ≥4.5. The above information content ≥3.222 is taken as the range of favorable metallogenic area, and the probability of ore occurrence is estimated to be more than 70%. Taking the information amount ≥5.018 as metallogenic target area, the theoretical probability of ore occurrence should be 100%. At present, the two predicted metallogenic target areas have been verified by deep drilling. For example, the 3266.06 m deep drilling in target area 2 revealed multi-layer industrial ore bodies at 2810–2854 m [61].

4.2. Deep Prospecting Target Areas in the Sanshandao Fault Zone

4.2.1. Determining Cell Blocks and Extracting Favorable Mineralization Information

The 3D geological model of the Sanshandao fault zone was divided into 1,747,886 cell blocks based on the line spacing × column spacing × layer spacing of 120 m × 120 m × 15 m. These cell blocks included 5323 ore-hosting cell blocks. Ore-hosting cell blocks were assigned 1, while other cell blocks were assigned 0. The favorable metallogenic information of this fault was extracted in the same manner as in the Jiaojia fault.

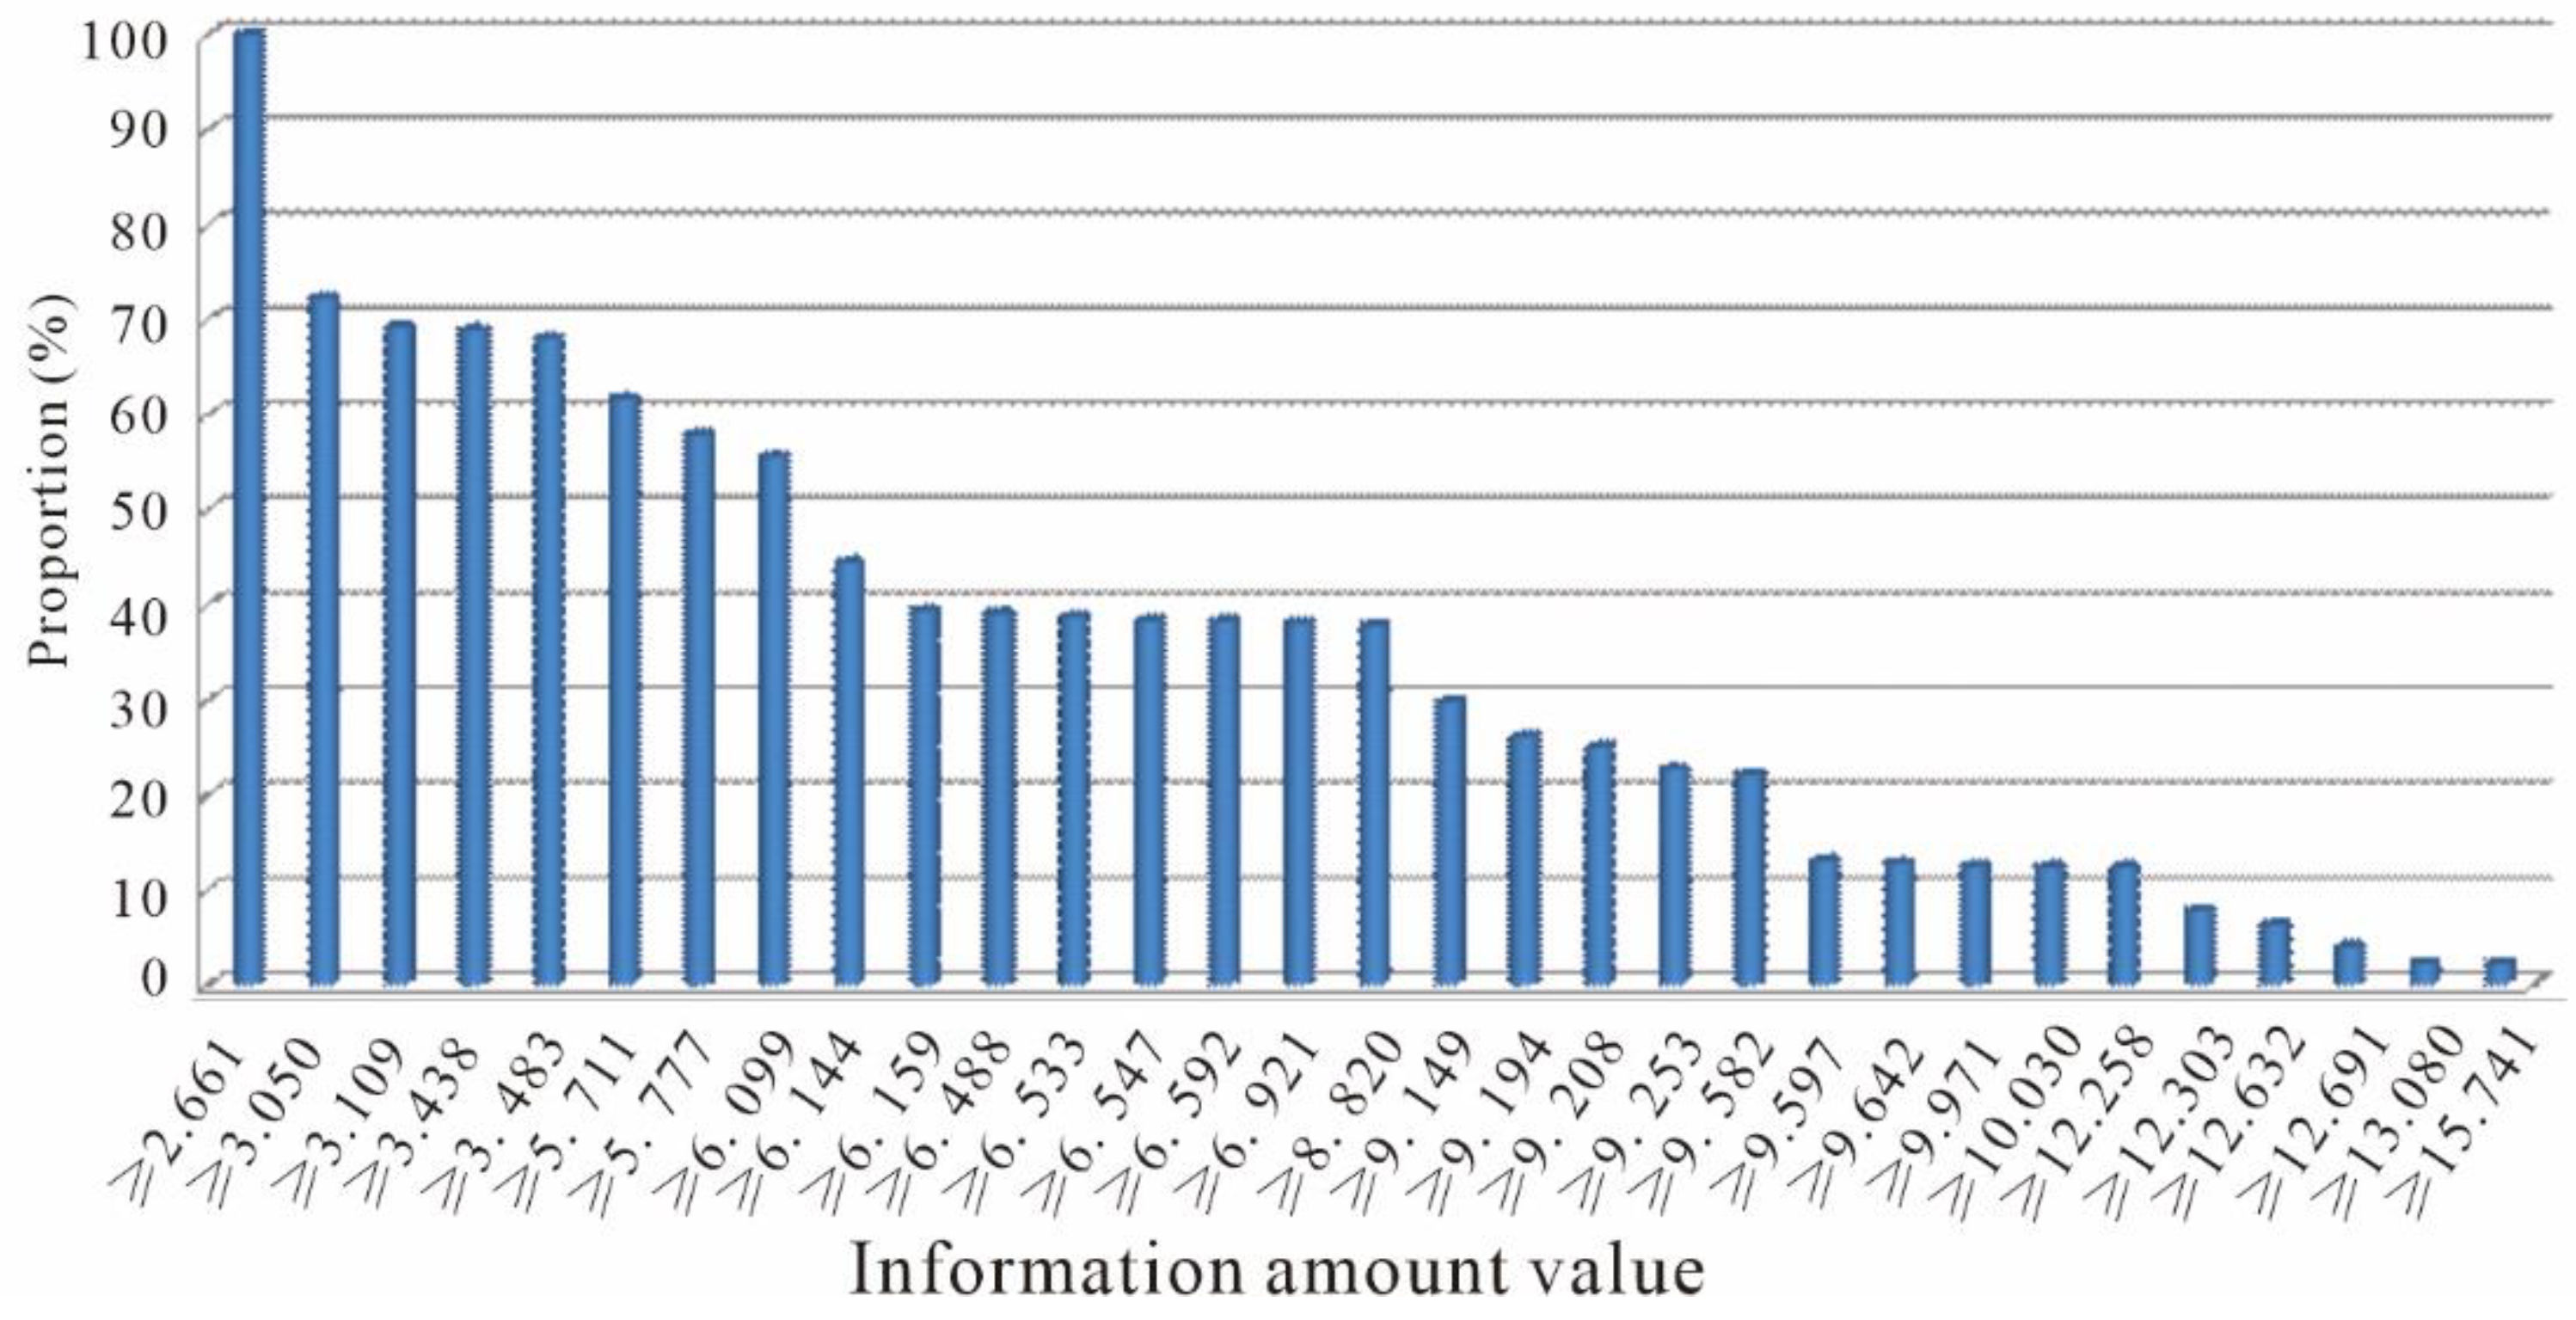
4.2.2. 3D Predictive Model and Statistics of Information Amounts

The deep prospecting predictive model of the Sanshandao fault (Table 3) was established based on the 3D geological model of deposits and the favorable metallogenic information extracted from the geological model. This predictive model involved eight characteristic variables for statistical analysis. Each characteristic variable was assigned 1 if it was true for a cell block and 0 otherwise. The statistics of these characteristic variables of each cell block were obtained (Table 4).

4.2.3. Predicted Results

The proportion of metallogenic information amount intervals of cell blocks (Table 5) in the 3D predictive model showed that the information amounts tended to stabilize and converge when they were ≥9.597 (Figure 8). Therefore, the information amount interval of ≥9.597 was favorable for mineralization (Figure 9a). This interval was divided into three grades: 9.597–12.303, 12.303–13.080, and ≥13.080. The information amount range of ≥13.080 was considered the range of predicted target areas based on the comparison with known mineralized zones which are generally greater than 12 (Figure 10). As a result, three predicted target areas were delineated (Figure 9b).
Target area I is located 3.8 km northeast (in the direction of 85°) of Sanshandao Town, Laizhou City (Figure 9b). It has an elevation of −3122–−2349 m and included 440 predicted ore-hosting cell blocks. Target area II is located 3.5 km southeast (in the direction of 100°) of Sanshandao Town, Laizhou City. It has an elevation range of −3121 to −2306 m and included 368 predicted ore-hosting cell blocks. Target area Ⅲ is located 3.0 km southeast (in the direction of 120°) of Sanshandao Town, Laizhou City. It has an elevation range of −2701 to −2291 m and includes 181 predicted ore-hosting cell blocks.

5. Prediction of Deep Resource Potential

5.1. Resource Potential of the Sanshandao Fault

5.1.1. Proved Resources

Based on the previous exploration results [6], the proved gold resources in the Sanshandao fault are analyzed in this paper. The Sanshandao fault has cumulative proved gold ore reserves of 333.65 Mt, gold metal reserves of 1,240,679 kg, an average orebody thickness of 7.93 m, and an average grade of 3.72 g/t. The first mineralization enrichment zone (elevation: −500–0 m) has gold ore reserves of 81.50 Mt, gold resources of 238,503 kg, an average orebody thickness of 8.10 m, and an average grade of 2.93 g/t. The second enrichment zone (elevation: −2000–−500 m) has gold ore reserves of 252.14 Mt, gold metal reserves of 1,002,176 kg, an average orebody thickness of 7.90 m, and an average grade of 3.98 g/t. The ratio of the resources of the second enrichment zone to those of the first enrichment zone is 4.20.

5.1.2. Predictive Parameters of Resources

Prediction range: The prediction range was determined by extrapolating the distribution range of identified deposits to deep parts. The distribution range of identified deposits in the Sanshandao fault was determined as follows. Its southern boundary was exploration line No. 171 on the southernmost side of the Xinli ore block and its northern boundary was exploration line No. 70 on the northernmost side of the sea-area ore block in the northern Sanshandao fault. Moreover, its western part was the outcrops of the Sanshandao fault, and its eastern part was the projection on the ground surface of the junction of the −2000 m elevation line and the deep part of the Sanshandao fault (Figure 11). The prediction range had the same southern, northern, and western boundaries as the distribution range of identified deposits, and its elevation was −5000–−2000 m.
Ore-bearing rates: the ore-bearing rates corresponding to the elevations of −500 to 0 m and −2000 to −500 m were calculated using the ratio of the proven resources to the projection area of the distribution range of identified deposits on the vertical longitudinal projection map (Figure 12, Table 6).

5.1.3. Resources Prediction

The area of the deep prediction areas at an elevation of −5000 to −2000 m was calculated based on the vertical longitudinal projection map. Subsequently, the gold resources in the deep prediction areas were estimated according to the ore-bearing rates at elevations of −500 to 0 m and −2000 to −500 m. The predicted gold resources of the deep prediction areas at an elevation of −5000 to −2000 m in the Sanshandao fault included approximately (375–560) Mt of ore reserves and 1100–2228 t of gold metal reserves (Figure 12, Table 7).

5.2. Resource Potential of the Jiaojia and Zhaoping Faults

The prediction range of the Jiaojia fault is as follows. Its southern boundary was the exploration line No. 408 on the southernmost side of the Qianchen ore block and its northern boundary was the exploration line No. 201 on the northernmost side of the Xincheng ore block. Its eastern and eastern parts were the outcrops of the Jiaojia fault and the production of the Jiaojia fault on the ground surface, respectively. Moreover, it had an elevation of −5000 to −2000 m.
For the purposes of this study, the Zhaoping fault was divided into two prediction sections: the northern section and the central-southern section. The prediction range of the Lingnan-Shuiwangzhuang gold concentration area in the northern Zhaoping fault is as follows. Its southern boundary was exploration line No. 9 of the Lingnan ore block and its northern boundary was exploration line No. 29 on the northernmost side of the Shuiwangzhuang ore block. Moreover, its western and eastern parts were the outcrops of the Zhaoping fault and the projection of the Zhaoping fault on the ground surface, respectively. The prediction range of the Dayin’gezhuang gold concentration area in the central-southern section of the Zhaoping fault is as follows. Its southern and northern boundaries were exploration lines No. 54 and No. 120 of the Dayin’gezhuang gold orefield, and its western and eastern parts were the outcrops of the Zhaoping fault and the projection of the Zhaoping fault on the ground surface, respectively. The prediction range of the Xiadian ore block concentration area in the central-southern section of the Zhaoping fault is as follows. Its southern boundary was exploration line No. 441 of the Xiadian ore block, and its northern boundary was exploration line No. 35 of the Daobeizhuangzi ore block. Moreover, its western and eastern parts were the outcrops of the Zhaoping fault and the projection of the outcrops on the ground surface, respectively. The elevation range of the prediction areas of the Zhaoping fault was −5000 to −2000 m. The proven resources and the parameters for resources prediction of Jiaojia and Zhaoping faults were determined using the same procedure as the Sanshandao fault zone. The predicted results are listed in Table 8.
In sum, for the metallogenetic belts of the Sanshandao, Jiaojia, and Zhaoping faults in the Jiaodong Peninsula, their predicted gold ore reserves and predicted gold metal reserves at an elevation of −5000 to −2000 m were approximately 1217–2237 × Mt and 3377–6490 t, respectively, and their total gold ore reserves and gold metal reserves at an elevation of −5000 m and above were approximately 2310–3330 × Mt and 7073–10,150 t, respectively. As the metallogenic conditions in the deep prediction area are different from those in the shallow area, the accuracy of the geophysical method will decrease with the increase in the depth, so the error of the prediction results is uncertain.
The above forecast data are only the predicted results of the deep parts of the main known gold deposits in the northwest Jiaodong Peninsula. In combination with the future prediction and prospecting of other areas in the Jiaodong Peninsula with great potential for deep prospecting, the total resources of gold deposits in the Jiaodong Peninsula will possibly double in quantity and increase from the current 5000 t to 10,000 t. Therefore, the Jiaodong gold concentration area is expected to become the world’s second largest gold metallogenic area.
At present, the exploration depths of identified gold deposits in the Jiaodong Peninsula are mostly less than 2000 m, with only a few exploratory boreholes reaching a depth of more than 3000 m [61,62]. For example, exploratory borehole ZK96-5 in the Xiling mining area in the northern Sanshandao fault has a final hole depth of 4006.17 m, making it the deepest borehole for gold exploration in China [62]. This borehole revealed a fractured alteration zone with a thickness of tens of meters at a depth of approximately 3500 m. Borehole K01 drilled in the deep part of the Jiaojia supergiant gold deposit in the middle part of the Jiaojia fault by the Shandong Institute of Geological Sciences has a depth of 3266.06 m. It revealed multi-layer industrial orebodies at a depth of 2810–2854 m [61]. Borehole K3401 drilled in the deep part of the Shuiwangzhuang mining area in the northern Zhaoping fault by the Shandong Provincial No. 6 Exploration Institute of Geology and Mineral Resources has a final hole depth of 3000.58 m. It revealed a fractured zone in the Jiuqujiangjia 208 fault at an elevation of approximately −2700 m. The sampling analysis indicated that the fractured zone has a maximum gold grade of nearly 7 g/t. The metallogenic information obtained from these deep exploratory boreholes is consistent with the predicted results of this study, indicating that the deep parts at an elevation of −2000 m and below have great potential for deep prospecting. In addition, geological and geophysical explorations show that the Jiaojia and Sanshandao faults’ dip angles gradually decrease towards their deep parts along their dip directions and that the two faults intersect at the elevation of approximately −4500 m [42,43,59]. These findings, combined with the comprehensive analysis of the evidence of denudation degree, metallogenic depth, deep drilling verification, and the extension of faults towards deep parts, have led to the conclusion that the Jiaojia and Sanshandao faults have favorable gold metallogenic conditions and enormous prospecting potential at an elevation of −4500 m and below.

6. Conclusions

  • Since deep-seated deposits cannot be predicted using conventional metallogenic predictive methods, it has become an important means of deep metallogenic prediction to establish a 3D geological model based on high-precision geophysical exploration and the drilling engineering in known areas. Through the dissection of the ore-controlling regularities of gold deposits in the Jiaodong Peninsula, this study proposed a method for predicting deep prospecting target areas based on a stepped metallogenic model and a method for predicting the deep resource potential of gold deposits based on the shallow resources of ore-controlling faults;
  • The information amounts of eight characteristic variables, including Early Precambrian metamorphic rock series, Linglong granite, contact zone of Early Precambrian metamorphic rock series and Linglong granite, fault buffer zone, gentle part of a fault section with a steep-to-gentle transition of fault dip angle, changing rate of fault dip angle, equidistant distribution along fault strike and equidistant distribution along fault dip direction, were extracted from the 3D geological models of main gold concentration areas. Using the statistics of the information amounts, a total of five deep prospecting target areas in the Jiaojia and Sanshandao faults were predicted;
  • Based on the proven gold resources at an elevation of −2000 m and above, the total gold resources at an elevation of −5000 to −2000 m in the Sanshandao, Jiaojia, and Zhaoping ore-controlling faults were predicted to be approximately 3377–6490 t of Au. Therefore, it is very likely that the total gold resources in the Jiaodong Peninsula are expected to exceed 10,000 t. However, due to the high ground temperature and pressure environment of deep resources, future mining will face great challenges.

Author Contributions

M.S. conceived and designed the research ideas; S.L., H.L. and C.H. participated in the field investigation; J.F., Z.Y., L.Z. and X.L. performed the data processing, and M.S., J.Z., S.L., B.W. and G.W. reviewed and edited the draft. All the data were obtained from previous work performed by the project team. All authors have read and agreed to the published version of the manuscript.

Funding

This study was financially supported by the National Natural Science Foundation of China-Shandong Joint Fund Project (U2006201).

Institutional Review Board Statement

Not applicable.

Informed Consent Statement

Not applicable.

Data Availability Statement

Not applicable.

Acknowledgments

The authors are grateful for the constructive comments by the anonymous reviewers.

Conflicts of Interest

The authors declare no conflict of interest.

References

  1. Zhao, P.D.; Chi, S.D.; Li, Z.D.; Cao, X.Z. Theory and Methods of Mineral Exploration; China University of Geosciences Press: Wuhan, China, 2006; pp. 1–334. (In Chinese) [Google Scholar]
  2. Zhu, Y.S. Introduction to the Methodology of Mineral Resource Evaluation; Geological Publishing House: Beijing, China, 1984. (In Chinese) [Google Scholar]
  3. Wang, S.C.; Liu, Y.Q.; YI, P.H.; Zhang, Y.Q. Multipurpose Information Metallogenic Prognosis of Gold Deposits and Gold Mineralization Area in Shandong Province; Geological Publishing House: Beijing, China, 2003; pp. 1–245. (In Chinese) [Google Scholar]
  4. Li, S.X.; Liu, C.C.; AN, Y.H.; Wang, W.C.; Huang, T.L.; Yang, C.H. Geology of Gold Deposits in Shandong Peninsula; Geological Publishing House: Beijing, China, 2007; pp. 1–423. (In Chinese) [Google Scholar]
  5. Ye, T.Z.; Lv, Z.C.; Pang, Z.S. Prospecting Prognosis Theory and Method of Exploration Area; Geological Publishing House: Beijing, China, 2015; pp. 1–703. (In Chinese) [Google Scholar]
  6. Song, M.C.; Ding, Z.J.; Zhang, J.J.; Song, Y.X.; Bo, J.W.; Wang, Y.Q.; Liu, H.B.; Li, S.Y.; Li, J.; Li, R.X.; et al. Geology and mineralization of the Sanshandao supergiant gold deposit (1200 t) in the Jiaodong Peninsula, China: A review. China Geol. 2021, 4, 686–719. [Google Scholar] [CrossRef]
  7. Lü, Q.T.; Qi, G.; Yan, J.Y. 3D geological model of Shizishan ore field constrained by gravity and magmatic interactive modeling: A case history. Geophysics 2013, 78, B25–B35. [Google Scholar] [CrossRef]
  8. Malehmir, A.; Tryggvason, A.; Juhlin, C.; Rodriguez-Tablante, J.; Weihed, P. Seismic imaging and potential field modeling to delineate structures hosting VHMS deposits in the Skellefte Ore District, Northern Sweden. Tectonophysics 2006, 426, 319–334. [Google Scholar] [CrossRef]
  9. Malehmir, A.; Tryggvason, A.; Lickorish, H.; Weihed, P. Regional structural profiles in the western part of the Palaeoproterozoic Skellefte Ore District, northern Sweden. Precambrian Res. 2007, 159, 1–18. [Google Scholar] [CrossRef]
  10. Wang, G.W.; Huang, L. 3D geological modeling for mineral resource assessment of the Tongshan Cu deposit, Heilongjiang Province, China. Geosci. Front. 2012, 3, 483–491. [Google Scholar] [CrossRef] [Green Version]
  11. Wang, G.W.; Li, R.X.; Carranza, J.M.E.; Zhang, S.T.; Yan, C.H.; Zhu, Y.Y.; Qu, J.N.; Hong, D.M.; Song, Y.W.; Han, J.W.; et al. 3D geological modeling for prediction of subsurface Mo targets in the Luanchuan district, China. Ore Geol. Rev. 2015, 71, 592–610. [Google Scholar] [CrossRef]
  12. Rabeaut, O.; Legault, M.; Cheilletz, A.; Jébrak, M.; Royer, J.J.; Cheng, L.Z. Gold potential of a Hidden Archean fault zone: The case of the Cadillac–Larder lake fault. Explor. Min. Geol. 2010, 19, 99–116. [Google Scholar] [CrossRef]
  13. Royer, J.J.; Cheilletz, A.; Rabeau, O.; Jébrak, L.Z. Is deposit location predictable? Example of the orogenic gold deposits in the Abitibi Province. In Proceedings of the 11th Biennial SGA Meeting, Antofagasta, Chile, 26–29 September 2011. 3p. [Google Scholar]
  14. Rabeau, O.; Royer, J.J.; Jébrak, M.; Cheilletz, A. Log-uniform distribution of gold deposits along major Archean fault zones. Miner. Depos. 2013, 48, 817–824. [Google Scholar] [CrossRef]
  15. Farahbakhsh, E.; Hezarkhani, A.; Eslamkish, T.; Bahroudi, A.; Chandra, R. Three-dimensional weights of evidence modeling of a deep-seated porphyry Cu deposit. Geochem. Explor. Environ. Anal. 2020, 20, 480–495. [Google Scholar] [CrossRef]
  16. Goldfarb, R.J.; Groves, D.I.; Gardoll, S. Orogenic gold and geological time: A global synthesis. Ore Geol. Rev. 2001, 18, 1–75. [Google Scholar] [CrossRef]
  17. Sibson, R.H.; Scott, J. Stress/fault controls on the containment and release of overpressured fluids: Examples from gold-quartz vein systems in Juneau, Alaska; Victoria, Australia and Otago, New Zealand. Ore Geol. Rev. 1998, 13, 293–306. [Google Scholar] [CrossRef]
  18. Tripp, G.I.; Vearncombe, J.R. Fault/fracture density and mineralization: A contouring method for targeting in gold exploration. J. Struct. Geol. 2004, 26, 1087–1108. [Google Scholar] [CrossRef]
  19. Mejia-Herrera, P.; Royer, J.J.; Caumon, G.; Cheilletz, A. Curvature attribute from surface-restoration as predictor variable in Kupferschiefer copper potentials: An example from the Fore-Sudetic region. Nat. Resour. Res. 2014, 24, 275–290. [Google Scholar] [CrossRef]
  20. Kusky, T.M.; Polat, A.; Windley, B.F.; Burke, K.C.; Dewey, J.F.; Kidd, W.S.F.; Maruyama, S.; Wang, J.P.; Deng, H.; Wang, Z.S.; et al. Insights into the tectonic evolution of the North China Craton through comparative tectonic analysis: A record of outward growth of Precambrian continents. Earth Sci. Rev. 2016, 162, 387–432. [Google Scholar] [CrossRef] [Green Version]
  21. Li, S.Z.; Zhao, G.C.; Santosh, M.; Liu, X.; Dai, L.M.; Suo, Y.H.; Tam, P.Y.; Song, M.C.; Wang, P.C. Paleoproterozoic structural evolution of the southern segment of the Jiao-Liao-Ji Belt, North China Craton. Precambrian Res. 2012, 200–203, 59–73. [Google Scholar] [CrossRef]
  22. Wang, L.; Kusky, T.M.; Polat, A.; Wang, S.; Jiang, X.; Zong, K.; Wang, J.; Deng, H.; Fu, J. Partial melting of deeply subducted eclogite from the Sulu orogen in China. Nat. Commun. 2014, 5, 5604. [Google Scholar] [CrossRef] [Green Version]
  23. Zhou, J.B.; Han, W.; Song, M.C.; Li, L. Zircon U-Pb ages of the cetaceous sedimentary rocks in the Laiyang Basin, eastern China and their tectonic implications. J. Asian Earth Sci. 2020, 194, 103965. [Google Scholar] [CrossRef]
  24. Yang, K.F.; Fan, H.R.; Santosh, M. Reactivation of the Archean Lower Crust: Implications for Zircon Geochronology, Elemental and Sr–Nd–Hf Isotopic Geochemistry of Late Mesozoic Granitoids from Northwestern Jiaodong Terrane, the North China Craton. Lithos 2012, 146–147, 112–127. [Google Scholar] [CrossRef]
  25. Zhao, R.; Wang, Q.F.; Deng, J.; Santosh, M.; Liu, X.F.; Cheng, H.Y. Late Mesozoic magmatism and sedimentation in the Jiaodong Peninsula: New constraints on lithospheric thinning of the North China Craton. Lithos 2018, 322, 312–324. [Google Scholar] [CrossRef]
  26. Charles, N.; Augier, R.; Gumiaux, C.; Monié, P.; Chen, Y.; Faure, M.; Zhu, R.X. Timing, duration and role of magmatism in wide rift systems: Insights from the Jiaodong Peninsula (China, East Asia). Gondwana Res. 2013, 24, 412–428. [Google Scholar] [CrossRef] [Green Version]
  27. Goss, C.S.; Wilde, S.A.; Wu, F.Y.; Yang, J. The age, isotopic signature and significance of the youngest Mesozoic granitoids in the Jiaodong Terrene, Shandong Province, North China Craton. Lithos 2010, 120, 309–326. [Google Scholar] [CrossRef]
  28. Huang, X.L.; He, P.L.; Wang, X.; Zhong, J.W.; Xu, Y.G. Lateral variation in oxygen fugacity and halogen contents in early Cretaceous magmas in Jiaodong area, East China: Implication for triggers of the destruction of the North China Craton. Lithos 2016, 248–251, 478–492. [Google Scholar] [CrossRef] [Green Version]
  29. Tang, H.Y.; Zheng, J.P.; Yu, C.M.; Ping, X.Q.; Ren, H.W. Multistage crust-mantle interactions during the destruction of the North China Craton: Age and composition of the Early Cretaceous intrusions in the Jiaodong Peninsula. Lithos 2014, 190–191, 52–70. [Google Scholar] [CrossRef]
  30. Wang, L.G.; Qiu, Y.M.; McNaugmton, N.J. Constraints on crust evolution and gold metallogeny in the northwestern Jiaodong Peninsula, China, from SHRIMP U-Pb zircon studies of granitoids. Ore Geol. Rev. 1998, 13, 275–291. [Google Scholar] [CrossRef]
  31. Yan, Q.S.; Metcalfe, I.; Shi, X.F.; Zhang, P.; Li, F. Early Cretaceous granitic rocks from the southern Jiaodong Peninsula, eastern China: Implications for lithospheric extension. Int. Geol. Rev. 2019, 61, 821–838. [Google Scholar] [CrossRef]
  32. Xia, Z.M.; Liu, J.L.; Ni, J.L.; Zhang, T.T.; Yun, W. Structure, evolution and regional tectonic implications of the Queshan metamorphic core complex in eastern Jiaodong Peninsula of China. Sci. China Earth Sci. 2016, 59, 997–1013. [Google Scholar] [CrossRef]
  33. Deng, J.; Wang, C.M.; Bagas, L.; Carranza, E.J.M.; Lu, Y.J. Cretaceous–Cenozoic tectonic history of the Jiaojia Fault and gold mineralization in the Jiaodong Peninsula, China: Constraints from zircon U–Pb, illite K–Ar, and apatite fission track thermo chronometry. Miner. Depos. 2015, 50, 987–1006. [Google Scholar] [CrossRef]
  34. Deng, J.; Yang, L.Q.; Li, H.R.; Groves, D.I.; Santosh, M.; Wang, Z.L.; Sai, S.X.; Wang, S.R. Regional structural control on the distribution of world-class gold deposits: An overview from the Giant Jiaodong Gold Province, China. Geol. J. 2019, 54, 378–391. [Google Scholar] [CrossRef] [Green Version]
  35. Yang, L.; Zhao, R.; Wang, Q.F.; Liu, X.; Carranza, E.J.M. Fault geometry and fluid-rock reaction: Combined controls on mineralization in the Xinli gold deposit, Jiaodong Peninsula, China. J. Struct. Geol. 2018, 111, 14–26. [Google Scholar] [CrossRef]
  36. Deng, J.; Yang, L.Q.; Groves, D.I.; Zhang, L.; Qiu, K.F.; Wang, Q.F. An integrated mineral system model for the gold deposits of the giant Jiaodong province, eastern China. Earth Sci. Rev. 2020, 208, 103274. [Google Scholar] [CrossRef]
  37. Zhang, L.; Weinberg, R.F.; Yang, L.Q.; Groves, D.I.; Deng, J. Mesozoic orogenic gold mineralization in the Jiaodong Peninsula, China: A focused event at 120 ± 2 Ma during cooling of pregold granite intrusions. Econ. Geol. 2020, 115, 415–441. [Google Scholar] [CrossRef]
  38. Li, L.; Santosh, M.; Li, S.R. The “Jiaodong type” gold deposits: Characteristics, origin and prospecting. Ore Geol. Rev. 2015, 65, 589–611. [Google Scholar] [CrossRef]
  39. Wen, B.J.; Fan, H.R.; Santosh, M.; Hu, F.F.; Pirajno, F.; Yang, K.F. Genesis of two different types of gold mineralization in the Linglong gold field, China: Constrains from geology, fluid inclusions and stable isotope. Ore Geol. Rev. 2015, 65, 643–658. [Google Scholar] [CrossRef]
  40. Li, J.J.; Zhang, P.P.; Li, H. Formation of the Liaoshang gold deposit, Jiaodong Peninsula, eastern China: Evidence from geochronology and geochemistry. Geol. J. 2020, 55, 5903–5913. [Google Scholar] [CrossRef]
  41. Song, M.C.; YI, P.H.; Xu, J.X.; Cui, S.X.; Shen, K.; Jiang, H.L.; Yuan, W.H.; Wang, H.J. A step metallogenetic model for gold deposits in the northwestern Shandong Peninsula, China. Sci. China Earth Sci. 2012, 42, 992–1000. [Google Scholar] [CrossRef]
  42. Song, Y.X.; Song, M.C.; Ding, Z.J.; Wei, X.F.; Xu, S.H.; Li, J.; Tan, X.F.; Li, S.Y.; Zhang, Z.L.; Jiao, X.M.; et al. Major advances on deep prospecting in Jiaodong gold ore cluster and its metallogenic characteristics. Gold Sci. Technol. 2017, 25, 4–18, (In Chinese with English abstract). [Google Scholar]
  43. Song, M.C.; Xue, G.Q.; Liu, H.B.; Li, Y.X.; He, C.Y.; Wang, H.J.; Wang, B.; Song, Y.X.; Li, S.Y. A Geological-Geophysical Prospecting Model for Deep-Seated Gold Deposits in the Jiaodong Peninsula, China. Minerals 2021, 11, 1393. [Google Scholar] [CrossRef]
  44. Yang, X.A.; Zhao, G.C.; Song, Y.B.; Tian, F.; Dong, H.W.; Gao, J.W. Characteristics of ore-controlling detachment fault and future prospecting in the Muping-Rushan metallogenic belt, Eastern Shandong Province. Geotecton. Metallog. 2011, 35, 339–347. [Google Scholar]
  45. Yang, L.Q.; Deng, J.; Wang, Z.L.; Zhang, L.; Guo, L.N.; Song, M.C.; Zheng, X.L. Mesozoic gold metallogenic system of the Jiaodong Gold Province, eastern China. Acta Petrol. Sin. 2014, 30, 2447–2467, (In Chinese with English abstract). [Google Scholar]
  46. Zhang, L.; Yang, L.Q.; Wang, Y.; Weinberg, R.F.; An, P.; Chen, B.Y. Thermochronologic constrains on the processes of formation and exhumation of the Xinli orogenic gold deposit, Jiaodong Peninsula, eastern China. Ore Geol. Rev. 2017, 81, 140–153. [Google Scholar] [CrossRef]
  47. Mao, X.C.; Ren, J.; Liu, Z.K.; Chen, J.; Tang, L.; Deng, H.; Bayless, R.C.; Yang, B.; Wang, M.J.; Liu, C.M. Three-dimensional prospectivity modeling of the Jiaojia-type gold deposit, Jiaodong Peninsula, Eastern China: A case study of the Dayingezhuang deposit. J. Geochem. Explor. 2019, 203, 27–44. [Google Scholar] [CrossRef]
  48. Zhang, L.; Groves, D.I.; Yang, L.Q.; Wang, G.W.; Liu, X.D.; Li, D.P.; Song, Y.X.; Shan, W.; Sun, S.C.; Wang, Z.K. Relative roles of formation and preservation on gold endowment along the Sanshandao gold belt in the Jiaodong gold province, China: Importance for province- to district-scale gold exploration. Miner. Depos. 2020, 55, 325–344. [Google Scholar] [CrossRef]
  49. Song, M.C.; Deng, J.; Yi, P.H.; Yang, L.Q.; Cui, S.X.; Xu, J.X.; Zhou, M.L.; Huang, T.L.; Song, G.Z.; Song, Y.X. The kiloton class Jiaojia gold deposit in eastern Shandong Province and its genesis. Acta Geol. Sin. Engl. Ed. 2014, 88, 801–824. [Google Scholar] [CrossRef]
  50. Wang, S.R.; Yang, L.Q.; Wang, J.G.; Wang, E.J.; Xu, Y.L. Geostatistical determination of ore shoot plunge and structural control of the Sizhuang world-class epizonal orogenic gold deposit, Jiaodong Peninsula, China. Minerals 2019, 9, 214. [Google Scholar] [CrossRef] [Green Version]
  51. Drummond, B.J.; Goleby, B.R. Seismic reflection images of the major ore-controlling structures in the eastern goldfields province Western Australia. Explor. Geophys. 1993, 24, 473–478. [Google Scholar] [CrossRef]
  52. West, D.; Witherly, K. Geophysical exploration for gold in deeply weathered terrains, two tropical cases. Explor. Geophys. 1995, 26, 124–130. [Google Scholar] [CrossRef]
  53. Takakura, S. CSAMT and MT investigations of an active gold depositing environment in the Osorezan geothermal area, Japan. Explor. Geophys. 1995, 26, 172–178. [Google Scholar] [CrossRef]
  54. Di, Q.Y.; Xue, G.Q.; Yin, C.C.; Li, X. New methods of controlled-source electromagnetic detection in China. Sci. China Earth Sci. 2020, 50, 1219–1227. [Google Scholar] [CrossRef]
  55. Di, Q.Y.; Xue, G.Q.; Zeng, Q.D.; Wang, Z.X.; An, Z.G.; Lei, D. Magnetotelluric exploration of deep-seated gold deposits in the Qingchengzi orefield, eastern Liaoning (China), using a SEP system. Ore Geol. Rev. 2020, 122, 103501. [Google Scholar] [CrossRef]
  56. Guo, Z.W.; Xue, G.Q. Electromagnetic methods for mineral exploration in China: A review. Ore Geol. Rev. 2020, 118, 103357. [Google Scholar] [CrossRef]
  57. Xue, G.Q.; Li, Z.Y.; Guo, W.B.; Fan, J.S. The exploration of sedimentary bauxite deposits using the reflection seismic method: A case study from the Henan Province, China. Ore Geol. Rev. 2020, 127, 103832. [Google Scholar] [CrossRef]
  58. Xue, G.Q.; Zhang, L.B.; Hou, D.Y.; Liu, H.T.; Luo, X.N. Integrated geological and geophysical investigations for the discovery of deeply buried gold–polymetallic deposits in China. Geol. J. 2020, 55, 1771–1780. [Google Scholar] [CrossRef]
  59. Song, M.C.; Wan, G.P.; Cao, C.G.; He, C.Y. Geophysical–geological interpretation and deep-seated gold deposit prospecting in Sanshandong–Jiaojia area, eastern Shandong Province, China. Acta Geol. Sin. Engl. Ed. 2012, 86, 640–652. [Google Scholar]
  60. Duan, L.A.; Guo, Y.C.; Han, X.M.; Wang, J.T.; Zhao, P.F.; Wang, L.P.; Wei, Y.F. Discovery of a medium-scale tectonic altered rock type gold deposit (13.5 t) on the northeastern margin of Jiaolai Basin, Shandong Province, China and its new application of exploration direction. China Geol. 2022. [Google Scholar] [CrossRef]
  61. Yu, X.F.; Li, D.P.; Tian, J.X.; Yang, D.P.; Shan, W.; Geng, K.; Xiong, Y.X.; Chi, N.J.; Wei, P.F.; Liu, P.R. Deep gold mineralization features of Jiaojia metallogenic belt, Jiaodong gold Province: Based on the breakthrough of 3000 m exploration drilling. China Geol. 2020, 3, 385–401. [Google Scholar]
  62. Chen, S.X.; Zhang, Y.C.; Liu, Z.D. Drilling Technology of ZK96-5 Well in Xiling Gold Deposit, Laizhou, Shandong Province. In Proceedings of the 17th National Exploration Engineering (Geotechnical Drilling Engineering) Academic Exchange Conference, Nanchang, China, 11–13 October 2013; pp. 121–125. (In Chinese). [Google Scholar]
Figure 1. Map showing the regional geology and gold deposit distribution in the Jiaodong Peninsula. 1—Quaternary; 2—Cretaceous; 3—Paleoproterozoic and Neoproterozoic; 4—Neoproterozoic bearing eclogite granitic gneiss; 5—Archean granite-greenstone belt; 6—Cretaceous Laoshan granite; 7—Cretaceous Weideshan granite; 8—Cretaceous Guojialing granite; 9—Jurassic Linglong granite; 10—Triassic granitoid; 11—Geological boundary of conformity/unconformity; 12—Fault; 13—Shallow gold deposits (very large and large/medium-scale and small); 14—Deep-seated gold deposits (very large and large/medium-scale and small); 15—Gold deposit of altered-rock-type/quartz-vein-type/altered-breccia-type.
Minerals 12 00935 g001
Figure 2. 3D geological model of the Sanshandao supergiant gold deposit (a) and superposition map of fault plane on gold orebodies (b). 1—Sea area; 2—Quaternary; 3—Early Precambrian metamorphic rock series; 4—Linglong-type granite; 5—Alteration zone of Sanshandao fault.
Minerals 12 00935 g002
Figure 3. Distribution of cell blocks covered by structural buffer zones in the Jiaojia fault.
Minerals 12 00935 g003
Figure 4. Horizontal projection of orebodies along fault strikes (a) and dip directions (b) in the Jiaojia deposit concentration area. The red dotted line in figure (a) and the green dotted line in figure (b) show the equally spaced distribution of orebody enrich areas.
Minerals 12 00935 g004
Figure 5. Histogram showing the proportion of metallogenic information amount intervals of cell blocks of the Jiaojia fault.
Minerals 12 00935 g005
Figure 6. Advantageous metallogenic target (a) and predicted target areas (b) of deep metallogenic in the Jiaojia fault.
Minerals 12 00935 g006
Figure 7. Histogram of metallogenic information amount showing the mineralized zones and the barren zones in the Jiaojia fault.
Minerals 12 00935 g007
Figure 8. Histogram showing the proportion of metallogenic information amount intervals of cell blocks of the Sanshandao fault.
Minerals 12 00935 g008
Figure 9. Deep metallogenic favorable zone (a) and the predicted deep target areas (b) in the Sanshandao fault.
Minerals 12 00935 g009
Figure 10. Histogram of metallogenic information amount showing the mineralized zones and the barren zone in the Sanshandao fault.
Minerals 12 00935 g010
Figure 11. Planar range of the prediction areas of deep resource potential. 1—Quaternary; 2—Early Precambrian metamorphic rock; 3—Cretaceous Weideshan granite; 4—Cretaceous Guojialing granite; 5—Jurassic Linglong granite; 6—Fault; 7—Range of ore-forming prediction areas.
Minerals 12 00935 g011
Figure 12. Vertical longitudinal projection map for the deep resource prediction of the Sanshandao fault. 1—Range of controlled gold orebodies; 2—Scope for the calculation of the shallow ore-bearing rate; 3—Scope for the calculation of the deep ore-bearing rate; 4—Prediction range at an elevation of −3000–−2000 m; 5—Prediction range at an elevation range of −5000–−3000 m; 6—Exploration lines and their numbers.
Minerals 12 00935 g012
Table 1. Deep predictive model of the Jiaojia fault.
Ore-Controlling ConditionPredictive FactorCharacteristic VariableCharacteristic Value
Geologic conditionFavorable geological body for mineralizationEarly Precambrian metamorphic rock seriesDirect screening and utilization
Linglong graniteDirect screening and utilization
Contact zone of Early Precambrian metamorphic rock series and Linglong granite 500 m width
Structural conditionsOre-controlling faultsFault buffer zone500 m
Fault planeGentle part of a fault section with a steep-to-gentle transition of fault dip angleDirect screening and utilization
Changing rate of fault dip angleCharacteristic value of the changing rate of fault dip angle
Ore-hosting conditionsOrebody distribution patternEquidistant distribution along fault strikeAbout 1.5 km along fault strike
Equidistant distribution along fault dip directionAbout 1.8 km along fault dip direction
Table 2. Proportion of metallogenic information amount intervals of cell blocks of the Jiaojia fault.
S.N.Information
Amount
Number of
Cell Blocks
Proportion
(%)
S.N.Information
Amount
Number of
Cell Blocks
Proportion
(%)
1≥0.000660,800100.0017≥3.23169,02410.45
2≥0.681429,56665.0118≥3.37568,02310.29
3≥0.754365,25755.2719≥3.43066,99610.14
4≥1.435298,94545.2420≥3.91264,1789.71
5≥1.588181,99927.5421≥3.98559,8669.06
6≥1.643180,48427.3122≥4.05657,4378.69
7≥1.787175,40426.5423≥4.11157,1178.64
8≥2.269121,33218.3624≥4.12953,2768.06
9≥2.324120,36918.2225≥4.18451,4127.78
10≥2.342112,90517.0926≥4.66648,3107.31
11≥2.397110,89616.7827≥4.81037,2285.63
12≥2.468106,28116.0828≥4.86535,6885.40
13≥2.54199,03414.9929≥5.01823,3893.54
14≥3.02394,55814.3130≥5.69922,0723.34
15≥3.07892,21013.9531≥5.77217,0722.58
16≥3.22273,59211.1432≥6.45312,7791.93
Table 3. Deep predictive model of the Sanshandao fault.
Ore-Controlling ConditionPredictive FactorCharacteristic VariableCharacteristic Value
Geologic conditionFavorable geological body for mineralizationEarly Precambrian metamorphic rock seriesDirect screening and utilization
Linglong graniteDirect screening and utilization
Contact zone of Early Precambrian metamorphic rock series and Linglong granite 500 m width
Structural conditionsOre-controlling faultsFault buffer zone500 m
Fault planeGentle part of a fault section with a steep-to-gentle transition of fault dip angleDirect screening and utilization
Changing rate of fault dip angleCharacteristic value of the changing rate of fault dip angle
Ore-hosting conditionsOrebody distribution patternEquidistant distribution along fault strikeAbout 1.5 km along fault strike
Equidistant distribution along fault dip directionAbout 1.0 km along fault dip direction
Table 4. Calculated results of prospecting information amounts of the Sanshandao fault.
Favorable FactorNumber Ore-Hosting Cell BlocksNumber of Cell Blocks with Favorable FactorNumber of Ore-Hosting Cell Blocks with Favorable FactorTotal Cell Block Number of the Geological ModelInformation Amount
Fault buffer zones532325,78125561,747,8863.483
Fault parts with a steep-to-gentle transition of fault dip angle532333,93532151,747,8863.438
Changing rate of fault dip angle532336,46623441,747,8863.050
Equidistant distribution along fault strike532329,96420441,747,8863.109
Equidistant distribution along fault dip direction5323120,98152731,747,8862.661
Table 5. Proportion of metallogenic information amount intervals of cell blocks of the Sanshandao fault.
S.N.Information
Amount
Number of
Cell Blocks
Proportion
(%)
S.N.Information
Amount
Number of
Cell Blocks
Proportion
(%)
1≥2.66118,150100.0017≥9.149237929.77
2≥3.050200772.3018≥9.19471226.14
3≥3.10919669.2419≥9.208149525.06
4≥3.43857068.9420≥9.25341222.78
5≥3.483417168.0721≥9.582594622.15
6≥5.711250561.7122≥9.59715913.07
7≥5.777149057.8923≥9.64222612.83
8≥6.099727955.6124≥9.9713812.49
9≥6.144334344.5125≥10.030912.43
10≥6.15921039.4026≥12.258297112.41
11≥6.48818939.0827≥12.30310037.88
12≥6.53332038.8028≥12.63215116.35
13≥6.5472338.3129≥12.69111624.05
14≥6.59211738.2730≥13.080192.27
15≥6.92120138.0931≥15.74114702.24
16≥8.820525237.79
Table 6. Ore-hosting rates of the Sanshandao fault.
Elevation (m)Proven Resource ReservesArea
(m2)
Grade
(g/t)
Thickness
(m)
Ore-Bearing Rate
Ore Reserves
(Mt)
Metal Reserves
(kg)
−500–081.5238,5035,516,8442.938.100.0432
−2000–−500252.141,002,17611,443,1563.987.900.0876
Table 7. Statistics of predicted resources in the Sanshandao fault.
Elevation
(m)
Area
(km2)
Ore-Bearing RatePredicted Resources
Ore Reserves (Mt)Metal Reserves (t)
Shallow PartDeep PartMinimumMaximumMinimumMaximum
−3000–−20008.480.04320.0876125187367743
−5000–−300016.960.04320.08762503737331485
Total37556011002228
Table 8. Predicted gold resources of major ore-controlling faults in the northwest Jiaodong Peninsula.
Name Proved Resources Predicted Resources of Deep Parts at an Elevation of −5000–−2000 m Total Resources at an Elevation of −5000 m and Above
Ore Reserves (Mt)Metal Reserves (kg)Ore Reserves (Mt)Metal Reserves (t)
Ore Reserves (Mt)Metal Reserves (kg)MinimumMaximum Minimum Maximum Minimum Maximum Minimum Maximum
Sanshandao fault 33412413755601100222870989423413469
Jiaojia fault 429133449591214332379924134127673713
Northern section of the Zhaoping fault 202700200319619114640252113191846
Central-southern section of the Zhaoping fault 1283851474462557372753838311122
Total 10933660121722373377649023103330707310,150
Publisher’s Note: MDPI stays neutral with regard to jurisdictional claims in published maps and institutional affiliations.

