Article

Evolution of the Reaction and Alteration of Granite with Ordinary Portland Cement Leachates: Sequential Flow Experiments and Reactive Transport Modelling

1
Nuclear Fuel Cycle Engineering Laboratories, Japan Atomic Energy Agency, Tokai 319-1194, Ibaraki, Japan
2
British Geological Survey, Keyworth, Nottingham NG12 5GG, UK
3
QJ Science, Yokohama 221-0052, Japan
4
Wilson Scientific Ltd., Birchwood, Warrington WA3 6TR, UK
*
Author to whom correspondence should be addressed.
Minerals 2022, 12(7), 883; https://doi.org/10.3390/min12070883
Submission received: 10 May 2022 / Revised: 28 June 2022 / Accepted: 11 July 2022 / Published: 13 July 2022

Abstract

:
The construction of a repository for the geological disposal of radioactive waste will include the use of cement-based materials. Following closure, groundwater will saturate the repository, and the extensive use of cement will result in the development of a highly alkaline porewater, pH > 12.5; this fluid will migrate into and react with the host rock. The chemistry of the fluid will evolve over time, initially with high Na and K concentrations, evolving to a Ca-rich fluid, and finally returning to the natural background groundwater composition. This evolving chemistry will affect the long-term performance of the repository, altering the physical and chemical properties, including radionuclide behaviour. Understanding these changes forms the basis for predicting the long-term evolution of the repository. This study focused on the determination of the nature and extent of the chemical reaction, as well as the formation and persistence of secondary mineral phases within a granite, comparing data from sequential flow experiments with the results of reactive transport modelling. The reaction of the granite with the cement leachates resulted in small changes in pH and the precipitation of calcium aluminium silicate hydrate (C-(A-)S-H) phases of varying compositions, of greatest abundance with the Ca-rich fluid. As the system evolved, secondary C-(A-)S-H phases redissolved, partly replaced by zeolites. This general sequence was successfully simulated using reactive transport modelling.

1. Introduction

The construction of a repository for the geological disposal of radioactive waste will include the extensive use of ordinary Portland cement (OPC)-based materials [1,2,3,4]. Following closure, groundwater will migrate into and resaturate the repository. The use of OPC will result in the development of a highly alkaline porewater, pH > 12.5 [5,6]. This alkaline fluid will then migrate into and react with the host rock. The chemistry of the migrating fluid will evolve over time, initially with high concentrations of both Na and K due to leaching of alkalis within the cement, resulting in a pH > 13 (Stage I), evolving to a Ca-dominated, portlandite-saturated fluid with pH ~12.5 (Stage II), followed by C-S-H buffering (Stage III), and finally returning to the natural background groundwater composition [5,6,7]. The evolving fluid chemistry will influence the long-term performance of the repository, altering the physical and chemical properties of the host rock, including radionuclide behaviour ([7] and references within). Understanding these changes forms the basis for evaluating the long-term evolution of the repository.
Flow-through or column experiments [8] are a useful technique with which to obtain experimental data on the spatial and temporal changes as the chemistry of the migrating fluid evolves. However, many previous studies have used only a single fluid at a time [9,10,11], and few studies have examined the impact of the changing fluid chemistry [12,13].
As the chemistry of the reacting fluid evolves (reduction in Na and K concentrations and increases in Ca concentration), it has previously been observed [12,13,14,15,16] that initially formed secondary calcium silicate hydrate (C-S-H) and calcium aluminium silicate hydrate (C-A-S-H) phases were over time replaced by ones with a lower Ca/Si ratio before being redissolved and replaced by new secondary phases [13].
Some previous modelling studies [17,18,19] have been undertaken to consider the fluid evolution impacts on the host and secondary mineralogy but without experimental data with which to validate the predictions. In addition, most of these modelling studies used a single input fluid and tracked evolution of this fluid’s chemistry and change in mineralogy with time and/or distance. An understanding of the evolution in chemistry of the migrating cement pore fluids from the repository and the subsequent interaction with the altered host rock is critical for the prediction of the long-term evolution of the mineralogy and will be part of the safety assessment for a radioactive waste disposal repository.
This study focused on the alteration owing to the evolution of OPC-type leachate chemistry on Toki granite from the Mizunami Underground Research Laboratory (MIU), Gifu, Japan [20].
The experiments described here document the use of sequential fluids to represent the evolution of the cement leachate fluid chemistry with time and distance, and how it interacts with the host rock, which has been identified as a key area of uncertainty, particularly with the modelling of such systems [7]. This was performed by setting up a series of identical column experiments to provide (at least in a laboratory time frame) information on the sequence of reaction. The first column experiment was stopped after the reaction with a fluid representative of a ‘young’ OPC cement leachate. In the remaining experiments, the reactant fluid was then changed to one representative of an ‘evolved’ leachate. Again, after a period of reaction, one of the columns was terminated, and the reactant fluid for the final column changed to a Mizunami groundwater, collected from the MIU. Fluid chemistry was monitored throughout the experiments, providing a record of the evolution of the reacted fluid chemistry, and with the three different fluid types, ‘snapshots’ of the mineralogical variations could be determined. The specific aim of this work was the determination of the nature and extent of the chemical reaction and the formation and persistence of secondary mineral phases, as the fluid chemistry evolved, by the comparison of experimental data with geochemical reactive transport modelling.

2. Materials and Methods

2.1. Toki Granite

Core samples of Toki granite were collected from MIU, from a near-horizontal borehole (BH 09MI20) drilled at a depth ~300 m below ground, at horizontal distances of 70.2–70.3 m and 81.8–82.0 m from the gallery wall. The typical composition for the Toki granite [21] is quartz (30 wt%), K-feldspar (30 wt%), albite (30 wt%), biotite (2–3 wt%), aragonite (<1 wt%), and chlorite (<1 wt%). The samples were combined ‘as one’, ~1.6 kg in total weight, and were crushed and sieved to provide a size fraction of 125–250 µm. It is recognised that the use of crushed samples may result in enhanced reaction rates compared with those observed in the natural environment, and in addition, the crushing process can affect the apparent rates of reaction through the generation of ‘artefacts’, such as highly reactive fines.

2.2. Description of Fluids

Cement pore fluids representative of the alkaline leachates expected from a cementitious repository [22,23] were used for these sequential experiments. The first fluid represented a ‘young’ OPC leachate pH ~13.4 with high Na and K concentrations. A second fluid, an ‘evolved’ OPC leachate (pH ~12.5), was Ca rich and saturated with respect to portlandite. The ‘young’ OPC leachate was prepared by the addition of analytical-grade NaOH and KOH to ultrapure water, followed by the addition of an excess of CaO. To prepare the ‘evolved’ OPC leachate, an excess of CaO was dissolved in ultrapure water at 25 °C. The fluids were stored in airtight containers for 1 month at room temperature before first being used, in order that saturation with respect to Ca(OH)2 was attained. The use of an excess of CaO ensures that the fluids remain saturated with respect to portlandite, even if the laboratory temperature changes (Ca(OH)2 has inverse solubility). In addition, any dissolved CO2 present in the fluids would precipitate out as CaCO3, which could be removed by filtration before use.
The third fluid was Mizunami groundwater (MGW), samples of which were collected from borehole BH-09MI20 (depth of 300 m). It should be noted that MGW is a dilute Na-(Ca)-Cl-HCO3-type groundwater (i.e., <1000 mg/L TDS). A total of 3 L was collected in individual plastic 1 L bottles, sealed, and stored at <5 °C until required for use. Details of the initial composition are given in Table 1.

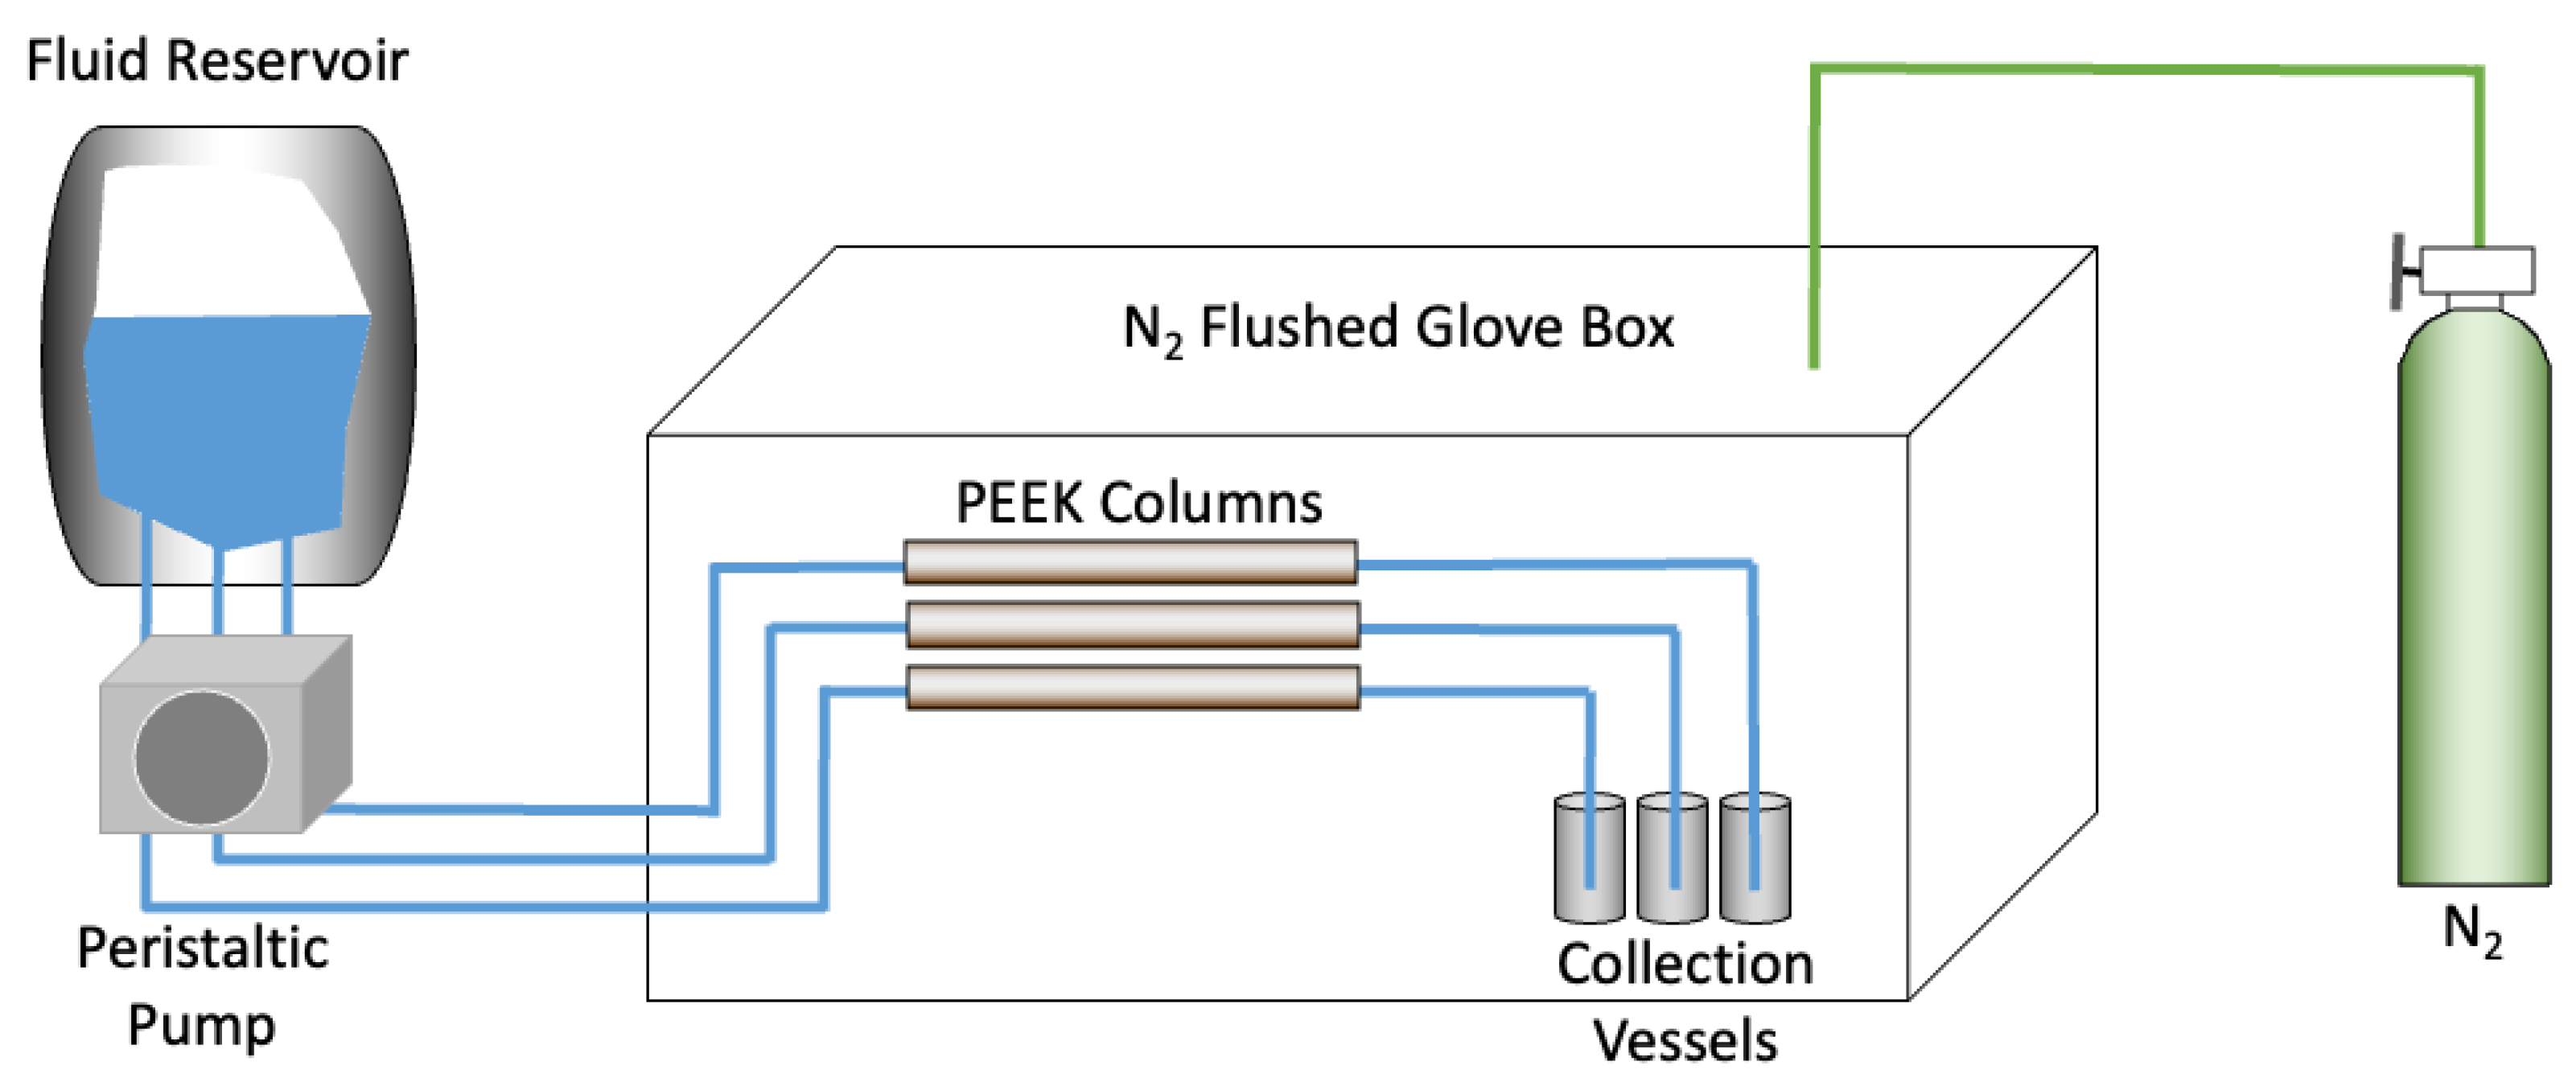
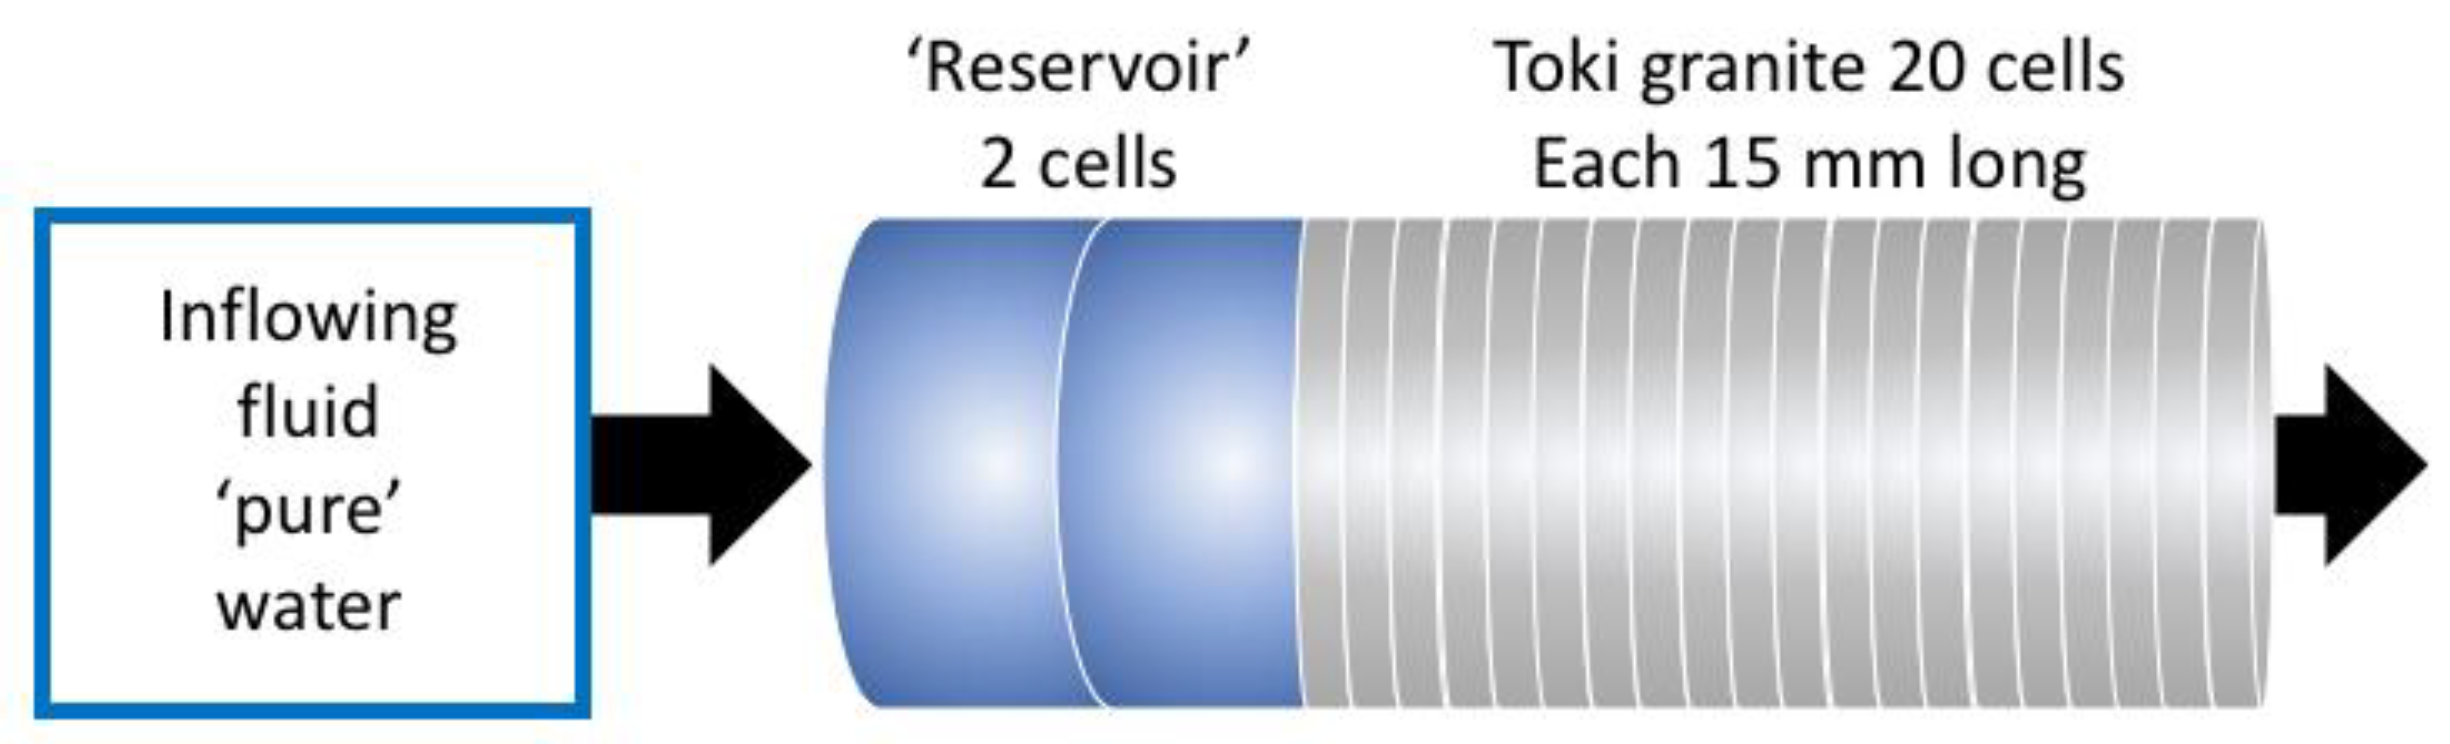
2.3. Description of the Column Experiment

A small acrylic glove box (900 mm long, 560 mm deep, and 570 mm high), with an airlock/transfer chamber (~200 × 200 mm), was used for the flow experiments. It was continuously flushed with N2. The primary aim of this flushing was to remove any carbon dioxide from the atmosphere to limit the formation of CaCO3 from the alkaline leachates.
The column experiments were set up in the glove box (Figure 1), composed of PEEK (polyetheretherketone) HPLC columns (300 mm long and 7.5 mm i.d.) packed with crushed rock (125–250 µm) with a typical original porosity of 42% (determined by the difference between ‘wet’ and ‘dry’ weights of the packed column, corrected for density) and connected to polypropylene fluid reservoirs and sample collection bottles by PFA (perfluoroalkoxy alkane) and PTFE (polytetrafluoroethylene) tubing. Flow was controlled by a Cole-Parmer Masterflex® peristaltic pump.
A typical volumetric flow rate was approximately 12 mL per day, with periodic subsampling of the collected reacted fluids. On completion of the experiments, the columns were sectioned into ~15 mm long pieces using a small rotary cutting saw (Proxxon KG 50) for subsequent mineralogical analysis.
A series of three flow-through experiments were conducted to examine the sequential reaction of Toki granite with OPC leachates and groundwater. This was achieved by reacting crushed granite with successive fluids starting with the ‘young’ OPC leachate (Col-1), followed by the ‘evolved’ OPC leachate (Col-2) and, finally, MGW (Col-3). Figure 2 gives details of the experiments conducted, together with the reaction duration with each fluid.

2.4. Fluid Sampling and Analysis

Sampling of the fluids was performed within the protective N2 atmosphere of the glove box. All collected fluids were filtered using 0.2 µm syringe filters and then subsampled for the determination of cations and anions. Typically, a 4 mL sample of the fluid was diluted twofold with 18 MΩ cm demineralised water (Millipore Simplicity® ultrapure water system) and then acidified with concentrated HNO3 (1% v/v), in order to preserve the sample. This sample was used for the analysis of major cations, by a combination of ICP-OES (inductively coupled plasma optical emission spectrometry) using a Shimadzu ICPE-9800 (Shimadzu Corporation, Kyoto, Japan) and ICP-MS (inductively coupled plasma mass spectrometry) using a PerkinElmer NexION 300× (PerkinElmer, Inc., Waltham, MA, USA), both calibrated using matrix-matched standards. The second subsample was used for the determination of major anions by IC (ion chromatography) using a Dionex ICS-5000 Ion Chromatograph System (Thermo Fisher Scientific, Waltham, MA, USA), calibrated using a mixed anion standard solution (Kanto Chemical Co., Inc., Tokyo, Japan). All fluid samples were stored in a refrigerator at <5 °C until required for analysis. Considering instrumental and sample preparation errors (e.g., sample dilution), a total 5% error was assumed.
The pH of the experimental fluids was determined immediately upon sampling using a DKK-TOA Corp. model HM-30P meter and combination electrode calibrated using DKK-TOA Corp. buffers at 4.01, 6.86, and 9.18 pH, pH accurate to ±0.02 pH.

2.5. Analysis of Solid Samples

On completion of the experiments, each column was sectioned into ~15 mm long pieces. The sections from the columns were then vacuum-dried and stored in a N2 atmosphere prior to being prepared for petrographic analysis performed using a combination of scanning electron microscopy (SEM) (JEOL JSM-6510 Series SEM with built-in JED-2300 EDS, JEOL Ltd., Tokyo, Japan) and X-ray diffraction (XRD) analysis (Rigaku SmartLab XRD, Rigaku Corporation, Tokyo, Japan) with a 9 kW (Cu-Kα) X-ray source. Subsamples for SEM analysis were prepared as carbon-coated random mount stub samples. The techniques used included SEM, with an accelerating voltage of 15 kV, using both secondary electron (SE) and backscattered electron (BSE) imaging with qualitative element analysis using energy dispersive X-ray spectroscopy (EDS). Samples for XRD were prepared for analysis by taking a representative subsample and grinding to a fine powder immediately before analysis, and front-loaded on the powder mount target. The samples were scanned from 2 to 90° 2θ at 10° 2θ/min.

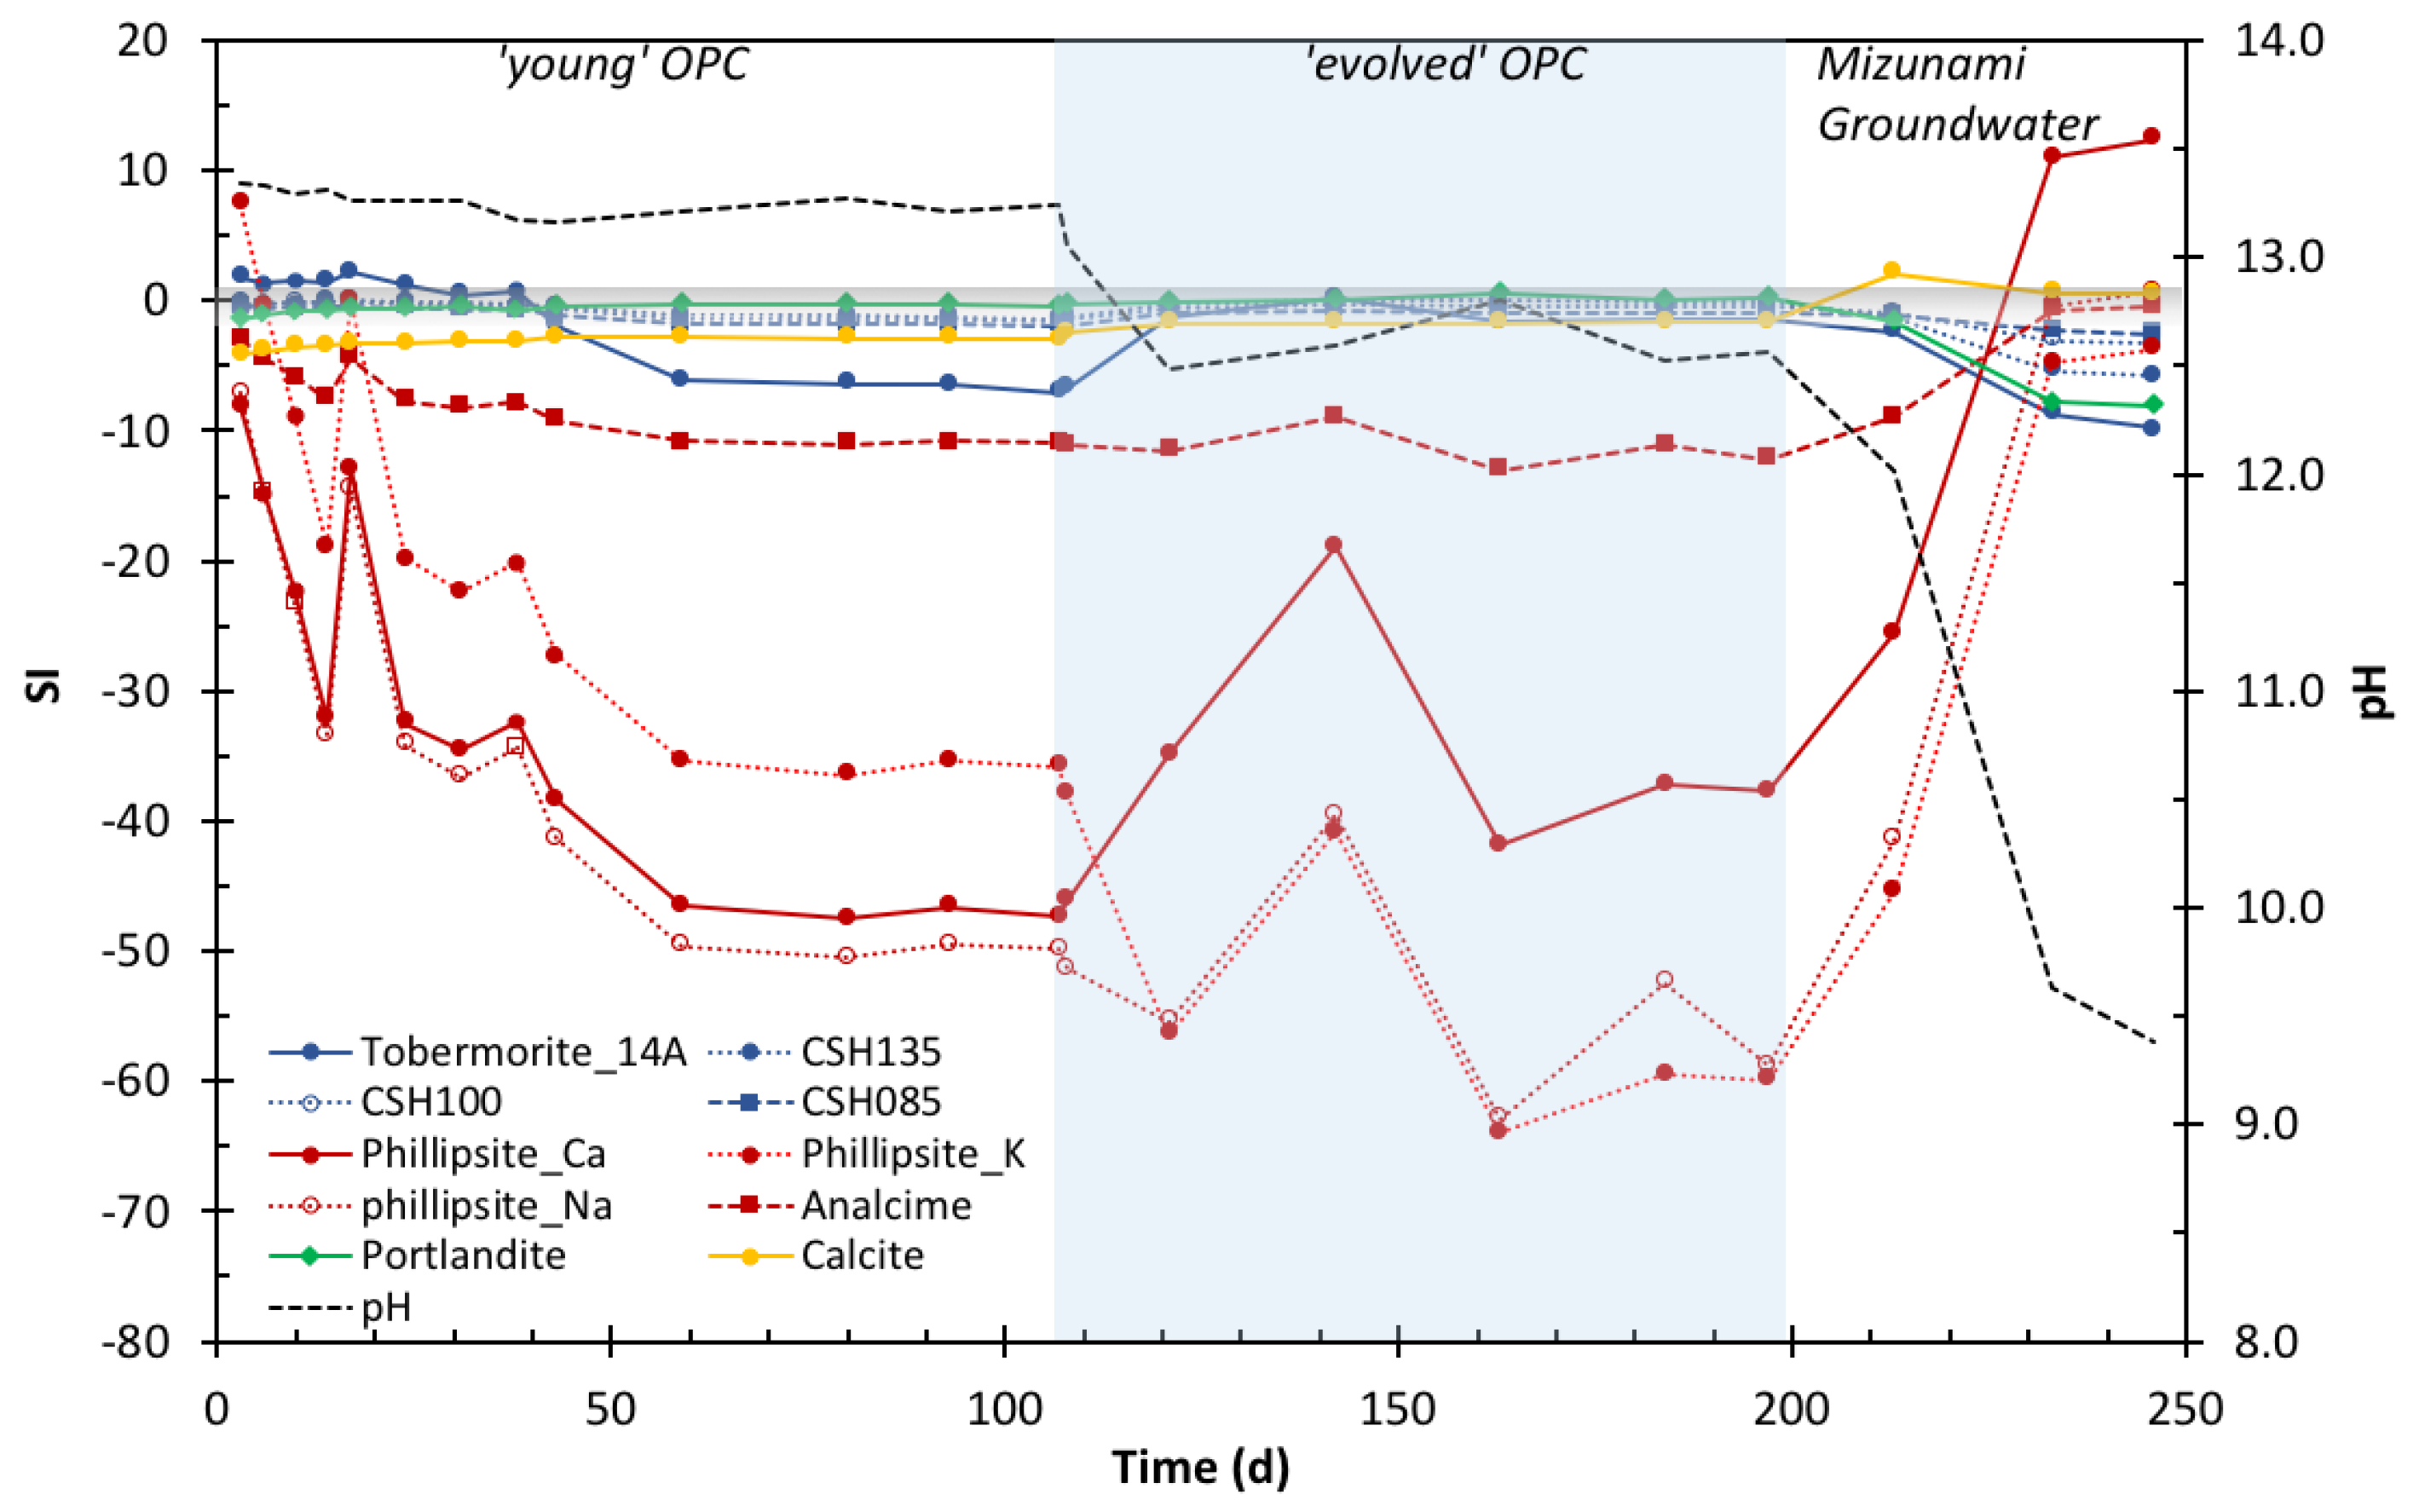
2.6. Mineral Saturation State Calculations

To aid the interpretation of the fluid chemical data and relate it to the mineralogy, the saturation indices (SI = log (IAP/Ks) (IAP ion activity product; Ks solubility constant) for primary and potential secondary minerals in the reacted fluids were calculated using the PHREEQC v3.6.3 geochemical code [25]. Calculations were performed using the JAEA thermodynamic database (JAEA-TDB) [26]. JAEA-TDB version PHREEQC20.dat (v1.2, 11 March 2021) was used for the calculations, being the latest version available at the time.

3. Reactive Transport Modelling

3.1. CABARET Model Concept

Fully-coupled 1D reactive transport models were constructed using the ‘CABARET’ computer modelling code (Quintessa Limited, Henley-on-Thames, Oxfordshire, UK). CABARET was chosen for the modelling in preference to codes such as PHREEQC [25], as it allows coupling of porosity evolution (as minerals dissolve and/or precipitate) with diffusive and advective transport, and was previously successfully used to model similar sequential flow-through experiments with Horonobe mudstone [13]. CABARET uses an adaptive time-stepper to maximise the solver efficiency, which reduces the size of the time step in response to external events (e.g., time-dependent inputs) or ‘emergent events’ (e.g., precipitation of secondary minerals or total dissolution of pre-existing minerals) and increases the time step when the system is evolving less rapidly.
Supporting calculations (e.g., aqueous chemical speciation) were undertaken using PHREEQCv3 to generate the initial fluid compositions and to identify the key aqueous species specified in the CABARET models. The same JAEA-TDB [26] version was used for the CABARET calculations as used for the PHREEQC mineral saturation state calculations.

3.2. CABARET Model Setup and Parameters

Figure 3 shows the geometry of the experimental setup as represented in CABARET. Since CABARET was designed to work with a single-input-fluid type, it was necessary to generate the fluids ‘in situ’, effectively reproducing the fluid reservoir used in the experimental setup, as previously used for similar reactive flow modelling [13]. This reservoir contained defined ‘hypothetical minerals’ (Tables S1–S3), which, when reacted with the inflowing water, replicated the three different successive reacting fluids. The resulting chemistry matched the fluid compositions given in Table 1.
Although CABARET is an efficient model, as with other complex simulations, it is still desirable to minimise the number of active components (i.e., chemical species and minerals) in the system in order to obtain results in a reasonable computational time. The choice of minerals considered in the model was determined by the analysis of the Toki granite and precipitates observed in this study together with information from previous studies of the Toki granite mineralogy [21]. The active minerals are given in Table 2. Eleven aqueous basis species (H2O, Al3+, Ca2+, Cl, H+, HCO3, K+, Mg2+, Na+, Si(OH)4(aq), SO42−) were active in the model, together with 35 related aqueous complex species. A full list of the active chemical species is available in Table S4. The choice of chemical species included was based on the chemical analysis of the reacted fluids and the compositions of the minerals included in the model.
Thermodynamic data (equilibrium constants and standard molar volume for minerals) were taken from the JAEA-TDB [26] version PHREEQC20.dat (v1.2, 11 March 2021). Kinetic rates for primary minerals were taken from [27,28] and the references within, those for C-S-H from [29]. Data for surface areas were from [30]. As regards the description of diffusion, including the effect of tortuosity, within CABARET, this was derived from [31] with dispersion and advection as described in [32].

4. Results of Experiments

A series of flow-thorough (column) experiments were conducted using 300 mm long PEEK columns, packed with 125–250 µm crushed Toki granite, and reacted with successive fluids ‘young’ OPC leachate, then ‘evolved’ OPC leachate, and finally, Mizunami groundwater, from borehole BH 09MI20 (Table 1). The nominal, volumetric, flow rate was approximately 12 mL per day, with periodic subsampling of the collected reacted fluids.

4.1. Aqueous Chemistry

The chemical evolution of the three column experiments was identical when comparing the same fluid type. That is, the fluid analytical data for the ‘young’ OPC leachate were the same for all experiments, and the data for the ‘evolved’ OPC leachate from the Col-2 and −3 experiments were identical.

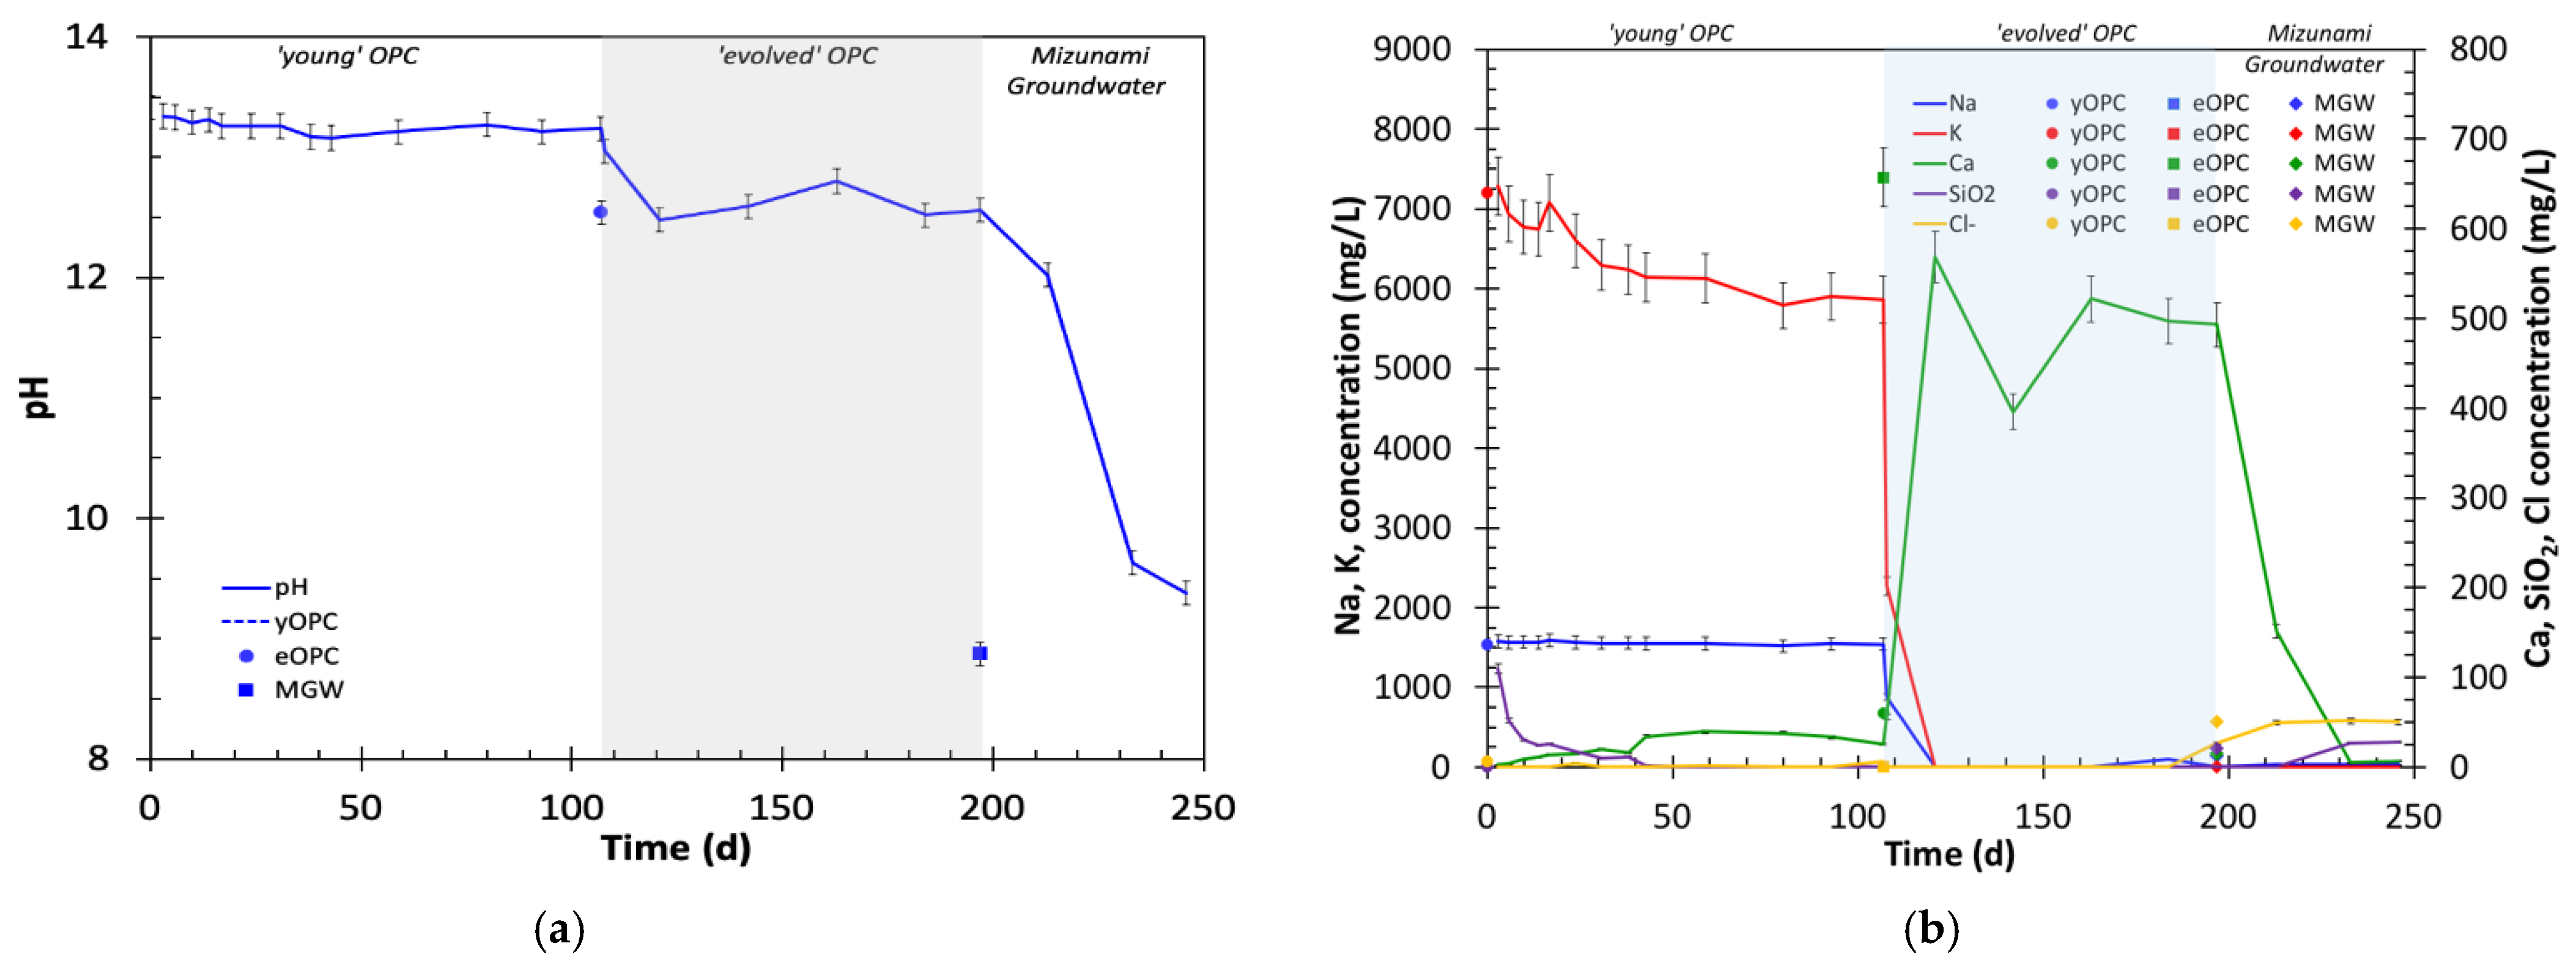
4.1.1. Changes in pH

The evolution of pH with time for the experiment with the ‘young’ OPC leachate, followed by the ‘evolved’ OPC leachate and then MGW of the reacted fluid (Col-3), is shown in Figure 4a. The pH reduction with the ‘young’ OPC leachate was ~0.2 pH units lower than the original leachate, and a smaller decrease was seen with the ‘evolved’ OPC leachate (pH ~12.4). With the change to MGW, the pH decreased, pH ~9.4, and was still decreasing when the experiment was terminated due to difficulty in maintaining flow through the column.

4.1.2. Changes in Na Concentration

The changes in Na concentrations in the reacted fluids for the experiment with the ‘young’ OPC leachate, followed by the ‘evolved’ OPC leachate and then MGW of the reacted fluid (Col-3), are shown in Figure 4b. In all three experiments, [Na] within analytical error was almost identical to the original ‘young’ OPC leachate ~1500 mg/L. When the inflowing fluid was changed to the ‘evolved’ OPC leachate (Figure 4b and Figure S1a), [Na], reflecting the lack of Na in the ‘evolved’ OPC leachate, decreased to ~10 mg/L (analytical detection limit) (Figure 4b and Figure S1b). With the change to MGW, [Na] increased to ~40 mg/L (Figure 4b), which was lower than the MGW, but as noted above, the experiment was terminated earlier than anticipated.

4.1.3. Changes in K Concentration

In all three experiments, K concentrations in the reacted fluids (Figure 4b and Figure S1a,b) decreased from that of the ‘young’ OPC leachate. When the inflowing fluid was changed to the ‘evolved’ OPC leachate, [K] rapidly decreased to ~10 mg/L (analytical detection limit) and remained at this level until the experiment was ended.

4.1.4. Changes in Ca Concentration

With both of the OPC leachate types, Ca concentrations in the reacted fluids were significantly lower than that of the original OPC leachates, <40 mg/L for the ‘young’ OPC leachate and decreases of up to 200 mg/L for the ‘evolved’ OPC leachate (Figure 4b and Figure S1a,b). When MGW replaced the OPC leachate, [Ca] decreased over the next 20 days to ~7 mg/L, around half the concentration of the MGW.

4.1.5. Changes in Silica Concentration

In all the experiments (Figure 4b and Figure S1a,b), the silica concentrations increased in the first 3 days of the reaction up to ~100 mg/L, and then slowly decreased to <10 mg/L after ~40 d and decreased further to close to detection limits until the change of fluids to the ‘evolved’ OPC leachate. With the ‘evolved’ OPC leachate, silica concentrations remained close to detection limits (Figure 4b and Figure S1a,b). When the inflowing fluid was changed to MGW, silica concentrations in the reacted fluids increased over 20 d to ~12 mg/L, slightly above that of the MGW (i.e., ~10 mg/L).

4.1.6. Changes in Other Ions

With the exception of Rb and Sr, which tracked the concentrations of K and Ca, respectively, the concentrations of the remaining cations analysed (e.g., Al, Ba, Cs, Cu, Fe, Li, Mg, Mn) showed no significant changes from the concentrations in the original inflowing fluids. With regard to anions, the dissolved concentrations of all anions reflected the concentrations present in the OPC leachates and groundwater, showing no sign of interaction.

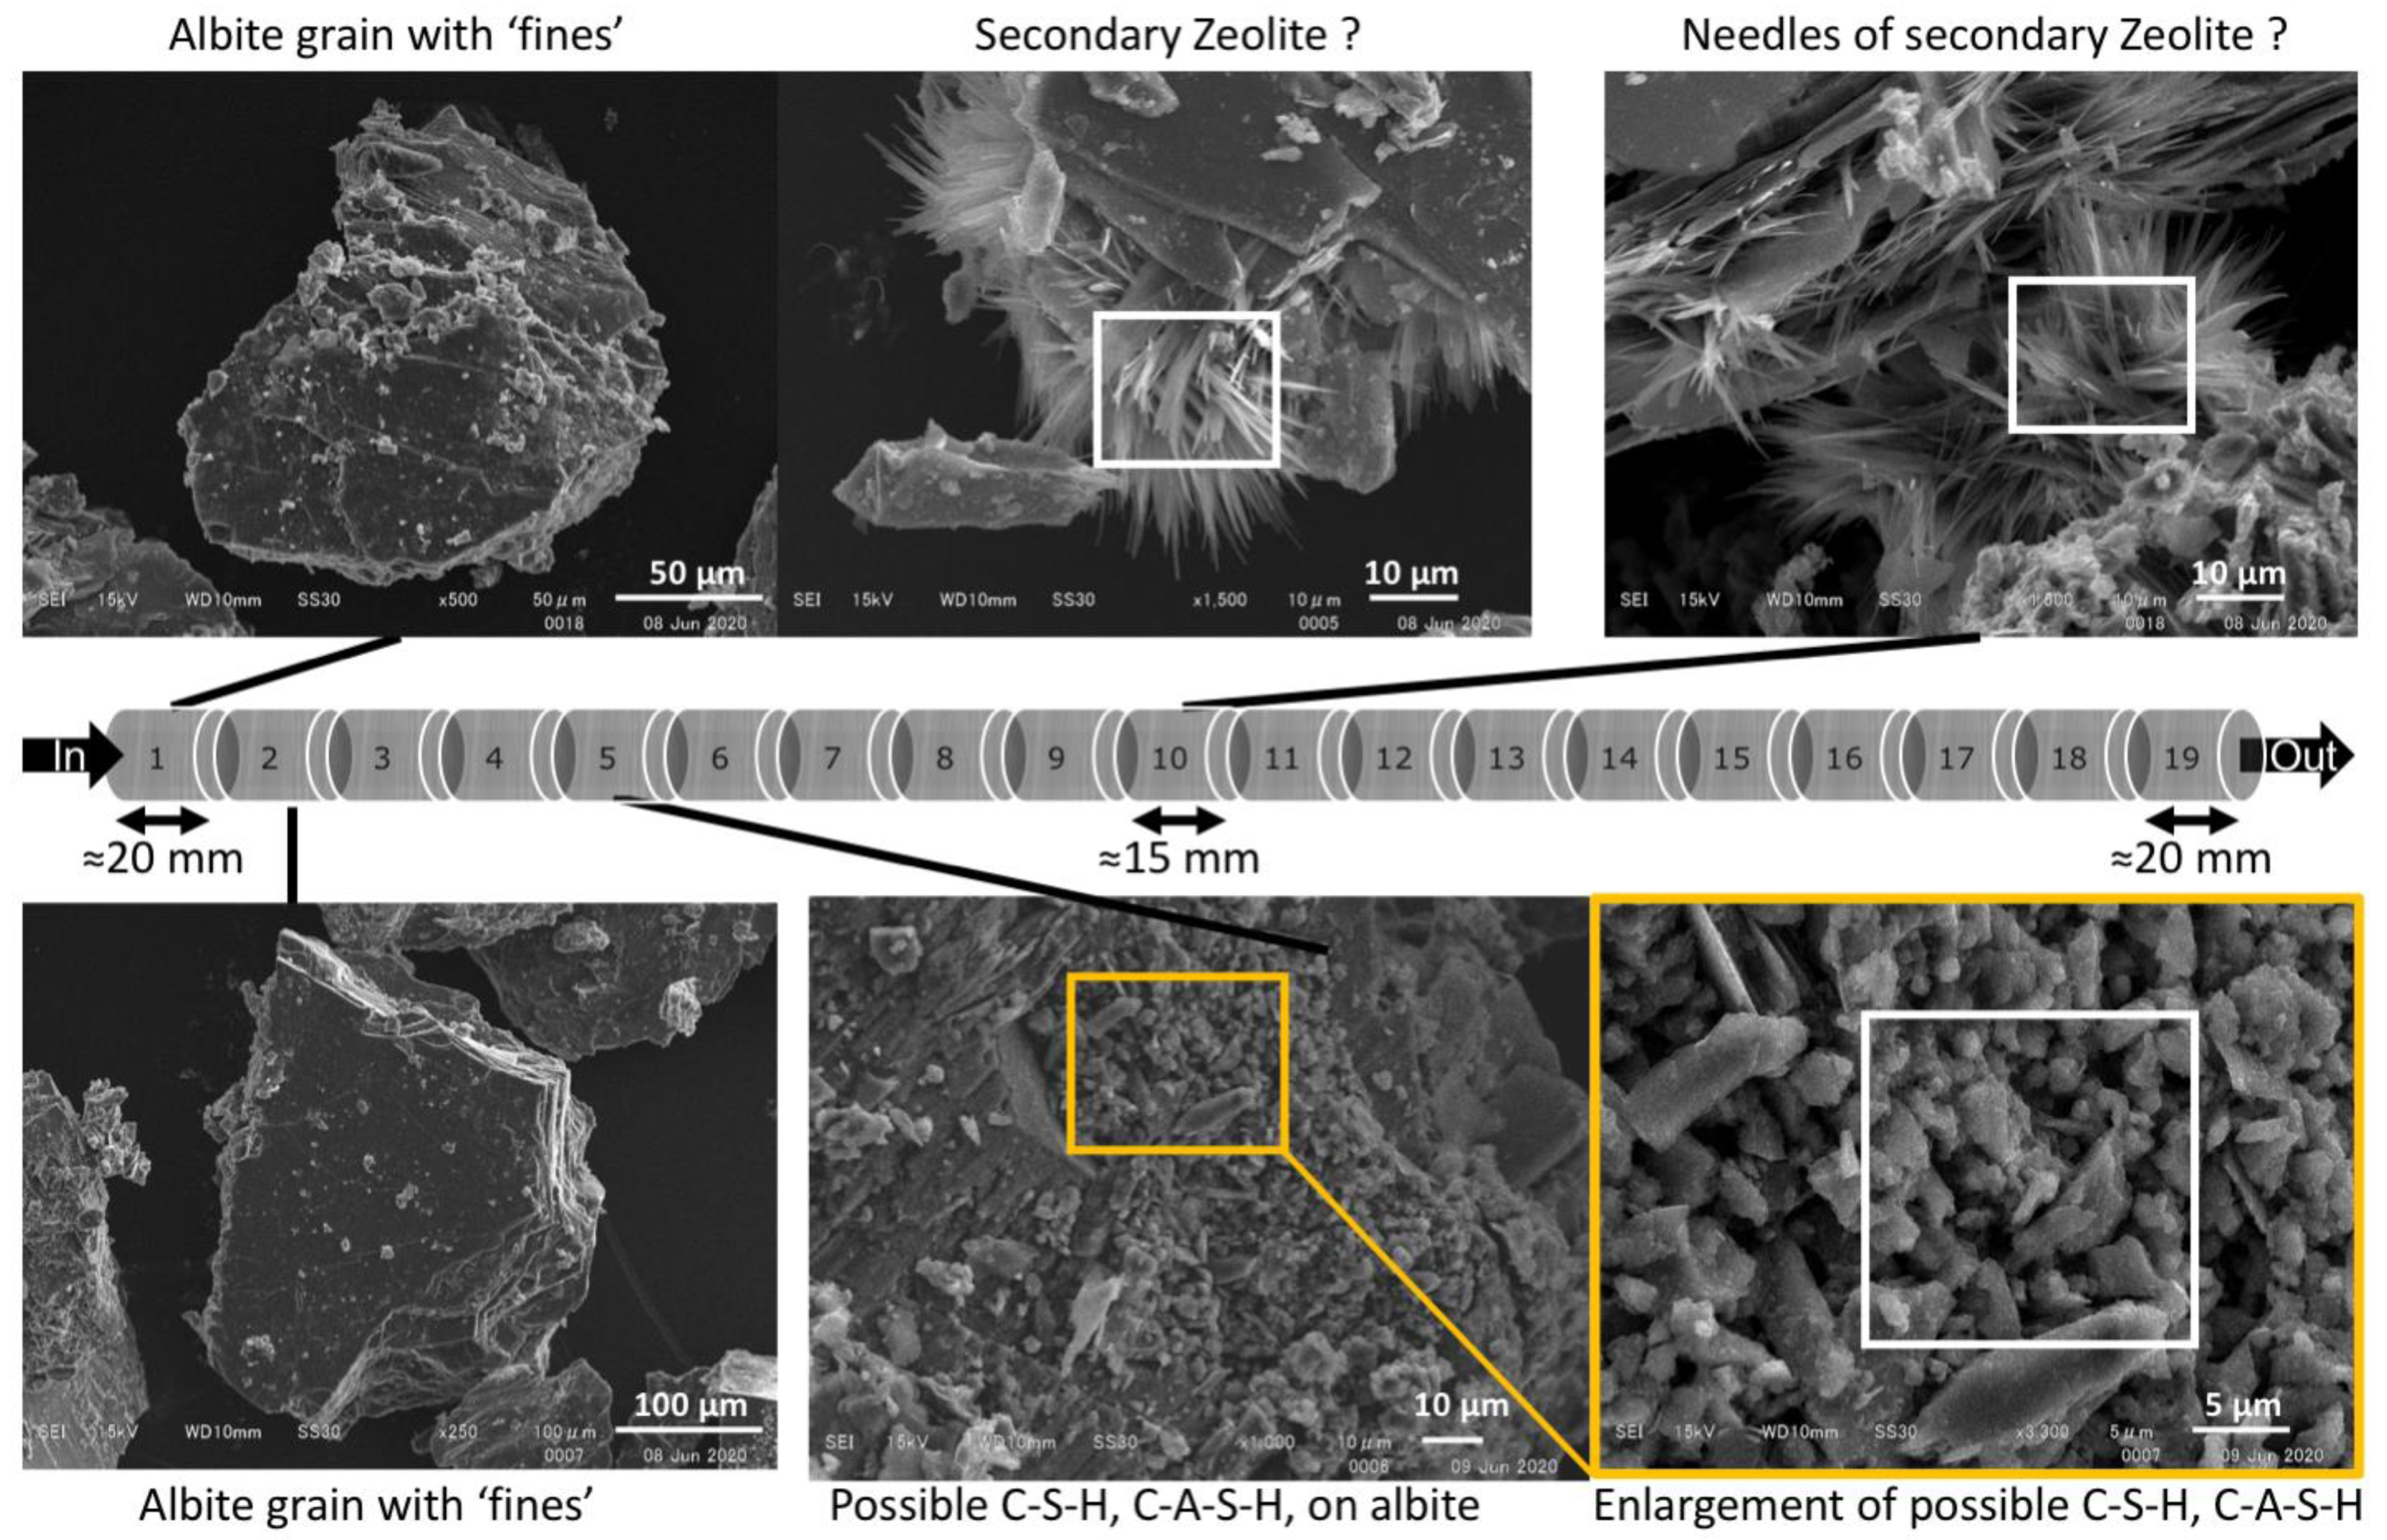
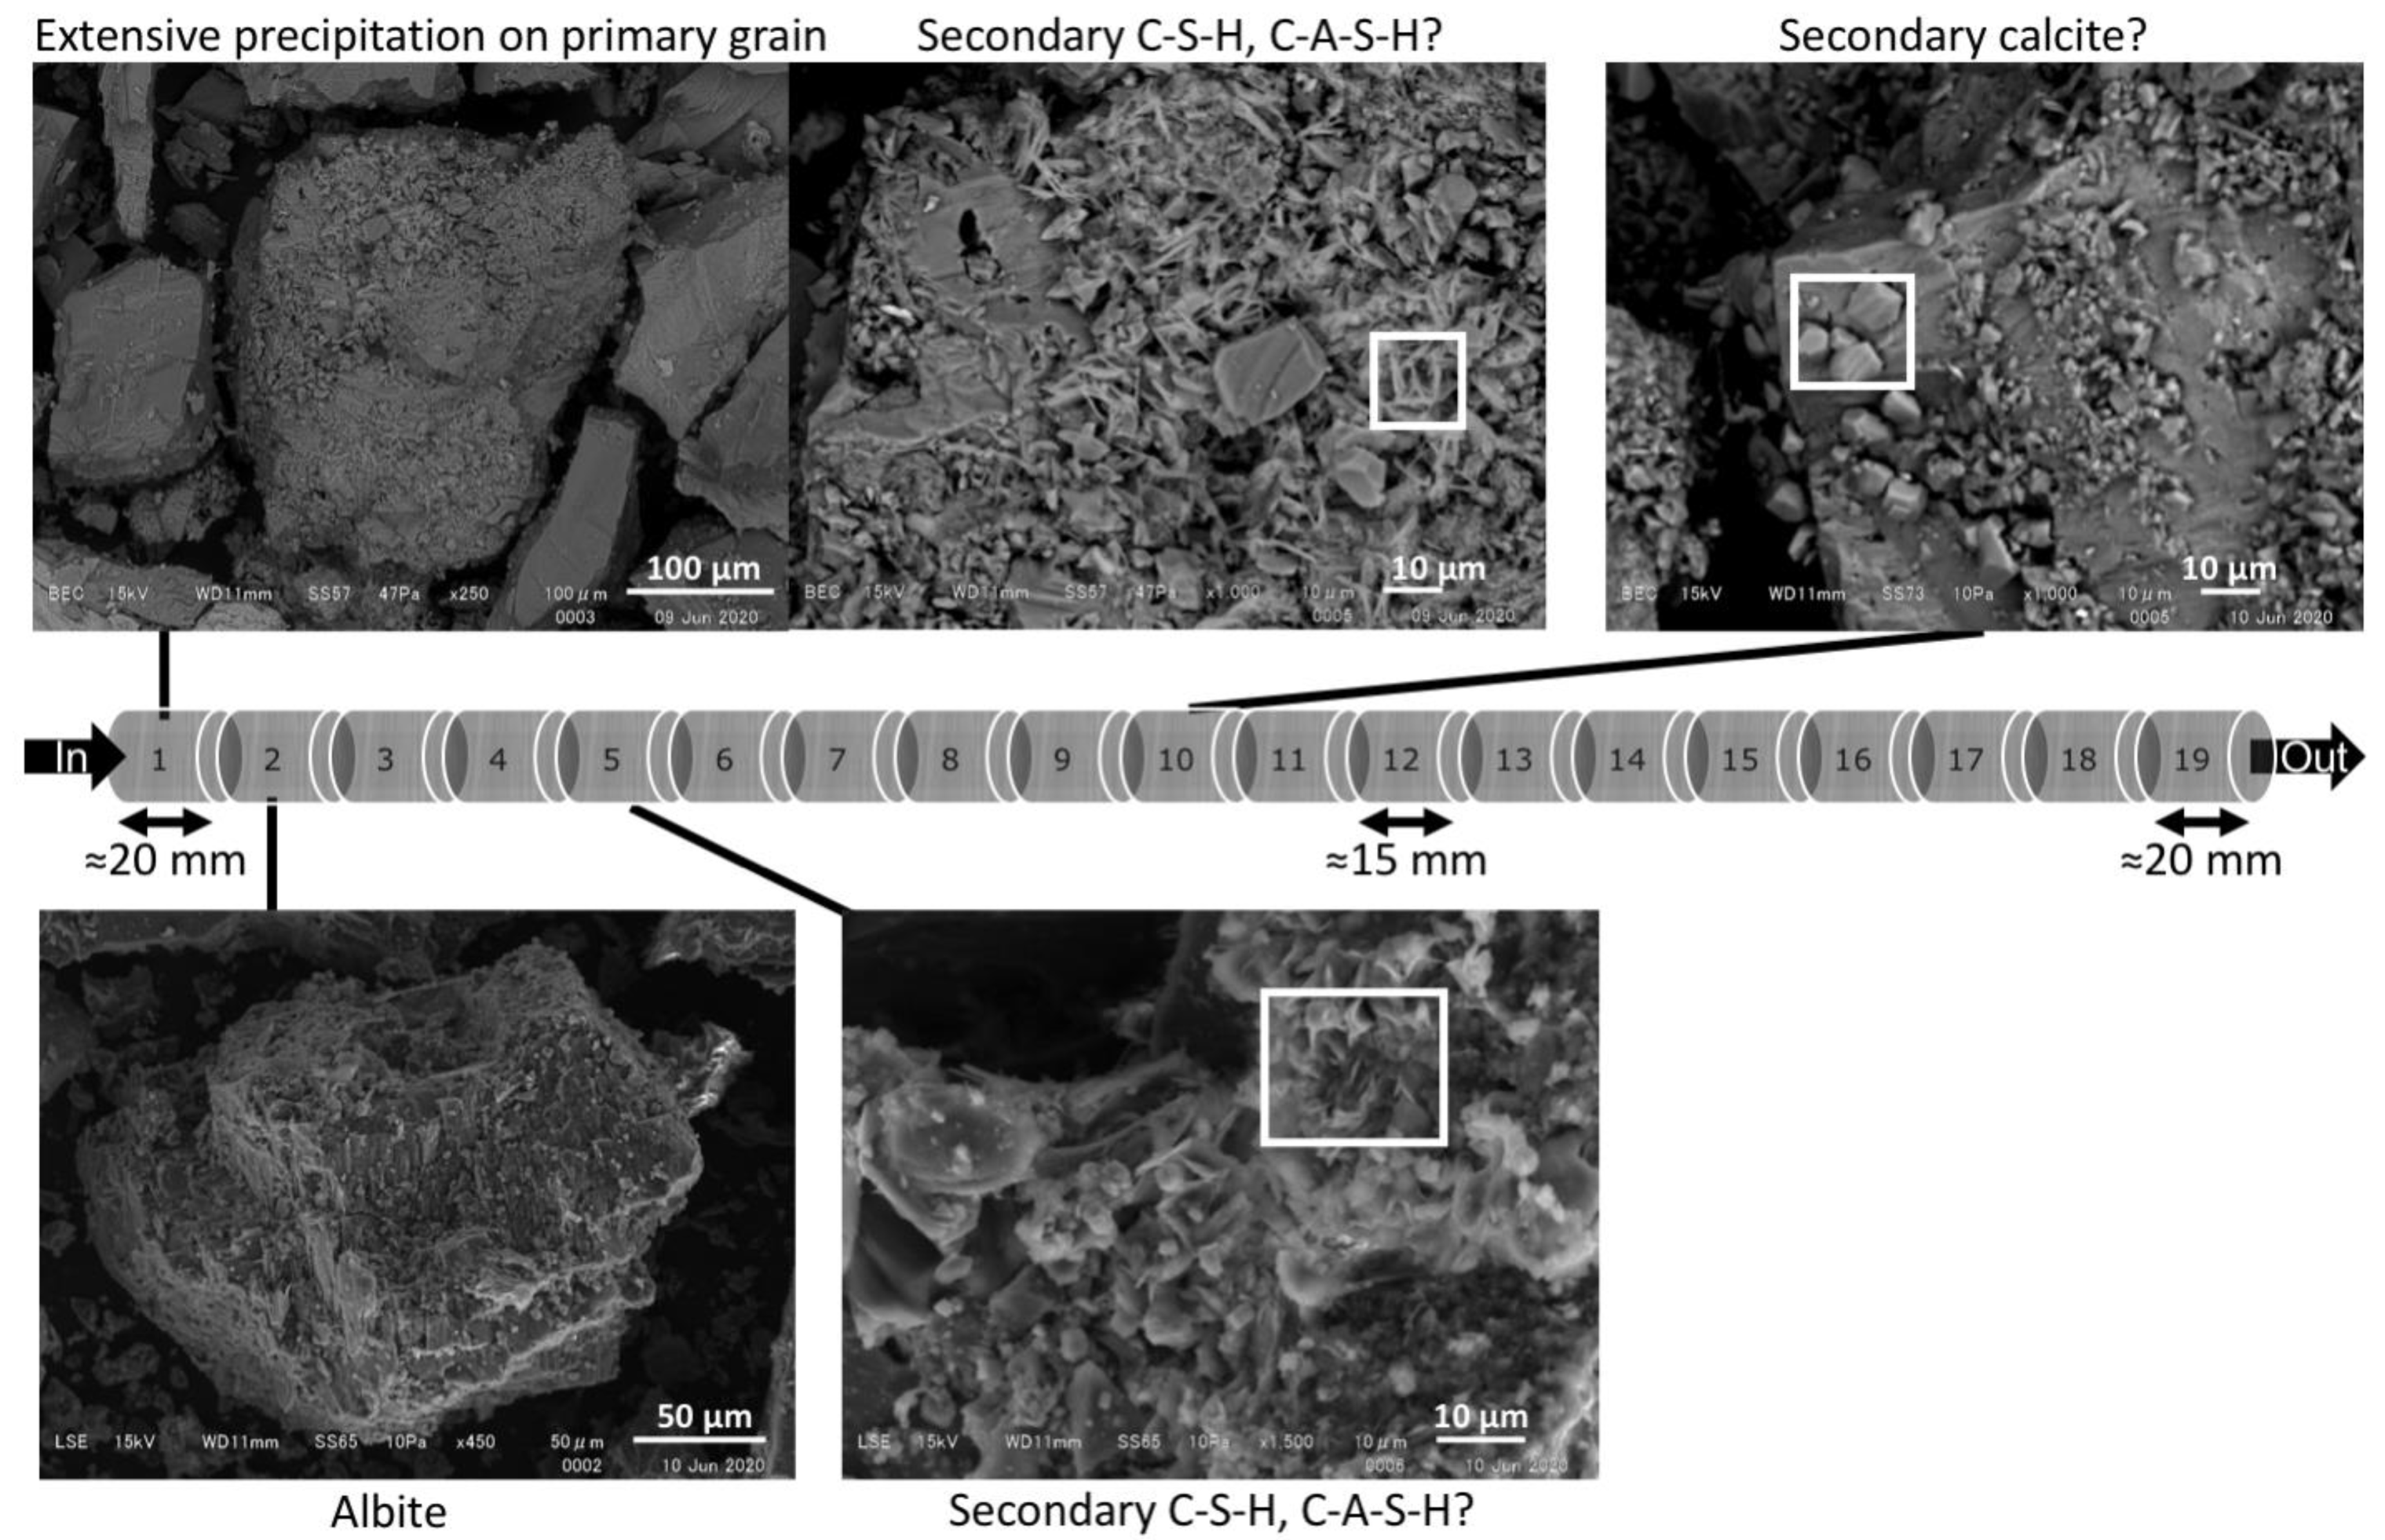
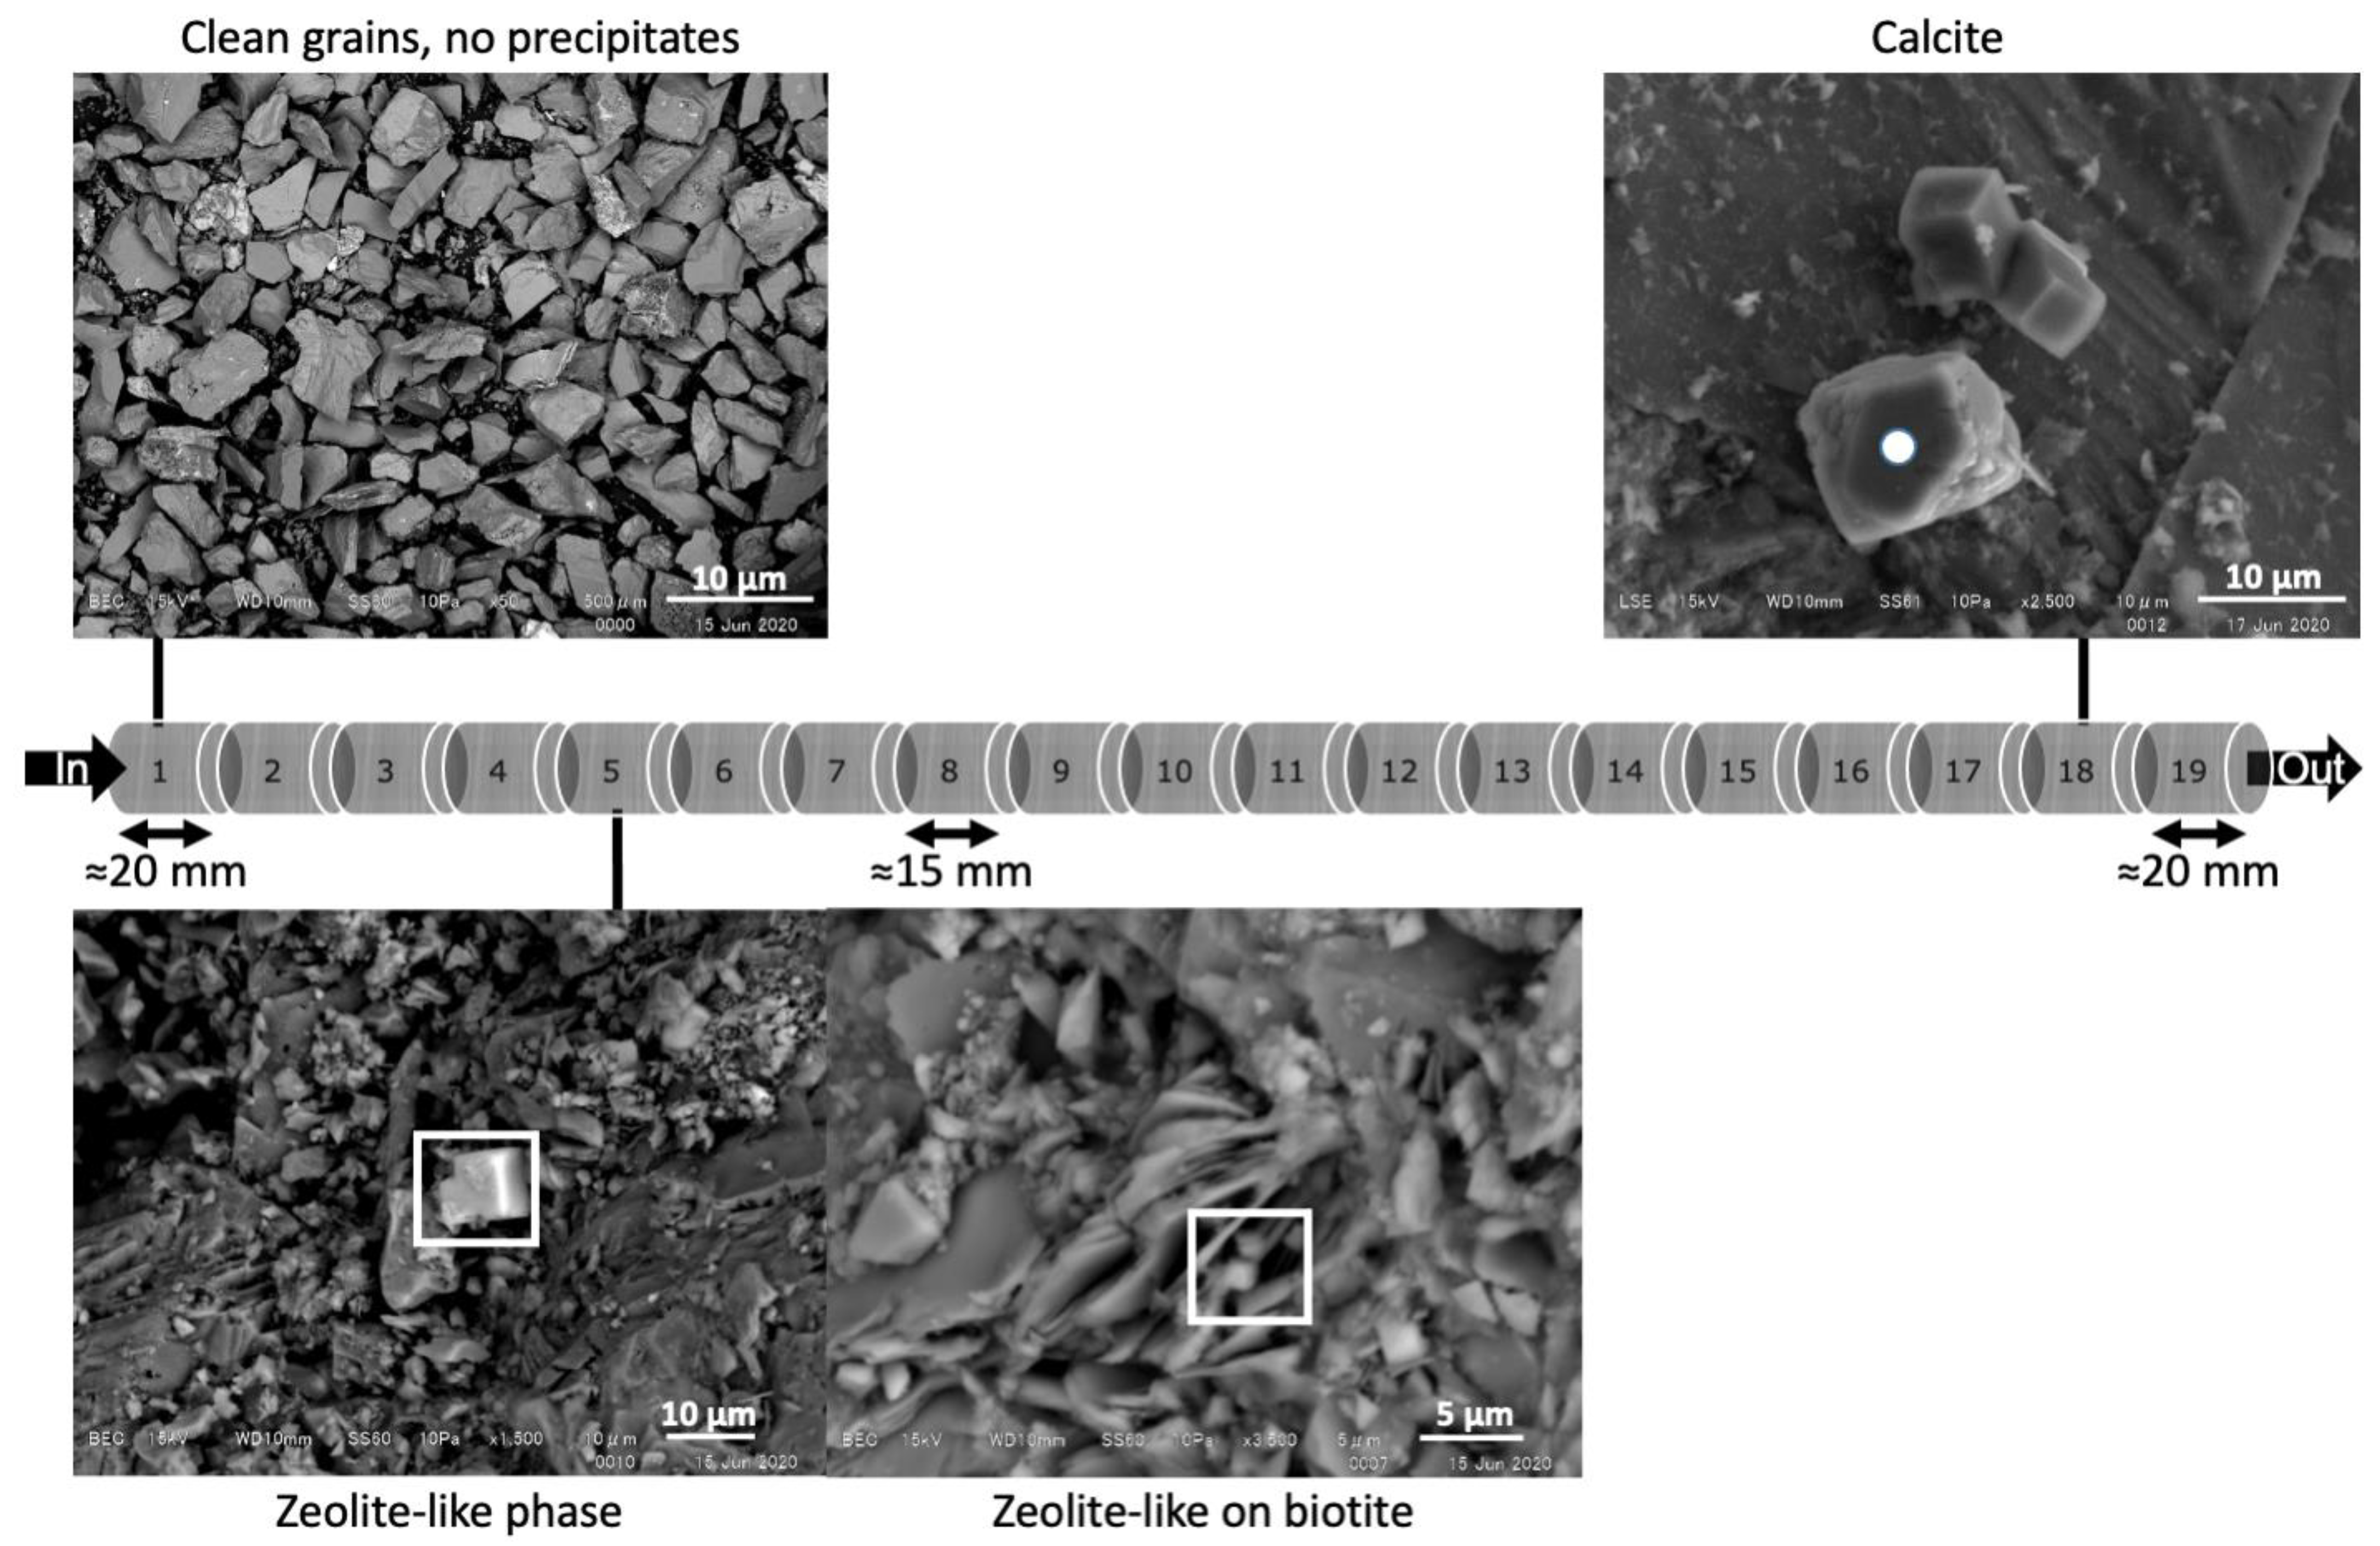
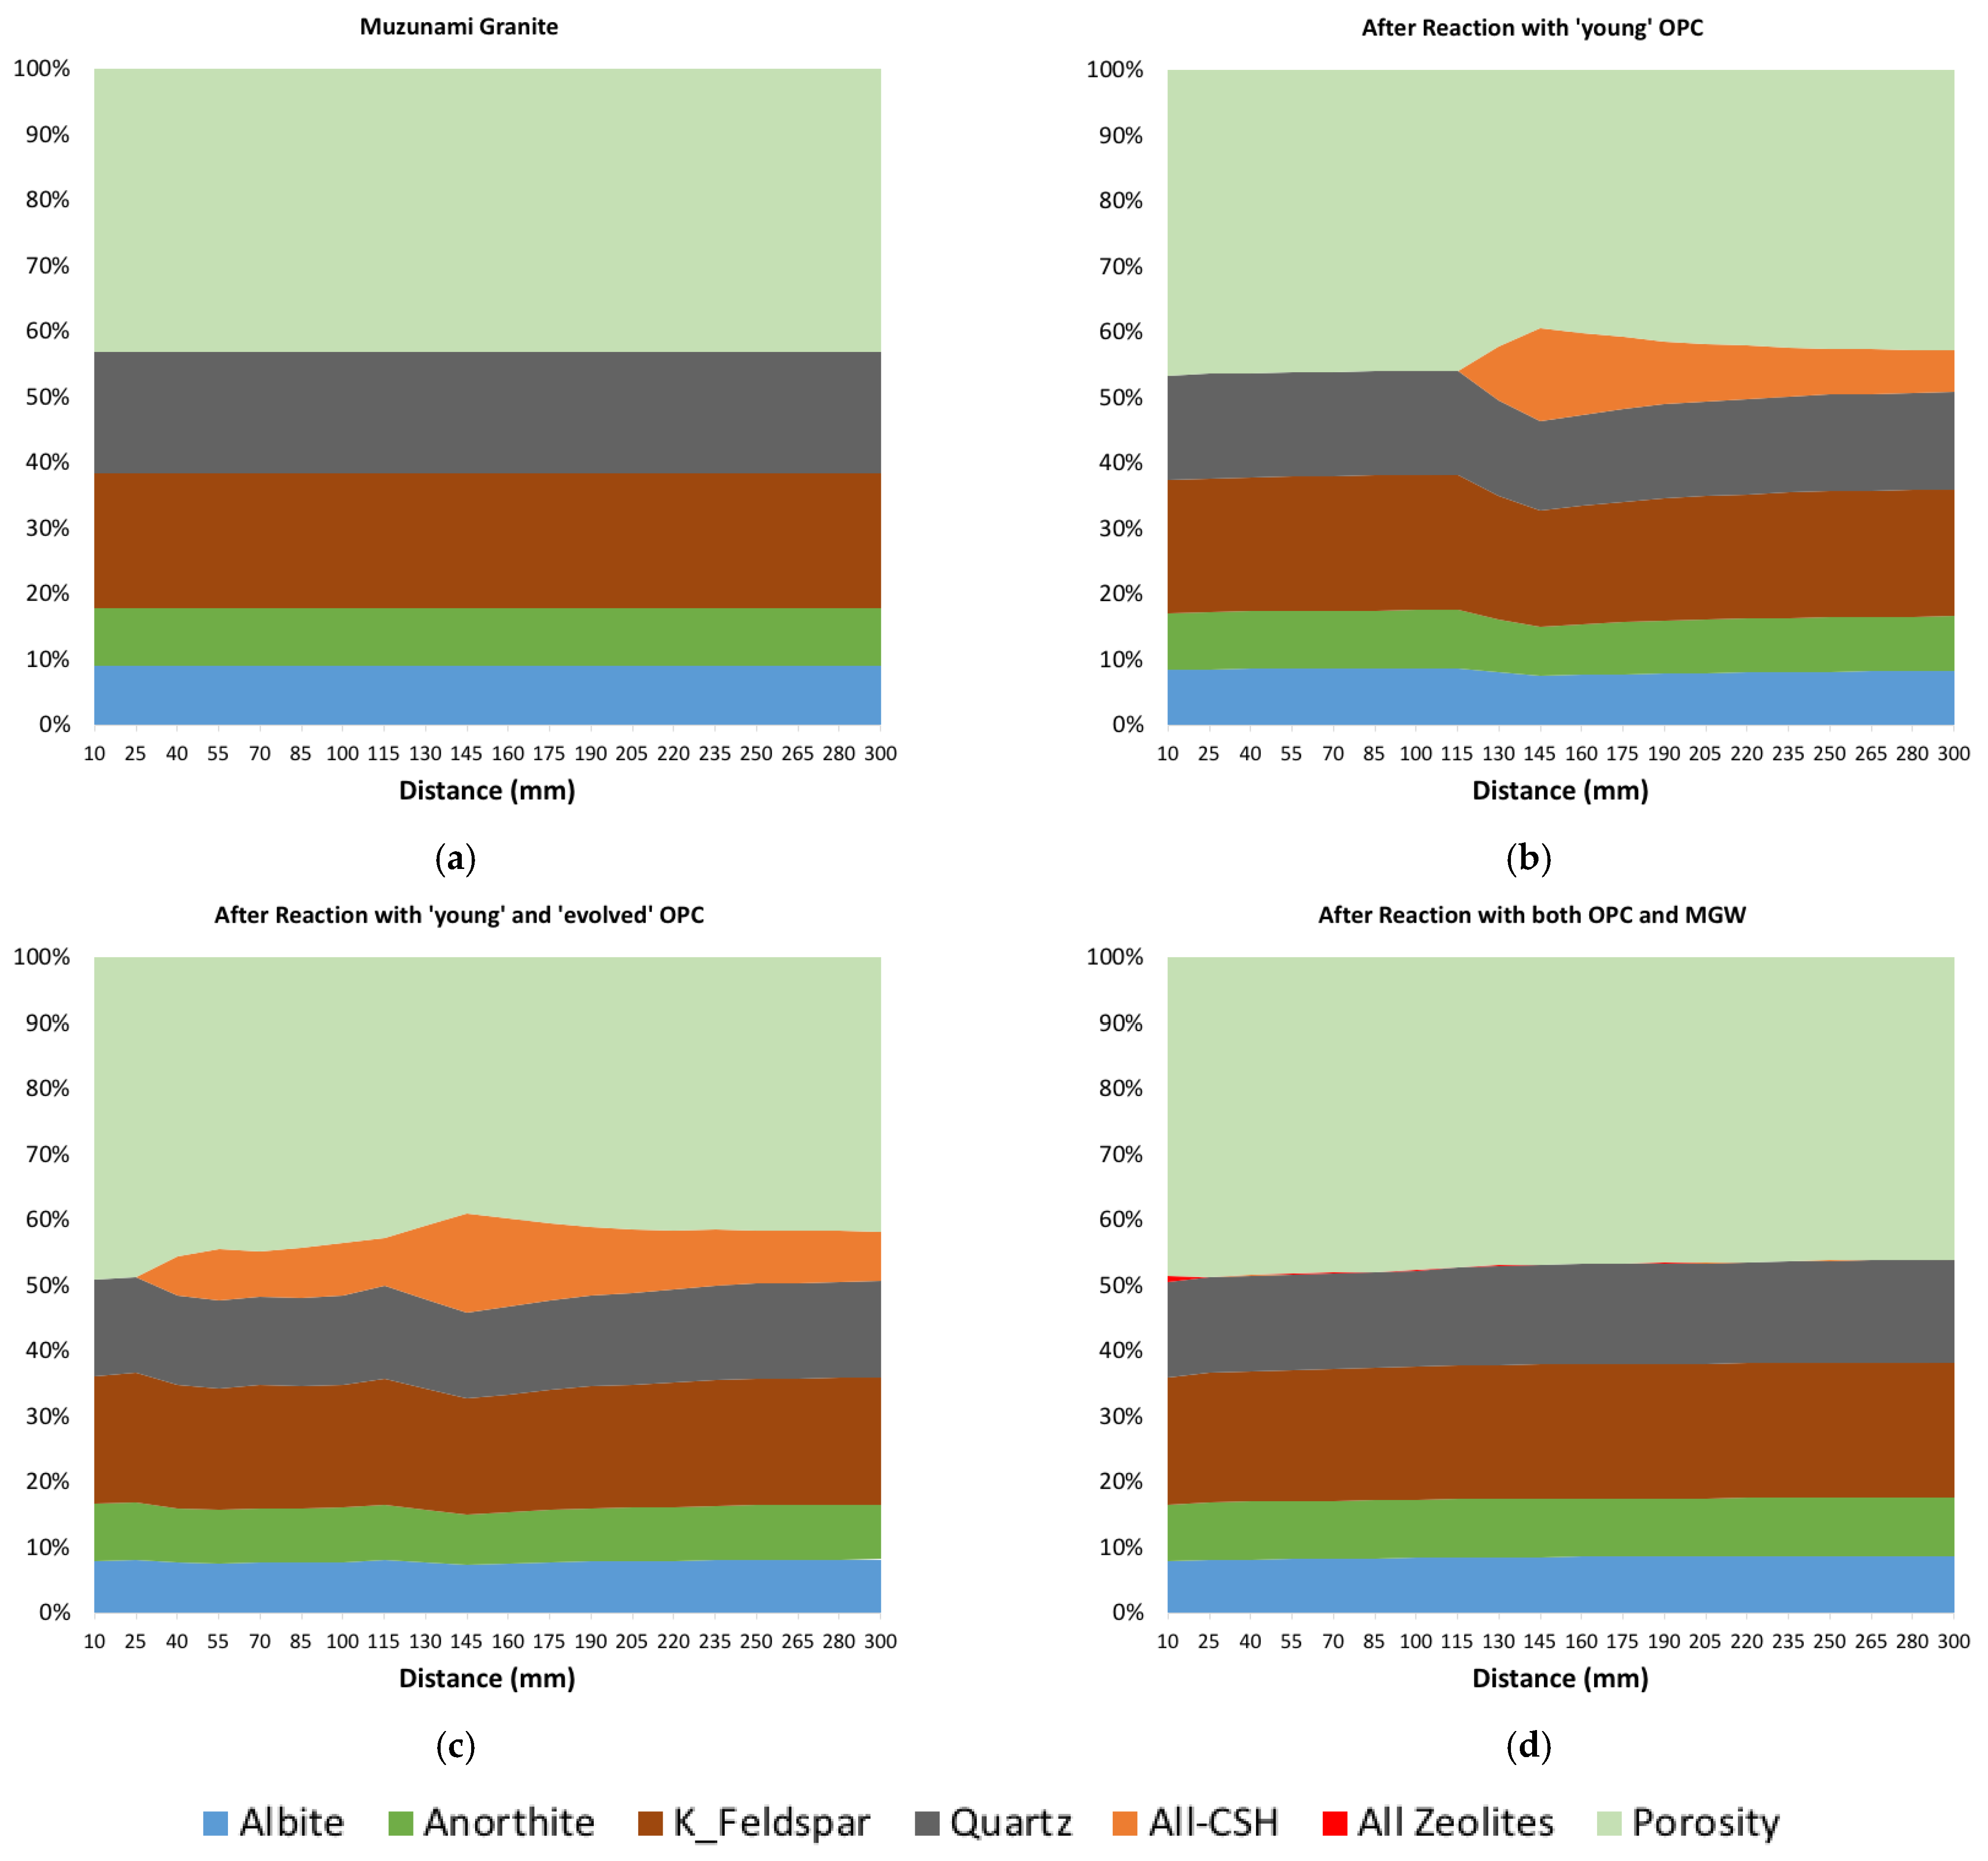
4.2. Mineralogical Analysis

4.2.1. ‘Young’ OPC Leachate Experiment (Col-1)

A summary of the evolution of the mineralogy for Col-1 is shown in Figure 5. XRD analysis of unreacted and reacted granite samples showed no significant changes during reaction (Figure S2a). In Section 1 (~0–20 mm), ‘fines’, formed by the crushing of the sample, were clearly visible on the surfaces of the primary grains. In addition, although not common, ‘needle-like’ secondary crystals (Figure 5) were clearly visible. The semiquantitative SEM–EDS analysis (Figure S2b) indicated a Na/K-Al-silicate composition, possibly a secondary zeolite. In Section 2 (~20–35 mm), the ‘fines’ previously observed in Section 1 were still visible, though subjectively they were less prevalent, and Na-Al-silicates were no longer observed.
In Section 5 (~65–80 mm), there was no evidence for Na/K-Al-silicates, but some secondary phases were observed (Figure 5). SEM–EDS analysis (Figure S2c) of these phases suggested that they may be C-S-H phases, some of which also contained Al, for example, potentially C-A-S-H, but the mineralogical evidence alone was inconclusive. In Section 10 (~140–155 mm), there were some very rare possible C-S-H phases, but ‘needles’ of secondary Na/K-Al-silicates (Figure S2d) were occasionally observed. In Section 18 (~265–280 mm), although Na/K-Al-silicates were still present, subjectively, they appeared less frequently, and no other secondary phases were observed.
PHREEQC [25] was used to calculate mineral SI in the reacted fluids based on the analysed fluid chemistry at each sampling point. The data presented in Figure 6 indicate that the reacted fluids were initially saturated with respect to K-phillipsite, but other zeolites were undersaturated. After ~12 d, K-phillipsite became undersaturated in the reacted fluids. This suggests that the zeolites observed probably formed early on in the experiment but did not (fully) redissolve with time. Initially, C-S-H phases were slightly saturated, in particular, tobermorite-14Å, but by ~21 d, C-S-H phases were slightly undersaturated and remained so for the remaining duration of the experiment.

4.2.2. ‘Young’ and Then ‘Evolved’ OPC Leachate Experiment (Col-2)

A summary of the evolution of the mineralogy of the column reacting the Toki granite with the ‘young’ OPC leachate and then followed by the ‘evolved’ OPC leachate is shown in Figure 7. XRD analysis of unreacted and reacted granite samples showed no significant changes during reaction (Figure S3a). In Section 1 (~0–20 mm) of the column, a variety of features were visible, including clean primary mineral grains and others showing extensive precipitation (Figure 7) of small secondary phases. These phases are most likely C-S-H/C-A-S-H based on the morphology and the EDS spectra, although the presence of Na could indicate a mixture of phases or the underlying albite grain, zeolites were not observed (Figure 7 and Figure S3b). In Section 2 (~20–35 mm), again clean primary grains were observed together with secondary phases, probably C-S-H (Figure 7 and Figure S3c). In Section 5 (~65–80 mm), probable C-S-H phases were also observed. In Section 10 (~140–155 mm), secondary phases were less common and some calcite was observed, though this may have been due to carbonation of possible C-S-H secondary phases (Figure S3d) during sample preparation.
As before, PHREEQC [25] was used to calculate mineral SI in the reacted fluids based on the analysed fluid chemistry. With the ‘young’ OPC leachate in the early reacted fluids, C-S-H phases were slightly saturated (Figure 6 and Figure S4), but again by ~21 d, C-S-H phases were slightly undersaturated. In the ‘evolved’ OPC leachate, C-S-H phases were close to saturation, whilst zeolites were always far from saturation, and calcite (not shown) was undersaturated.

4.2.3. OPC Leachates Then MGW (Col-3)

A summary of the evolution of the mineralogy of the Toki granite with OPC leachates followed by MGW is shown in Figure 8. XRD analysis of unreacted and reacted granite samples showed no significant changes during reaction (Figure S5a). In Sections 1 (~0–20 mm), and 2 (~20–35 mm, not shown), only ‘clean’ primary mineral grains were observed. In Section 5 (~65–80 mm), occasional precipitation of secondary zeolite-like phases was found on biotite grains (Figure 8 and Figure S5b,c). In Section 18 (~265–280 mm), as well as very rare zeolites, occasional calcite was present (Figure 8 and Figure S5d).
This experiment was terminated earlier than planned due to difficulty in maintaining flow through the column; on removing the PEEK frit from the inlet of the column, its porosity was found to be greatly reduced (Figure 9) due to precipitation within the pores of the frit of secondary calcite. This calcite was most likely the result of mixing and subsequent reaction of the high Ca containing ‘evolved’ OPC leachate with the MGW, which contained dissolved bicarbonate. Indeed, the examination of mineral SI in the reacted fluids (Figure 6) indicated that calcite was saturated.

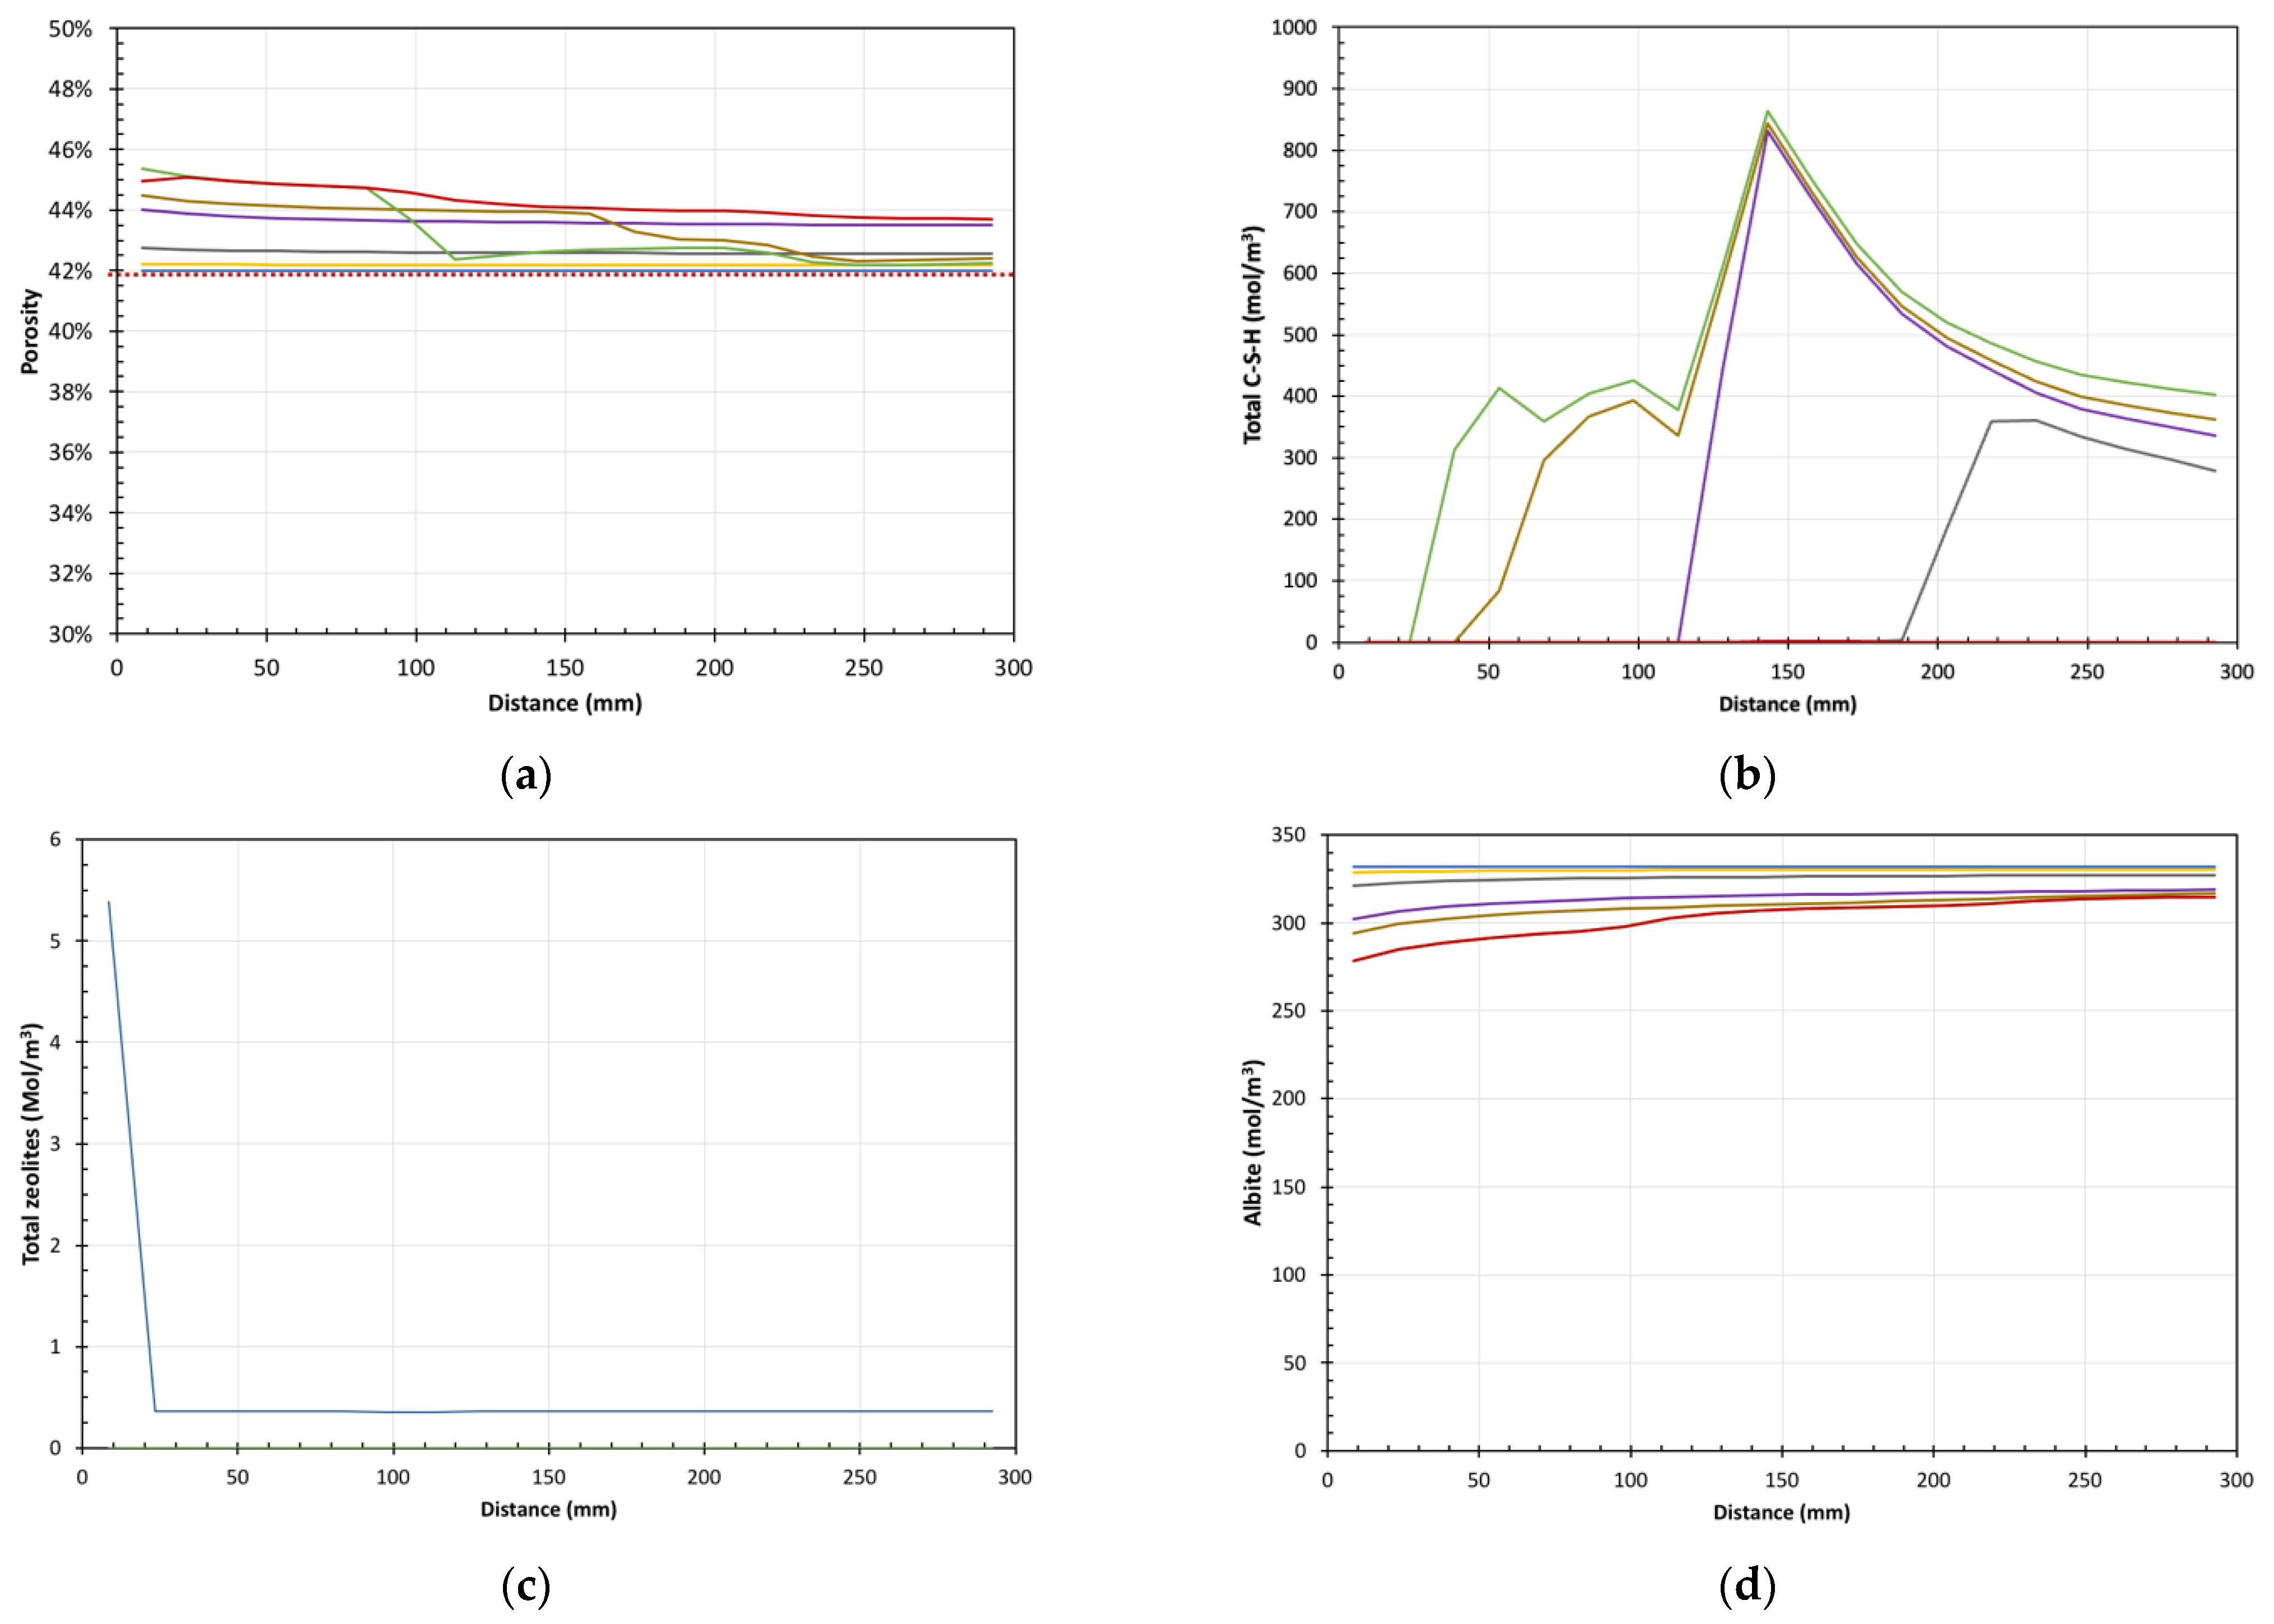
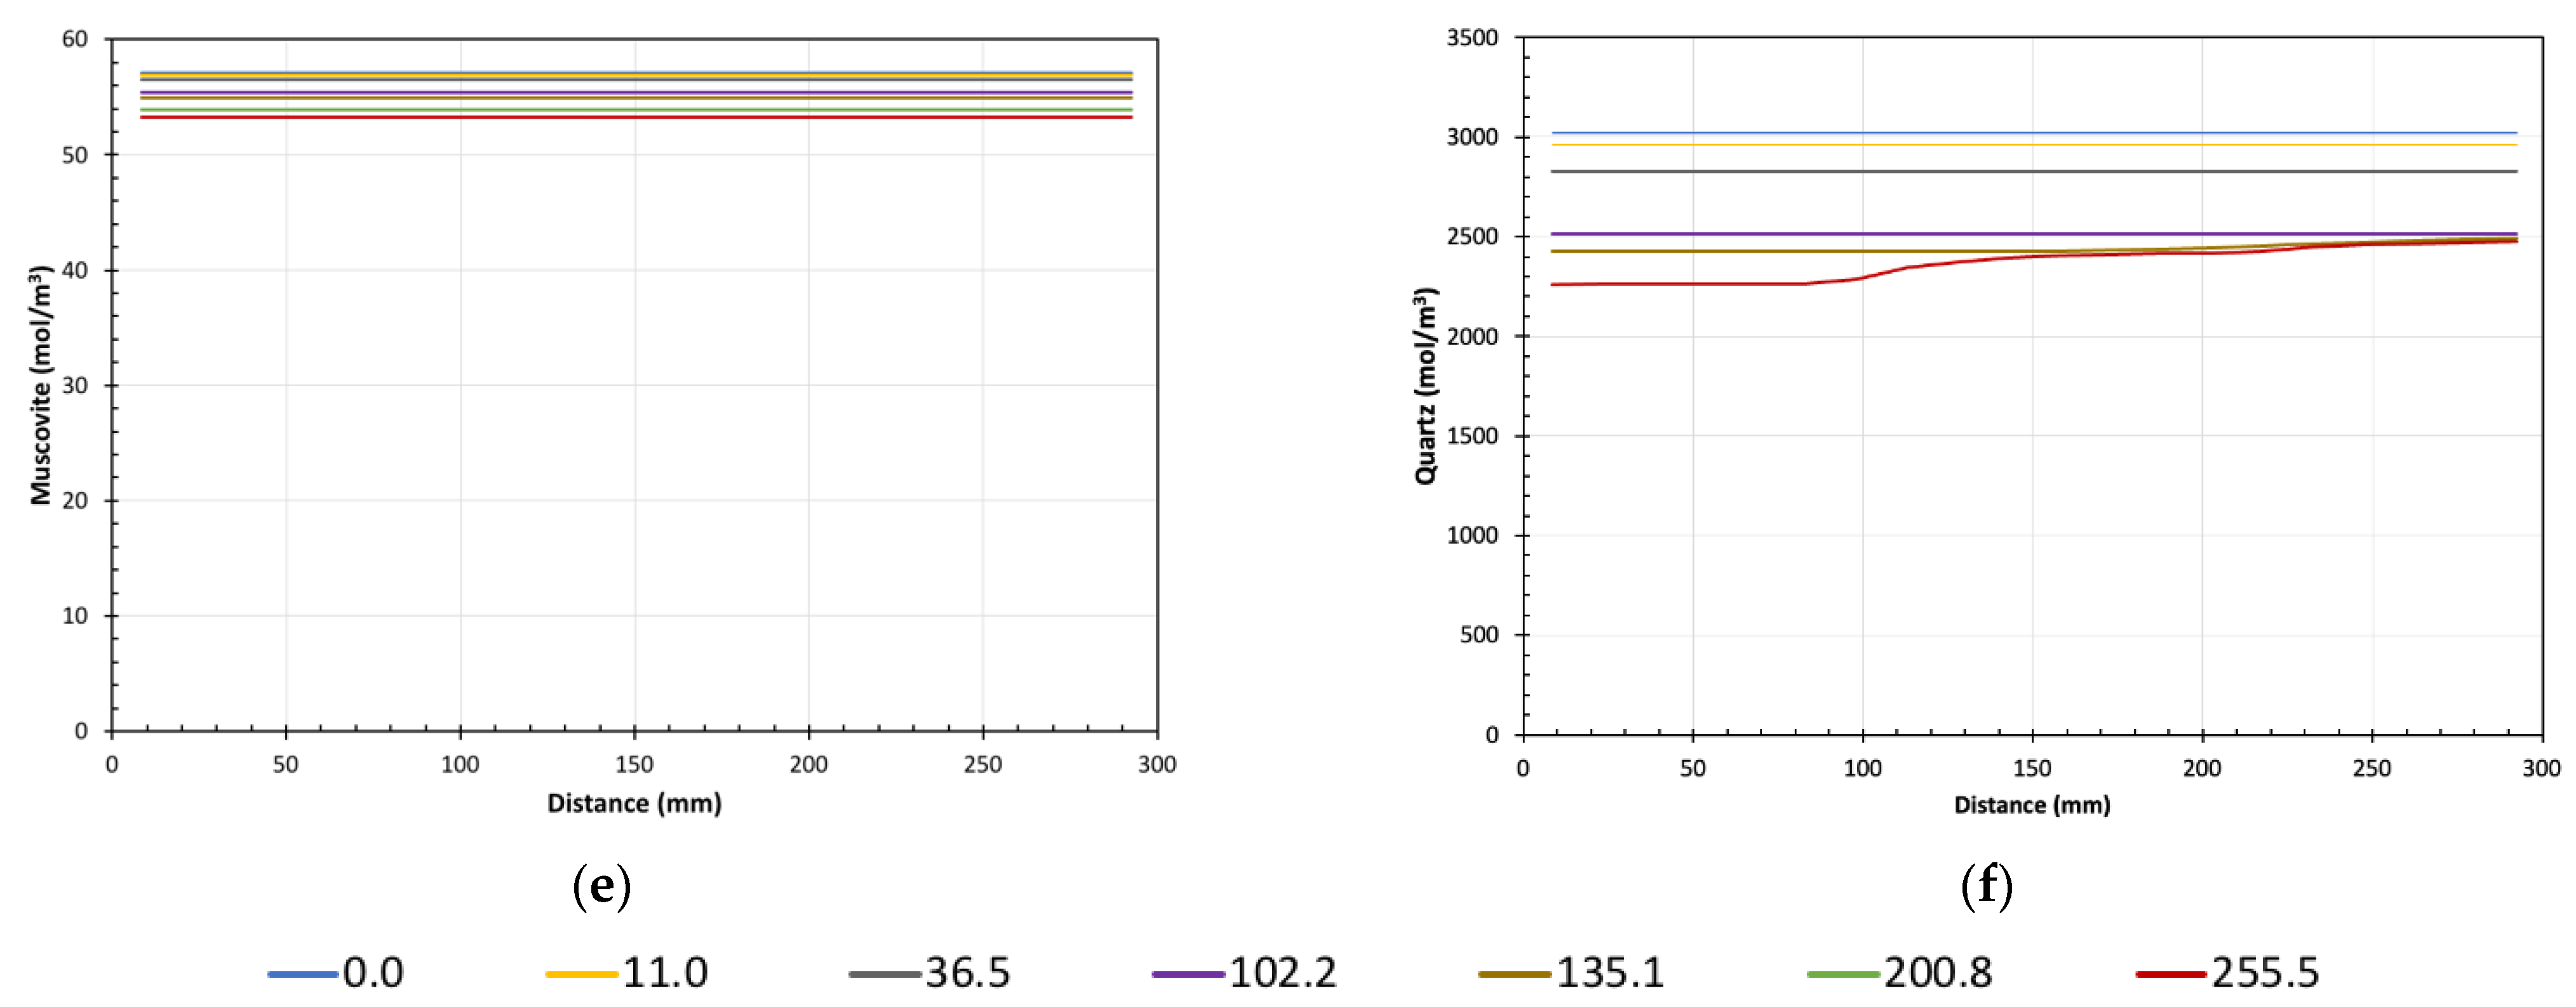
5. Results of Reactive Transport Modelling

To further examine the reaction sequence seen in these experiments, coupled 1D reactive transport models were constructed using the ‘CABARET’ software.

Model Predictions vs. Experimental Data

Figure 10 shows a comparison of the results of the CABARET model compared with the experimental data for the major aqueous components. The model predictions for the evolution of pH, Na, and K (Figure 10a) were a good match for the experimental data. However, with the MGW, the model showed more rapid changes than the experimental observations, though this may be because the reduced flow in the experiment due to the formation of calcite in the PEEK frits was not represented in the model. Generally, calcium concentrations, although reproducing the experimental trends, were higher in the model (Figure 10b). Predicted silica concentrations in the CABARET model did not match the early-stage (0–50 d) experimental data, the initial sharp increase in silica concentrations not being replicated. The reasons for this mismatch are not clear, but one possible explanation could be that, in the experiments, the crushing process produced many highly reactive ‘fines’ that would have reacted before the bulk minerals in the granite; it was not possible to reproduce this variation in a surface area in the model.
Comparisons of the saturation indices (SI) for selected C-S-H and zeolite phases derived from the fluid chemistry and CABARET is shown in Figure 10c,d. For the C-S-H phases (Figure 10c), the trends in saturation are reasonably well reproduced, and the model data, like the experimental data, show initial saturation of C-S-H phases, followed by undersaturation and hence dissolution of C-S-H phases with the MGW. For zeolites (Figure 10d), again the trend in the model is a reasonable match for the experiment-derived SI data, although the absolute numerical values in the model for SI were different. It should be noted that the available thermodynamic data for C-S-H and many zeolites remain poorly known [18], which may account for these numerical differences.
Figure 11 shows the predicted variation of porosity and selected minerals with distance at defined time steps. The variation in porosity with time and distance (Figure 11a) predicts that until the change to MGW, there is a continued but minor increase in overall porosity <2%, and that this is mainly in the first half of the column, suggesting continued minor dissolution of the primary minerals. Only with the MGW was there any significant increase in porosity, most likely related to C-S-H dissolution, and even then, it is <3%.
The predicted changes in porosity mirrored the model prediction of C-S-H phase precipitation (Figure 11b), suggesting that most precipitation occurs with the ‘evolved’ OPC leachate and that with the change to MGW, the C-S-H phases would redissolve. This matches with the experimental observations. Zeolites in the model (Figure 11c) represented only a minor principate, which fits with the experimental observations in which although zeolite-like phases were tentatively identified, they did not occur in any significant amounts. Also shown in Figure 11 are exemplar data for the primary minerals, which show continued dissolution with time with most dissolution being within the first half of the column (Figure 11d–f).
Figure 12 shows summary plots of the changes in composition of modelled mineral assemblage for the unreacted Toki granite and after reaction with each fluid (i.e., time = 0, ~100, ~200, ~255 d). These illustrate the variation in the relative proportions of the primary and secondary minerals with time and distance. The increase in the volume of C-S-H phases precipitated with the ‘evolved’ OPC leachate compared with the ‘young’ leachate and the increased spatial extent is evident, as is the complete removal of C-S-H phases following reaction with MGW. Zeolites were predicted to form but only in very small amounts. In addition, primary minerals, though showing slight dissolution, dominate the mineral assemblage throughout. Overall, the model matches the sequence of reaction observed in the experiments (see Figure 5, Figure 6, Figure 7 and Figure 8).

6. Discussion

In summary, the experimental data obtained from this study on the reaction of granite with highly alkaline leachates are consistent with previous modelling and experimental studies on other host rocks [9,10,11,12,14,16,32]. However, there was less reaction of the Toki granite compared with other experimental data for crystalline rocks [10,12], though it should be noted that all these studies were at slightly elevated temperatures (50–70 °C), which would have increased the mineral dissolution and the potential for secondary mineral products.

6.1. Chemistry and Mineralogy

The small deceases in pH, <0.2, with the OPC leachates were similar to that seen in a previous work conducted using crystalline rocks [10,12]. With the change to MGW, pH further decreased towards that of the groundwater within ~30 d. It should be noted that the observed pH in the experiment with the MGW was higher than the model predictions, but this was most likely due to the flow rate being reduced due to calcite precipitation from the mixing of the high [Ca] ‘evolved’ OPC leachate and the bicarbonate containing (~80 mg/L) groundwater. Both Na and K concentrations within analytical error showed little difference from the reacting fluids. Calcium and silica showed the most significant changes, with [Ca] decreasing in the OPC leachates. Although [SiO2] initially increased, silica then decreased and remained low throughout the experiments until the change to MGW when silica concentrations increased, this most likely being due to the redissolution of the previously precipitated C-S-H phases.
The sequential reaction of the granite with the OPC leachates was dominated by the initial precipitation of C-(A-)S-H phases of varying compositions (fluid chemical mineral saturation data, SEM–EDS, semiquantitative analysis) and the occasional observation of zeolite-like phases, as seen in previous studies [9,10,12]. With the change to the Ca-rich ‘evolved’ OPC leachate, tentatively identified C-(A-)S-H phases were the only secondary precipitates. With the change to MGW, C-(A-)S-H would have dissolved due to the lower pH of the groundwater. This general sequence of mineral evolution was also matched by the predicted mineral assemblage in the CABARET modelling. A similar pattern of C-(A-)S-H phase formation and redissolution with groundwater was also previously observed in experiments with a generic crystalline rock [12].
In terms of total amount of C-S-H precipitation, a simple mass balance calculation, assuming that all the Ca lost from the fluid had precipitated as a ‘tobermorite-type’ phase, suggests that a maximum of <1 wt% C-S-H would be present in Col-1, compared with the mass of Toki granite. For the ‘young’ followed by the ‘evolved’ OPC leachate (Col-2), the mass balance suggested a maximum of ~2 wt% C-S-H. The degree of precipitation of C-(A-)S-H was less than that observed in other studies with crystalline rocks [9,10,12], which reported that C-(A-)S-H formed on most grains, but it should be noted that those previous studies were performed at elevated temperatures, which will have increased mineral reaction rates and hence availability of silica (and Al) for the precipitation of C-(A-)S-H.
The greater abundance of C-S-H phases with the Ca-dominated ‘evolved’ OPC leachate could enhance radionuclide sorption and reduce migration during this period. However, the later redissolution of the C-S-H phases with groundwater means that any radionuclides associated with these phases would then be (re)released.

6.2. Extent of Reaction

In general, the dissolution of the primary minerals and the precipitation of secondary phases were observed over the first ~150 mm of the columns, which is similar to previous laboratory studies using crystalline rocks [9,10,12], in which a large zone of reaction was observed. This contrasts with experimental studies using sedimentary rocks [7,11,13,16] in which the extent of reactions was limited to only the first few millimetres, illustrating the difference in reactivity of the sedimentary versus crystalline rocks. However, it must be remembered that most experimental studies, including this one, used crushed samples with larger reactive surface areas and higher porosities than natural samples. The greater surface area will have enhanced the reaction of the granite with the OPC leachates, whilst the higher porosity will also have allowed transport over a greater distance. To fully understand the true extent of the chemically disturbed zone (CDZ) in crystalline rock, experiments with intact samples are required. These would enable the relationship between reduced porosity (perhaps < 1%) and extent of reaction (both dissolution and secondary mineral evolution) to be determined.
The experiments provided mineralogical data only at four time steps (i.e., at the start and at ~100 and ~200 and at the end of the experiment), and the outflow fluid chemistry was only sampled intermittently. Since the CABARET model predictions were in general agreement with the experimental data at these specific time steps, the model simulations can then be used to examine how the chemical and spatial changes may have evolved between these time steps. In addition, it is possible to predict the changes in fluid chemistry along the columns’ length, which are technically complex to determine experimentally.

6.3. Recommendations for Model Improvements and Validation

The necessity to understand the timing and extent of the sequence of reactions to evaluate the precise effect of mineral evolution could be further addressed by longer-duration experiments with intact samples. These would provide additional data for model validation to aid the understanding of the temporal and spatial extents of the reactions on mineral evolution (precipitation and dissolution).
Further improvements to the simulation software are also required to analyse and extend the results from such experimental programmes to repository scales. The treatment of a surface area, although improving, remains an issue. For example, in CABARET, the reactive surface area for each mineral is assigned a fixed value (dependent on the initial mineral abundance) in the model setup file, and in CABARET, this does not subsequently vary with dissolution or precipitation, whereas in the experiments, the reactive surface areas of minerals will change due to the fact that precipitation/dissolution reactions and mineral grain sizes and morphology will evolve. Some studies have attempted to consider greater complexity surface areas for secondary minerals by considering Ostwald ripening [33], but the data required for such models is generally lacking. In addition, this approach does not account for reduction in reactive surface area due to coating of primary minerals by precipitated secondary minerals.
Additionally, it is difficult to reproduce potential experimental artefacts, such as the presence of highly reactive ‘fines’ caused by the crushing process, which will dissolve preferentially [34], although the use of intact samples would perhaps alleviate this constraint. However, reactive transport models, such as CABARET, as used in this study, have demonstrated general agreement with the experimental data, which gives greater confidence in the potential to make predictions beyond experimental time and distance scales.

Supplementary Materials

The following supporting information can be downloaded at: https://www.mdpi.com/article/10.3390/min12070883/s1: Figure S1: Major changes in fluid chemistry with time. (a) Toki Granite with ‘young’ OPC leachate (Col-1); (b) Toki Granite with ‘young’ OPC, then ‘evolved OPC leachate (Col-2); Figure S2: (a) XRD analysis of unreacted and reacted granite samples in experiment with ‘young’ OPC, (Col-1, Sections 2 and 5). Showing little difference between unreacted and reacted solids. SEM–EDS figures: (b) Section 1, (c) Section 5, (d) Section 10; Figure S3: (a) XRD analysis of unreacted and reacted granite samples in experiment with ‘young’ OPC, then the ‘evolved OPC leachate (Col-2, Sections 1 and 2). Showing little difference between unreacted and reacted solids. SEM–EDS figures: (b) Section 1, (c) Section 5, (d) Section 10, Figure S4: Selected primary mineral and C-S-H phase saturation states in reacted fluids, experiment with ‘young’ OPC, then the ‘evolved OPC leachate (Col-2); Figure S5: (a) XRD analysis of unreacted and reacted granite samples in experiment with ‘young’ OPC, then the ‘evolved OPC leachate, followed by MGW (Col-3, Sections 1 and 10). Showing little difference between unreacted and reacted solids apart from the presence of calcite (Sections 1 and 2). SEM–EDS figures (b,c): Section 5; (d) Section 18; Table S1: Calculated log K(297.15 K) for the hypothetical minerals, ‘young’ OPC leachate; Table S2: Calculated log K(297.15 K) for the hypothetical minerals, ‘evolved’ OPC leachate; Table S3: Calculated log K(297.15 K) for the hypothetical minerals, Mizunami groundwater; Table S4: Details of the dissolved chemical species included in the CABARET reactive transport model.

Author Contributions

The individual contributions to this paper are as follows: Conceptualisation and methodology, K.B., Y.A., Y.T., Y.H., M.K., J.W. and T.S.; validation, K.B., S.M., M.K. and Y.O.; investigation and formal analysis, K.B., S.M., Y.H., M.K., J.W., T.S. and Y.O.; resources, Y.T. and Y.A.; data curation, K.B., S.M., Y.H., J.W., T.S. and Y.O.; writing—original draft preparation, K.B.; writing—review and editing, all authors. All authors have read and agreed to the published version of the manuscript.

Funding

This study was partly performed as a part of ‘The project for validating near-field assessment methodology in geological disposal (FY2020, Grant Number: JPJ007597)’, supported by the Ministry of Economy, Trade, and Industry of Japan.

Data Availability Statement

The data used in this study are available from the authors upon request.

Acknowledgments

We thank Hikari Beppu and Takashi Endo for their assistance in fluid chemical analysis. This study was supported by the JAEA Mizunami Underground Research Laboratory, Gifu, Japan, providing the rock samples and background information.

Conflicts of Interest

The authors declare no conflict of interest.

References

  1. JNC. H12: Project to Establish the Scientific and Technical Basis for HLW Disposal in Japan, Project Overview Report and Three Supporting Reports. JNC TN1410 2000-001~004. 2000. Available online: https://jopss.jaea.go.jp/pdfdata/JNC-TN1410-2000-003.pdf (accessed on 4 May 2022).
  2. Baker, A.J.; Bateman, K.; Hyslop, E.K.; Ilett, D.J.; Linklater, C.M.; Milodowski, A.E.; Noy, D.J.; Rochelle, C.A.; Tweed, C.J. Research on the Alkaline Disturbed Zone Resulting from Cement-Water-Rock Reactions around a Cementitious Repository; UK Nirex Ltd.: Oxfordshire, UK, 2002. [Google Scholar]
  3. JAEA. Second Progress Report on Research and Development for TRU Waste Disposal in Japan; Repository Design, Safety Assessment and Means of Implementation in the Generic Phase (TRU-2). JAEA-Review 2007-010, 2007/03. 2007. Available online: https://www.jaea.go.jp/04/be/documents/doc_02.html (accessed on 4 May 2022).
  4. Falck, W.E.; Nilsson, K.-F. Geological Disposal of Radioactive Waste-Moving towards Implementation. In JRC Reference Reports, JRC45385 (EUR 23925 E); European Commission: Brussels, Belgium, 2009; Available online: https://op.europa.eu/en/publication-detail/-/publication/566e802a-2eb5-45af-ba47-787d3df4b05d/language-en (accessed on 4 May 2022).
  5. Atkinson, A. The time dependence of pH within a repository for radioactive waste disposal. In UKAEA Report AERE-R 11777; UKAEA: Oxfordshire, UK, 1985. [Google Scholar]
  6. Berner, U. Evolution of pore water chemistry during degradation of cement in a radioactive waste repository environment. Waste Manag. 1992, 12, 201–219. [Google Scholar] [CrossRef]
  7. Wilson, J.; Bateman, K.; Tachi, Y. The impact of cement on argillaceous rocks in radioactive waste disposal systems: A review focusing on key processes and remaining issues. Appl. Geochem. 2021, 130, 104979. [Google Scholar] [CrossRef]
  8. Levenspiel, O. Chemical Reaction Engineering, 3rd ed.; Wiley: Hoboken, NJ, USA, 1998; ISBN 978-0-471-25424-9. [Google Scholar]
  9. Bateman, K.; Coombs, P.; Pearce, J.M.; Wetton, P.D. Nagra/Nirex/SKB Column Experiments; Fluid Chemical and Mineralogical Studies. In British Geological Survey Report WE/95/26; British Geological Survey: Nottingham, UK, 2001. [Google Scholar]
  10. Bateman, K.; Coombs, P.; Pearce, J.M.; Noy, D.J.; Wetton, P.D. Fluid Rock Interactions in the Disturbed Zone: Nagra/Nirex/SKB Column Experiments-Phase II. In British Geological Survey Report WE/99/5; British Geological Survey: Nottingham, UK, 2001. [Google Scholar]
  11. Taubald, H.; Bauer, A.; Schafer, T.; Geckeis, H.; Satir, M.; Kim, J.I. Experimental investigation of the effect of high-pH solutions on the Opalinus Shale and the Hammerschmiede Smectite. Clay Miner. 2000, 35, 515–524. [Google Scholar] [CrossRef]
  12. Small, J.S.; Byran, N.; Lloyd, J.R.; Milodowski, A.E.; Shaw, S.; Morris, K. Summary of the BIGRAD project and its implications for a geological disposal facility. In Report NNL; RWM: Oxfordshire, UK, 2016; Volume 16, p. 13817. Available online: https://rwm.nda.gov.uk/publication/summary-of-the-bigrad-project-and-its-implications-for-a-geological-disposal-facility/ (accessed on 4 May 2022).
  13. Bateman, K.; Murayama, S.; Hanamachi, Y.; Wilson, J.; Seta, T.; Amano, Y.; Kubota, M.; Ohuchi, Y.; Tachi, Y. Evolution of the Reaction and Alteration of Mudstone with Ordinary Portland Cement Leachates: Sequential Flow Experiments and Reactive-Transport Modelling. Minerals 2021, 11, 1026. [Google Scholar] [CrossRef]
  14. Ochs, M.; Mallants, D.; Wang, L. Radionuclide and Metal Sorption on Cement and Concrete; Springer International Publishing: Cham, Switzerland, 2016. [Google Scholar] [CrossRef]
  15. Rochelle, C.A.; Milodowski, A.E.; Bateman, K.; Moyce, E.B.A. A long-term experimental study of the reactivity of basement rock with highly alkaline cement waters: Reactions over the first 15 months. Mineral. Mag. 2016, 80, 1089–1113. [Google Scholar] [CrossRef] [Green Version]
  16. Bateman, K.; Amano, Y.; Kubota, M.; Ohuchi, Y.; Tachi, Y. Reaction and Alteration of Mudstone with Ordinary Portland Cement and Low Alkali Cement Pore Fluids. Minerals 2021, 11, 588. [Google Scholar] [CrossRef]
  17. Marty, N.; Bildstein, O.; Blanc, P.; Claret, F.; Cochepin, B.; Gaucher, E.C.; Jacques, D.; Lartigue, J.E.; Liu, S.; Mayer, K.U.; et al. Benchmarks for multicomponent reactive transport across a cement/clay interface. Comput. Geosci. 2015, 19, 635–653. [Google Scholar] [CrossRef]
  18. Savage, D.; Noy, D.; Mihara, M. Modelling the Interaction of Bentonite with Hyperalkaline Fluids. Appl. Geochem. 2002, 17, 207–223. [Google Scholar] [CrossRef]
  19. Watson, C.; Hane, K.; Savage, D.; Benbow, S.; Cuevas, J.; Fernandez, R. Reaction and diffusion of cementitious water in bentonite: Results of ’blind’ modelling. Appl. Clay Sci. 2009, 45, 54–69. [Google Scholar] [CrossRef]
  20. Iwatsuki, T.; Hagiwara, H.; Ohmori, K.; Munemoto, T.; Onoe, H. Hydrochemical disturbances measured in groundwater during the construction and operation of a large-scale underground facility in deep crystalline rock in Japan. Environ. Earth Sci. 2015, 74, 3041–3057. [Google Scholar] [CrossRef] [Green Version]
  21. Sakai, T. Data-Base of Bulk Chemical Compositions and Modal Compositions of TOKI Granitic Body; JAEA-Data/Code 2018-006; Japan Atomic Energy Agency (JAEA): Tokai, Ibaraki, Japan, 2018; p. 75. [Google Scholar]
  22. Savage, D.; Hughes, C.R.; Milodowski, A.E.; Bateman, K.; Pearce, J.; Rae, E.; Rochelle, C.A. The evaluation of chemical mass transfer in the disturbed zone of a deep geological disposal facility for radioactive wastes. I. Reaction of silicates with Calcium hydroxide fluids. In Nirex Report NSS/R244; UK Nirex Ltd.: Oxfordshire, UK, 1998. [Google Scholar]
  23. Savage, D.; Bateman, K.; Hill, P.; Hughes, C.R.; Milodowski, A.E.; Pearce, J.; Rochelle, C.A. The evaluation of chemical mass transfer in the disturbed zone of a deep geological disposal facility for radioactive wastes. II. Reaction of silicates with Na-K-Ca- hydroxide fluids. In Nirex Report NSS/R283; UK Nirex Ltd.: Oxfordshire, UK, 1998. [Google Scholar]
  24. Iwatsuki, T.; Munemoto, T.; Kubota, M.; Hayashida, K.; Kato, T. Characterization of rare earth elements (REEs) associated with suspended particles in deep granitic groundwater and their post-closure behavior from a simulated underground facility. Appl. Geochem. 2017, 82, 134–145. [Google Scholar] [CrossRef]
  25. Parkhurst, D.L.; Appelo, C.A.J. Description of Input and Examples for PHREEQC Version 3-A Computer Program for Speciation, Batch-Reaction, One-Dimensional Transport, and Inverse Geochemical Calculations. 2013. Available online: https://pubs.usgs.gov/tm/06/a43/ (accessed on 4 May 2022).
  26. JAEA. The Project for Validating Assessment Methodology in Geological Disposal System. In Annual Report for JFY2016; JAEA Technical Report; Japan Atomic Energy Agency (JAEA): Tokai, Ibaraki, Japan, 2017. (In Japanese) [Google Scholar]
  27. JAEA. 2014: H25 Project for Technical Study on Geological Disposal of High-Level Radioactive Waste. In Report on Development of Advanced Cement Material Impact Assessment Technology; Japan Atomic Energy Agency (JAEA): Tokai, Ibaraki, Japan; Available online: https://www.enecho.meti.go.jp/category/electricity_and_gas/nuclear/rw/library/2013/25-13-1.pdf (accessed on 4 May 2022). (In Japanese)
  28. JAEA. 2019: H29 Project for Geological Disposal of High-Level Radioactive Waste. Technology Development Project for Geological Disposal of High-Level Radioactive Waste. Development of Technology for Confirmation of Evaluation of Disposal System. Available online: https://www.enecho.meti.go.jp/category/electricity_and_gas/nuclear/rw/library/2017/29fy_hyoukakakushou.pdf (accessed on 4 May 2022). (In Japanese)
  29. Trapote-Barreira, A.; Cama, J.; Soler, J.M. Dissolution kinetics of C-S-H gel: Flow-through experiments. Phys. Chem. Earth Parts A/B/C 2014, 70–71, 17–31. [Google Scholar] [CrossRef]
  30. Steefel, C.I.; Lichtner, P.C. 1998 Multicomponent reactive transport in discrete fractures: II: Infiltration of hyperalkaline groundwater at Maqarin, Jordan, a natural analogue site. J. Hydrol. 1998, 209, 200–224. [Google Scholar] [CrossRef]
  31. Mihara, M.; Sasaki, R. RAdio-Nuclides Migration DAtasets (RAMDA) on Cement, Bentonite and Rock for TRU Waste Repository in Japan. JNC TN1410 2000-001~004. 2005. Available online: https://jopss.jaea.go.jp/pdfdata/JNC-TN8400-2005-027.pdf (accessed on 4 May 2022).
  32. Benbow, S.J.; Watson, C.E. 2014 QPAC Reactive Transport Module: Theory and Testing. Quintessa Report QRS-QPAC-RTM-2 v1.1; Quintessa Limited: Henley-on-Thames, UK.
  33. Savage, D.; Watson, C.; Benbow, S.; Wilson, J. Modelling iron-bentonite interactions. Appl. Clay Sci. 2010, 47, 91–98. [Google Scholar] [CrossRef]
  34. Steefel, C.I.; Van Cappellen, P. A new kinetic approach to modeling water-rock interaction: The role of nucleation, precursors, and Ostwald ripening. Geochim. Cosmochim. Acta 1990, 54, 2657–2677. [Google Scholar] [CrossRef]
Figure 1. Schematic of column setup.
Minerals 12 00883 g001
Figure 2. Interval and total times for the sequential column experiments with Toki granite reacting with OPC leachates and then groundwater.
Minerals 12 00883 g002
Figure 3. Geometry of the experimental setup as represented in CABARET. The 2-cell ‘Reservoir’ represents the single physical fluid reservoir, with the granite divided into 20 sections, each 15 mm long and 7.5 mm in diameter (note: not to scale).
Minerals 12 00883 g003
Figure 4. Major changes in fluid chemistry with time (Col-3). Tokai granite with ‘young’ OPC, and then the ‘evolved’ OPC leachate followed by MGW. (a) pH; (b) [Na], [K], [Ca], [SiO2], and [Cl]. Legend text: yOPC-‘young’ OPC leachate, eOPC-‘evolved’ OPC leachate, MGW-Mizunami groundwater. Lines indicate concentrations in reacted samples; single points the original concentration in the reacting fluids.
Minerals 12 00883 g004
Figure 5. Summary of mineralogy of Toki granite with ‘young’ OPC leachate (Col-1). All SEM photos are secondary electron (SE) images. The white rectangle in the SEM images indicate the areas used for SEM–EDS analysis (see Figure S2b–d). Orange rectangle indicates the area enlarged in the adjacent image.
Minerals 12 00883 g005
Figure 6. Selected secondary mineral saturation states in reacted fluids, experiment with ‘young’ OPC, and then the ‘evolved OPC leachate, followed by MGW; all data from Col-3. Representative C-S-H phases in blue, zeolites in red, portlandite in green, and calcite in yellow.
Minerals 12 00883 g006
Figure 7. Summary of the mineralogy of the Toki granite with ‘young’ OPC, and then the ‘evolved OPC leachate (Col-2). SEM photos from Section 2 and Section 5 are secondary electron (SE) images; others are backscattered electron (BSE) images. The white rectangles in the SEM images indicate the areas used for SEM–EDS analysis (see Figure S3b–d).
Minerals 12 00883 g007
Figure 8. Summary of the mineralogy of the Toki granite with OPC leachates, and then MGW (Col-3). SEM photos are BSE images apart from the image from Section 18, which is an SE image. The white shapes in the SEM images indicate the areas used for SEM–EDS analysis (see Figure S5b–d).
Minerals 12 00883 g008
Figure 9. Comparison of (a) a new PEEK frit, showing nominal 5 µm pores, with (b) frit recovered from the inlet end of Col-3 after reaction with MGW, showing reduced porosity and precipitate blocking the pores.
Minerals 12 00883 g009
Figure 10. Summary of the model predictions compared with the experiment data: (a) pH, [Na], and [K]; (b) [Ca] and [SiO2]; (c) selected C-S-H saturation indices; (d) zeolite saturation indices.
Minerals 12 00883 g010
Figure 11. Legend for all plots; time step (days), selected model data showing variation along the length of the column with time; (a) porosity, red dashed line indicates initial porosity; (b) total C-S-H; (c) total zeolites; (d) albite (as a representative of the feldspars); (e) muscovite; (f) quartz. Time step of 102 d, change from ‘young’ to ‘evolved’ OPC leachate; time step of 200 d, change from ‘evolved’ OPC leachate to MGW.
Minerals 12 00883 g011aMinerals 12 00883 g011b
Figure 12. Legend for all plots. Summary of the composition of modelled mineral assemblage: (a) Toki granite before reaction, (b) after reaction with ‘young’ OPC leachate for ~100 d, (c) after successive reaction with both OPC leachates (~200 d), and (d) after successive reaction with both OPC leachates and MGW (~255 d).
Minerals 12 00883 g012
Table 1. Initial concentrations of major ions in the OPC leachates and Mizunami groundwater.
FluidpH @ 24 °CComponents (mg/L)
‘Young’ OPC leachate NaKCaSiO2MgClHCO3
(Na-K-Ca-OH)13.41500730060----
‘Evolved’ OPC leachate CaSiO2MgClHCO3
(saturated Ca(OH)2)12.5 800----
Mizunami groundwater NaKCaSiO2MgClHCO3
BH 09MI20—mean *8.70800.49320.16575
Sampled 25 December 20198.77141<0.101520.83.2150.3-
* Mean fluid chemistry for borehole 09MI20, taken from [24].
Table 2. Details of the ‘model’ Toki granite composition and potentially active minerals.
Vol %Formula in Thermodynamic Database (JAEA-TDB, [26])
Porosity42
Quartz18.1SiO2
Anorthite8.71CaAl2Si2O8
Albite8.71NaAlSi3O8
K_Feldspar20.1KAlSi3O8
Muscovite2.27K(Al2)(AlSi3)O10(OH)2
Portlandite Ca(OH)2
CSH055
to
CSH165
(CaO)1.65(SiO2)(H2O)2.1167, (CaO)1.55(SiO2)(H2O)2.0167, (CaO)1.45(SiO2)(H2O)1.9167, (CaO)1.35(SiO2)(H2O)1.8167, (CaO)1.25(SiO2)(H2O)1.7167, (CaO)1.15(SiO2)(H2O)1.6167, (CaO)1.05(SiO2)(H2O)1.5167, (CaO)1.00(SiO2)(H2O)1.4667, (CaO)0.95(SiO2)(H2O)1.4167, (CaO)0.90(SiO2)(H2O)1.3667, (CaO)0.85((SiO2)(H2O)1.3167, (CaO)0.80(SiO2)(H2O)1.248, (CaO)0.75(SiO2)(H2O)1.17, (CaO)0.65(SiO2)(H2O)1.014, (CaO)0.55(SiO2)(H2O)0.858
Stratlingite_Al (Ca2Al(OH)6)(AlSiO2(OH)4)(H2O)3
Analcime
(Analcite)
NaAlSi2O6(H2O)
Clinoptilolite_alk, K2.3Na1.7Ca1.4(Al6.8Si29.2O72)(H2O)26
Clinoptilolite_CaCa3(Al6Si30O72)(H2O)20
Clinoptilolite_KK6(Al6Si30O72)(H2O)20
Clinoptilolite_NaNa6(Al6Si30O72)(H2O)2
Phillipsite_alk K1.4Na1.6Ca0.4(Al3.8Si12.2O32)(H2O)12
Phillipsite_CaCa3(Al6Si10O32)(H2O)12
Phillipsite_KK6(Al6Si10O32)(H2O)12
Phillipsite_NaNa6(Al6Si10O32)(H2O)12
Brucite Mg(OH)2
MSH06
to
MSH15
(MgO)0.6(SiO2)(H2O)1.08, (MgO)0.7(SiO2)(H2O)1.2, (MgO)0.8(SiO2)(H2O)1.32, (MgO)0.9(SiO2)(H2O)1.44, (MgO)1(SiO2)(H2O)1.56, (MgO)1.1(SiO2)(H2O)1.68, (MgO)1.2(SiO2)(H2O)1.8, (MgO)1.3(SiO2)(H2O)1.92, (MgO)1.4(SiO2)(H2O)2.04, (MgO)1.5(SiO2)(H2O)2.16
Monocarbonate_Al (Ca2Al(OH)6)2(CO3)(H2O)5
Monosulfate_Al (Ca2Al(OH)6)2(SO4)(H2O)8
Magnesite MgCO3
Thaumasite Ca3Si(OH)6(SO4)(CO3)(H2O)12
Calcite Ca(CO3)2
Dolomite CaMg(CO3)2
Gypsum CaSO4(H2O)2
Ettringite_Al Ca6(Al(OH)6)2(SO4)3(H2O)26
Friedel_Salt_Al (Ca2Al(OH)6)2(Cl)2(H2O)4
Kuzel_Salt_Al (Ca2Al(OH)6)2((SO4)0.5Cl)(H2O)6
Publisher’s Note: MDPI stays neutral with regard to jurisdictional claims in published maps and institutional affiliations.

