Article

Genesis of Color Zonation and Chemical Composition of Penglai Sapphire in Hainan Province, China

1
School of Gemology, China University of Geosciences, Beijing 100083, China
2
State Key Laboratory of Geological Processes and Mineral Resources, China University of Geosciences, Beijing 100083, China
3
Southern Marine Science and Engineering Guangdong Laboratory (Guangzhou), Guangzhou 511458, China
4
Key Laboratory of Deep-Earth Dynamics, Institute of Geology, Chinese Academy of Geological Sciences, Beijing 100037, China
5
Shandong Academician Workstation of Diamond Mineralization Mechanism and Exploration, Shandong No. 7 Exploration Institute of Geology and Mineral Resources, Linyi 276006, China
*
Authors to whom correspondence should be addressed.
Minerals 2022, 12(7), 832; https://doi.org/10.3390/min12070832
Submission received: 1 May 2022 / Revised: 24 June 2022 / Accepted: 26 June 2022 / Published: 29 June 2022

Abstract

:
The Penglai sapphires are mainly hosted in alkaline basalts and derived in alluvial sediments. Previous studies have investigated the formation of the Penglai sapphires; however, the genesis of color zoning remains ambiguous. In this paper, we report spectral and chemical composition data of sapphires using ultraviolet–visible spectroscopy (UV–Vis), Fourier transform infrared spectroscopy (FTIR), and laser-ablation–inductively coupled plasma–mass spectrometry (LA–ICP–MS). The results show that the Penglai sapphire has a magmatic origin, mostly showing various shapes of incomplete girdles, barrels, and flakes. The content of Ti in rims is higher than in cores of color-banded sapphire, which results from ubiquitous Ti-bearing inclusions within grown bands. The main chromophore of the deep-blue core is Fe2+-Ti4+, which pairs with Fe3+-Fe3+, Cr3+, and V3+ in the core, likely producing purple-hued blue in an oxidizing environment. The yellowish-brown rim is due to Fe3+ and Cr3+ in a reduced environment. Compared with the basaltic sapphires worldwide, the Fe content is moderately higher than those of most Asian sapphires but obviously lower than those of Changle sapphires in Shandong, China, and overlaps with those of African sapphires.

1. Introduction

Gem-grade corundum is also known as sapphire and ruby. As a variant of natural α-Al2O3, corundum with a perfect lattice is generally pure, colorless, and transparent. However, corundum always exhibits different colors due to the replacement of the Al element with Fe, Ti, Cr, V, and other transition metal elements [1,2]. The existence of trace elements in corundum is closely related to the geological background of their formation, so the study of their genesis provides important ways to interpret its formation history and identify specific origins [3,4]. Since metamorphic and basaltic sapphires have significant differences in trace elements, previous studies have proposed a variety of classification methods based on experimental data [5,6]. They found that trace elements such as Mg, Fe, Ti, Cr, Ga, and V and their ratios can well distinguish the origin and genesis of corundum. Ratios of Cr2O3/Ga2O3, Fe2O3/TiO2, as well as trace element contents of Zn, Sn, Ba, Ta, and Pb of 35 sapphires from different origins, were analyzed via LA–ICP–MS, and the resulting data provide useful criteria to interpret and identify the geographical origins of sapphires [7]. Moreover, the presence of Sn and Ta elements suggests that corundum probably formed close to syenites or granites. Having various concentrations of Zn, Nb, Sn, Ba, and Pb and no Ta indicates that sapphires likely occurred in nepheline–corundum-bearing syenites or syenitic gneisses [7]. Studies on the genesis of rare elements above provide unique ways to determine the geographic origin of corundum [8,9].
The Penglai deposit in Hainan Province is one of the most important sapphire mines in China [10,11]. It lies within a basalt-hosted corundum belt along the western Pacific continental margin (Figure 1a). The homogenization temperature and REE distribution patterns of Hainan sapphire and its inclusions are significantly different from those of the host basalt. The assimilation and metasomatism of sapphire with mafic magma have roughly been performed during its formation. Corundum is generally produced via high-pressure metamorphism near the interface between the crust and subcontinental lithosphere mantle and is delivered to the surface by alkaline basalt magma [12,13]. The zonation in Hainan sapphire was interpreted as a periodic change of Fe3+ content, implying that the periodic change in redox condition also occurs in its wall rock magma [14]. The coloring mechanism of Hainan sapphire was investigated using photoluminescence spectroscopy and showed that interactions of different ions occurred in the 500–700 nm absorption broadband, and spectral peaks appeared [15].
Previous studies have mainly focused on basalt-hosted sapphire deposits in Hainan and insufficiently on alluvial-type ones. The mechanism of color zonation and its compositional characteristics, in particular, remain ambiguous. Therefore, in this paper, we present the physical and chemical characteristics of Penglai sapphires and analyze the relationship between color mechanism and geological origin via microscopic observation, UV–Vis, FTIR, and LA–ICP–MS. These new data and our interpretation provide robust insights into the color genesis and compositional characteristics of the Penglai sapphire.

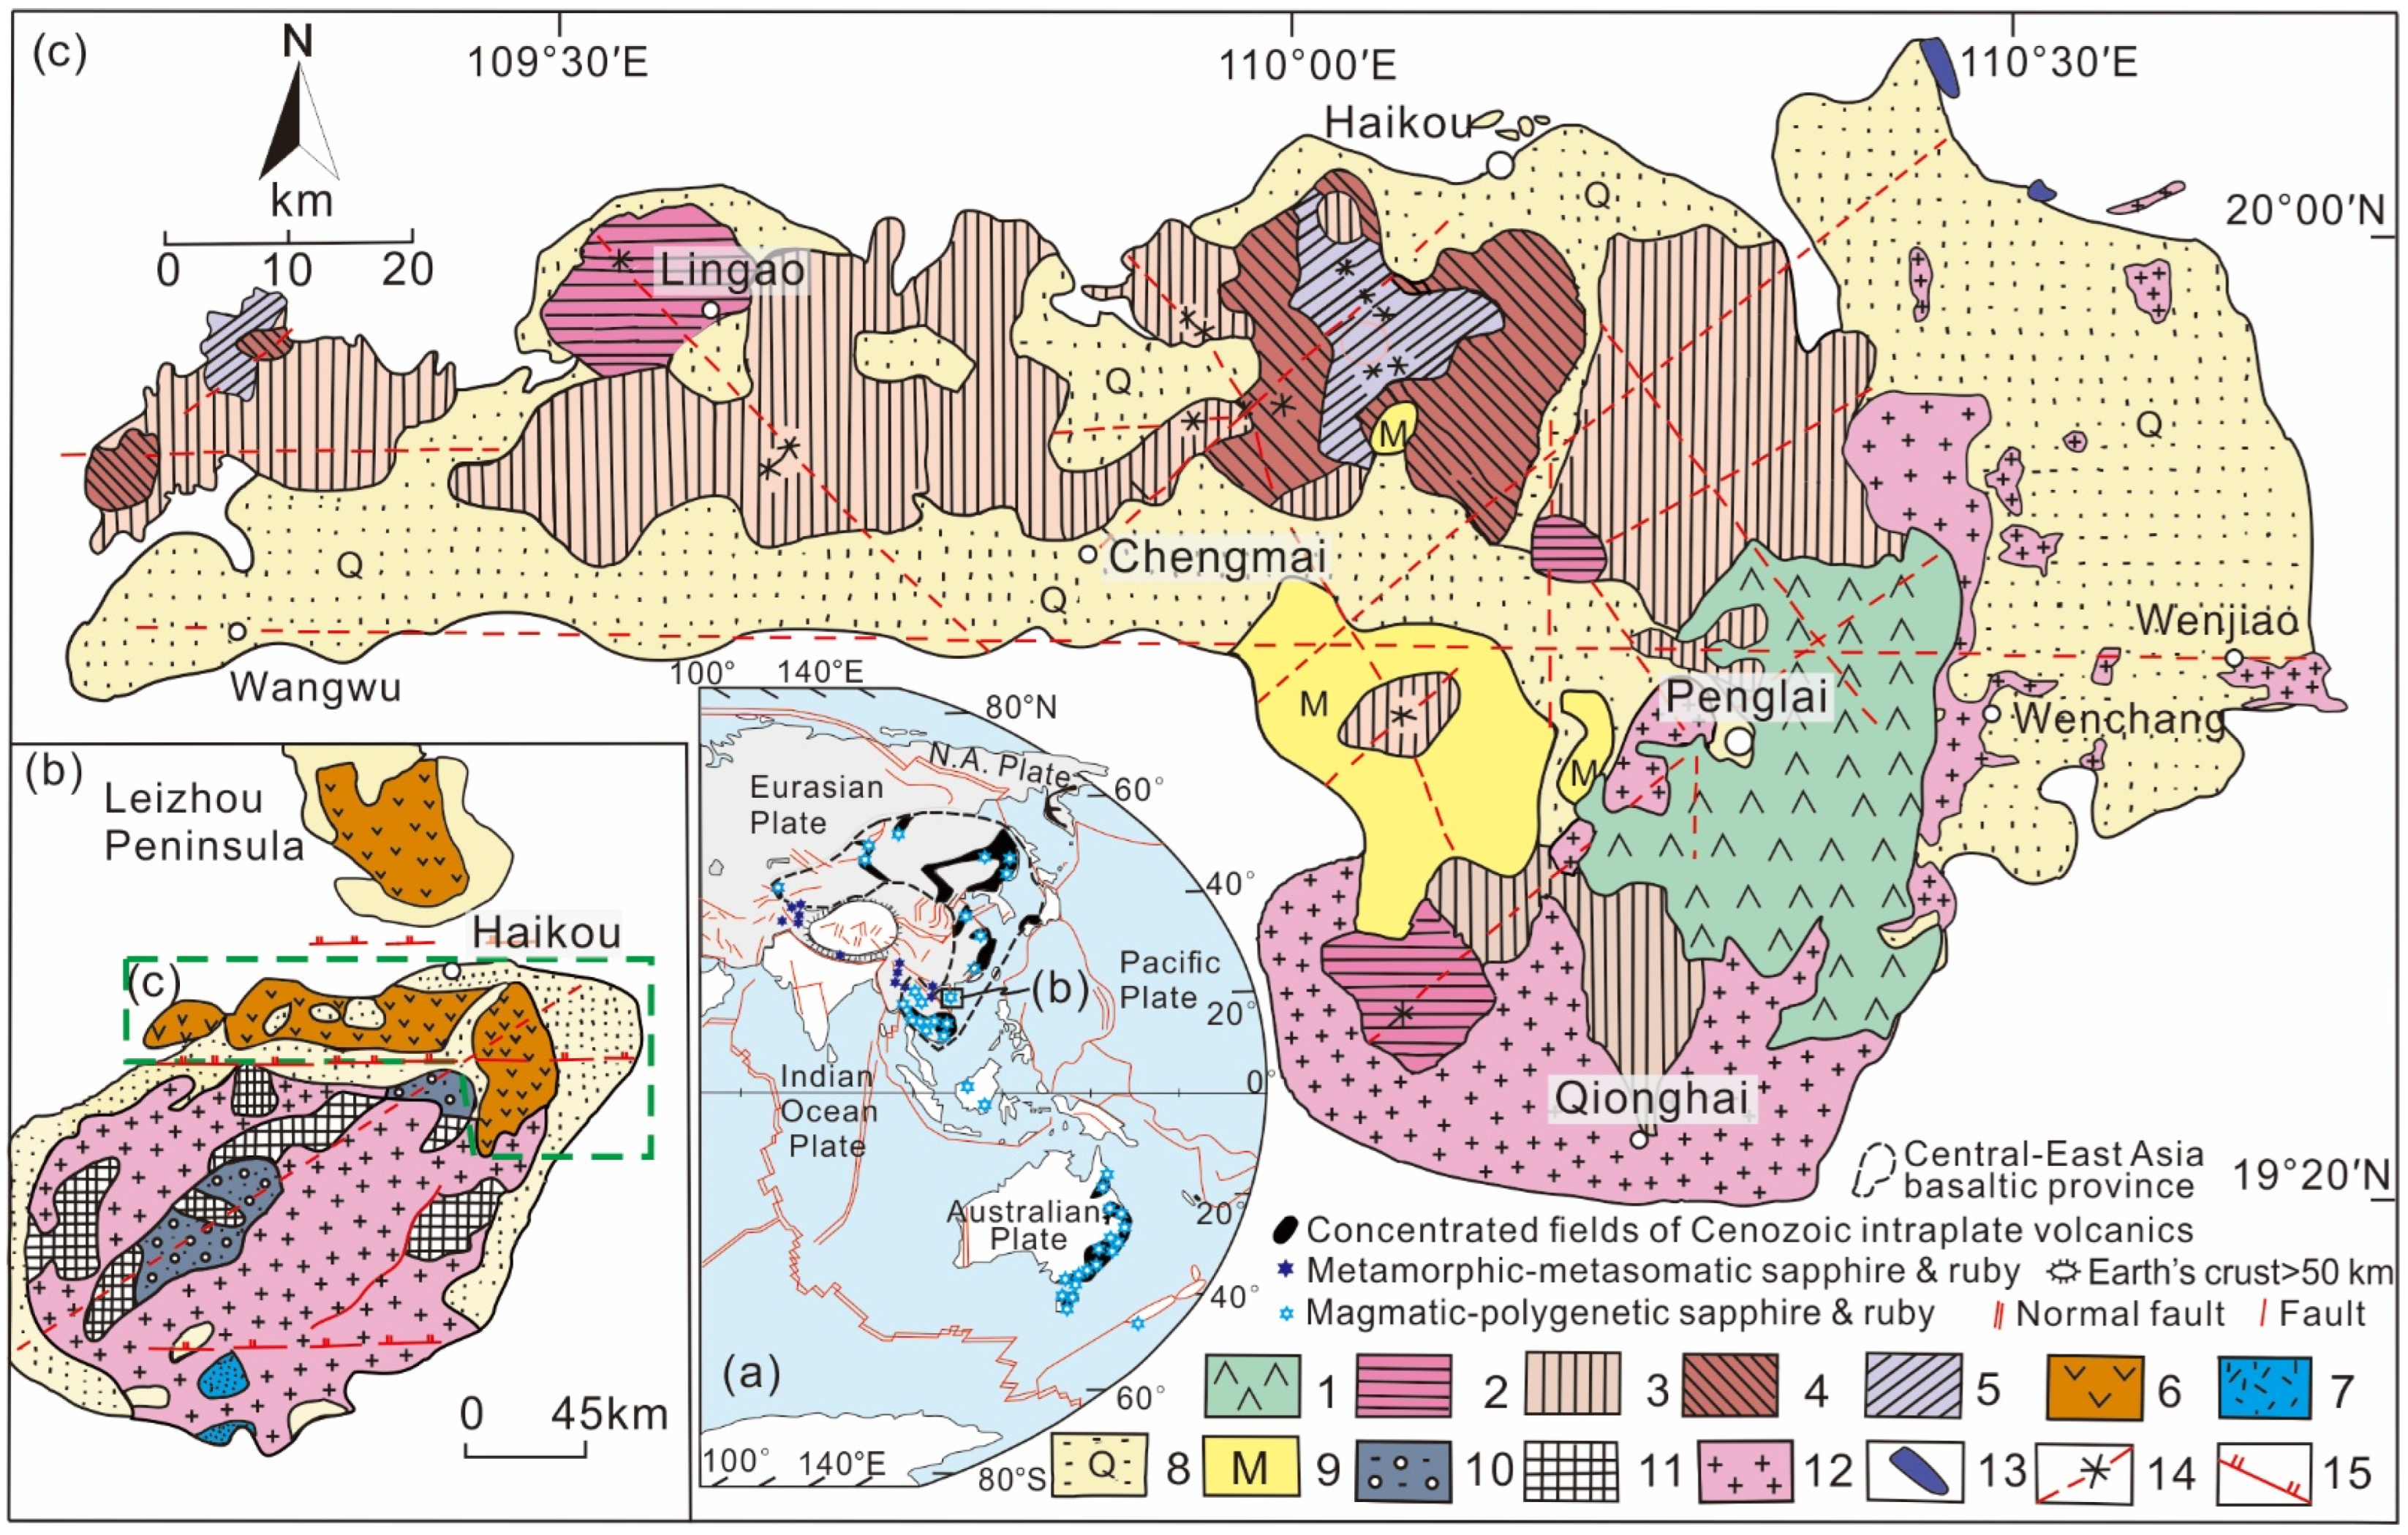
2. Geological Settings

The sapphire deposit hosted in basaltic rocks is located near Penglai town in the northern part of Hainan Island. Hainan Island is separated from mainland China by the Qiongzhou Strait. The formation of these sapphire deposits is associated with extensive basaltic magmatism in eastern China during the Cenozoic [16]. These volcanic rocks occur in northern Hainan Island and the adjacent Leizhou Peninsula (Figure 1b). The roughly west–east striking regional Wangwu–Wenjiao fault forms a boundary of Cenozoic volcanic rocks and pre-Cenozoic rocks [13] (Figure 1c). The Cenozoic rocks exposed in northern Hainan Island have been subdivided into five eruptive episodes—namely, Shimengou/Shimacun Formation (Pliocene–Miocene), Duowen Formation (middle Pleistocene), Dongying Formation (middle Pleistocene), Daotang Formation (late Pleistocene) and Shishan Formation (Holocene). The sapphire-bearing basalts in Penglai town are hosted in the Shimengou/Shimacun Formation that may have lasted from 3.0 to 6.0 Ma and about 13 Ma for incipient volcanism [16].
The mining area is about 35 km2. The Penglai sapphires in Hainan Province mainly occur in mafic volcanic rocks, including limburgite, olivine basalt, and other alkaline volcanic rocks [13,17]. Corundum crystals ranging from several centimeters to millimeters in size are mainly distributed in the porphyritic olivine basalt [13,18]. The olivine basalt is gray-black, with porphyritic, vesicular, and dense massive structure. The rock phenocryst is mainly composed of olivine, clinopyroxene, and plagioclase. Olivine basalt and limburgite are the main two rocks in the early eruptive episodes. The former has phenocrysts of olivine and a small amount of clinopyroxene, and the matrices have intergranular texture. The latter exhibits a typically porphyritic texture, the phenocrysts are olivine, pyroxene, and plagioclase, and the matrix has a tholeiitic texture. Compared with the early erupted basalt, its vesicular structure is more developed. The phenocrysts are dominantly plagioclase rimmed by corrosion and reaction edge, and the brecciated structure is obvious. Corundum giant crystals are often associated with other minerals such as zircon, olivine, pyroxene, ilmenite, magnetite, niobium, feldspar, and quartz, as well as mantle peridotite and olivine pyroxenite xenoliths [13].
Figure 1. (a) The gem corundum occurrences and associated basaltic fields in Central and East Asia showing the location of the Hainan Island, modified from [19]; (b) simplified geological map of the Hainan Island separated from mainland China by the Qiongzhou Strait and (c) the distribution of late Cenozoic basaltic volcanism in the northern part of the Hainan Island, modified from [16,18]: 1—Shimengou/Shimacun Formation (Pliocene—Miocene); 2—Duowen Formation (middle Pleistocene); 3—Dongying Formation (middle Pleistocene); 4—Daotang Formation (late Pleistocene); 5—Shishan Formation (Holocene); 6—Cenozoic basalt; 7—intermediate acid extrusive rocks; 8—Quaternary sediments; 9—Mesozoic rocks; 10—Pre-Cenozoic basalt; 11—Paleozoic rocks; 12—Mesozoic granite; 13—eclogite; 14—volcanoes and inferred faults; 15—nearly west–east striking regional faults; N.A. Plate—North American Plate.
Minerals 12 00832 g001
The alluvial sapphire deposits commonly form lenses and layers in the Quaternary loose sediments [17]. The samples in this paper were collected from the Penglai alluvial deposit.

3. Materials and Methods

3.1. Materials

Six sapphire samples (Sap-1, Sap-2, Sap-3, Sap-4, Sap-5, and Sap-6) were investigated from the alluvial deposit in Hainan, China (Figure 2). Grains ranged mainly in size from 4 × 4 × 3 mm to 6 × 8 × 5 mm, and their colors vary in depth and hues (Figure 2). In order to attenuate the effects of rough and uneven surfaces, they were carefully cut and polished into slices with two large parallel faces. Sap-1 was polished on both sides along the vertical optical axis (⊥c) and the parallel optical axis (‖c), whereas Sap-2 was doubled-polished on both planes over a visible ribbon, and the other samples were performed on both sides of their large facets.
Sap-1 shows a trapezoid-shaped dark-blue core rimmed by lightly yellowish-brown diffuse-zoned bands (Figure 3a), sap-2 has distinct colored parallel bands in various widths (Figure 3b), sap-3 has both yellow and blue colors (Figure 2c and Figure 3c), sap-4 has evenly dark-blue patch in the core rimmed by light blue edges (Figure 3d), sap-5 has obvious streaks on the surface (Figure 2e), and sap-6 has a hexagonal pyramid-shaped in the core (Figure 2f).

3.2. Methods

UV–Vis absorption spectra were obtained at the Gem Research Laboratory of China University of Geosciences (Beijing). The testing instrument was a UV-2000 UV–Vis spectrophotometer produced by Lab Tech in Beijing, China. The UV–Vis wavelength range was 300–800 nm. The record width was 2.0. The slit width was 2 nm. The room temperature was 24 °C. The measurement method was T%. In this study, UV was applied to only sample Sap-1.
The FTIR was analyzed using an instrument model LUMOS infrared spectrometer with transmission and reflection methods under 32 scans and a resolution of 4 cm−1. The test wavelength range was 3000–3600 cm−1. The test temperature was 14℃, and the relative humidity was 50%. The laser direction is non-polarized. To further explore the variation pattern of FTIR in individual sapphire crystals, sample Sap-1 was investigated linearly from core to the rim, with 6 points (Figure 4).
Spectroscopic measurements of trace chemical composition were performed in the same area using a Thermo Element XR mass spectrometer at the National Center for Geological Analysis and Research (CAGS) equipped with a New Wave UP193 model laser. The laser parameters were set as follows: laser wavelength 193 nm, beam spot size 35 um, pulse frequency 10 Hz, output energy 100%, and pulse energy 6.0 mJ. Plasma mass spectrometry parameters were as follows: cooling gas flow (Ar) 16.21 L/min, auxiliary gas flow (Ar) 0.86 L/min, carrier gas flow (He) 0.743 L/min, sample gas flow (Ar) 0.910 L/min, and radio frequency generation, for which the power of the device was 1300 W. Other parameters included the following: resolution mode, low resolution; scan mode, E-scan; rest time, 1 ms; sampling time, 3 ms; the number of points per peak, 100; detector dead time, 14 ns; background acquisition time, 20 s; ablation time, 40 s; signal intensity (Th), 160,000 cps; and oxide yield (ThO/Th), 0.24%. Data processing was normalized using Al as the internal standard, standard sample Nist612/Nist610, and multiple external standard matrices. To ensure accuracy, as a quality control measure, after every 30 runs, one of the standard samples was run again as an unknown substance. LA–ICP–MS was applied punctually to only one sample (Sap-1). In order to further explore the variation law of trace elements in a single sapphire crystal, sample Sap-1 was sampled linearly, with points from A to B, C to D, and evenly distributed between A and B, and C and D (Figure 4).

4. Results

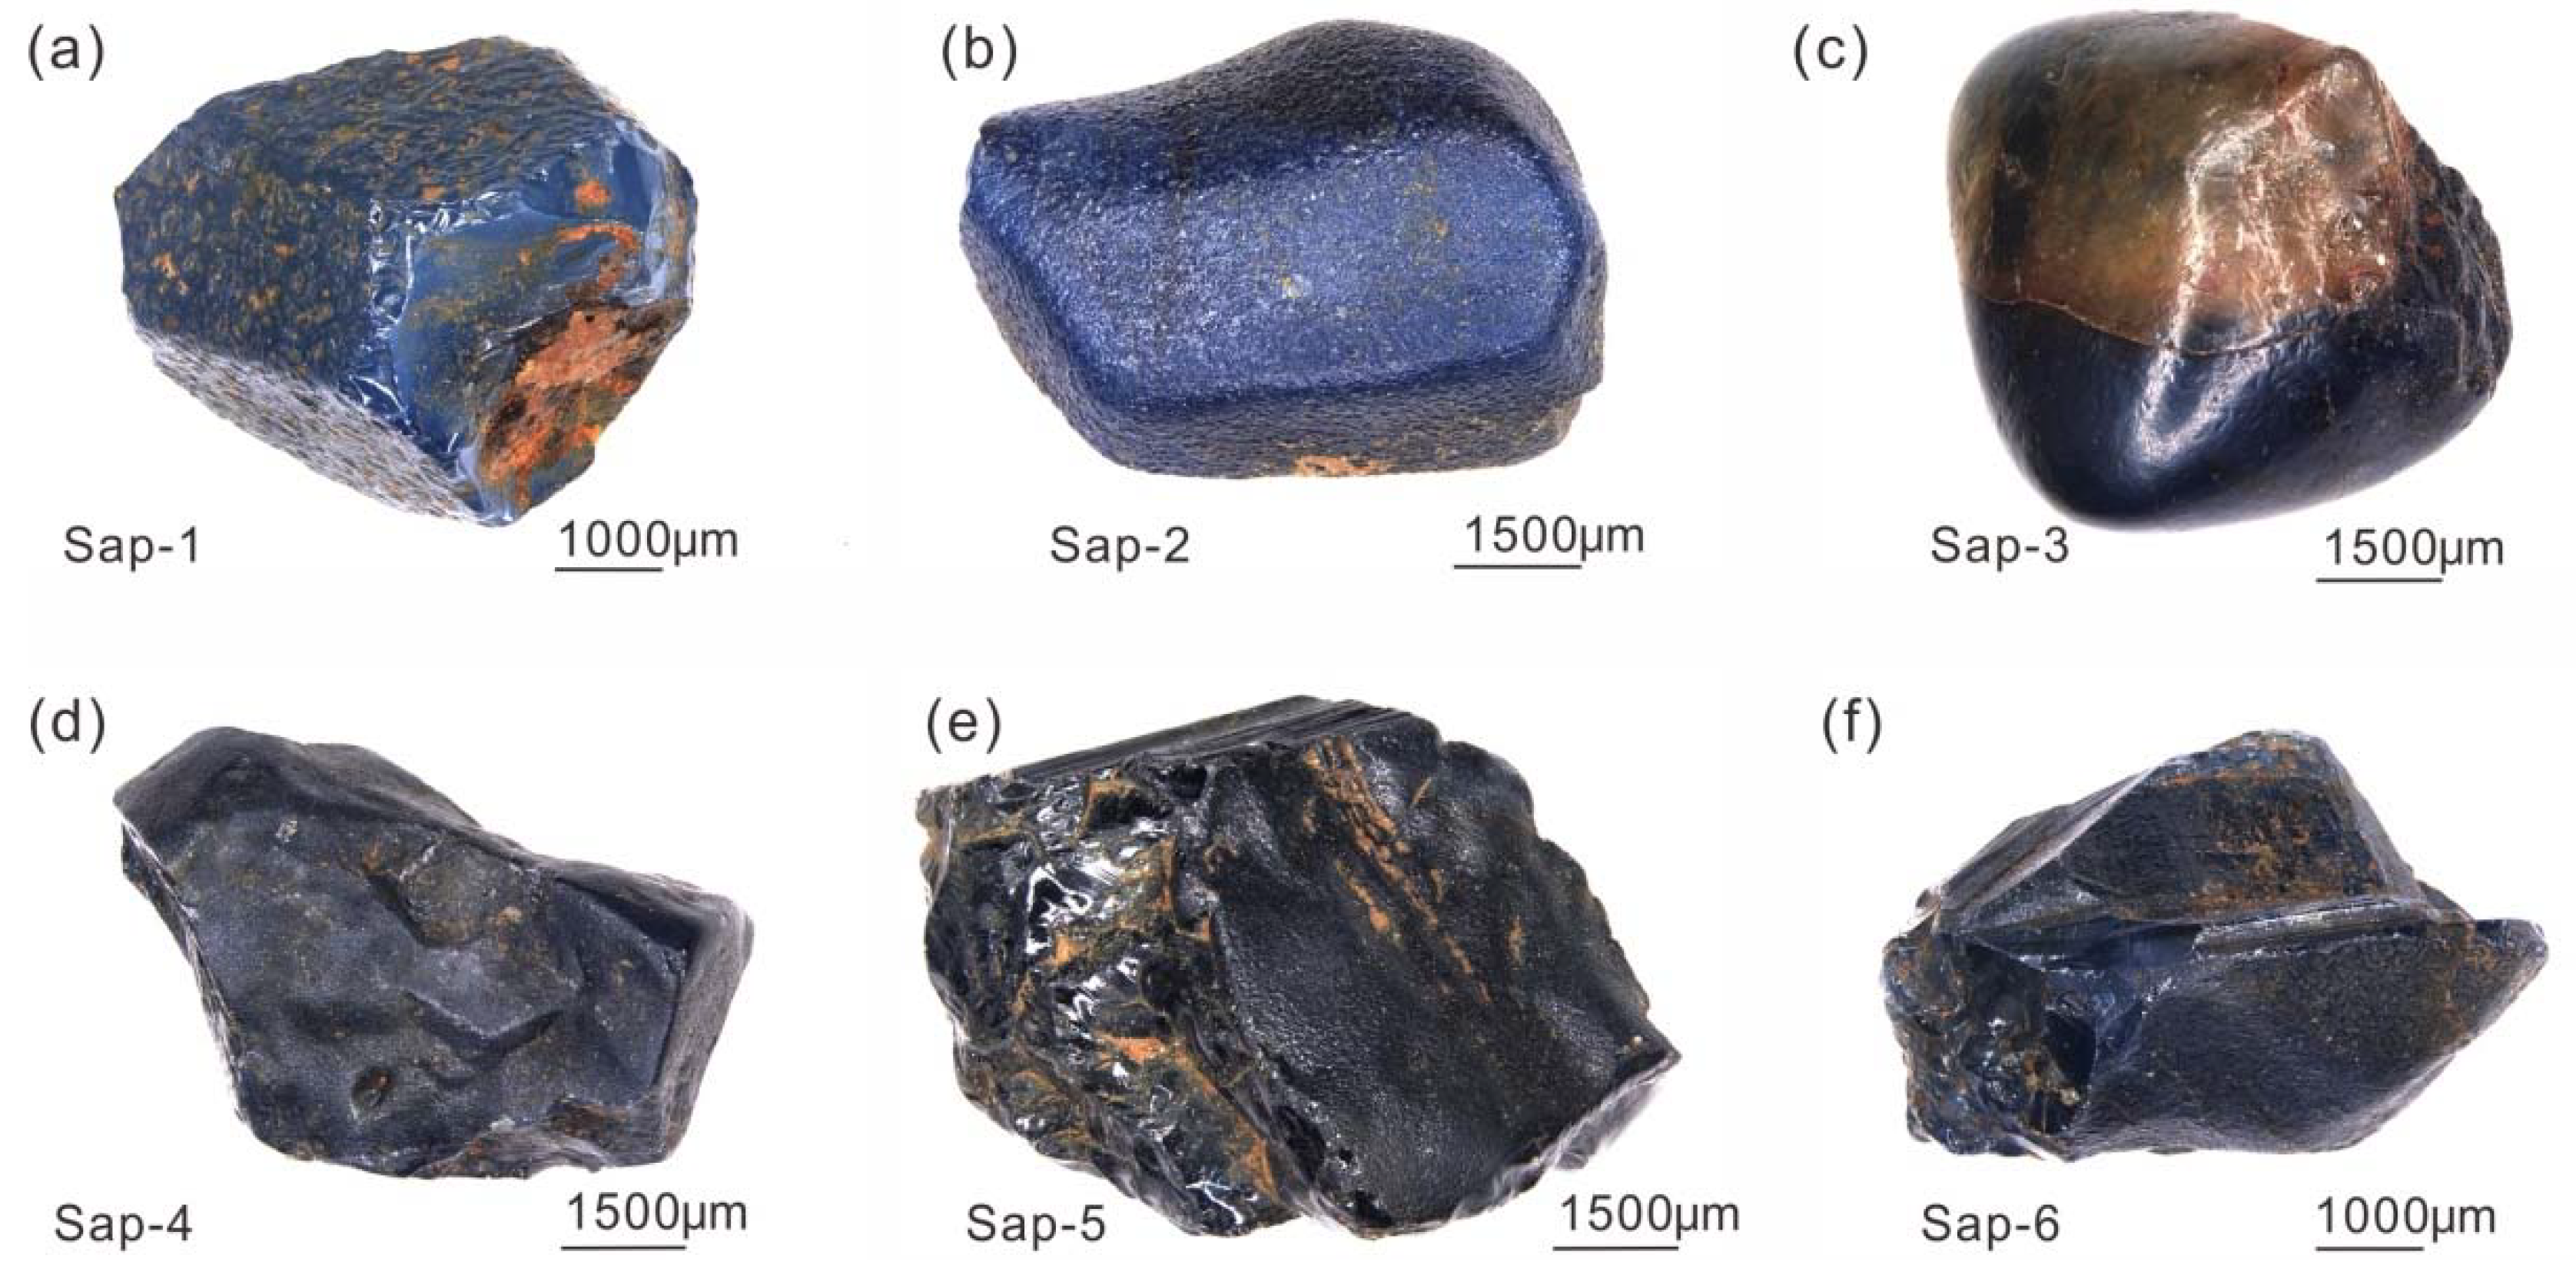
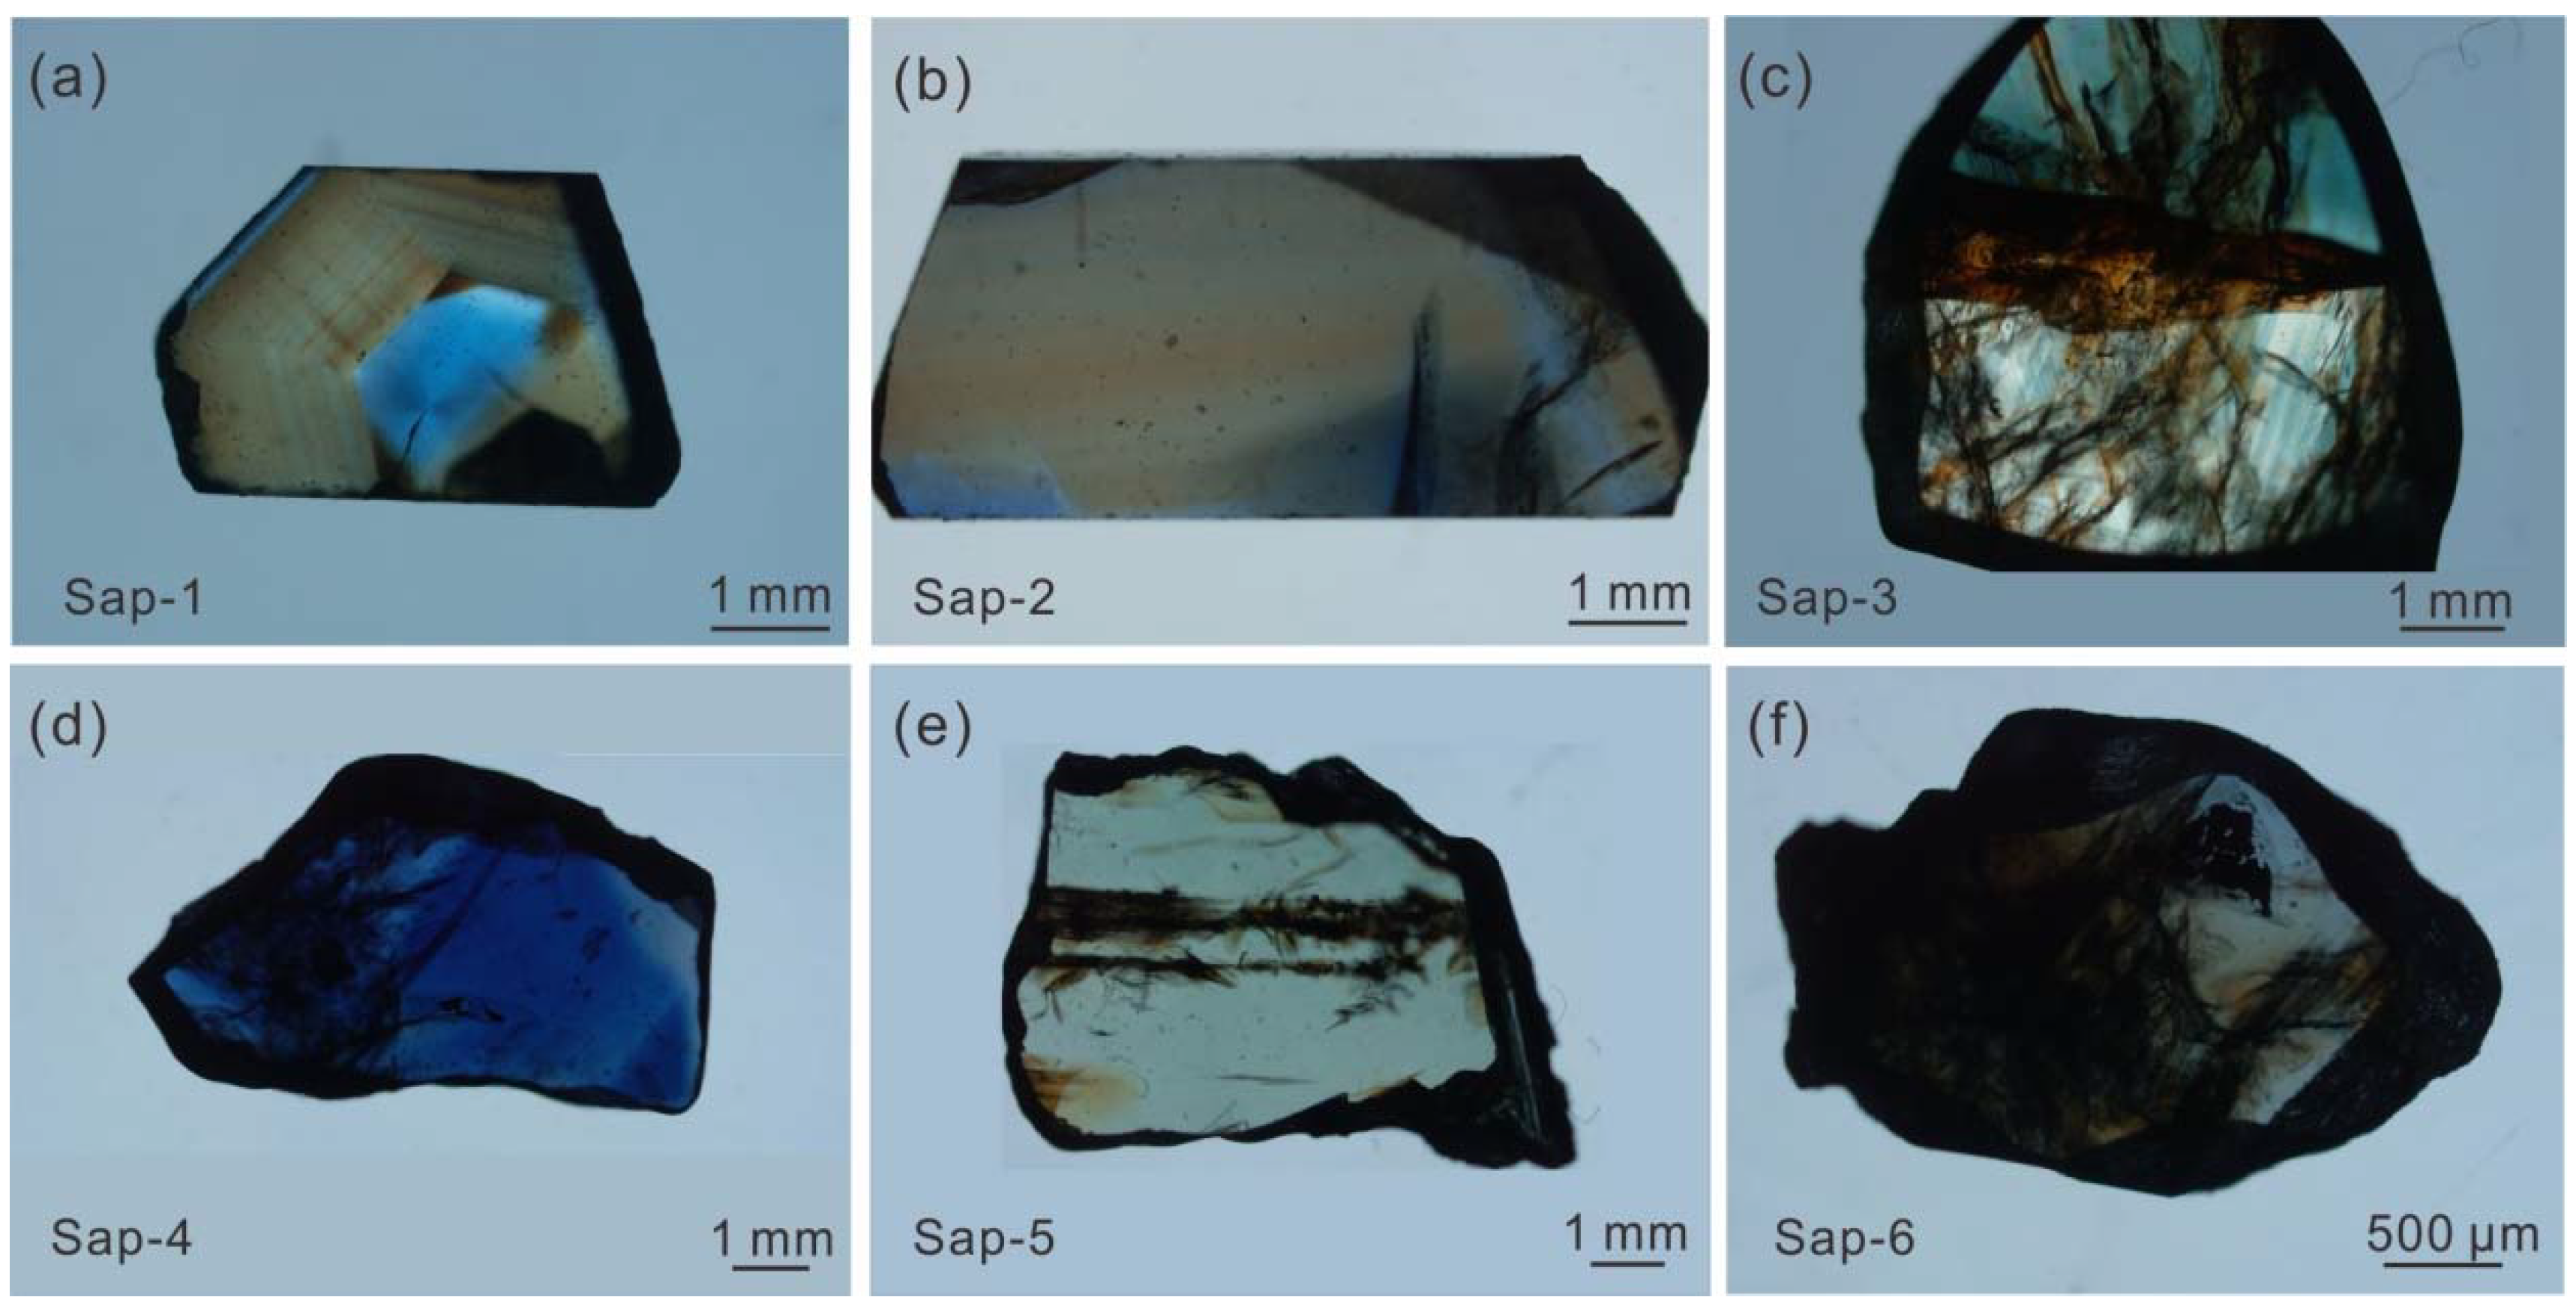
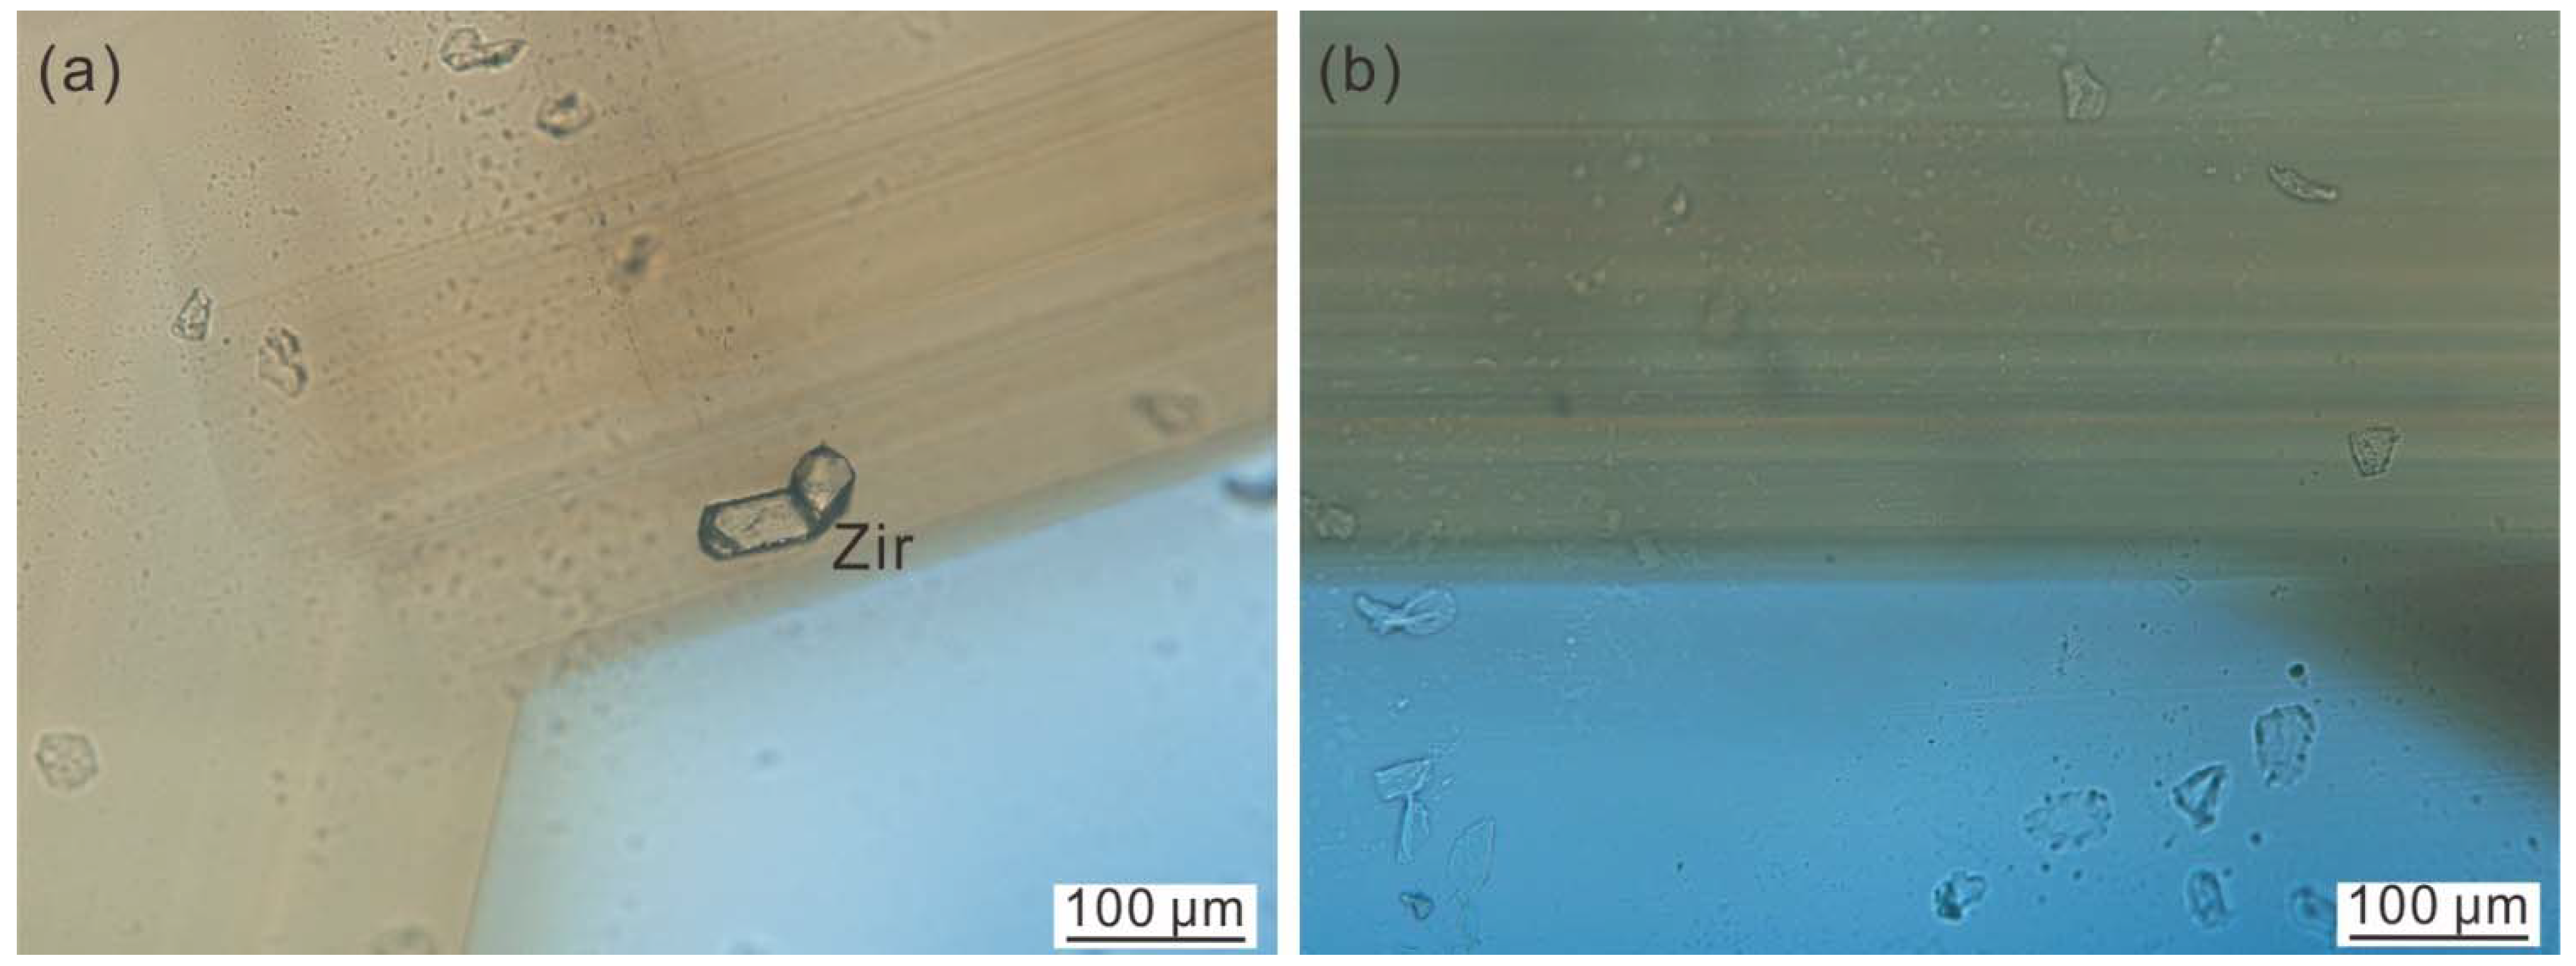
4.1. Physical Characteristics of the Penglai Sapphires

The Penglai sapphires have hexagonal columnar, hexagonal bipyramid, rhombohedron, and other aggregated shapes, but single crystals with euhedral shapes are rare, mostly in the shape of incomplete waist drum, barrel, cone, and various irregular shapes. The surface of most samples shows ablation rounding, and the surface is in a ground glass (opaque) state. The overall color is dark, and color distribution is uneven, and the color band, color nucleus, a two-color phenomenon, and strong glass luster can be observed. Ne = 1.761–1.762, No = 1.771–1.772, DR = 0.010, and the average specific gravity is 3.96. Many micro-internal flaws and inclusions occur in the typical characteristic growth bands of the Penglai sapphire, e.g., milky white in reflected light, and yellowish-brown in transmitted light can be observed (Figure 5).

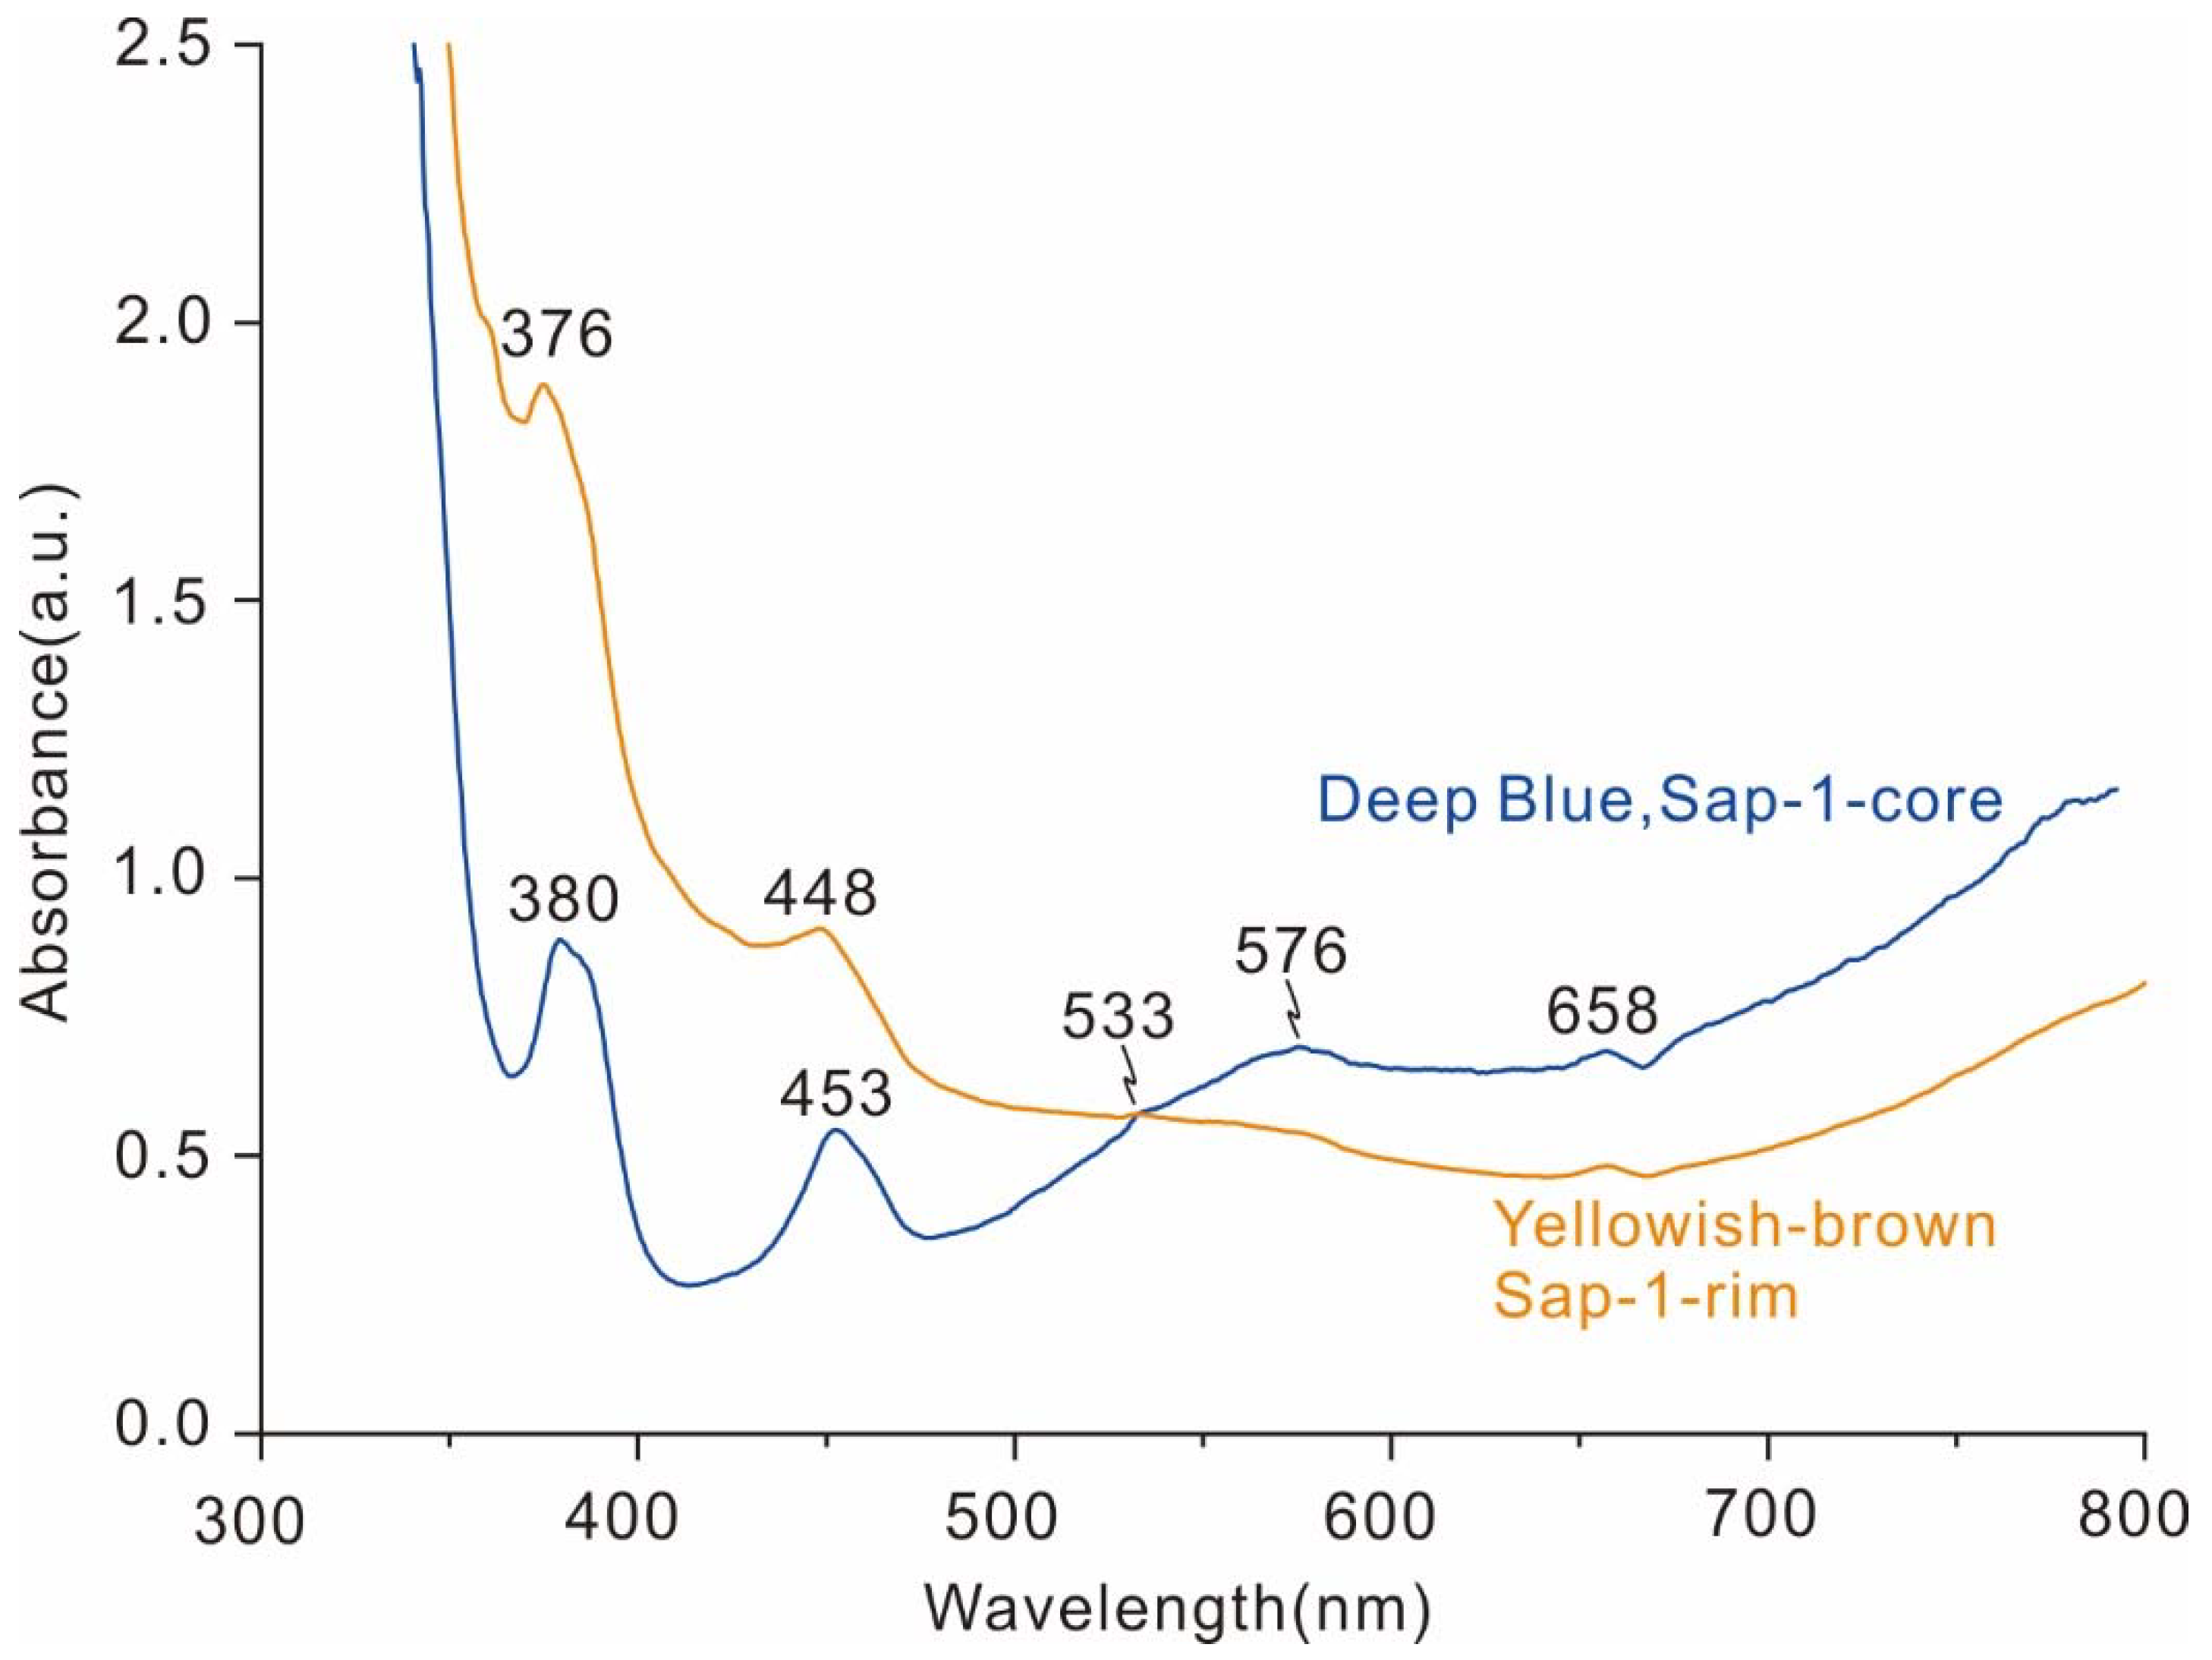
4.2. UV–Vis Spectral Characteristics
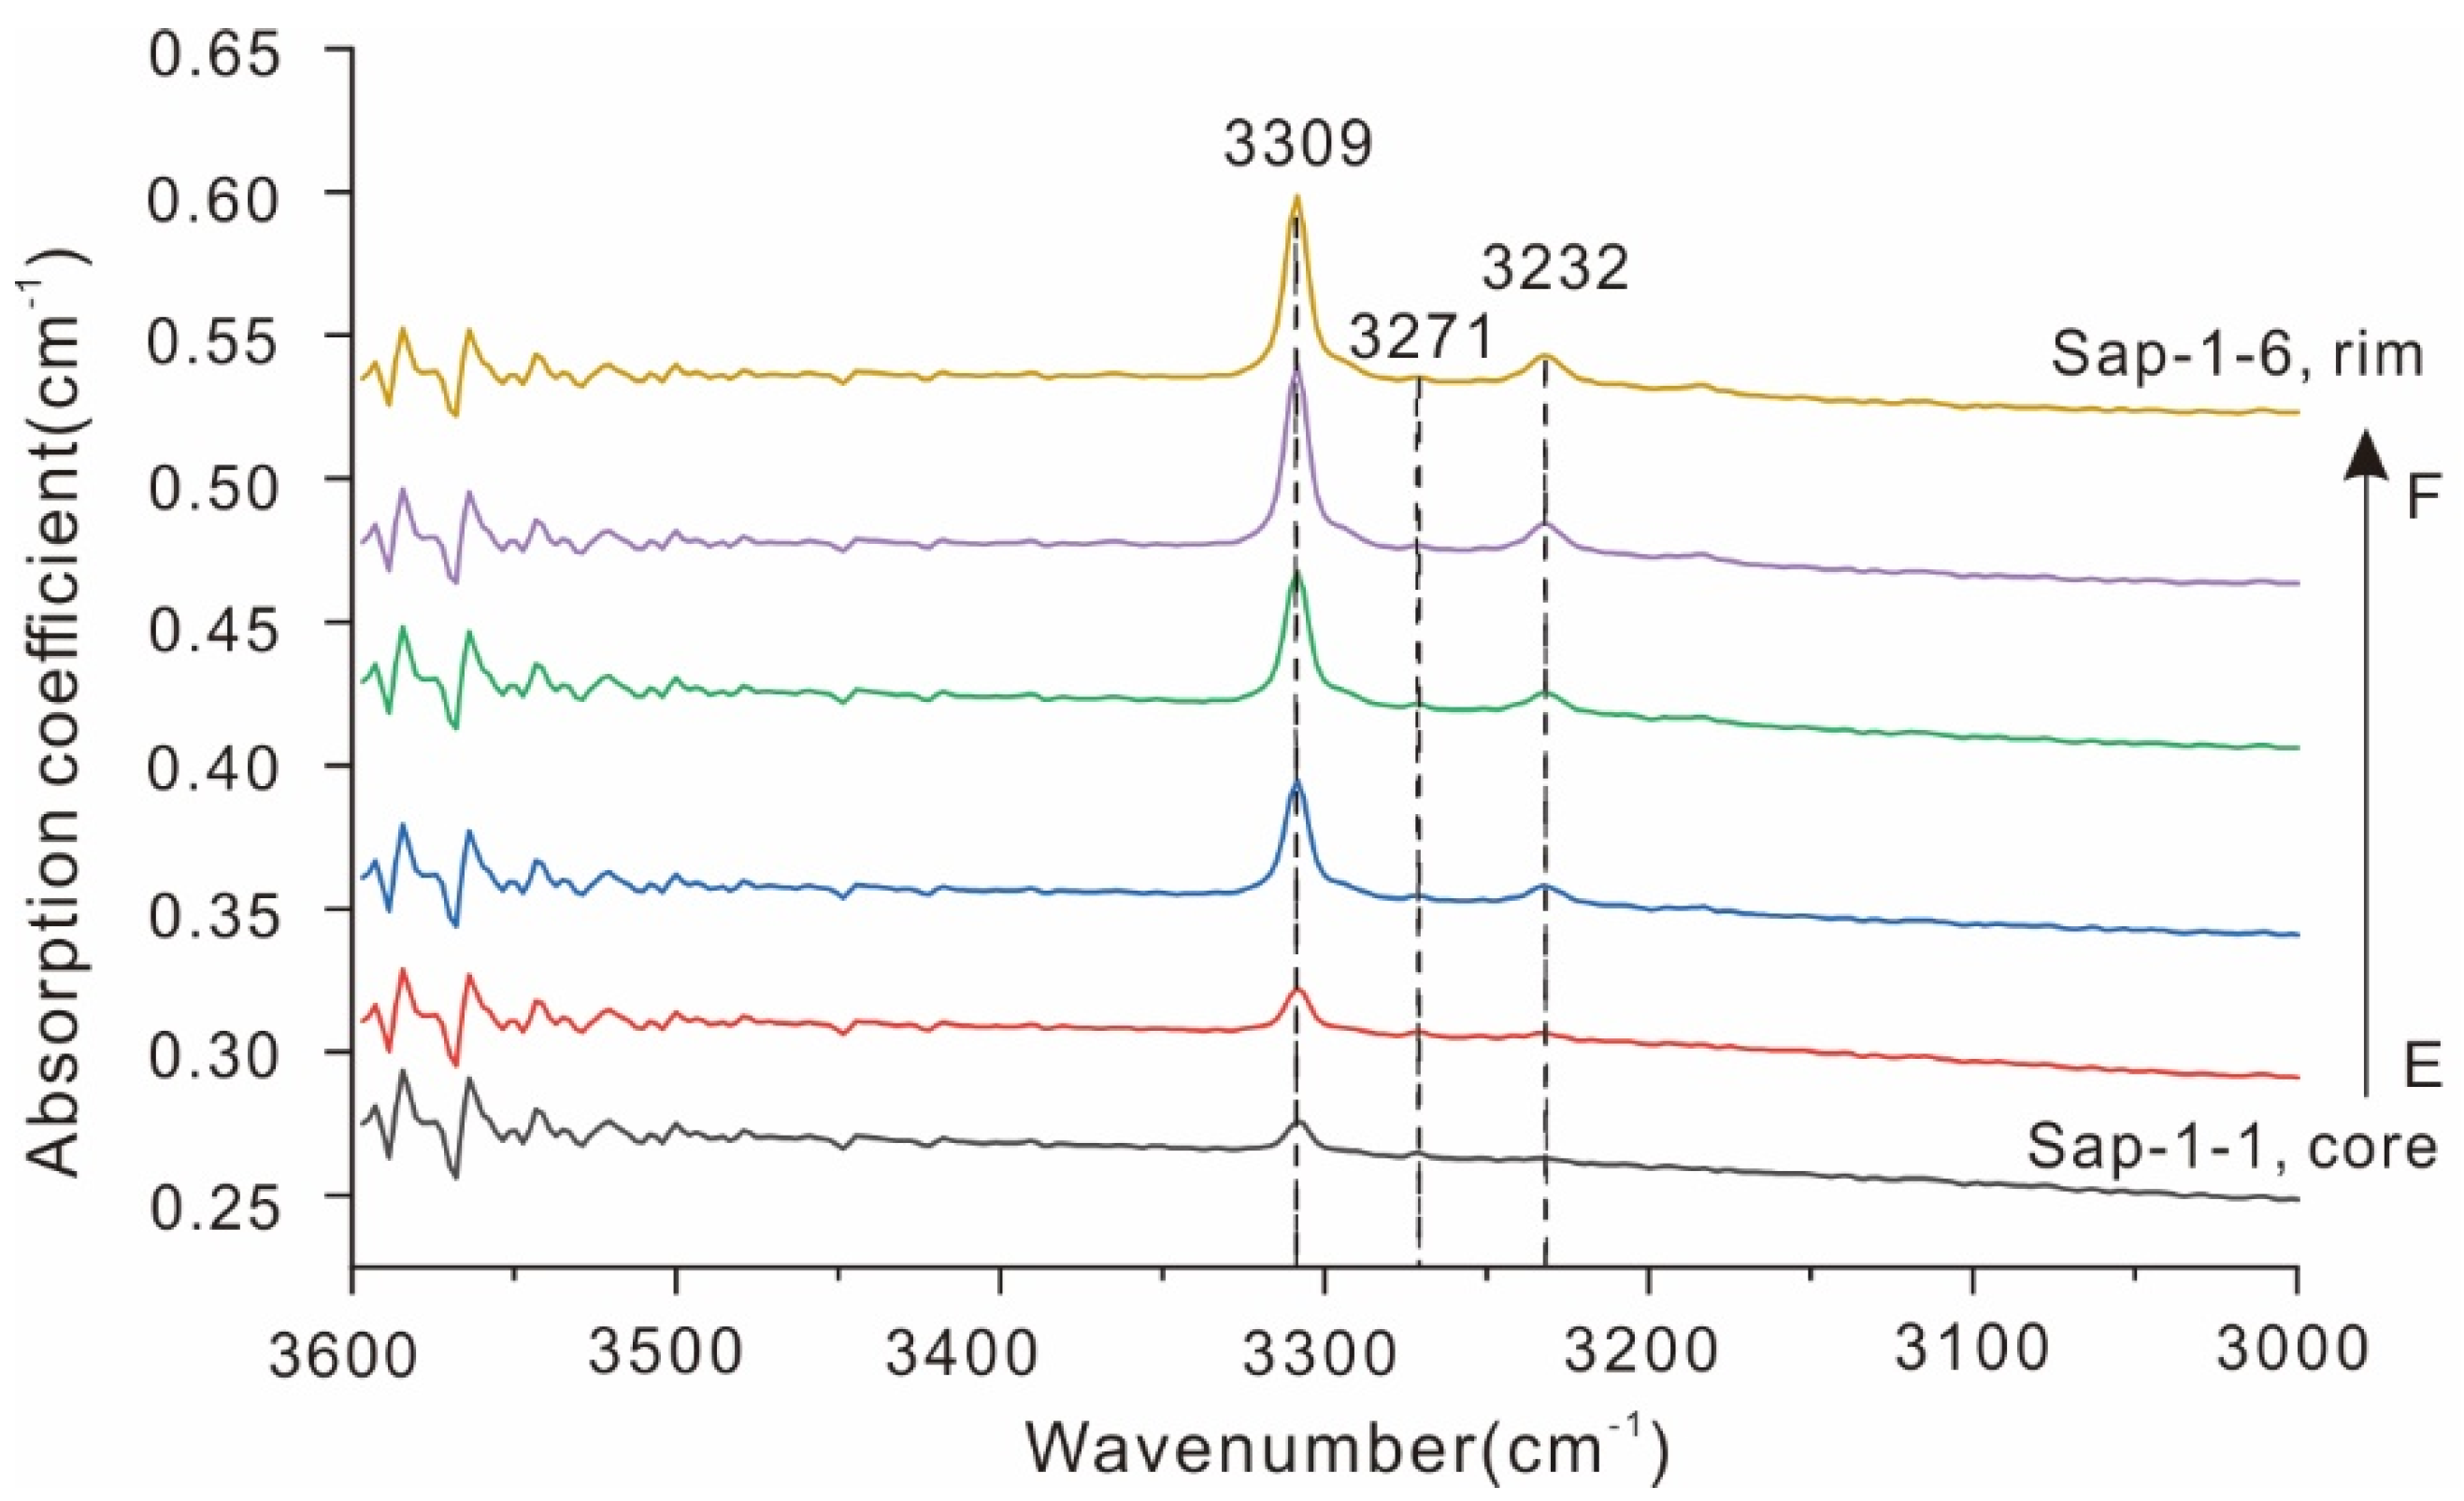
The UV–Vis absorption spectra of the studied sample Sap-1 are shown in Figure 6. The main peaks in the deep-blue core of the blue sapphire were sharp narrow peaks at 380 nm and 453 nm, a broad absorption band at 576 nm, and small peaks at 658 nm and 533 nm were also observed. The yellowish-brown rim had weak absorption peaks at 376 nm, 448 nm, 533nm, and 658 nm (Figure 6).

4.3. FTIR Features

The FTIR features of Sap-1 were characterized by a strong absorption peak at 3309 cm−1, and weak absorption peaks near 3232 cm−1 and 3271 cm−1. The absorption intensity of the three peaks generally decreased from rim to core (Figure 7).

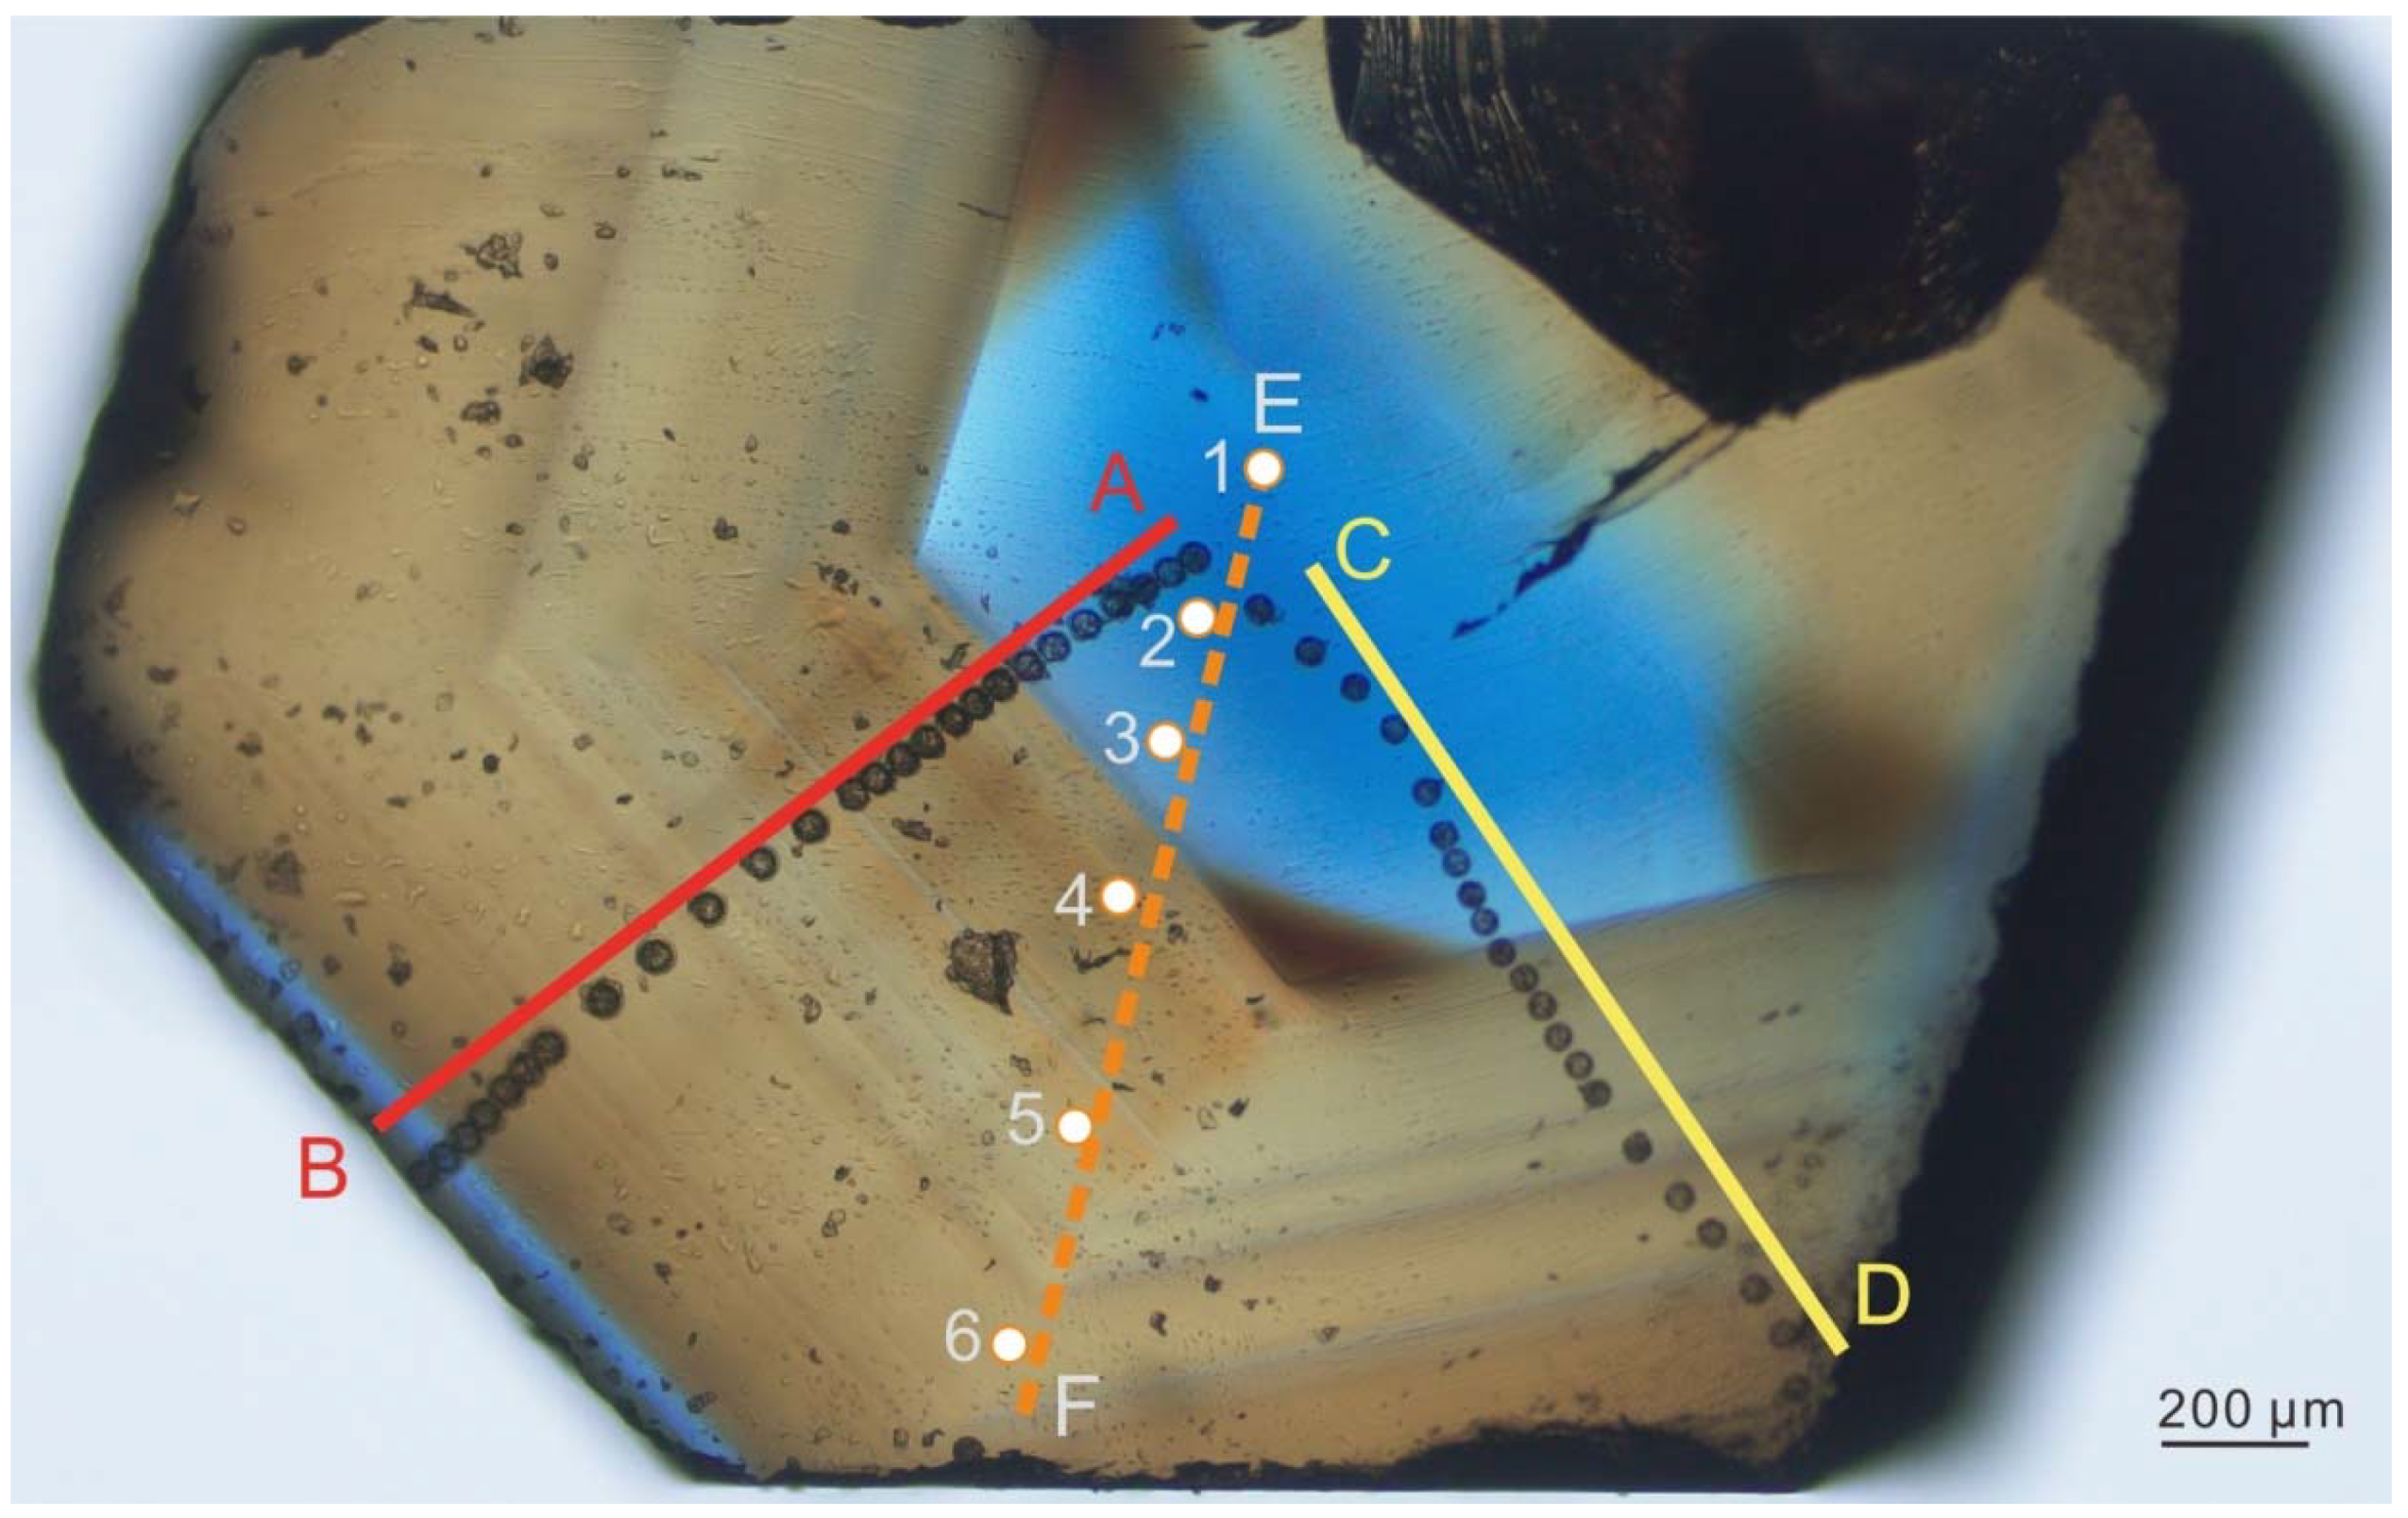
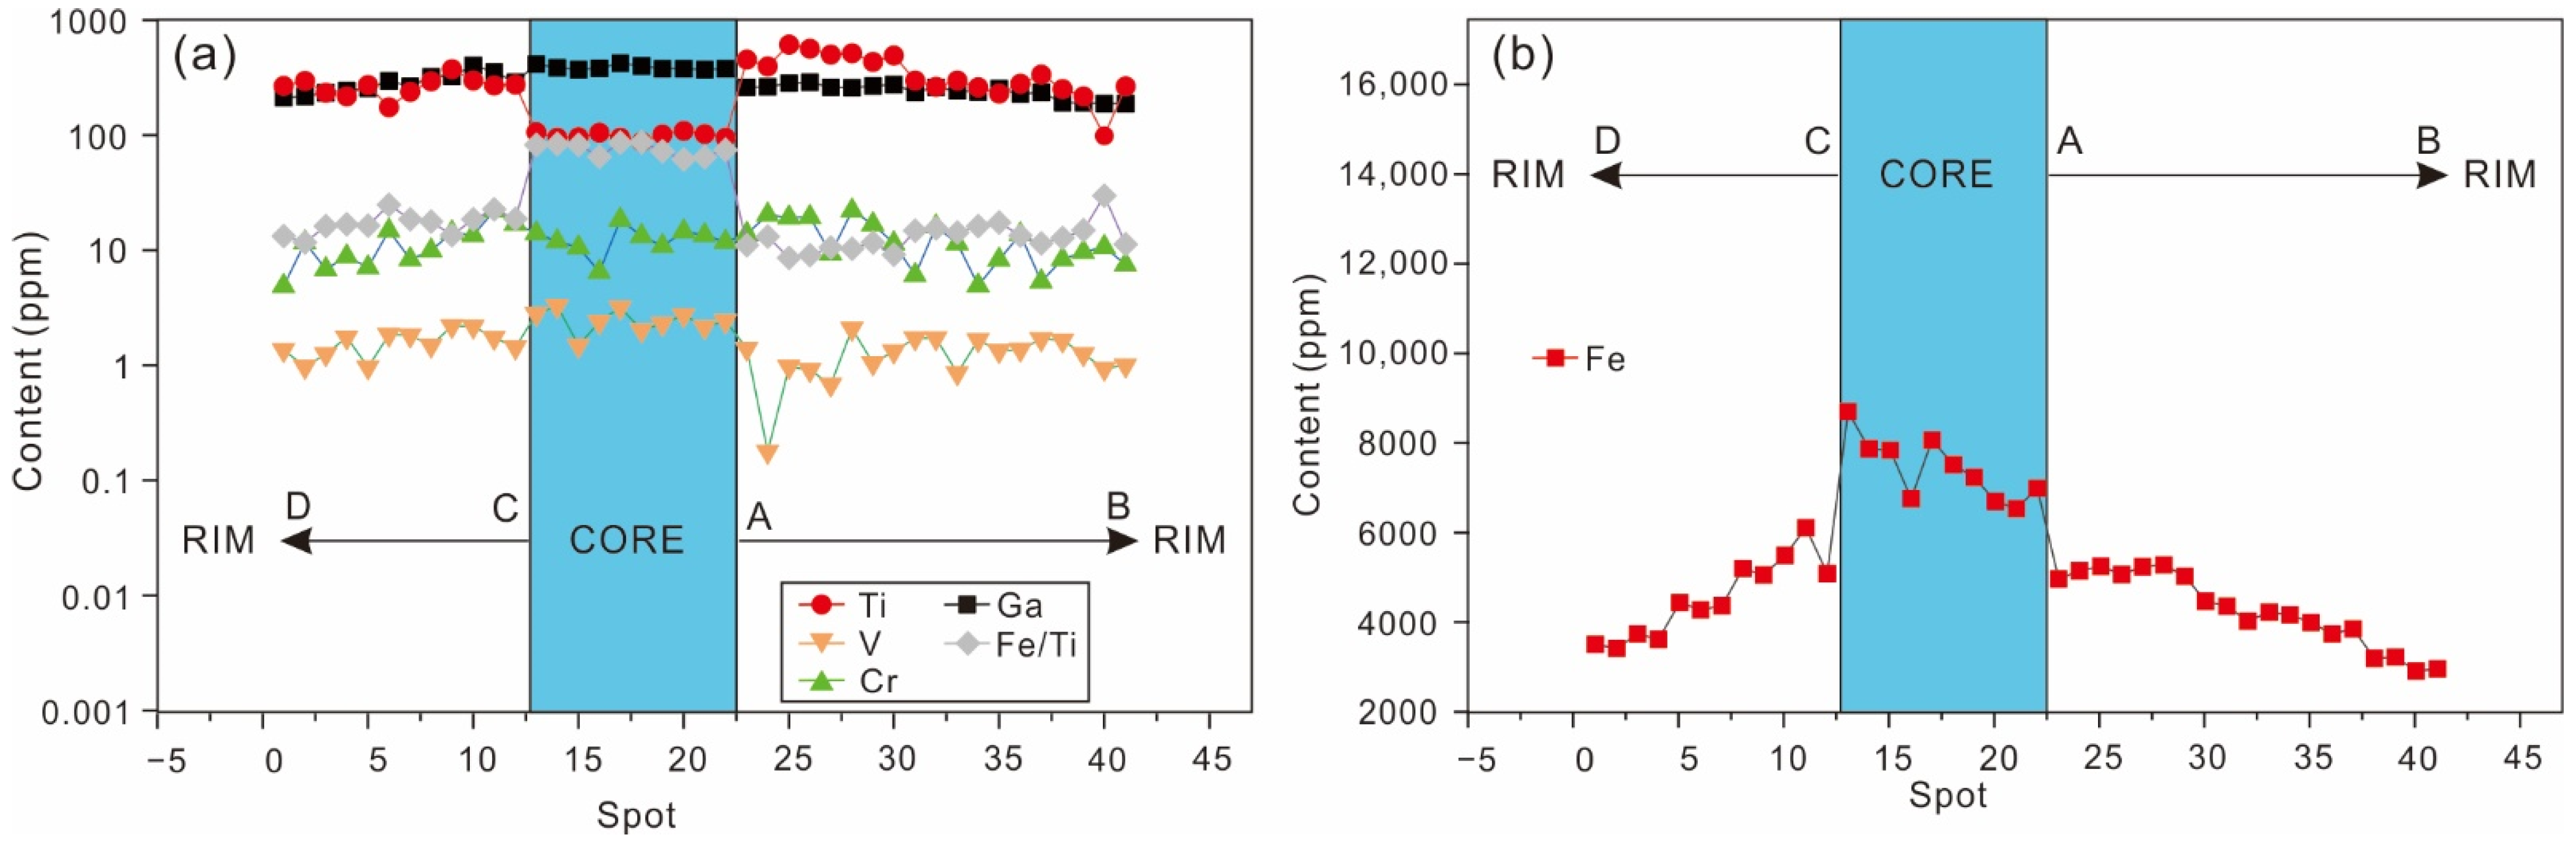
4.4. Chemical Composition of the Penglai Sapphires

The trace elements of sample Sap-1 from two profiles analyzed from core to rim are shown in Table S1. The main contents of Fe, Ti, Cr, V, Ga, and Mg and their ratios are shown in Table 1. The main component of Al2O3 in the deep-blue core ranged from 98.53 wt.% to 98.79 wt.% (average 98.69 wt.%) and from 98.51 wt.% to 99.04 wt.% (average 98.73 wt.%) in profiles AB and CD, respectively. The content of Al2O3 in yellowish-brown rim ranged from 98.93 wt.% to 99.39 wt.% (average 99.12 wt.%), from 98.95 wt.% to 99.28 wt.% (average 99.15 wt.%) in profiles AB and CD, respectively (Table S1). The contents of Fe, Ga, Mg, and V in the core were obviously higher than those of elements in the rim (Figure 8a,b). We combined the two sets of data and found that Fe content in the core ranged from 5091.60 ppm to 8697.46 ppm, with an average of 7117.45 ppm (n = 12). In contrast, lower Fe content was observed ranging from 2906.85 ppm to 5488.46 ppm, with an average of 4377.55 ppm (n = 23) (Figure 8b). The mean values of Ga, Mg, and V in the core were 374.45 ppm, 15.79 ppm, and 2.33 ppm, respectively, and the corresponding data of three elements in the rim were 255.54 ppm, 6.27 ppm, and 1.30 ppm, respectively. There was no significant difference in Cr content between the core and the rim. However, the content of Ti in the rim (mean 334.85 ppm) was obviously higher than that in the core (mean 127.53 ppm) (Figure 8a).

5. Discussion

5.1. Color Genesis of Growth Bands

The UV–Vis absorption peaks near 377 and 450 nm are due to the replacement of the adjacent 2Al3+ cations with Fe3+-Fe3+ ion pair [1,20,21]. The absorption peaks of sapphire at or near 575–580 nm are related to Fe2+, Ti4+, V3+ and Cr3+ [1,22,23]. The absorption peak at 658 nm is the result of Cr3+ [1], and it is worth noting that it has been observed that Co2+ in sapphire can also produce absorption peaks around 450 nm and in the range of 600–700 nm [24,25].
The distribution patterns of trace elements from core to rim of the Penglai sapphire (Figure 8) and the correlation of their trace elements (Figure 9) showed that (1) Fe and Ti contents relatively changed with respect to the crystallization position and crystal color. From deep-blue core to yellowish-brown rim, Fe content decreased, while Ti content increased (Figure 9a). (2) The variations in Fe and Ti concentrations were negatively correlated in the core but positively correlated in the rim (Figure 9b). (3) The contents of V and Cr had slight differences in the core and the rim, but there was almost no change relative to the position. (4) There was a positive correlation between Fe and Ga.
The obvious peaks at 380 nm and 453 nm for the deep-blue core and two distinct peaks at 376 nm and 448 nm for the yellowish-brown rim in the UV–Vis absorption spectra of the studied sample were attributed to Fe3+-Fe3+ ion pairs, as was the weak peak at 533 nm. The weak peak at 576 nm was caused by Fe2+-Ti4+ ion pairs, which appeared at the core but not the rim (Figure 6). Generally, Fe2+-Ti4+ charge transfer contributes to blue color, when Ti content is high in sapphire crystals [1,26]. However, there was no characteristic absorption peak of Fe2+-Ti4+ in the UV–Vis absorption spectra of the yellowish-brown rim, compared with the peak in the core, indicating that Ti in the rim was not involved in the formation of Fe2+-Ti4+ even if the content of Ti in the rim was obviously higher than that in the core. The high concentration of Ti resulted from the great number of microscopic inclusions over growth bands that were clearly observed under the microscope (Figure 5). These inclusions are difficult to investigate using infrared and Raman spectroscopy [27]. Having different colors within core and rim but slight differences in Cr3+ and V3+ contents (Figure 8) indicates that they were not the chromophores producing the deep-blue color in the core. The absorption peaks at 658 nm at the core and rim were mainly caused by Cr3+ (Figure 6). The hole–Cr3+ preferentially pairs with trapped holes, compared with Fe3+, and the hole–Cr3+ pairing produces an orange color. High concentrations of Fe3+ produce a yellow color. We propose that the mixing of Fe3+-Fe3+ and cavity–Cr3+ pairs produces a marginal yellowish-brown color, and the Fe2+-Ti4+ ion pair is the main factor in producing the deep-blue color of the core of the pungent sapphire. The impact of Co2+ on the coloration of sapphire cannot be ruled out, and further research is needed. In addition, based upon the compilation of UV–Vis spectra of basaltic sapphires from different origins (Table 2), we suggest that the deep-blue coloration in the core is closely related to Fe2+-Ti4+, and it pairs with Fe3+-Fe3+ and Cr3+ in the core, likely producing purple-hued blue. The chromogenic factors of the yellowish-brown rim are Fe3+-Fe3+ and Cr3+.
The radius of Ga3+ is similar to that of Al3+ and Fe3+, with positive three valence electrons distributed on the outermost electron layer. Its chemical features reveal a strong oxophilic affinity. Gallium’s geochemical properties under oxidizing conditions are similar to those of Fe and especially of Al. The content of Ga decreased from core to rim, indicating that the core sapphires crystalized in a much higher oxidation environment than those in the rim. The positive correlation between the content of Ga and Fe showed that the content of Fe3+ also decreased from core to rim. These compositional variations well indicated that the deep-blue core was mainly caused by Fe2+-Ti4+ and Fe3+-Fe3+, Cr3+, and V3+ in an oxidizing environment, whereas the yellowish-brown rim dominantly resulted from Fe3+-Fe3+ in a reduced environment.
Phlayrahan et al. [31] argued that the peak at 3309 cm−1 in the FTIR diagram is caused by the stretching vibration of Ti-OH, which is stronger in the c-axis direction, and the peaks near 3232, 3271 cm−1 are considered to be the absorption of the stretching vibration of Ti-OH in different crystallographic directions. According to the Beer–Lambert law A = εcd, the principle of quantitative analysis in infrared spectroscopy, the absorption peak near 3309 cm−1 corresponding to -OH in the sapphire ribbon can be analyzed by c = A/εd for quantitative comparison. The studied samples were double-cut and parallel-polished; therefore, one sample showed the same d value, so the magnitude of c was proportional to the A value (c is the concentration of -OH in the sapphire; A is the absorbance). According to Figure 7, the content of -OH increased sequentially from core to rim. The absorption peak near 3310 cm−1 was indicative of sapphire grown in a strongly reducing environment [32]. Phlayrahan et al. [33] proposed the heating-induced binding between Ti, Fe, and -OH in the blue sapphire structure, and that the intensity of peak at 3309 cm−1 series gradually decreases with increasing heating temperature in any given condition. However, the trend from core to rim in our sample was reversed (Figure 7), suggesting that the deep-blue rimmed by yellowish-brown bands in the investigated sample was not caused by heating but by a different redox condition during the formation.

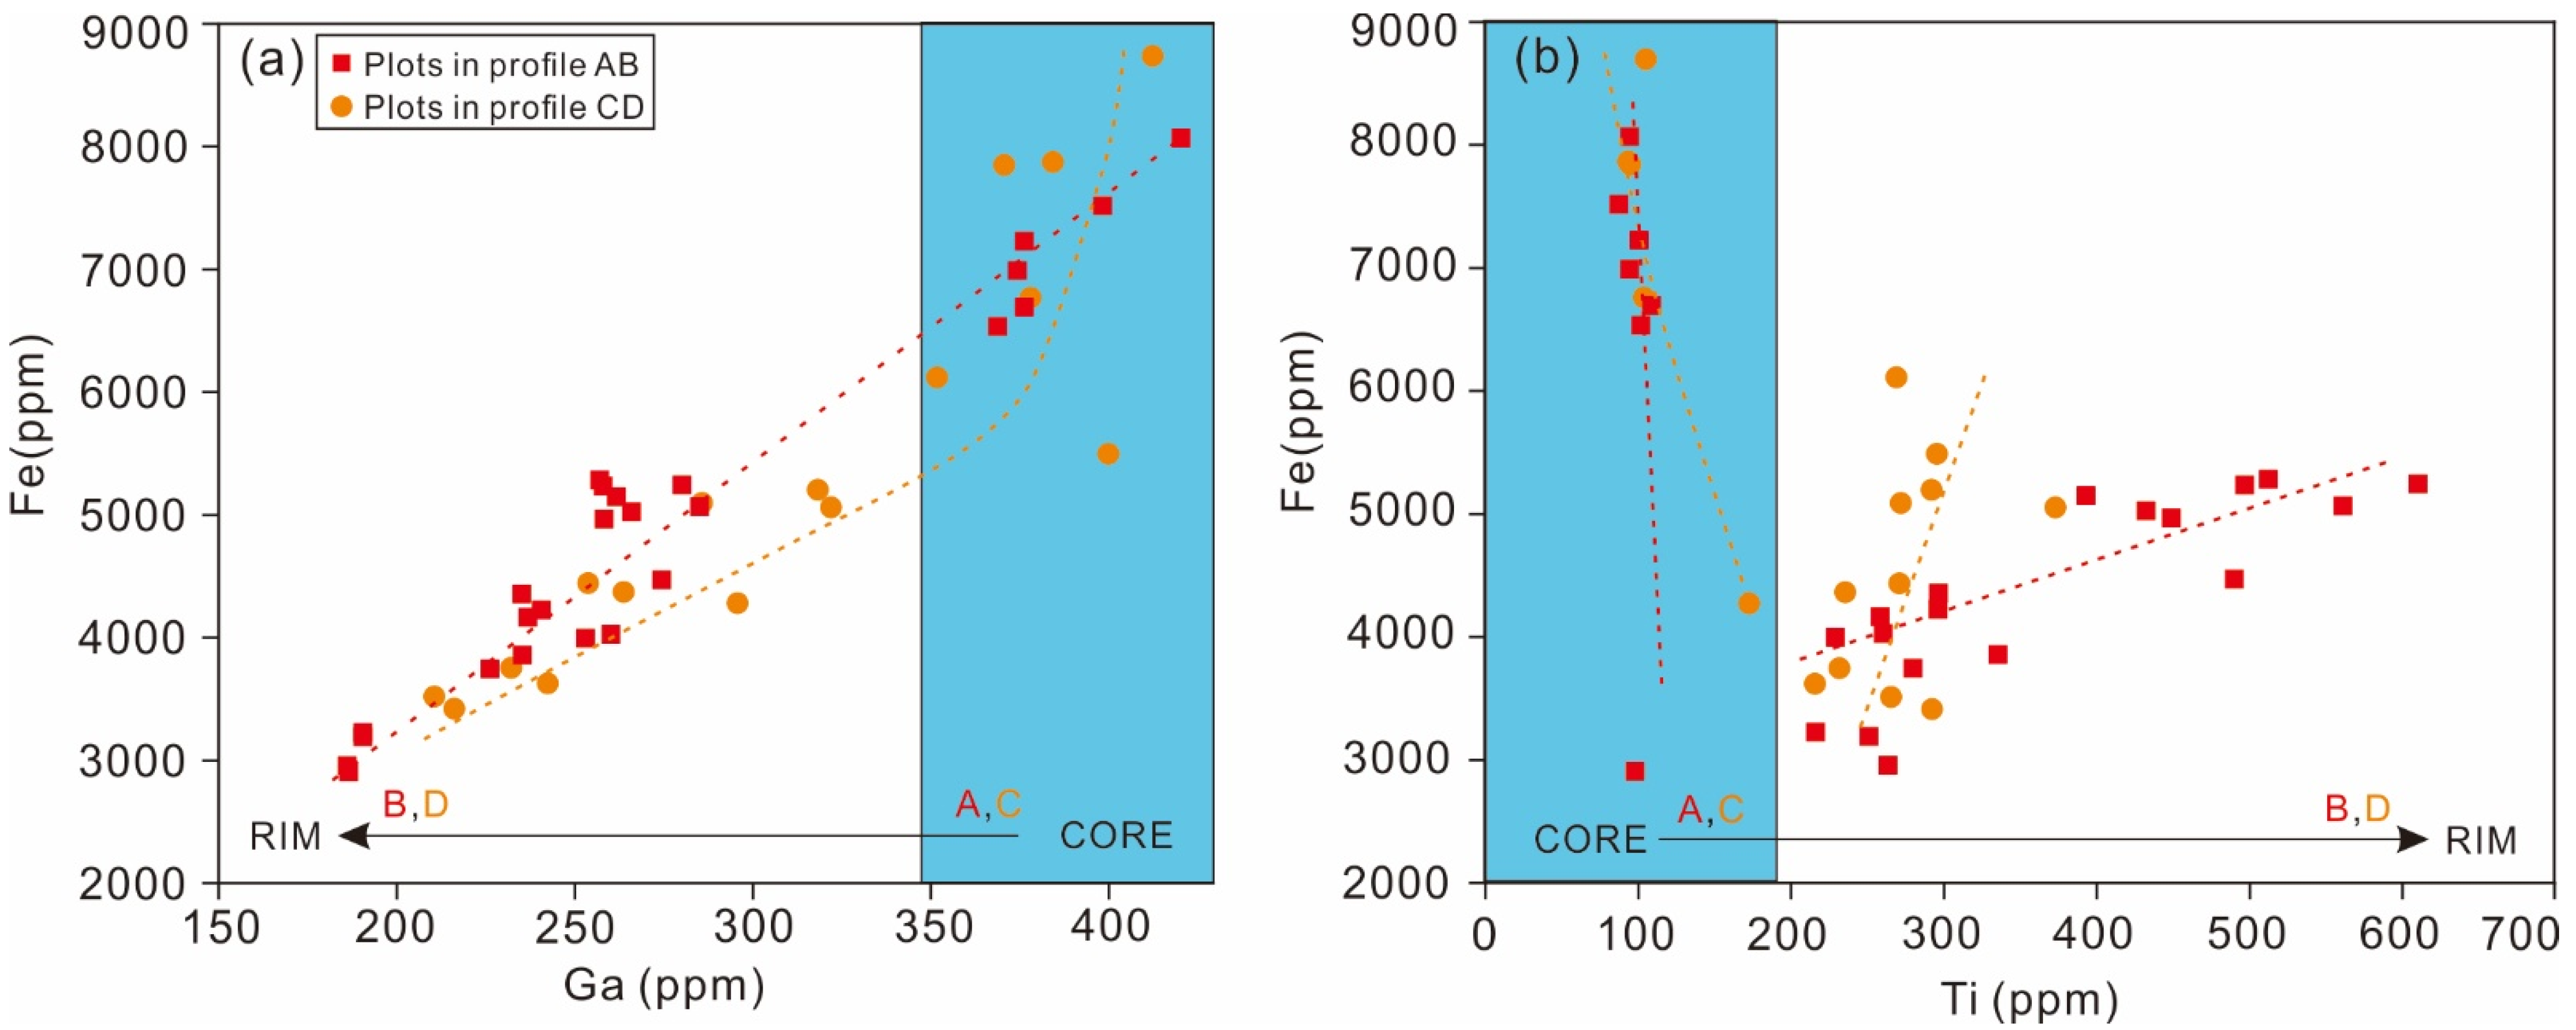
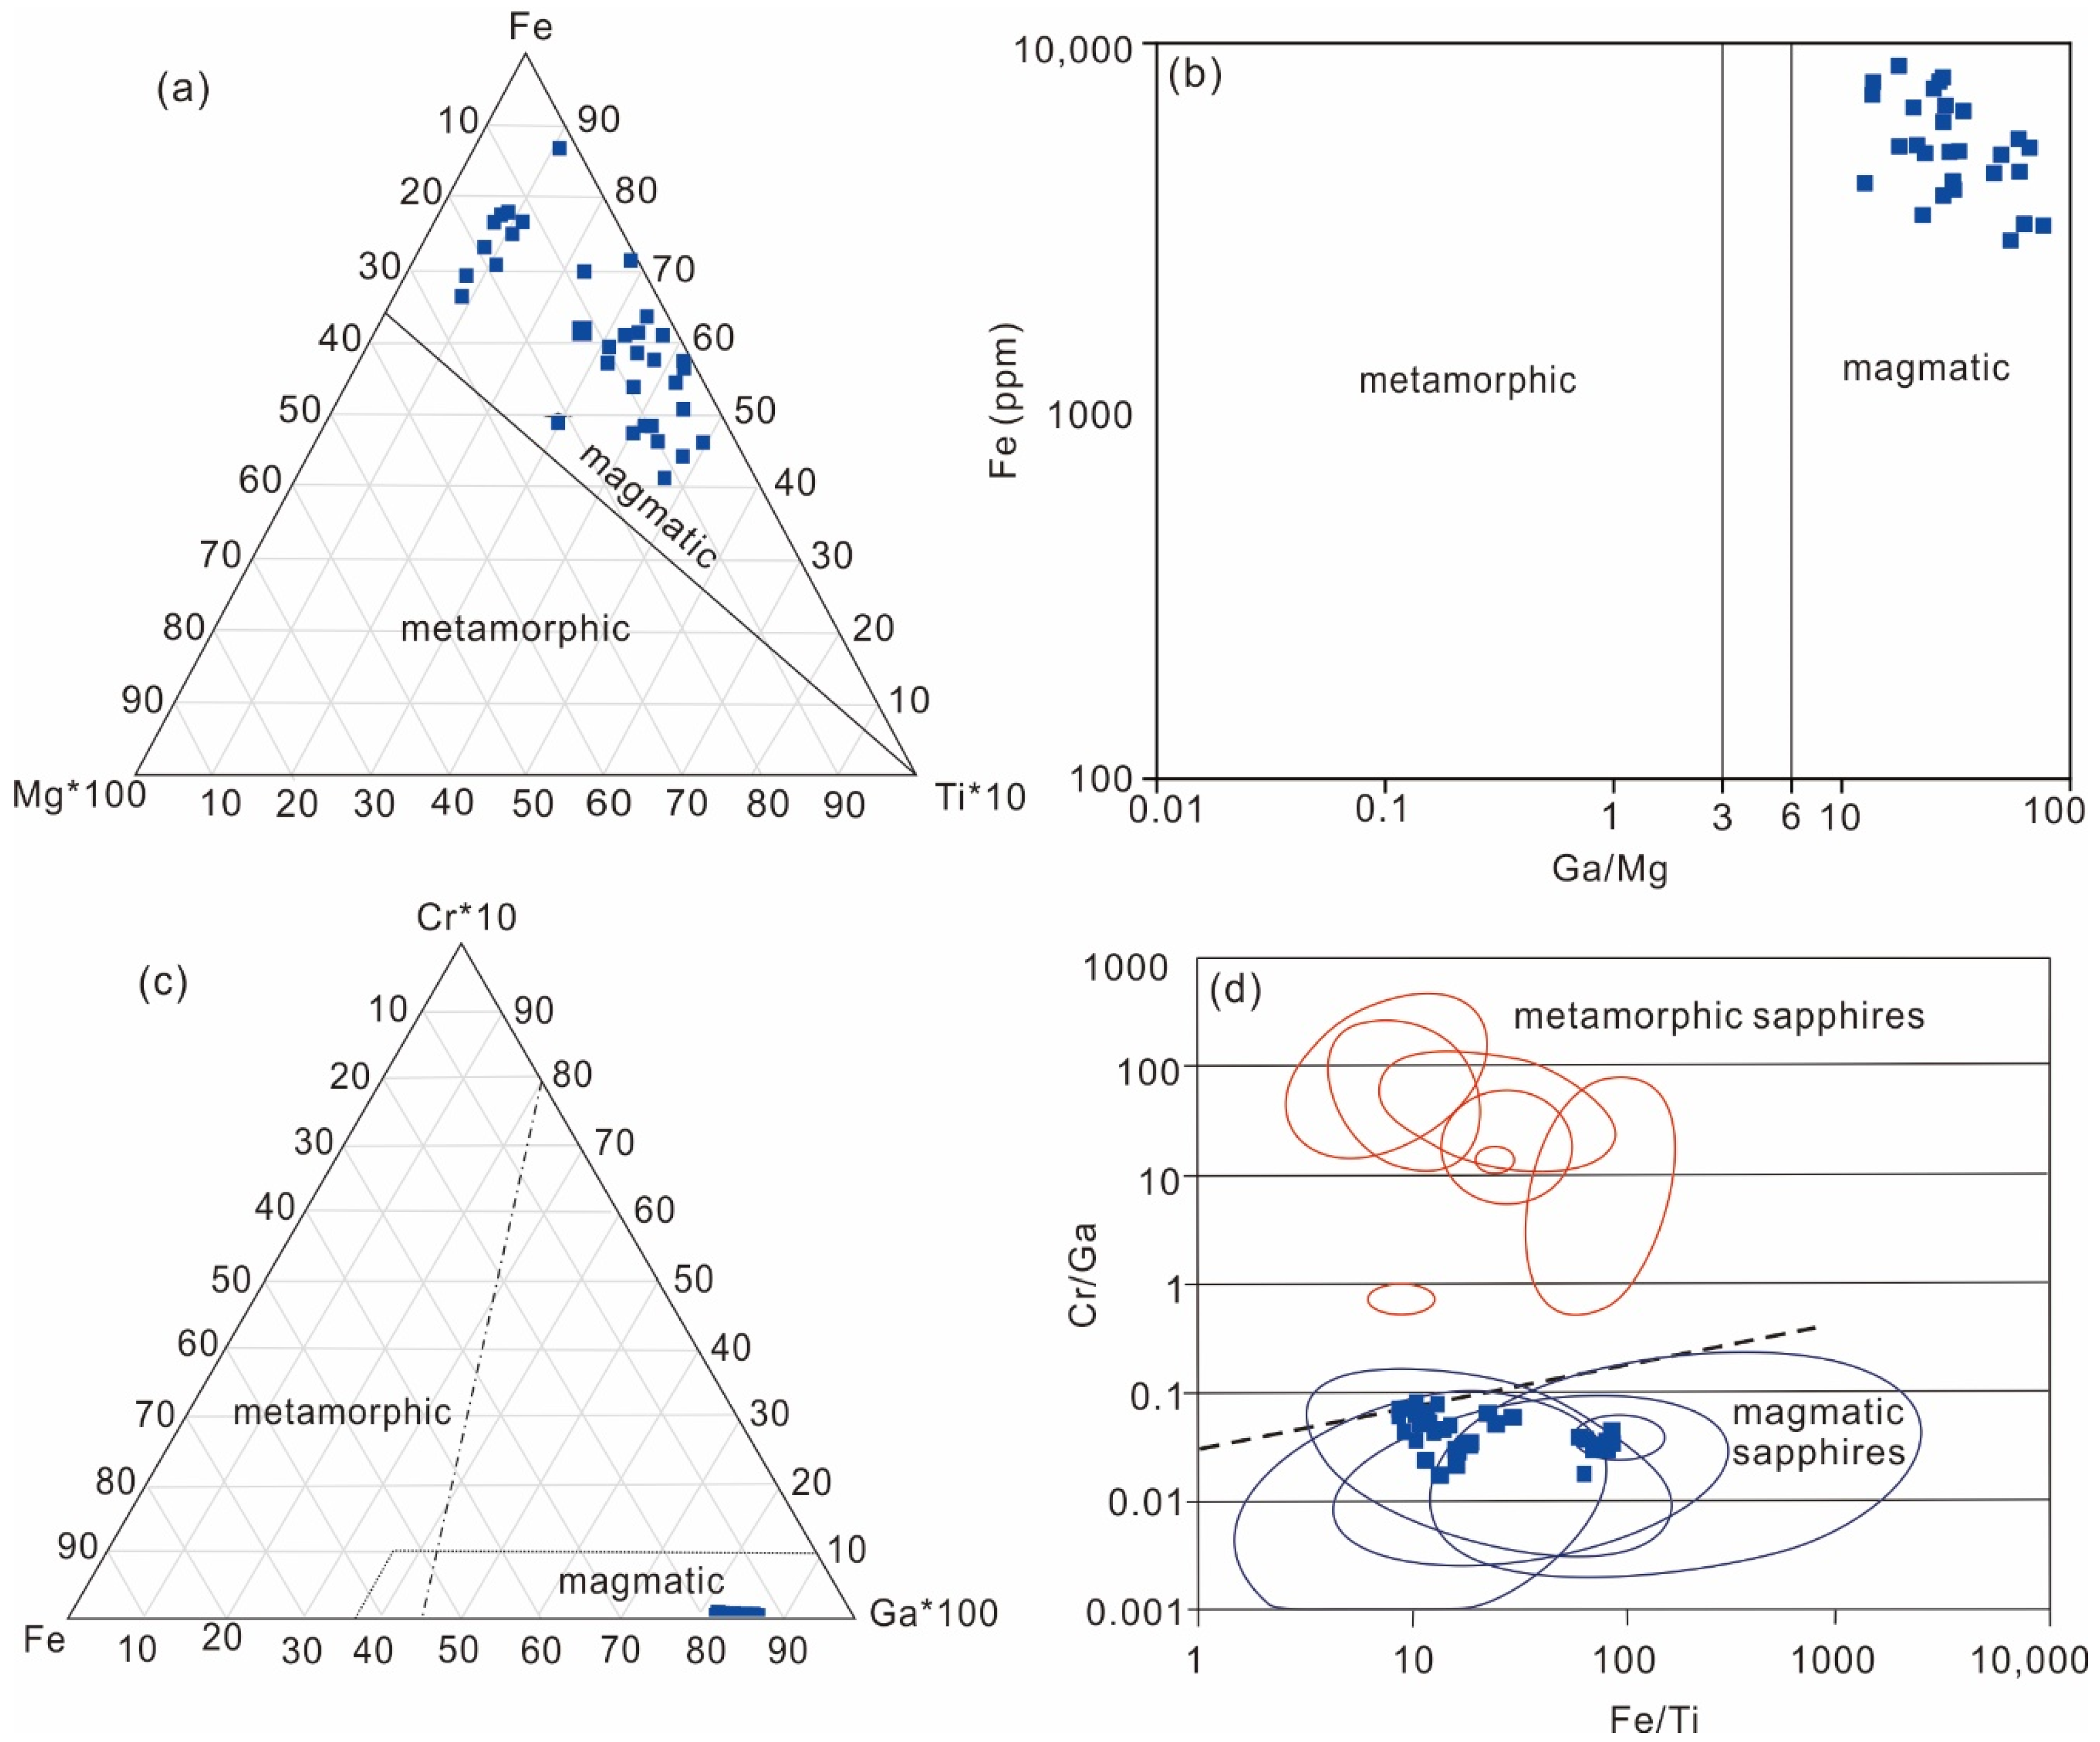
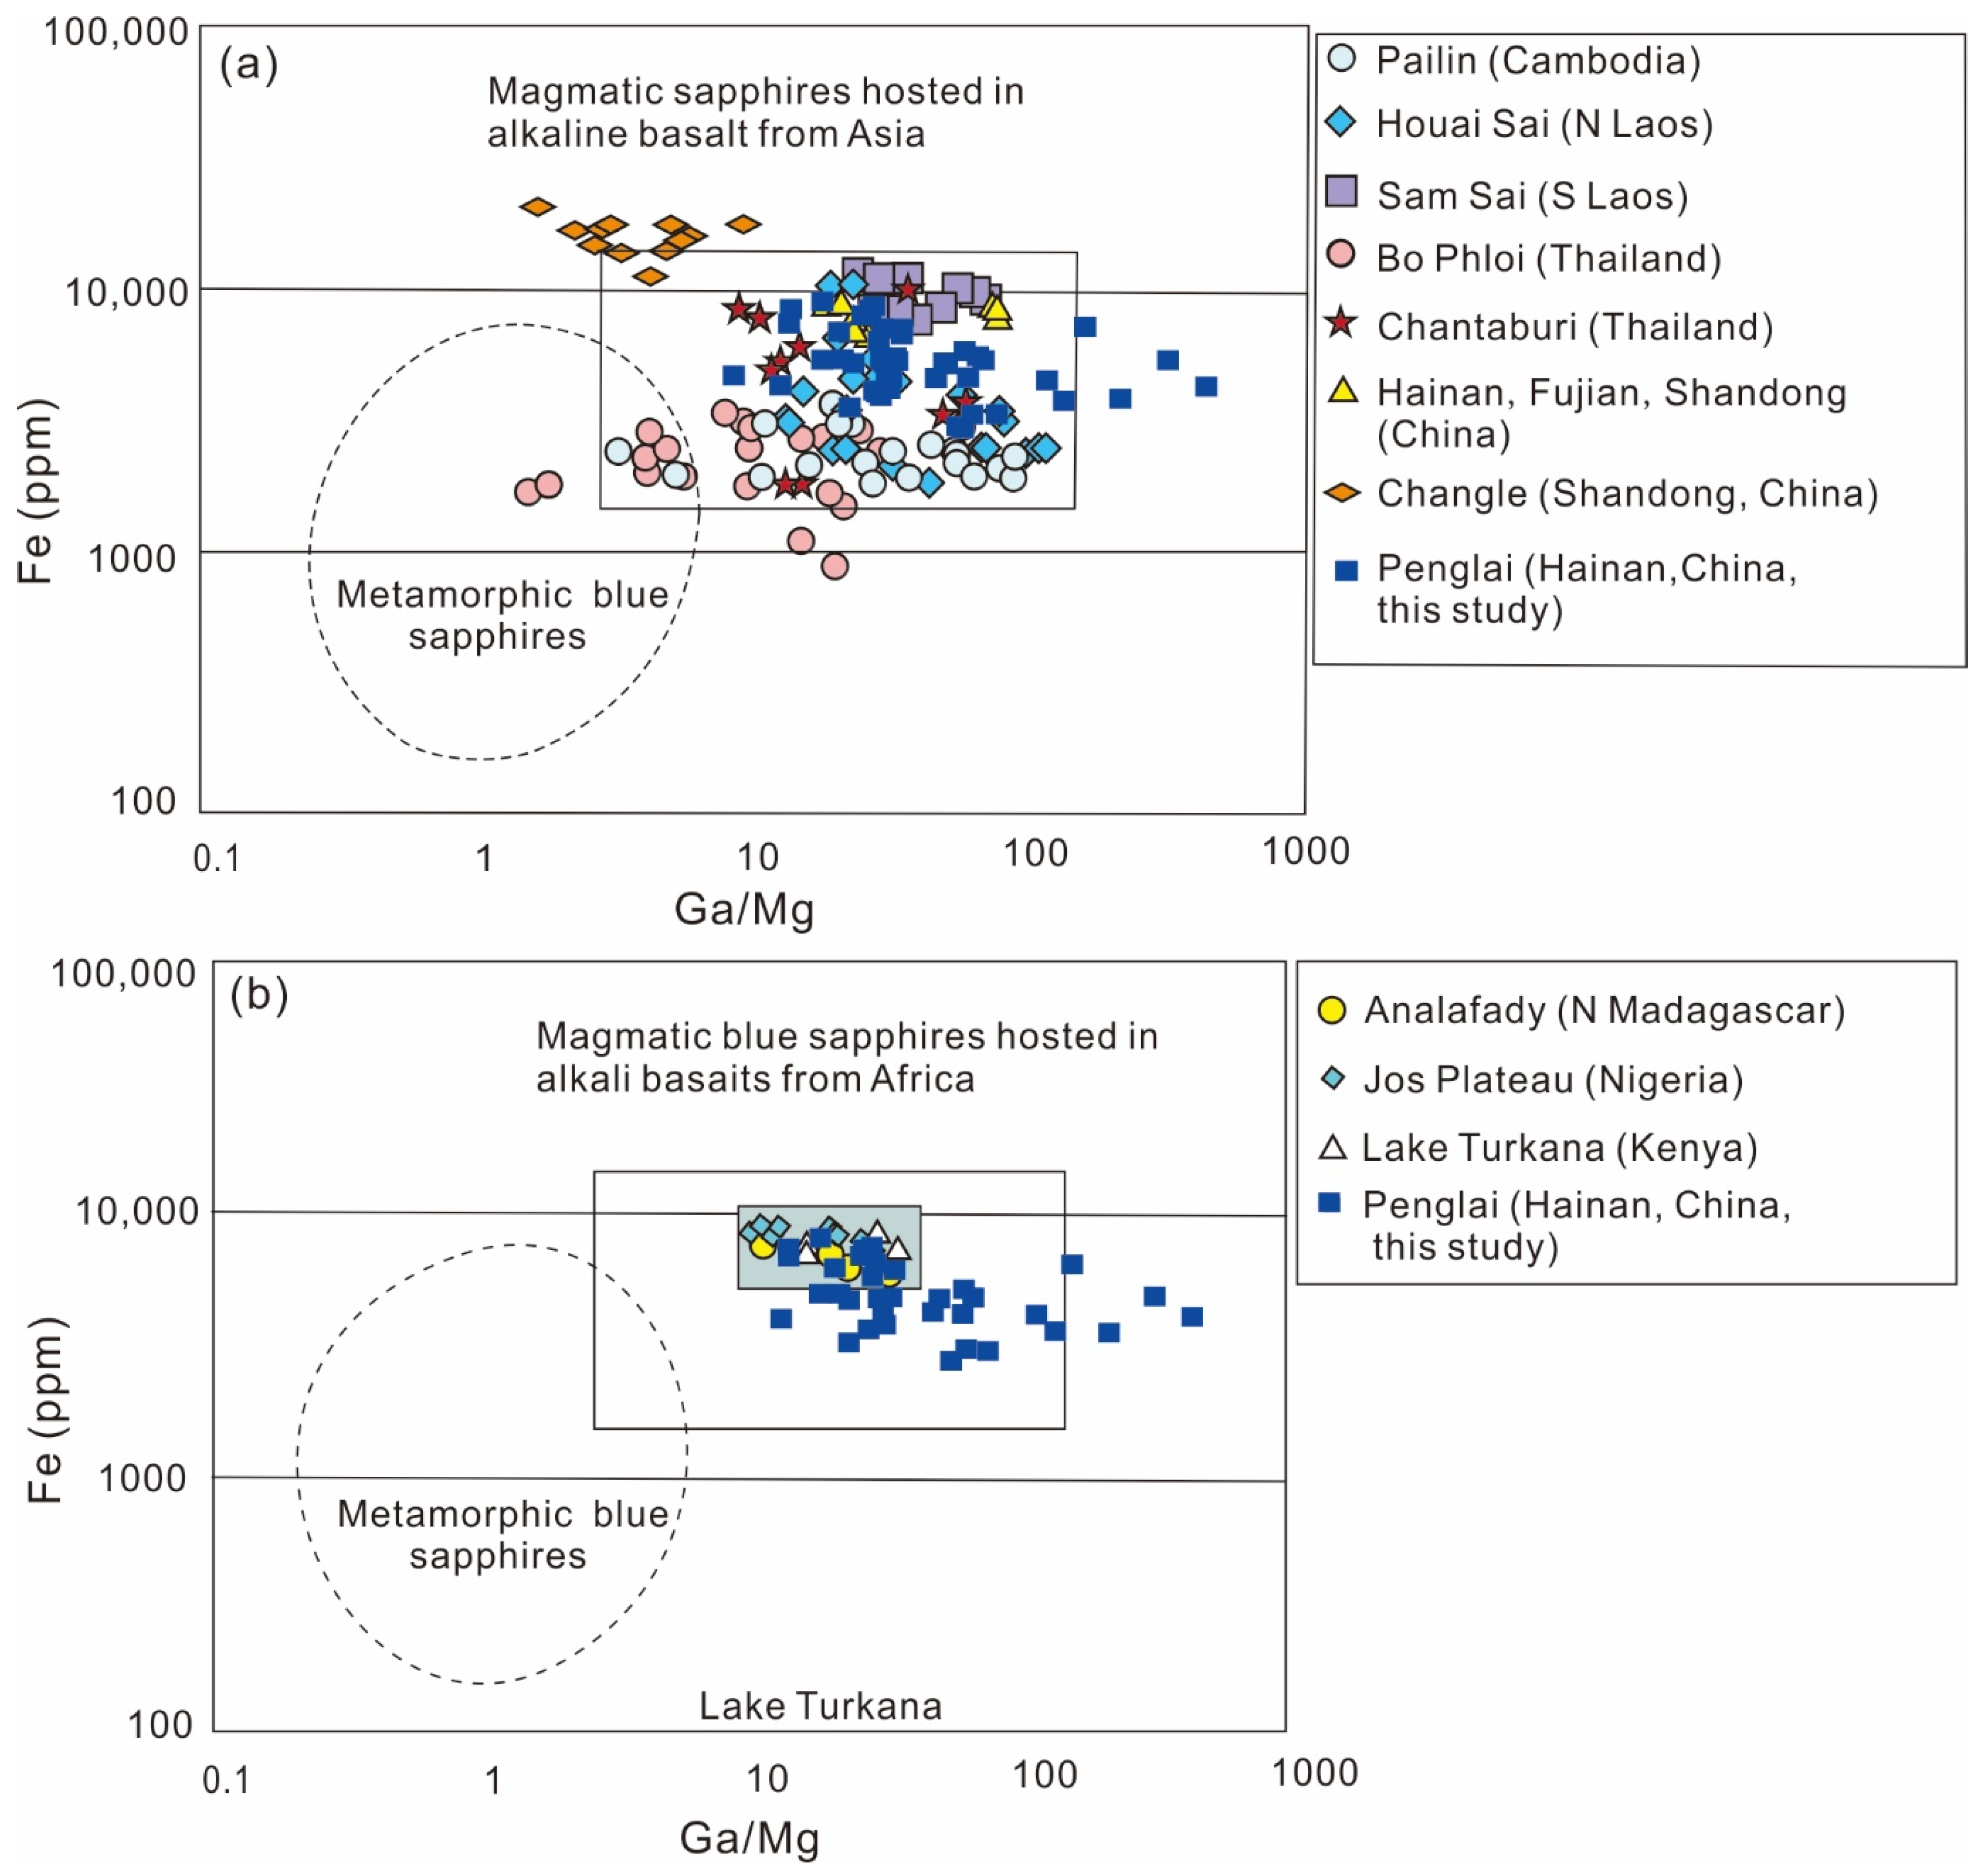
5.2. Compositional Characteristics of the Penglai Sapphire

Trace elements of minerals are often considered favorable tools to explain minerals’ origin and also help us to understand the geological processes related to the mineral formation [3,4,34,35,36]. As for sapphire, previous studies mainly focused on the distribution of Fe, Ti, Mg, Ga, Cr, and V in sapphire with respect to identifying different types of deposits (Figure 10). Generally, the content of Ga in basaltic corundum is higher than 100 ppm, while in metamorphic corundum, it is lower than 100 ppm [37]. The Ga/Mg ratio is an effective indicator for distinguishing metamorphic from magmatic sapphire. The ratio of the magmatic sapphire is >10, while that of the metamorphic is <10 [38]. The Ga/Mg ratio greater than 6 would indicate a magmatic origin, while the Ga/Mg ratio less than 3 indicates a metamorphic one [39]. As shown in Table 1, the Ga content in all spots of sample Sap-1 was higher than 100 ppm, with Ga/Mg ratio > 10. All data showed Ga/Mg > 6. The Fe vs. Ga/Mg plot showed that all spots fell into the magmatic field (Figure 10b).
The Fe/Mg ratio of the magmatic sapphire is commonly greater than 100, while that of the metamorphic and metasomatic sapphire is less than 100. Moreover, the Cr/Ga ratio of the magmatic sapphire is less than 0.1, while the metamorphic is greater than 1 [40]. The Fe/Mg ratio of Penglai sapphire had a large range, from 221 to 6268, and Cr/Ga ratio ranged from 0.02 to 0.09; all these values were similar to those of magmatic sapphires. In Fe–Mg–Ti plot and Cr–Fe–Ga ternary diagram, all data fell within a magmatic sapphire field (Figure 10a,c). The Cr/Ga and Fe/Ti diagram displayed that almost all plots fell within a magmatic sapphire area, and only several plots were scattered near the boundary line between magmatic and metamorphic fields (Figure 10d). Therefore, all values of studied sapphires indicated a magmatic origin. In addition, the presence of Sn and Ta (Table S1) suggested that the sapphires likely formed related to magmatic rocks, e.g., syenite or granite [41,42].
Trace element contents of the Penglai sapphire in Hainan, China, and other magmatic sapphires worldwide are compared in Table 3 and Figure 11. The Penglai sapphires are characterized by high Fe content and are as variable in Fe content as sapphires from Changle, Shandong [43], Chantaburi, Thailand, Houai Sai, Laos, and Lake Turkana area, Kenya [38] (the variation is seen in the large σ value in the table). The Ti content also varies greatly, which is related to the ubiquitous titanium-containing inclusions in sapphire. Such inclusions exist in most basalt types, including sapphires from Pailin in Cambodia, and Chantaburi in Thailand, Australia, and Ethiopia [44]. The data of Shandong Changle sapphire samples show that the concentrations of Fe, Ti, Cr, and Mg are than those of other sapphires [43], and it varies greatly, with the content of Fe much larger than that of Hainan sapphire.
Figure 11 presents the Fe content versus Ga/Mg ratio of the studied sapphires in Hainan, China, and those of famous deposits in Asia and Africa. The basaltic sapphire deposits in Asia include Cambodia, Thailand; Laos in Southeast Asia; and Shandong, Fujian, and Hainan in China. Compositions of the basaltic sapphires from these places are concentrated (Figure 11a). In the rectangular box [38] in the figure, the Ga/Mg ratio of sapphires in these mines is generally higher than that of metamorphic ones. Figure 11a shows that the Penglai sapphire in Hainan, China, falls within the magmatic sapphire field. Compared with sapphires from Cambodia, Bo Phlo in Thailand, and Houai Sai mines in Laos, the Fe content of sapphires from the Penglai mine is relatively high. In Figure 11b, the Ga/Mg ratio and Fe content of the Penglai sapphire in China and the magmatic sapphire from African deposits partly overlap. Combined with Figure 11a, the data indicate that the magmatic sapphires in Africa are roughly enriched with Fe, compared with those of the Penglai sapphires.

6. Conclusions

There are abundant melting erosion and growth marks on the surface of rough sapphires from the Penglai alluvial deposits in Hainan, China. They exhibit a strong glass luster after polishing. Inclusion-bearing growth bands that are milky white in reflected light and yellowish-brown in transmitted light can be observed, which is significant for its origin identification.
The color distribution is uneven, and visible color nuclei, color bands, and multiple colors can be observed on one crystal. The color chromatic factors of the deep-blue core are Fe2+-Ti4+ in an oxidizing environment, it pairs with Fe3+-Fe3+, Cr3+, and V3+ in the core, likely producing purple-hued blue. The Fe in the core mainly exists in the form of Fe3+ that decreased uniformly from core to rim. The chromogenic factors of the yellowish-brown rim are Fe3+-Fe3+ and Cr3+ in a reduced environment. Ti was not involved in forming Fe2+-Ti4+ ion pairs during the formation process of sapphire in the rim.
The chemical composition showed that the Penglai sapphires have a magmatic origin. The oxidation of the formation environment decreased sequentially from the deep-blue core to the yellowish-brown rim. Compared with the basaltic sapphires worldwide, the Fe content was moderately higher than most of those of Asian sapphires but obviously lower than those of Changle sapphires in Shandong, China, and overlapped with those of African sapphires. The content of Ti in the rim was higher than the core, which resulted from ubiquitous Ti-bearing inclusions in sapphire.

Supplementary Materials

The following supporting information can be downloaded at: https://www.mdpi.com/article/10.3390/min12070832/s1; Table S1: The main trace element contents (ppm) of sample Sap-1 analyzed via LA–ICP–MS over two profiles (AB and CD) from core to rim.

Author Contributions

Conceptualization, G.-Y.W., X.-Y.Y. and F.L.; methodology, G.-Y.W., X.-Y.Y. and F.L.; software, G.-Y.W. and X.-Y.Y.; validation, G.-Y.W., X.-Y.Y. and F.L.; formal analysis, G.-Y.W.; investigation, F.L.; resources, F.L.; data curation, G.-Y.W., X.-Y.Y. and F.L.; writing—original draft preparation, G.-Y.W., X.-Y.Y. and F.L.; writing—review and editing, G.-Y.W., X.-Y.Y. and F.L.; visualization, G.-Y.W.; supervision, X.-Y.Y. and F.L.; project administration, X.-Y.Y. and F.L.; funding acquisition, X.-Y.Y. and F.L. All authors have read and agreed to the published version of the manuscript.

Funding

This research was funded by grants from China Geological Survey (DD20190379-88; DD20221630), the Key Special Project for Introduced Talents Team of Southern Marine Science and Engineering Guangdong Laboratory (Guangzhou) (GML2019ZD0201), State Key Laboratory of Geological Processes and Mineral Resources, China University of Geosciences (GPMR202115), National Science Foundation of China (92062215; 41720104009), seventh Institute of Geology and Mineral Exploration of Shandong Province (QDKY202007) and Key Laboratory of Deep-Earth Dynamics of the Ministry of Natural Resources (J1901-32).

Data Availability Statement

Not applicable.

Acknowledgments

We are deeply grateful to Jing-Sui Yang, Zheng-Yu Long, Dong-Yang Lian, Hui-Chao Rui, Guan-Long Li, Ding-Yong Liang, Yi Zhang, Li-Jie Qin, and Zi-Yuan Liu for their help and valuable comments. We also thank Chao Li, Jia-Xin Wan and Yu-Rui Wu for their valuable help during tests. We also like to thank the Gem Lab of the School of Jewelry, China University of Geosciences (Beijing) for the accurate experimental platform.

Conflicts of Interest

The authors declare no conflict of interest in this paper.

References

  1. Dubinsky, E.V.; Stone-Sundberg, J.; Emmett, J.L. A quantitative description of the causes of color in corundum. Gems Gemol. 2020, 56, 2–28. [Google Scholar] [CrossRef]
  2. Xu, X.-S.; Chen, X.-M.; Griffin, W.L.; O′Reilly, S.Y.; Zhang, X.-S.; Chen, L.-H. Immiscible-melt inclusions in corundum megacrysts: Microanalyses and geological implications. Am. Miner. 2021, 106, 559–569. [Google Scholar] [CrossRef]
  3. Kullerud, K.; Nasipuri, P.; Ravna, E.J.K.; Selbekk, R.S. Formation of corundum megacrysts during H2O-saturated incongruent melting of feldspar: P–T pseudosection-based modelling from the Skattøra migmatite complex, North Norwegian Caledonides. Contrib. Miner. Pet. 2012, 164, 627–641. [Google Scholar] [CrossRef]
  4. Baldwin, L.; Tomaschek, F.; Ballhaus, C.; Gerdes, A.; Fonseca, R.; Wirth, R.; Geisler, T.; Nagel, T. Petrogenesis of alkaline basalt-hosted sapphire megacrysts. Petrological and geochemical investigations of in situ sapphire occurrences from the Siebengebirge Volcanic Field, Germany. Contrib. Miner. Pet. 2017, 172, 1–27. [Google Scholar] [CrossRef] [Green Version]
  5. Kochelek, K.; McMillan, N.; McManus, C.; Daniel, D. Provenance determination of sapphires and rubies using laser-induced breakdown spectroscopy and multivariate analysis. Am. Miner. 2015, 100, 1921–1931. [Google Scholar] [CrossRef]
  6. Wang, H.; Yu, X.-Y.; Liu, F.; Alam, M.; Wu, G.-C. Color genesis and compositional characteristics of color-change sapphire from Fuping, China. Crystals 2022, 12, 463. [Google Scholar] [CrossRef]
  7. Abduriyim, A.; Kitawaki, H. Determination of the origin of blue sapphire using laser ablation inductively coupled plasma mass spectrosmetry (LA-ICP-MS). J. Gemmol. 2007, 30, 23–36. [Google Scholar] [CrossRef]
  8. Graham, I.T.; Harris, S.J.; Martin, L. Enigmatic alluvial sapphires from the Orosmayo Region, Jujuy Province, Northwest Argentina: Insights into their origin from in situ oxygen isotopes. Minerals 2019, 9, 390. [Google Scholar] [CrossRef] [Green Version]
  9. Krebs, M.Y.; Hardman, M.F.; Pearson, D.G.; Luo, Y.; Fagan, A.J.; Sarkar, C. An evaluation of the potential for determination of the geographic origin of ruby and sapphire using an expanded trace element suite plus sr-pb isotope compositions. Minerals 2020, 10, 447. [Google Scholar] [CrossRef]
  10. Furui, W. The sapphires of Penglai, Hainan Island, China. Gems Gemol. 1988, 24, 155–159. [Google Scholar] [CrossRef]
  11. Yu, X.-Y.; Long, Z.-Y.; Zhang, Y.; Qin, L.-J.; Zhang, C.; Xie, Z.-R.; Wu, Y.-R.; Yan, Y.; Wu, M.-K.; Wan, J.-X. Overview of gemstone resources in China. Crystals 2021, 11, 1189. [Google Scholar] [CrossRef]
  12. Qiu, Z.; Li, Z.; Qin, S.; Pang, X. Sapphire and its forming-conditions in Penglai, Hainan Province. Acta Mineral. Sin. 1993, 13, 368–373. [Google Scholar]
  13. Qiu, Z.; Qin, S.; Pang, X. The genesis of corundum megacrysts related to alkali basalt in Haina. Acta Sci. Nat. Univ. Sunyatseni 1995, 34, 95–101. [Google Scholar]
  14. Zhang, Z.; He, Y.; Yue, K.; Liu, W. Character of girdle band and its comparision of sapphire from Changle, Shandong Province and Penglai, Hainan Province. Miner. Depos. 2002, 21, 938–940. [Google Scholar]
  15. Yang, Q.; Yang, Y.; Tian, Y.-H. A Study on photoluminescence spectroscopy of sapphire from Penglai, Hainan. Acta Mineral. Sin. 2009, 29, 447–451. [Google Scholar]
  16. Wang, X.; Li, Z.; Li, X.; Li, J.; Liu, Y.; Long, W.; Zhou, J.; Wang, F. Temperature, pressure, and composition of the mantle source region of late cenozoic basalts in Hainan Island, SE Asia: A consequence of a young thermal mantle plume close to subduction zones? J. Petrol. 2012, 53, 177–233. [Google Scholar] [CrossRef]
  17. Huang, X.; Chen, Z.; Zhong, S. Characteristics of volcanic rocks and relationship with the sapphire deposit, Penglai, Hainan. Geol. Miner. Resour. South China 1997, 3, 39–45. [Google Scholar]
  18. Lan, T.; Dong, Y. Petrological and petrochemical characteristics of sapphire-bearing basalts in Penglai mining area, Hainan. J. Guilin Coll. Geol. 1991, 11, 28–37. [Google Scholar]
  19. Graham, I.; Sutherland, L.; Zaw, K.; Nechaev, V.; Khanchuk, A. Advances in our understanding of the gem corundum deposits of the West Pacific continental margins intraplate basaltic fields. Ore Geol. Rev. 2008, 34, 200–215. [Google Scholar] [CrossRef]
  20. Emmett, J.L.; Scarratt, K.; McClure, S.F.; Moses, T.; Douthit, T.R.; Hughes, R.; Novak, S.; Shigley, J.E.; Wang, W.; Bordelon, O. Beryllium diffusion of ruby and sapphire. Gems Gemol. 2003, 39, 84–135. [Google Scholar] [CrossRef] [Green Version]
  21. Zhang, P.-Q.; Ma, Y. Main color-causing factors of sapphires in Shandong Province. Contrib. Geol. Miner. Resour. Res. 2008, 21, 115–119. [Google Scholar]
  22. Mattson, S.M.; Rossman, G.R. Fe2+-Ti4+ charge transfer in stoichiometric Fe2+, Ti4+-minerals. Phys. Chem. Miner. 1988, 16, 78–82. [Google Scholar] [CrossRef]
  23. Moon, A.R.; Phillips, M.R. Defect clustering and color in Fe, Ti: α-Al2O3. J. Am. Ceram. Soc. 1994, 77, 356–367. [Google Scholar] [CrossRef]
  24. Müller, R.; Günthard, H.H. Spectroscopic study of the reduction of nickel and cobalt ions in sapphire. J. Chem. Phys. 1966, 44, 365. [Google Scholar] [CrossRef]
  25. D′lppolito, V.; Andreozzi, G.; Hålenius, U.; Skogby, H.; Hametner, K.; Günther, D. Color mechanisms in spinel: Cobalt and iron interplay for the blue color. Phys. Chem. Miner. 2015, 42, 431–439. [Google Scholar] [CrossRef]
  26. Emmett, J.L.; Douthit, T.R. Heat treating the sapphires of Rock Creek, Montana. Gems Gemol. 1993, 29, 250–272. [Google Scholar] [CrossRef]
  27. Palke, A.C.; Breeding, C.M. The origin of needle-like rutile inclusions in natural gem corundum: A combined EPMA, LA-ICP-MS, and nanoSIMS investigation. Am. Miner. 2017, 102, 1451–1461. [Google Scholar] [CrossRef]
  28. Sudarat, S.; Supharart, S.; Wim, V.; Ungkhana, A.; Victoria, L.; Raynaud, F.; Charuwan, K.; Vararut, W. A study of sapphire from Chanthaburi, Thailand and its gemological characteristics. Gems Gemol. 2017, 53, 1–42. [Google Scholar]
  29. Sudarat, S.; Supharart, S.; Wim, V.; Ungkhana, A. An in-depth gemological study of blue sapphires from Pailin, Cambodia. Gems Gemol. 2017, 53, 1–45. [Google Scholar]
  30. Lucas, A.; Hsu, T. Tourmaline and sapphire from Nigeria. Gems Gemol. 2017, 53, 134–135. [Google Scholar]
  31. Phlayrahan, A.; Monarumit, N.; Satitkune, S.; Wathanakul, P. Role of ti content on the occurrence of the 3309-cm-1 peak in FTIR absorption spectra of ruby samples. J. Appl. Spectrosc. 2018, 85, 385–390. [Google Scholar] [CrossRef]
  32. Hughes, E.B.; Perkins, R. Madagascar sapphire: Low-temperature heat treatment experiments. Gems Gemol. 2019, 55, 184–197. [Google Scholar] [CrossRef] [Green Version]
  33. Phlayrahan, A.; Monarumit, N.; Lhuaamporn, T.; Satitkune, S.; Wathanakul, P. Spectroscopic investigation of properties of blue sapphire samples depending on heating conditions. J. Appl. Spectrosc. 2019, 86, 810–816. [Google Scholar] [CrossRef]
  34. Sutherland, F.L.; Zaw, K.; Meffre, S.; Giuliani, G.; Fallick, A.E.; Graham, I.T.; Webb, G.B. Gem-corundum megacrysts from east Australian basalt fields: Trace elements, oxygen isotopes and origins. Aust. J. Earth Sci. 2009, 56, 1003–1022. [Google Scholar] [CrossRef]
  35. Wang, Y.; Qiu, K.; Müller, A.; Hou, Z.; Zhu, Z.; Yu, H. Machine learning prediction of quartz forming-environments. J. Geophys. Res. Solid Earth 2021, 126, e21925. [Google Scholar] [CrossRef]
  36. Wu, M.; Samson, I.M.; Qiu, K.; Zhang, D. Concentration mechanisms of rare earth element-Nb-Zr-Be mineralization in the Baerzhe deposit, Northeast China: Insights from textural and chemical features of amphibole and rare metal minerals. Econ. Geol. 2021, 116, 651–679. [Google Scholar] [CrossRef]
  37. Guo, J.; Wang, F.; Yakoumelos, G. Sapphires from Changle in Shandong province, China. Gems Gemol. 1992, 28, 255–260. [Google Scholar] [CrossRef]
  38. Peucat, J.J.; Ruffault, P.; Fritsch, E.; Bouhnik-Le Coz, M.; Simonet, C.; Lasnier, B. Ga/Mg ratio as a new geochemical tool to differentiate magmatic from metamorphic blue sapphires. Lithos 2007, 98, 261–274. [Google Scholar] [CrossRef]
  39. Sutherland, F.L.; Zaw, K.C.; Meffre, S.C.; Yui, T.-F.D.; Thu, K.E. Advances in trace element “fingerprinting” of gem corundum, ruby and sapphire, Mogok area, Myanmar. Minerals 2014, 5, 61–79. [Google Scholar] [CrossRef] [Green Version]
  40. Uher, P.; Giuliani, G.; Szakall, S.; Fallick, A.E.; Strunga, V.; Vaculovic, T.; Ozdin, D.; Greganova, M. Sapphires related to alkali basalts from the Cerová Highlands, Western Carpathians (southern Slovakia): Composition and origin. Geol. Carpathica 2012, 63, 71–82. [Google Scholar] [CrossRef]
  41. Peter Möller, P.; Saupé, F. Lanthanides, Tantalum, and Niobium: Mineralogy, Geochemistry, Characteristics of Primary Ore Deposits, Prospecting, Processing, and Applications: Proceedings of a Workshop in Berlin, November 1986; Springer: Berlin/Heidelberg, Germany, 1989; p. 380. [Google Scholar]
  42. Aspen, P.; Upton, B.G.J.; Dickin, A.P. Anorthoclase, sanidine and associated megacrysts in Scottish alkali basalts; High-pressure syenitic debris from upper mantle sources. Eur. J. Mineral. 1990, 2, 503–517. [Google Scholar] [CrossRef]
  43. Yu, X.; Niu, X.; Zhao, L. Characterization and origin of zonal sapphire from Shandong Province, China. J. Met. 2015, 67, 391–397. [Google Scholar] [CrossRef]
  44. Palke, A.C.; Saeseaw, S.; Renfro, N.D.; Sun, Z.; McClure, S.F. Geographic origin determination of ruby. Gems Gemol. 2019, 55, 536–579. [Google Scholar] [CrossRef]
Figure 2. Six raw sapphire samples from the Penglai alluvial deposit: (a) Sap-1; (b) Sap-2; (c) Sap-3; (d) Sap-4; (e) Sap-5; (f) Sap-6.
Minerals 12 00832 g002
Figure 3. The cut and polished sapphire samples from the Penglai alluvial deposit: (a) Sap-1; (b) Sap-2; (c) Sap-3; (d) Sap-4; (e) Sap-5; (f) Sap-6.
Minerals 12 00832 g003
Figure 4. Photomicrographs of cross-section along the vertical c-axis of sample Sap-1, showing plots performed by LA–ICP–MS from core to rim over two profiles (AB, CD), and six FTIR-analyzed plots over profile EF.
Minerals 12 00832 g004
Figure 5. (a,b) Photographs of the Penglai sapphire (sample Sap-1) showing blue core rimmed by yellowish-brown growth bands in transmitted light. Numerous micro-inclusions are distributed across the growth bands in rim. Zir—zircon inclusion.
Minerals 12 00832 g005
Figure 6. Ultraviolet and visible absorption spectra of the dark-blue core and yellowish-brown rim from Penglai sapphire (sample Sap-1).
Minerals 12 00832 g006
Figure 7. The FTIR patterns of the deep-blue core and yellowish-brown rim from the Penglai sapphire (sample Sap-1). The plot locations over profile EF are shown in Figure 4.
Minerals 12 00832 g007
Figure 8. Compositional variations in trace elements of the Penglai sapphire over two profiles shown in Figure 4 from core to rim: (a) Distribution pattern of trace element contents of Ti, V, Cr, Ga and Fe/Ti ratio from core to rim; (b) Distribution pattern of Fe content from core to rim.
Minerals 12 00832 g008
Figure 9. Plots of (a) Ga-Fe and (b) Ti-Fe for Penglai sapphires.
Minerals 12 00832 g009
Figure 10. Variation content diagrams of trace element for identifying sapphire origin by data from the Penglai sapphire in Hainan, China: (a) Fe–Mg(× 100)–Ti(× 10) ternary plot [38]; (b) Fe–Ga/Mg chemical composition plot [39]; (c) Cr(× 10)–Fe–Ga(× 100) ternary plot [34,39]; (d) Cr/Ga versus Fe/Ti plot [34].
Minerals 12 00832 g010
Figure 11. Ga/Mg versus Fe diagram of the magmatic blue sapphires worldwide cited from [38]: (a) main Asian field of magmatic blue sapphires hosted in alkaline basalt; (b) main African field of magmatic blue sapphires in alkaline basalt.
Minerals 12 00832 g011
Table 1. The main trace element contents (ppm) of sample Sap-1 analyzed via LA–ICP–MS over two profiles (AB and CD) from core to rim.
SampleDIRColorSpotFeGaTiCrMgVFe/TiGa/MgFe/MgCr/Ga
Sap-1A

B
Deep blue core18068.86420.1694.3818.4115.203.1885.4927.64530.890.04
27518.39398.2187.2613.2715.752.0286.1625.29477.440.03
37229.51376.26100.5910.8727.732.3071.8713.57260.700.03
46695.00376.23108.7714.5218.282.7361.5520.58366.250.04
56537.82368.64101.8813.4310.862.1664.1733.95602.020.04
66989.96374.2494.4311.722.382.4374.02157.242936.960.03
Yellowish-brown rim74969.15258.19448.5713.815.191.4011.0849.75957.500.05
85148.08261.72392.9120.320.830.1813.10315.216200.290.08
95245.51280.18610.0619.1715.700.978.6017.84334.080.07
105064.39285.03560.8919.389.640.919.0329.56525.140.07
115234.76257.98496.449.340.130.6810.542013.5640857.760.04
125283.87256.99512.2121.9312.062.0810.3221.31438.080.09
135027.11265.94432.0816.8311.491.0511.6323.14437.420.06
144472.11274.31489.7111.484.571.339.1360.01978.300.04
154224.53240.60295.8311.427.860.8614.2830.62537.610.05
164168.04236.78258.414.9318.821.6616.1312.58221.430.02
173996.28252.99228.928.278.161.3317.4630.99489.470.03
183746.31226.14279.663.721.061.3813.40214.083546.540.02
193856.99235.29335.195.368.471.7011.5127.77455.270.02
203191.89190.49250.908.342.501.6412.7276.071274.640.04
213226.51190.51216.049.643.041.2614.9462.711062.100.05
222906.85186.4497.9510.643.390.9429.6854.99857.290.06
C

D
Deep blue core16759.82377.67104.696.4513.292.3864.5728.42508.640.02
27841.34370.3095.6410.5727.021.4981.9913.70290.210.03
37868.48384.0394.5011.9114.383.2783.2626.71547.180.03
48697.46410.72105.9414.0423.132.8182.1017.76376.030.03
55091.60285.47272.5116.898.771.438.6832.55580.570.06
66111.20351.52269.7721.9612.651.7422.6527.79483.100.06
Yellowish-brown rim75488.46399.60296.2313.476.732.1818.5359.34815.090.03
85195.35318.03292.739.884.791.4917.7566.421084.980.03
94366.93263.47236.198.352.321.8218.49113.541881.920.03
104275.72295.43173.3714.730.681.8524.66433.116268.300.05
114436.24253.52271.677.105.460.9616.3346.47813.080.03
123745.72231.91232.436.811.711.2516.12135.382186.620.03
133412.76215.86293.1911.669.590.9711.6422.50355.720.05
Table 2. Comparison of UV–Vis spectra (nm) of the Penglai sapphire with other basaltic sapphires.
Color MechanismElementsSap-1
(Deep-Blue Core)
Sap-1
(Yellowish-Brown Rim)
ThailandCambodiaNigeria
Crystal field theoryFe3+--388388388
Fe3+-Fe3+380, 453376, 448377, 450, 535330, 377, 450377, 450
Electronic transferFe2+-Ti4+576-580580500-600
Cr3+658658---
Fe2+-Fe3+--840–880866900
References This studyThis study[28][29][30]
Table 3. Trace element contents of the Penglai sapphire in Hainan, China, and other basaltic sapphires worldwide (average value in ppm); b.d.l. = below detection limit.
DepositsFeMgGaTiVCrGa/MgTi/MgFe/MgFe/Ti
avg±1σavg±1σavg±1σavg±1σavg±1σavg±1σavg
Pailin (Cambodia) [38] 2311258551431220515882b.d.l. 524247411
Houai Sai (N Laos) [38]3720160864191738910821b.d.l. 481561842
Sam SaiBlue11,0988825218981726261b.d.l. 4238246365
(S Laos) [38]Blue green87112634118491062550.3b.d.l. 4526212682
Chantaburi (Thailand) [38]612529781820186292791901161651261634522
Bo Phloi (Thailand) [38]21876601512139281266466b.d.l. 15814517
Jos Plateau (Nigeria) [38]8661724941733217686199b.d.l. 181991849
Analafady (N Madagascar) [38]719292385174201549142b.d.l. 221990247
Lake Turkana (Kenya) [38] 850414801081403413417263b.d.l. 261487863
Hainan-Fudjian-Shandong (China) [38]83996909427536956521b.d.l 311193688
Shandong Changle (China) [43]16,335.3237581.943.3272.719.944126016.93.893.254.24.16.2250.850.1
This paper6087185221293065327038021115142128523
Publisher’s Note: MDPI stays neutral with regard to jurisdictional claims in published maps and institutional affiliations.

