
Ore Genesis of the Changkeng–Fuwan Au-Ag Deposit in Central Guangdong, South China: Evidence from Fluid Inclusions and C-H-O-S-Pb-He-Ar Isotopes

 ,
,
Abstract
:1. Introduction
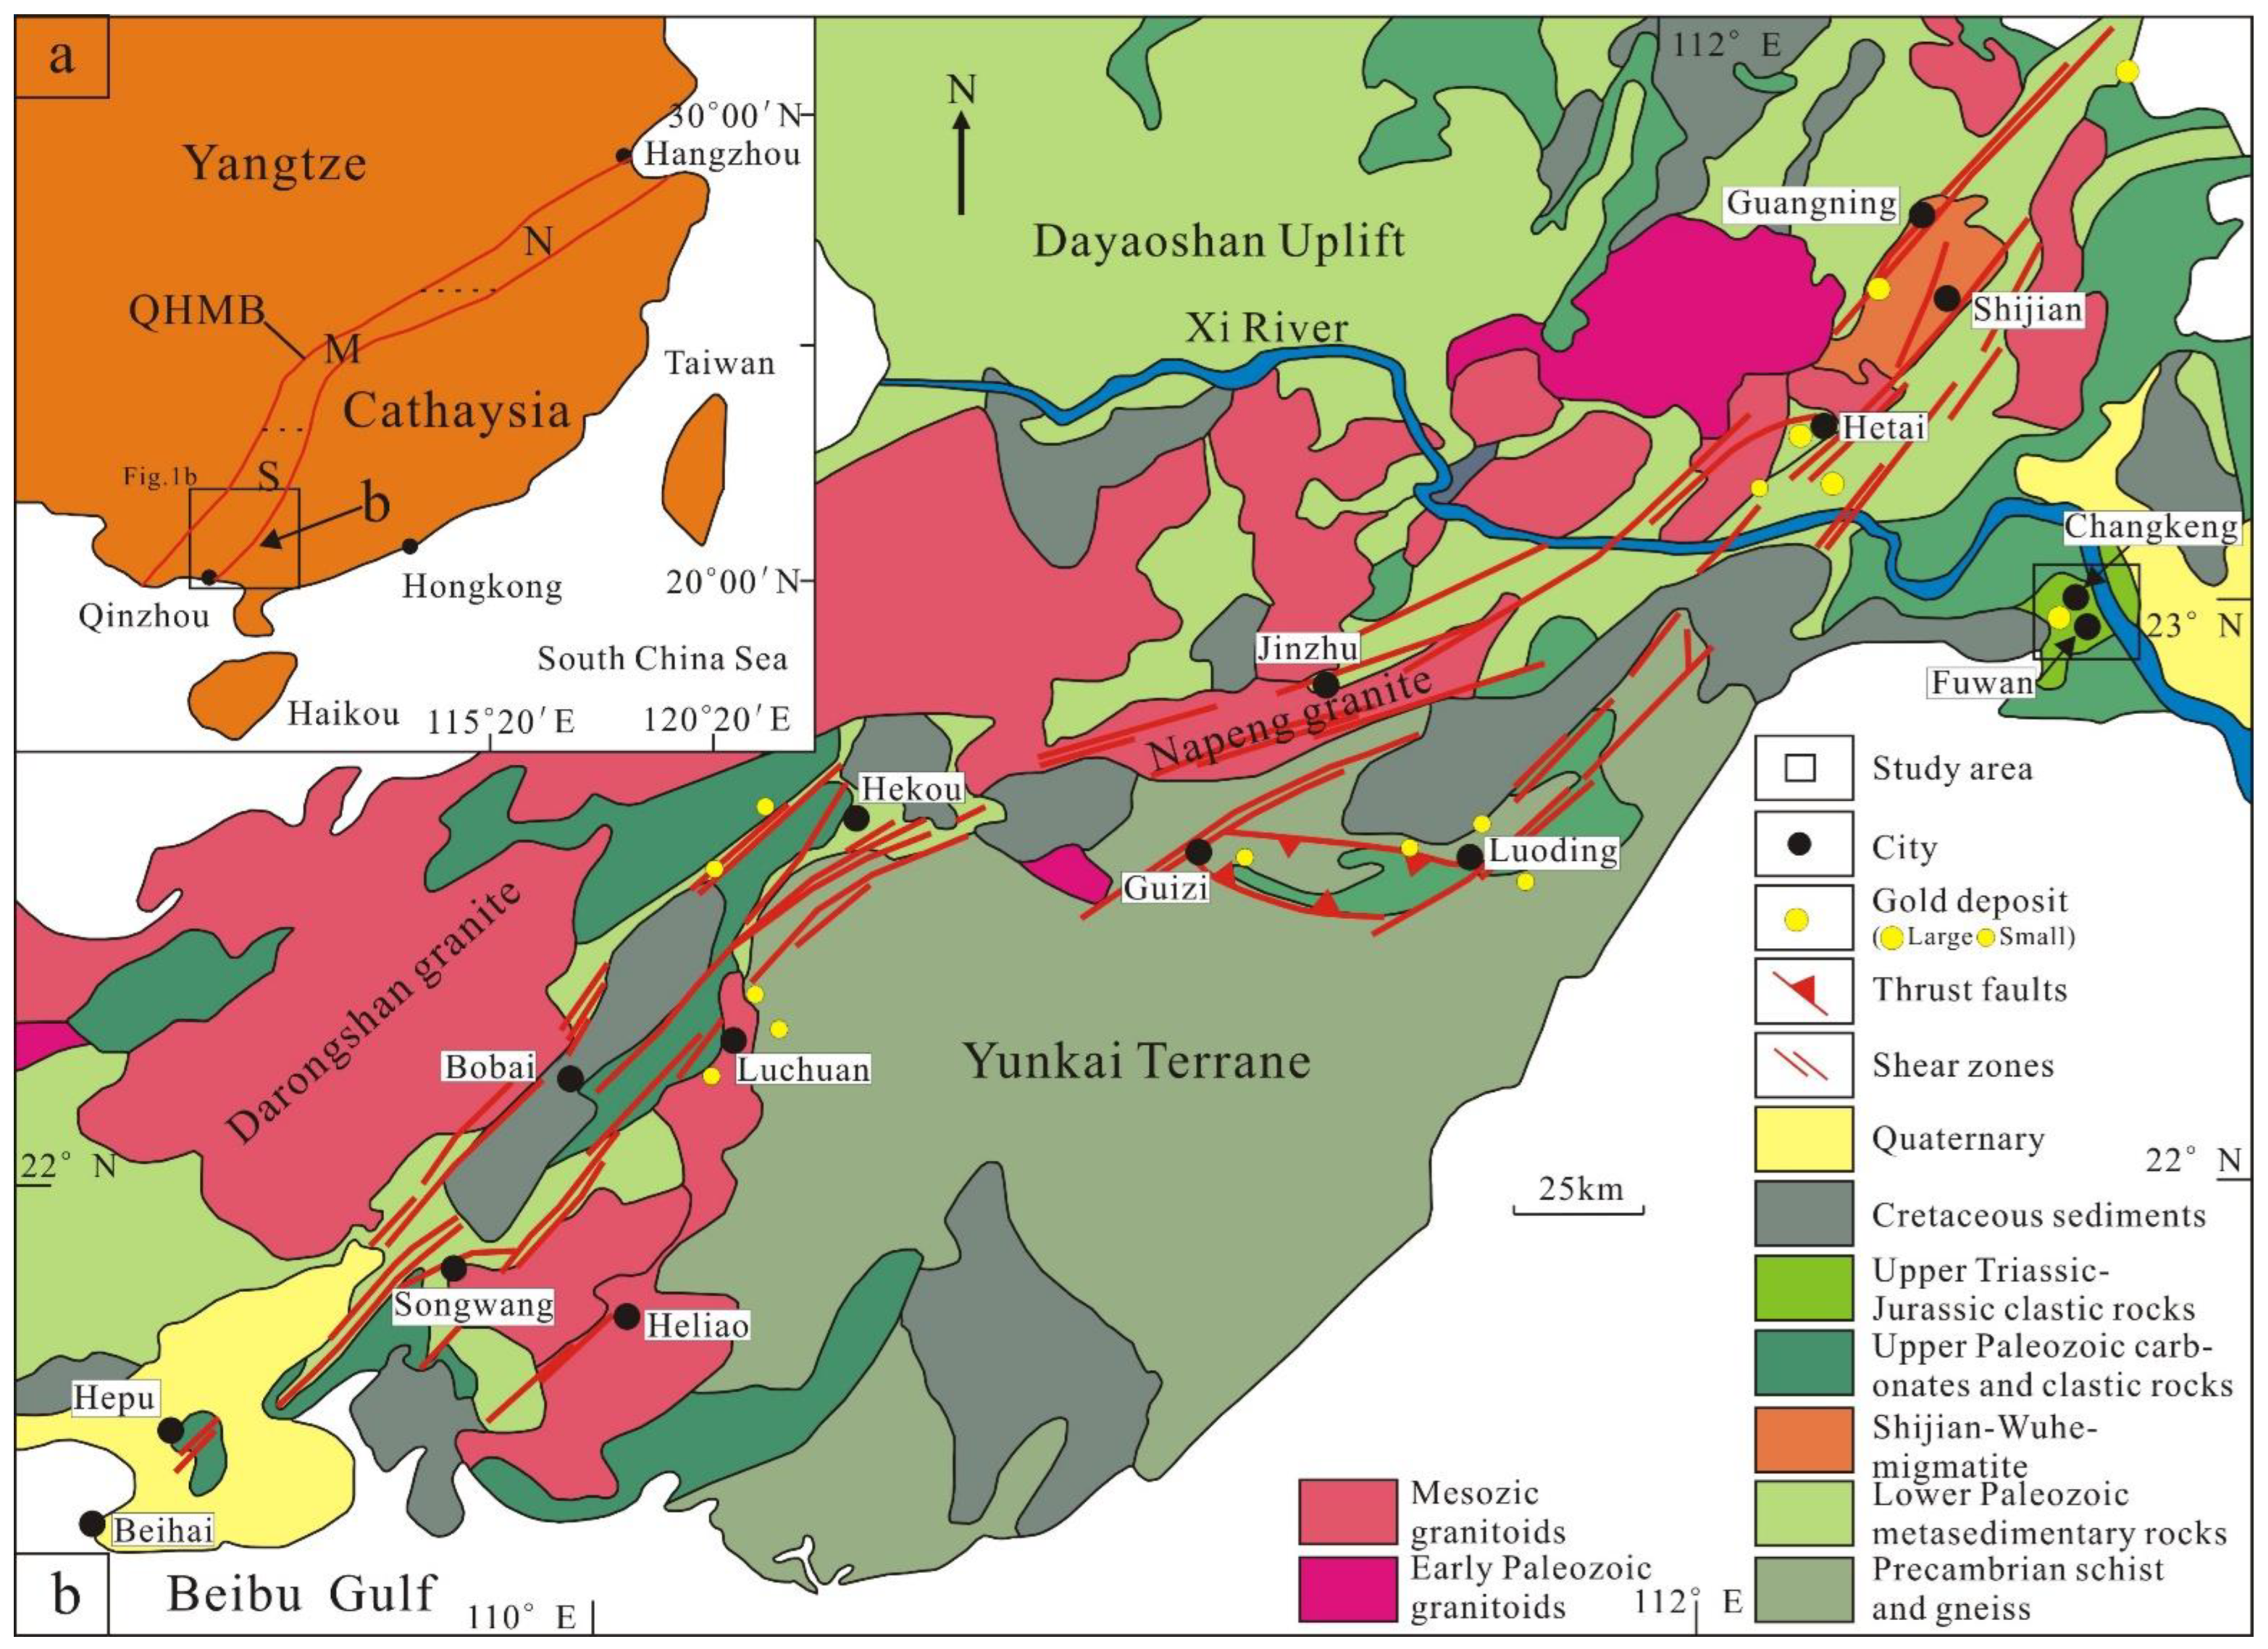
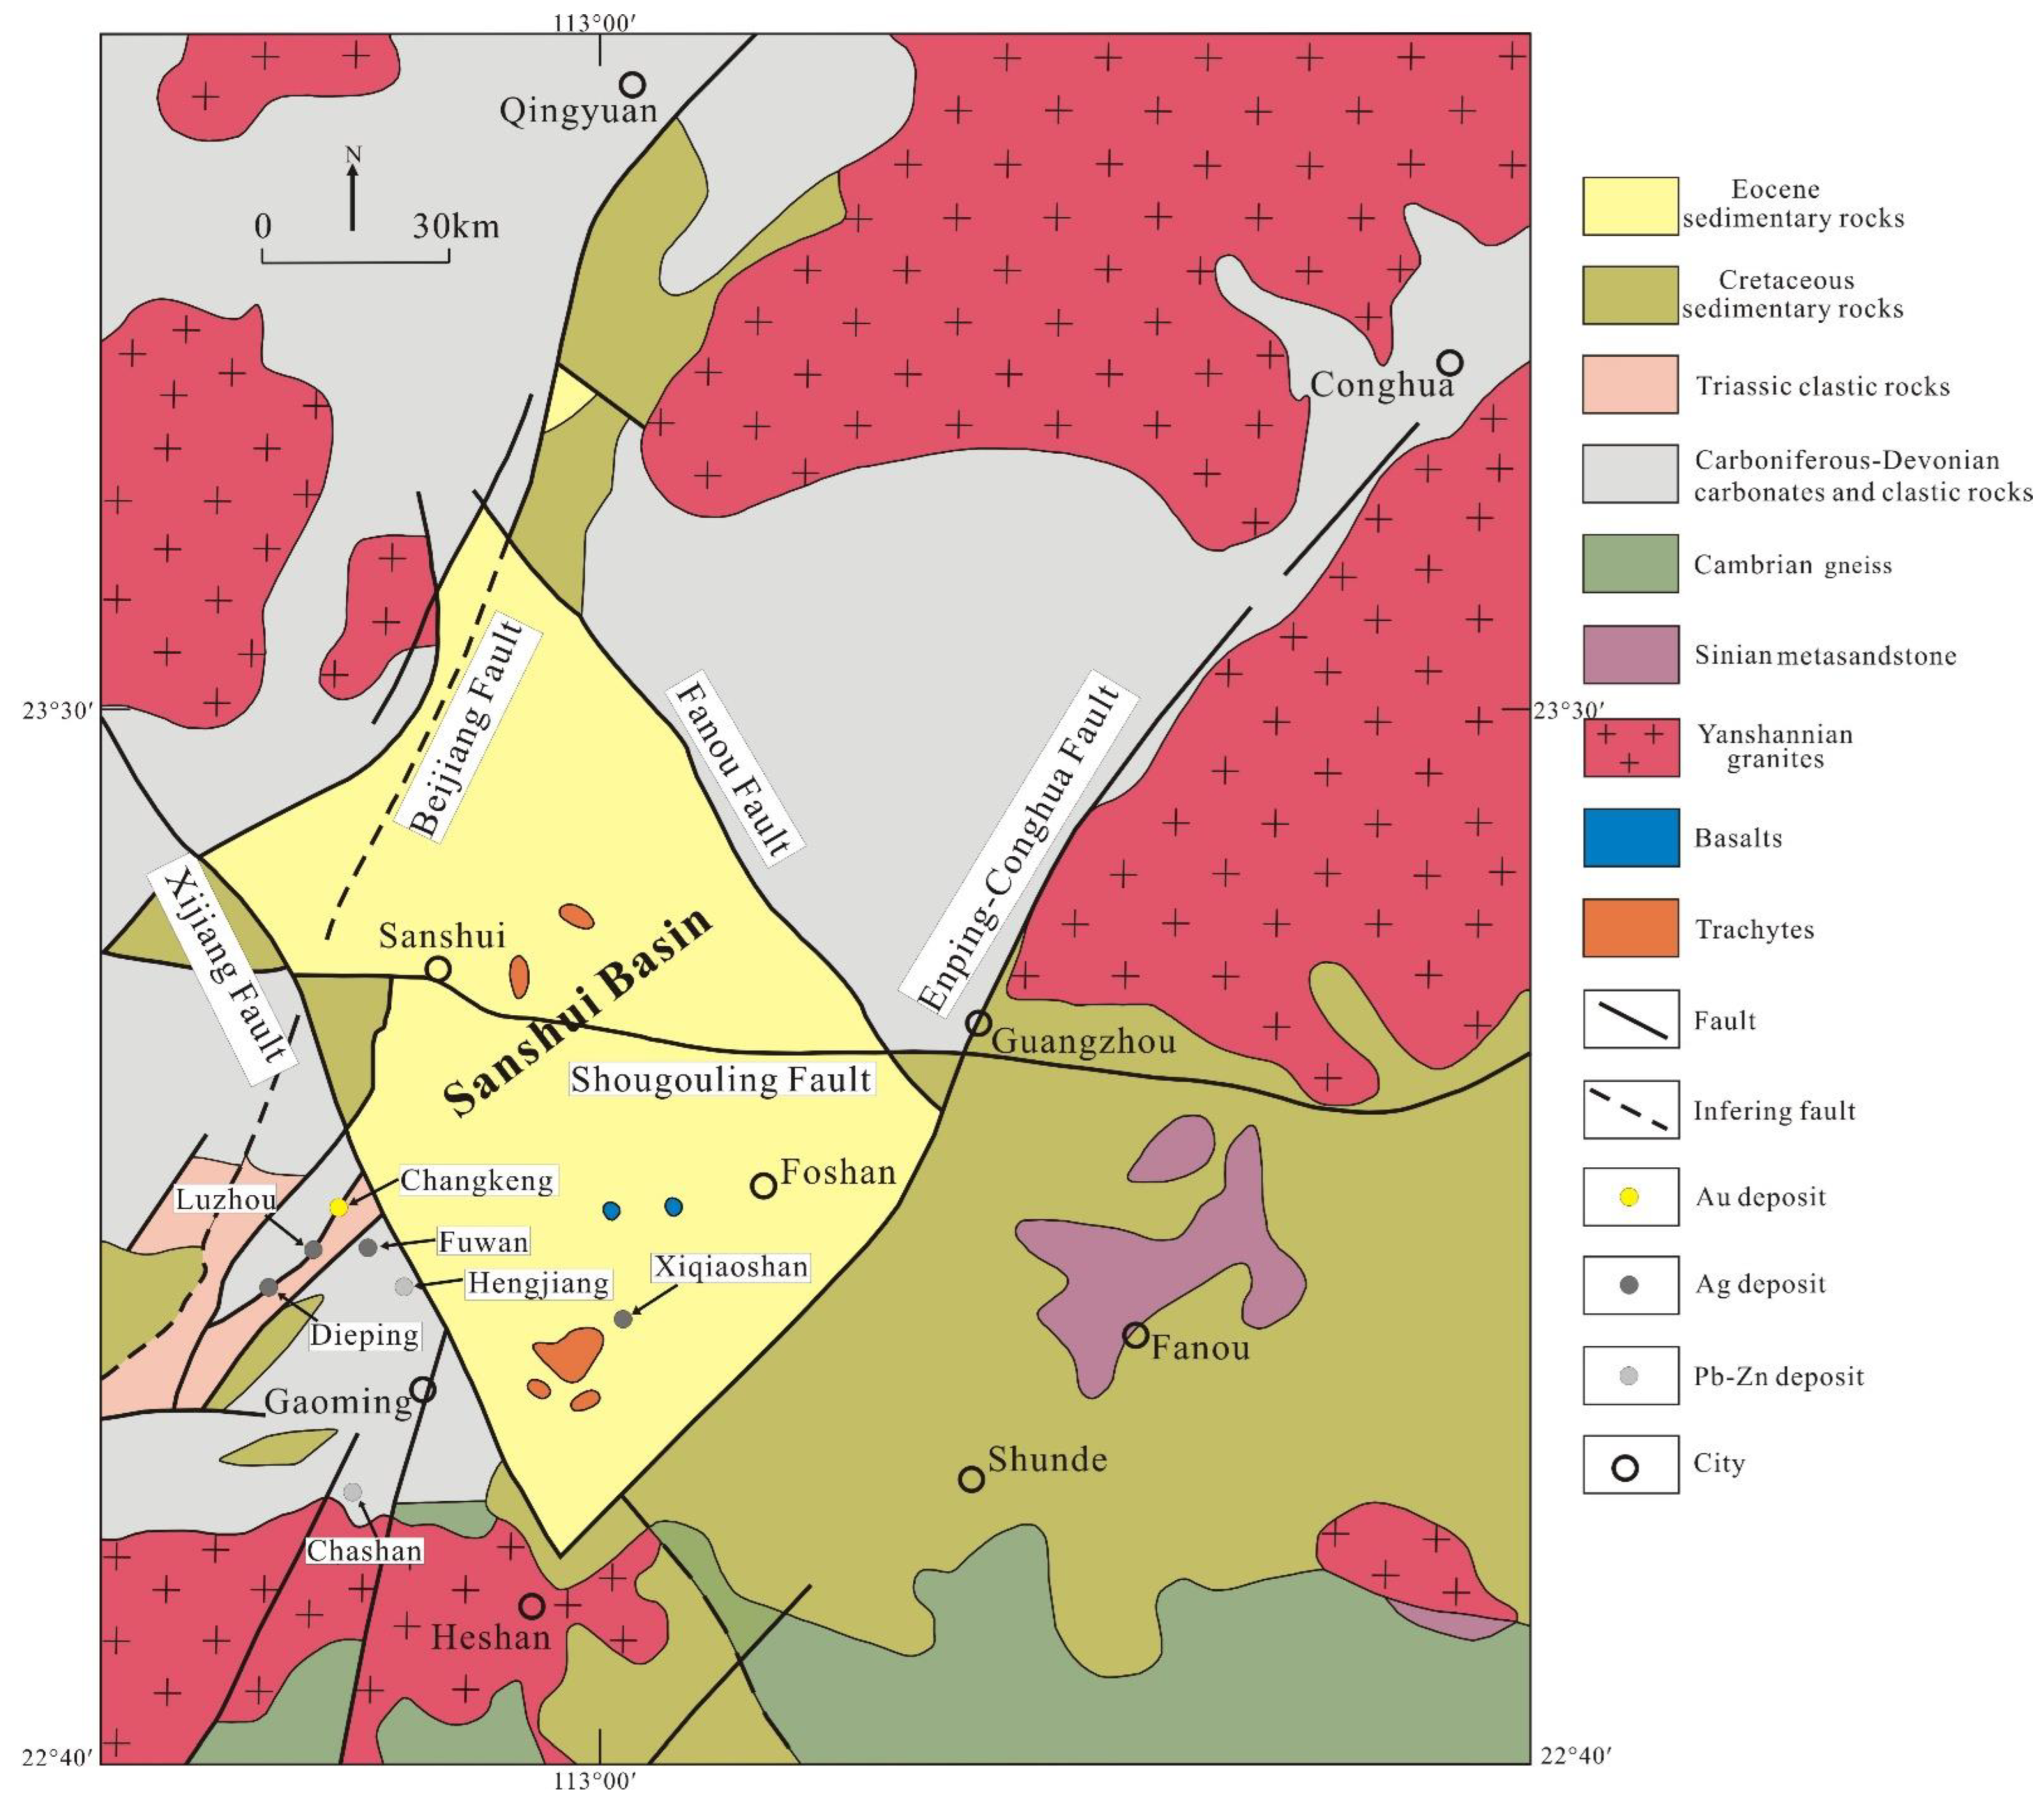
2. Regional Geology
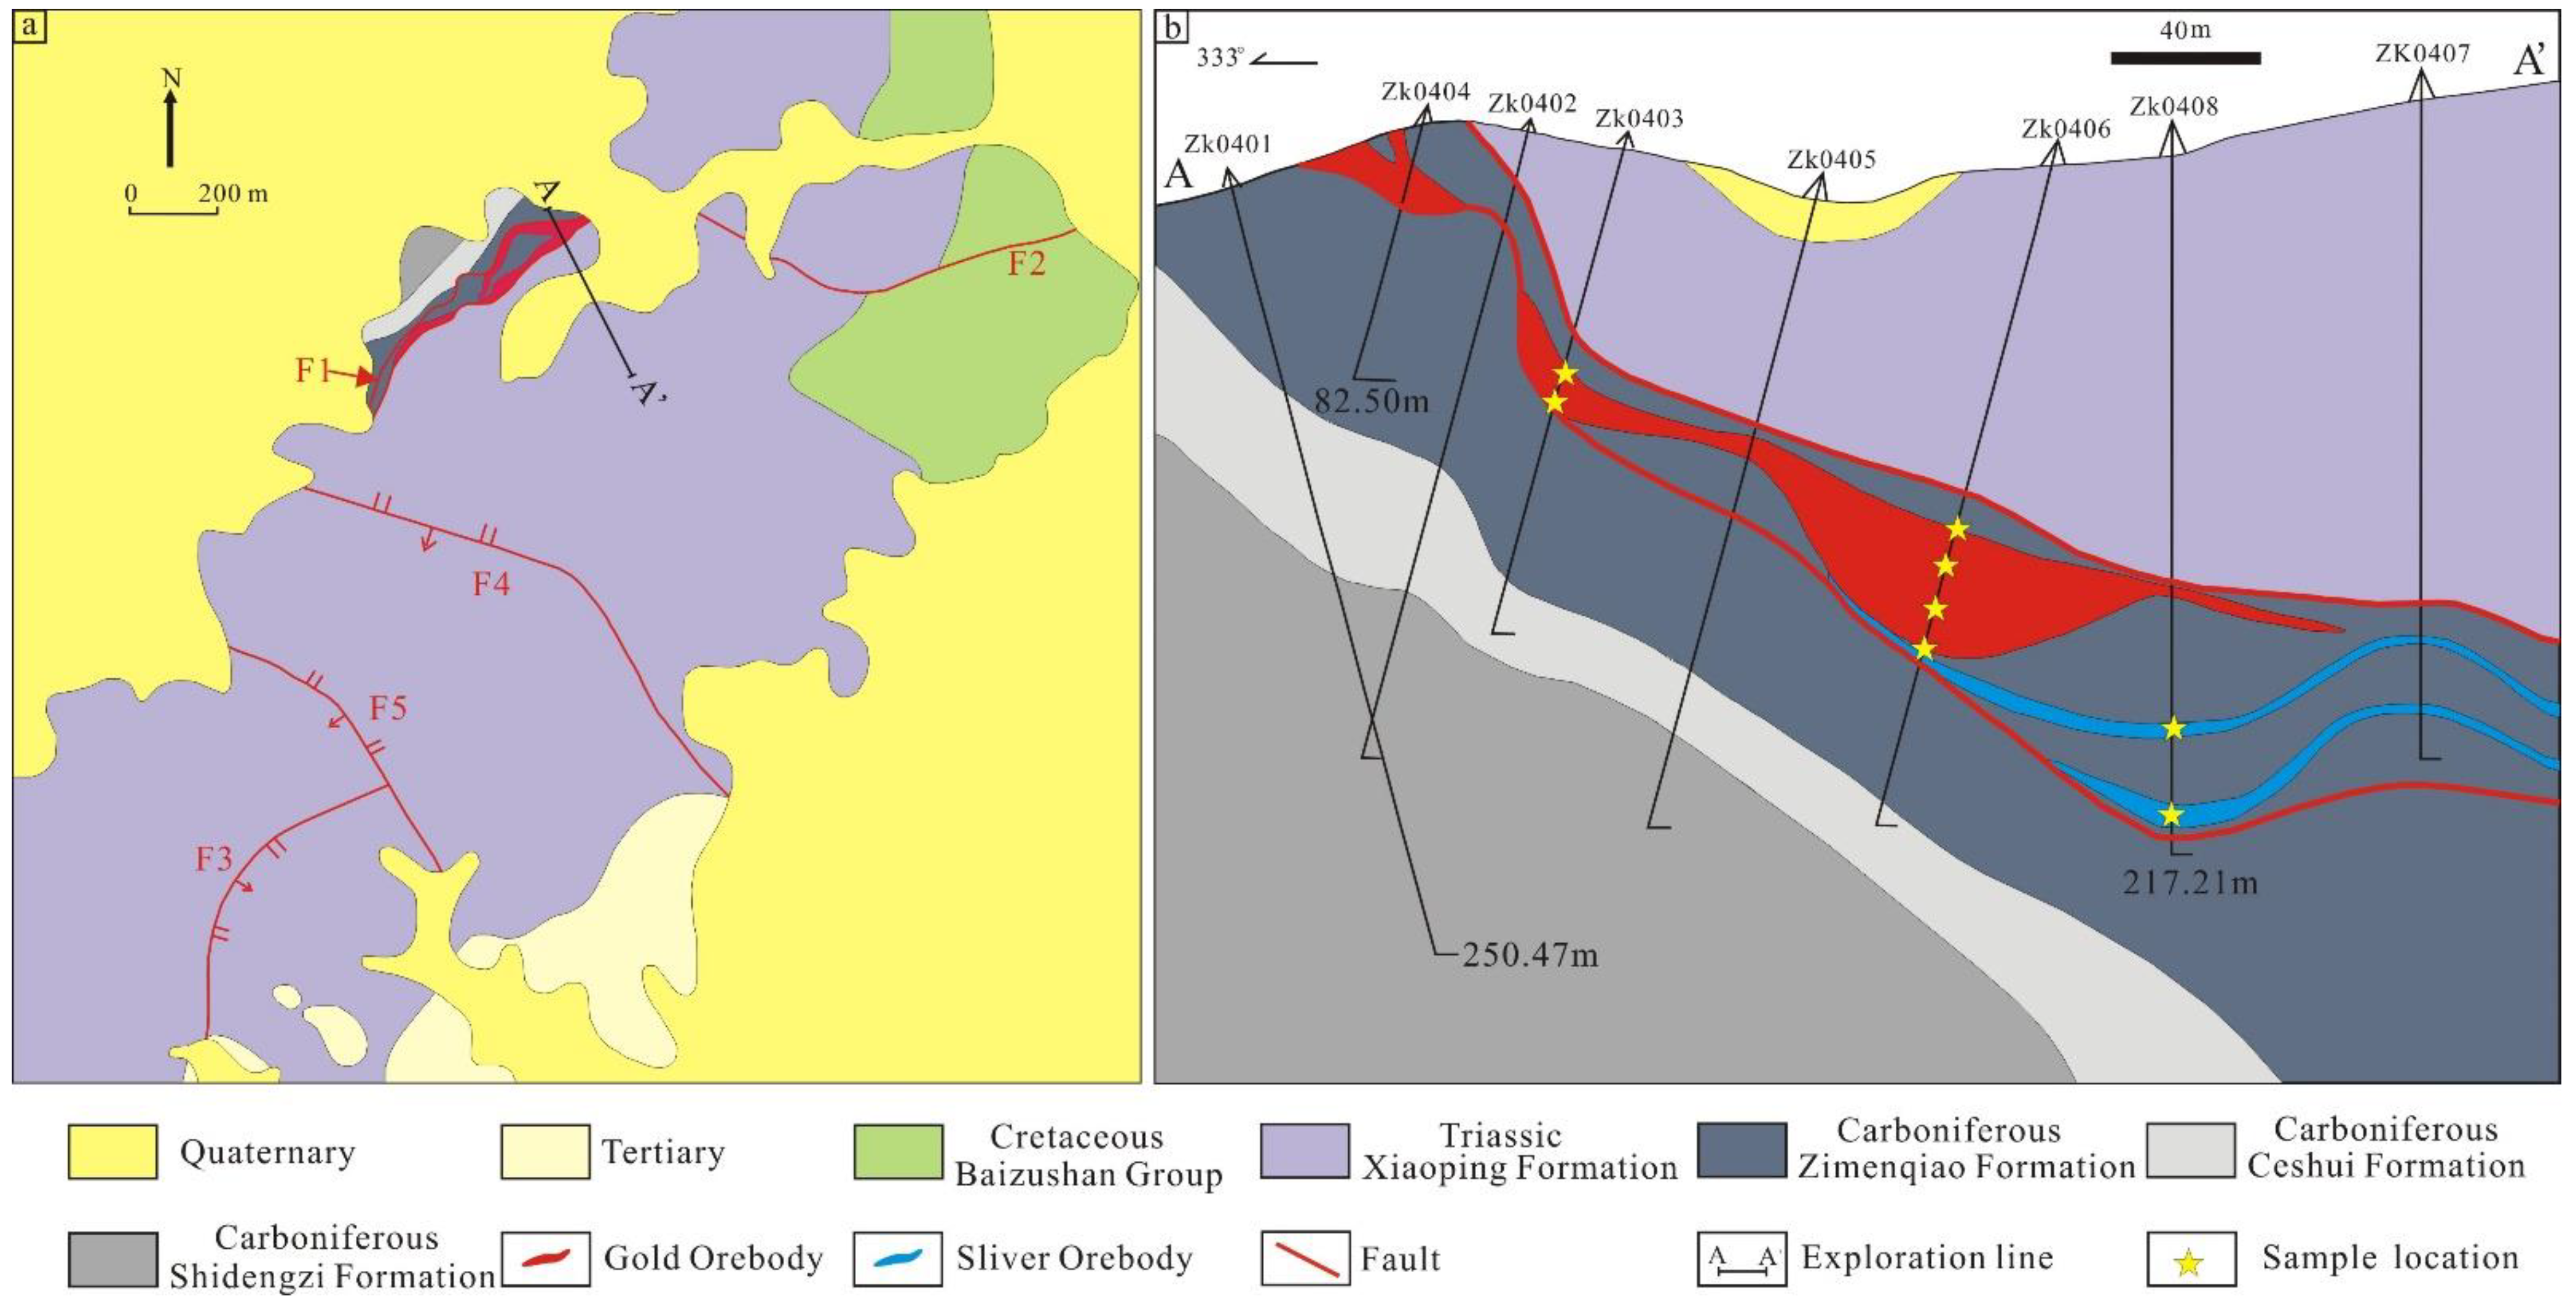
3. Deposit Geology
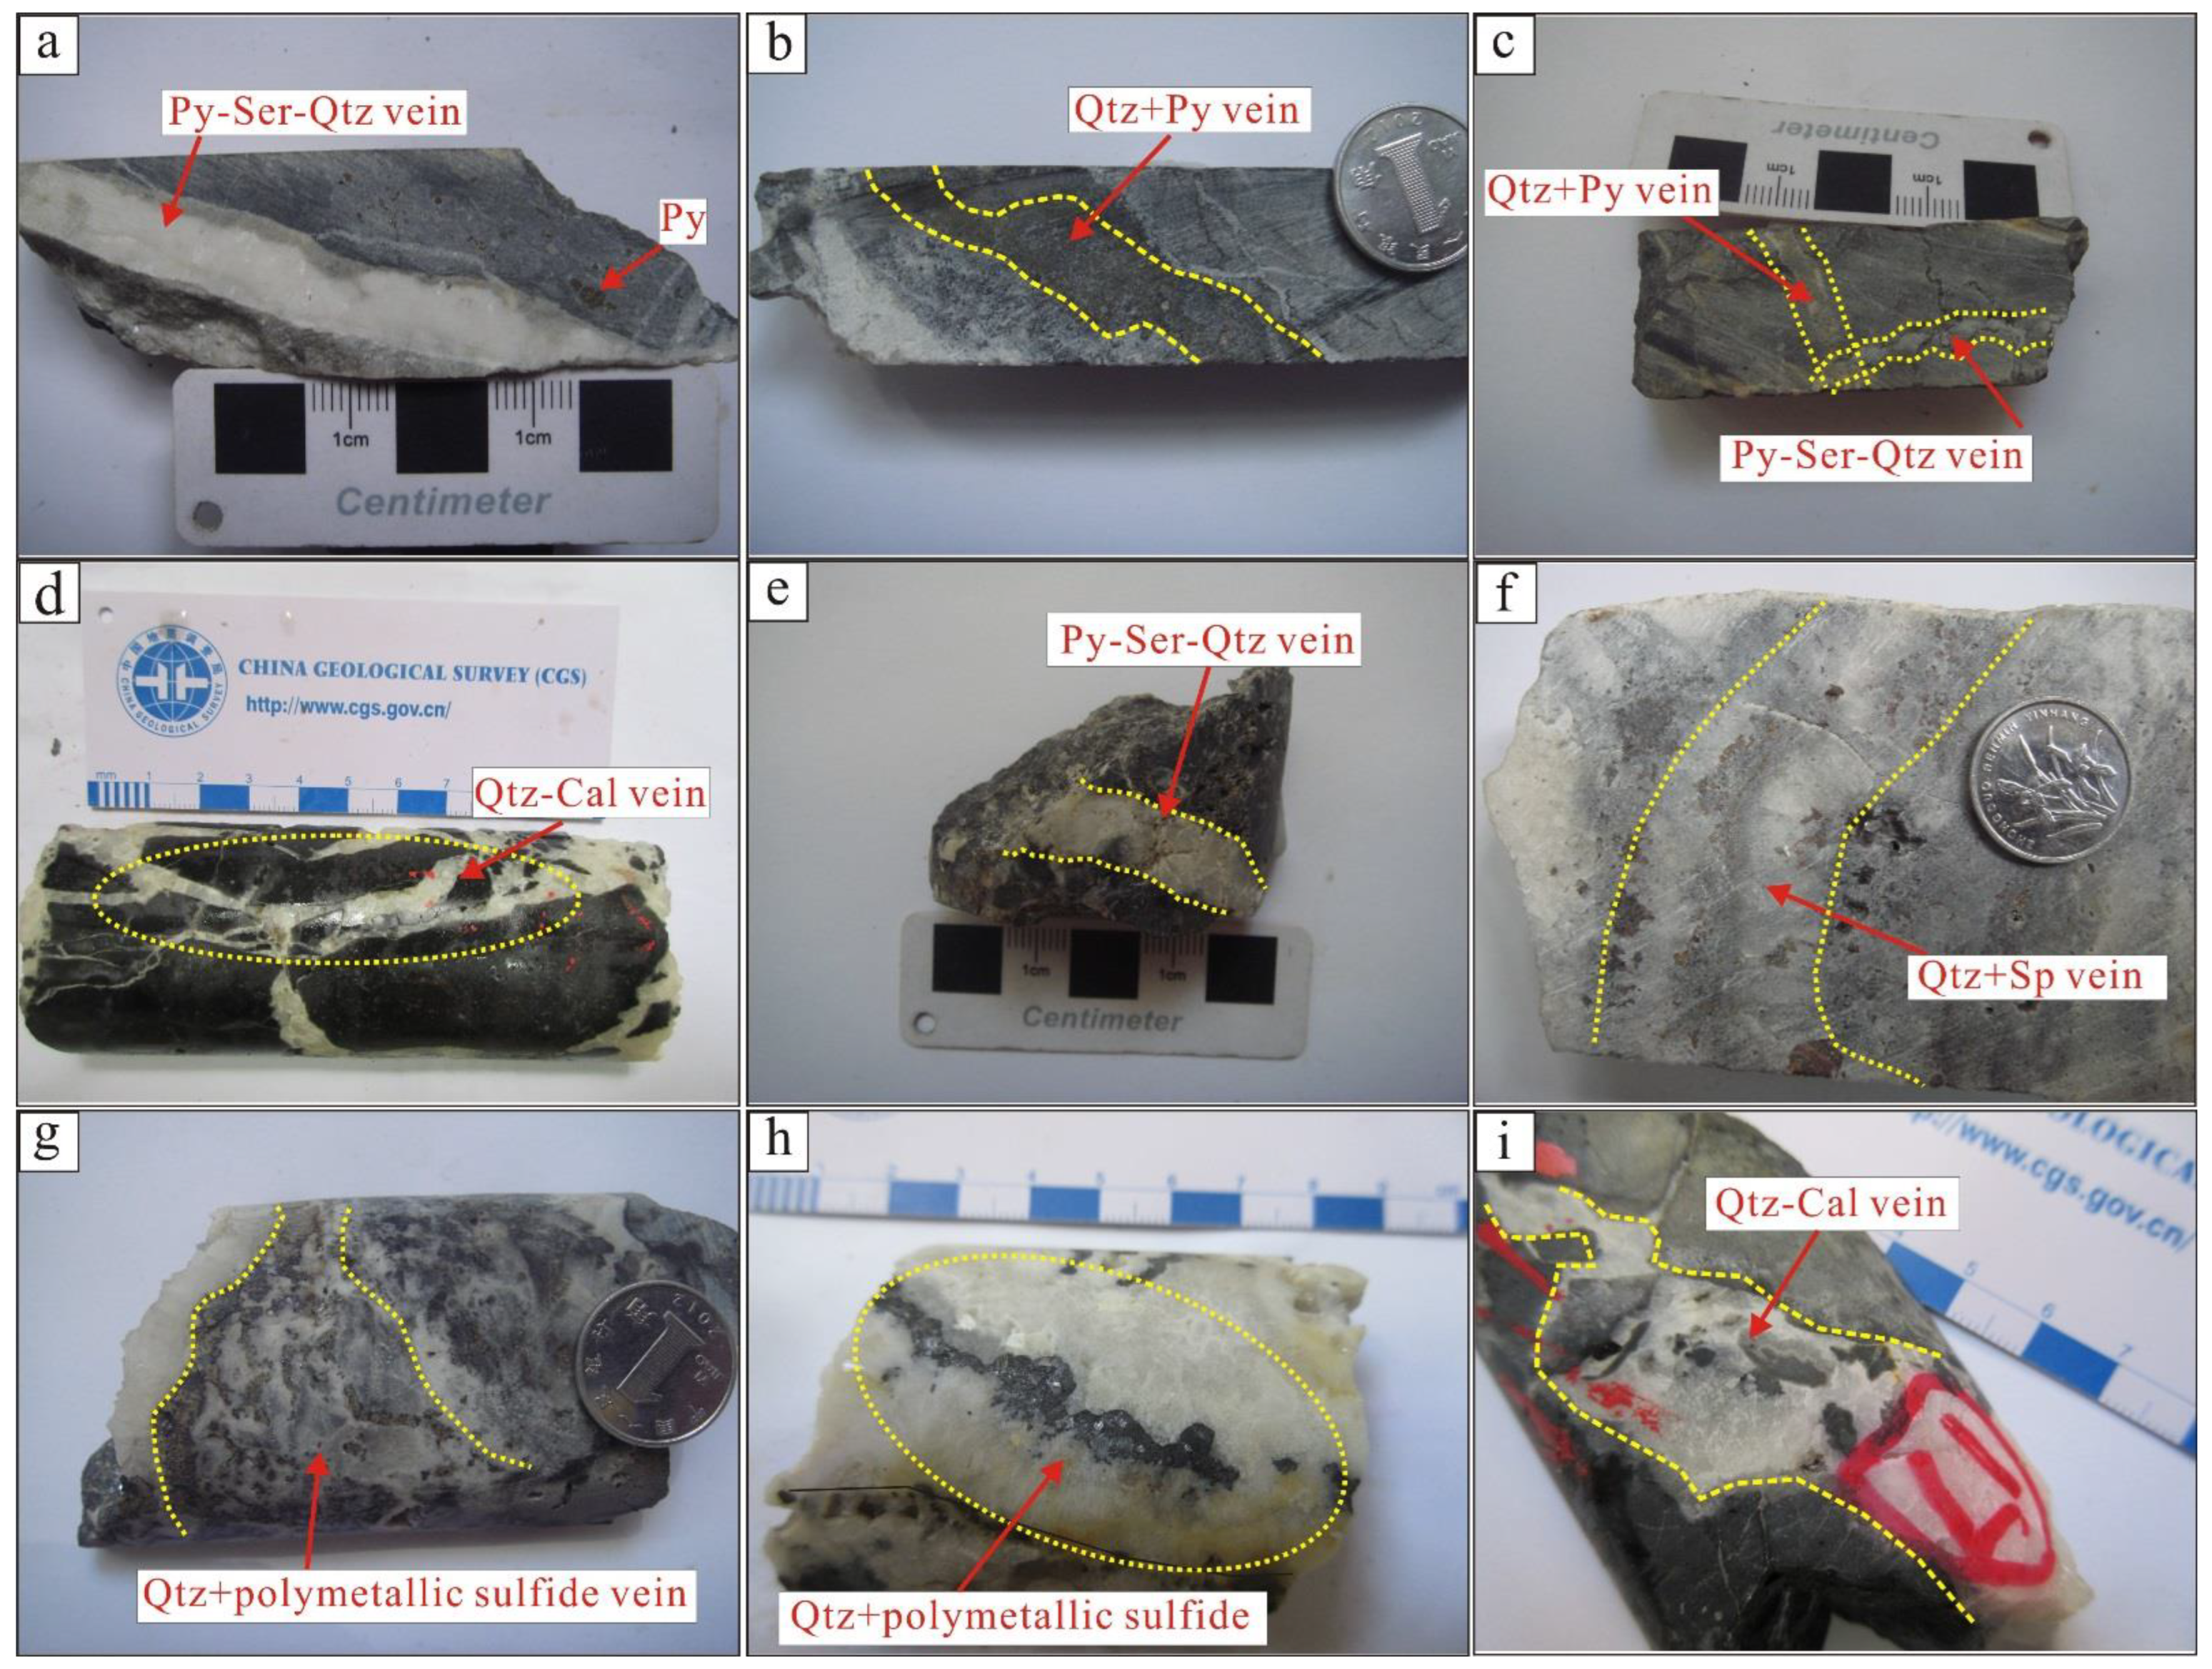
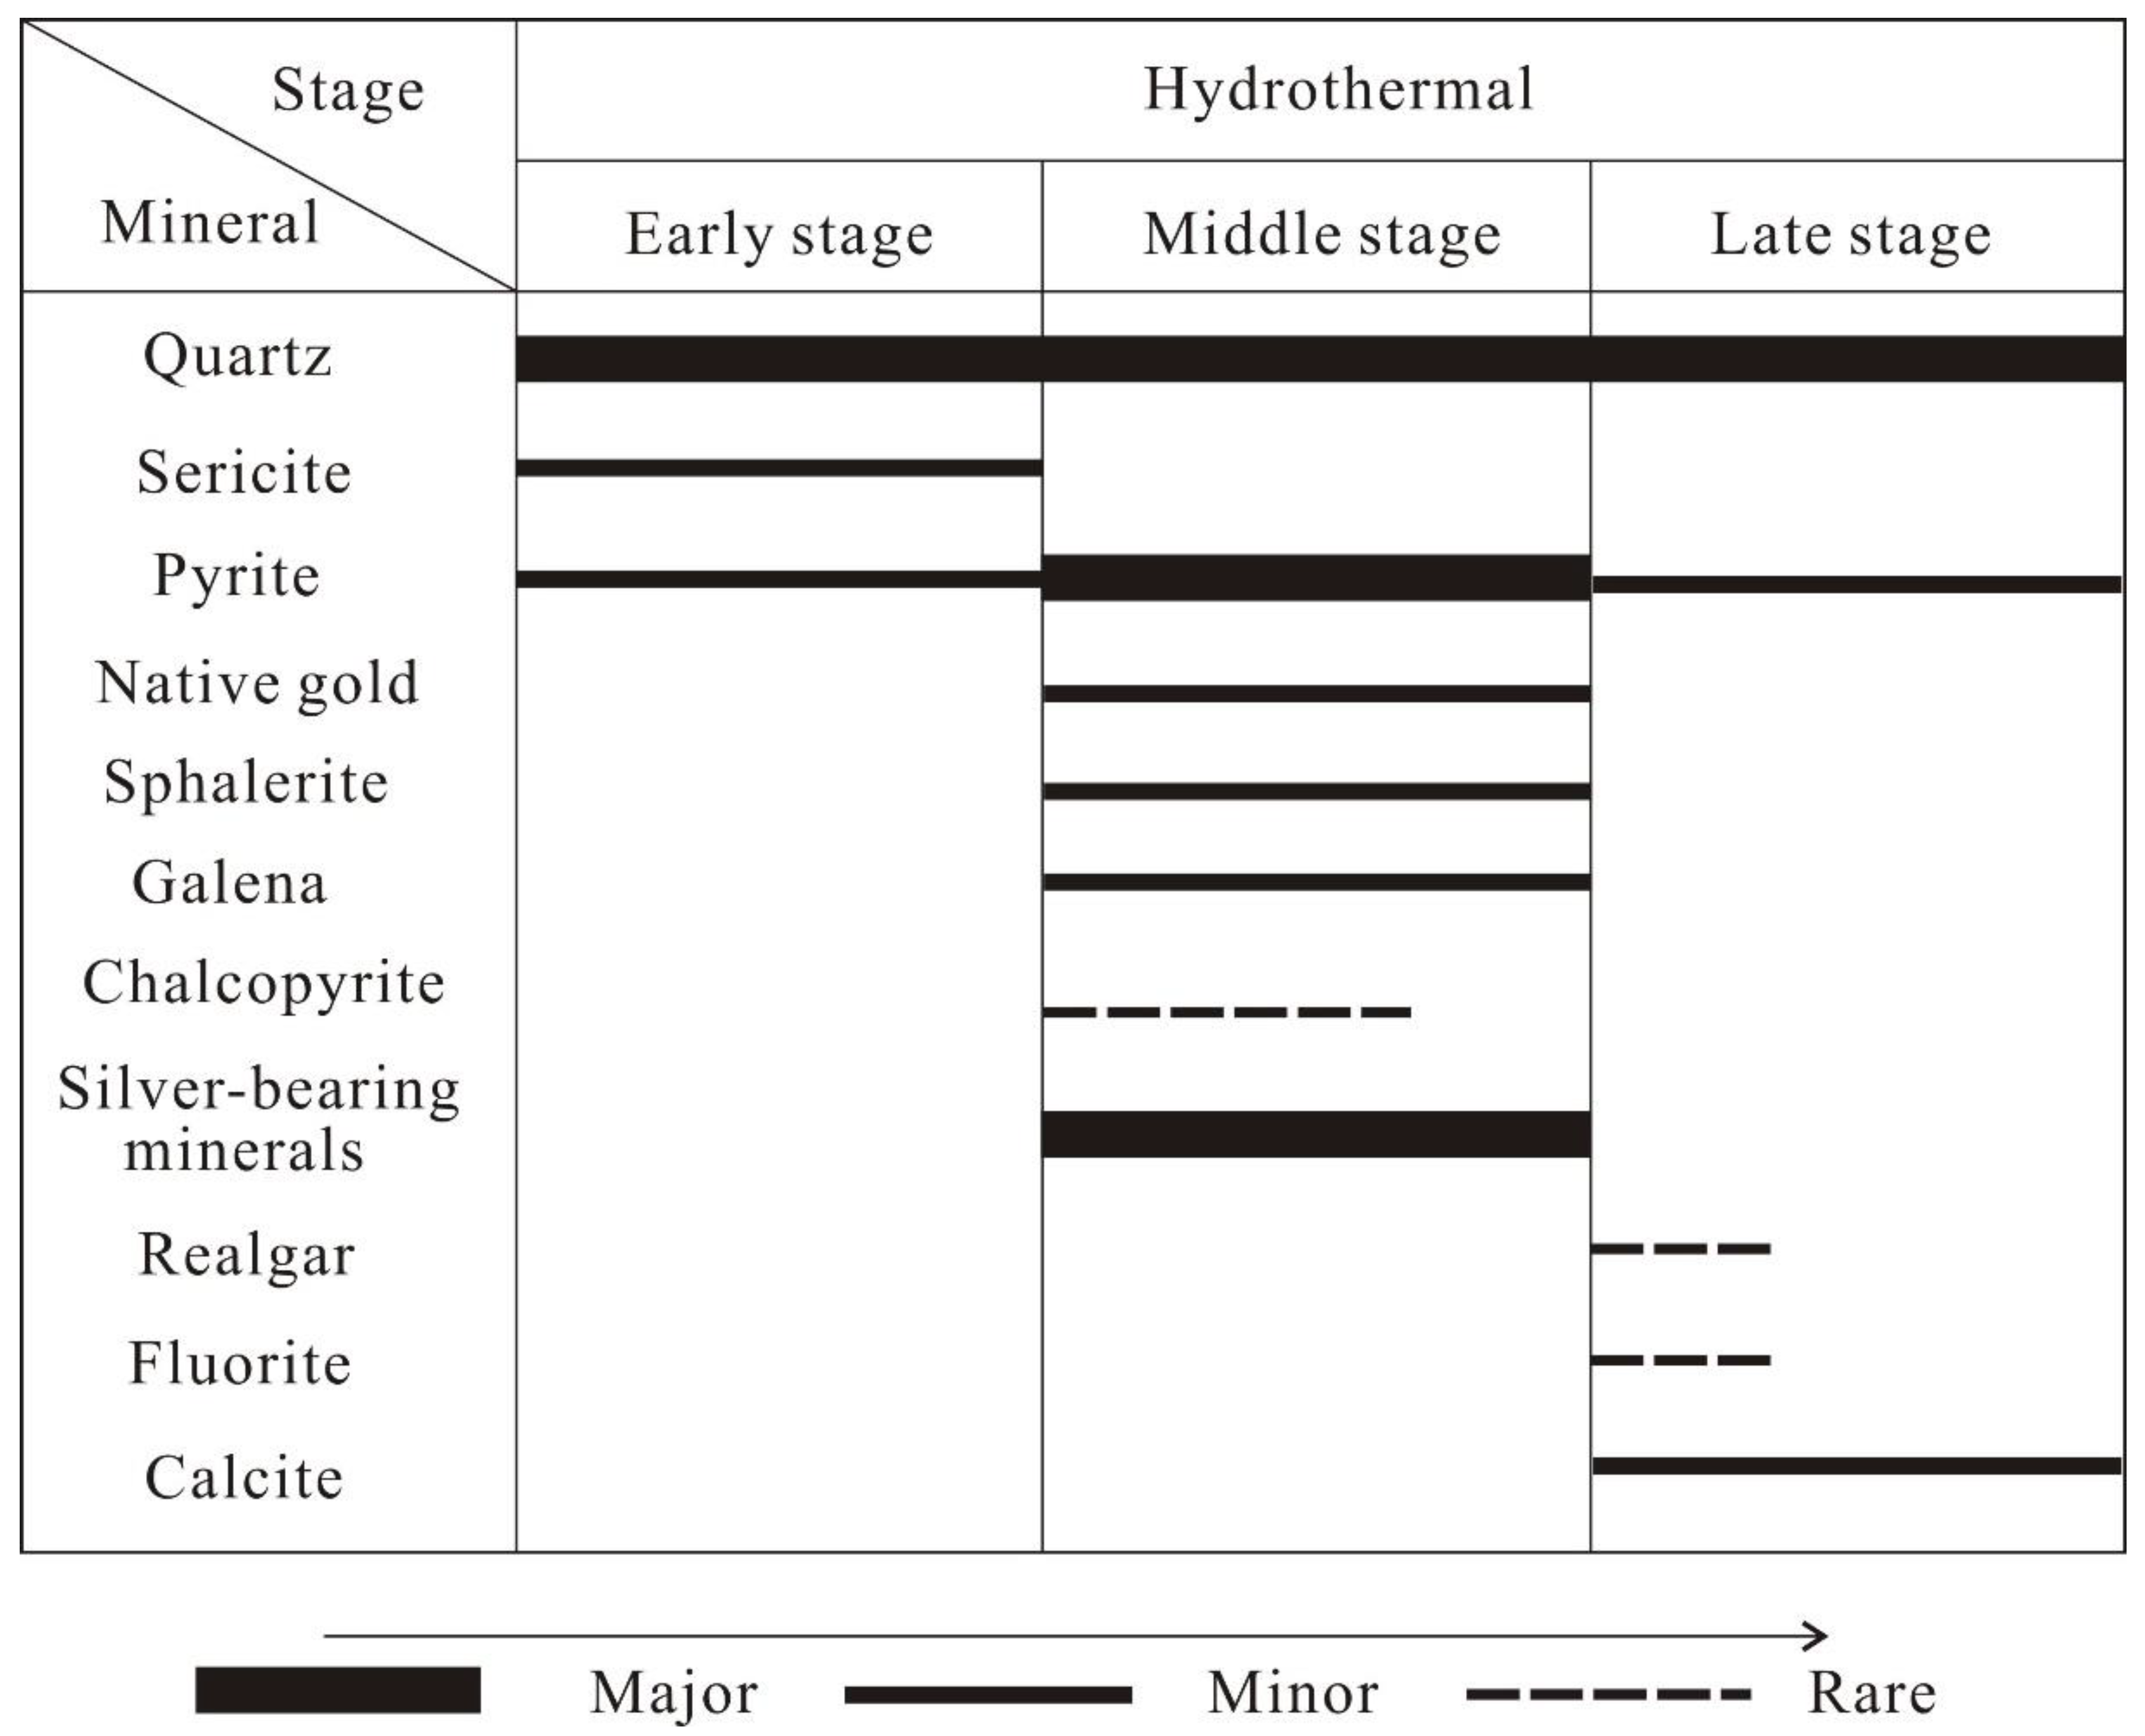
3.1. Characteristics of the Orebodies and Ore Mineral Assemblages
3.2. Hydrothermal Alteration and Mineralization Stages
4. Samples and Methods
4.1. Fluid Inclusion Microthermometry
4.2. Isotope Analyses
5. Results
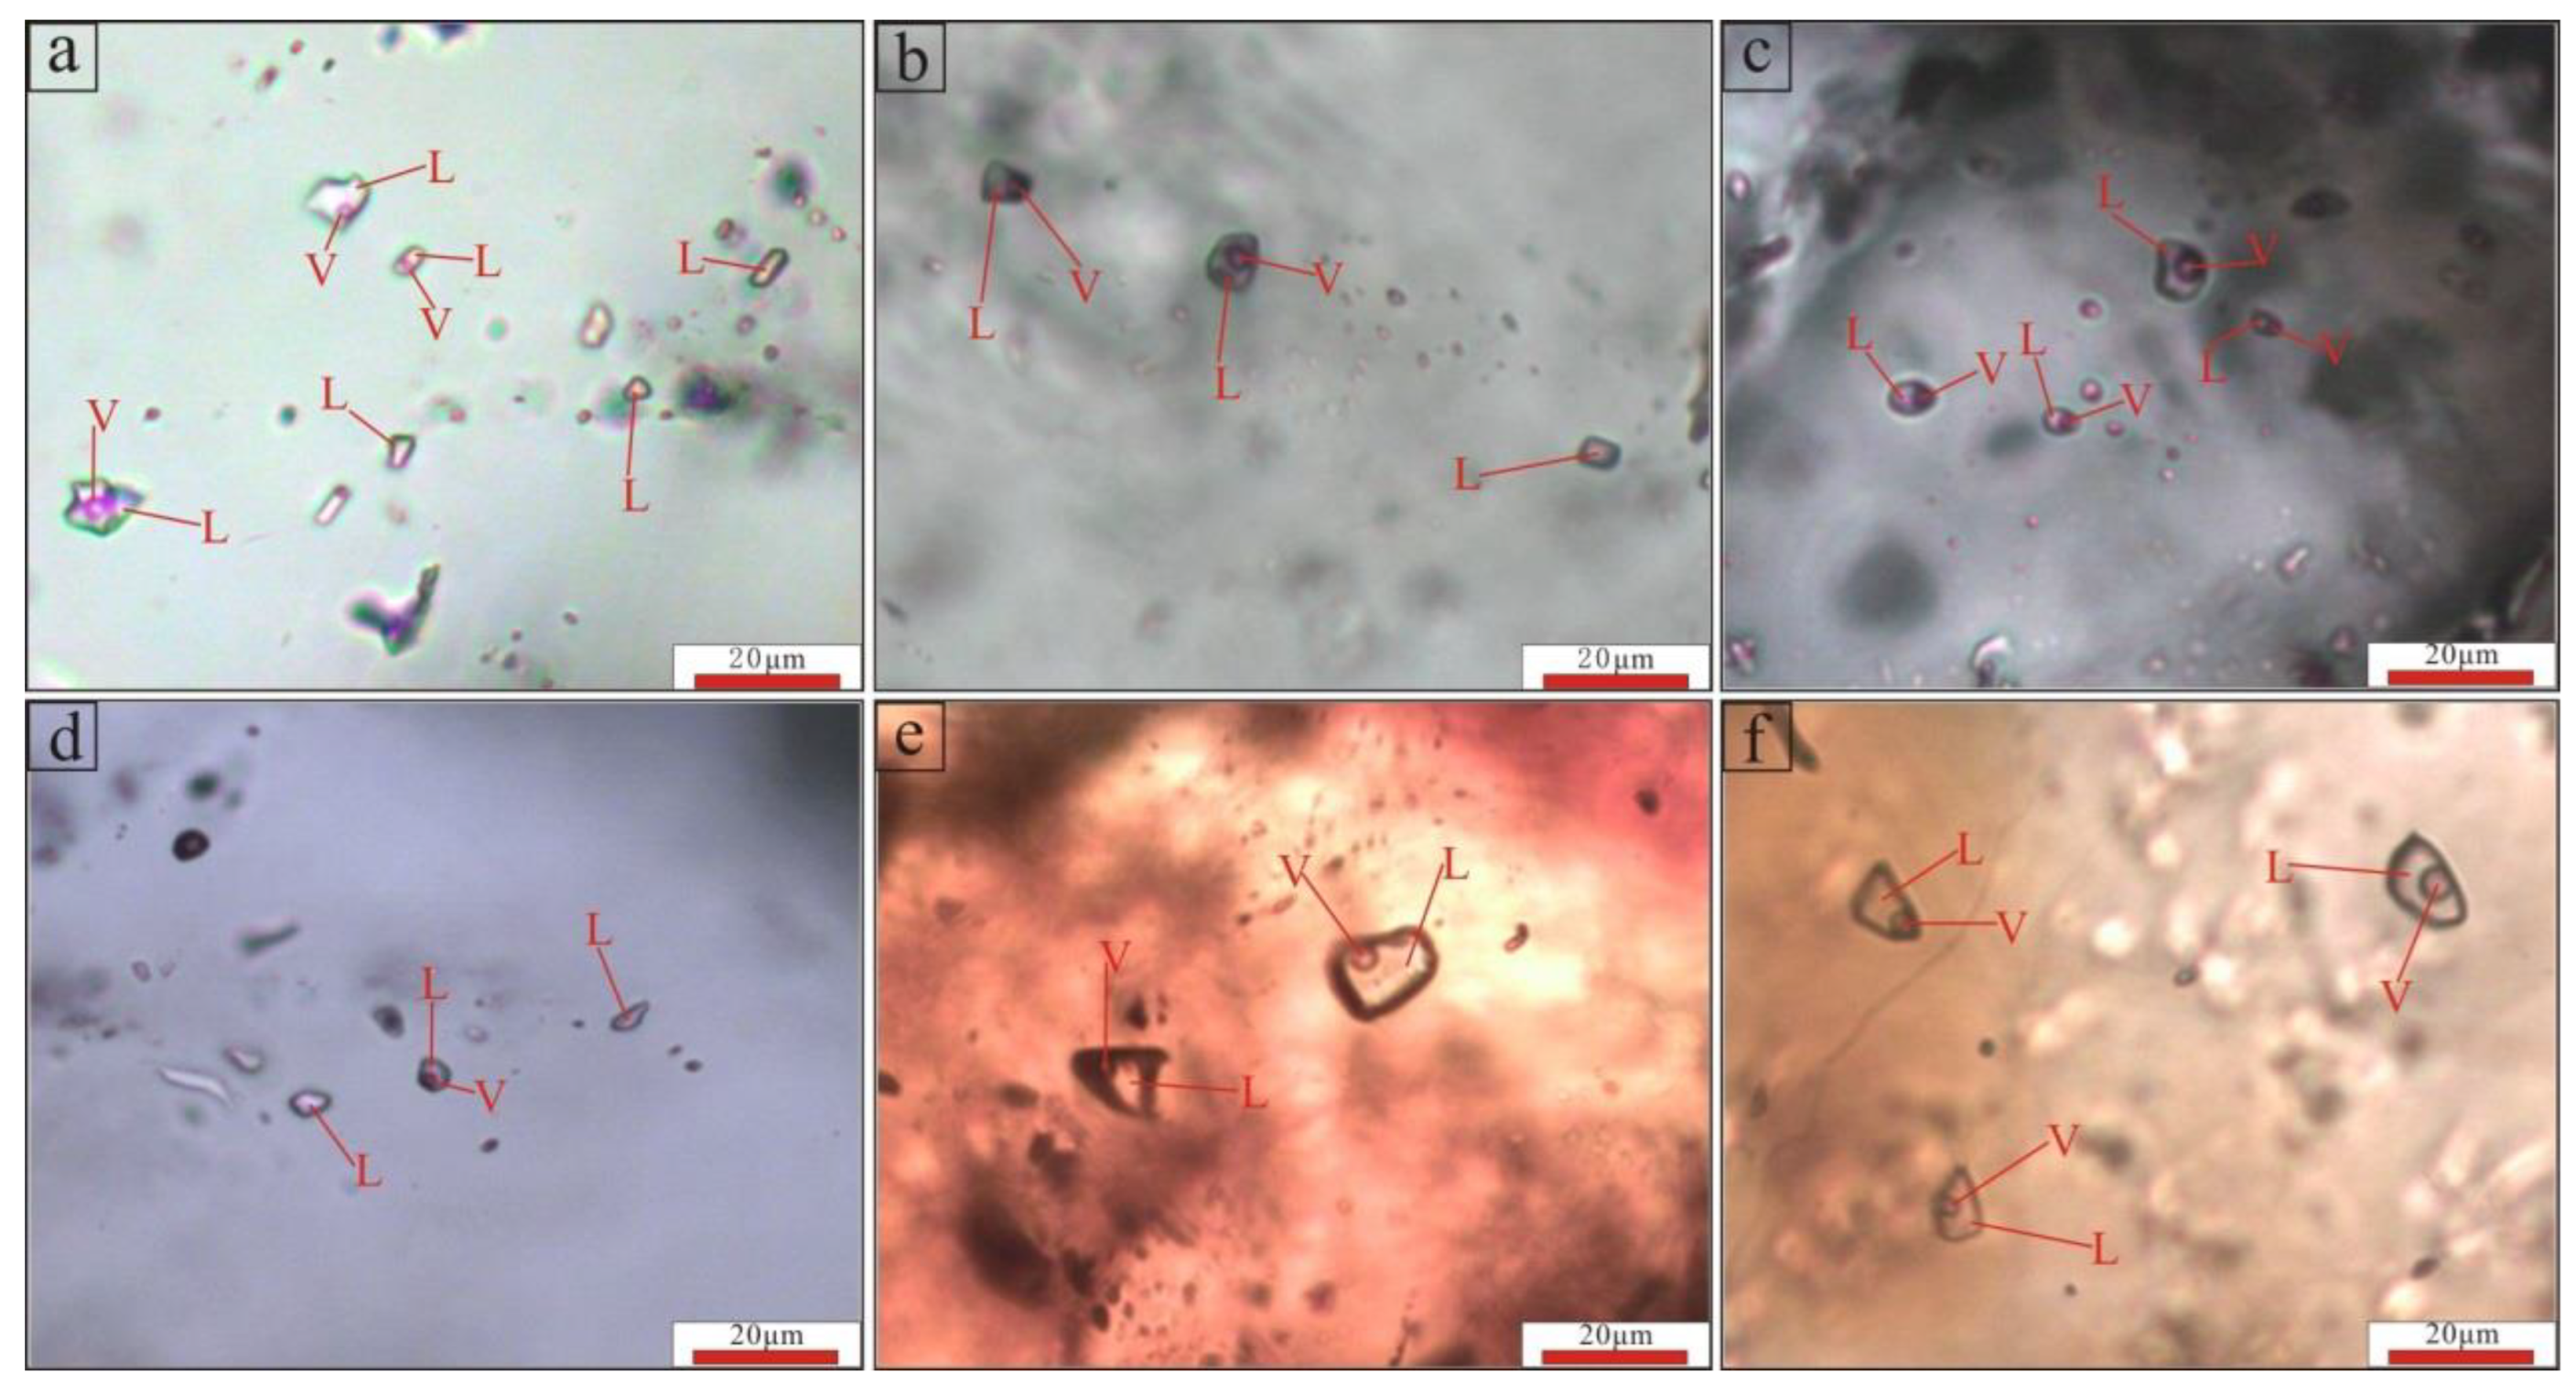
5.1. Fluid Inclusion Study
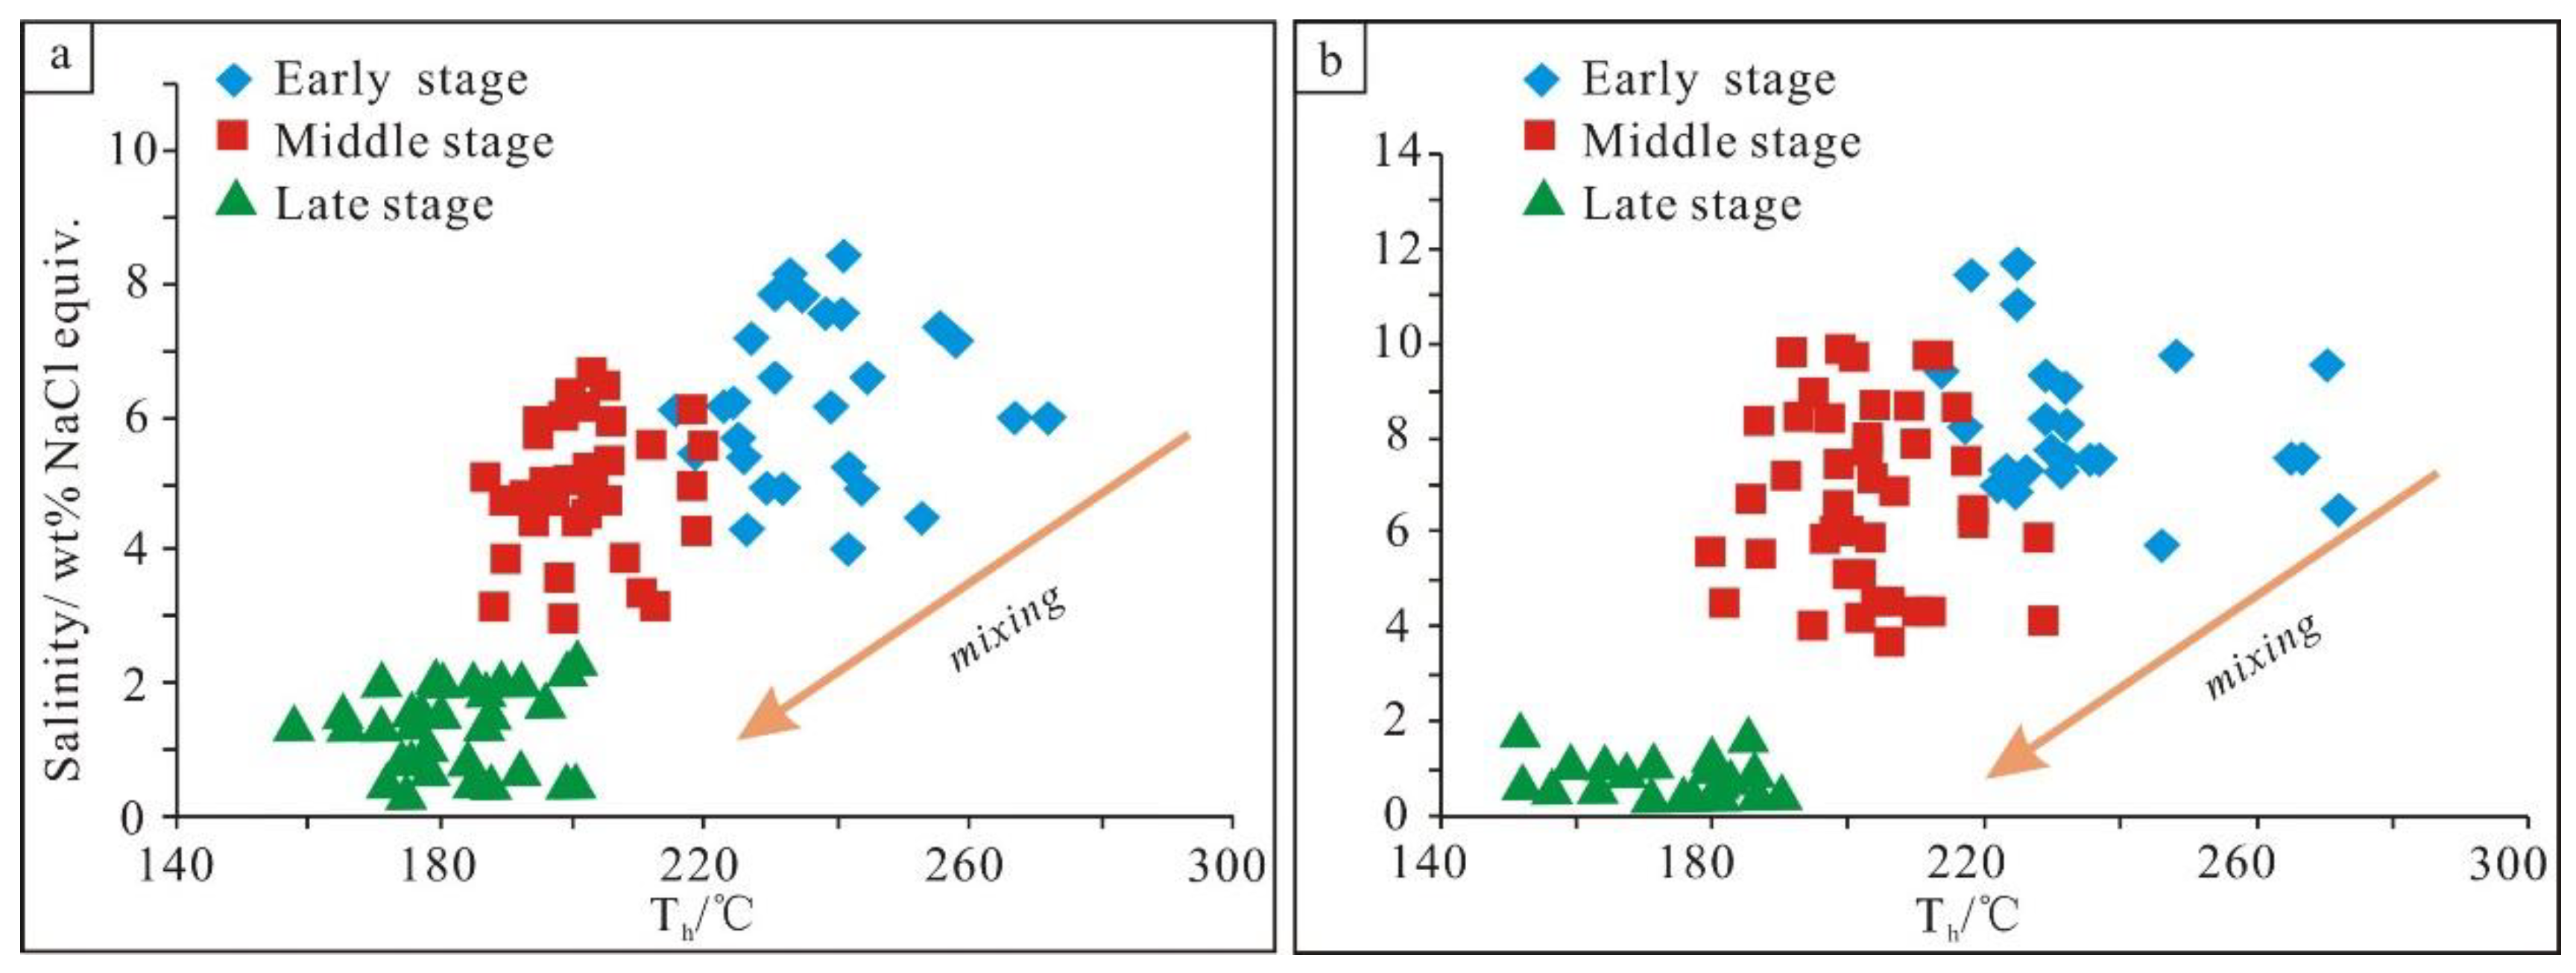
5.2. Microthermometry
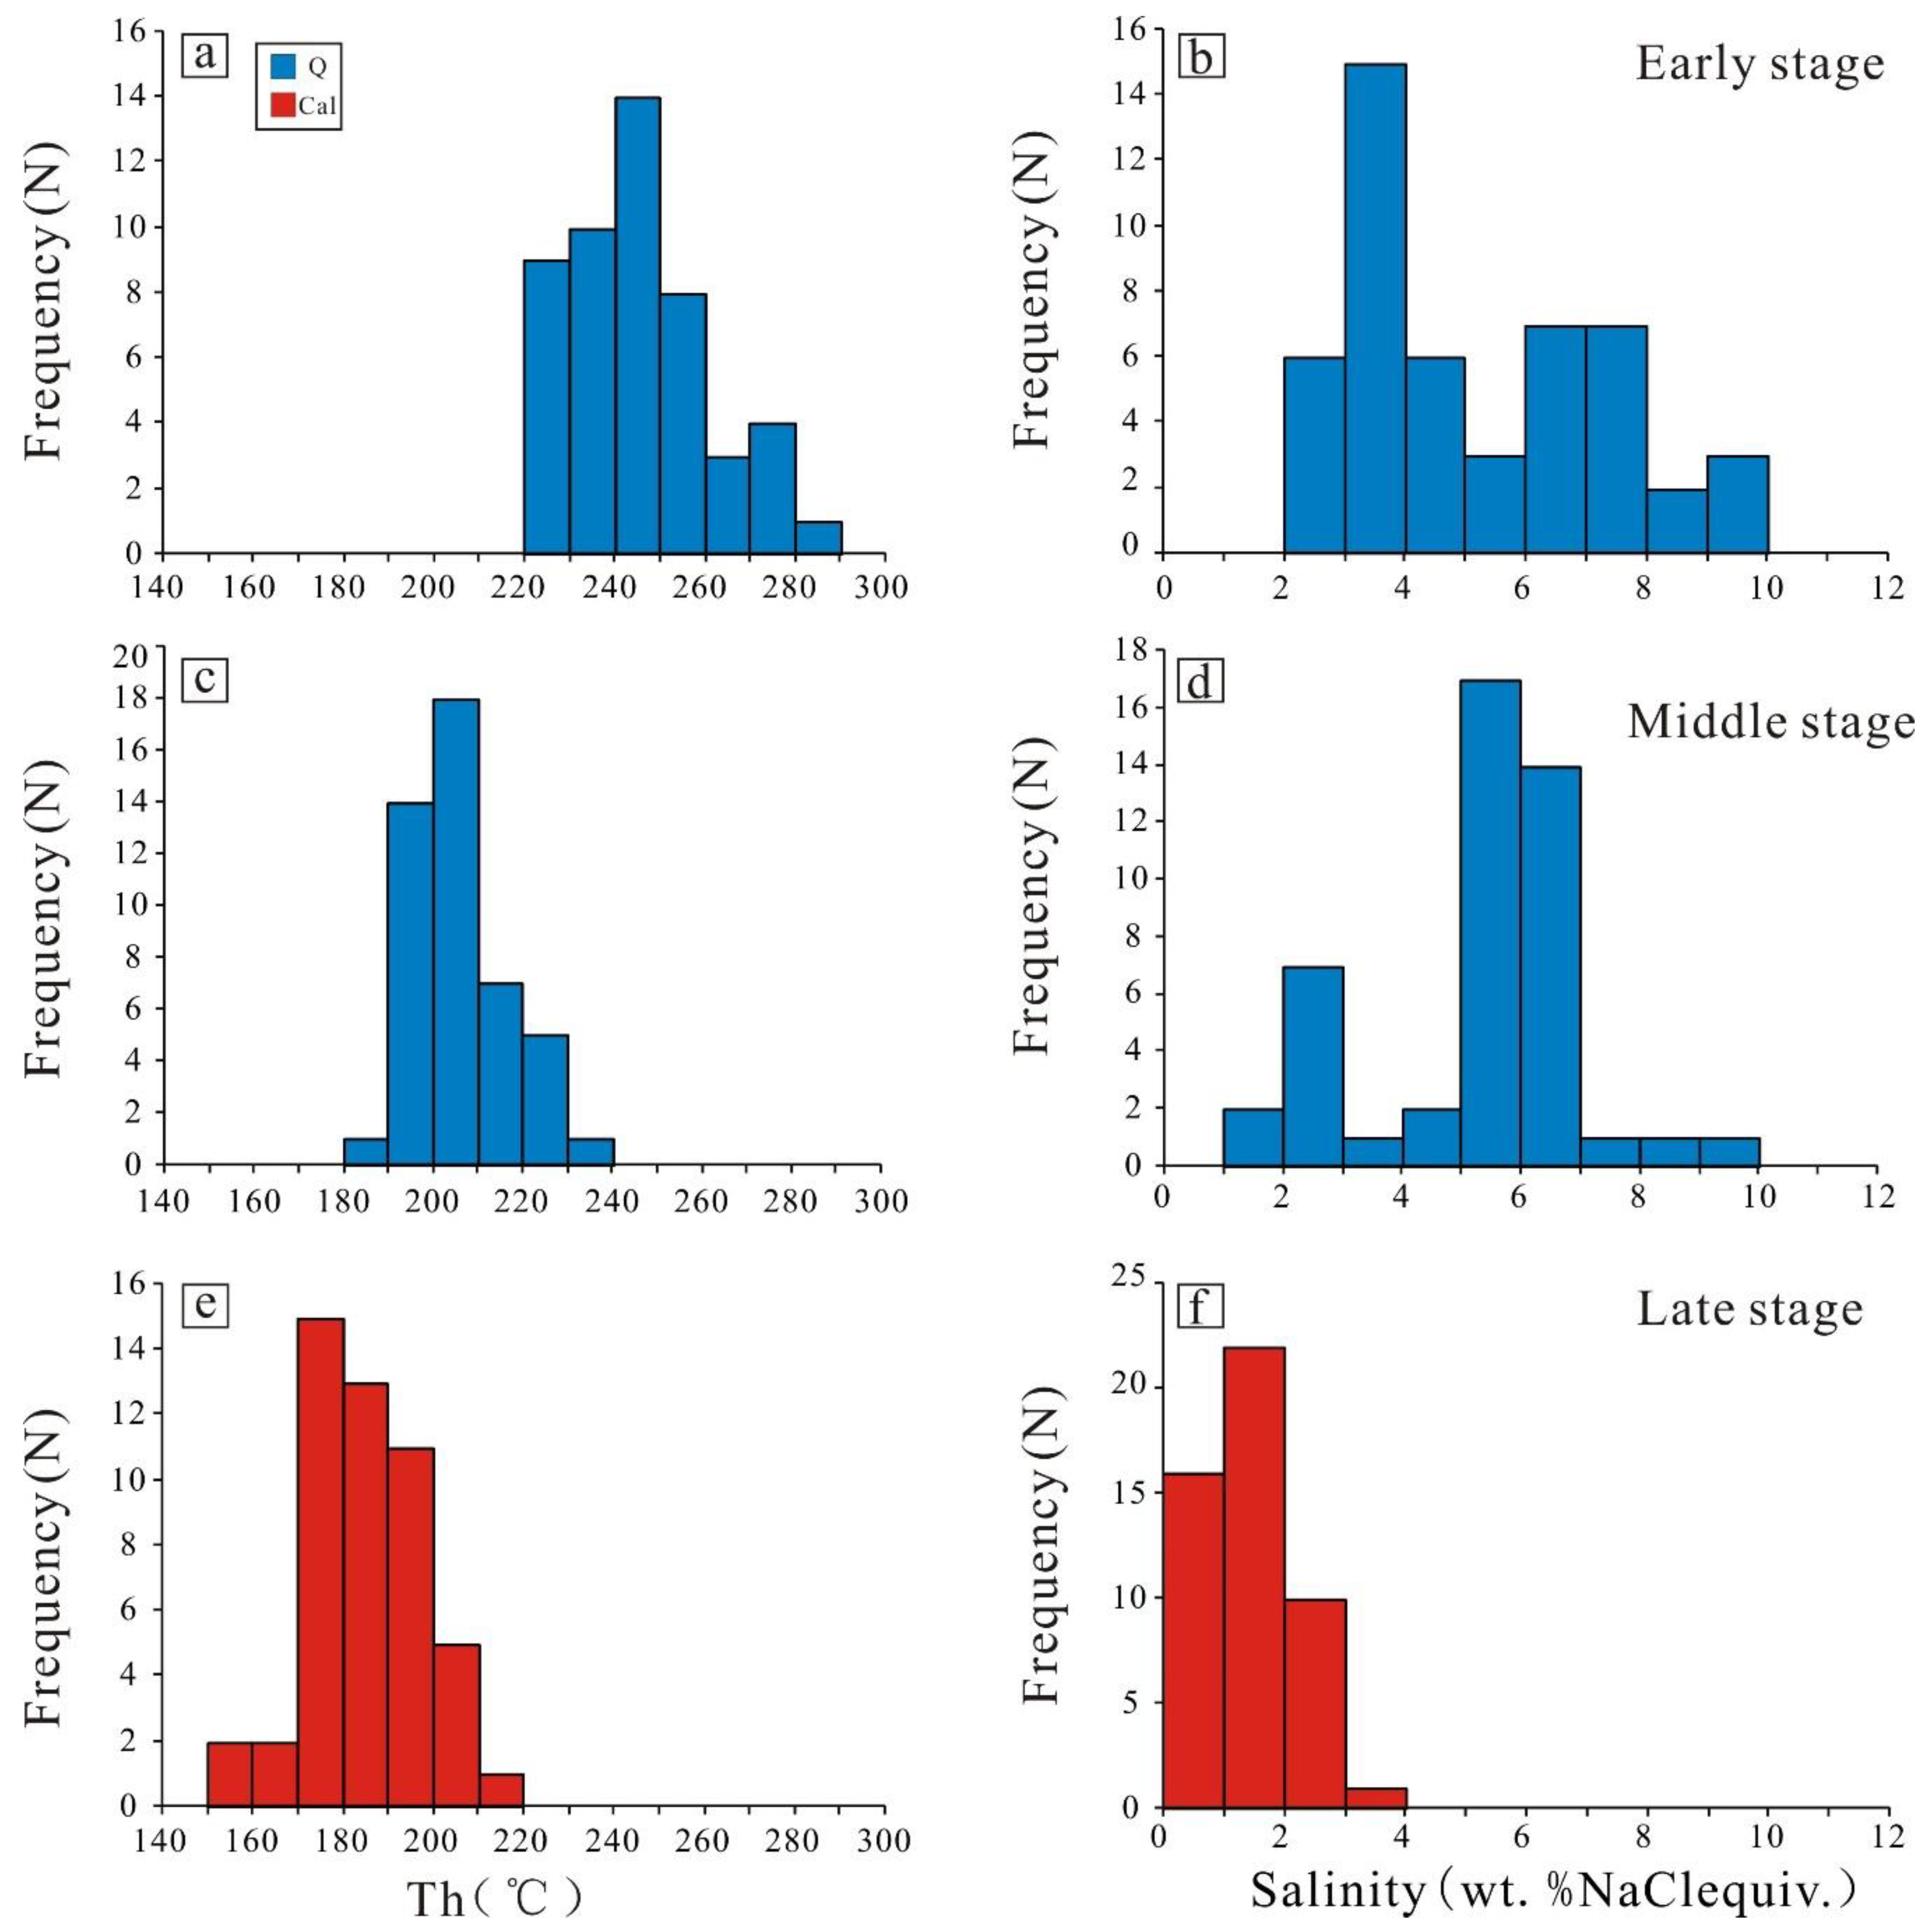
5.2.1. Microthermometry of the Au Orebody
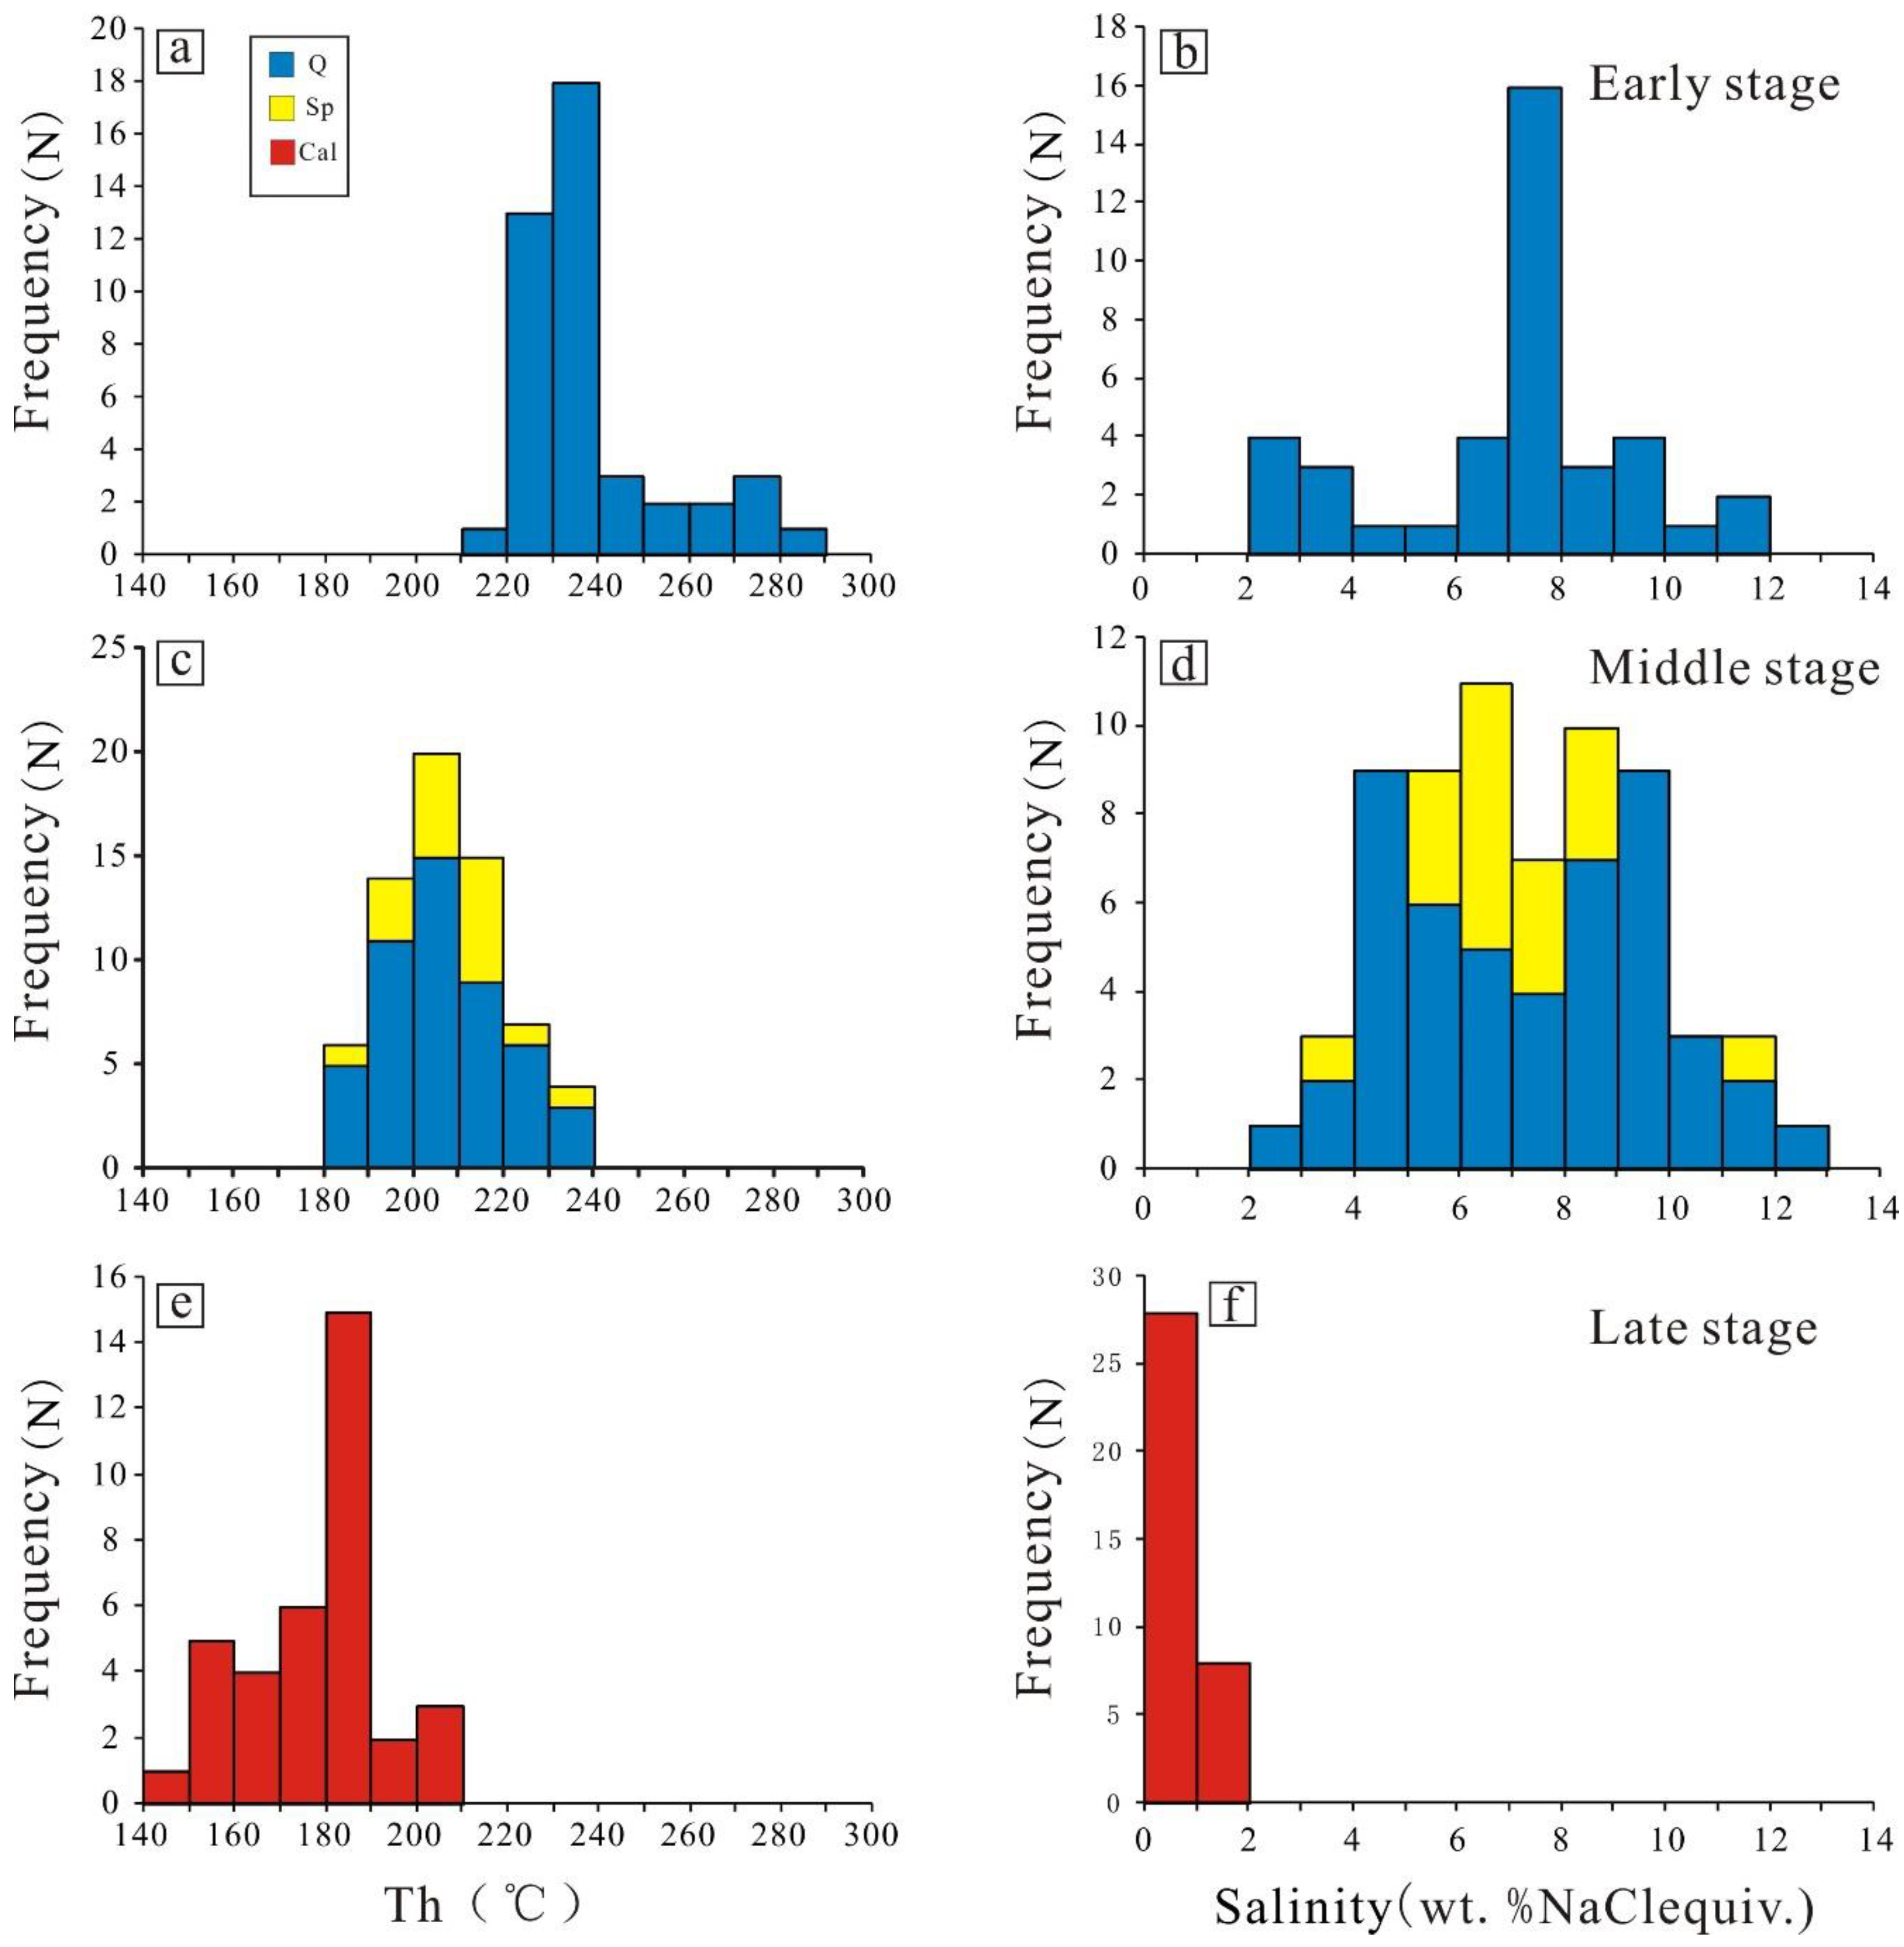
5.2.2. Microthermometry of the Ag Deposit
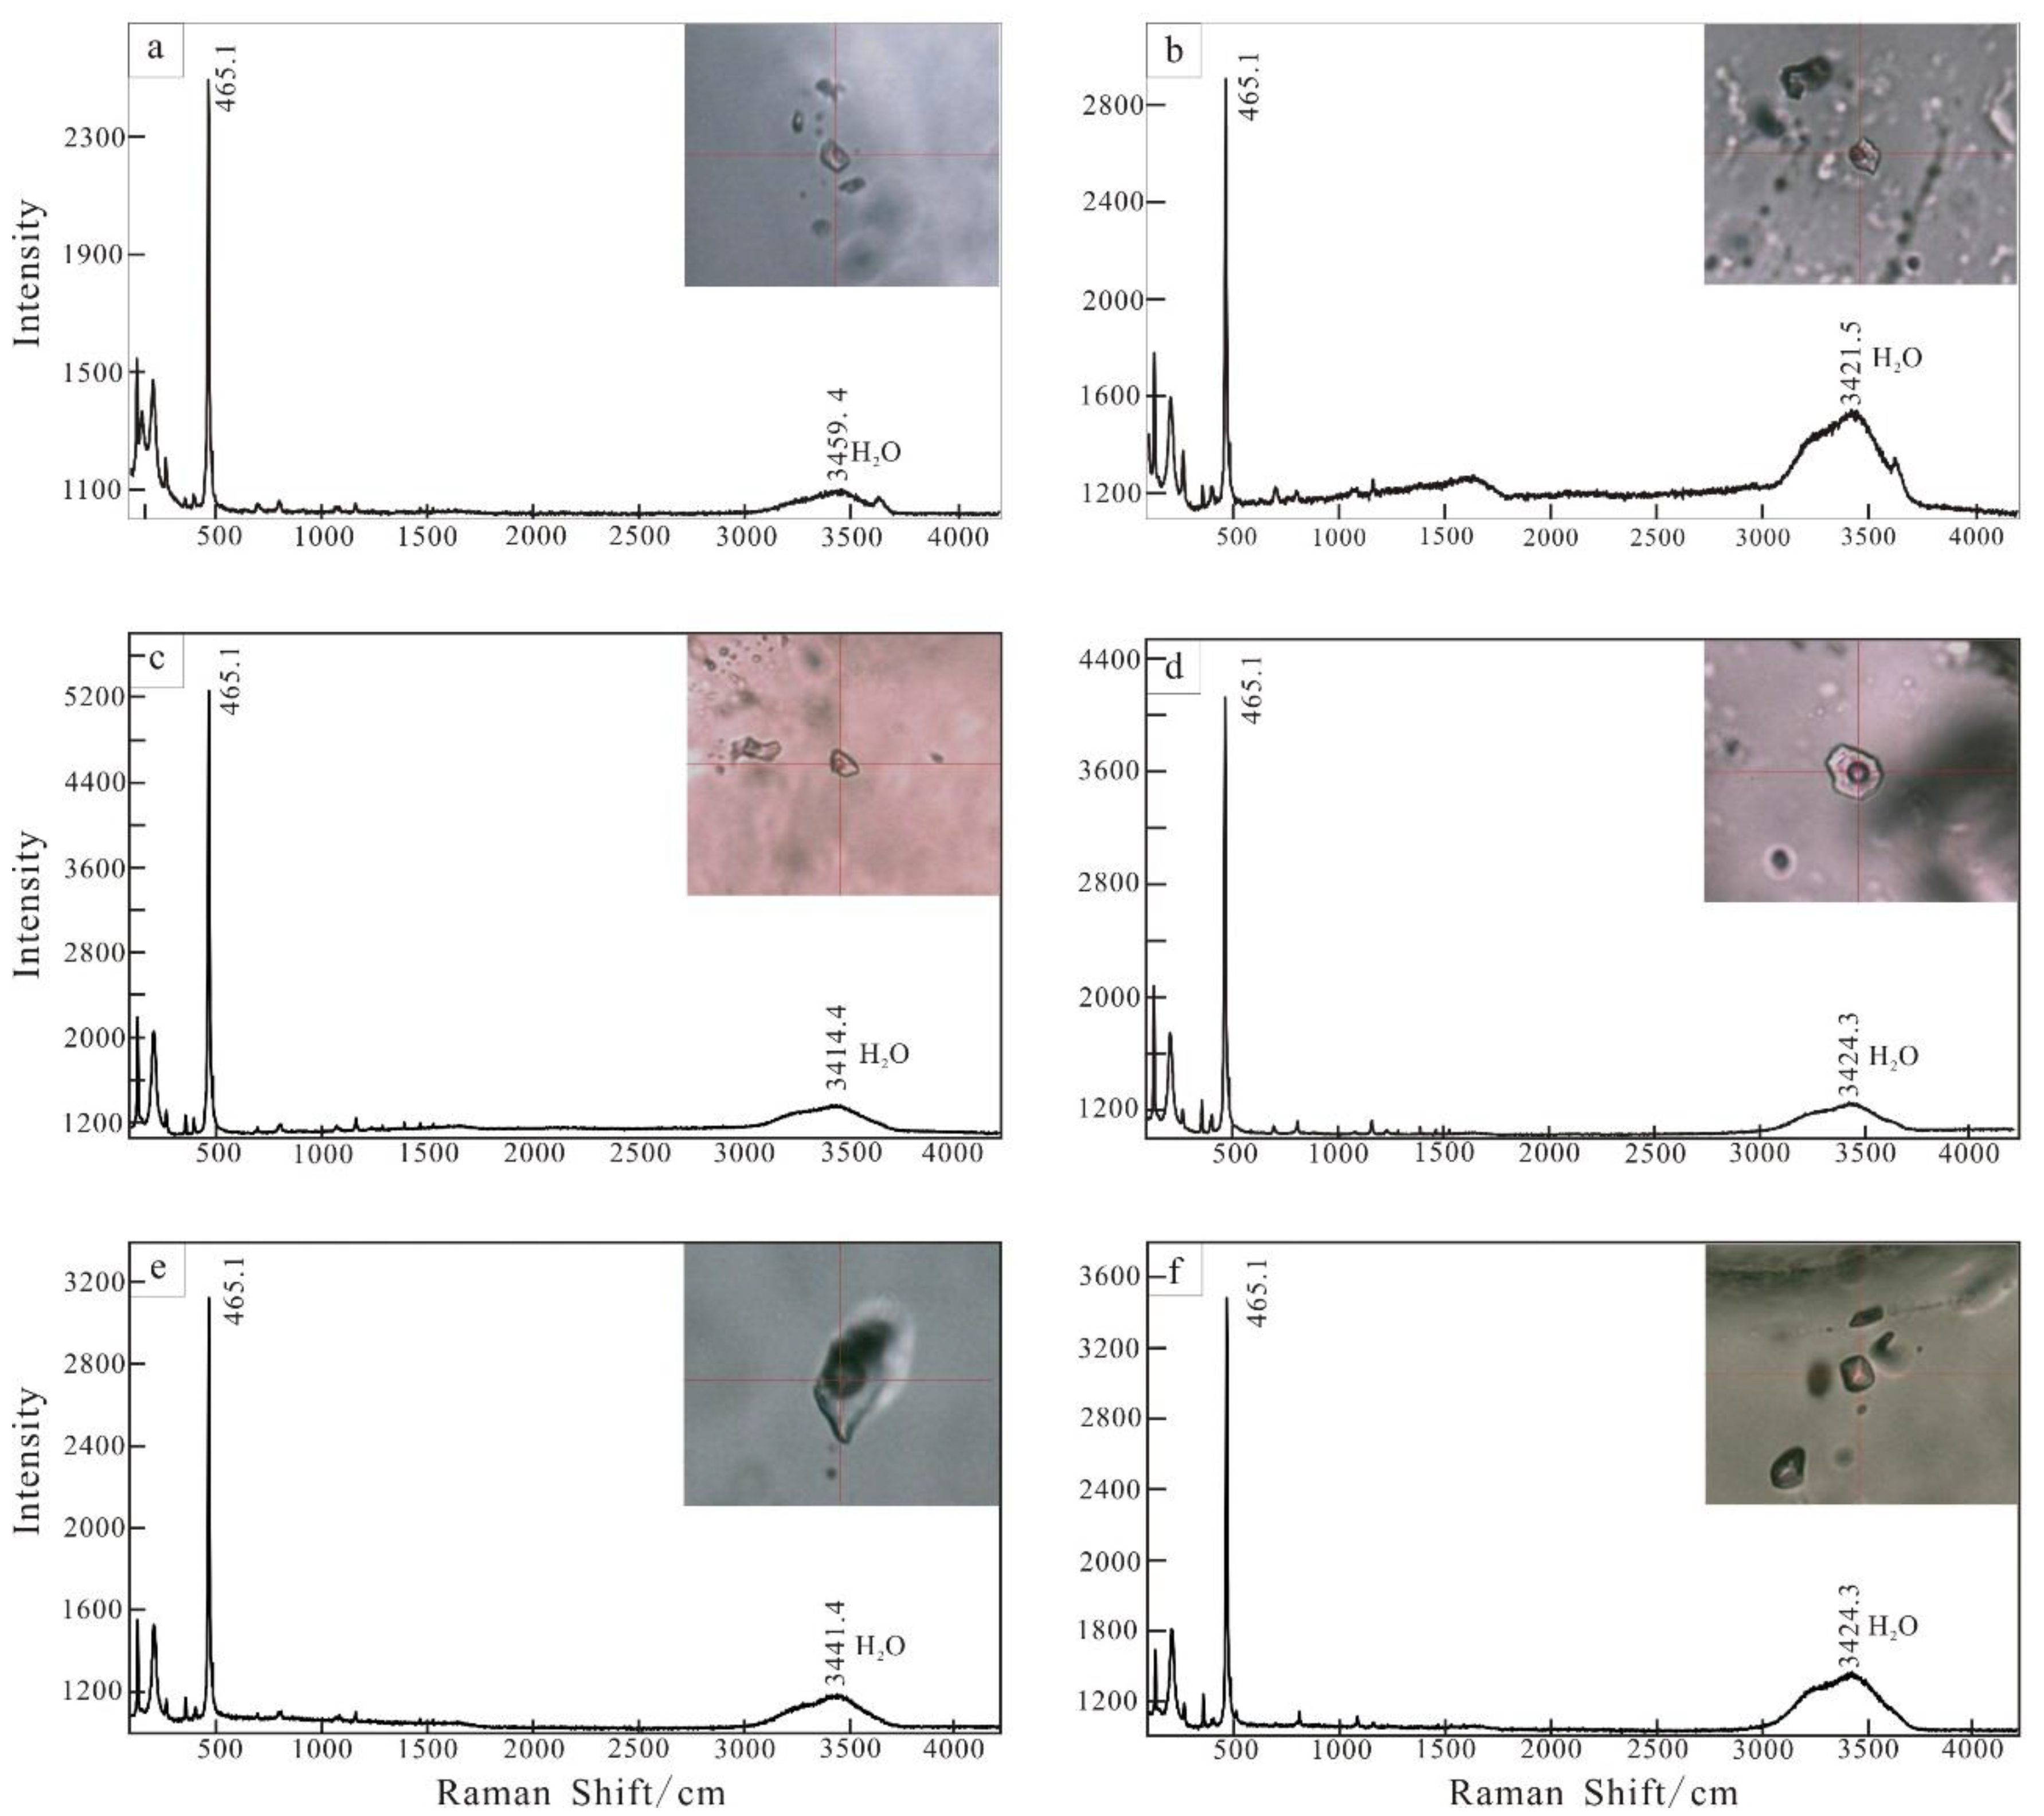
5.3. Laser Raman Spectroscopy
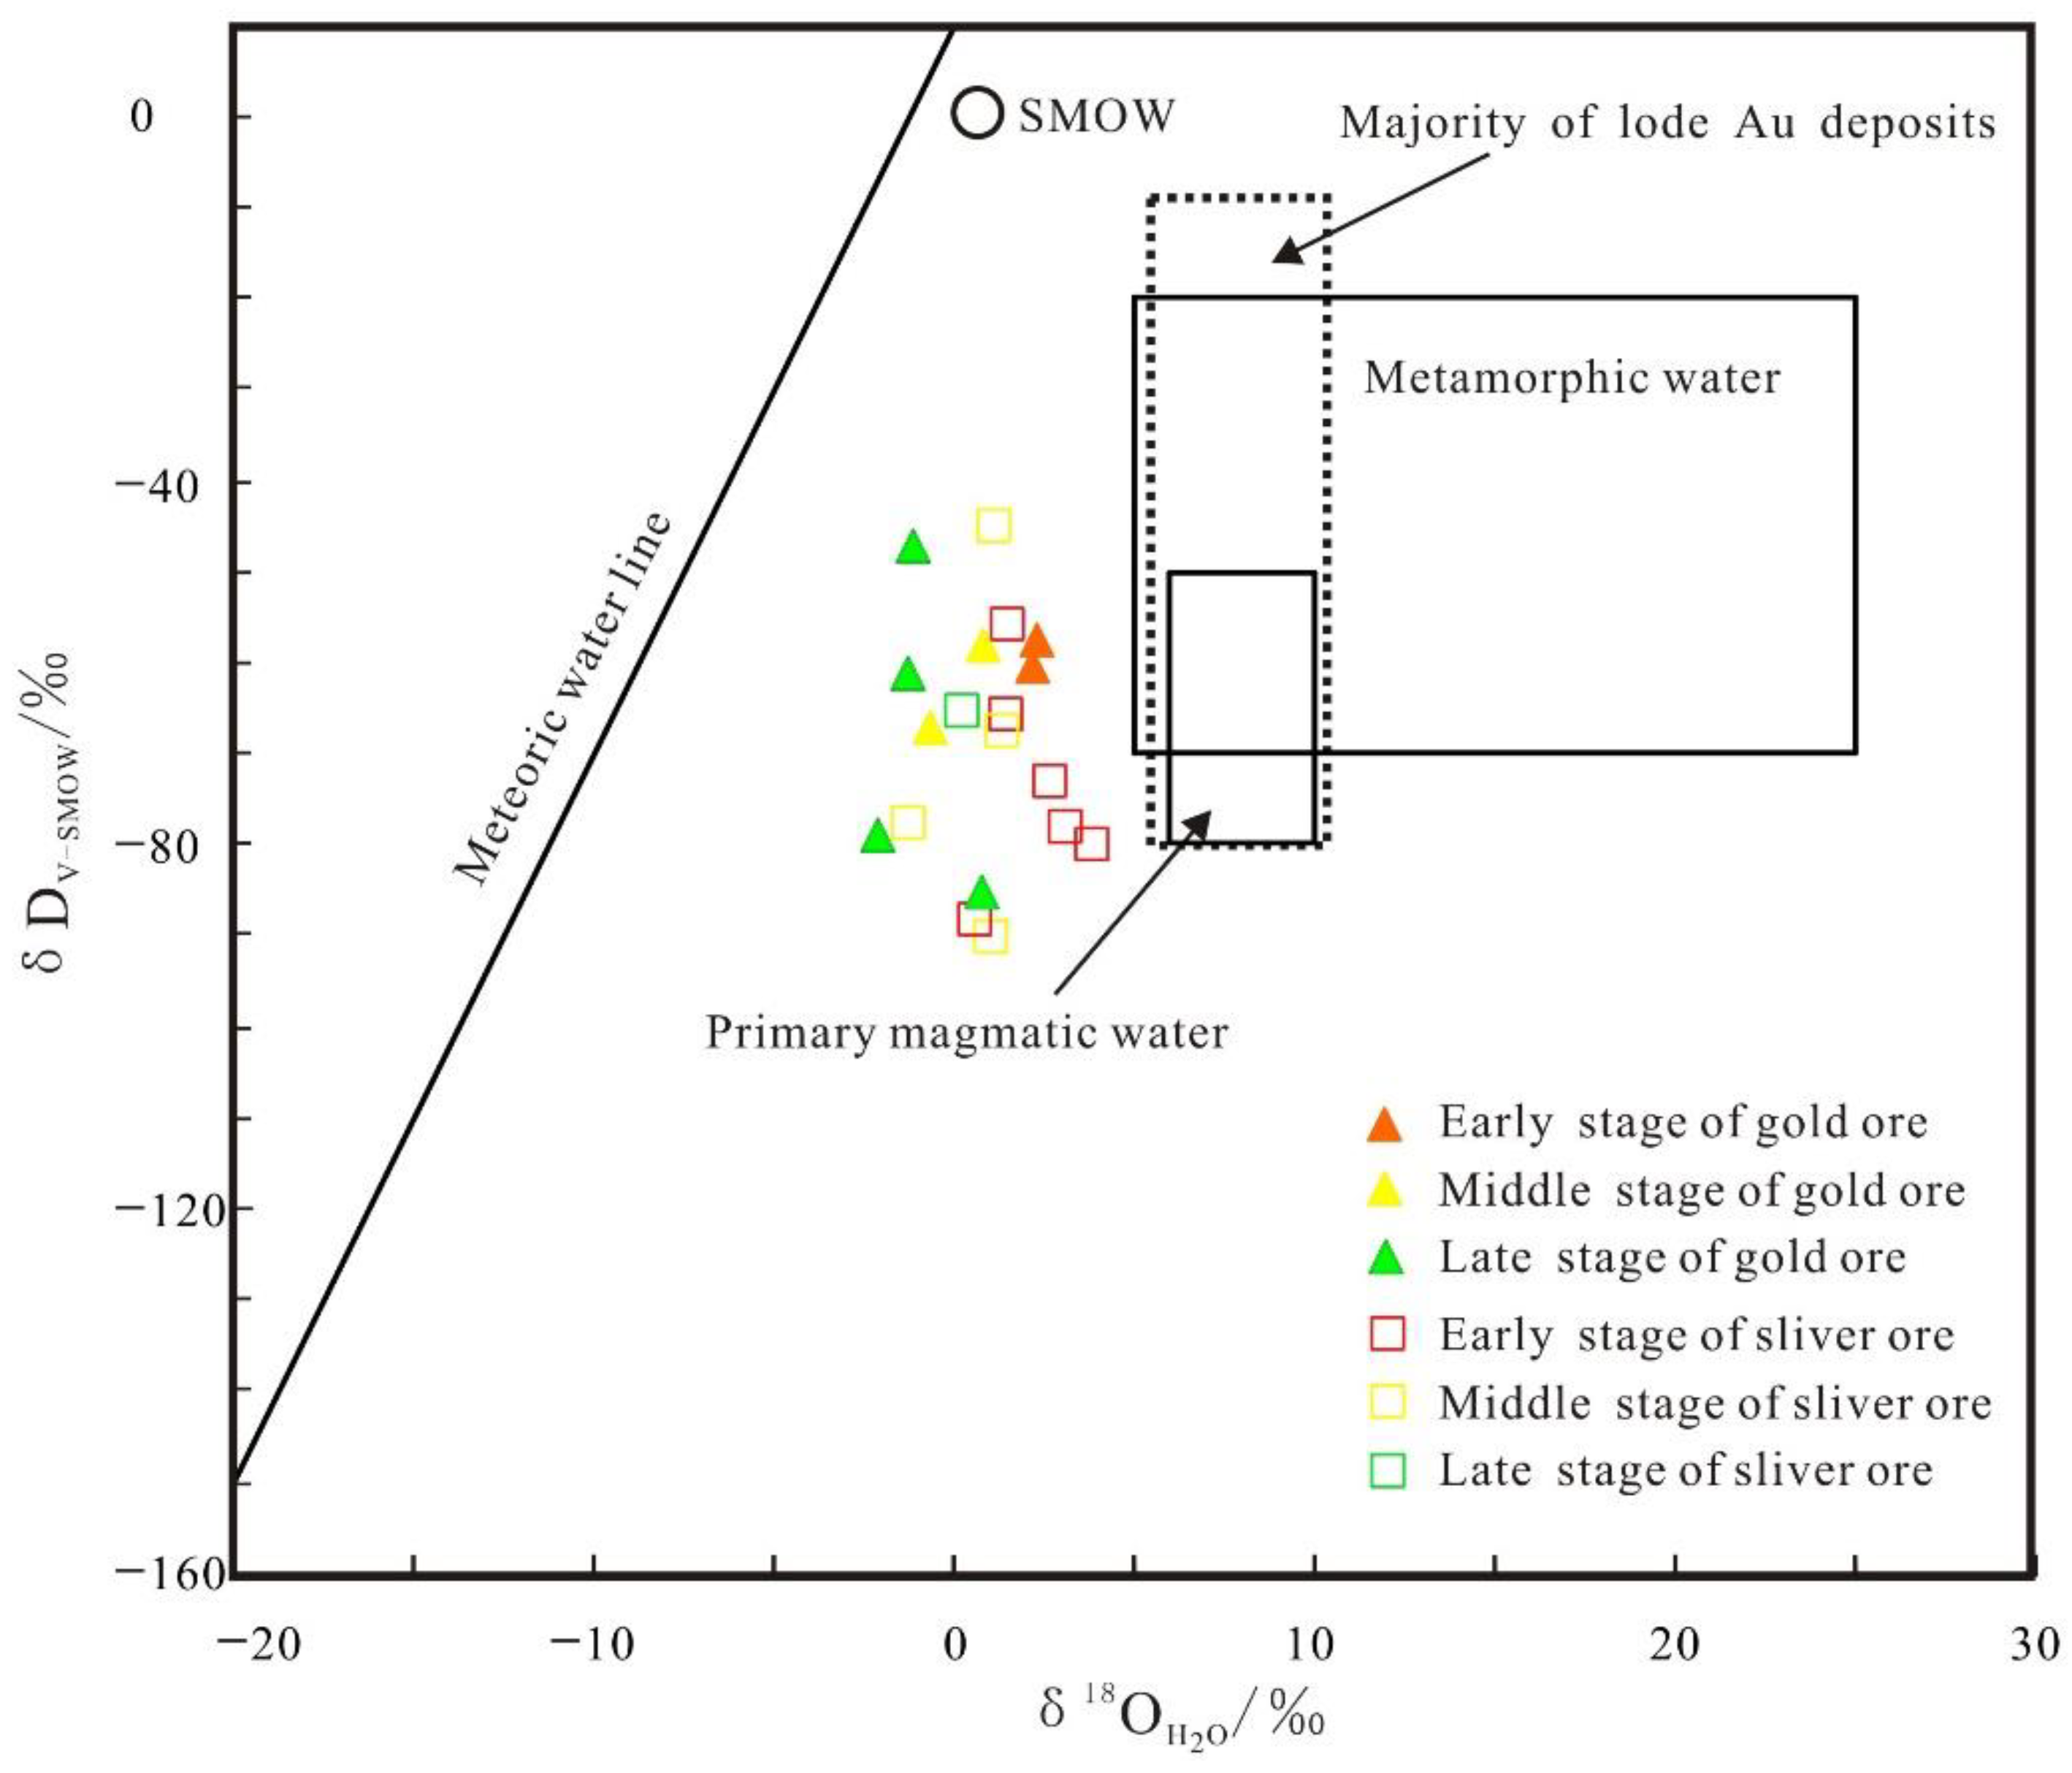
5.4. H and O Isotopes
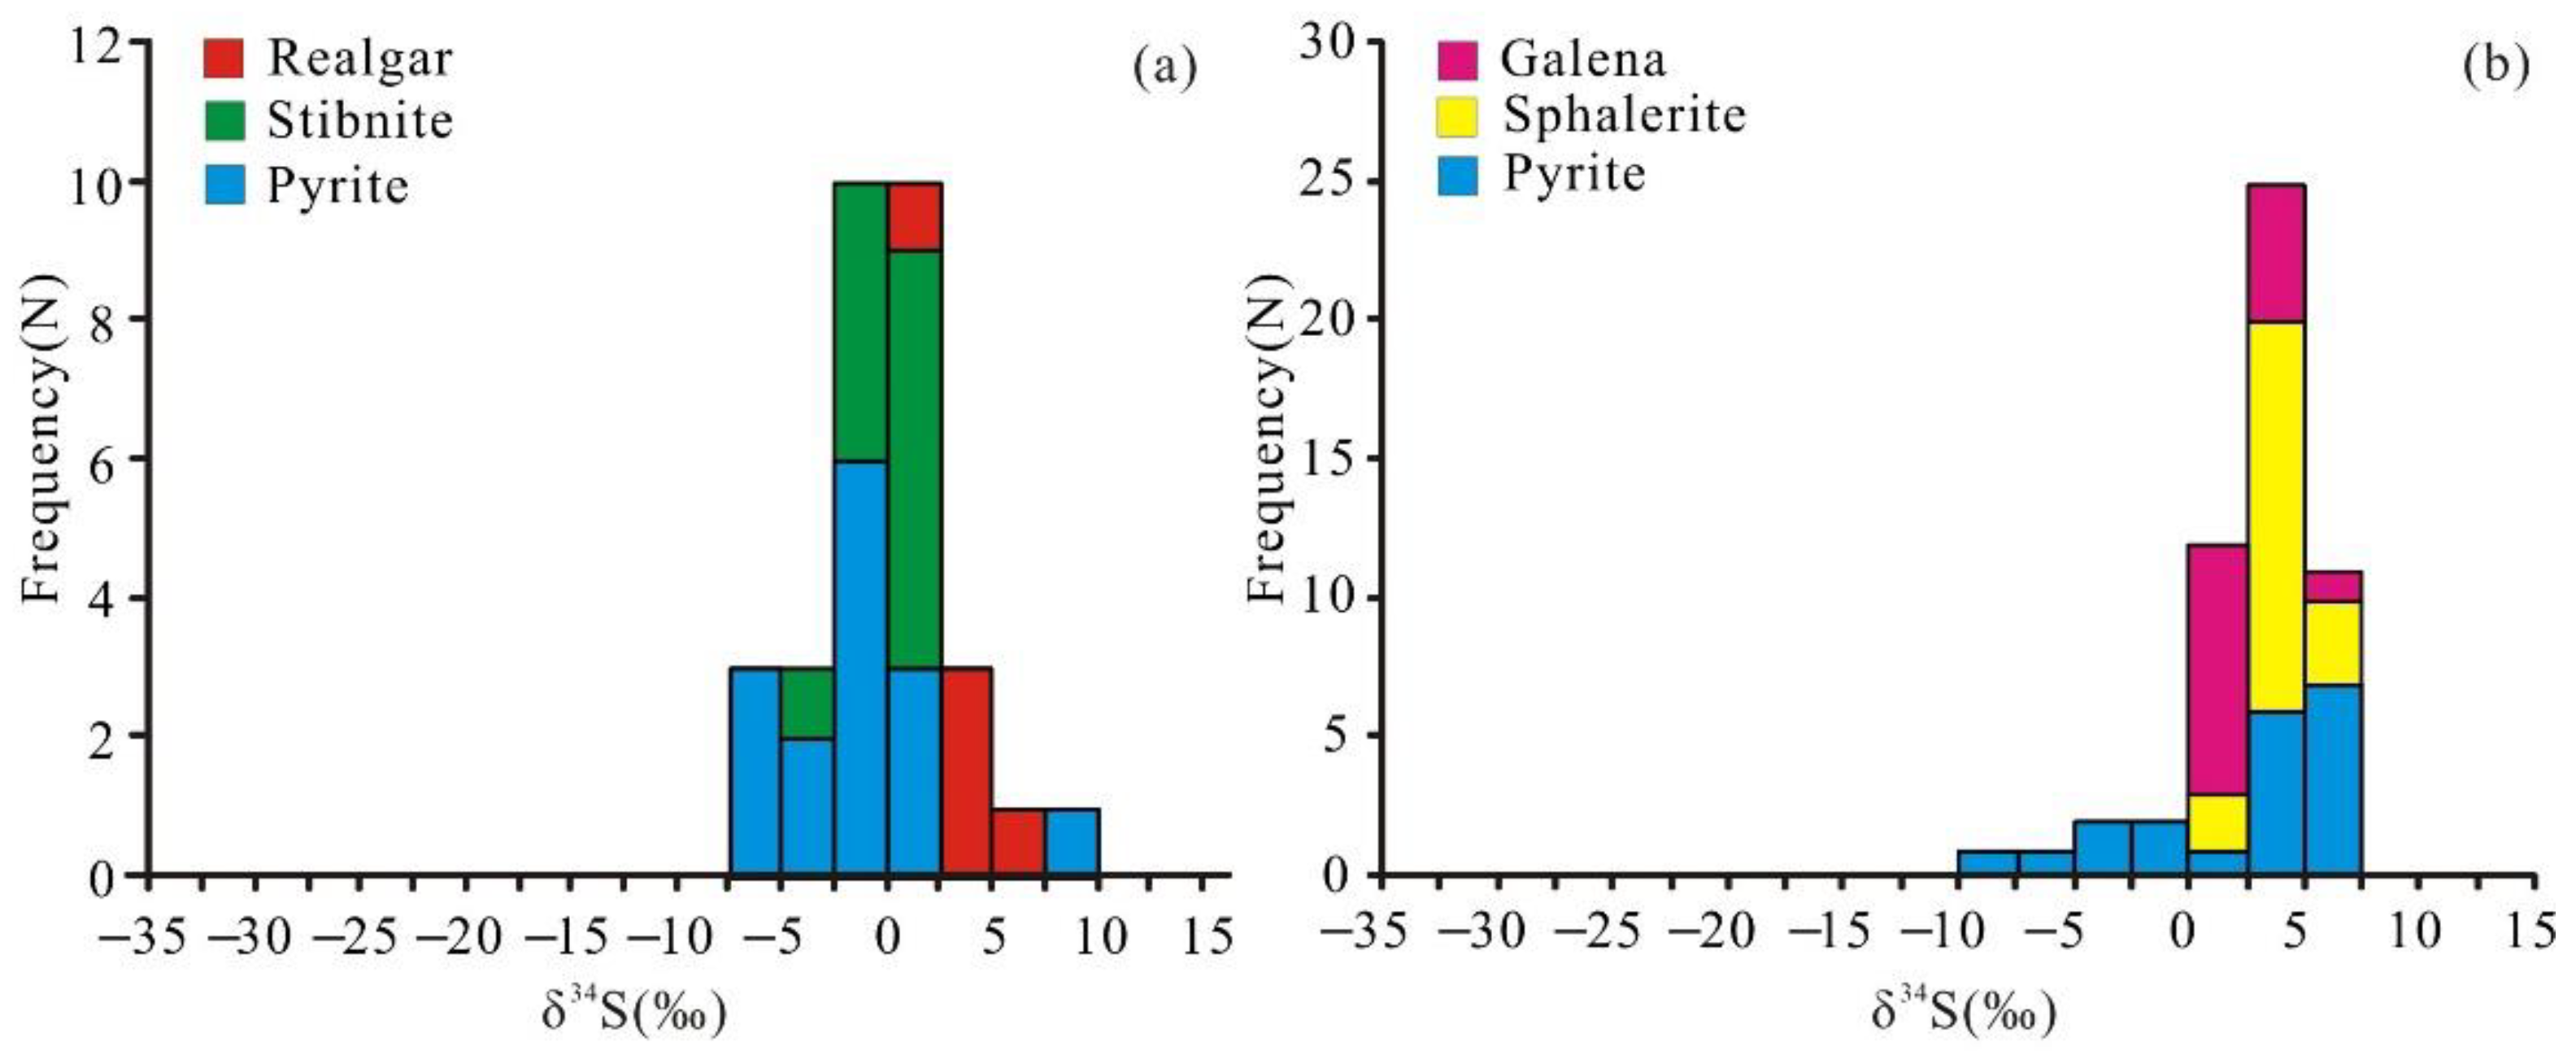
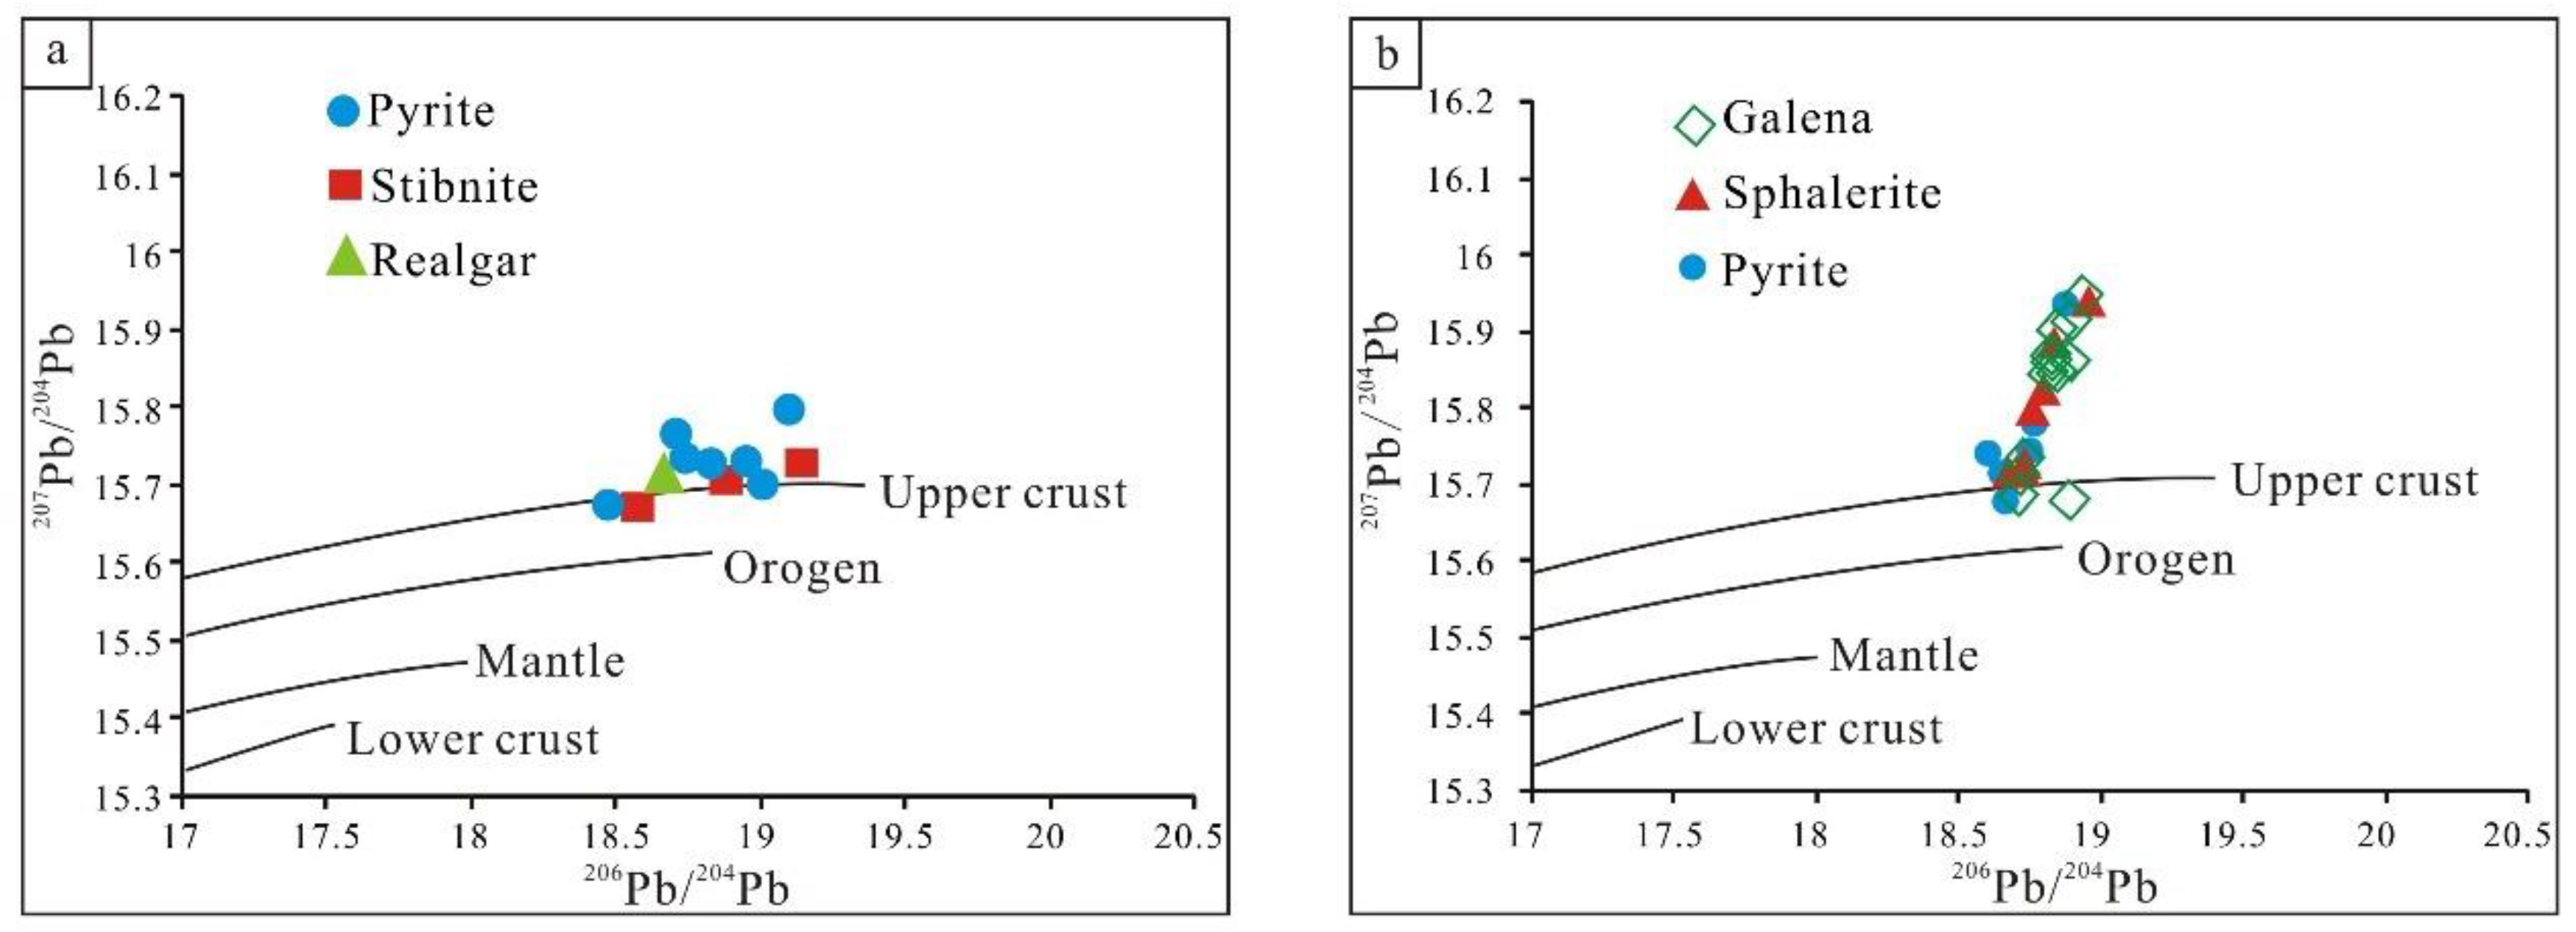
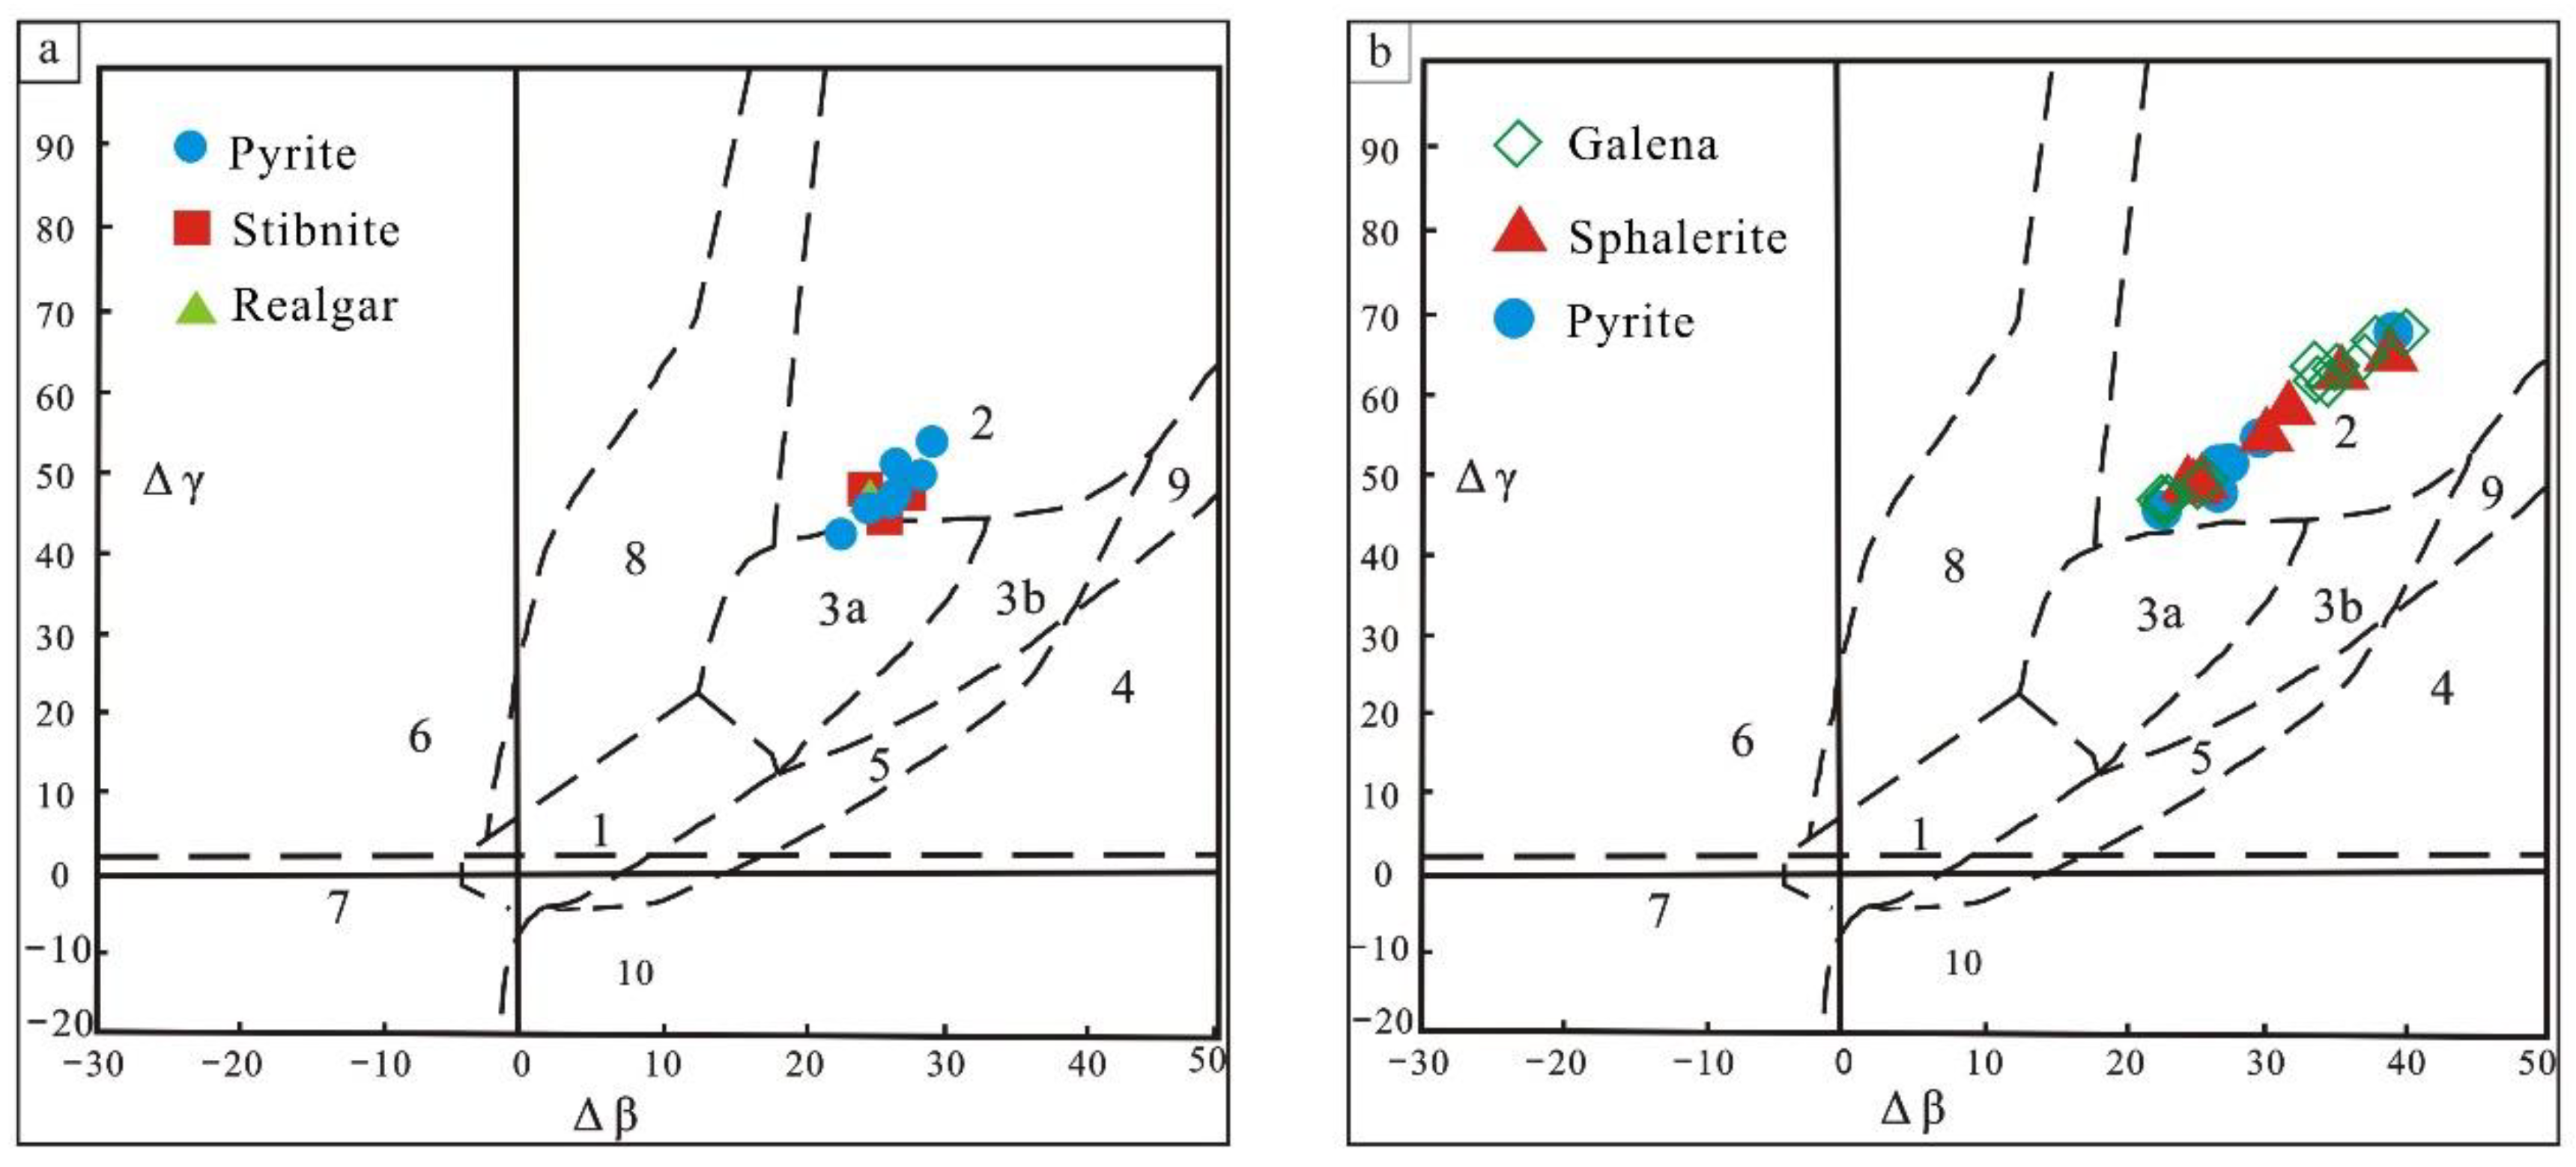
5.5. S and Pb Isotopes
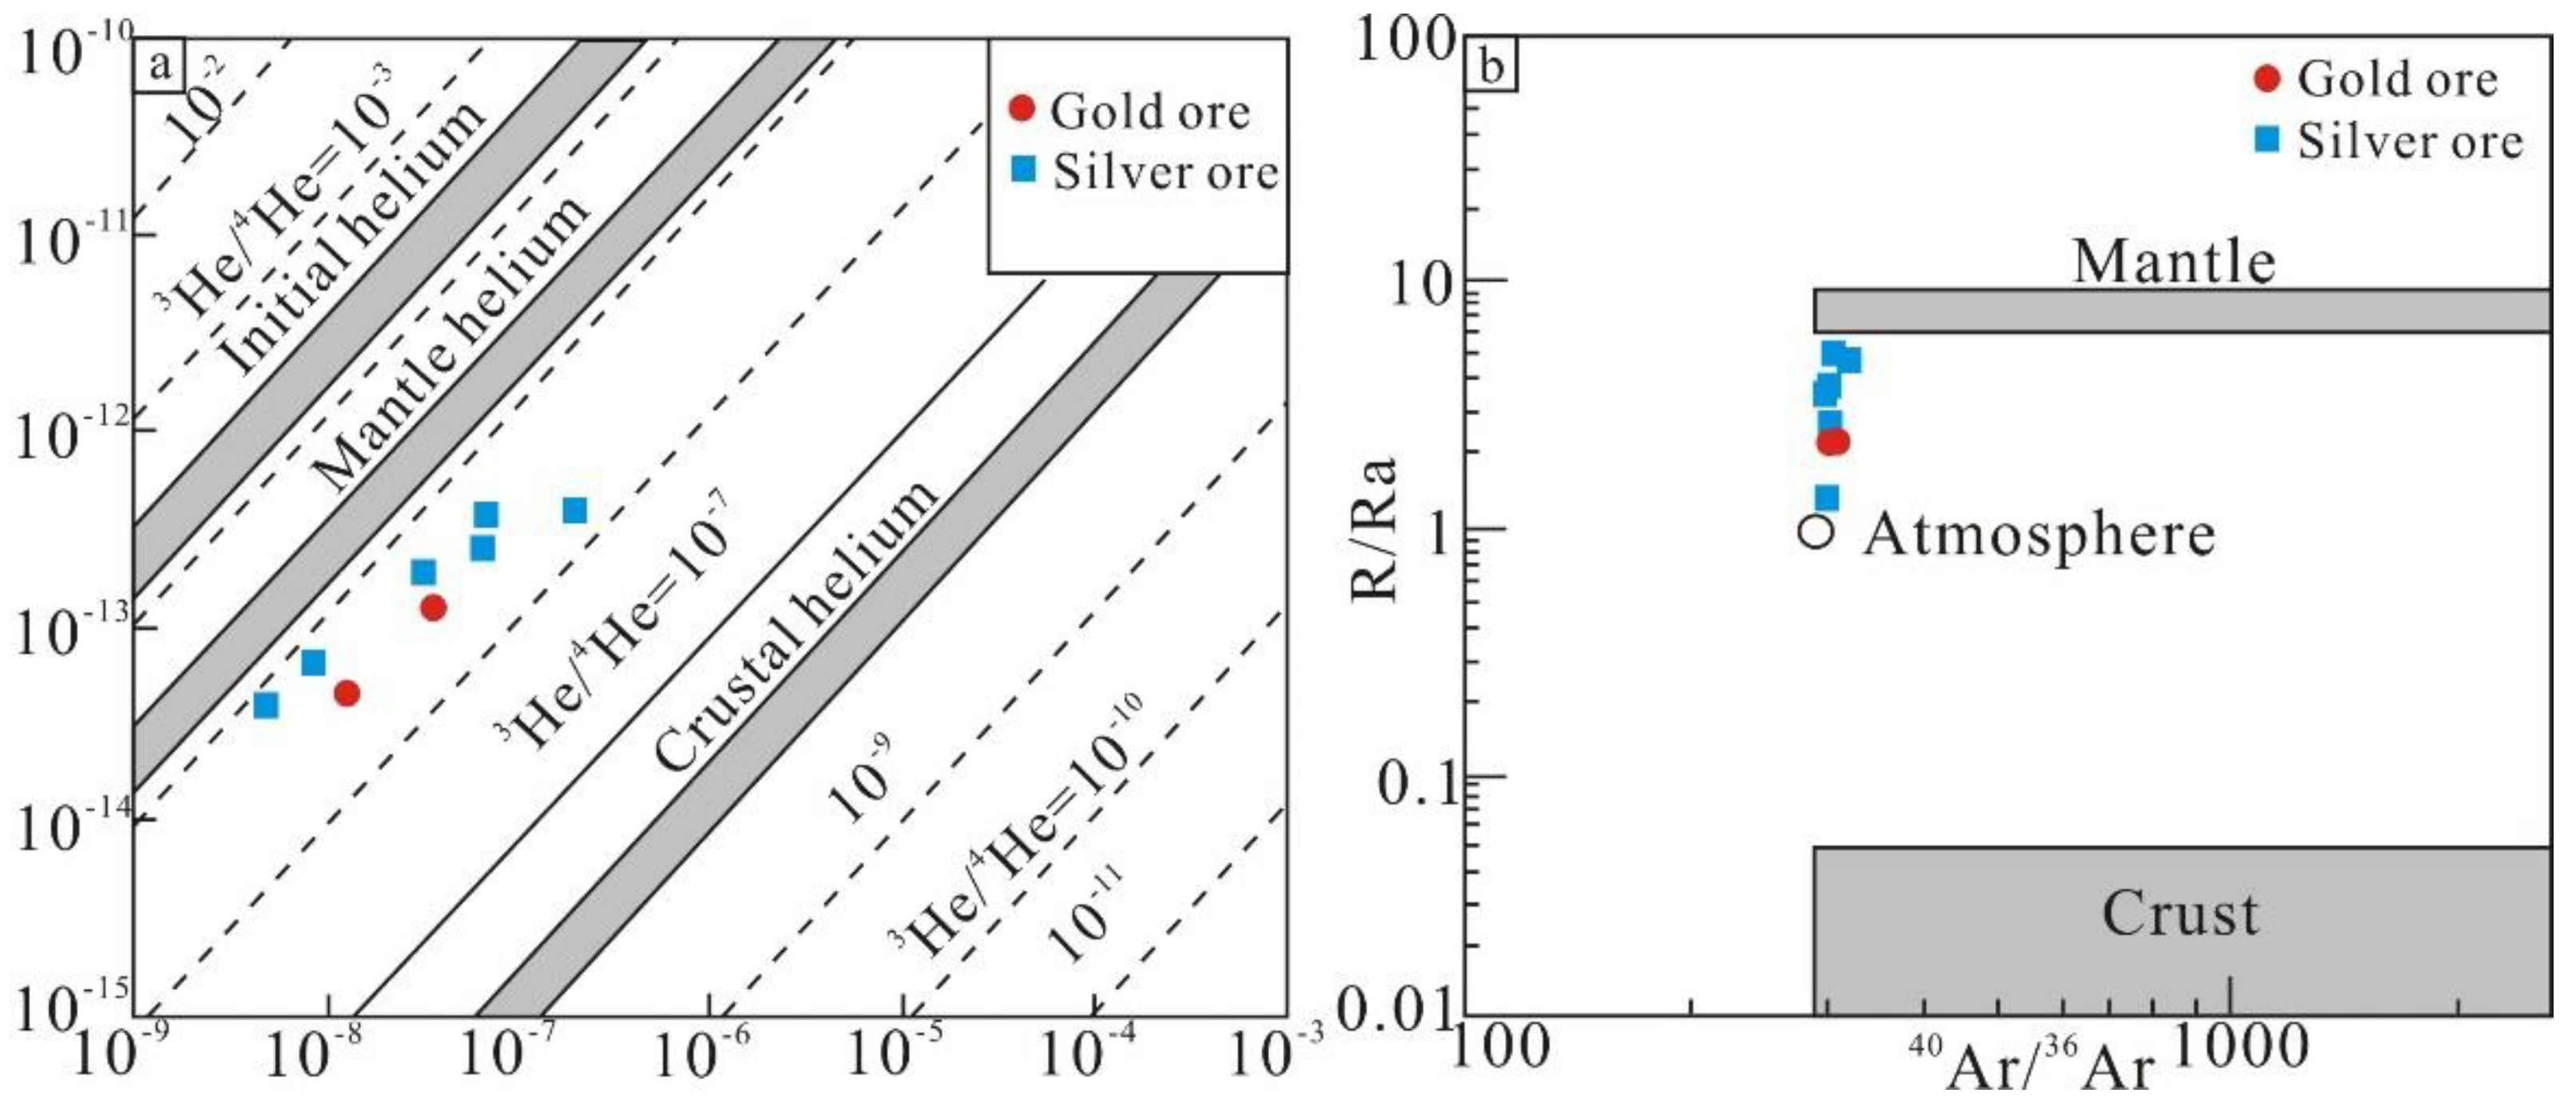
5.6. He and Ar Isotopes
5.7. C-O Isotopes
6. Discussion
6.1. Fluid Evolution
6.2. Source of Ore-Forming Fluids
6.3. Source of Ore-Forming Metals
6.4. Mineralization Zonation
6.5. Ore Deposition Mechanism and Genesis
7. Conclusions
Author Contributions
Funding
Data Availability Statement
Acknowledgments
Conflicts of Interest
References
- Li, H.; Kong, H.; Zhou, Z.K.; Wu, Q.H.; Xi, X.S.; Gabo-Ratio, J.A.S. Ore-forming metal sources of the Jurassic Cu–Pb–Zn mineralization in the Qin–Hang ore belt, South China: Constraints from S–Pb isotopes. Geochemistry 2019, 79, 280–306. [Google Scholar] [CrossRef]
- Wu, S.; Mao, J.; Xie, G.; Geng, J.; Xiong, B. Geology, geochronology, and Hf isotope geochemistry of the Longtougang skarn and hydrothermal vein Cu–Zn deposit, North Wuyi area, southeastern China. Ore Geol. Rev. 2015, 70, 136–150. [Google Scholar] [CrossRef]
- Ni, P.; Wang, G.G.; Cai, Y.T.; Zhu, X.T.; Yuan, H.X.; Huang, B.; Ding, J.Y.; Chen, H. Genesis of the late jurassic shizitou Mo deposit, South China: Evidences from fluid inclusion, H-O isotope and Re-Os geochronology. Ore Geol. Rev. 2017, 81, 871–883. [Google Scholar] [CrossRef]
- Zhou, Y.Z.; Zeng, C.Y.; Li, H.Z.; An, Y.F.; Lu, W.C.; Yang, Z.J.; Shen, W.J. Geological evolution and ore-prospecting targets in southern segment of Qinzhou Bay-Hangzhou Bay juncture orogenic belt, southern China. Geol. Bull. China 2012, 31, 486–491, (In Chinese with English Abstract). [Google Scholar]
- Wang, Y.J.; Fan, W.M.; Zhang, G.W.; Zhang, Y.H. Phanerozoic tectonics of the South China Block: Key observations and controversies. Gondwana Res. 2013, 23, 1273–1305. [Google Scholar] [CrossRef]
- Zheng, Y.; Zhou, Y.Z.; Wang, Y.J.; Shen, W.J.; Yang, Z.J.; Li, X.Y. A fluid inclusion study of the Hetai goldfield in the Qinzhou Bay–Hangzhou Bay metallogenic belt, South China. Ore Geol. Rev. 2016, 73, 346–353. [Google Scholar] [CrossRef]
- Jiao, Q.Q.; Deng, T.; Wang, L.X.; Xu, D.R.; Chi, G.X.; Chen, G.W.; Zou, S.H. Geochronological and mineralogical constraints on mineralization of the Hetai goldfield in Guangdong Province, South China. Ore Geol. Rev. 2017, 88, 655–673. [Google Scholar] [CrossRef]
- Jiao, Q.Q.; Wang, L.X.; Deng, T.; Xu, D.R.; Chen, G.W.; Yu, D.S.; Ye, T.W.; Gao, Y.W. Origin of the ore-forming fluids and metals of the Hetai goldfield in Guangdong Province of South China: Constraints from C-H-O-S-Pb-He-Ar isotopes. Ore Geol. Rev. 2017, 88, 674–689. [Google Scholar] [CrossRef]
- Wang, Y.; Fan, W.; Zhao, G.; Ji, S.; Peng, T. Zircon U–Pb geochronology of gneissic rocks in the Yunkai massif and its implications on the Caledonian event in the South China Block. Gondwana Res. 2007, 12, 404–416. [Google Scholar] [CrossRef]
- Mao, J.W.; Chen, M.H.; Yuan, S.D.; Guo, C.L. Geological characteristics of the Qinhang (or Shihang) metallogenic belt in South China and spatial-temporal distribution regularity of mineral deposit. Acta Geol. Sin. 2011, 85, 636–658, (In Chinese with English Abstract). [Google Scholar]
- Wang, C.H.; Zhang, C.Q.; Wang, Y.L.; Qiu, X.P. Chronological research of the Hetai gold mine in Gaoyao county, Guangdong Province. Geotecton. Metallog. 2012, 36, 427–433, (In Chinese with English Abstract). [Google Scholar]
- Wang, L.; Xu, D.M.; Zhang, K.; Hu, J.; Xiao, G.M.; Xu, J.Y. Geological and geochemical characteristics and metallogenic age of Huangnikeng gold deposit in western Guangdong Province. Miner. Depos. 2017, 36, 317–329, (In Chinese with English Abstract). [Google Scholar]
- Du, J.E.; Ma, C.H.; Wei, L. Geochemistry of Changkeng gold-silver deposit, Guangdong province. Guangdong Geolooy 1996, 11, 49–59, (In Chinese with English Abstract). [Google Scholar]
- Mao, X.D.; Liu, Y.H. Metallogenic model of Changkeng gold and silver deposit in Guangdong Province. Geol. Sci. Technol. Inf. 2004, 23, 82–86, (In Chinese with English Abstract). [Google Scholar]
- Liang, H.Y.; Xia, P.; Wang, X.Z.; Cheng, J.P.; Zhao, Z.H.; Liu, C.Q. Geology and geochemistry of the adjacent Changkeng gold and Fuwan silver deposit, Guangdong Province, South China. Ore Geol. Rev. 2007, 31, 304–318. [Google Scholar] [CrossRef]
- Zhang, S.; Li, T.J.; Wang, L.K. Geochemistry and genesis of the Changkeng large-superlarge gold-silver deposit, Guangdong province. Miner. Depos. 1998, 17, 125–134, (In Chinese with English Abstract). [Google Scholar]
- Zhuang, W.M.; Chen, G.N.; Lin, X.M.; Peng, Z.L.; Ma, H.M. Composition of oxygen isotopes and discussion on the formation of Changkeng Au-Ag deposit, Guangdong province. J. Jilin Univ. 2006, 36, 521–526, (In Chinese with English Abstract). [Google Scholar]
- Mao, X.D.; Wu, W.H.; Huang, S.J. Ore types mineral assemblage of the Changkeng Au-Ag deposit, Guangdong, south China. J. Chengdu Univ. Technol. 2007, 34, 7–14, (In Chinese with English Abstract). [Google Scholar]
- Zhang, W.H.; Lu, W.J.; Jiao, Y.Q.; Li, S.T. Composition and source study of ore-forming fluid in Changkeng gold-silver deposits, Guangdong province, China. Acta Petrol. Sin. 2000, 16, 521–527, (In Chinese with English Abstract). [Google Scholar]
- Mao, X.D.; Huang, S.J.; Liu, Y.H. Geochemical characters and significance of the fluid inclusions from the Changkeng-Fuwan gold-silver deposit, Guangdong province. J. Chengdu Univ. Technol. 2003, 30, 111–119, (In Chinese with English Abstract). [Google Scholar]
- Mao, X.D.; Huang, S.J. Characteristics of sulfur isotopes and its significance in Changkeng-Fuwan gold and silver deposit, Guagndong Province. Geol. Miner. Resour. South China 2002, 1, 17–22, (In Chinese with English Abstract). [Google Scholar]
- Mao, X.D.; Huang, S.J. Characteristics and significance of lead isotopes of ores from the Changkeng-Fuwan gold-silver deposit, Guagndong Province. Geol. Miner. Resour. South China 2003, 1, 27–32, (In Chinese with English Abstract). [Google Scholar]
- Liang, H.Y.; Wang, X.Z.; Cheng, J.P.; Xia, P.; Zhang, H.; Shan, Q. Rb-Sr dating and genesis of Changkeng-Fuwan superlarge silver deposit in west Guangdong. Sci. Geol. Sin. 2000, 35, 47–54, (In Chinese with English Abstract). [Google Scholar]
- Mao, X.D.; Huang, S.J.; Liu, Y.H. The metallogenic epoch of the Changkeng-Fuwan Au-Ag deposit in Guangdong Province. Prog. Nat. Sci. 2003, 13, 95–98, (In Chinese with English Abstract). [Google Scholar]
- Sun, X.M.; Chen, B.H. Hot spring genesis of the Chankeng gold-silver deposit in Guangdong province and its geological sig-nificance. Acta Sci. Nat. Univ. Sunyatseni 1995, 34, 131–133, (In Chinese with English Abstract). [Google Scholar]
- Deng, J.; Wang, Q. Gold mineralization in China: Metallogenic provinces, deposit types and tectonic framework. Gondwana Res. 2016, 36, 219–274. [Google Scholar] [CrossRef]
- Liu, Y.; Zhao, J.H.; Zhao, X.F.; Chen, H.M.; Luo, H.L. Texture and geochemistry of pyrite from the Gaoche gold deposit in South China: Implications of ore-forming processes. Ore Geol. Rev. 2020, 126, 103747. [Google Scholar] [CrossRef]
- Wang, C.; Shao, Y.J.; Evans, N.J.; Li, H.; Zhou, H.D.; Huang, K.X.; Liu, Z.F.; Chen, Y.; Lai, C.; Liu, Q.Q. Genesis of Zixi gold deposit in Xuefengshan, Jiangnan Orogen (South China): Age, geology and isotopic constraints. Ore Geol. Rev. 2020, 117, 103301. [Google Scholar] [CrossRef]
- Goldfarb, R.J.; Mao, J.W.; Qiu, K.F.; Goryachev, N. The great Yanshanian metallogenic event of eastern Asia: Consequences from one hundred million years of plate margin geodynamics. Gondwana Res. 2021, 100, 223–250. [Google Scholar] [CrossRef]
- Hao, Z.M.; Xiao, Y.M.; Du, H.F.; Wang, Q.; Chang, J.; Shen, L.J.; Lin, L. Geochemistry of the Cunqian ore-bearing porphyry from the eastern Qin-Hang metallogenic belt and its implication for tectonic setting and mineralization. Acta Petrol. Sin. 2016, 32, 2069–2085. [Google Scholar]
- Zhao, P.; Yuan, S.; Mao, J.; Santosh, M.; Li, C.; Hou, K. Geochronological and petrogeochemical constraints on the skarn deposits in Tongshanling ore district, southern Hunan Province: Implications for Jurassic Cu and W metallogenic events in South China. Ore Geol. Rev. 2016, 78, 120–137. [Google Scholar] [CrossRef]
- Li, H.; Yonezu, K.; Watanabe, K.; Tindell, T. Fluid origin and migration of the Huangshaping W–Mo polymetallic deposit, South China: Geochemistry and 40Ar/39Ar geochronology of hydrothermal K-feldspars. Ore Geol. Rev. 2017, 86, 117–129. [Google Scholar] [CrossRef]
- Zhao, W.W.; Zhou, M.F.; Li, Y.H.M.; Zhao, Z.; Gao, J.F. Genetic types, mineralization styles, and geodynamic settings of Mesozoic tungsten deposits in South China. J. Asian Earth Sci. 2017, 137, 109–140. [Google Scholar] [CrossRef]
- Zhao, P.L.; Yuan, S.D.; Yuan, Y.B. Geochemical characteristics of garnet in the Huangshaping polymetallic deposit, southern Hunan: Implications for the genesis of Cu and W-Sn mineralization. Acta Petrol. Sin. 2018, 34, 2581–2597. [Google Scholar]
- Zhang, G.W.; Guo, A.L.; Wang, Y.J.; Li, S.Z.; Dong, Y.P.; Liu, S.F. Tectonics of South China continent and its implications. Sci. China Earth Sci. 2013, 56, 1804–1828, (In Chinese with English Abstract). [Google Scholar] [CrossRef]
- Wang, L.X.; Zhao, Z.X.; Huang, Q.Y.; Xu, D.R.; Jiao, Q.Q.; Chen, G.W.; Cai, J.X.; Zou, S.H.; Teng, D.; Qiang, S. The genesis of gold deposit in the Hetai goldfield, South China: New constraints from geochronology, fluid inclusion, and multiple isotopic studies. Geol. J. 2019, 55, 2447–2472. [Google Scholar] [CrossRef]
- Deng, J.; Qiu, K.F.; Wang, Q.F.; Goldfarb, R.J.; Yang, L.Q.; Zi, J.W.; Geng, J.Z.; Ma, Y. In situ dating of hydrothermal monazite and implications for the geodynamic controls on ore formation in the Jiaodong gold province, eastern China. Econ. Geol. 2020, 115, 671–685. [Google Scholar] [CrossRef]
- Qiu, K.F.; Goldfarb, R.J.; Deng, J.; Yu, H.C.; Gou, Z.Y.; Ding, Z.J.; Wang, Z.K.; Li, D.P. Gold deposits of the Jiaodong Peninsula, eastern China. SEG Spec. Publ. 2020, 23, 753–773. [Google Scholar]
- Deng, J.; Yang, L.Q.; Groves, D.I.; Zhang, L.; Qiu, K.F.; Wang, Q.F. An integrated mineral system model for the gold deposits of the giant Jiaodong province, eastern China. Earth-Sci. Rev. 2020, 208, 103274. [Google Scholar] [CrossRef]
- Wan, Y.; Liu, D.; Wilde, S.A.; Cao, J.; Chen, B.; Dong, C. Evolution of the Yunkai Terrane, South China: Evidence from SHRIMP zircon U-Pb dating, geochemistry and Nd isotope. J. Asian Earth Sci. 2010, 37, 140–153. [Google Scholar] [CrossRef]
- Ni, J.L.; Liu, J.L.; Wang, J.C.; Tang, X.L.; Wang, Z.; Li, Z.S.; Li, D.P. Ductile shear deformation and gold mineralization in the Hetai goldfield of the Yunkai Massif, South China Block. Geol. J. 2019, 54, 929–945. [Google Scholar] [CrossRef]
- Jiao, Q.Q.; He, C.K.; Dong, Y.P.; Xu, D.R.; Chen, G.W.; Chen, C.; Shi, S.; Gao, Y.W. The petrogenetic links of Indosiniangranitoid and migmatite in the Hetai goldfield, Guangdong Province of South China and the tectonic implication. Acta Petrol. Sin. 2020, 36, 893–912. [Google Scholar]
- Wang, Y.J.; Fan, W.M.; Cawood, P.A.; Ji, S.C.; Peng, T.P.; Chen, X.Y. Indosinian high-strain deformation for the Yunkai-dashan tectonic belt, South China: Kinematics and 40Ar/39Ar geochronological constraints. Tectonics 2007, 26, 229–247. [Google Scholar] [CrossRef] [Green Version]
- Xu, X.B.; Zhang, Y.Q.; Jia, D.; Shu, L.S.; Wang, R.R. Early Mesozoic geotectonicprocesses in China. Geol. China 2009, 36, 573–593, (In Chinese with English Abstract). [Google Scholar]
- Shu, L.S. An analysis of principal features of tectonic evolution in South China Block. Geol. Bull. China 2012, 31, 1035–1053, (In Chinese with English Abstract). [Google Scholar]
- Cai, J.X. An early Jurassic dextral strike-slip system in southern South China and its tectonic significance. J. Geodyn. 2013, 63, 27–44. [Google Scholar] [CrossRef]
- Peng, S.B.; Jin, Z.M.; Liu, Y.H.; Fu, J.M.; He, L.Q.; Cai, M.H. Petrochemistry, chronology and tectonic setting of strong peraluminous anatectic granitoids in Yunkai Orogenic Belt, Western Guangdong Province, China. J. Earth Sci. 2006, 17, 1–12, (In Chinese with English Abstract). [Google Scholar] [CrossRef]
- Peng, S.B.; Wang, Y.; Wei, M.; Peng, T.; Liang, X. LA-ICPMS zircon U-Pb dating for three Indosinian Granitic plutons from Central Hunan and Western Guangdong Provinces and its petrogenetic implications. Acta Geol. Sin. 2006, 80, 660–669, (In Chinese with English Abstract). [Google Scholar]
- Zhai, W.; Yuan, G.; Li, Z.L.; Huang, D. U-Pb isotope age of zircons in gold-bearing quartz veins from the Hetai gold deposit, Western Guangdong, China: Constraints on the timing of gold metallogenesis. Geol. Rev. 2005, 51, 340–346, (In Chinese with English Abstract). [Google Scholar]
- Cai, M.; Zhan, M.; Peng, S.; Meng, X.; Liu, G. Study of Mesozoic metallogenic geological setting and dynamic mechanism in Yunkai area. Miner. Depos. 2002, 21, 264–269, (In Chinese with English Abstract). [Google Scholar]
- Du, J.E.; Ma, C.H.; Zhang, G.H. Mineralization characteristics of the Changkeng gold–silver deposit, Guangdong province. Guangdong Geol. 1993, 8, 1–8, (In Chinese with English Abstract). [Google Scholar]
- Wu, G.Y.; Liang, W.; Wei, L.; Li, X.Y. Geology feature and isotopic dating of Himalayan endogenetic mineralization in the Sanshui basin and its west margin, Guangdong Province. In Study on Himalayan Endogenic Mineralization; Chen, Y., Wang, D., Eds.; Seismic Press: Beijing, China, 2001; pp. 117–129. (In Chinese) [Google Scholar]
- Liu, B.; Shen, K. Thermodynamics of Fluid Inclusions; Geological Publishing House: Beijing, China, 1999. (In Chinese) [Google Scholar]
- Lu, H.Z.; Fan, H.R.; Ni, P.; Ou, G.X.; Shen, K.; Zhang, W.H. Fluid Inclusion; Science Press: Beijing, China, 2004; pp. 1–487. (In Chinese) [Google Scholar]
- Zhu, X.Q.; Wang, J.B.; Pang, Z.S.; Zhen, S.M.; Yang, F.; Xue, J.L.; Jia, H.X.; Shi, G.Y. Ore Geology, Fluid Inclusion Microthermometry and H-O-S Isotopes of the Liyuan Gold Deposit, Central Taihang Mountains, North China Craton. Minerals 2019, 9, 606. [Google Scholar] [CrossRef] [Green Version]
- Zhang, P.; Kou, L.L.; Yan, Z.; Bi, Z.W.; Sha, D.M.; Li, Z.M.; Han, P.P. Fluid inclusions, H-O, S, Pb, and noble gas isotope studies of the Baiyun gold deposit in the Qingchengzi orefield, NE China. J. Geochem. Explor. 2019, 200, 37–53. [Google Scholar] [CrossRef]
- Clayton, R.N.; Mayeda, T.K. The use of bromine pentafluoride in the extraction of oxygen from oxides and silicates for isotopic analysis. Geochim. Cosmochim. Acta 1963, 27, 43–52. [Google Scholar] [CrossRef]
- Coleman, M.L.; Sheppard, T.J.; Durham, J.J.; Rouse, J.E.; Moore, G.R. Reduction of water with zinc for hydrogen isotope analysis. Anal. Chem. 1982, 54, 993–995. [Google Scholar] [CrossRef]
- Li, C.; Love, G.D.; Lyons, T.W.; Fike, D.A.; Sessions, A.L.; Chu, X.L. A stratified redox model for the Ediacaran ocean. Science 2010, 328, 80–83. [Google Scholar] [CrossRef] [Green Version]
- Friedman, I.; O’Neil, J.R. Compilation of Stable Isotope Fractionation Factors of Geochemical Interest. Data of Geochemistry; United States Government Printing Office: Washington, DC, USA, 1977; pp. 1–12.
- Roedder, E. Fluid inclusions. Rev. Miner. 1984, 12, 644. [Google Scholar]
- Walrafen, G.E. Raman spectral studies of water structure. J. Chem. Phys. 1964, 40, 3249–3256. [Google Scholar] [CrossRef]
- Clayton, R.N.; O’Neil, J.R.; Mayeda, T.K. Oxygen isotope exchange between quartz and water. J. Geophys. Res. 1972, 77, 3057–3067. [Google Scholar] [CrossRef]
- Xia, P.; Zhang, H.; Wang, X.Z.; Cheng, J.P. Geological and geochemical characteristics and genesis of the siliceous rocks in the Changkeng gold-silver district. Geochemica 1996, 25, 129–139, (In Chinese with English Abstract). [Google Scholar]
- Guan, K.; Qiu, Y.S.; Yan, Z.Y. Geological characteristics and genesis of Changkeng gold deposit in Guangdong. J. Precious Met. Geol. 1997, 6, 27–37, (In Chinese with English Abstract). [Google Scholar]
- Stuart, F.M.; Burnard, P.G.; Taylor, R.P.; Turner, G. Resolving mantle and crustal contributions to ancient hydrothermal fluids: He-Ar isotopes in fluid inclusions from Dae Hwa W-Mo mineralisation, South Korea. Geochim. Cosmochim. Acta 1995, 59, 4663–4673. [Google Scholar] [CrossRef]
- Kendrick, M.A.; Burgess, R.; Pattrick, R.A.D.; Turner, G. Fluid inclusion noble gas and halogen evidence on the origin of Cu-Porphyry mineralising fluids. Geochim. Cosmochim. Acta 2001, 65, 2651–2668. [Google Scholar] [CrossRef]
- Chen, Y.J.; Chen, H.Y.; Zaw, K.; Pirajno, F.; Zhang, Z.J. Geodynamic settings and tectonic model of skarn gold deposit in China: An overview. Ore Geol. Rev. 2007, 31, 139–169. [Google Scholar] [CrossRef]
- Liu, T.; Xiong, S.F.; Jiang, S.Y.; Li, H.L.; Chen, Q.Z.; Jiang, H. Genesis of the Zhijiadi Ag-Pb-Zn Deposit, Central North China Craton: Constraints from Fluid Inclusions and Stable Isotope Data. Geofluids 2017, 2017, 4153618. [Google Scholar] [CrossRef] [Green Version]
- Taylor, H.P. The application of oxygen and hydrogen isotope studies to problems of hydrothermal alteration and ore deposition. Econ. Geol. 1974, 69, 843–883. [Google Scholar] [CrossRef]
- Wilkinson, J.J. Fluid inclusions in hydrothermal ore deposit. Lithos 2001, 55, 229–272. [Google Scholar] [CrossRef]
- Richards, J.P.; Bray, C.J.; Channer, D.D.; Spooner, E.T.C. Fluid chemistry and processes at the Porgera gold deposit, Papua New Guinea. Miner. Depos. 1997, 32, 119–132. [Google Scholar] [CrossRef]
- Lotfia, F.; Belkabira, A.; Brunetb, S.; Brownc, A.C.; Marcouxd, E. Lithogeochemical, mineralogical analyses and oxygen-hydrogen isotopes of the Hercynian Koudiat Aïcha massive sulphide deposit, Morocco. J. Afr. Earth Sci. 2010, 56, 150–166. [Google Scholar] [CrossRef] [Green Version]
- Wagner, T.; Mlynarczyk, M.S.J.; Williams-Jones, A.E.; Boyce, A.J. Stable isotope constraints on ore formation at the San Rafael Tin-Copper Deposit, Southeast Peru. Econ. Geol. 2009, 104, 223–248. [Google Scholar] [CrossRef]
- Qiu, K.F.; Yu, H.C.; Deng, J.; McIntire, D.; Gou, Z.Y.; Geng, J.Z.; Chang, Z.S.; Zhu, R.; Li, K.N.; Goldfarb, R.J. The giant Zaozigou orogenic Au-Sb deposit in West Qinling, China: Magmatic or metamorphic origin? Miner. Depos. 2020, 55, 345–362. [Google Scholar] [CrossRef]
- Long, Z.Y.; Qiu, K.F.; Santosh, M.; Yu, H.C.; Jiang, X.Y.; Zou, L.Q.; Tang, D.W. Fingerprinting the metal source and cycling of the world’s largest antimony deposit in Xikuangshan, China. GSA Bull. 2022. [Google Scholar] [CrossRef]
- Qiu, K.F.; Yu, H.C.; Hetherington, C.; Huang, Y.Q.; Yang, T.; Deng, J. Tourmaline composition and boron isotope signature as a tracer of magmatic-hydrothermal processes. Mineralogis 2021, 106, 1033–1044. [Google Scholar] [CrossRef]
- Wang, L.Q.; Tang, J.X.; Cheng, W.B.; Chen, W.; Zhang, Z.; Lin, X.; Luo, M.C.; Yang, C. Origin of the ore-forming fluids and metals of the Bangpu porphyry Mo–Cu deposit of Tibet, China: Constraints from He-Ar, H-O, S and Pb isotopes. J. Asian Earth Sci. 2015, 103, 276–287. [Google Scholar] [CrossRef]
- Simmons, S.F.; Sawkins, F.J.; Schlutter, D.J. Mantle-derived helium in two Peruvian hydrothermal ore deposit. Nature 1987, 329, 429–432. [Google Scholar] [CrossRef]
- Burnard, P.G.; Hu, R.Z.; Turner, G.; Bi, X.W. Mantle, crustal and atmospheric noble gases in Ailaoshan gold deposit, Yunnan province, China. Geochim. Cosmochim. Acta 1999, 63, 1595–1604. [Google Scholar] [CrossRef]
- Shen, J.F.; Santosh, M.; Li, S.R.; Li, C.P.; Zhang, J.Q.; Zhang, S.Q.; Alam, M.; Wang, Y.H.; Xu, K.X. He-Ar, S, Pb and O isotope geochemistry of the Dabaiyang gold deposit: Implications for the relationship between gold metallogeny and destruction of the North China Craton. Ore Geol. Rev. 2020, 116, 103229. [Google Scholar] [CrossRef]
- Li, N.; Yang, F.Q.; Zhang, Z.X. Fluid inclusions and isotope (C, H, O, S, He, and Ar) study of the Xiaobaishitou skarn W–(Mo) deposit, East Tianshan, NW China. Ore Geol. Rev. 2020, 122, 103520. [Google Scholar] [CrossRef]
- Yang, C.D.; Zhang, B.; Yang, F.Q.; Li, Q.; Wang, W.Q. Zircon u–pb age, fluid inclusion, and H–C–O–He–Ar–S isotopic compositions as an index to the VMS-type mineralization: A case study from the Wulasigou polymetallic deposit, Altay Orogenic Belt, Northwest China. J. Geochem. Explor. 2020, 222, 106720. [Google Scholar] [CrossRef]
- Zeng, Q.D.; He, H.Y.; Zhu, R.X.; Zhang, S.; Wang, Y.B.; Su, F. Origin of ore-forming fluids of the Haigou gold deposit in the eastern Central Asian Orogenic belt, NE China: Constraints from H-O-He-Ar isotopes. J. Asian Earth Sci. 2017, 144, 384–397. [Google Scholar] [CrossRef]
- Mamyin, B.A.; Tolstikhin, I.N. Helium Isotopes in Nature; Elsevier Pnb. Company: Amsterdam, The Netherlands, 1984; p. 273. [Google Scholar]
- Ohmoto, H. Stable isotope geochemistry of ore deposits. Rev. Miner. Geochem. 1986, 16, 491–559. [Google Scholar]
- Branam, T.D.; Ripley, E.M. Genesis of sediment-hosted copper mineralization in south-central Kansas: Sulfur/carbon and sulfur isotope systematics. Econ. Geol. 1990, 85, 601–621. [Google Scholar] [CrossRef]
- Du, L.J.; Li, B.; Huang, Z.L.; Zhou, J.X.; Zou, G.F.; Yan, Z.F. Carbon-oxygen isotopic geochemistry of the Yangla Cu skarn deposit, SW China: Implications for the source and evolution of hydrothermal fluids. Ore Geol. Rev. 2017, 88, 809–821. [Google Scholar] [CrossRef]
- Deines, P. Stable isotope variations in carbonatites. In Carbonatites: Genesis and Evolution; Bell, K., Ed.; Unwin Hyman: London, UK, 1989; pp. 301–359. [Google Scholar]
- Veizer, J.; Hoefs, J. The nature of 18O/16O and 13C/12C secular trends in sedimentary carbonate rocks. Geochim. Cosmochim. Acta 1976, 40, 1387–1395. [Google Scholar] [CrossRef]
- Zheng, Y.F.; Hoefs, J. Carbon and oxygen isotopic covariations in hydrothermal calcites. Miner. Depos. 1993, 28, 79–89. [Google Scholar] [CrossRef]
- Liu, J.J.; Zheng, M.H.; Cook, N.J.; Long, X.R.; Deng, J.; Zhai, Y.S. Geological and geochemical characteristics of the Sawaya’erdun gold deposit, southwestern Chinese Tianshan. Ore Geol. Rev. 2007, 32, 125–156. [Google Scholar] [CrossRef]
- Xue, Y.; Campbell, I.; Ireland, T.R.; Holden, P.; Armstrong, R. No mass-independent S isotope fractionation in auriferous fluids supports a magmatic origin for Archean gold deposit. Geology 2013, 41, 791–794. [Google Scholar] [CrossRef]
- Selvaraja, V.; Caruso, S.; Fiorentini, M.L.; LaFlamme, C.; Bui, T.H. Atmospheric sulfur in the orogenic gold deposit of the Archaean Yilgarn Craton. Geology 2017, 45, 691–694. [Google Scholar]
- Liang, J.L.; Li, J.; Sun, W.D.; Zhao, J.; Zhai, W.; Huang, Y.; Song, M.C.; Ni, S.J.; Xiang, Q.R.; Zhang, J.C.; et al. Source of ore-forming fluids of the Yangshan gold field, western Qinling orogen, China: Evidence from microthermometry, noble gas isotopes and in situ sulfur isotopes of Au-carrying pyrite. Ore Geol. Rev. 2019, 105, 404–422. [Google Scholar] [CrossRef]
- Xu, R.; Li, W.C.; Deng, M.G.; Zhou, J.X.; Ren, T.; Yu, H.J. Genesis of the superlarge Luziyuan Zn-Pb-Fe(-Cu) distal skarn deposit in western Yunnan (SW China): Insights from ore geology and C-H-O-S isotopes. Ore Geol. Rev. 2019, 104, 944–959. [Google Scholar] [CrossRef]
- Qiu, K.F.; Taylor, R.D.; Song, Y.H.; Yu, H.C.; Song, K.R.; Li, N. Geologic and geochemical insights into the formation of the Taiyangshan porphyry copper-molybdenum deposit, western Qinling orogenic belt, China. Gondwana Res. 2016, 35, 40–58. [Google Scholar] [CrossRef]
- Qiu, K.F.; Marsh, E.; Yu, H.C.; Pfaff, K.; Gulbransen, C.; Gou, Z.Y.; Li, N. Fluid and metal sources of the Wenquan porphyry molybdenum deposit, Western Qinling, NW China. Ore Geol. Rev. 2017, 86, 459–473. [Google Scholar] [CrossRef] [Green Version]
- Kesler, S.E.; Riciputi, L.C.; Ye, Z. Evidence for a magmatic origin for Carlin-type gold deposits: Isotopic composition of sulfur in the Betze-Post-Screamer Deposit, Nevada, USA. Miner. Depos. 2005, 40, 127–136. [Google Scholar] [CrossRef] [Green Version]
- Chang, Z.; Large, R.R.; Maslennikov, V. Sulfur isotopes in sediment-hosted orogenic gold deposits: Evidence for an early timing and a seawater sulfur source. Geology 2008, 36, 971–974. [Google Scholar] [CrossRef] [Green Version]
- Ma, J.; Lü, X.; Escolme, A.; Li, S.; Zhao, N.; Cao, X.; Zhang, L.J.; Lu, F. In-situ sulfur isotope analysis of pyrite from the Pangjiahe gold deposit: Implications for variable sulfur sources in the north and south gold belt of the South Qinling orogen. Ore Geol. Rev. 2018, 98, 38–61. [Google Scholar] [CrossRef]
- Ohmoto, H.; Rye, R. Isotopes of sulfur and carbon. In Geochemistry of Hydrothermal Ore Deposit; Barnes, H.L., Ed.; John Wiley & Sons Inc.: New York, NY, USA, 1979; pp. 509–567. [Google Scholar]
- Rye, R.O. The evolution of magmatic fluids in the epithermal environment: The stable isotope perspective. Econ. Geol. 1993, 88, 733–752. [Google Scholar] [CrossRef]
- Kouhestani, H.; Ghaderi, M.; Chang, Z.; Zaw, K. Constraints on the ore fluids in the Chah Zard breccia-hosted epithermal Au–Ag deposit, Iran: Fluid inclusions and stable isotope studies. Ore Geol. Rev. 2015, 65, 512–521. [Google Scholar] [CrossRef]
- Yilmaz, H.; Oyman, T.; Arehart, G.B.; Colakoglu, A.R.; Billor, Z. Low-sulfidation type Au–Ag mineralization at Bergama, Izmir, Turkey. Ore Geol. Rev. 2007, 32, 81–124. [Google Scholar] [CrossRef]
- Yuan, M.W.; Li, S.R.; Li, C.L.; Santosh, M.; Alam, M.; Zeng, Y.J. Geochemical and isotopic composition of auriferous pyrite from the Yongxin gold deposit, Central Asian Orogenic Belt: Implication for ore genesis. Ore Geol. Rev. 2018, 93, 255–267. [Google Scholar] [CrossRef]
- Yang, L.; Wang, Q.; Large, R.R.; Mukherjee, I.; Deng, J.; Li, H.; Yu, H.; Wang, X. Fluid source and metal precipitation mechanism of sediment-hosted Chang’an orogenic gold deposit, SW China: Constraints from sulfide texture, trace element, S, Pb, and He-Ar isotopes and calcite C-O isotopes. Am. Mineral. 2021, 106, 410–429. [Google Scholar] [CrossRef]
- Wang, Z.; Zhang, X.; Liu, Q.; Shao, Y.; Wu, S.; Pan, Z.; Chen, M.; Zhang, Y.; Wu, H. Genesis of the Lishupo gold deposit in the Jiangnan Orogen, NE Hunan (South China): Biotite Ar-Ar, zircon U-Pb ages and H-O-S-Pb isotopic constraints. Ore Geol. Rev. 2022, 145, 104890. [Google Scholar] [CrossRef]
- Zhu, B.Q. Theory and Application of Isotope System in Geoscience; Science Press: Beijing, China, 1998; p. 224. (In Chinese) [Google Scholar]
- Wei, R.; Wang, Y.T.; Mao, J.W.; Hu, Q.J.; Qin, S.T.; Liu, S.Y.; Ye, D.J.; Yuan, Q.H.; Dou, P. Genesis of the Changba–Lijiagou Giant Pb-Zn Deposit, West Qinling, Central China: Constraints from S-Pb-C-O isotopes. Acta Geol. Sin. 2020, 94, 884–900. [Google Scholar] [CrossRef]
- Zartman, R.E.; Doe, B.R. Plumbotectonics—The model. Tectonophysics 1981, 75, 135–162. [Google Scholar] [CrossRef]
- Xue, J.L.; Pang, Z.S.; Ye, T.Z.; Zhen, S.M.; Tao, W.; Yang, T.T. Study of metallogenic regularity and prospecting prediction of gold deposit in China. Earth Sci. Front. 2017, 24, 1–14, (In Chinese with English Abstract). [Google Scholar]
- Ye, T.Z.; Lv, Z.C.; Pang, Z.S. Theory and Method of Prospecting Prediction in Exploration Area (General Introduction); Geological Publishing House: Beijing, China, 2014; pp. 362–404. (In Chinese) [Google Scholar]
- Zhang, D.H. Geochemistry of Ore-Forming Processes; Geological Publishing House: Beijing, China, 2015; pp. 85–100. (In Chinese) [Google Scholar]
- Wang, D.H.; Chen, Y.C.; Li, J.W.; Wei, L.; Li, X.Y.; Li, C.J. Ore-forming epoch of Hengjiang Pb-Zn-Cu deposit on western margin of Sanshui basin, Guangdong province, and its significance in prospecting for Cenozoic copper deposit. Miner. Depos. 2006, 25, 10–16, (In Chinese with English Abstract). [Google Scholar]
- Railsback, L.B. An Earth scientist’s periodic table of the element and their ions. Geology 2003, 31, 737–740. [Google Scholar] [CrossRef]
- Barnes, H.L. “Solubilities of Ore Minerals” in Geochemistry of Hydrothermal Ore Deposits; Wiley: New York, NY, USA, 1979; pp. 404–460. [Google Scholar]
- Brimhall, G.H.; Crerar, D.A. Ore fluids: Magmatic to supergene. Rev. Mineral. Geochem. 1987, 17, 235–321. [Google Scholar]
- Li, T.G.; Wu, G.; Liu, J.; Wang, G.R.; Hu, Y.Q.; Zahng, Y.F.; Luo, D.F.; Mao, Z.H.; Xu, B. Geochronology, fluid inclusions and isotopic characteristics of the Chaganbulagen Pb–Zn–Ag deposit, Inner Mongolia, China. Lithos 2016, 261, 340–355. [Google Scholar] [CrossRef]
- Einaudi, M.T.; Hedenquist, J.W.; Inan, E.E. Chapter 15: Sulfidation state of fluids in active and extinct hydrothermal systems: Transitions from porphyry to epithermal environments. In Special Publication of Society of Economic Geologists, No. 10: Volcanic, Geothermal, and Ore-Forming Fluids: Rulers and Witnesses of Processes within the Earth; Simmons, S.F., Graham, I., Eds.; Society of Economic Geologists: Littleton, CO, USA, 2003; pp. 285–313. [Google Scholar]
- Sillitoe, R.H.; Hedenquist, J.W. Chapter 16: Linkages between volcanotectonic settings, ore-fluid compositions, and epithermal precious metal deposit. In Special Publication of Society of Economic Geologists, No. 10: Volcanic, Geothermal, and Ore-Forming Fluids: Rulers and Witnesses of Processes within the Earth; Simmons, S.F., Graham, I., Eds.; Society of Economic Geologists: Littleton, CO, USA, 2003; pp. 315–343. [Google Scholar]
- Rajabpour, S.; Jiang, S.Y.; Lehmann, B.; Abedini, A.; Gregory, D.D. Fluid inclusion and O-H-C isotopic, constraints on the origin and evolution of ore-forming fluids of the Cenozoic volcanic-hosted Kuh-Pang copper deposit, Central Iran. Ore Geol. Rev. 2018, 94, 277–289. [Google Scholar] [CrossRef]
- Goldfarb, R.J.; Qiu, K.F.; Deng, J.; Chen, Y.J.; Yang, L.Q. Orogenic gold deposits of China. SEG Spec. Publ. 2019, 22, 263–324. [Google Scholar]
- Cooke, D.R.; Simmons, S.F. Characteristics and genesis of epithermal gold deposits. Rev. Econ. Geol. 2000, 13, 221–244. [Google Scholar]
- Simmons, S.F.; White, N.C.; John, D.A. Geological characteristics of epithermal precious and base metal deposits. In Economic Geology 100th Anniversary Volume; Hedenquist, J.W., Thompson, J.F.H., Goldfarb, R.J., Richards, J.P., Eds.; Society of Economic Geologists: Littleton, CO, USA, 2005; pp. 485–522. [Google Scholar]


| Orebody | Host Mineral | Stage | Type | N | Size/μm | Th/°C | Tm-ice/°C | wt.%NaCl.eqv | |
|---|---|---|---|---|---|---|---|---|---|
| Range | Range | Range | Mean | ||||||
| Gold orebody | Quartz | Early | L + V | 49 | 4–10 | 223–282 | 245 | −6.6–−1.2 | 6.1 |
| Quartz | Middle | L + V | 46 | 3–8 | 187–231 | 204 | −6.5–−1.1 | 5.3 | |
| Calcite | Late | L + V | 49 | 3–6 | 158–211 | 184 | −1.8–−0.2 | 1.4 | |
| Silver orebody | Quartz | Early | L + V | 48 | 4–12 | 210–289 | 236 | −8.0–−2.0 | 7.4 |
| Quartz | Middle | L + V | 49 | 5–14 | 180–232 | 206 | −6.5–−1.1 | 7.3 | |
| Sphalerite | Middle | L + V | 17 | 6–14 | 187–230 | 209 | −8.8–−2.2 | 7.0 | |
| Calcite | Late | L + V | 36 | 4–10 | 146–203 | 176 | −1.0–−0.1 | 0.7 | |
| Orebody | Sample | Mineral | Stage | Th (°C) | δ18OV-SMOW % | δ18OH2O % | δDV-SMOW % | Reference |
|---|---|---|---|---|---|---|---|---|
| Gold orebody | CKP31-1 | Quartz | I | 238 | 12 | 2.46 | −72.6 | This study |
| CKP5-3 | Quartz | I | 240 | 11.6 | 2.16 | −56.5 | ||
| CKP11-1 | Quartz | II | 201 | 12.3 | 0.67 | −84.1 | ||
| CKP2-3 | Quartz | II | 208 | 10.5 | −0.7 | −65.7 | ||
| G0305-7 | Quartz | III | 178 | 13.8 | 0.64 | −57 | [20] | |
| G0405-9 | Quartz | III | 178 | 11 | −2.16 | −78 | ||
| G0406-19 | Quartz | III | 178 | 11.8 | −1.36 | −60 | ||
| G3210 | Quartz | III | 187 | 11.9 | −1.26 | −46 | ||
| Silver orebody | CKP16-2 | Quartz | I | 263 | 8.8 | 0.44 | −87.7 | This study |
| CKP32-17 | Quartz | I | 242 | 10.7 | 1.36 | −55.3 | ||
| CKP22-1 | Quartz | I | 242 | 10.7 | 1.36 | −65.3 | ||
| CKP34-20 | Quartz | I | 242 | 11.4 | 2.06 | −60.1 | ||
| CKP5-5 | Quartz | I | 242 | 12.3 | 2.96 | −77.7 | ||
| CKP31-3 | Quartz | I | 242 | 13 | 3.66 | −79.5 | ||
| CKP11-2 | Quartz | II | 224 | 8.9 | −1.38 | −77.1 | ||
| CKP17-2 | Quartz | II | 209 | 12.2 | 1.06 | −66.6 | ||
| CKP14-2 | Quartz | II | 208 | 12.4 | 1.2 | −67 | ||
| CKP36-4 | Quartz | II | 208 | 12.1 | 0.9 | −89.6 | ||
| CKP33-23 | Quartz | III | 203 | 11.6 | 0.09 | −64.8 |
| Sample | Mineral | δ34SV-CDT(‰) | Reference |
|---|---|---|---|
| ck-19 | Pyrite | −0.3 | [64] |
| ck-38 | Pyrite | −5.2 | |
| ck-147 | Pyrite | −5.3 | |
| ck-55 | Stibnite | −3.9 | |
| ck-33 | Stibnite | 2.3 | |
| ck-39 | Stibnite | 0.8 | |
| ck-145 | Stibnite | 2.2 | |
| G0802-8 | Pyrite | −2.2 | [65] |
| G0802-9 | Pyrite | −1.9 | |
| G0001-5 | Pyrite | −5.8 | |
| G0405-12 | Pyrite | −0.8 | |
| K01-1 | Pyrite | −3.1 | |
| CKZK-1 | Pyrite | −2.2 | [21] |
| CK-5 | Stibnite | 2.01 | |
| N334 | Stibnite | −1.23 | |
| CK-25 | Stibnite | −1.95 | |
| CKIA-4 | Stibnite | −0.56 | |
| CK-10 | Realgar | 3.67 | |
| CK-92C | Realgar | 4.62 | |
| C-T21 | Pyrite | −3.14 | [13] |
| C-T22 | Pyrite | −1.57 | |
| C-T27 | Pyrite | 8.73 | |
| C-T10 | Pyrite | 1.46 | |
| C-T12 | Pyrite | 1.33 | |
| C-T4 | Realgar | 3.93 | |
| C-T8 | Stibnite | 1.47 | |
| C-T3 | Stibnite | 0.11 | |
| C-T2 | Stibnite | −0.45 | |
| ckp13-1 | Realgar | 5.3 | This study |
| ckp6-9 | Realgar | 1.3 | |
| ckp8-6 | Pyrite | 1.2 |
| Sample | δ34SV-CDT(‰) | Reference | ||
|---|---|---|---|---|
| Pyrite | Sphalerite | Galena | ||
| CK-94 | 2.7 | 2.4 | [64] | |
| CK-95 | 4.6 | 4.1 | ||
| CK-156 | 1.7 | 2.1 | ||
| CK-157 | 2.4 | 3.2 | ||
| CK-160 | 3.8 | 3.7 | ||
| CK-34 | −2.3 | |||
| C-T13 | 7.39 | 4.04 | [13] | |
| C-T15 | 4.77 | 0.09 | ||
| L-1 | 6.41 | 3.15 | 5.61 | |
| CH-15S | 4.82 | [16] | ||
| CH-21S | −6.14 | |||
| CH-14S | 4.2 | 0.07 | ||
| CH-5S | 5.75 | 1.91 | ||
| CH-11S | 4.72 | 3.16 | 3.5 | |
| CKZK2403-6(1) | 4.89 | 4.76 | 2.28 | [21] |
| CKZK3209-2 | 3.27 | |||
| CKZK4401-1 | 4.07 | |||
| CKZK2403-4(1) | 5.29 | |||
| CKZK3206-4(1) | 4.95 | 3.34 | 1.24 | |
| CKZK3206-4(3) | 4.99 | |||
| CKZK1001-3 | 1.59 | 3.38 | 2.33 | |
| CKZK4401-3(1) | 4.39 | 1.5 | ||
| ckp14-2 | 3.6 | This study | ||
| ckp22-5 | −2.7 | |||
| ckp34-1 | −2.4 | |||
| ckp22-4 | −8.7 | |||
| ckp5-5 | −3.8 | |||
| ckp29-3 | 3.6 | |||
| Orebody | Sample | Mineral | 206Pb/204Pb | 207Pb/204Pb | 208Pb/204Pb | Reference |
|---|---|---|---|---|---|---|
| Au orebody | CK-32 | Pyrite | 19.092 | 15.797 | 39.075 | [16] |
| CK-38 | Pyrite | 18.832 | 15.728 | 39.002 | ||
| CH-3S | Pyrite | 18.737 | 15.736 | 39.177 | ||
| CK-33 | stibnite | 18.58 | 15.672 | 38.7 | ||
| CKZK-1 | Pyrite | 18.996 | 15.705 | 38.987 | [22] | |
| CK-28 | Pyrite | 18.945 | 15.73 | 39.035 | ||
| CK-5 | stibnite | 19.14 | 15.727 | 38.914 | ||
| CK-25 | stibnite | 18.883 | 15.706 | 39.032 | ||
| CK-92C | Realgar | 18.666 | 15.708 | 39.024 | ||
| ckp13-1 | Pyrite | 18.706 | 15.767 | 39.124 | This study | |
| ckp8-6 | Pyrite | 18.477 | 15.678 | 38.842 | ||
| Ag orebody | CK-156 | Galena | 18.845 | 15.902 | 39.69 | [64] |
| CK-160 | Galena | 18.834 | 15.848 | 39.657 | ||
| CK-157 | Galena | 18.851 | 15.873 | 39.658 | ||
| CK-95 | Galena | 18.891 | 15.914 | 39.786 | ||
| CK-94 | Galena | 18.82 | 15.848 | 39.579 | ||
| CH-15S | Pyrite | 18.871 | 15.941 | 39.854 | ||
| CH-14S | Galena | 18.702 | 15.687 | 39.015 | ||
| CH-5S | Galena | 18.887 | 15.682 | 38.991 | ||
| CH-6S | Galena | 18.825 | 15.86 | 39.561 | ||
| ZK2403-6 | Galena | 18.713 | 15.72 | 39.087 | [22] | |
| ZK2403-6 | Sphalerite | 18.768 | 15.796 | 39.335 | ||
| ZK2403-6 | Pyrite | 18.667 | 15.685 | 38.997 | ||
| ZK3209-2 | Sphalerite | 18.72 | 15.725 | 39.119 | ||
| ZK4401-1 | Sphalerite | 18.704 | 15.715 | 39.118 | ||
| ZK2403-4 | Sphalerite | 18.932 | 15.936 | 39.698 | ||
| ZK3206-4 | Galena | 18.835 | 15.867 | 39.596 | ||
| ZK3206-4 | Sphalerite | 18.716 | 15.718 | 39.099 | ||
| ZK3206-4 | Pyrite | 18.772 | 15.787 | 39.33 | ||
| ZK1001-3 | Galena | 18.935 | 15.951 | 39.804 | ||
| ZK1001-3 | Pyrite | 18.596 | 15.746 | 39.095 | ||
| ZK4401-3 | Galena | 18.722 | 15.73 | 39.124 | ||
| ZK4401-3 | Sphalerite | 18.841 | 15.882 | 39.627 | ||
| ckp22-5 | Pyrite | 18.745 | 15.752 | 39.207 | This study | |
| ckp29-3 | Sphalerite | 18.797 | 15.823 | 39.448 | ||
| ckp5-5 | Pyrite | 18.762 | 15.742 | 39.209 |
| Sample | Mineral | 3He | 4He | 40Ar | 3He/4He | R/Ra | 40Ar/36Ar | 38Ar/36Ar |
|---|---|---|---|---|---|---|---|---|
| ckp8-6 | Pyrite, Au ore | 1.26 × 10⁻¹³ | 3.65 × 10⁻⁸ | 2.77 × 10⁻⁸ | 3.45 × 10⁻⁶ | 2.46 | 304.6 | 0.182 |
| ckp13-1 | Pyrite, Au ore | 4.55 × 10⁻¹⁴ | 1.30 × 10⁻⁸ | 2.22 × 10⁻⁷ | 3.50 × 10⁻⁶ | 2.5 | 300.2 | 0.179 |
| ckp22-5 | Pyrite, Ag ore | 3.90 × 10⁻¹³ | 1.97 × 10⁻⁷ | 3.00 × 10⁻⁷ | 1.98 × 10⁻⁶ | 1.41 | 295.9 | 0.175 |
| ckp33-23 | Sphalerite, Ag ore | 3.69 × 10⁻¹³ | 6.75 × 10⁻⁸ | 3.60 × 10⁻⁸ | 5.47 × 10⁻⁶ | 3.91 | 295.6 | 0.186 |
| ckp36-4 | Sphalerite, Ag ore | 3.95 × 10⁻¹⁴ | 4.94 × 10⁻⁹ | 5.50 × 10⁻⁸ | 7.99 × 10⁻⁶ | 5.70 | 302.5 | 0.223 |
| ckp19-2 | Sphalerite, Ag ore | 6.52 × 10⁻¹⁴ | 8.70 × 10⁻⁹ | 2.35 × 10⁻⁸ | 7.49 × 10⁻⁶ | 5.35 | 314.7 | 0.226 |
| ckp28-23 | Galena, Ag ore | 1.86 × 10⁻¹³ | 3.20 × 10⁻⁸ | 1.16 × 10⁻⁷ | 5.81 × 10⁻⁶ | 4.15 | 298.1 | 0.198 |
| ckp34-12 | Pyrite, Ag ore | 2.49 × 10⁻¹³ | 6.45 × 10⁻⁸ | 2.66 × 10⁻⁸ | 3.86 × 10⁻⁶ | 2.76 | 298.7 | 0.218 |
| Sample | Mineral | δ13CV-PDB‰ | δ18OV-PDB‰ | δ18OV-SMOW‰ |
|---|---|---|---|---|
| ckp33-1 | Calcite, the late stage of Au ore | −0.7 | −11.6 | 18.9 |
| ckp33-6 | +1.3 | −11.2 | 19.4 | |
| ckp8-6 | +1.2 | −17.2 | 13.2 | |
| ckp10-4 | Calcite, the late stage of Ag ore | −0.1 | −17.6 | 12.8 |
| ckp16-2 | −1.2 | −13.2 | 17.3 | |
| ckp24-2 | +1.0 | −18.4 | 11.9 | |
| ckp25-1 | −0.3 | −17.1 | 13.2 | |
| ckp26-3 | −0.7 | −18.4 | 11.9 | |
| ckp34-9 | +1.5 | −15 | 15.4 |
Publisher’s Note: MDPI stays neutral with regard to jurisdictional claims in published maps and institutional affiliations. |
© 2022 by the authors. Licensee MDPI, Basel, Switzerland. This article is an open access article distributed under the terms and conditions of the Creative Commons Attribution (CC BY) license (https://creativecommons.org/licenses/by/4.0/).
Share and Cite
Shi, G.; Xue, J.; Zhu, X.; Pang, Z.; Wang, X.; Yang, F.; Jepson, G.; Tao, W.; Zhen, S. Ore Genesis of the Changkeng–Fuwan Au-Ag Deposit in Central Guangdong, South China: Evidence from Fluid Inclusions and C-H-O-S-Pb-He-Ar Isotopes. Minerals 2022, 12, 799. https://doi.org/10.3390/min12070799
Shi G, Xue J, Zhu X, Pang Z, Wang X, Yang F, Jepson G, Tao W, Zhen S. Ore Genesis of the Changkeng–Fuwan Au-Ag Deposit in Central Guangdong, South China: Evidence from Fluid Inclusions and C-H-O-S-Pb-He-Ar Isotopes. Minerals. 2022; 12(7):799. https://doi.org/10.3390/min12070799
Chicago/Turabian StyleShi, Guangyao, Jianling Xue, Xiaoqiang Zhu, Zhenshan Pang, Xueqiu Wang, Fan Yang, Gilby Jepson, Wen Tao, and Shimin Zhen. 2022. "Ore Genesis of the Changkeng–Fuwan Au-Ag Deposit in Central Guangdong, South China: Evidence from Fluid Inclusions and C-H-O-S-Pb-He-Ar Isotopes" Minerals 12, no. 7: 799. https://doi.org/10.3390/min12070799