Article

Evaluation of Rheology Measurements Techniques for Pressure Loss in Mine Paste Backfill Transportation

1
Mining Engineering Department, King Abdulaziz University, Jeddah 21589, Saudi Arabia
2
Mining and Materials Engineering Department, McGill University, Montreal, QC H3A2A7, Canada
*
Authors to whom correspondence should be addressed.
Minerals 2022, 12(6), 678; https://doi.org/10.3390/min12060678
Submission received: 29 March 2022 / Revised: 18 May 2022 / Accepted: 24 May 2022 / Published: 27 May 2022

Abstract

:
Understanding the rheology behavior of non-Newtonian mine paste backfill is critical to ensure its flowability in the pipeline distribution system. Several rheology measurements methods for paste backfill have been proposed in the literature to quantify the rheology properties. However, there is no definite conclusion on the best measurement method to correctly predict pressure loss in the paste backfill pipeline system with a high solid concentration. This study addresses the issue by comparing several rheology measurements techniques, i.e., coaxial rheometer with various configurations, vane viscometer, and slump and pipe loop tests, with regard to Bingham yield stress, Bingham plastic viscosity, and pressure loss using statistical analysis. The paste backfill samples are prepared from two different mine tailings: finer and coarser particles. The pressure loss from the pipe loop test along with Buckingham-Reiner transformation using the Darcy-Weisbach equation are used as reference properties. The results suggest that a simple slump test can accurately predict the Bingham yield stress for coarser tailing. At the same time, a coaxial rheometer with MVDIN cup is found to predict the Bingham paste properties accurately for finer tailing.

1. Introduction

Paste backfill is used in underground mines to fill voids left by previously mined stopes and is transported via pipelines. Rheology is among the most important properties in the paste backfill to determine its transportability and flowability. Rheometry is a general term that comprises the measurement of rheological properties, while viscometry is specific to viscosity measurements. In non-Newtonian fluids, the viscosity is dependent on both shear stress and shear rate and is termed apparent viscosity η . Unlike Newtonian fluids, multiple rheological parameters are required to define the relationship between shear stress and shear rate for a non-Newtonian fluid.
Benzaazoua et al., 2004 [1] classifies two types of parameters that influence mechanical properties of pastefill: (i) macroscopic properties that include all phenomena occurring at the scale of a stope filled with pastefill and its interaction with adjacent rock such as pastefill–rock interface, drainage, and cracks; and (ii) microscopic properties that include the pastefill components (tailings, water, and binder) and their changes during the curing process.
Paste backfill, a yield-stress fluid, can be characterized as a Herschel-Bulkley fluid [2,3]. However, Herschel-Bulkley being a three-parameter model, is complicated to solve, and the non-Newtonian Bingham plastic model is more commonly used [4,5]. Two material properties of consequence for the design of paste backfill flow are yield stress and plastic viscosity. When the yield stress of a Bingham fluid is exceeded by applying stress, the fluid flows as an accurate viscous material with a finite viscosity. Of the numerous methods available to determine rheology, vane rheometer and slump tests are commonly used to determine yield stress. In contrast, cup and bob viscometer and flow loop tests are employed to determine both yield stress and plastic viscosity. The history of these tests and their development are discussed below.
The cup and bob viscometer setup involves a cylindrical bob rotating inside a coaxial cylindrical cup with the test material placed in the annulus between the two. The measurement is the torque required to rotate the bob at an angular velocity and this data is related to the shear stress and shear rate. The shear-stress-shear-rate rheogram is then related to the preferred non-Newtonian fluid models to determine the yield stress and plastic viscosity.
A disadvantage experienced with the cup and bob viscometer is the potential for the development of plug flow on the wall of the cup. At low shear rates, the shear stress close to the bob will be sufficiently higher than the critical yield stress, but near the cup, it may be below the point. This results in the development of a solid plug while the bob rotates. The annulus between the cup and bob can be minimized as much as possible to overcome this. Another possible error in this method is the development of slip due to the cylinder’s smooth surface and a small gap between cup and bob. When testing a multiphase fluid such as paste backfill, phase separation along the cylinder wall leads to wall slip [6,7]. The flow near the cylinder wall moves easily and forms a lubrication layer. The particle concentration is zero near the wall and rises rapidly away from the wall until it reaches the bulk concentration. This phenomenon of lower concentration is called wall depletion or slip and is about five particle diameters thick.
Some studies proposed roughening the cylindrical walls or profiling the wall with cylindrical grooves at right angles to the direction of shear to eliminate slip effects [7,8,9,10]. Increasing the gap between cup and bob is believed to reduce the slip effects at the wall as well [11].
Krieger and Maron, 1952 [12], claimed that in an infinite cup, the material in the cup does not behave as a fluid throughout. A solid-like behavior is seen in regions where the shear stress experienced is below the yield point. Jacobsen, 1974 [13], found the yield point of a fluid in an infinite medium by evaluating from the bob to the critical radius was the same as that proposed by Krieger and Maron, 1952 [12], who evaluated from the bob to the cup.
Zengeni et al., 2012 [14], claimed the cup and bob method to be unreliable for yield stresses above 100 Pa. They proposed a method to measure the rheology by using a bob in an infinite cup that is at least twice the diameter of the bob and twice the height of the bob. They compared their results with the conventional cup and bob, vane in an infinite cup and a pipe loop test. They found close agreement at low viscosity mixtures and lesser agreement as the solid concentration increased.
The vane was first used in soil mechanics to measure shear strength [15,16], and has since been adapted as a reliable technique for yield-stress measurement in high concentration non-Newtonian slurries [6,17].
The vane rheometer consists of a star-shaped impeller that is designed to eliminate slip between the sample fluid and the vane geometry. The study by Saak et al., 2001 [18] on the influence of wall slip in cement pastes claimed that concentric cylinders suffer from a slip during yield-stress measurements due to the formation of a slip layer at the walls of the cylinders as the shear stress approaches the yield point. The vane eliminates this since shearing occurs within the material and not at the walls. When the vane rotates, the material in between the blades is trapped within a circular cylinder confined by the blades’ tips. The shear stress is evenly distributed over the cylinder surface and the rotating vane behaves like a solid cylinder without slip [19].
Liddel and Boger, 1996 [20], studied the effects of rotational speed in a stress-controlled and rate-controlled mode for yield-stress measurement using vane. They noticed an upper limit for the rotational speed, beyond which the measured yield stress increased with increasing rotational speed. This was because the network bonds holding the fluid together stretches beyond its elastic limit and pulls apart rapidly without a possibility for relaxation at high speeds. Mizani and Simms, 2016, [21] compared yield stresses from different rheometric techniques. They found some consistency when increasing shear stress and shear rate for a 90–125 Pa value and larger discrepancies by lowering them.
Chandler, 1986, [22] first adapted the slump test to cylindrical geometries but fell short in giving an analytical relationship between slump height and yield stress. Since then, numerous works have been carried out to provide relationships between slump height and yield stress for different mold geometries and materials [23,24]. Pashias et al., 1996, [25] developed a technique to determine yield stress for high-volume fraction-concentrated mine tailings using cylindrical frustums for slump tests. They conducted slump tests on three suspensions and related them to values obtained from rotational vane tests arriving at an expression to predict yield stress. Chao et al., 2020, [26] found that the slump reduced as the solid content increased, while the cement to tailing ratio was kept constant. Niu et al., 2022, [27] used machine learning to predict the rheological parameters of paste backfill. Wu et al., 2022, [28] reviewed the characteristics and rheology of cemented paste backfill. One of their conclusions is that a standard for measuring the rheological properties of paste backfill should be established. Dikonda et al., 2021, [29] evaluated the effect of specific mixing energy to the rheological properties of paste backfill. Silva et al., 2021, [30] compared slump, flow table spread, fall cone, and vane technique to measure the rheological properties of paste backfill. They concluded that the fall cone test resulted in best correlation measurement of dry content and of yield-stress measurements using a viscometer and rheometer.
Researchers have turned their attention to validating slump experiments numerically using computational fluid dynamics in recent years. Roussel and Coussot, 2005, [31] compared the slump results from the ASTM mini cone with numerical simulations. They could predict experimental results with good agreement for the range of yield stresses tested, assuming a pure shear flow with neglected inertia effects. They further state that their results hold good for a yield-stress material that can be considered a continuum. The presence of a granular phase makes the rheological analysis of slump or spread test in terms of a single intrinsic constitutive equation impossible [32]. The cylindrical and conical slump tests concluded that the cylinder accurately predicts the material yield stress while being less mathematically intensive. They also compared the yield-stress values with vane test results for dimensionless yield-stress values above 0.2 (dimensionless slump values less than 0.25) and observed that the yield-stress value increased with an increase in cylinder heights. They concluded this phenomenon was because both slump and yield-stress values were converted to dimensionless quantities by dividing with mold height H and a change in height will affect both quantities.
Bouvet et al., 2010, [33] used a numerical approach to study the global flow behavior of Portland cement pastes. They suggested that surface tension effects were significant for low yield-stress fluids. At yield stresses above 20 Pa, they observed less agreement between spread and yield stress. Gao and Fourie, 2015, [34,35] conducted tests on low viscosity and yield-stress kaolin pastes and observed spread to be a more effective means of determining yield stress over the slump. They concluded from numerical simulations at different mold-lifting velocities that the lifting velocity had a greater impact on the slump than the spread. They claimed this effect is less significant in high viscosity and yield-stress materials. However, this is in contradiction to previous sensitivity tests carried out that indicated that the slump is independent of lift rate [
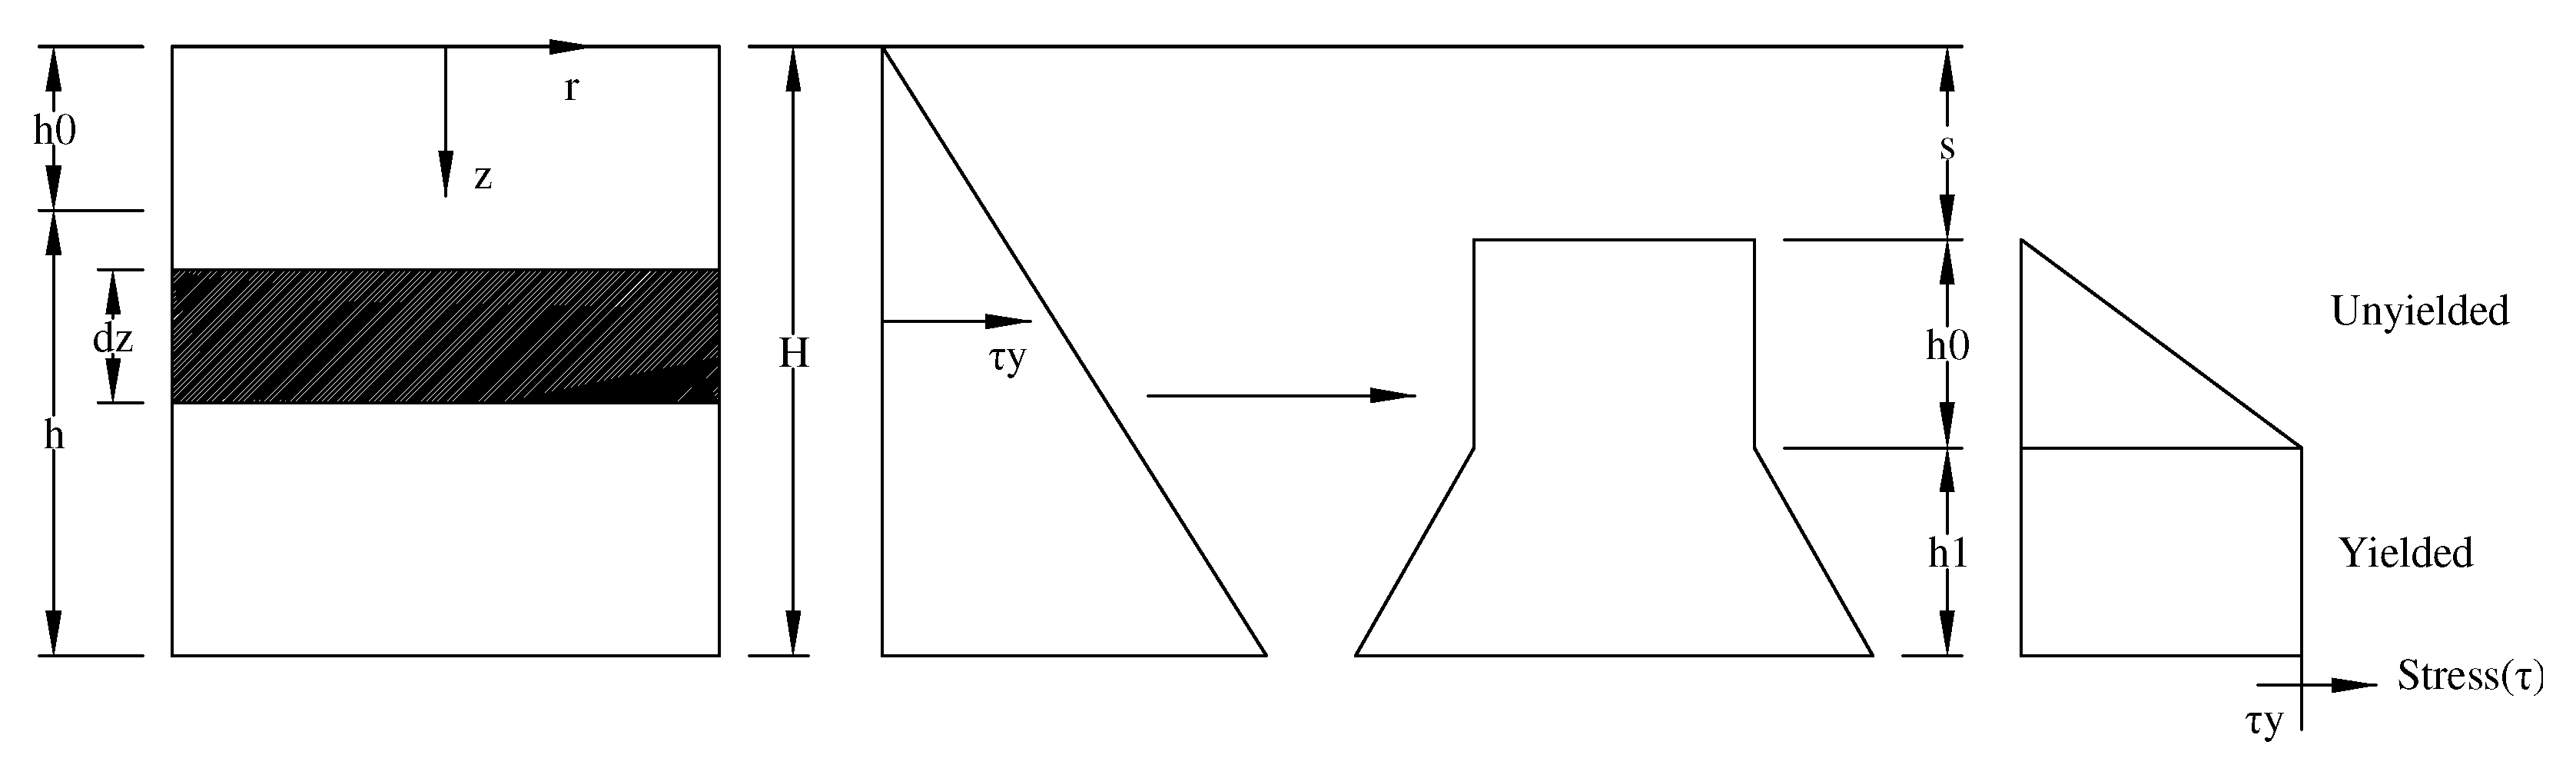
32]. In our study, we assume the lift velocity of the mold does not affect the slump and ignore the effects of inertia and viscosity. For high-viscosity and yield-stress fluids such as paste backfill, the yielding regions in the sample stop flowing when the Von mises yield criterion is met and the unyielded regions keep their initial shape [31].
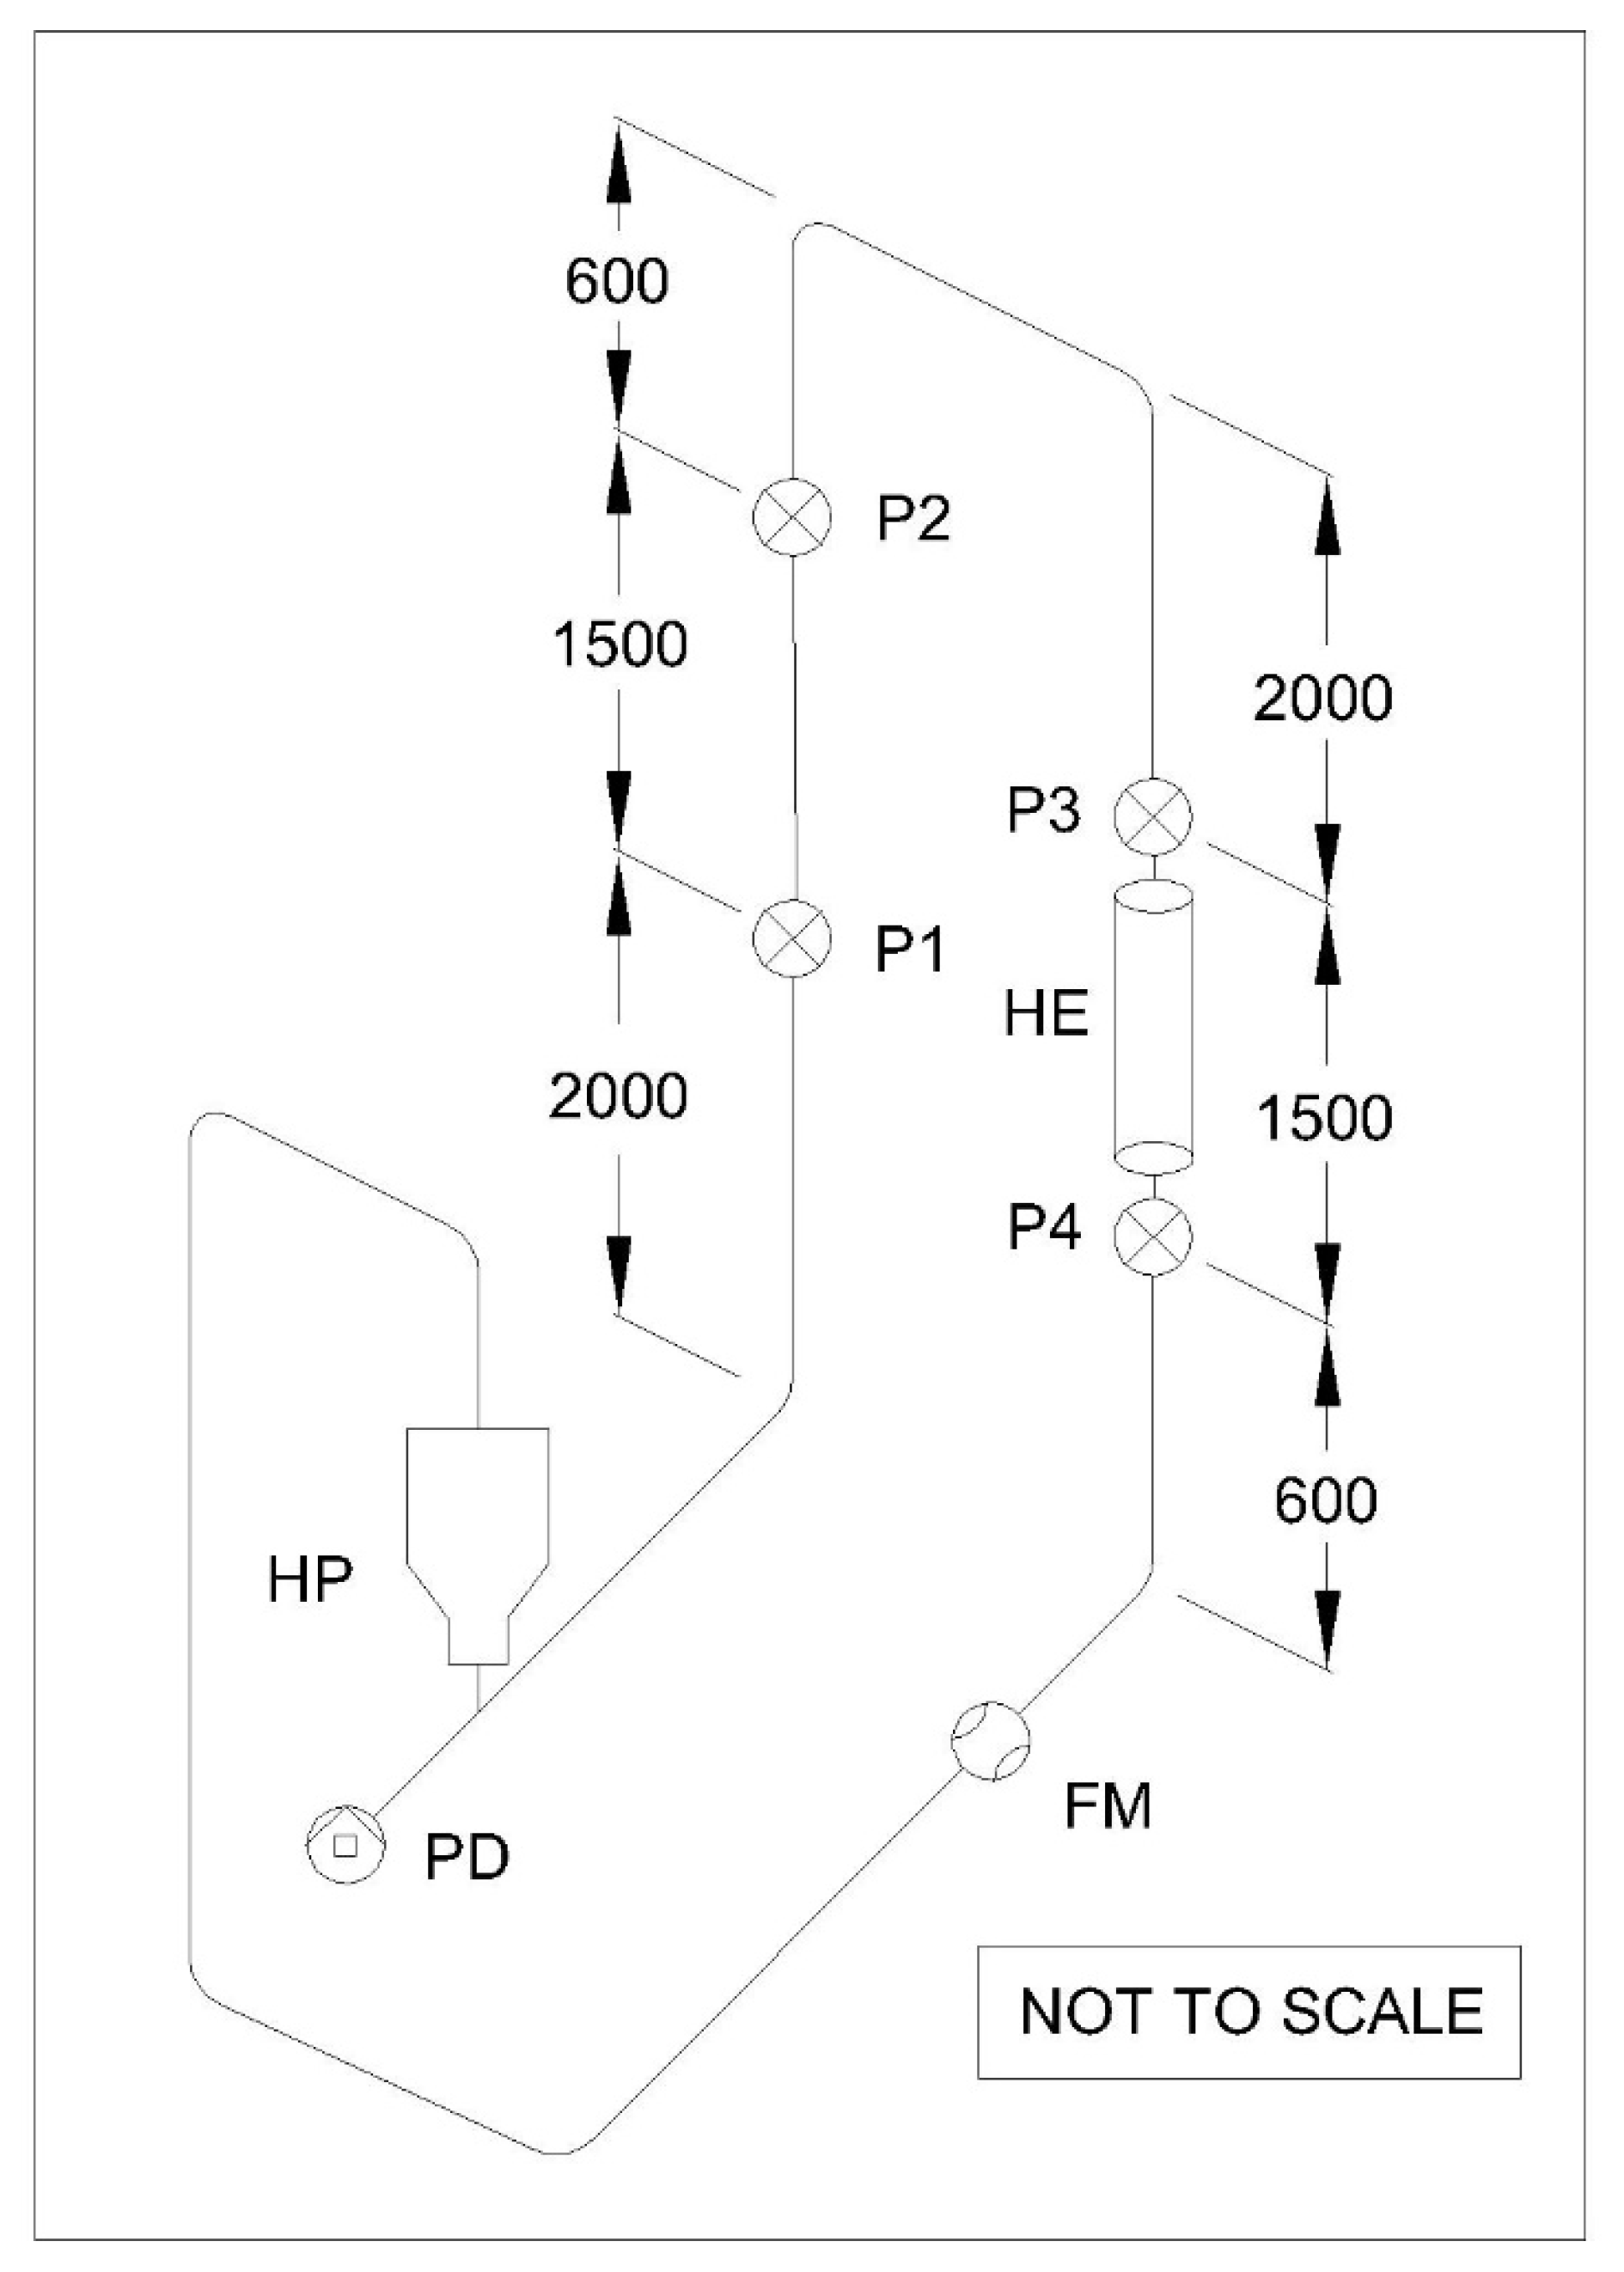
The flow pipe loop test is a small-scale laboratory-level experiment performed to measure the pressure drop across closed loop pipelines. The pressure drop is used to determine the wall shear stress developed during the flow. In combination with the Buckingham–Reiner transformation and Darcy-Weisbach equation for shear rate, the yield stress and plastic viscosity for a non-Newtonian fluid can be determined. This method is highly accurate but is not widely used due to the expensive nature of the experimental setup.
Over the years, this test has been adopted for determining rheological properties of cemented paste backfill or other non-Newtonian fluids by predicting pressure drop in pipelines and through regression analysis at various solid concentrations and mineral compositions. Wang et al., 2004, [36] conducted tests to determine the rheology of cemented tailings from a Chinese nickel mine. They found good agreement between the regression curve developed through mathematical relationships and test results by assuming the fluid to be Bingham. Senapati and Mishra, 2012, [37] studied the rheology of high concentration fly ash-bottom ash mixture slurry in pipelines using the power-law model. They found a good agreement between the predicted pressure loss and experimental values. Recently, Wu et al. [38] conducted flow loop tests with cemented coal gangue-fly ash backfill (CGFB) and studied the effects of solid concentration, ratios of different components to pressure drop and transportability. Wu et al. [39] conducted flow loop tests to study the effects of volumetric flow rate, pipe diameter, and solid concentration. They found good agreement with their CFD results.
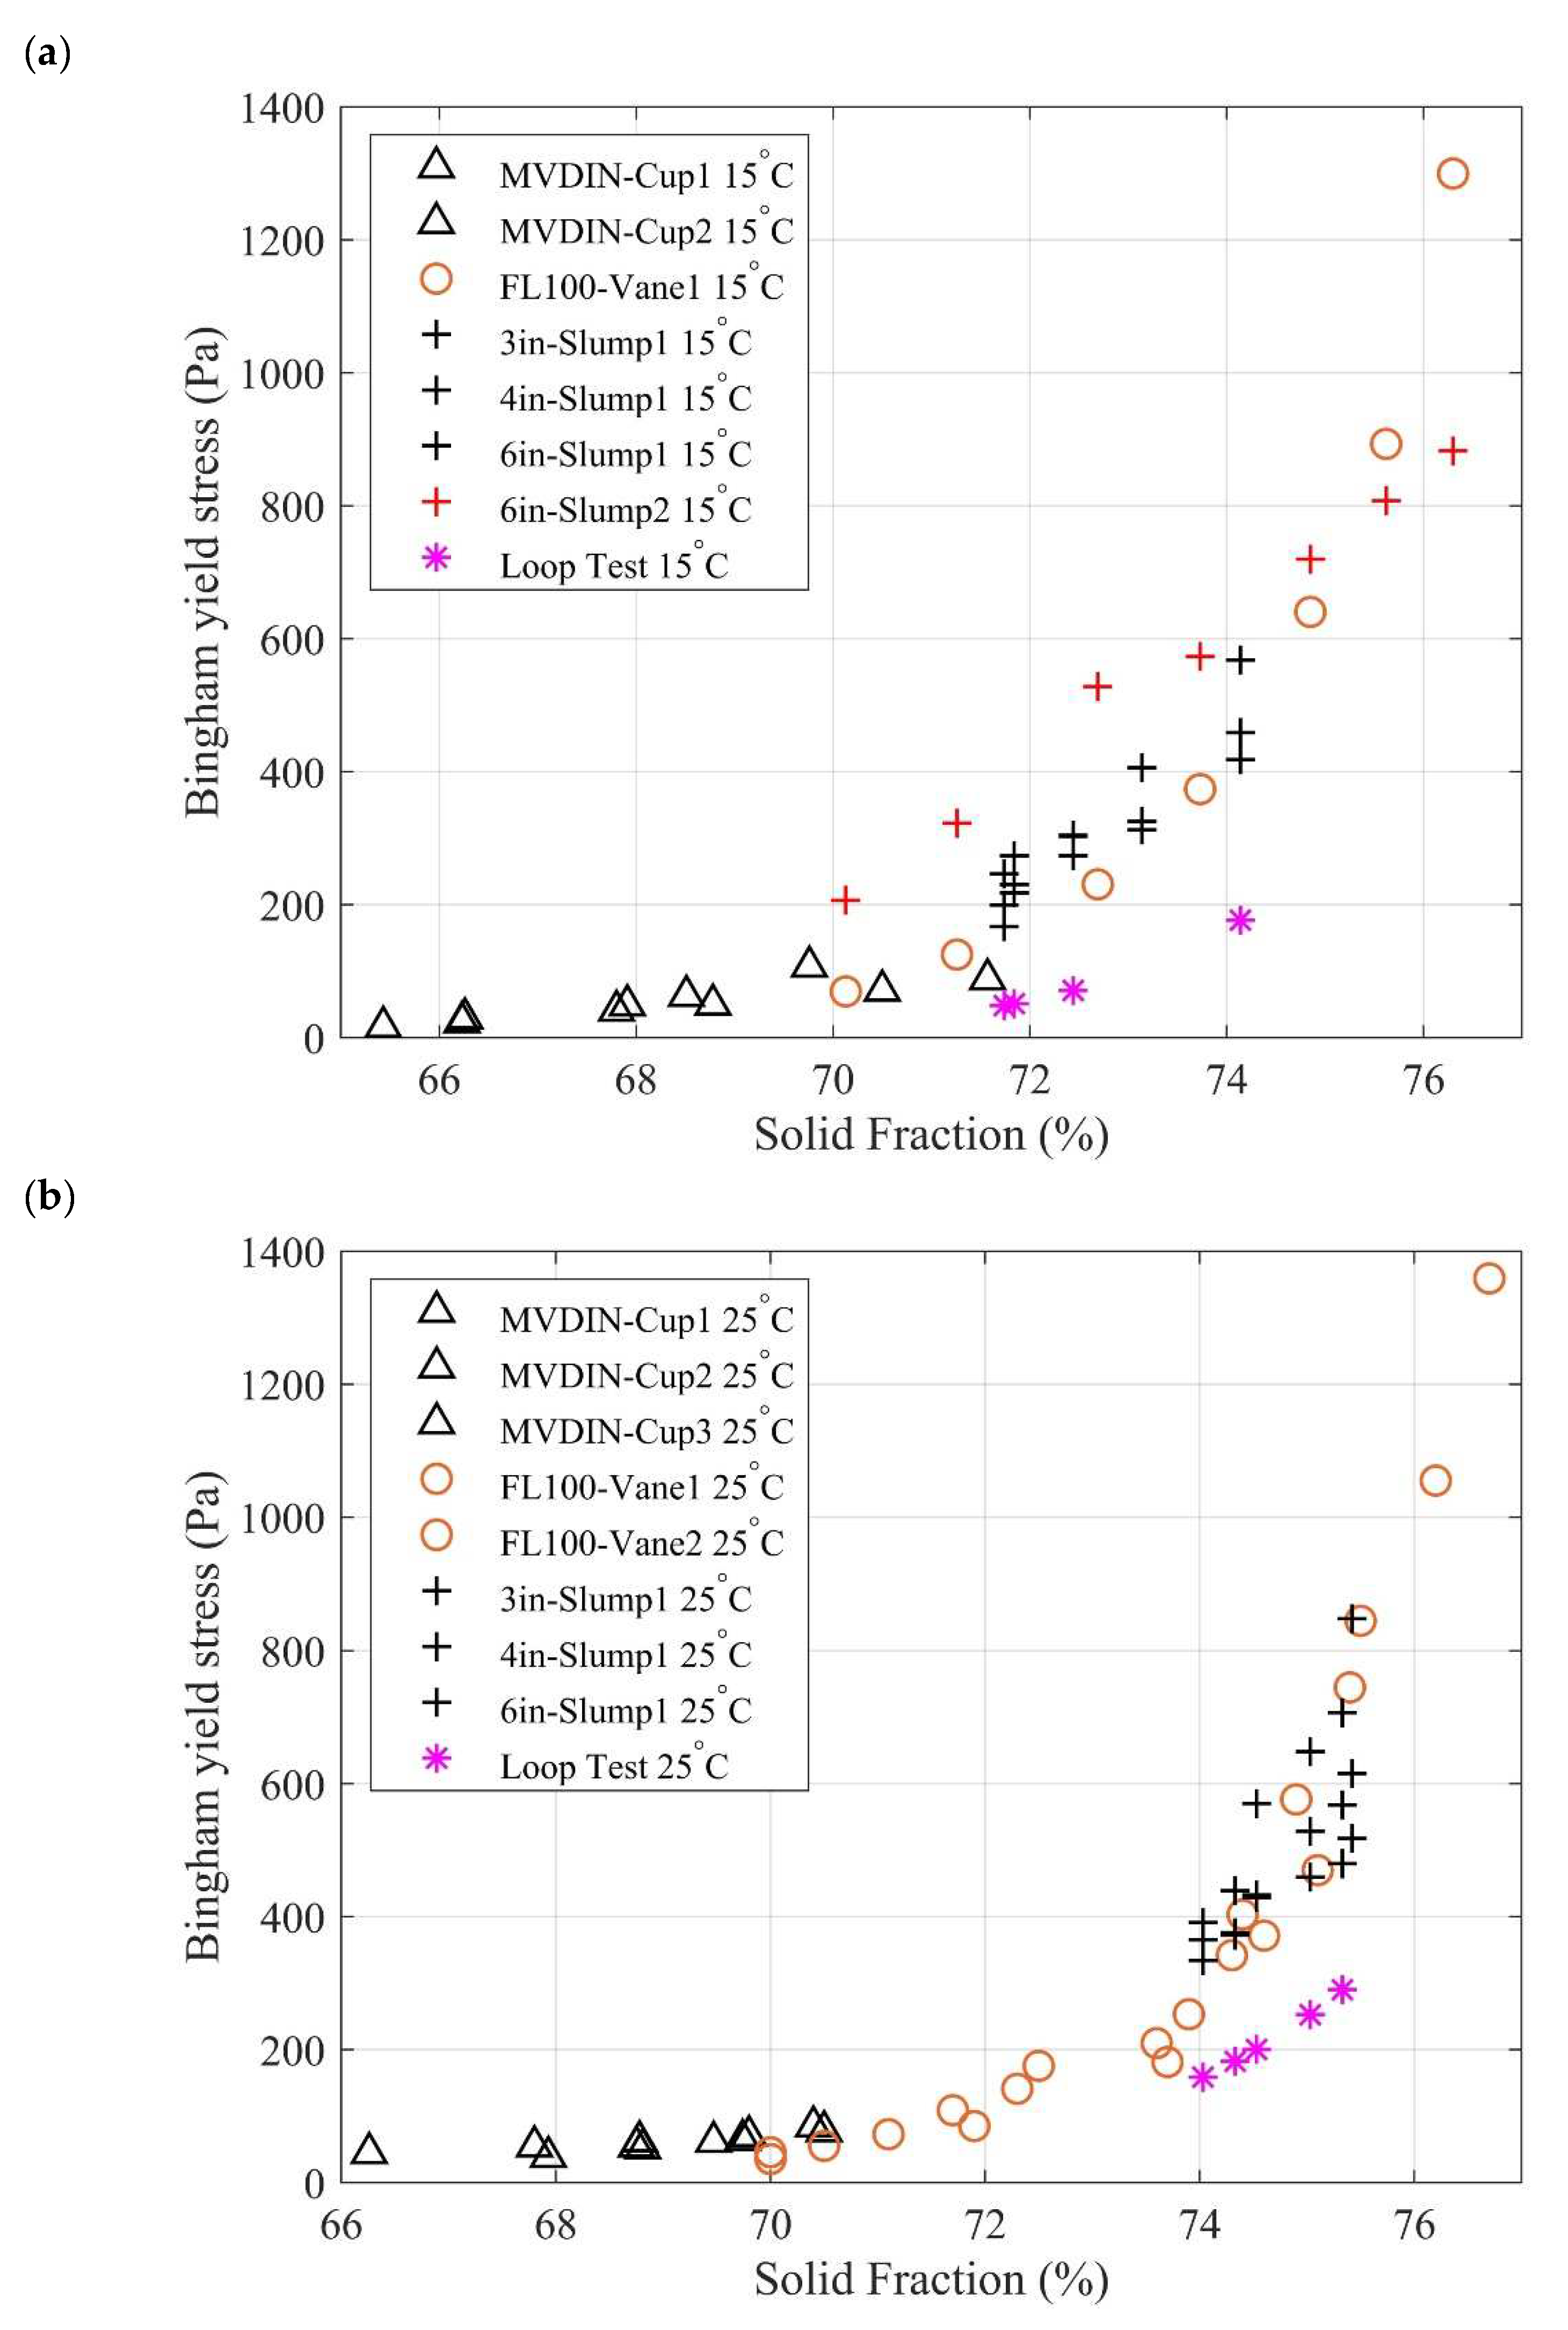
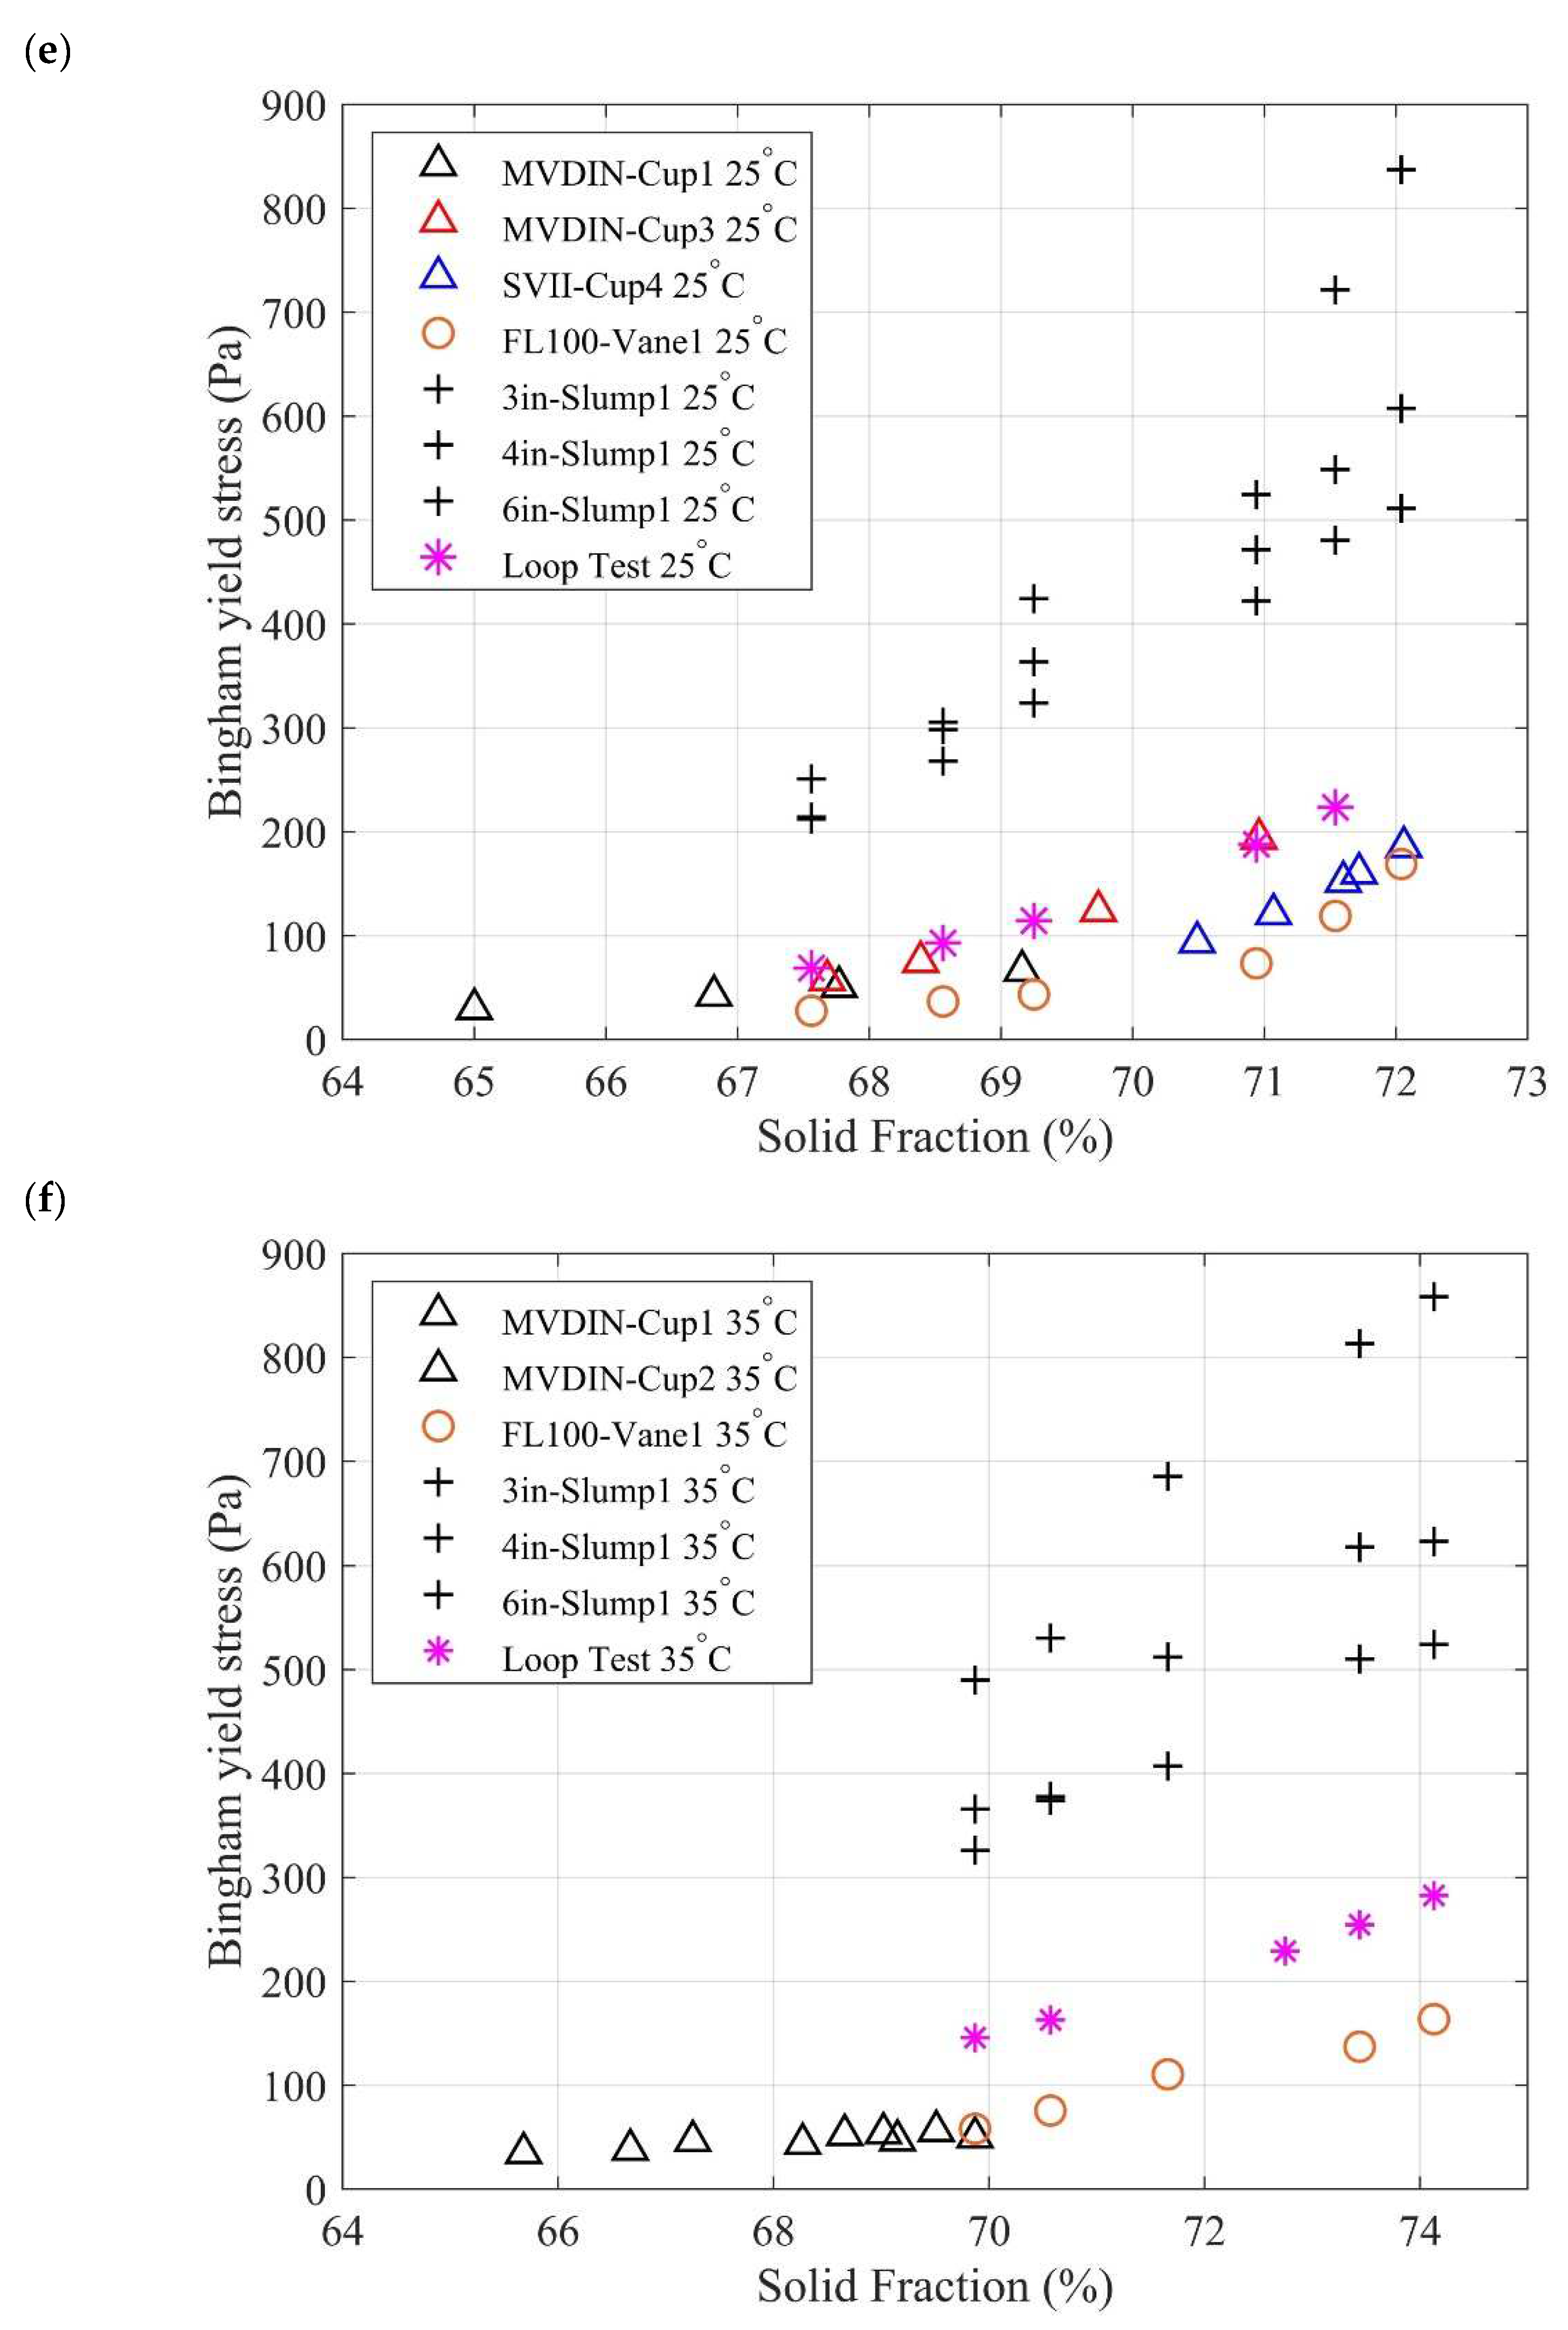
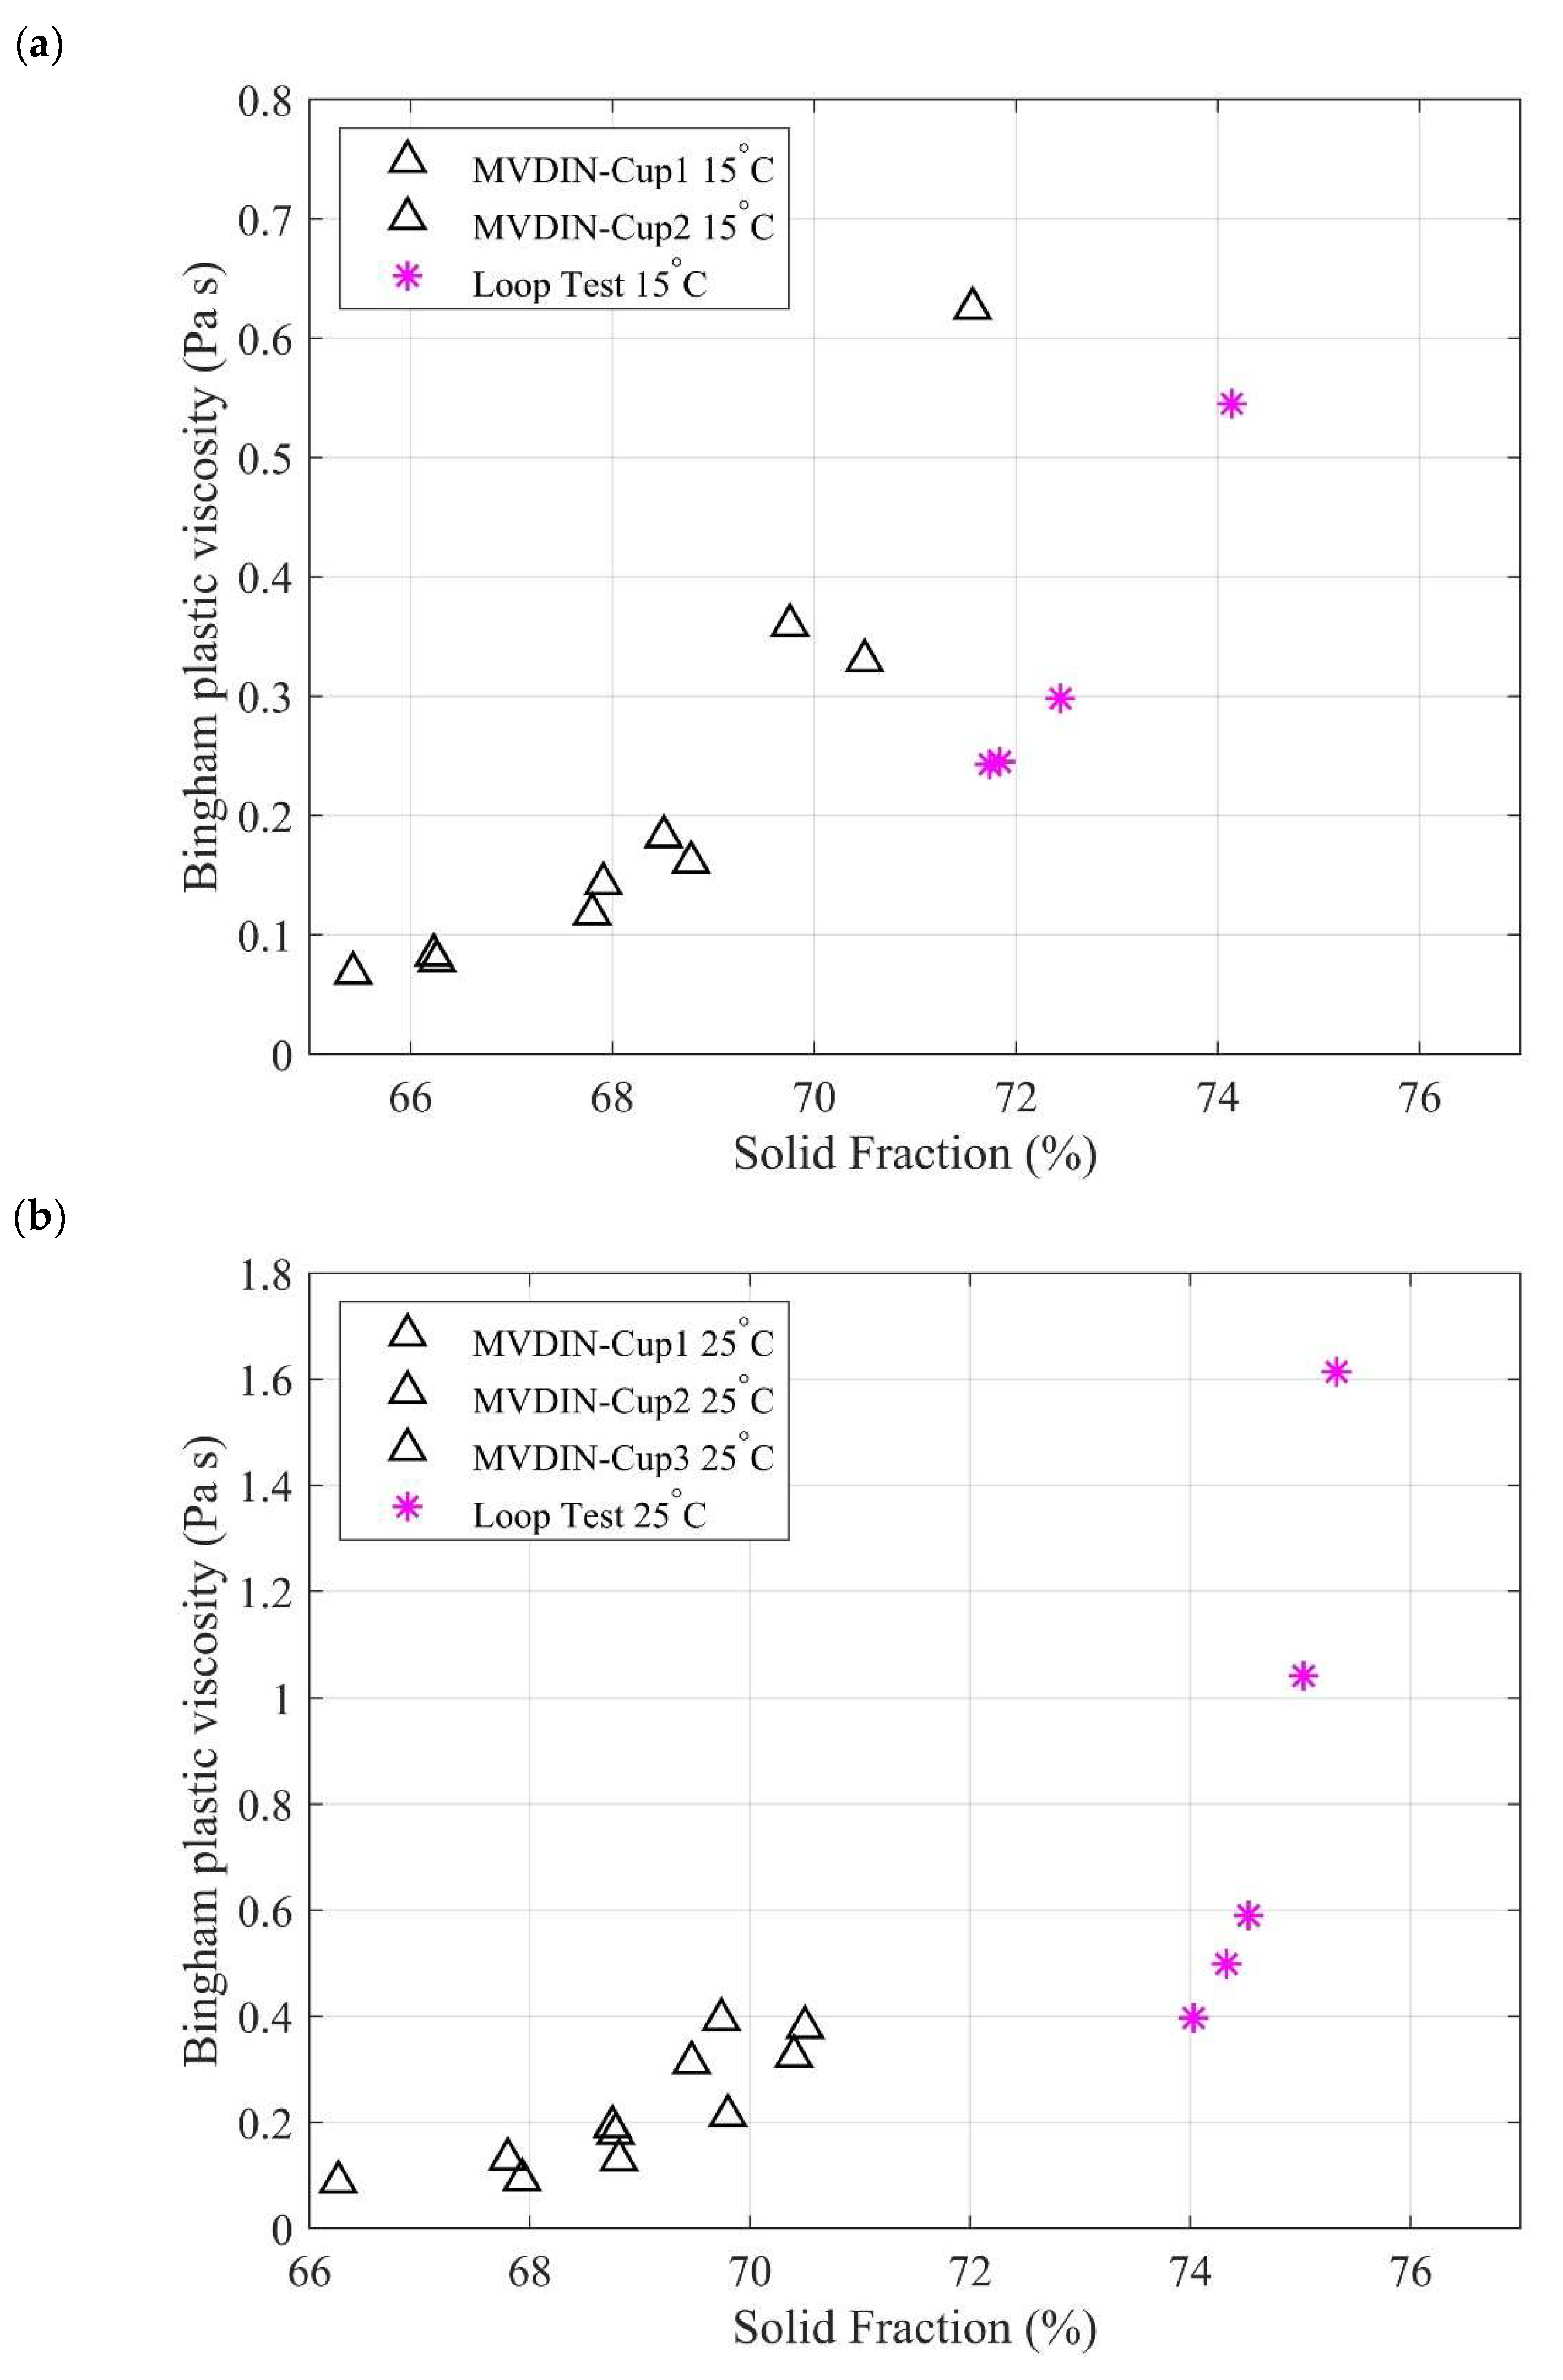
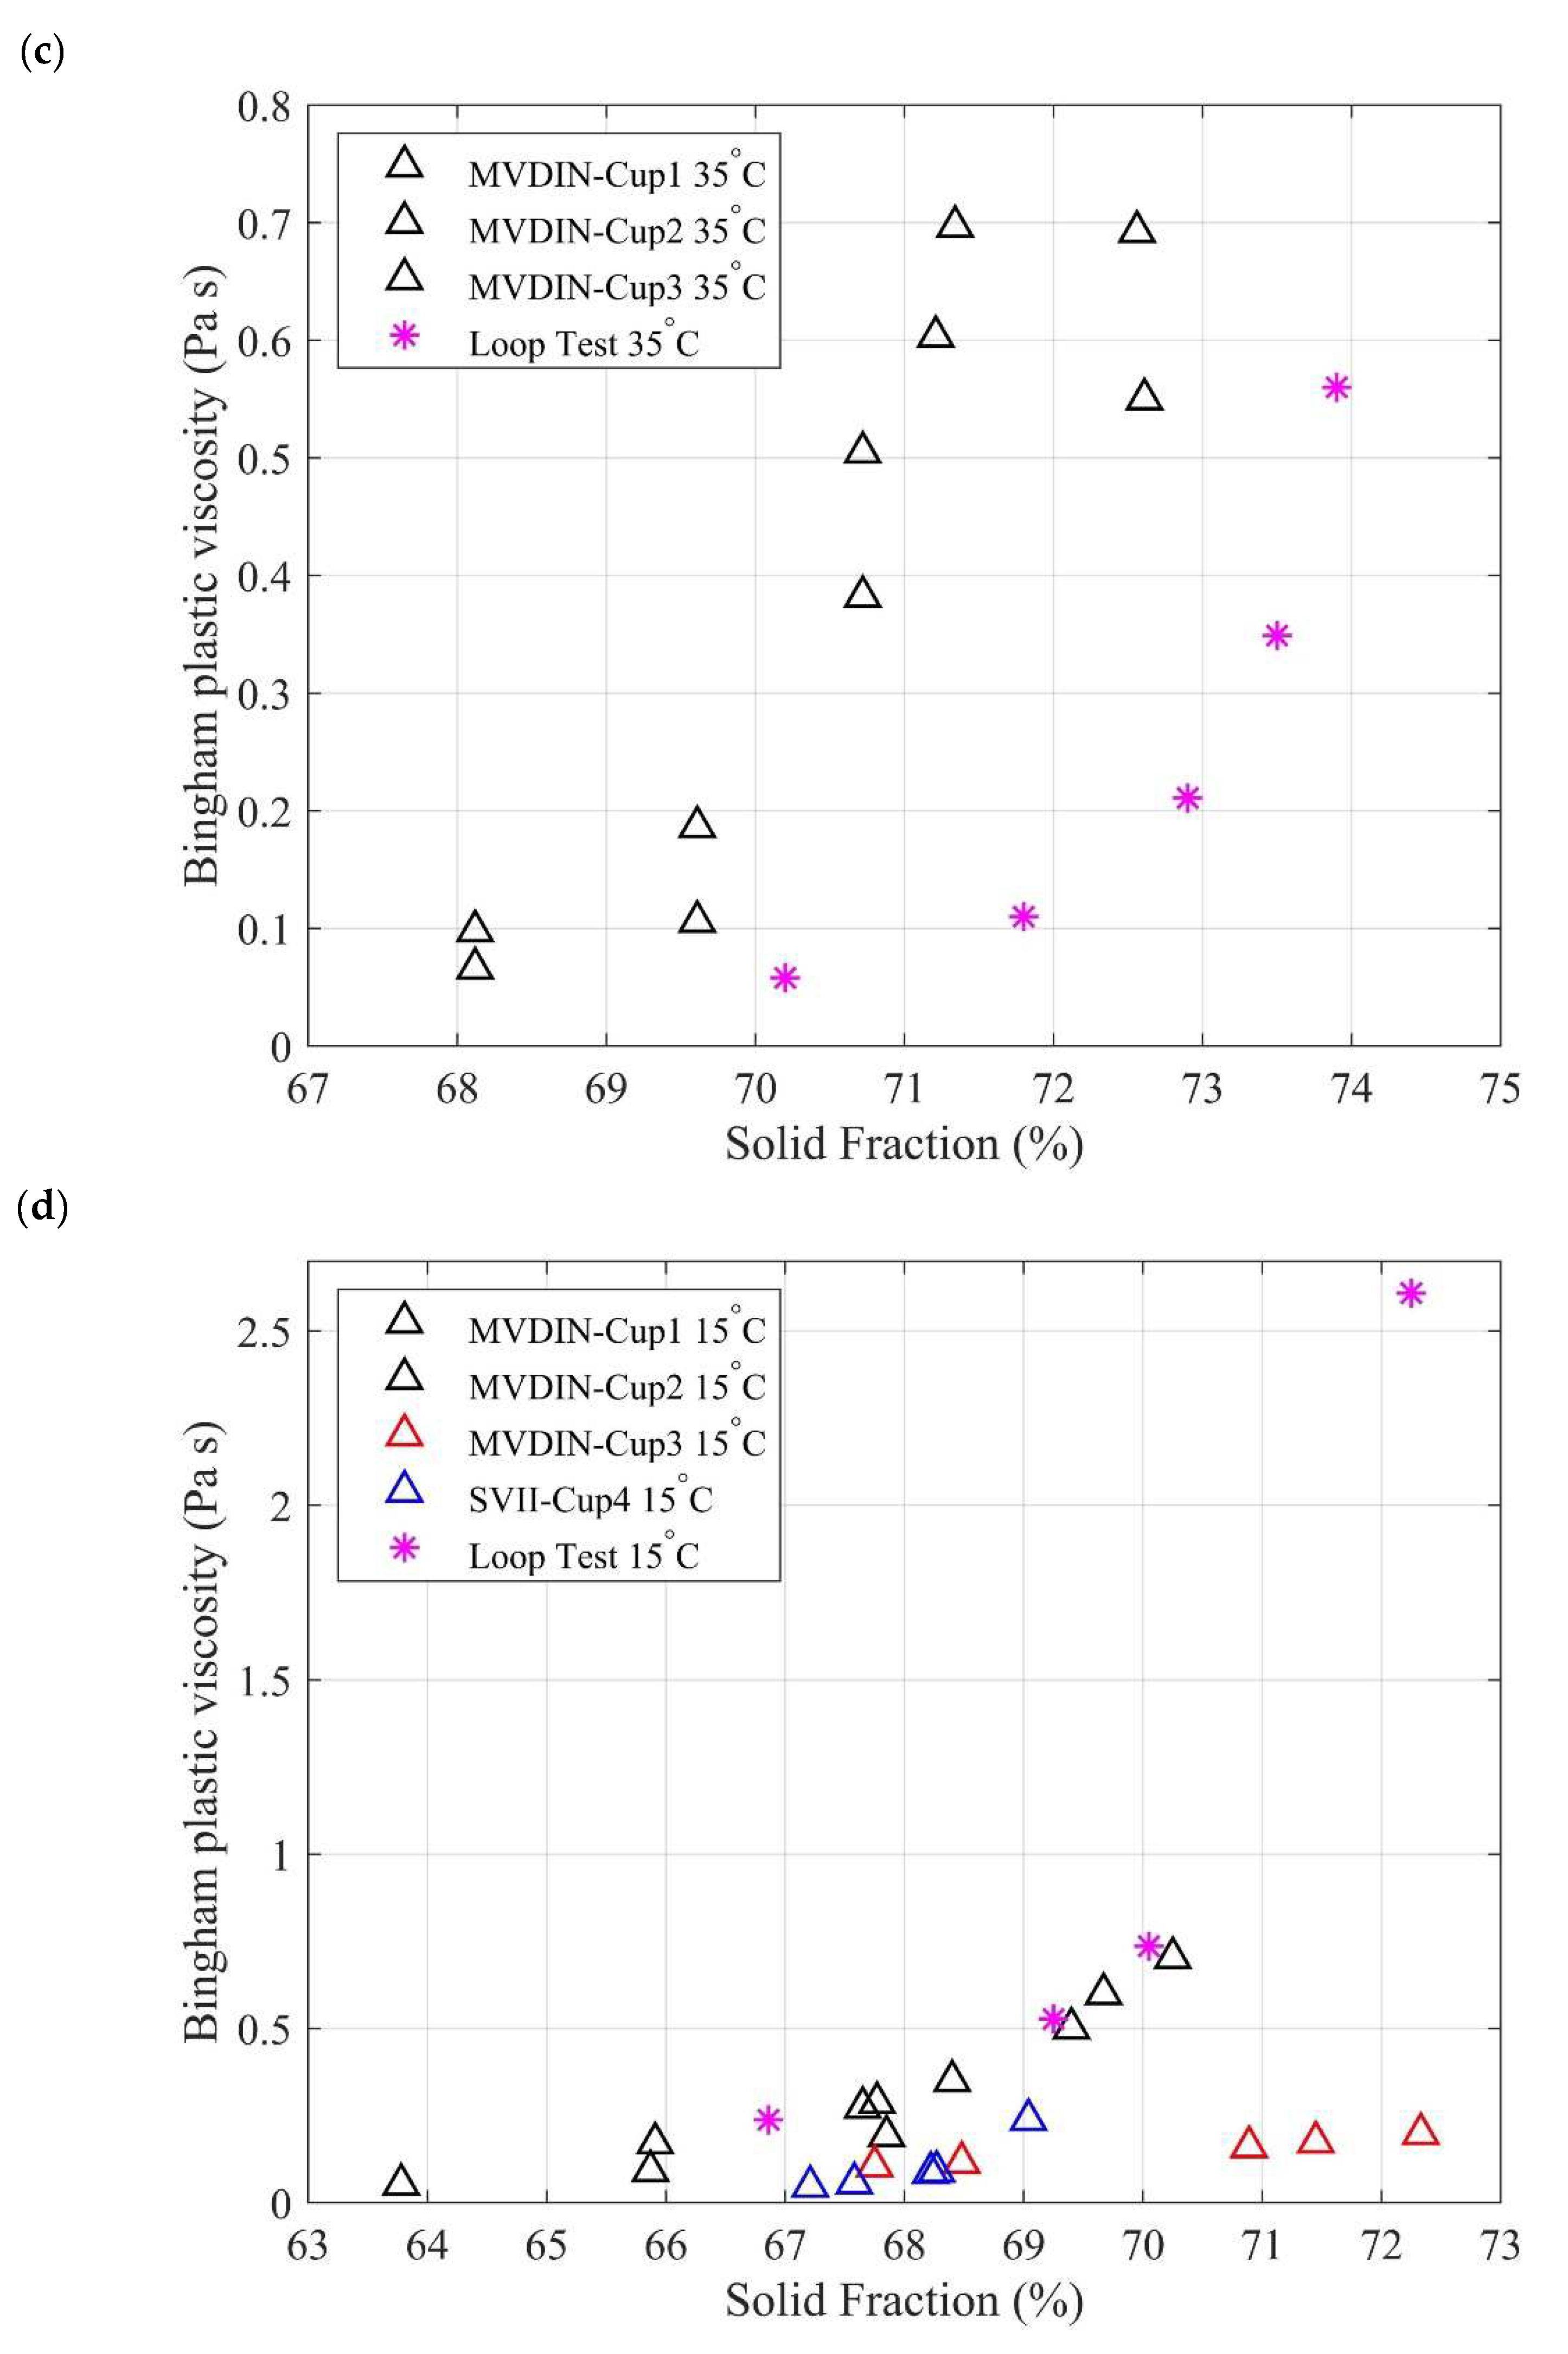
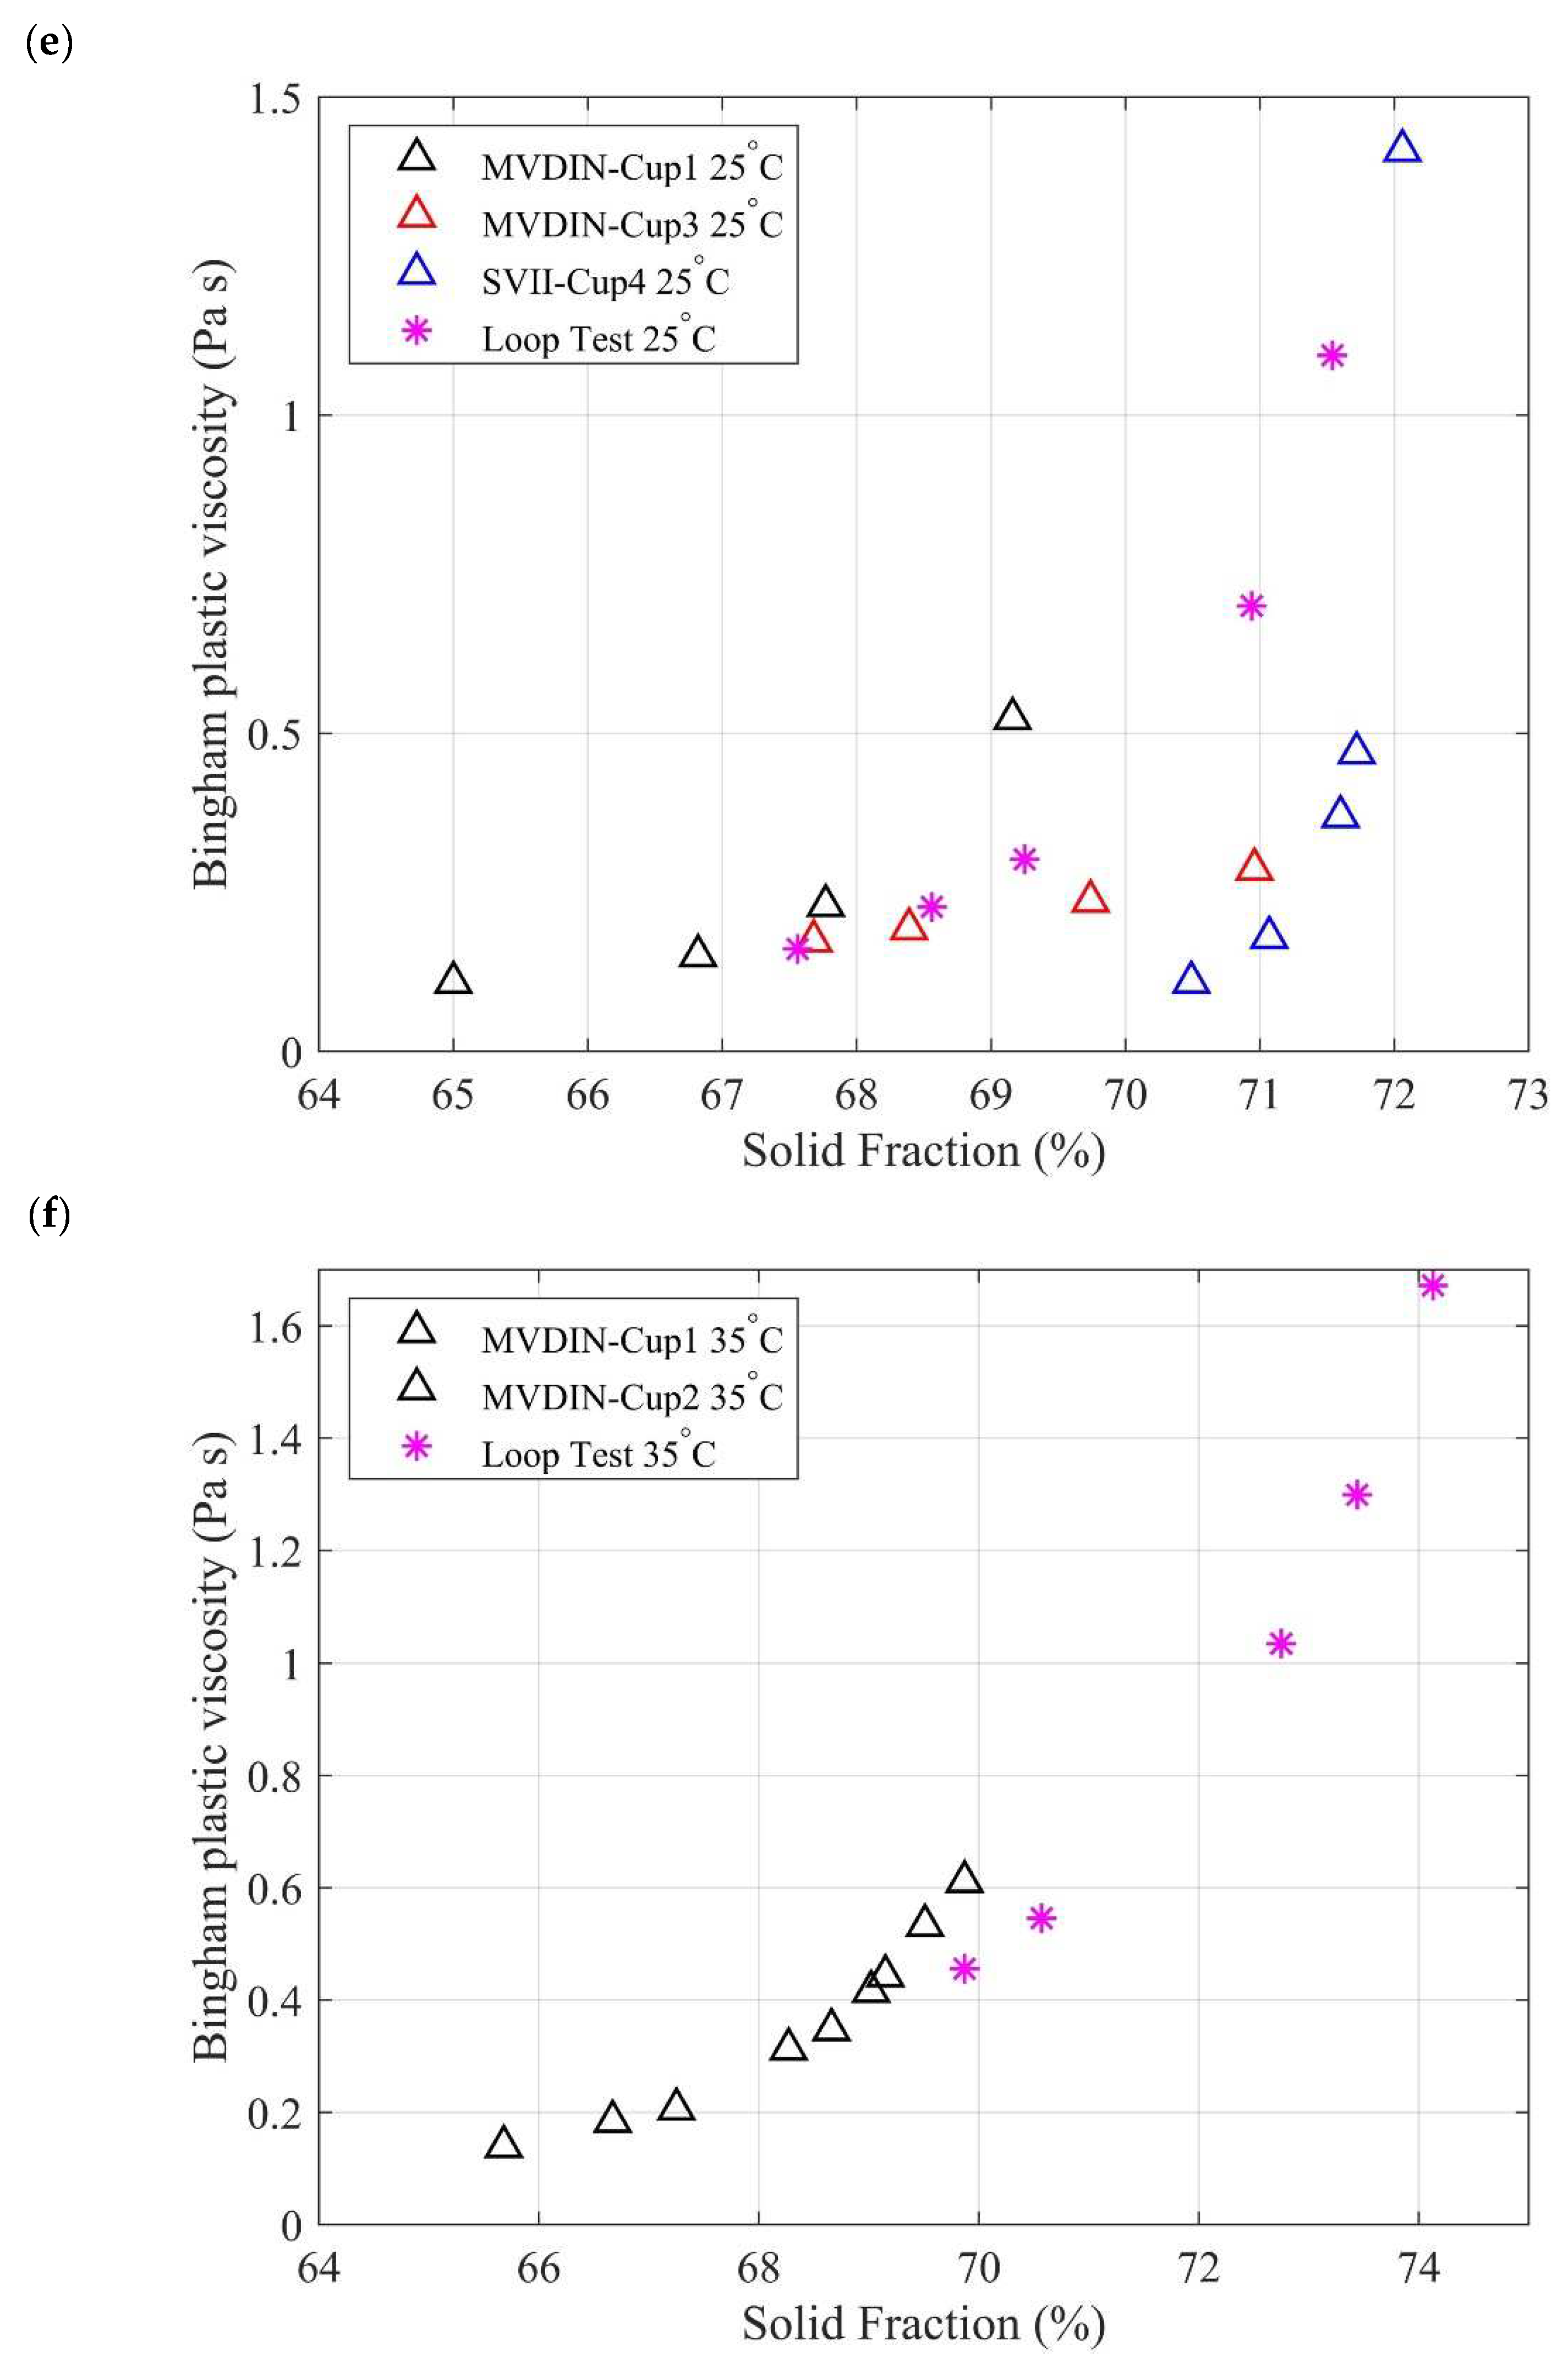
Despite numerous research attempts to measure rheology properties and pressure loss in mine paste backfill, there is no definite conclusion on the best and simple measurement method to be used for such a purpose. The main objective of this paper is to make a statistical analysis of the rheological properties of paste backfill obtained from various measurement methods under different temperatures to determine the method that most accurately predicts the properties and pressure in mine paste backfill. A series of experiments were conducted, and data were obtained from cup and bob viscometer, slump, vane rheometer, and flow loop tests. The flow loop test is considered the standard and all results are analyzed against it for accuracy. This paper discusses the theory behind each test, comparing results using five statistical models and a conclusion summarizing the results.

2. Materials and Paste Backfill Preparations

The composition of the tailings from Mine-A and Mine-B are detailed below in Table 1. The composition of both tailings is similar except that the SO3 content of tailing from Mine-B is higher. Also, there is no CO2 and ZnO particle in Mine-A tailings. The particle size distribution (PSD) of tailings is shown in Figure 1 and Table 2. Mine-A tailings have a wider range of particle sizes than Mine-B. Mine B tailings are very fine, with 80% of the material passing 20 µm while the cumulative passing of Mine-A is only 45%. Particle sizes have a significant impact on the pressure drop across a pipe and are dependent on solid fraction and flow rate. Particles of larger size decrease the void space in the backfill, and, therefore, porosity. Coarser tailings have larger inter-particle spaces in comparison to finer tailings [40,41]. The mine-B curve has a steeper grade than Mine-A, indicating a narrower size range.
A sample of the highest solid concentration is mixed from thickened tailings and processed mine water for every test. The sample is then gradually diluted by adding more water for subsequent tests. A sample is weighed and dried in an oven at each solid concentration to determine the exact solid fraction of the sample used in each trial. The samples used in this study for Mine-A and Mine-B are detailed below in Table 3 and Table 4, along with the type of experiment performed with them, rheometer sensors, cup types, and temperatures. The HAAKE Viscotester 550 was used with MVDIN and SVII sensors for cup and bob tests and FL100 vane sensor for yield stress. Standard and infinite cup mediums were used to assess the wall effects. All slump tests were conducted using 3-in, 4-in, and 6-in cylindrical molds. Tests were conducted at three different temperatures, 15 °C, 25 °C, and 35 °C to represent seasonal temperature variations along with possible viscous heating along the pipeline, which may influence rheological properties and pressure loss in the pipeline transportation system. All tests were conducted in clean laboratory environments.

3. Theory and Methods

3.1. Rotational Rheometer

Choosing a rheometer is a crucial element in the accurate estimation of a fluid’s rheological parameters. There are several methods to obtain viscosities using a rotational rheometer. The viscometer may be ramped up from a low speed up to a high speed for quick measurements. Stepping through specific shear rates long enough for a steady-state viscosity to be achieved is another approach. The type of fluid being analyzed and the shear rate range determine the type of geometry used with the rheometer. For low-viscous fluids at low shear rates, a geometry with a large surface area is preferred to maximize the torque response from the applied shear rate. At higher shear rates, a narrower gap is preferred to avoid turbulence. Thicker fluids are tested with a cone or plate system to ensure the applied torque range overlaps with the desired stress range. Figure 2 below shows a schematic representation of different rheometer geometries.
Paste backfill, being a mixture of thickened tailings and water, is prone to particle sedimentation at low solid concentrations and/or if kept untouched. A cup and bob geometry with a stationary cup and a rotating bob is preferred for such fluids. In this system, settling occurs parallel to the geometry, so particle concentration close to the surface is relatively constant. In cone or plate systems, particles settle perpendicular to the upper surface and concentration reduces over time, resulting in a drop in the viscosity measured. This behavior also arises due to wall slip. During fluid flow, it is generally assumed that the velocity at the wall equals zero (a no-slip condition). This condition is not universal, and in some scenarios, slip occurs on the wall. Slip may not necessarily occur continuously, and it may alternate with adhesion. This phenomenon, which is characteristic of the flow of melts and concentrated solutions at high shear stresses, is called the stick-slip phenomenon [42].
As a general rule of thumb, the annulus between the cup and bob should be at least 5–10 times the size of the largest particle in the test sample. For larger particles, the gap needs to be increased accordingly. Failure to follow this might result in inaccurate data recordings and scratches on the geometry surface. Viscosity is a temperature-dependent property, and any sudden changes in temperature will produce erroneous data. To counter this, the viscometer geometry is enclosed within a thermal jacket, which keeps the temperature gradients to the absolute minimum. The viscosity decreases for liquids with an increase in temperature. Similarly, an increase in pressure causes an increase in viscosity but this effect is only seen at very high pressures of 10–100 bar or higher [43].
This study uses a controlled rate rotational viscometer—HAAKE VT 550 to test the samples. The viscometer is connected to a computer with an installed program to record data. An FL100 vane attachment immersed in a cylindrical cup filled with the sample is used to measure yield stress. A cup and bob attachment using MV-DIN and SVII sensors measure yield stress and plastic viscosity.

3.2. Cup and Bob Viscometer

This setup consists of an inner cylinder (bob) attached to the spindle of the viscometer. The bob is immersed into a container (cup) that holds the backfill test fluid occupying the annulus. A torque is applied to the spindle allowing the bob to rotate, generating a velocity gradient across the gap. The gradient is called shear rate or the change in linear velocity (cm/s) between two adjacent fluid layers divided by their distance in centimeters (cm). Hence, the shear rates are expressed in reciprocal seconds (1/s). The resistance to motion develops shear stress that is expressed in pascal (Pa). The viscometer calculates the shear stress from the torque and the dimensions of the bob as per Equation (1). Similarly, the shear rate is determined from the angular velocity and the radii of both cup and bob as per Equation (2). Figure 3 and Table 5 below detail the schematic representation of the cup and bob viscometer and its dimensions.
τ = M 2 π R b 2 H
γ ˙ = 2 ω R c 2 R c 2 R b 2
The viscometer tests were conducted in accordance with the ASTM C1749-17a standard for shear rates of 0 to 220 s−1. The angular velocity varies from 0 to 25 rad/s with maximum torque of 0.025 Nm. Two sensors, MV DIN and SV II, were used in this test with two different types of containers. The first is a standard cup attachment and the second a cup with a height and diameter that is at least twice that of the bob [12]. The second cup is referred to as an infinite cup and aims to minimize the wall slip effects. Minor modifications were made in the shear rate calculation to account for the infinite cup. The slope of a plot between the natural log of angular velocity and shear stress at the bob was determined. This slope was used to obtain a modified shear rate, as shown in Equation (3).
γ ˙ = 2 ω s l o p e
A plot was generated from the shear rate ( γ ˙ ) versus shear stress ( τ ) values as per Equations (1) and (2). This plot was curve-fitted with a plot with the same shear rate ( γ ˙ ) versus a shear stress ( τ ) determined using Bingham plastic viscosity and Bingham yield-stress values as per Equation (4).
τ = τ B + η B γ ˙
Tests were conducted in an infinite medium as per Zengeni et al., 2012 [14] and Jacobsen, 1974 [13] to understand wall slip when measuring paste backfill rheology. When R c >> R b as in the case of an infinite cup, the angular velocity and shear stress at the bob wall can be written as shown below in Equation (5) [13,14,44].
d ω d τ W = f τ W 2 τ W
Solving this expression for the shear rate at bob wall and multiplying both numerator and denominator by angular velocity ω , and simplifying, gives Equation (6), which provides a means to determine the shear rate at bob in an infinite cup.
f τ W = γ W ˙ = 2 τ W d ω d τ W = 2 ω τ W ω d ω d τ W = 2 τ W d l n ω d l n τ W

3.3. Vane Rheometer

The vane rheometer consists of impeller blades attached to a rotating shaft geometry. This attachment helps minimize slip by increasing sample–sample contact. The vane is immersed into the backfill test sample in a container with minimum disturbance to the sample allowing the paste to yield under static conditions. It is slowly rotated at a constant rate to detect the yielding moment when the torque exerted on the vane shaft reaches a maximum value [45]. The breaking up of the flocculated particles in the fluid causes a maximum torque response and as the vane rotates, the yield stress acts uniformly on the side and ends of an equivalent cylinder [46]. The rotation of the vane in the material induces irreversible particle depletion near the blades [47] and thus, all-new measurements were done using newly prepared samples.
To avoid the influence of viscous resistance and instrument inertia, the rotational speed is kept below 10 rpm and H 2 R i < 3.5 . The radius of the vane geometry, R i should be lesser than the radius of the container R o in accordance with the relationship in Equation (7). Figure 4 and Table 6 below detail the schematic representation of the cup and bob viscometer and its dimensions.
R o > R i τ y τ w 0.5
Assuming that the sample yields along the cylindrical surface created by the vane, the peak torque required to overcome the yield stress can be expressed as explained by Steffe, 1992:
M 0 = π H D 2 2 σ y + 4 π 0 D 2 R i 2 2 R i D m σ y d R i
The constant m is used to account for the shear stress at the upper and lower ends of the vane geometry. A value of m = 1 records errors less than or equal to 3.7% for H 2 R i > 2 [48]. A value of m = 0 indicates the end effects are assumed to be insignificant. Equation (8) can then be re-written to obtain the yield stress.
σ y = 2 M 0 π D 3 H D + 1 3 1

3.4. Slump Test

The slump test is an experiment generally used to determine the workability of fresh concrete. It has continued to be used extensively in many fields due to its simplicity in operation and acceptable accuracy [35]. The difference between the heights of the slump mold and the slumped material is used to determine the yield stress. Alternatively, the final spread diameter of the slumped material can also be used [25,31,33].
The slump molds used in this study were cylindrical PVC molds. They were chosen over the conventional ASTM cones for a few reasons; the cylindrical model contains fewer variables than the ASTM model, which is mathematically more complex. The conical geometry of the ASTM model also makes it difficult to fill, giving rise to air bubbles. Three cylindrical molds were used, with a height of 3 in (76.2 mm), 4 in (101.6 mm), and 6 in (152.4 mm). The diameter of each mold is equal to its height. A perfect slip condition is assumed at the wall of the slump mold, such that the lift velocity of the mold, viscosity, or flow inertia effects do not affect the slump in any form and the undeformed material is assumed to be a perfect cylinder [31,32]. The only stress that acts on the material is vertically downwards due to its weight.
It was ensured that the setup was free of dents, deformations, or material stuck from previous trials. The prepared backfill was poured into the molds placed on top of a flat, rigid, and non-absorbent surface that had been cleaned prior to the commencement of the test. The mold was then steadily raised off the surface vertically without torsional or lateral motion causing the backfill to flow out and settle on the surface. The slump height of the backfill was measured from the top of the mold to the surface. Slump heights were converted into dimensionless forms with the use of arithmetic relations laid forth by Pashias et al., 1996, [25] for the slump cylinder test, as shown in Equations (10)–(12). Figure 5, below, shows the schematic representation of the stress distribution in the cylindrical slump mold.
s = s H
τ y = τ y ρ g H
s = 1 2 τ y 1 l n 2 τ y

3.5. Flow Loop Test

The flow loop test experiment is employed to measure the pressure gradient along the length of the pipe and characterize the fluid flow behavior in pipes. A schematic arrangement of the setup is shown below in Figure 6. The system is 12 m long with pipes running 8.2 m and the rest comprises the positive displacement pump and hopper. There are four pressure gauges installed; two upstream and two downstream. The pipe length L between gauges P1–P2 and P3–P4 is 1500 mm.
The test was conducted for the two mine tailings, A and B, at various solid concentrations at three different temperatures, 15 °C, 25 °C, and 35 °C, as explained by [5]. From the data collected by the pressure gauges, the pressure drop due to the resistance in flow is obtained by removing the gravitational head loss as detailed below in Equations (13) and (14). An average of P 12 and P 34 gives the pressure gradient as detailed below in Equation (15).
P 12 = P 1 ρ g L P 2
P 34 = P 3 P 4 ρ g L
P L = 1 2 P 12 L + P 34 L
The Buckingham–Reiner equation shown below in Equation (16) is used to determine the rheological properties of the paste backfill. The shear rate γ from this is equated with the pseudo shear rate in Equation (17). The wall shear stress expressed in terms of pressure loss is displayed in Equation (18). Regression analysis is performed between the results from Equations (16) and (17) to determine the plastic viscosity μ P and the yield stress τ y .
γ = τ W η B 1 4 3 τ y τ W + 1 3 τ y τ W 4
γ = 8 V D
τ W = D 4 P L
The yield stress and plastic viscosity obtained from the above-mentioned tests correspond to their respective solid concentration for which they were tested. Bingham plastic fluids, in general, have yield stress and plastic viscosity that are dependent on the solid concentrations. Coussot and Piau, 1995, [49] developed empirical correlations to describe the dependency of yield stress in terms of solid concentration. This relationship is shown below in Equation (19), where a and b denote empirical coefficients that can be determined for the conditions; a 0 and b 0 .
τ B = a C b
The dependence of apparent viscosity with solid concentration is expressed in terms of relative viscosity. Relative viscosity is the ratio of apparent viscosity to a dynamic viscosity of carrier fluid which is water in this case. Krieger and Dougherty, 1959, [50] developed a relationship that is shown below in Equation (20) where c and d denote empirical coefficients that can be determined for the conditions; c 1 and d 1 .
η B η W = 1 C c d
Equations (19) and (20) provide the Bingham yield stress and Bingham plastic viscosity of the non-Newtonian paste backfill samples in terms of entire sets of tested solid concentrations.

4. Results and Discussion

4.1. Yield Stress

The graphs displaying the yield-stress results are shown below in Figure 7a–f. For Mine-A at 15 °C and 25 °C, all MVDIN standard cup results show very good repeatability and good agreement with loop test data when extrapolated to higher solid concentrations. Vane’s results show very good agreement with slump results but not with the loop test. At 35 °C, there is a moderate agreement between the cup and bob results and the loop test. For Mine-B, there is very good agreement between MVDIN standard cup, SVII standard cup and loop test results at 15 °C and 25 °C and moderate agreement at 35 °C. There is moderate repeatability in the slump results at lower temperatures than higher temperatures and no good correlation is seen between a slump and the other tests. Slump results overpredict the yield stress by a minimum of 200 Pa at lower solid concentrations, and this is seen to increase at higher solid concentrations.
Generally, increasing solid fraction increases Bingham yield stress. Looking into the effect of temperature on the rheological properties, increasing paste temperature decreases the Bingham yield stress for both tailings. This is due to the fact that higher temperature leads to lower shear rate. Particle size has significant effect on the Bingham yield stress—higher particle size gives rise to a higher yield stress. Notably, paste from tailings of Mine-B has around 50% higher Bingham yield stress as compared to its Mine-A counterpart.

4.2. Plastic Viscosity

The graphs displaying the plastic viscosity results are shown below in Figure 8a–f. For Mine-A, there is a moderate agreement between MVDIN standard cup results and loop test data with a standard cup over predicting the plastic viscosity at all temperatures. The variation is lower at low solid concentrations and rises as the concentration increases. In the case of Mine-B, at all temperatures, there is very good agreement between the MVDIN standard cup results and the loop test data. The SVII infinite cup shows good agreement at 15 °C but deviates and underpredicts at 25 °C. The MVDIN infinite cup does not show good agreement with the loop test and the MVDIN standard cup.
In general, it is obvious that increasing the solid fraction increases the Bingham plastic viscosity. The effect of temperature to the Bingham plastic vicosity is apparent. Higher temperature reduces the viscosity due to lower water viscosity for both pastes. Similarly to yield stress, higher particle size also increases the Bingham plastic vicosity significantly. In this particular case, paste from the Mine-B tailing has about twice higher Bingham plastic viscosity as compared to paste from Mine-A tailings.
Tailings are the larger component in paste backfill and their influence on rheology is by PSD. The characterization of paste backfill from different mines is unique because of PSD, tailings mineralogy, history of mineral processing, and intended application [51,52]. Along with PSD, particle surface area and density strongly affect the yield stress and apparent viscosity of a fluid [53]. The rheological behavior of paste backfill is highly dependent on PSD and, in particular, the fraction of particles under −20% µm (Fall et al., 2005). A minimum of 15% < 20 µm is necessary to create paste properties [54]. Very fine tailings are generally mixed with aggregates such as sand to alter the PSD to achieve desirable rheological properties and strengths. These factors determine the design of paste backfill mixing, distribution, and transport systems.
The cup and bob tests have a 72–73% solid fraction limitation when testing paste backfill. This limit does not apply for loop, vane, and slump tests where samples up to 74–75% could be tested. This upper limit for cup and bob restricts its application despite having the best agreement with loop test data. Smaller bobs are more preferred for testing large yield-stress fluids and this is seen with the small-sized bob SVII having a better agreement with the loop test data in an infinite medium than the larger MVDIN bob.

4.3. Statistical Analysis

The large amount of data generated from each test was statistically compared with loop test data. The goal was to use different statistical analyses tools to identify trends between the different tests to determine the best fit. Root mean square error (RMSE), mean absolute percent error (MAPE), symmetric mean absolute percent error (SMAPE), Akaike information criterion (AIC), and the Bayesian information criterion (BIC) were employed in this study. Table 7 shows the governing expression used in each statistical model and its interpretation criterion. Table 8 and Table 9 showcases the results obtained from each statistical analysis for Mines A and B. The statistical analysis was conducted for each rheology test against the loop test for all three temperatures.
For Mine-A Bingham yield stress, the RMSE analysis shows that MVDIN standard cup and bob had the lowest error (41.249), MAPE and SMAPE showed that FL100 vane had the lowest percentage error (113.171 and 68.964), while AIC and BIC showed that the 3 in cylindrical slump had the best regression (76.360 and 73.484). The MVDIN standard cup and bob had the least errors only from the RMSE method, while all the other methods gave high errors—indicating the test to be ineffective in accurately predicting the Bingham yield stress for Mine-A. A plausible explanation could be due to lower particle sizes in Mine-A tailings that travel through the space in between standard cup and bob and have minimum wall slip effect, as compared to larger tailing particles. The same trend was observed when comparing Bingham plastic viscosity values, but a conclusive result may be obtained by comparing against different types of testing methods.
For Mine-B Bingham yield stress, the MVDIN infinite cup and bob has all-round lowest errors across the five statistical models. This could be due to the minimum wall-slip effect in the MVDIN infinite cup. It is very closely followed by SVII infinite cup and bob, MVDIN standard cup and bob, and FL100 vane. The slump tests for Mine-B showed the highest errors, making them unsuitable for Mine-B testing. The Bingham plastic viscosity comparisons showed that MVDIN standard cup and bob had the lowest errors. The SVII infinite cup and bob and MVDIN infinite cup and bob also had marginally lower errors than the MVDIN standard cup. The infinite cup medium is accurate when measuring yield stress and plastic viscosity. Its superiority over the standard cup is not easily discernible, although the results were consistent throughout when using a smaller bob.
A comparison of the different available rheology testing methods shows that for backfill prepared from tailings of fine particle sizes (d50 = 10 µm; 80% < 20 µm), such as Mine-B, the cup and bob viscometers have very good accuracy in predicting both Bingham yield stress and Bingham plastic viscosity and show good agreement with loop test data. For tailings with coarser particle sizes (d50 = 20 µm; 45% < 20 µm), such as Mine-A, the vane and slump tests show better overall agreement over MVDIN standard cup and bob while predicting Bingham yield stress.
When the statistical analyses result from Table 8 and Table 9 are read in conjunction with the results from Figure 7a–f and Figure 8a–f, it is clear that the model selection criteria AIC and BIC best represent the test results accuracy. The smaller 3-in-sized slump mold has the best accuracy in predicting Bingham yield stress of coarser Mine-A paste backfill over 4-in and 6-in slump molds and the rotational rheometer tests. Larger mold sizes overpredicted the yield stress, as stated by Clayton et al., 2003. For the much finer Mine-B paste backfill, MVDIN infinite cup and bob best predicts the Bingham yield stress and MVDIN standard cup and bob best predicts the Bingham plastic viscosity. A larger number of tests performed using more varied types of mine tailings based on particle size, mineralogy, and chemical properties will help us to gain a better understanding of the characterization of mine paste backfill and to select the most efficient and easily accessible rheology testing method.

5. Conclusions

In this study, different commonly used rheology measurement techniques for mine paste backfill were compared. All tests were compared against the results from the pipe loop test for accuracy. The tests were conducted at three different temperatures, 15 °C, 25 °C, and 35 °C in laboratories. The following conclusions were made from observed results.
i.
Slump tests overpredicted the Bingham yield stress for the finer Mine-B tailings but showed good agreement with vane for the coarser Mine-A tailings. The predictions made using the smallest 3-in mold had the least errors as statistical analyses while testing coarse paste backfill. MVDIN bob in an infinite cup showed the least errors while testing the finer Mine-B tailings.
ii.
FL100 vane tests showed moderate agreement with the loop test data for both sets of mine tailings. The effects of wall-slip reduced by the vane compared to smooth cylinders using MVDIN cup and bob tests were not profound in the tests. Good agreement was seen between FL100 vane and MVDIN cup and bob tests.
iii.
The infinite cup did not show a discernible superiority over the standard cup. However, the smaller SVII bob in the infinite cup has a better agreement for both Bingham yield stress and Bingham plastic viscosity over the MVDIN bob in the infinite cup.
iv.
The MVDIN standard cup had the least errors while predicting Bingham plastic viscosity for finer Mine-B tailings, as well as coarser Mine-A tailings.
v.
Higher particle size gives rise to a higher Bingham yield stress and viscosity.

Author Contributions

Conceptualization, A.P.S., F.H., M.A.H., and M.K.; methodology, A.P.S., B.B., M.K.; software, B.B.; validation, B.B., M.K., A.P.S.; formal analysis, B.B., A.P.S., M.K., F.H.; investigation, B.B., A.P.S., F.H.; resources, A.P.S., F.H., H.M.A., M.A.H.; data curation, B.B., M.K.; writing—original draft preparation, B.B., A.P.S., M.K.; writing—review and editing, A.P.S., F.H., H.M.A., M.A.H., H.A.M.A., G.S.A.H., E.B.M., H.A.S.; visualization, B.B., M.K.; supervision, A.P.S., F.H.; project administration, H.M.A., M.A.H., A.P.S., F.H.; funding acquisition, H.M.A., M.A.H., A.P.S., F.H. All authors have read and agreed to the published version of the manuscript.

Funding

This research work was funded by the Deputyship for Research & Innovation, Ministry of Education in Saudi Arabia through the project number (IFPRC-036-135-2020) and King Abdulaziz, University, DSR, Jeddah, Saudi Arabia.

Data Availability Statement

Data will be made available upon request.

Acknowledgments

The authors extend their appreciation to the Deputyship for Research & Innovation, Ministry of Education in Saudi Arabia for funding this research work through the project number (IFPRC-036-135-2020) and King Abdulaziz University, DSR, Jeddah, Saudi Arabia.

Conflicts of Interest

The authors declare no conflict of interest.

References

  1. Benzaazoua, M.; Fall, M.; Belem, T. A contribution to understanding the hardening process of cemented pastefill. Miner. Eng. 2004, 17, 141–152. [Google Scholar] [CrossRef]
  2. Gharib, N.; Bharathan, B.; Amiri, L.; McGuinness, M.; Hassani, F.P.; Sasmito, A.P. Flow characteristics and wear prediction of Herschel-Bulkley non-Newtonian paste backfill in pipe elbows. Can. J. Chem. Eng. 2017, 95, 1181–1191. [Google Scholar] [CrossRef]
  3. Ouattara, D.; Mbonimpa, M.; Belem, T. Rheological properties of thickened tailings and cemented paste tailings and the effects of mixture characteristics on shear behavior. In Proceedings of the 63rd Canadian Geotechnical Conference & 6th Canadian Permafrost Conference, Calgary, AB, Canada; 2010; pp. 1178–1185. [Google Scholar]
  4. Belem, T.; Benzaazoua, M. An overview on the use of paste backfill technology as a ground support method in cut-and-fill mines. In Proceedings of the Proceedings of the 5th International Symposium on Ground support in Mining and Underground Construction, Perth, WA, Australia, 28–30 September 2004; pp. 637–650. [CrossRef]
  5. Bharathan, B.; McGuinness, M.; Kuhar, S.; Kermani, M.; Sasmito, A.P.; Hassani, F.P. Friction factor model comparison for high concentration non-Newtonian mine paste backfill. Powder Technol. 2019, 344, 443–453. [Google Scholar] [CrossRef]
  6. Nguyen, Q.D.; Boger, D.V. Measuring the Flow Properties of Yield Stress Fluids. Annu. Rev. Fluid Mech. 1992, 24, 47–88. [Google Scholar] [CrossRef]
  7. Barnes, H.A. A Handbook of Elementary Rheology, a Handbook of Elementary Rheology; University of Wales: Aberystwyth, UK, 2000. [Google Scholar] [CrossRef]
  8. Kao, S.V.; Neilson, L.E.; Hill, C.T. Heology of concentrated suspensions of spheres. II. Suspensions agglomerated by an immiscible second liquid. J. Colloid Interface Sci. 1975, 55, 367–373. [Google Scholar]
  9. Savage, S.B.; Mckeown, S. Shear stresses developed during rapid shear of concentrated suspensions of large spherical particles between concentric cylinders. J. Fluid Mech. 1983, 127, 453–472. [Google Scholar] [CrossRef]
  10. Green, H. High-Speed Rotational Viscometer of Wide Range. Confirmation of theReiner Equation of Flow. Ind. Eng. Chem. Anal. Ed. 1942, 14, 576–585. [Google Scholar] [CrossRef]
  11. Van Wazer, J.R.; Lyons, J.W.; Kim, K.Y.; Colwell, R.E. A Laboratory Handbook of Rheology; Interscience Publishers: Hoboken, NJ, USA, 1963. [Google Scholar]
  12. Krieger, I.M.; Maron, S.H. Direct Determination of the Flow Curves of Non-Newtonian Fluids. J. Appl. Phys. 1952, 23, 147. [Google Scholar] [CrossRef]
  13. Jacobsen, R.T. The determination of the flow curve of a plastic medium in a wide gap rotational viscometer. J. Colloid Interface Sci. 1974, 48, 437–441. [Google Scholar] [CrossRef]
  14. Zengeni, B.; Malloch, R.; Sittert, F.V. A comparison of 150 nb pipe loop data with rotational viscometer test methods. In Proceedings of the 4th South African Conference on Rheology, Cape Town, South Africa, 3–5 September 2012; pp. 1–4. [Google Scholar]
  15. Skempton, A.W. Vane Tests in the Alluvial Plain of the River Forth Near Grangemouth. Géotechnique 1948, 1, 111–124. [Google Scholar] [CrossRef]
  16. Cadling, L.; Odenstad, S. The Vane Borer: An Apparatus for Determining the Shear Strength of Clay Soils Directly in the Ground. In Proceedings of the Royal Swedish Geotechnical Institute; Royal Swedish Geotechnical Institute: Stockholm, Sweden, 1950. [Google Scholar]
  17. Nguyen, Q.D.; Boger, D.V. Characterization of yield stress fluids with concentric cylinder viscometers. Rheol. Acta 1987, 26, 508–515. [Google Scholar] [CrossRef]
  18. Saak, A.W.; Jennings, H.M.; Shah, S.P. The influence of wall slip on yield stress and viscoelastic measurements of cement paste. Cem. Concr. Res. 2001, 31, 205–212. [Google Scholar] [CrossRef]
  19. Yan, J.; James, A.E. The yield surface of viscoelastic and plastic fluids in a vane viscometer. J. Nonnewton. Fluid Mech. 1997, 70, 237–253. [Google Scholar] [CrossRef]
  20. Liddel, P.V.; Boger, D.V. Yield stress measurements with the vane. J. Nonnewton. Fluid Mech. 1996, 63, 235–261. [Google Scholar] [CrossRef]
  21. Mizani, S.; Simms, P. Method-dependent variation of yield stress in a thickened gold tailings explained using a structure based viscosity model. Miner. Eng. 2016, 98, 40–48. [Google Scholar] [CrossRef]
  22. Chandler, J.L. The stacking and solar drying process for disposai of bauxite tailings in Jamaica. In Proceedings of the International Conference of Bauxite Tailings, Jamaica Bauxite Institute, Kingston, Jamaica, 26–31 October 1986. [Google Scholar]
  23. Murata, J. Flow and deformation of fresh concrete. Matériaux Constr. 1984, 17, 117–129. [Google Scholar] [CrossRef]
  24. Schowalter, W.R.; Christensen, G. Toward a rationalization of the slump test for fresh concrete: Comparisons of calculations and experiments. J. Rheol. 1998, 42, 865. [Google Scholar] [CrossRef]
  25. Pashias, N.; Boger, D.V.; Summers, J.; Glenister, D.J. A fifty cent rheometer for yield stress measurement. J. Rheol. 1996, 40, 1179. [Google Scholar] [CrossRef]
  26. Chao, S.; Xue, G.; Yilmaz, E.; Yin, Z. Assessment of rheological and sedimentation characteristics of fresh cemented tailings backfill slurry. Int. J. Min. Reclam. Environ. 2020, 35, 319–335. [Google Scholar]
  27. Niu, Y.; Cheng, H.; Wu, S.; Sun, J.; Wang, J. Rheological properties of cemented paste backfill and the construction of a predictive model. Case Stud. Constr. Mater. 2022, 16, e01140. [Google Scholar]
  28. Wu, A.; Ruan, Z.; Wang, J. Rheological behavior of paste in metal mines. Int. J. Miner. Metall. Mater. 2022, 29, 717–726. [Google Scholar] [CrossRef]
  29. Dikonda, R.K.; Mbonipa, M.; Belem, T. Specific mixing energy of cemented paste backfill, Part II: Influence on the rheological and mechanical properties and practical applications. Minerals 2021, 11, 1159. [Google Scholar] [CrossRef]
  30. Silva, M.; Hansson, M.; Silva, M.C. Rheological yield stress measurement of paste fill: New technical approaches. In Minefill 2020–2021; Hassani, F., Palarski, J., Sokola-Szewiola, V., Strozik, G., Eds.; Taylor & Francis Group: London, UK, 2021; pp. 169–182. [Google Scholar]
  31. Roussel, N.; Coussot, P. “Fifty-cent rheometer” for yield stress measurements: From slump to spreading flow. J. Rheol. 2005, 49, 705–718. [Google Scholar] [CrossRef]
  32. Clayton, S.; Grice, T.G.; Boger, D.V. Analysis of the slump test for on-site yield stress measurement of mineral suspensions. Int. J. Miner. Process. 2003, 70, 3–21. [Google Scholar] [CrossRef]
  33. Bouvet, A.; Ghorbel, E.; Bennacer, R. The mini-conical slump flow test: Analysis and numerical study. Cem. Concr. Res. 2010, 40, 1517–1523. [Google Scholar] [CrossRef]
  34. Gao, J.; Fourie, A. Spread is better: An investigation of the mini-slump test. Miner. Eng. 2015, 71, 120–132. [Google Scholar] [CrossRef]
  35. Gao, J.; Fourie, A. Using the flume test for yield stress measurement of thickened tailings. Miner. Eng. 2015, 81, 116–127. [Google Scholar] [CrossRef]
  36. Wang, X.; Li, J.; Xiao, Z.; Xiao, W. Rheological properties of tailing paste slurry. J. Cent. South Univ. Technol. 2004, 11, 75–79. [Google Scholar] [CrossRef]
  37. Senapati, P.K.; Mishra, B.K. Design considerations for hydraulic backfilling with coal combustion products (CCPs) at high solids concentrations. Powder Technol. 2012, 229, 119–125. [Google Scholar] [CrossRef]
  38. Wu, D.; Yang, B.; Liu, Y. Transportability and pressure drop of fresh cemented coal gangue-fly ash backfill (CGFB) slurry in pipe loop. Powder Technol. 2015, 284, 218–224. [Google Scholar] [CrossRef]
  39. Wu, D.; Baogui, Y.; Yucheng, L. Pressure drop in loop pipe flow of fresh cemented coal gangue-fly ash slurry: Experiment and simulation. Adv. Powder Technol. 2015, 26, 920–927. [Google Scholar] [CrossRef]
  40. Fall, M.; Benzaazoua, M.; Ouellet, S. Experimental characterization of the influence of tailings fineness and density on the quality of cemented paste backfill. Miner. Eng. 2005, 18, 41–44. [Google Scholar] [CrossRef]
  41. Yin, S.; Wu, A.; Hu, K.; Wang, Y.; Zhang, Y. The effect of solid components on the rheological and mechanical properties of cemented paste backfill. Miner. Eng. 2012, 35, 61–66. [Google Scholar] [CrossRef]
  42. Malkin, A.Y.; Isayev, A.I. Rheometry experimental methods. In Rheology Concepts, Methods, and Applications, 2nd ed.; Malkin, A.Y., Isayev, A.I., Eds.; Elsevier: Oxford, UK, 2012; pp. 255–364. [Google Scholar] [CrossRef]
  43. SI Analytics GmbH. Visco Handbook—Theory and Application of Viscometry with Glass Capillary Viscometers; SI Analytics GmbH: Mainz, Germany, 2015. [Google Scholar]
  44. Steffe, J.F. Rheological Methods in Food Process Engineering; Freeman Press: East Lansing, MI, USA, 1996. [Google Scholar]
  45. Nguyen, Q.D.; Boger, D.V. Direct Yield Stress Measurement with the Vane Method. J. Rheol. 1985, 29, 335–347. [Google Scholar] [CrossRef]
  46. Nguyen, Q.D.; Boger, D.V. Yield Stress Measurement for Concentrated Suspensions. J. Rheol. 1983, 27, 321. [Google Scholar] [CrossRef]
  47. Ovarlez, G.; Mahaut, F.; Bertrand, F.; Chateau, X. Flows and heterogeneities with a vane tool: Magnetic resonance imaging measurements. J. Rheol. 2010, 55, 197. [Google Scholar] [CrossRef] [Green Version]
  48. Steffe, J.F. Yield stress: Phenomena and measurement. In Advances in Food Engineering; Singh, R.P., Wirakartakusumah, A., Eds.; CRC Press: Baton Rouge, FL, USA, 1992; pp. 363–376. [Google Scholar]
  49. Coussot, P.; Piau, J. A large-scale field coaxial cylinder rheometer for the study of the rheology of natural coarse suspensions. J. Rheol. 1995, 39, 105–124. [Google Scholar] [CrossRef]
  50. Krieger, I.M.; Dougherty, T.J. A Mechanism for Non-Newtonian Flow in Suspensions of Rigid Spheres. Trans. Soc. Rheol. 1959, 3, 137–152. [Google Scholar] [CrossRef]
  51. Tenbergen, R.A. Paste dewatering techniques and paste plant circuit design. In Tailings and Mine Waste; A.A. Balkema Publishers: Fort Collins, CO, USA, 2000. [Google Scholar]
  52. Li, M.; Moerman, A. Perspectives on the scientific and engineering principles underlying flow of mineral pastes. In Proceedings of the 34th Annual Meeting of CMP, Ottawa, ON, Canada, 22–24 January 2002; pp. 573–595. [Google Scholar]
  53. Bentz, D.P.; Ferraris, C.F.; Galler, M.A.; Hansen, A.S.; Guynn, J.M. Influence of particle size distributions on yield stress and viscosity of cement–fly ash pastes. Cem. Concr. Res. 2012, 42, 404–409. [Google Scholar] [CrossRef]
  54. Landriault, D. Paste backfill mix design for Canadian underground hard rock mining. In Proceedings of the 97th Annual General Meeting of CIM. Rock Mechanics and Strata Control Session, Halifax, NS, Canada, 14–18 May 1995; pp. 229–238. [Google Scholar]
Figure 1. Mine-A and Mine-B particle size distribution.
Minerals 12 00678 g001
Figure 2. Schematic representation of different rheometer geometries; (a) cone and plate, (b) concentric—cup and bob, (c) parallel plate.
Minerals 12 00678 g002
Figure 3. Schematic representation of cup and bob viscometer.
Minerals 12 00678 g003
Figure 4. Schematic representation of vane rheometer.
Minerals 12 00678 g004
Figure 5. Schematic arrangement showing the initial and final stress distribution of the cylindrical mold slump test [25].
Minerals 12 00678 g005
Figure 6. The flow loop test experimental apparatus (all dimensions are in mm). PD—positive displacement pump; HP—hopper; P1, P2, P3, and P4—pressure gauges; HE—heat exchanger; FM—flow meter.
Minerals 12 00678 g006
Figure 7. Bingham yield stresses for (a) Mine-A at 15 °C; (b) Mine-A at 25 °C; (c) Mine-A at 35 °C; (d) Mine-B at 15 °C; (e) Mine-B at 25 °C; and (f) Mine-B at 35 °C.
Minerals 12 00678 g007aMinerals 12 00678 g007bMinerals 12 00678 g007c
Figure 8. Bingham plastic viscosity for (a) Mine-A at 15 °C; (b) Mine-A at 25 °C; (c) Mine-A at 35 °C; (d) Mine-B at 15 °C; (e) Mine-B at 25 °C; and (f) Mine-B at 35 °C.
Minerals 12 00678 g008aMinerals 12 00678 g008bMinerals 12 00678 g008c
Table 1. Mine-A and Mine-B tailings composition.
OxideMine-AMine-BOxideMine-AMine-B
CO2-0.88%K2O3.46%2.70%
Na2O3.32%1.50%CaO5.67%6.52%
MgO3.26%3.97%TiO20.57%0.64%
Al2O318.64%17.67%MnO0.15%0.13%
SiO254.79%49.02%Fe2O36.75%9.15%
SO32.83%7.29%ZnO-0.15%
Table 2. Mine-A and Mine-B tailings characterization.
ParameterMine-AMine-B
d8060 µm20 µm
d5025 µm10 µm
d208 µm6.62 µm
Cu10.13.5
Cc1.11.3
% <20 µm45%80%
Specific gravity2.743.40
Table 3. Mine-A sample data (bullet represents measurement technique performed).
Test LabelCup TypeTemperature (°C)
StandardInfinite152535
Loop test
MVDIN-Cup1
MVDIN-Cup2
MVDIN-Cup3
FL100-Vane1
FL100-Vane2
3in-Slump1
4in-Slump1
6in-Slump1
6in-Slump2
Table 4. Mine-B sample data (bullet represents measurement technique performed).
Test LabelCup TypeTemperature (°C)
StandardInfinite152535
Loop test
MVDIN-Cup1
MVDIN-Cup2
MVDIN-Cup3
SVII-Cup4
FL100-Vane1
3in-Slump1
4in-Slump1
6in-Slump1
Table 5. Cup and bob dimensions.
DescriptionMV DINSV II
Bob radius (Rb)19.36 mm10.10 mm
Cup radius (Rc)21.00 mm21.00 mm
Bob height (H)58.08 mm19.60 mm
Table 6. Vane dimensions.
DescriptionFL 100
Vane radius ( R i )11.00 mm
Standard cup radius ( R o )As per Equation (7)
Vane height ( H )16.00 mm
Table 7. Governing expression of each statistical model and its interpretations.
ModelGoverning ExpressionInterpretation
Root mean square error (RMSE) R M S E = i = 1 N F t A t 2 N The smaller the errors, the better the model
Mean absolute percent error (MAPE) M A P E = 100 N i = 1 N F t A t A t The smaller the percentage error, the better the model
Symmetric mean absolute percent error (SMAPE) S M A P E = 200 N i = 1 N F t A t F t + A t The smaller the percentage error, the better the model
Akaike information criterion (AIC) A I C = N + N l o g 2 π + N l o g R S S N + 2 p + 1 The smaller the value, the better the model
Bayesian information criterion (BIC) B I C = N + N l o g 2 π + N l o g R S S N + l o g N p + 1 The smaller the value, the better the model
Table 8. Statistical analysis of rheology tests against the loop test experiment for Mine-A.
Rheology TestRMSEMAPESMAPEAICBIC
Bingham yield stress
MVDIN standard cup and bob41.249380.800102.122161.899160.373
FL100 vane326.416113.17168.964190.295188.589
3in slump199.101165.08583.50876.36073.484
4in slump235.518179.60589.47677.96475.089
6in slump338.703239.278104.57481.43678.560
Bingham plastic viscosity
MVDIN Standard cup and bob0.256240.08093.45525.04523.520
Table 9. Statistical analysis of rheology tests against loop test experiment for Mine-B.
Rheology TestRMSEMAPESMAPEAICBIC
Bingham yield stress
MVDIN standard cup and bob53.64240.86254.591126.916125.001
MVDIN infinite cup and bob61.29221.41725.34354.35751.220
SVII infinite cup and bob56.29238.41948.26459.08856.088
FL100 vane88.563100.43071.147102.776100.467
3in slump220.953150.20381.409116.275113.967
4in slump279.756179.83791.663119.760117.451
6in slump416.296240.154107.715125.629123.320
Bingham plastic viscosity
MVDIN standard cup and bob0.08323.41923.537−2.349−4.264
MVDIN infinite cup and bob1.03457.29792.98222.44819.311
SVII infinite cup and bob0.50068.024107.56417.18214.045
Publisher’s Note: MDPI stays neutral with regard to jurisdictional claims in published maps and institutional affiliations.

