
Geophysical Implications for Prospective Prediction of Copper Polymetallic Ore Bodies: Northern Margin of Alxa Block, China


1
Geophysical Survey Center, China Geological Survey, Langfang 065000, China
2
Key Laboratory of Geophysical EM Probing Technologies, Ministry of Natural Resources, Langfang 065000, China
3
Institute of Geophysical and Geochemical Exploration, Chinese Academy of Geological Sciences, Langfang 065000, China
*
Author to whom correspondence should be addressed.
Minerals 2022, 12(5), 653; https://doi.org/10.3390/min12050653
Submission received: 9 April 2022
/
Revised: 16 May 2022
/
Accepted: 16 May 2022
/
Published: 22 May 2022
(This article belongs to the Special Issue Understanding Hydrothermal Ore Deposits: Insights from In-situ Analyses)
Abstract
:The Alxa Block is located in the middle part of the Central Asian orogenic belt, which is the coupling belt of the North China, Tarim, and Kazakhstan Plates. The east–west-trending deep faults control stratigraphic distribution and magmatic activity in the region. To detect the EW-trending ore-controlling deep structures, a 440 km NS section of magnetotelluric sounding was conducted from Minle to Ejinaqi. The phase tensor and electrical principal axis were analyzed based on the measured data to build the exploration model. The electrical structure model along the section was obtained using nonlinear conjugate gradient (NLCG) 2D inversion. Combined with the geological, geophysical, and deposit distribution characteristics in the area, the comprehensive study of magnetotelluric sounding profile shows that the resistivity presents as zoned along the profile. The Engelwusu ophiolite mélange belt is stacked in clumps with high and low resistivity, indicating that the northern margin of the Engelwusu Belt subducts below the high-resistivity zone, representing the passive continental margin. The southern end of the Engelwusu ophiolite belt is primarily the prospecting potential area for copper–gold deposits, whereas the northern end of the Engelwusu ophiolite belt corresponds to copper polymetallic deposits.
1. Introduction
In the global tectonic system, plate boundary tectonics, particularly continental margins, contain multiple geological processes and develop multiple metallogenic systems [1]. Therefore, a plate boundary survey is essential for mineralization and prospecting.
The study area is located in the coupling belt of the North China Craton and the Tarim and Kazakhstan Plates in the middle of the Central Asia orogenic belt southern margin. The interaction and regional metallogenic background among the Hexi Corridor, the North China Plate, and the Xingxingxia–Beishan Block are important areas of research [2].
The indirect method of ore body prospect prediction is to regard the prediction work as the output of the prospecting model. The method consists of four stages: (i) summarize the prospecting criteria and prospecting model; (ii) clarify the geological bodies and physical properties related to the occurrence of ore bodies; (iii) determine which survey method to use, and carry out survey; (iv) based on the framework of prospecting model, combined with the prediction results of geology, geophysics, and geochemistry, propose prospecting prospective area or direction at regional scale.
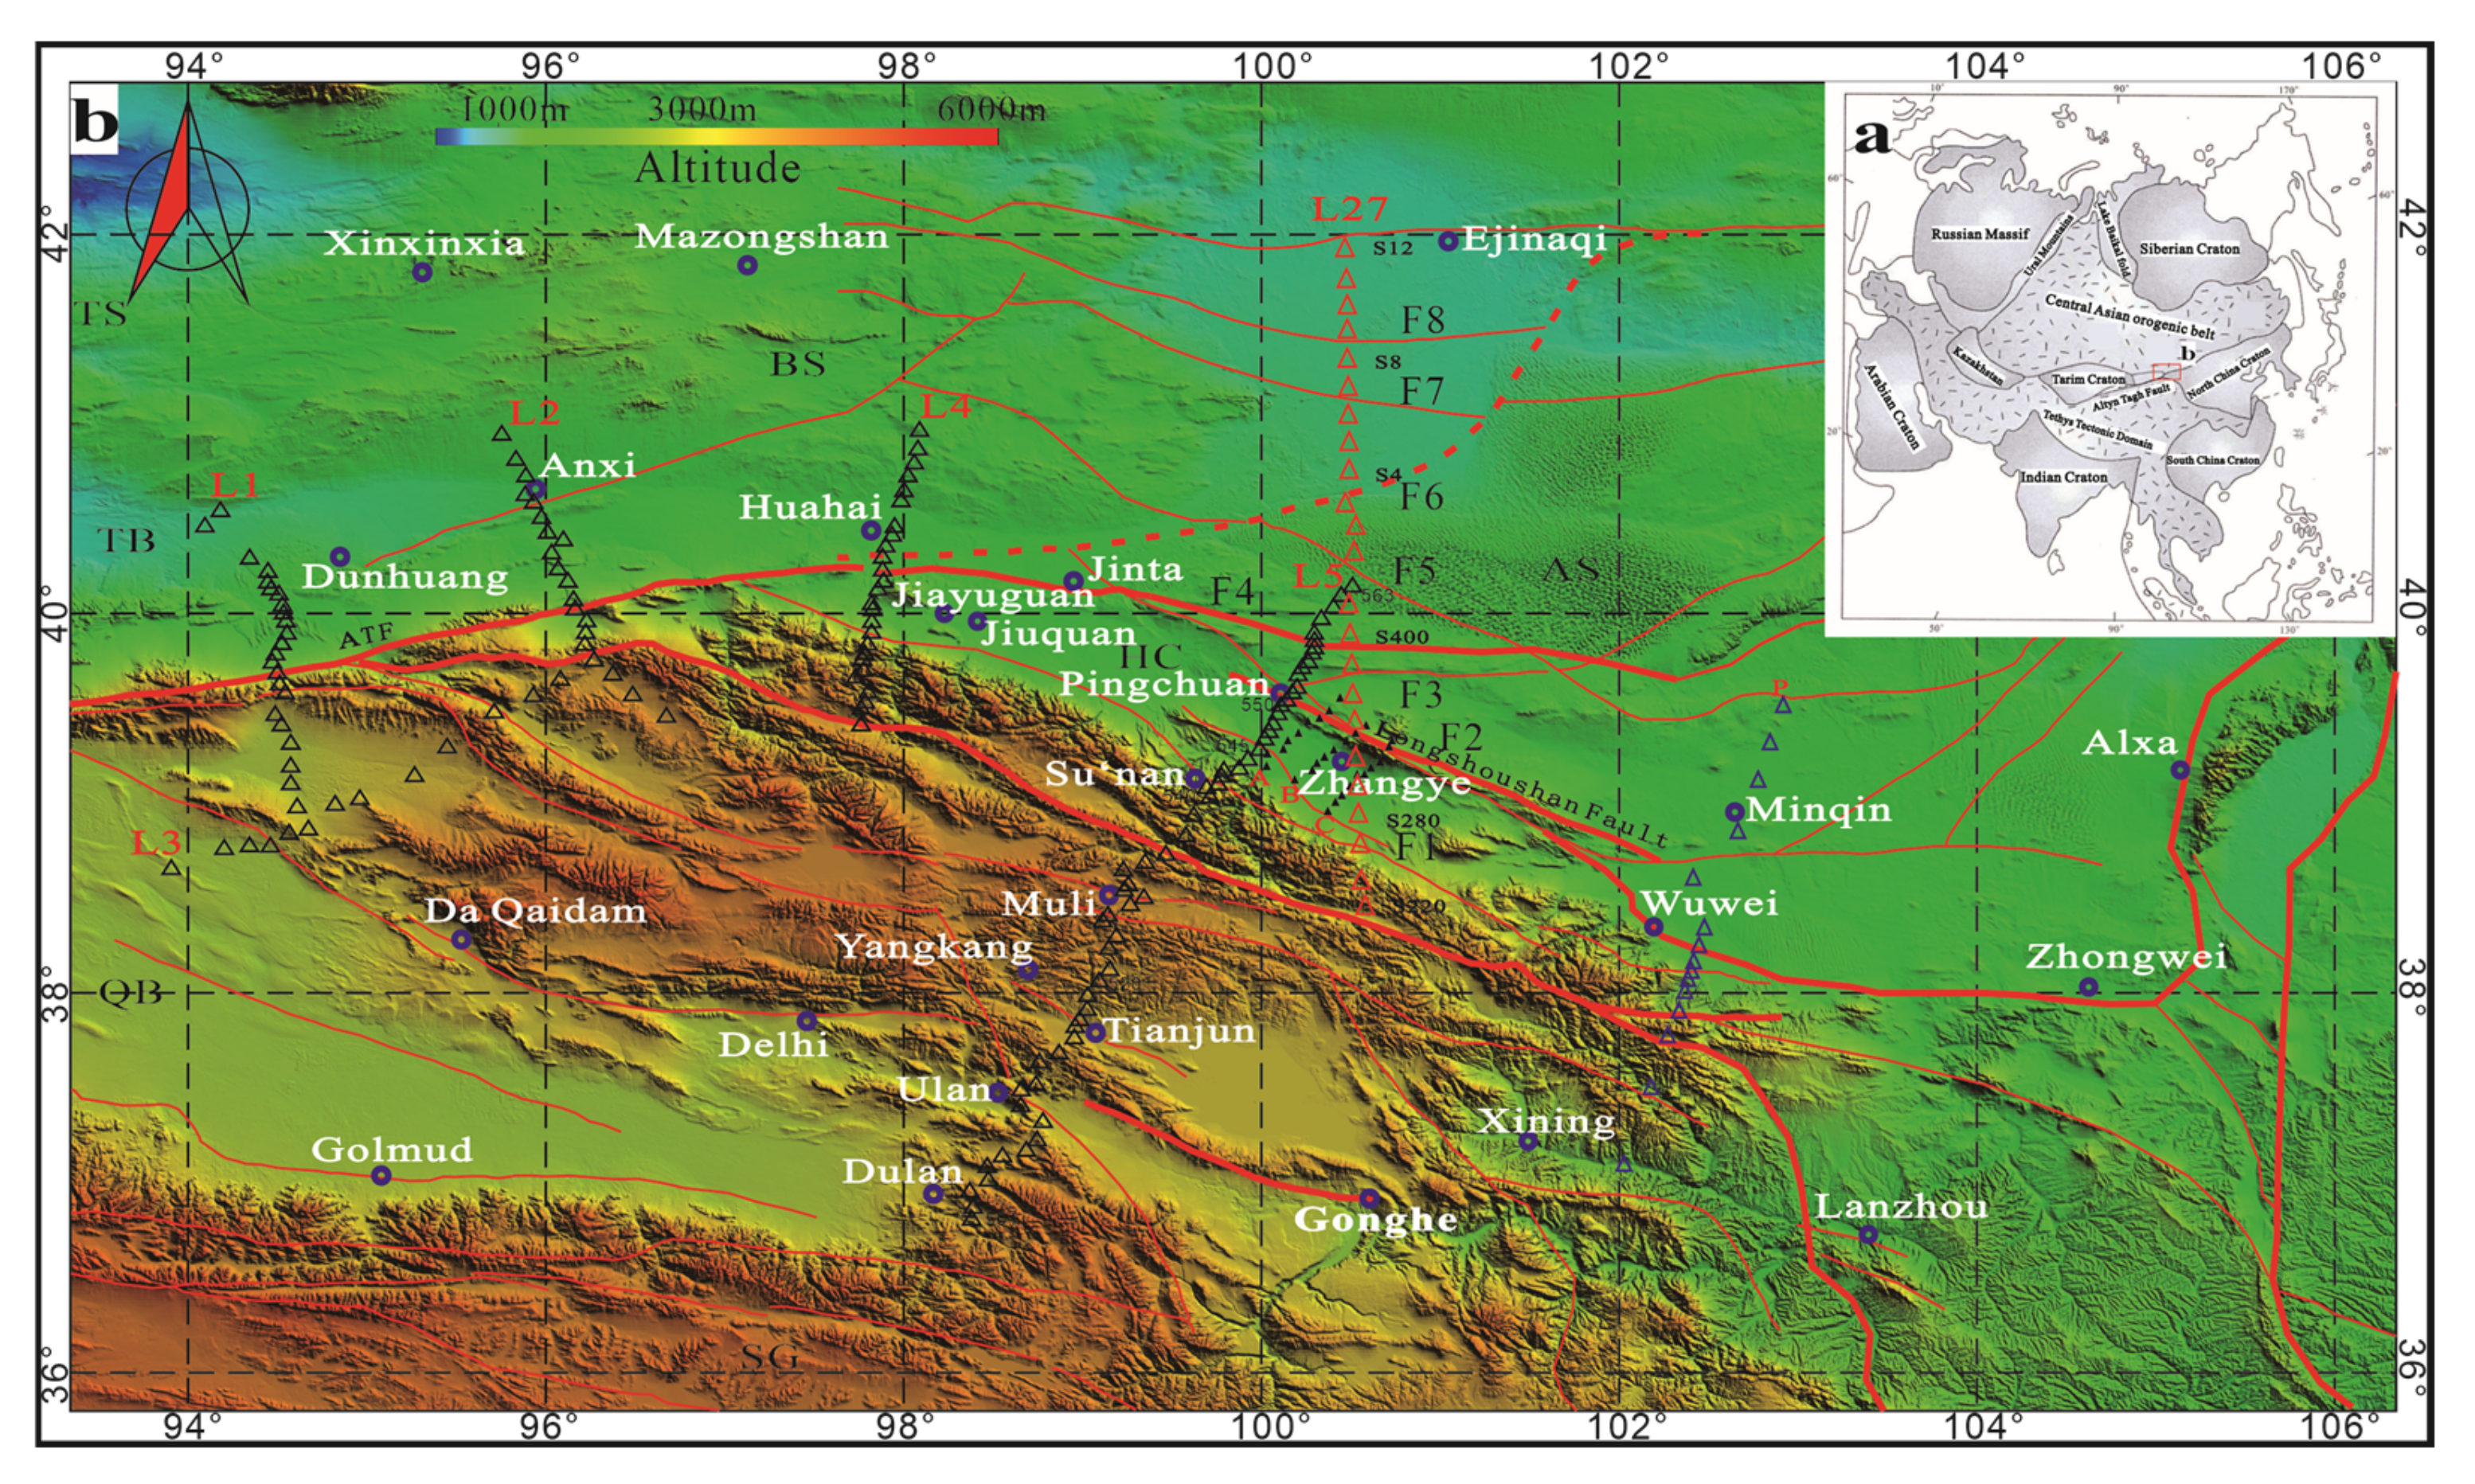
The “Y”-shaped boundary faults formed by the Hongliuhe–Niuhuan–Changjing suture zone, the eastern edge of the Altyn Tagh Fault, and the Engelwusu ophiolite belt have separated the Tarim Block, the North China Craton, and the Kazakhstan Plate [3]. The vast Badanjilin Desert is situated in the area between Gurinai and Tamusu, and therefore, the Engelwusu ophiolite belt has not been previously studied. The Engelwusu ophiolite belt can be regarded as a suture line between the Tarim and North China Plates [3,4]. To the south of the belt, Lower Paleozoic deposits are missing in the North China Plate, with Proterozoic metamorphic basement to the south of the belt. The fold basement to the north is Lower Paleozoic [2,5,6,7,8,9]. It is also considered that both sides of the Engelwusu Belt belong to the Tarim Block, and the fault of the western edge of Yabulai Mountain is the boundary between the North China Plate and the Tarim Block [10]. The ownership and evolutionary history of the Alxa Block have long been controversial [3]. Based on a detailed geological and geophysical investigation in the Badanjilin Desert and its surrounding areas, this study discusses the distribution characteristics of the Engelwusu ophiolite belt along profile L27 to support the prospect evaluation of deep mineral resources (Figure 1).
2. Geology: Geophysical Background
The Central Asian orogenic belt is located between the Siberian Craton and the North China–Tarim Plate. It extends 5000 km from the Ural Mountains in the west across Kazakhstan, China, and Mongolia, to the Okhotsk Sea in Russia in the east. It is the largest Phanerozoic accretive orogenic belt in the world [12,13,14,15,16].
The Alxa Block is considered to be a Precambrian microcontinent. It is separated from the Dunhuang Block by the Ruoshui Fault in the west, connected to the Central Asian orogenic belt by the Engelwusu ophiolite belt in the north, separated from the North Qilian orogenic belt by the Longshoushan Fault in the southeast, and connected to the North China Craton in the east.
The study area is the northern margin of the Alxa Block, located in the middle part of the southern margin of the Central Asian orogenic belt [16,17]. Its formation is related to the closure of the Paleo-Asian ocean [15,16,18]. It serves as the boundary between the southern margin of the Central Asian orogenic belt and the Alxa Block and occupies an important position in tectonic background.
2.1. Geological Background
The Alxa and Dunhuang micro land masses formed a rigid block in the Precambrian. The western boundary of the rigid block was located in the Ruoqiang–Xingxingxia Fault, the eastern boundary was located in the Helanshan tectonic line, the southern margin was wedged under the Qinghai–Tibet Plateau, and the northern margin was inserted under the Xing–Mongolian fold system. The Alxa–Dunhuang joint block not only resists the compression stress transmitted northward by the Indian plate but also closely connects the Siberian, Tarim, and North China Blocks [19].
Under the background of extrusion, the northern margin of the Alxa Block is divided into six belts, namely, the Yagan uplift, Zhusileng Early Paleozoic passive continental margin, Guaizihu Late Paleozoic ocean basin, ZongNaiShan–Shalazashan island arc, Wuliji back arc basin, and the Yabulai–Bayinauer ancient continental block. The northern margin of the Alxa Block has formed a complete trench–arc–basin system [2]. The Engelwusu ophiolite belt is the front of the Late Paleozoic Guaizihu ocean basin [16,20]. The Zonaishan–Shalazshan island arc merged with the Yabulai–Bayinauer ancient continental block in the early Permian, resulting in the closure of the back arc ocean basin into the Chaganchulu ophiolite belt. The Late Carboniferous Paleo-Asian subduction, represented by the Engelwusu ophiolite belt, formed a trench–arc–basin system in the northern margin of the Alxa Block [2].
2.2. Geophysical Background
The Bouguer gravity anomaly in the northern margin of the Alxa Block (hereinafter referred to as the NAB) is high in the northeast and low in the southwest. The crust thickness of the NAB is rapidly thickening from northeast to southwest [19,21]. The crustal thickness of the Tarim–Beishan–Alxa region beneath the study area changes dramatically, with crustal thickness varying from 40 km to 46 km [22]. A large area of negative magnetic field in the northern margin of the NAB corresponds to the Precambrian weak magnetic basement [23].
A seismic and magnetotelluric survey demonstrates that NAB subducted beneath the northern margin of Qinghai–Tibet Plateau in deep crust. The resistivity of the lower part of the Qilian Mountains is more than 7000 ohm-m, and the lowest resistivity of lower crust in NAB is several hundred. This resistivity distribution indicates that the southern margin of the NAB is inserted into the lower part of the lithosphere of the Qilian Mountains, and the northern margin of the NAB is inserted into the lower part of the Xingmongolian Fold system lithosphere [11,19,24,25,26]. The tectonic activity of the continental suture zone is intense, which leads to serious rock fragmentation, fracture development, destruction of water-resistant layer, and the release and migration of deep fluid. The characteristic of stratified resistivity distribution no longer exists. The area with well-developed pores and abundant fracture water shows mostly low-resistivity block. High and low resistivity clumps are stacked [27].
3. Data Collection and Qualitative Analysis
Aether is a magnetotelluric instrument (Crystal Globe Geophysical Research & Service, Houston, TX, USA) that was used for data acquisition through GPS timing positioning and the multi-channel synchronous continuous acquisition of high-frequency and low-frequency data. The measuring stations were arranged in a north–south, east–west direction, and the electrode distance in the same direction was 100 m. The time series of five components (Ex, Ey, Hx, Hy, and Hz) was collected.
To obtain spectrum information, the prMT software (Crystal Globe Geophysical Research & Service, Houston, Texas) was used for a time–frequency analysis of the original data. The impedance tensor information was calculated using Robust estimation [28]. After power spectrum selection, the full-frequency apparent resistivity and phase of each measuring station were calculated.
The MT data of profile L27 were collected from July to August 2021. The total length of the profile was approximately 440 km with 23 points, and the average span of measuring stations was approximately 20 km. The acquisition time was no less than 20 h. The acquisition frequency of each measurement station was 400–0.001 Hz, which was suitable for the inversion of the lower crust structure in the study area.
3.1. Analysis of Single Station Sounding Curve
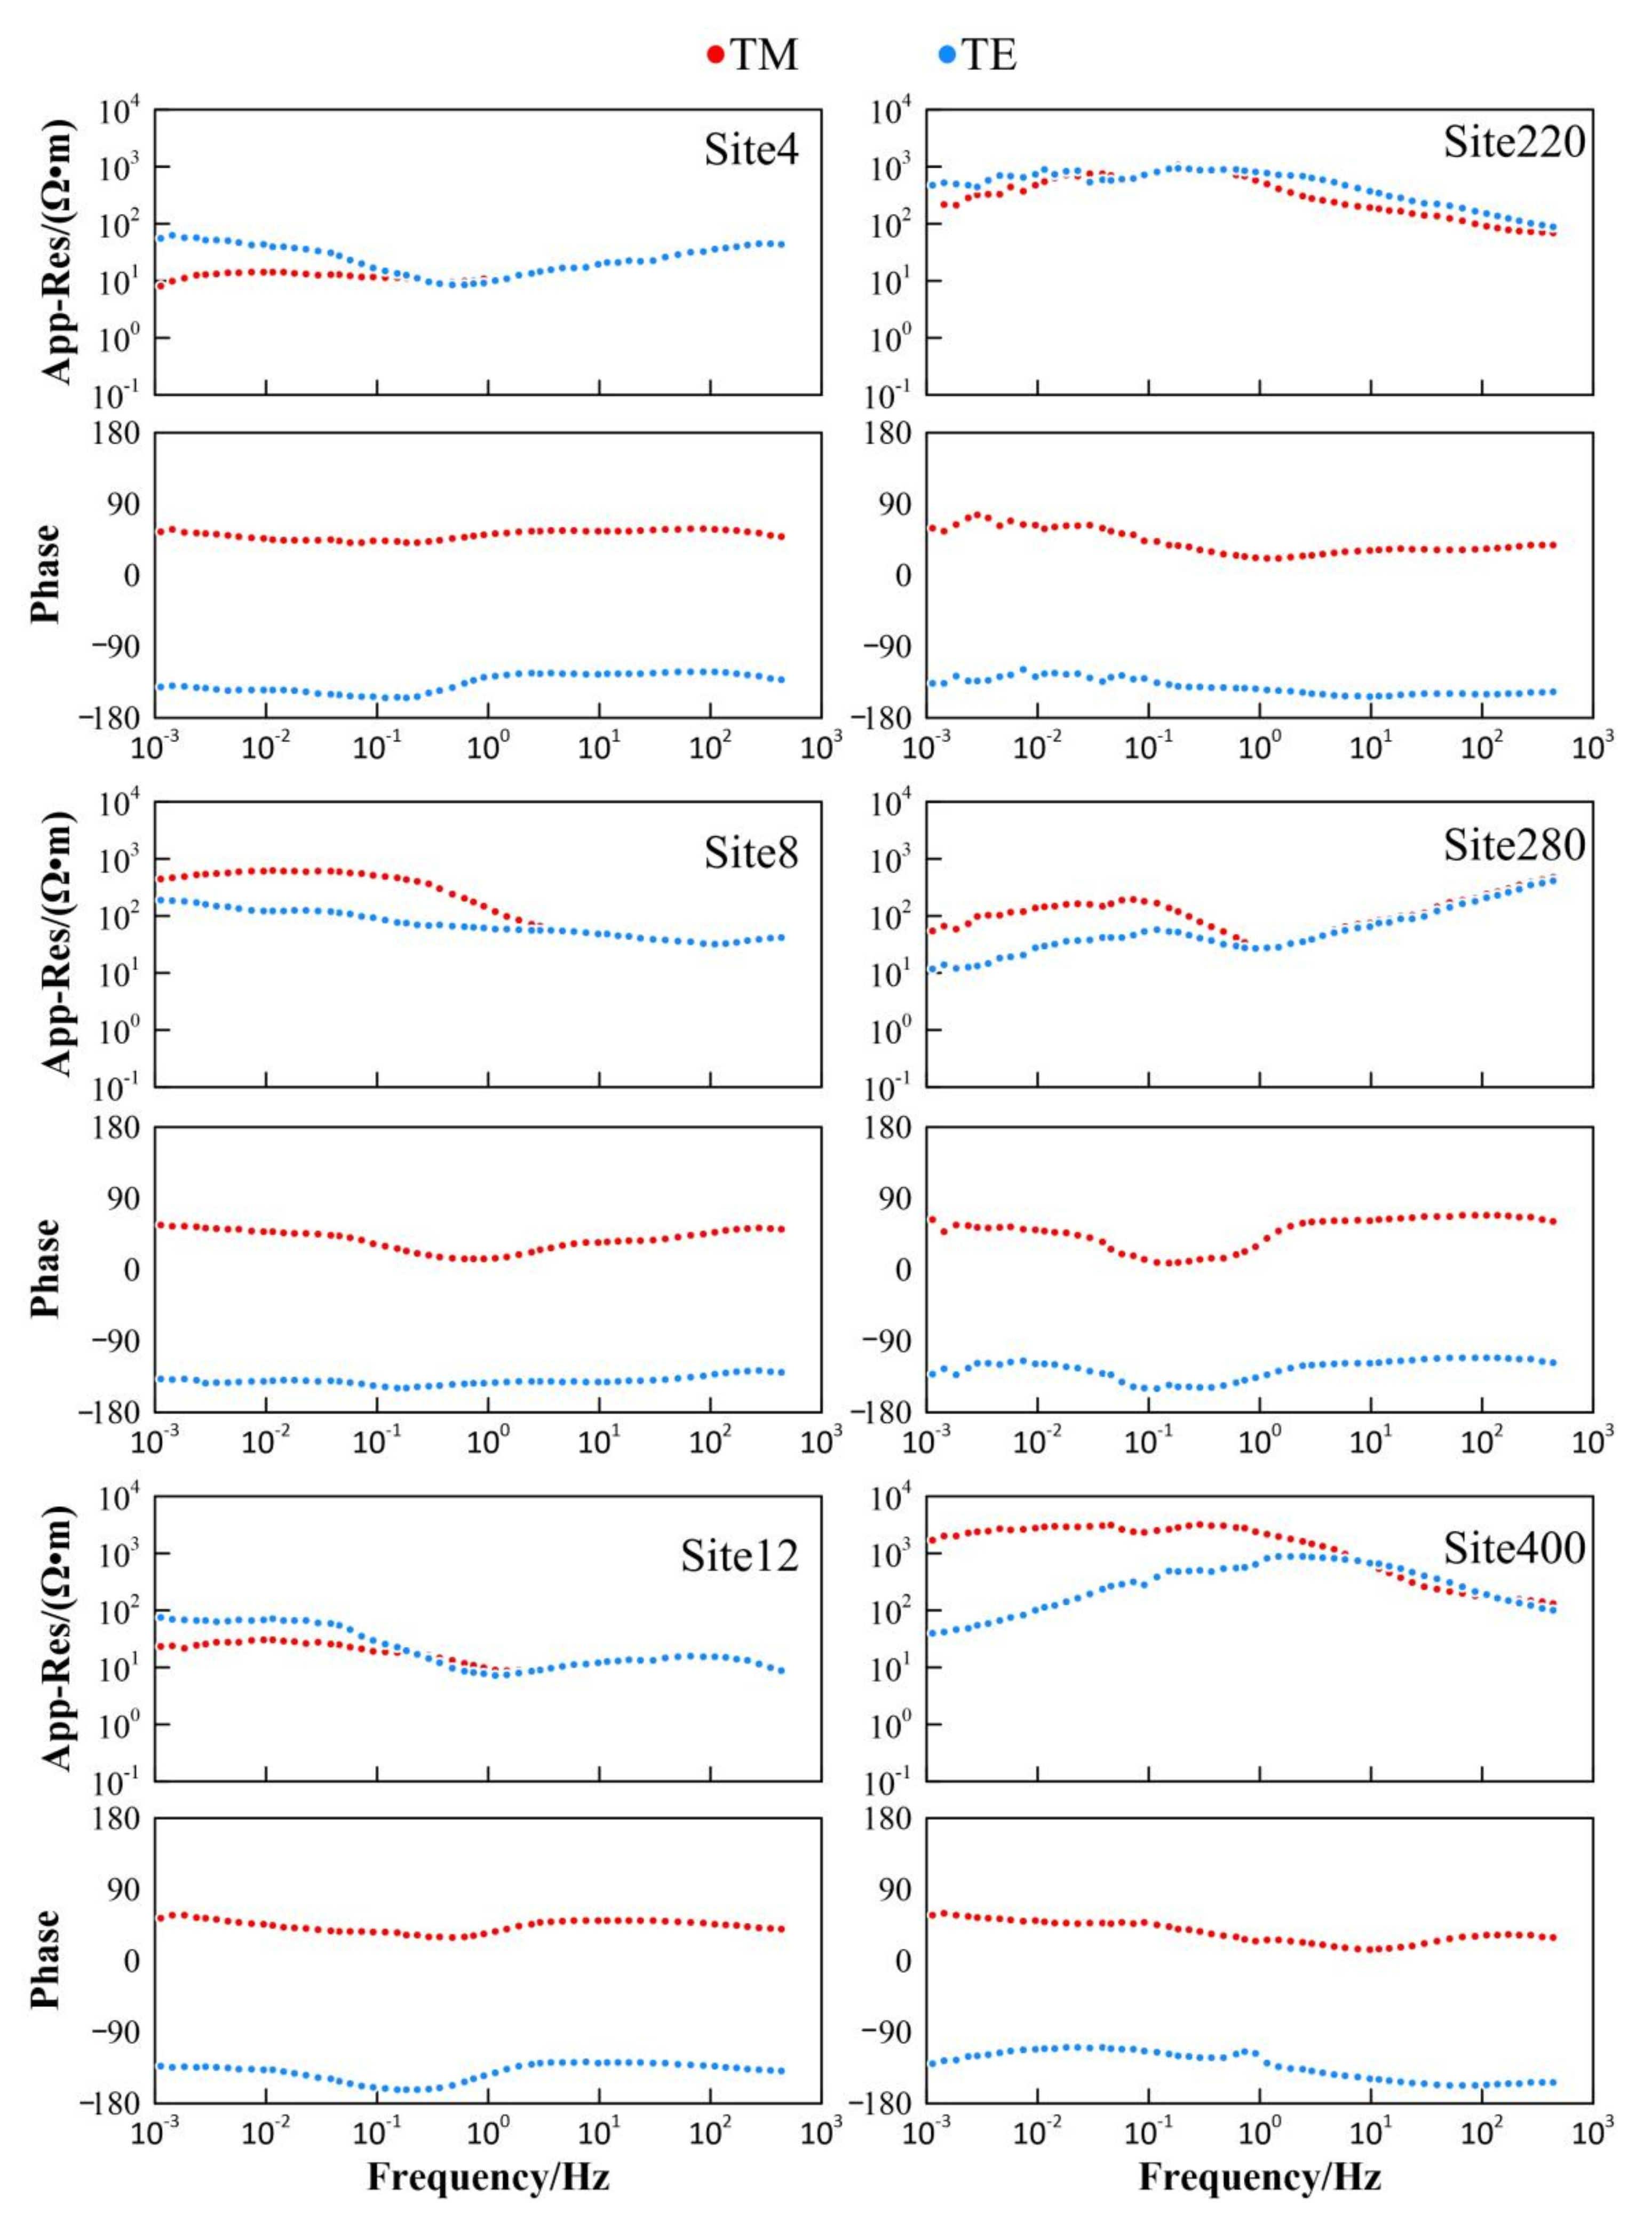
The apparent resistivity and phase curves of the measured stations along the profile directly reflect the characteristics of the underground electrical structure changing with depth (Figure 2). When static displacement exists in the apparent resistivity curves of the TE and TM models, the high-frequency part of the curves is parallel. Here, the static displacement of S220, S320, and S420 was corrected by comparing the apparent resistivity values of adjacent stations in the same structural unit [29], and the high-frequency partial overlap was finally achieved. Figure 2 demonstrates sounding curves of typical measuring stations along L27. The S220 and S240 points are located in the Qilian Mountain fold belt. The apparent resistivity curve is higher than that of other measuring stations. The thickness of coverage with low resistivity is less than 1 km. Generally, the shallow resistivity is high, and the deep resistivity is low. The burial depth of low resistivity geologic body deepens rapidly from north to south. The S240 and S260 sounding stations are located near the northern boundary fault of the Qilian Mountain fold belt, and their sounding curves differ. The S260–S320 stations are located in the Hexi Corridor. There is a low resistivity geologic body up to 4 km thickness in the shallow resistivity. Beneath the low resistivity geologic body there are blocks of high-resistivity geologic body with different burial depths. The overall resistivity distribution is characterized by low-high-low layered resistivity. The Longshoushan Fault zone between S320 and S360 is characterized by low-high layered resistivity. S400–S4 are located between the northern margin fault of Beidashan and the Engelwusu ophiolite belt. The resistivity of S1–S3 measuring stations is high, and the resistivity structure on both sides has a transition zone characteristic. The resistivity structure of the S4–S5 measuring stations is a high-low-high layered structure.
The resistivity structure of the S6–S10 measuring stations is a low-high-low layered one. The middle layer beneath the S8–S10 measuring stations has high resistivity, and the apparent resistivity increases gradually with increased depth. The resistivity of the S11–S12 measuring stations is generally low.
3.2. Dimensional Analysis
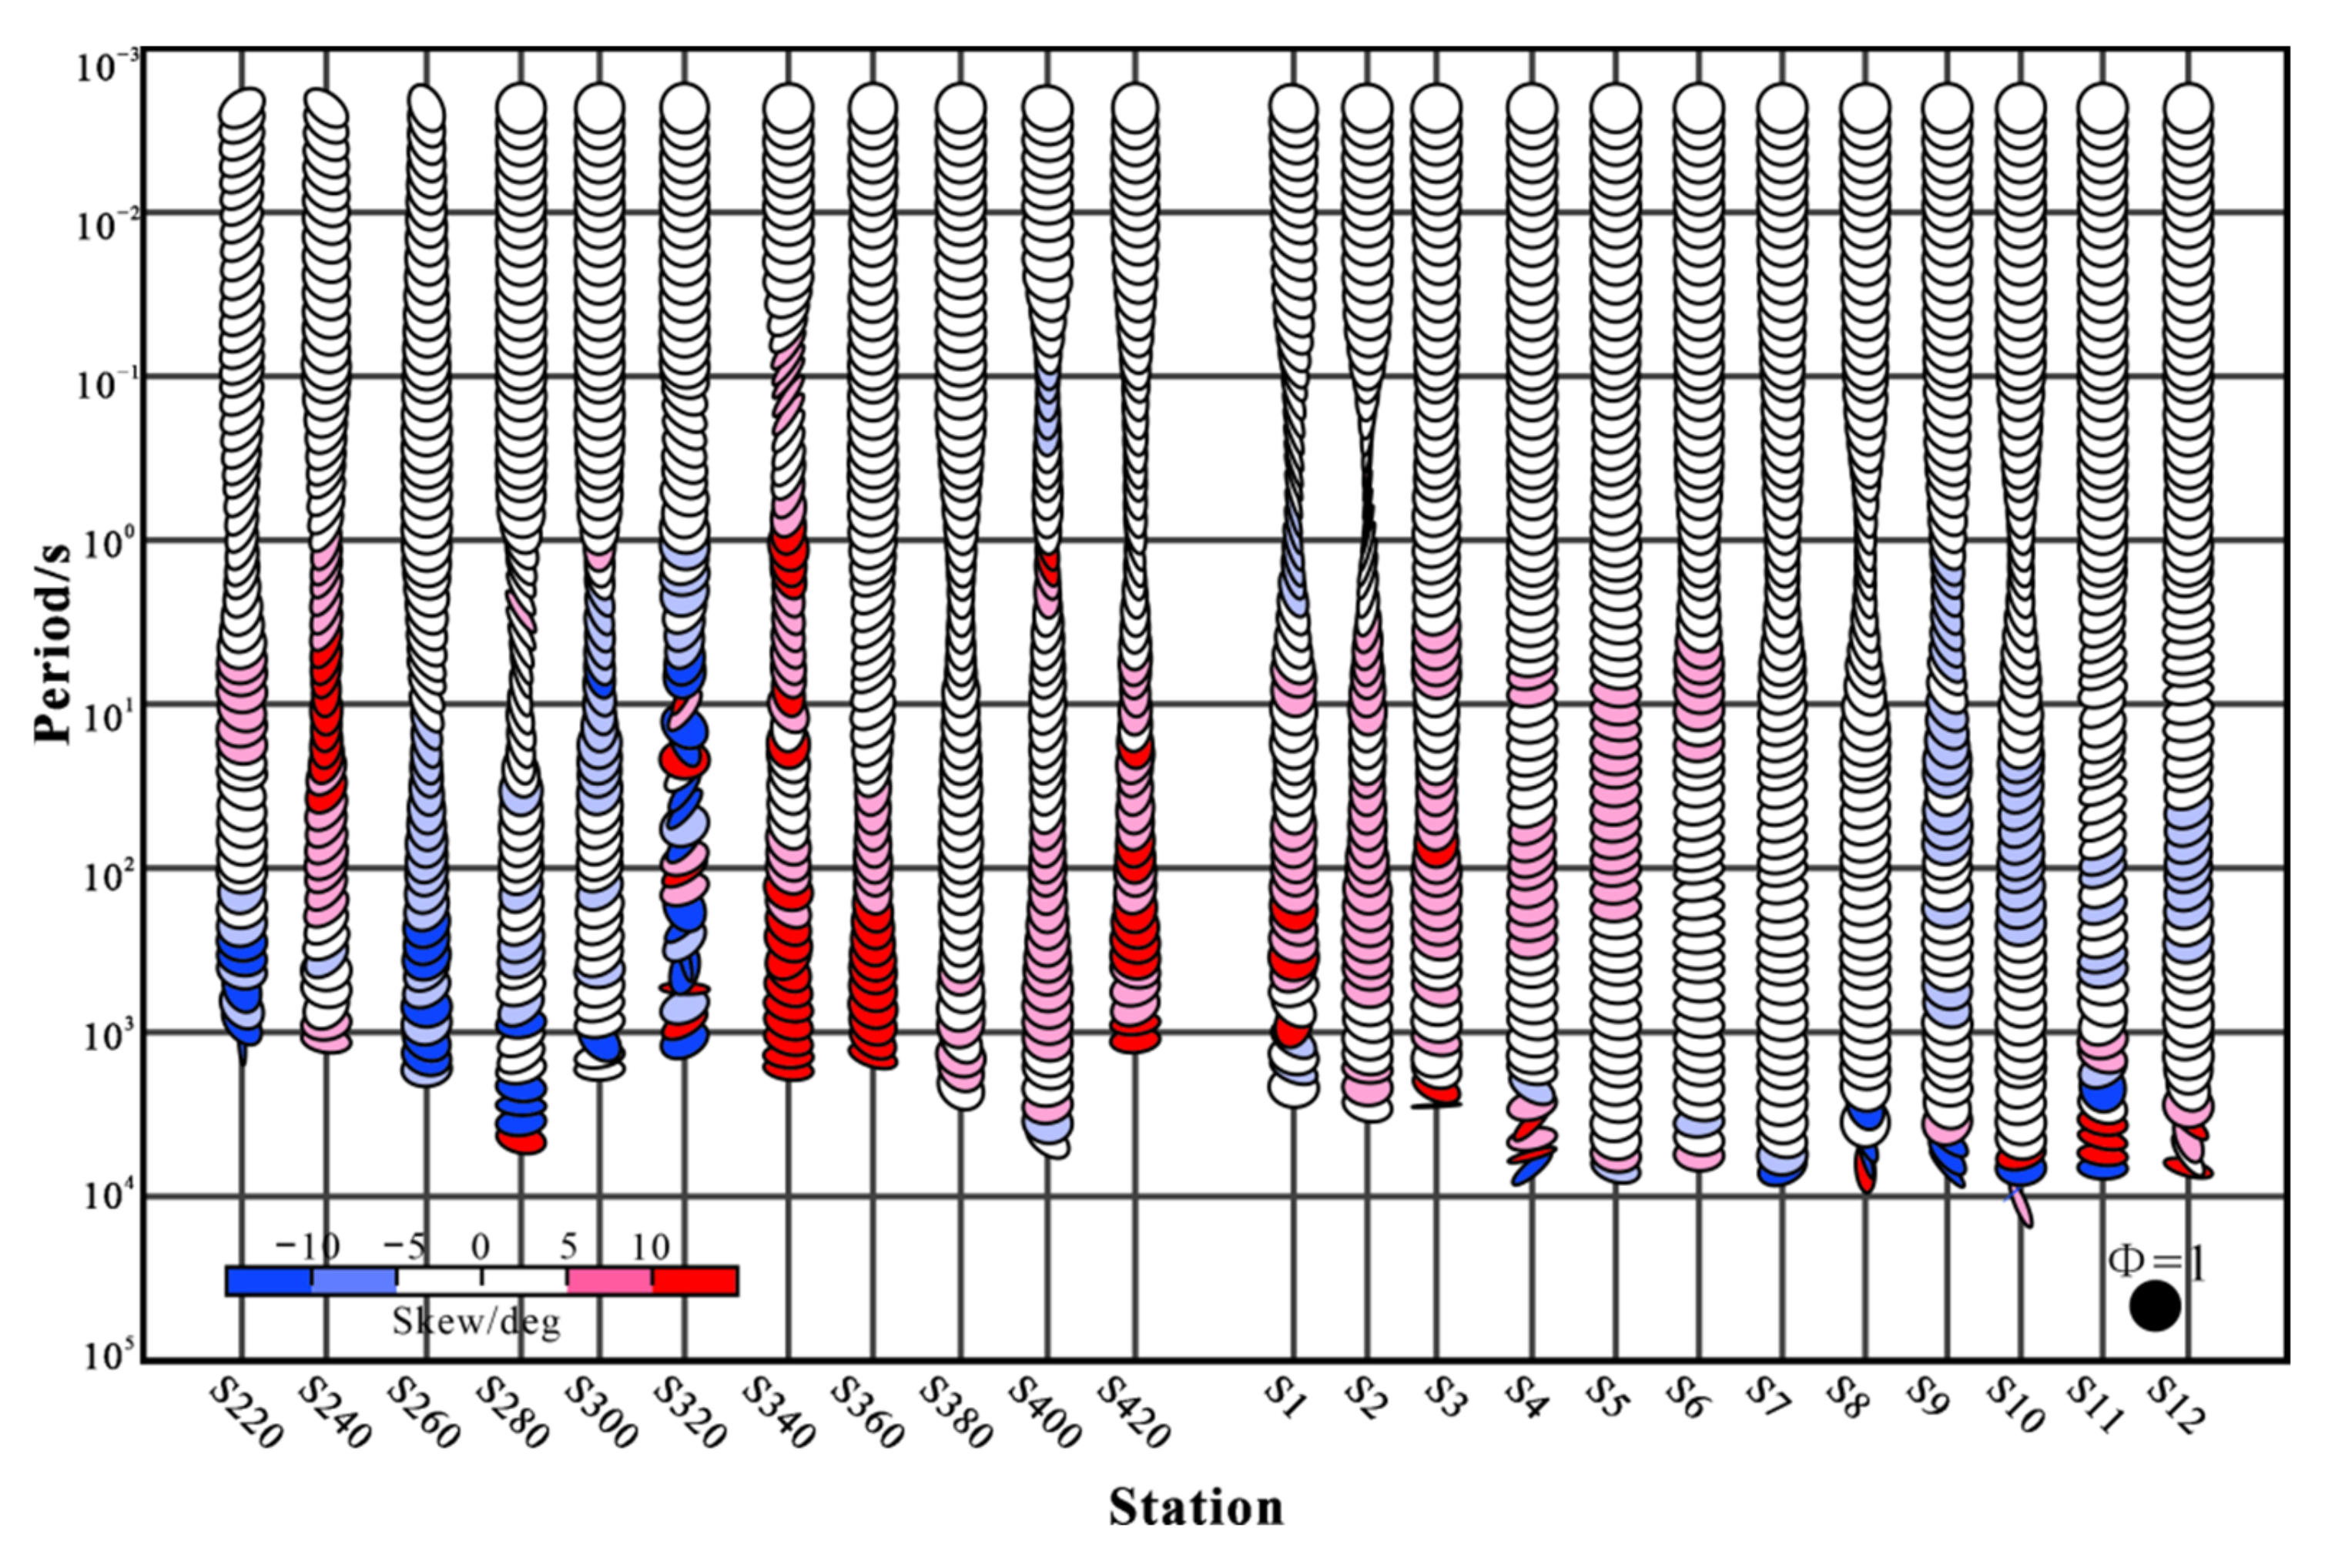
In this study, a phase tensor analysis [30] was used to analyze the dimension of geological structure of the profile for determining the corresponding inversion method (one-dimensional, two-dimensional, or three-dimensional inversion). The phase tensor bevel (β) can be represented by an elliptic graph. The larger the β value, the more complex the underground structure. The smaller the β value, the more homogeneous the underground structure. In general, when β is less than 3°, the underground electrical distribution can be regarded as a two-dimensional structure [31]. Figure 3 shows the phase tensor of all frequencies at each measuring station. The β values at most frequencies at all sites were within ±5°. Therefore, the electrical structure along the profile can be approximated by a two-dimensional model.
3.3. Electrical Spindle Analysis
Before 2D inversion, the electrical principal axis should be determined and the magnetotelluric sounding data should be rotated to the corresponding coordinate system. In this study, the conjugate impedance change method was utilized [26,32] to perform electrical spindle analysis on all measuring stations (Figure 4).
The electrical spindle direction has 90° uncertainty, which needs to be determined according to relevant geological and geophysical data. The phase tensor decomposition rose diagram of all measured stations along the profile (Figure 4) indicates that the electrical spindle direction is N80°W. When considering that the main fault in the study area is in the NWW direction, the dominant tectonic spindle direction of the region was determined to be N80°W. All measuring stations were rotated 80 degrees to the west. The TE and TM patterns of apparent resistivity and impedance phase data were identified according to the electrical spindle direction.
4. Results
4.1. Inversion Parameters
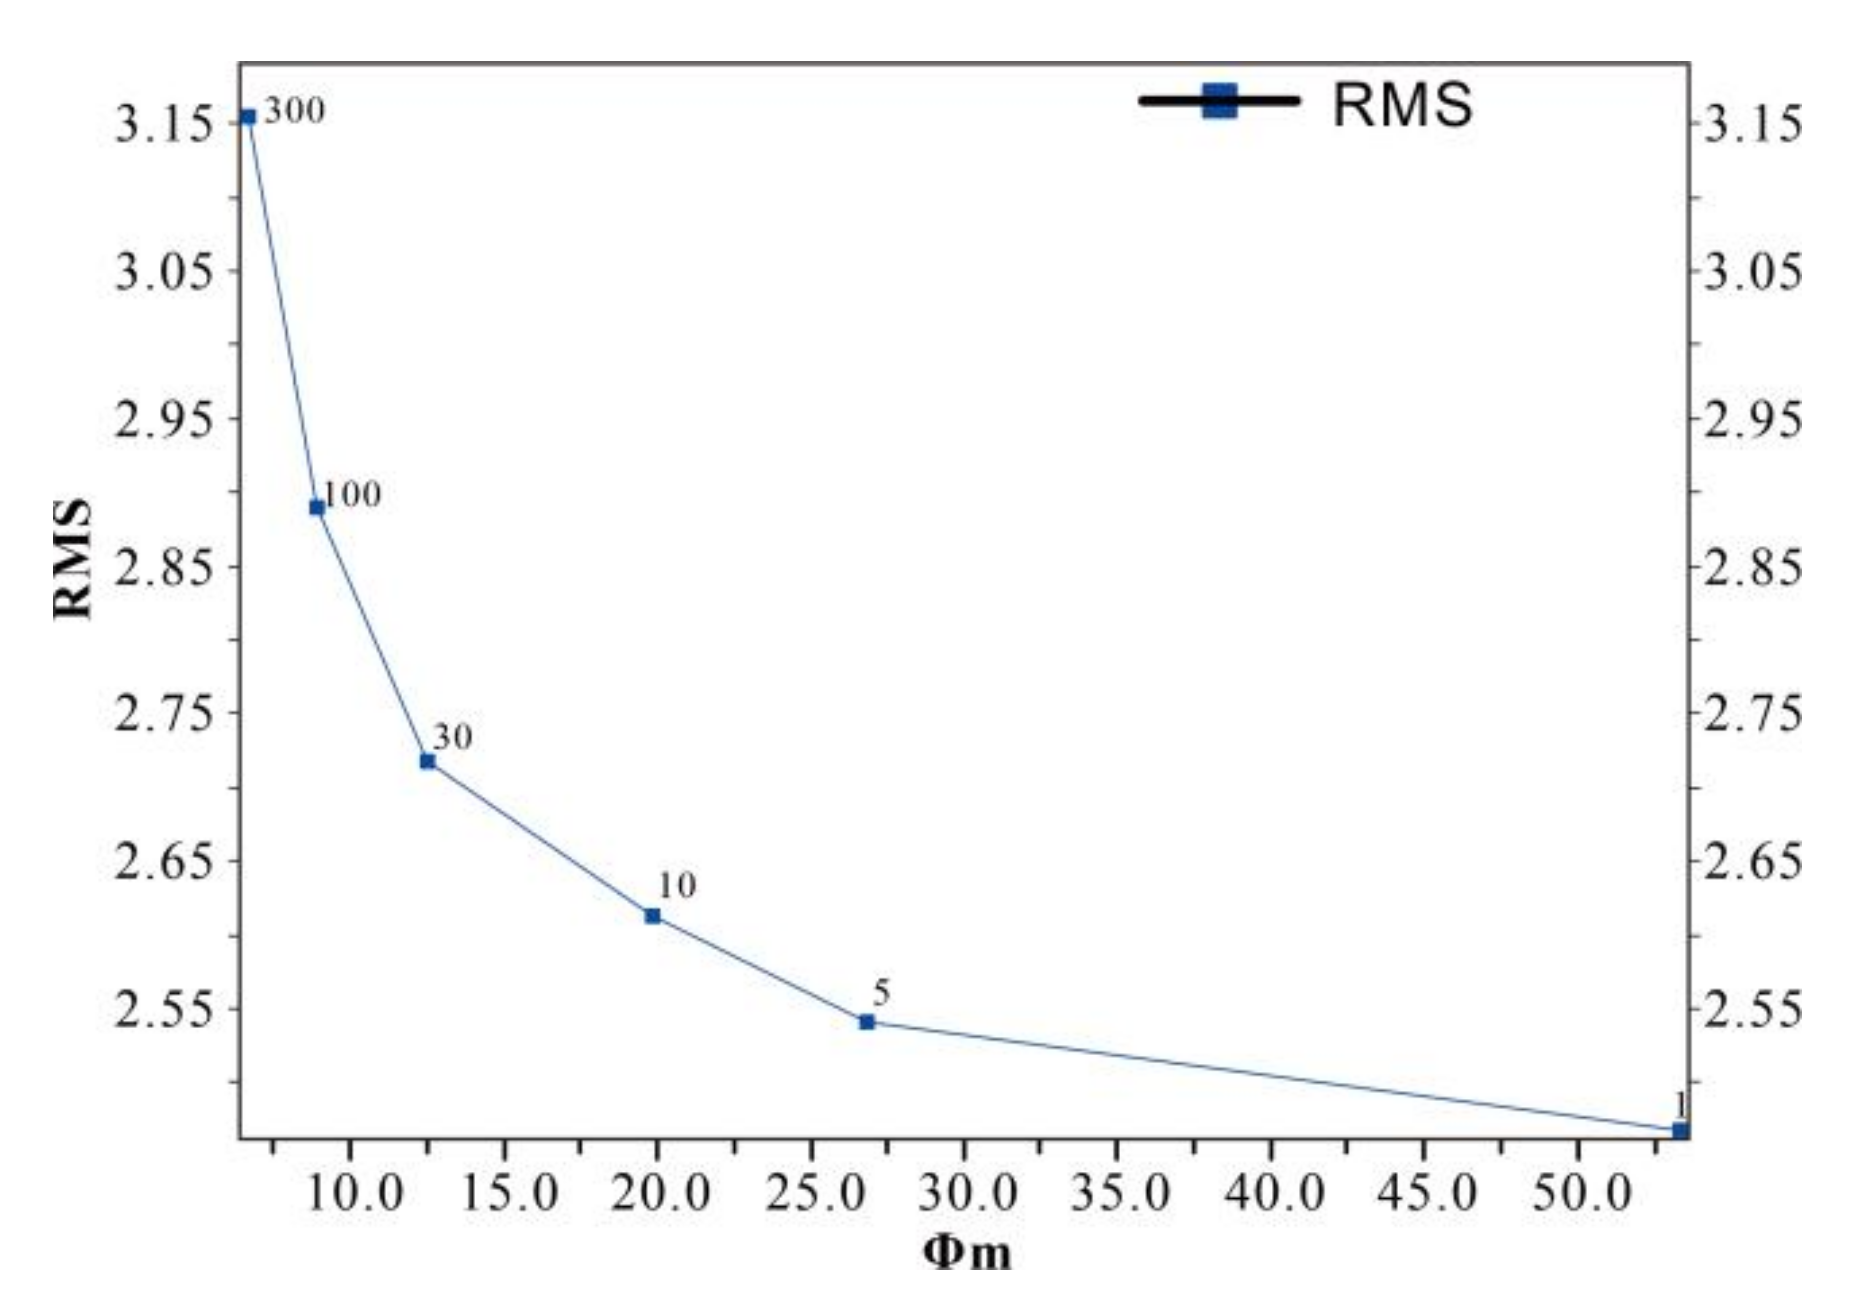
The nonlinear conjugate gradient algorithm (NLCG) [29] was used for the two-dimensional inversion. This algorithm has stable convergence in actual inversion [33]. In the inversion parameters, setting the apparent resistivity error limits to a large value is an effective method for overcoming the static displacement of magnetotelluric sounding data [34,35]. The initial two-dimensional inversion model has 100 ω·m homogeneous half space. When considering the importance of the regularization parameter (tau) and apparent resistivity phase error in the NLCG algorithm, the optimal value of tau was selected through a curve analysis [36]. The turning point of the curve is a good tau value [37]. The curve analysis shows that tau = 10 is the optimal choice (Figure 5). We also compared the model roughness obtained using different polarization data and found that the TE-only model roughness is unstable, which affects the results of the combined TE + TM model. In the final inversion, we used the TM model for two-dimensional inversion.
4.2. Electrical Model Analysis
The fitting difference in two-dimensional inversion is less than 3 (Figure 6), indicating that the electrical structure model obtained by inversion can better reflect the underground structural characteristics. The fitting difference between the S260 and S280 points is large, which is influenced by the northern boundary of the Northern Qilian fold belt. The fitting difference between S1 and S2 is large and is plausibly influenced by the broken boundary of the plate suture zone.
The electrical structure model of L27 (Figure 6) can be divided into multiple structural zones from south to north. These are, successively, the Qilian Mountain fold belt, the Hexi Corridor transition zone, the Alxa microcontinent, the eastern edge of the Tarim Block, and the Southern Mongolia microcontinent. Three types of crust–mantle electrical structures can be divided along the section from south to north, namely, a low-high-low layered electrical structure in the crust–mantle under the Hexi Corridor, a high-low-high layered electrical structure of the northern Alxa [38,39], and a typical low-high layered electrical structure in the crust–mantle in the north of the Engelwusu belt.
The Engelwusu ophiolite belt (S400–S3) is a structural boundary zone. The southern side of the belt is dominated by extrude stacked clumps of high and low resistivity bodies, with many electrical gradient zones and large extensions. The fault strike is mostly NWW trending and tends to the SW. The faults in the shallow strata are high-angle thrust faults [39]. The north side is dominated by layered structures, and the faults are mostly NEE trending, with a tendency of NNW [21].
4.3. Geological Inference and Interpretation
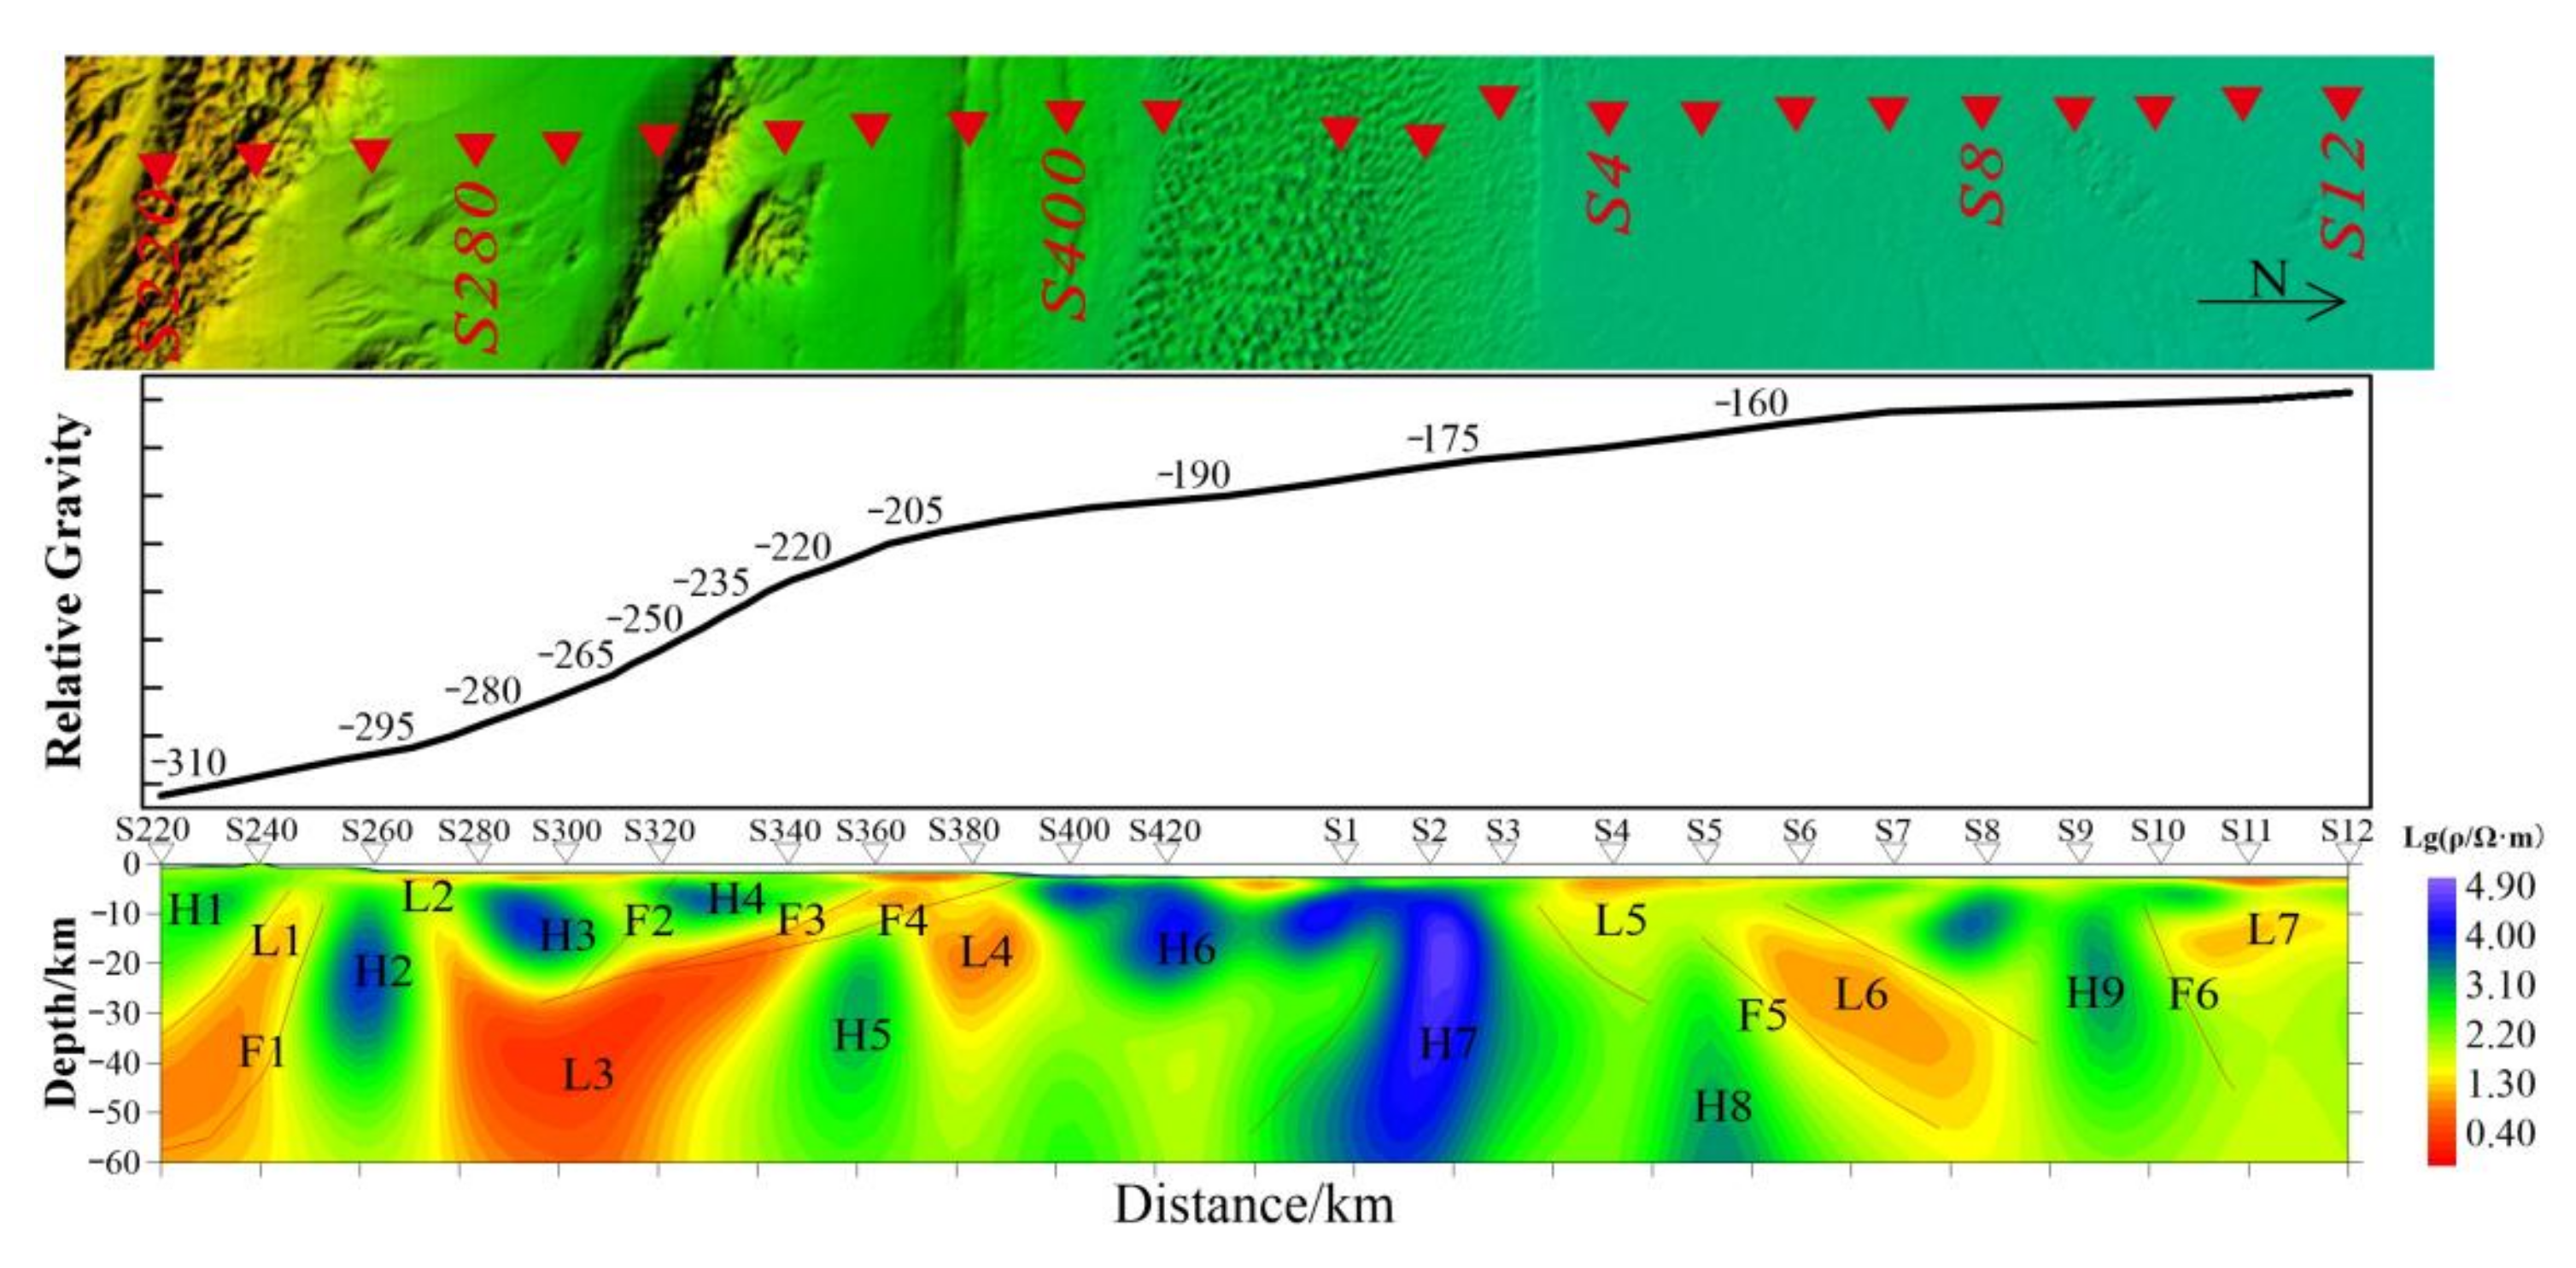
Combined with relevant geological and geophysical data, the geological structure characteristics of the electrical structure model of section L27 were analyzed (Figure 7). The fault zone shows obvious characteristics of electrical gradient, and the tectonic pattern and contact relationship of each block are well displayed along the survey line (Figure 7). The following is an analysis of the electrical structure characteristics of each block from south to north.
4.3.1. North Margin Fault of the North Qilian Mountains
The North Margin of the North Qilian Mountains Fault zone (F1) is located in the middle of the Qilian Mountains thrust zone in the northeast margin of the Qinghai–Tibet Plateau. Below stations S240–S260, it strikes NW–SE, with a dip angle of approximately 60°, and moves northward along the Yuanshanzi–Pingchuan strike-slip fault east of the Hongshuiba River. It belongs to the Cenozoic thrust zone [26,40].
The low resistivity anomaly (L1) in the electrical structure model reflects the subduction of the corridor transition zone beneath the North Qilian terrane. The high-resistivity anomaly area (H1) was formed by the continuous uplift of the North Qilian because of collision and compression between the Indian and Eurasian Plates during the Late Himalayan Movement [41,42]. Finally, the Silurian flysch, with higher resistivity, overthrust the Cretaceous, and Cenozoic strata with lower resistivity was formed [26,42]. The high resistivity (H2) indicates the Paleo-oceanic basement uplift [42,43].
4.3.2. Corridor Transition Zone
The corridor transition zone is located between the northern margin of the North Qilian Mountains Fault and the Longshoushan Fault (S260–S320). The upper crust structure is relatively complex. The formation of Longshoushan was associated with the collision and compression of the North China and Qilian Plates [44]. The Longshoushan Fault (F2) is the boundary between the Alxa Block and the Hexi Corridor. The fault presents an obvious electrical gradient zone in the electrical profile, dipping to the southwest and striking steeply. After the closure of the Qilian Paleo-sea basin, the Qinghai-Tibet and Alxa Blocks continued to collide and squeeze, making the Longshoushan Group with high resistivity overthrust Meso-Cenozoic strata with low resistivity [45,46]. The crust–mantle electrical structure of the corridor transition zone is characterized by low resistivity in shallow, high resistivity in middle, and low resistivity in deep areas. There are two high-resistivity blocks (H3 and H4) in the vicinity of the Longshoushan Fault, which are consistent with the results of magnetotelluric sounding from the Qilian Mountains to the Alxa region [26,38]. Beneath the high-resistivity body, there is a saddle-shaped low resistivity L3 extending deep to the top of the upper mantle. This is similar to other findings [26,47]. We infer that the low resistivity body was formed when the Alxa Block inserted into the deep of the Hexi Corridor during the NE pushing process of the Qinghai–Tibet Plateau Block. The surface thrusts in response to the northeast growth of the Qinghai–Tibet Plateau extend to the north side of the Hexi Corridor, that is, the thrust structure of the Alxa Block along the Kuantan Mountain Fault (F3) below the Hexi Corridor. A clump structure H5 with high resistivity was detected in the lower crust–upper mantle of the northern edge of the Hexi Corridor, which is cold lithosphere material of the Alxa Block, similar to the “crocodile structure” delineated by Xiao Qibin at Kuantanshan south of Huahai [11].
4.3.3. Northwest Margin of the Alxa Microcontinent
The Alxa microcontinent can be divided into three tectonic units from south to north, namely, the Yabulai–Bayanuori continental margin, the Wuliji back arc basin, and the Zongnai–Salazashan island arc belt [2,48,49].
The region between the Longshoushan Fault (F2) and the Engelwusu ophiolite belt (from stations S380 to S4) belongs to the northwest margin of the Alxa microcontinent. The electrical structure in this area does not have the typical layered structure characteristics of the Alxa Block [25,39,50,51,52] and instead, blocks with high and low resistivity are superimposed together. There are many resistivity gradient zones between them that extend deep. The southern margin fault of Beidashan (F4) is to the north of S380 and tends to the southwest. F4 is fused with the Kuantanshan (F3) and Longshoushan (F2) faults in the lower crust. With the high-resistivity H7 as the center, blocks with high or low resistivity are approximately symmetrically distributed on both sides. The layered low resistivity, from surface to a depth of 8 km, with resistivity of tens to hundreds of ohms, is suggested to be the Mesozoic–Cenozoic sedimentary cap layer in this region [25,39,50].
The clumpy high resistivity (H6) below S420 and the clumpy high resistivity (H7) below S2 correspond to uplift with high resistivity at the bottom of an ancient ocean. Combined with the characteristics of gravity values of the same section [21], we infer that the high-resistivity area corresponds to a suture zone between plates [48,53].
4.3.4. Eastern Margin of the Tarim Plate
The eastern edge of the Tarim Plate is distributed between the Engelwusu ophiolite belt and the Yagan Fault (F6) [2,9]. From south to north, it can be divided into the Guaizihu Late Paleozoic ocean basin, the Zhusileng Early Paleozoic passive continental margin, and the Huhetauergai Early Paleozoic arc [2,20]. The electrical structural profile (from S4 to S10) shows that the northern margin of Engelwusu (F5) dips to NW, low resistivity (L5) is Cenozoic overburden, and low resistivity (L6) subducts below high resistivity (H9), which represents passive continental margin [2].
4.3.5. Southern Mongolia Microcontinent
The southern margin of the Southern Mongolia microcontinent is located in the western Alxa League of Inner Mongolia and the border between China and Mongolia. In the south, the Yagan Fault (F6) is connected to the eastern edge of the Tarim Block [21]. Tectonically, it belongs to the southern margin of the Late Paleozoic orogenic belt in Central Asia [54,55]. The structures are arc-shaped in the direction of NE–SW.
The Yagan metamorphic core complex, located north of S10, developed from fracture and subsidence of the basement in the Meso–Neoproterozoic basement rift [55].
5. Discussion
5.1. Gravity Gradient Zone
The difference between the maximum value of the gravity anomaly in the northeast and the minimum value in the southwest edge of the study area is 135 mGal (Figure 6). The characteristics of the gravity field in this region reflect the undulation characteristics of the deep density interface (presumed to be the Moho surface) in the study area, that is, the crust thickens rapidly from northeast to southwest [21]. The results of the present study suggest that the plate boundary between S400 and S3 points on the section (Engelwusu ophiolite belt) corresponds to the gravity gradient zone, which explains the rationality of the electrical structure model (Figure 6).
5.2. Metallogenic Prospect
The south side of the Engelwusu Belt (hereinafter referred to as the south side) is the Wuliji–Oubrag Copper–Iron–Au–Nickel–Cobalt–Uranium metallogenic belt, and the north side (hereinafter referred to as the north side) is the Zhusileng–Hulunxibai–Yagan Copper–Lead–Zinc–Au–Nickel metallogenic sub-belt [56,57]. The electrical structure model shows that the south side is characterized by clusters of high and low resistivity, corresponding to the gradient zone of rapid gravity rise. There are many EW structures distributed among them. The north side is mainly characterized by approximately layered resistivity, corresponding to stable high gravity values. There are many NE and NW structures distributed among them. According to the geophysical characteristics of ore bodies [19,21], it is concluded that the south side is a favorable area for Late Variscian–Indosinian volcanic–subvolcanic, skarn, and porphyry Cu–Au deposits, while the north side is a prospective area for Indosinian Au–Cu deposits. The south side is more favorable to mineralization than the north side.
6. Conclusions
According to the electrical structure model, combined with the geological and geophysical data of the study area, the geological structure from Ejinaqi to Minle is characterized as zoned from north to south.
The electrical structural model shows that the crust–mantle structure is a high resistivity sandwich structure from the northern edge of the North Qilian Mountains to the southern edge of the Longshoushan Mountains. The Engelwusu ophiolite has complex electric structure. The low resistivity extending downward on either side of the Engelwusu Belt indicates that the ancient ocean was subducted to the north and south plates.
The Engelwusu ophiolite zone is a suture zone of plates. To the south of the suture zone is the structural slope transition zone with abundant mineral deposits, while to the north is the structural stable zone with relatively few mineral deposits. The electrical structure characteristics indirectly indicate prospecting prospects.
To sum up, the indirect method is based on a step-by-step solution of the prospecting model, based on geophysical property differences in relevant geological bodies, in-depth analysis of regional deep structure characteristics, comparison of mineral distribution in investigation area [58,59], and finally predicting prospecting potential area, effectively reducing the cost of prospecting. The indirect method has popularization value in solving the problem of ore body prospect prediction around ophiolite mixed rock fracture zones.
Author Contributions
Conceptualization, Y.M.; methodology, Y.M.; software, G.W. and W.W.; validation, G.W. and R.L.; formal analysis, W.W.; investigation, Y.M.; resources, X.C.; data curation, Y.M.; writing—original draft preparation, Y.M.; writing—review and editing, Y.M.; visualization, Y.M.; supervision, X.C.; project administration, Y.M.; funding acquisition, X.C. All authors have read and agreed to the published version of the manuscript.
Funding
This research was funded by The Project of China Geological Survey, grant number DD20208001, DD20208002, and ZD20220507.
Data Availability Statement
Not applicable.
Acknowledgments
We thank Guo Changan, Guo Tianpeng, and Wang Yijing for field work assistance. The NLCG code used in this article was obtained from a shared version published by Randall Mackie at MIT in 1996. Part of the illustrations in this paper were drawn using the toolkit MTpy published by Lars Krieger and Jared R. Peacock [60].
Conflicts of Interest
The authors declare no conflict of interest.
References
- Deng, J.; Wang, Q.F.; Li, G.J. Tectonic evolution, superimposed orogeny, and composite metallogenic system in China. Gondwana Res. 2017, 50, 216–266. [Google Scholar] [CrossRef]
- Zhang, W. Late Paleozoic Granitoids in Beishan-Northern Alxa Area (NW China) and Their Tectonic Implications. Ph.D. Thesis, Bejing University, Beijing, China, 2013. (In Chinese). [Google Scholar]
- Qiu, K.F.; Yu, H.C.; Deng, J.; McIntire, D.; Gou, Z.Y.; Geng, J.Z.; Chang, Z.S.; Zhu, R.; Li, K.N.; Goldfarb, R.J. The giant Zaozigou orogenic Au-Sb deposit in West Qinling, China: Magmatic or metamorphic origin? Miner. Depos. 2020, 55, 345–362. [Google Scholar] [CrossRef]
- Zhang, J.; Zhang, B.H.; Zhao, H. Timing of amalgamation of the Alxa Block and the North China Block: Constraints based on detrital zircon U–Pb ages and sedimentologic and structural evidence. Tectonophysics 2016, 668, 65–81. [Google Scholar] [CrossRef]
- Zhang, J.; Cunningham, D.; Qu, J.F.; Zhang, B.H.; Li, J.Y.; Zhao, H.; Niu, P.F.; Hui, J.; Yun, L.; Zhao, S.; et al. Poly-phase structural evolution of the northeastern Alxa Block, China: Constraining the Paleozoic-Recent history of the southern central Asian Orogenic belt. Gondwana Res. 2022, 105, 25–50. [Google Scholar] [CrossRef]
- Long, X.P.; Yuan, C.; Sun, M.; Kroner, A.; Zhao, G.C. New geochemical and combined zircon U–Pb and Lu–Hf isotopic data of orthogneisses in the northern Altyn Tagh, northern margin of the Tibetan plateau: Implication for Archean evolution of the Dunhuang Block and crust formation in NW China. Lithos 2014, 200, 418–431. [Google Scholar] [CrossRef]
- Feng, J.Y.; Xiao, W.J.; Windley, B.; Han, C.M.; Wan, B.; Zhang, J.; Ao, S.J.; Zhang, Z.Y.; Lin, L.N. Field geology, geochronology and geochemistry of mafic–ultramafic rocks from Alxa, China: Implications for Late Permian accretionary tectonics in the southern Altaids. J. Asian Earth Sci. 2013, 78, 114–142. [Google Scholar] [CrossRef]
- Ren, J.S.; Niu, B.G.; Liu, Z.G. Soft collision, superposition orogeny and polycyclic suturing. Earth Sci. Front. 1999, 6, 85–93. (In Chinese) [Google Scholar]
- Hui, J.; Cheng, H.Y.; Zhang, J.; Zhang, K.J.; Qu, J.F.; Zhang, B.H. Early Cretaceous continent basalts in the Alxa Block, NW China: Geochronology, geochemistry, and tectonic implications. Int. Geol. Rev. 2021, 63, 882–899. [Google Scholar] [CrossRef]
- Ye, Z.; Li, Q.S.; Gao, R.; Zhang, H.S.; Shen, X.Z.; Liu, X.Z.; Gong, C. Anisotropic regime across northeastern Tibet and its geodynamic implications. Tectonophysics 2016, 671, 1–8. [Google Scholar] [CrossRef]
- Xiao, Q.B.; Shao, G.H.; Zeng, L.Z.; Oskin, M.E.; Zhang, J.; Zhao, G.Z.; Wang, J.J. Eastern termination of the Altyn Tagh Fault, western China: Constraints from a magnetotelluric survey. J. Geophys. Res. Solid Earth 2015, 120, 2838–2858. [Google Scholar] [CrossRef]
- Jahn, B.M.; Wu, F.Y.; Chen, B. Granitoids of the Central Asian Orogenic Belt and continental growth in the Phanerozoic. Trans. R. Soc. Edinb. Earth Sci. 2000, 91, 181–193. [Google Scholar] [CrossRef]
- Windley, B.F.; Alexeiev, D.; Xiao, W.; Kröner, A.; Badarch, G. Tectonic models for accretion of the Central Asian Orogenic Belt. J. Geol. Soc. 2007, 164, 31–47. [Google Scholar] [CrossRef] [Green Version]
- Xiao, W.J.; Han, C.M.; Yuan, C.; Sun, M.; Zhao, G.C.; Shan, Y.H. Transitions among Mariana-, Japan-, Cordillera- and Alaska-type arc systems and their final juxtapositions leading to accretionary and collisional orogenesis. Geol. Soc. Spec. Publ. 2010, 338, 35–53. [Google Scholar] [CrossRef] [Green Version]
- Jian, P.; Liu, D.Y.; Kröner, A.; Windley, B.F.; Shi, Y.R.; Zhang, F.Q.; Shi, G.H.; Miao, L.C.; Zhang, W.; Zhang, Q.; et al. Time scale of an early to mid-Paleozoic orogenic cycle of the long-lived Central Asian Orogenic Belt, Inner Mongolia of China: Implications for continental growth. Lithos 2008, 101, 233–259. [Google Scholar] [CrossRef]
- Sun, W.; Li, S.; Liu, X.; Santosh, M.; Zhao, S.; Guo, L.; Cao, H.; Yu, S.; Dai, L.; Zhang, Y. Deep structures and surface boundaries among Proto-Tethyan micro-blocks: Constraints from seismic tomography and aeromagnetic anomalies in the Central China Orogen. Tectonophysics 2015, 659, 109–121. [Google Scholar] [CrossRef]
- Zhang, Y.P.; Zhang, J.; Chen, X.H.; Wang, Y.N.; Zhao, H.; Nie, F.J.; Zhang, B.H. Late Palaeozoic tectonic setting of the southern Alxa Block, NW China: Constrained by age and composition of diabase. Int. Geol. Rev. 2017, 59, 1028–1046. [Google Scholar] [CrossRef]
- Xiao, Q.B.; Zhang, J.; Zhao, G.; Wang, J. Electrical resistivity structures northeast of the Eastern Kunlun Fault in the Northeastern Tibet: Tectonic implications. Tectonophysics 2013, 601, 125–138. [Google Scholar] [CrossRef]
- Xu, W.; Sun, Z.M.; Shi, G.R.; Lu, J.C.; Yu, L.; Niu, Y.Z.; Zhao, Y.; Han, X.F.; Wang, B.W.; Song, B.; et al. First report of coupled Early Permian paleomagnetic and geochronologic data from the Dunhuang block (NW China), and implications for the tectonic evolution of the Paleo-Asian ocean. Gondwana Res. 2019, 67, 46–63. [Google Scholar] [CrossRef]
- Zheng, R.G.; Wu, T.R.; Zhang, W.; Xu, C.; Meng, Q.P.; Zhang, Z.Y. Late Paleozoic subduction system in the northern margin of the Alxa block, Altaids: Geochronological and geochemical evidences from ophiolites. Gondwana Res. 2014, 25, 842–858. [Google Scholar] [CrossRef] [Green Version]
- Wu, Y.W. A Comparative Research on the Tectonic and Sedimentary Background in Late Paleozoic in Beishan and Yin’Gen-Eji’naqi Area. Master’s Thesis, Chang’an University, Xi’an, China, 2014. (In Chinese). [Google Scholar]
- Goldfarb, R.J.; Mao, J.W.; Qiu, K.F.; Goryachev, N. The great Yanshanian metallogenic event of eastern Asia: Consequences from one hundred million years of plate margin geodynamics. Gondwana Res. 2021, 100, 223–250. [Google Scholar] [CrossRef]
- Gao, G.M.; Lu, Q.M.; Wang, J.; Kang, G.F. Constraining crustal thickness and lithospheric thermal state beneath the northeastern Tibetan Plateau and adjacent regions from gravity, aeromagnetic, and heat flow data. J. Asian Earth Sci. 2021, 212, 104743. [Google Scholar] [CrossRef]
- Xu, Z.Q.; Yang, J.S.; Wu, C.L.; Li, H.B.; Zhang, J.X.; Qi, X.X.; Song, S.G.; Qiu, H.J. Timing and mechanism of formation and exhumation of the Northern Qaidam ultrahigh-pressure metamorphic belt. J. Asian Earth Sci. 2006, 28, 160–173. [Google Scholar] [CrossRef]
- Xiao, Q.B.; Zhang, J.; Wang, J.; Zhao, G.Z.; Tang, J. Electrical resistivity structures between the Northern Qilian Mountains and Beishan Block, NW China, and tectonic implications. Phys. Earth Planet. Inter. 2012, 200, 92–104. [Google Scholar] [CrossRef]
- Zhang, Y.; An, Z.G.; Dong, Y.H. Study of the crust electrical structure of Zhangye Basin. Prog. Geophys. 2021, 36, 1477–1486. (In Chinese) [Google Scholar] [CrossRef]
- Zhao, G.Z.; Tang, J.; Zhan, Y.; Chen, X.B.; Zhuo, X.J.; Wang, J.J.; Xuan, F.; Deng, Q.H.; Zhao, J.M. Study on the relationship between crustal electrical structure and block deformation in the northeastern margin of Qinghai Tibet Plateau. Sci. China Ser. D Geosci. 2004, 34, 908–918. (In Chinese) [Google Scholar] [CrossRef]
- Egbert, G.D. Robust multiple-station magnetotelluric data processing. Geophys. J. Int. 1997, 130, 475–496. [Google Scholar] [CrossRef] [Green Version]
- Rodi, W.; Mackie, R.L. Nonlinear conjugate gradients algorithm for 2-D magnetotelluric inversion. Geophysics 2001, 66, 174–187. [Google Scholar] [CrossRef]
- Caldwell, T.G.; Bibby, H.M.; Brown, C. The magnetotelluric phase tensor. Geophys. J. Int. 2004, 158, 457–469. [Google Scholar] [CrossRef] [Green Version]
- Booker, J.R. The magnetotelluric phase tensor: A critical review. Surv. Geophys. 2014, 35, 7–40. [Google Scholar] [CrossRef]
- Hoelz, S.; Polag, D.; Becken, M.; Fiedler-Volmer, R.; Zhang, H.C.; Hartmann, K.; Burkhardt, H. Electromagnetic and geoelectric investigation of the Gurinai Structure, Inner Mongolia, NW China. Tectonophysics 2007, 445, 26–48. [Google Scholar] [CrossRef]
- Xiao, Q.B.; Cai, X.P.; Liang, G.H.; Xu, X.W.; Zhang, B.L. Application of 2D magnetotelluric methods in a geological complex area, Xinjiang, China. J. Appl. Geophys. 2011, 75, 19–30. [Google Scholar] [CrossRef]
- Ogawa, Y. On Two-Dimensional modeling of magnetotelluric field data. Surv. Geophys. 2002, 23, 251–273. [Google Scholar] [CrossRef]
- Parker, R.L.; Booker, J.R. Optimal one-dimensional inversion and bounding of magnetotelluric apparent resistivity and phase measurements. Phys. Earth Planet. Inter. 1996, 98, 269–282. [Google Scholar] [CrossRef]
- Hansen, P.C. Analysis of discrete ill-posed problems by means of the L-Curve. SIAM Rev. 1992, 34, 561–580. [Google Scholar] [CrossRef]
- Patro, P.K.; Harinarayana, T. Deep geoelectric structure of the Sikkim Himalayas (NE India) using magnetotelluric studies. Phys. Earth Planet. Inter. 2009, 173, 171–176. [Google Scholar] [CrossRef]
- Xia, S.B.; Wang, X.B.; Min, G.; Hu, Y.B.; Li, D.W.; Kong, F.T.; Cai, X.L. Crust and uppermost mantle electrical structure beneath Qilianshan Orogenic Belt and Alxa Block in northeastern margin of the Tibetan Plateau. Chin. J. Geophys. 2019, 62, 950–966. (In Chinese) [Google Scholar] [CrossRef]
- Zhan, Y.; Zhao, G.Z.; Wang, J.J.; Chen, X.B.; Xiao, Q.B.; Huang, Z.; Zhen, G.J. Deep electric structure beneath the epicentre of the 1927 and its adjacent areas from magnetotelluric Gulang M8 earthquake sounding. Chin. J. Geophys 2008, 51, 511–520. [Google Scholar] [CrossRef]
- Zhang, L.Q.; Zhang, H.F.; Zhang, S.S.; Xiong, Z.L.; Luo, B.J.; Yang, H.; Pan, F.B.; Zhou, X.C.; Xu, W.C.; Guo, L. Lithospheric delamination in post-collisional setting: Evidence from intrusive magmatism from the North Qilian orogen to southern margin of the Alxa block, NW China. Lithos 2017, 288–289, 20–34. [Google Scholar] [CrossRef]
- Zheng, W.J. Active Tectonic Image and Deformation Model in Hexi Corridor and Its Adjacent Area. Ph.D. Thesis, Institute of Geology, China Seismological Bureau, Beijing, China, 2009. (In Chinese). [Google Scholar]
- Yu, S.Y.; Peng, Y.B.; Zhang, J.X.; Li, S.Z.; Santosh, M.; Li, Y.S.; Liu, Y.J.; Gao, X.Y.; Ji, W.T.; Lv, P.; et al. Tectono-thermal evolution of the Qilian orogenic system: Tracing the subduction, accretion and closure of the Proto-Tethys Ocean. Earth-Sci. Rev. 2021, 215, 103547. [Google Scholar] [CrossRef]
- Jia, S.X.; Guo, W.B.; Mooney, W.D.; Wang, F.Y.; Duan, Y.H.; Zhao, J.M.; Lin, J.Y.; Liu, Z. Crustal structure of the middle segment of the Qilian fold belt and the coupling mechanism of its associated basin and range system. Tectonophysics 2019, 770, 128154. [Google Scholar] [CrossRef]
- Zhang, J.; Zhang, Y.P.; Xiao, W.X. Linking the Alxa Terrane to the eastern Gondwana during the Early Paleozoic: Constraints from detrital zircon U-Pb ages and Cambrian sedimentary records. Gondwana Res. 2015, 28, 1168–1182. [Google Scholar] [CrossRef]
- Wang, K.X.; Yu, C.D.; Yan, J.; Liu, X.D.; Liu, W.H.; Pan, J.Y. Petrogenesis of Early Silurian granitoids in the Longshoushan area and their implications for the extensional environment of the North Qilian Orogenic Belt, China. Lithos 2019, 342, 152–174. [Google Scholar] [CrossRef]
- Dan, W.; Li, X.H.; Wang, Q.; Wang, X.C.; Liu, Y. Neoproterozoic S-type granites in the Alxa Block, westernmost North China and tectonic implications: In situ zircon U-Pb-Hf-O isotopic and geochemical constraints. Am. J. Sci. 2014, 314, 110–153. [Google Scholar] [CrossRef]
- Chang, L.J.; Ding, Z.F.; Wang, C.Y.; Flesch, L.M. Vertical coherence of deformation in lithosphere in the NE margin of the Tibetan plateau using GPS and shear-wave splitting data. Tectonophysics 2017, 699, 93–101. [Google Scholar] [CrossRef]
- Wu, T.R.; He, G.Q. Ophiolitic melange belts in the northern margin of the Alashan Block. Geoscience 1992, 6, 286–296. (In Chinese) [Google Scholar]
- Dang, B.; Zhao, H.; Lin, G.C.; He, H.Y.; Wu, Y.W.; Zhou, G.F.; Zeng, X.H.; Wu, W.K. Petrogenesis and Tectonic Significance of Carboniferous Volcanic Rocks in Northern Alxa and Its Neighboring Areas, Inner Mongolia, China. Earth Sci.-J. China Univ. Geosci. 2013, 38, 963–974. (In Chinese) [Google Scholar] [CrossRef]
- Zhang, J.; Li, J.Y.; Xiao, W.X.; Wang, Y.N.; Qi, W.H. Kinematics and geochronology of multistage ductile deformation along the eastern Alxa block, NW China: New constraints on the relationship between the North China Plate and the Alxa block. J. Struct. Geol. 2013, 57, 38–57. [Google Scholar] [CrossRef]
- Sun, Y.; Niu, M.L.; Yan, Z.; Palin, R.M.; Li, C.; Li, X.C.; Yuan, X.Y. Late early Paleozoic continental collision on the northern margin of the Central Qilian Block, NE Tibetan Plateau: Evidence from a two-stage tectono–metamorphic event. J. Asian Earth Sci. 2022, 105121. [Google Scholar] [CrossRef]
- Wang, X.; Zhan, Y.; Zhao, G.Z.; Wang, L.F.; Wang, J.J. Deep electric structure beneath the northern section of the western margin of the Ordos basin. Chin. J. Geophys. 2010, 53, 595–604. (In Chinese) [Google Scholar] [CrossRef]
- Xie, F.Q.; Wu, J.H.; Sun, Y.H.; Wang, L.D.; Wu, J.H.; Jia, W.J. Permian to Triassic tectonic evolution of the Alxa Tectonic Belt, NW China: Constraints from petrogenesis and geochronology of felsic intrusions. Lithos 2021, 384, 105980. [Google Scholar] [CrossRef]
- Wang, T.; Zheng, Y.D.; Li, T.B.; Gao, Y.J. Mesozoic granitic magmatism in extensional tectonics near the Mongolian border in China and its implications for crustal growth. J. Asian Earth Sci. 2004, 23, 715–729. [Google Scholar] [CrossRef]
- Li, J.J. Regional Metallogenic System of Alashan Block in Inner Monolia Autonomous Region. Ph.D. Thesis, China University of Geosciences, Beijing, China, 2006. (In Chinese). [Google Scholar]
- Zhai, M.G.; Zhu, X.Y.; Zhou, Y.Y.; Zhao, L.; Zhou, L.G. Continental crustal evolution and synchronous metallogeny through time in the North China Craton. J. Asian Earth Sci. 2020, 194, 104169. [Google Scholar] [CrossRef]
- Gao, J.; Klemd, R.; Zhu, M.T.; Wang, X.S.; Li, J.L.; Wan, B.; Xiao, W.J.; Zeng, Q.D.; Shen, P.; Sun, J.G. Large-scale porphyry-type mineralization in the Central Asian Metallogenic Domain: Geodynamic background, magmatism, fluid activity and metallogenesis. J. Asian Earth Sci. 2018, 165, 1–6. [Google Scholar] [CrossRef]
- Han, N.; Shen, Z.; Zhao, X.; Chen, R.; Thakur, V.K. Perovskite oxides for oxygen transport: Chemistry and material horizons. Sci. Total Environ. 2022, 806, 151213. [Google Scholar] [CrossRef]
- Han, N.; Race, M.; Zhang, W.; Marotta, R.; Zhang, C.; Bokhari, A.; Klemeš, J.J. Perovskite and related oxide based electrodes for water splitting. J. Clean. Prod. 2021, 318, 128544. [Google Scholar] [CrossRef]
- Krieger, L.; Peacock, J.R. MTpy: A Python toolbox for magnetotellurics. Comput. Geosci. 2014, 72, 167–175. [Google Scholar] [CrossRef]
Figure 1.
Tectonic sketch and magnetotelluric sounding profile location in the study area (Digital Elevation Model, from https://e4ftl01.cr.usgs.gov/ASTT/ASTGTM.003 (accessed on 15 September 2021); L1–L4 measurement positions come from the work of [11]). (a). The tectonic background of the study area; (b). Location map of magnetotelluric survey point and digital elevation model of study area.

Figure 2.
Sounding curve of typical magnetotelluric survey stations.

Figure 3.
Phase tensor ellipses of each frequency phase tensor.

Figure 4.
Electrical spindle analysis of all measuring points in the full-frequency band.

Figure 5.
L curve of inverse fitting difference in different regularization factors.

Figure 6.
Two-dimensional inversion electrical structure model and error of L27.

Figure 7.
Comprehensive analytical diagram of electrical structure of Minle–Ejinaqi section in the northern edge of the Alxa Block (gravity data are from [21]).
Figure 7.
Comprehensive analytical diagram of electrical structure of Minle–Ejinaqi section in the northern edge of the Alxa Block (gravity data are from [21]).

Publisher’s Note: MDPI stays neutral with regard to jurisdictional claims in published maps and institutional affiliations. |
© 2022 by the authors. Licensee MDPI, Basel, Switzerland. This article is an open access article distributed under the terms and conditions of the Creative Commons Attribution (CC BY) license (https://creativecommons.org/licenses/by/4.0/).
Share and Cite
MDPI and ACS Style
Meng, Y.; Chen, X.; Wang, W.; Li, R.; Wang, G. Geophysical Implications for Prospective Prediction of Copper Polymetallic Ore Bodies: Northern Margin of Alxa Block, China. Minerals 2022, 12, 653. https://doi.org/10.3390/min12050653
AMA Style
Meng Y, Chen X, Wang W, Li R, Wang G. Geophysical Implications for Prospective Prediction of Copper Polymetallic Ore Bodies: Northern Margin of Alxa Block, China. Minerals. 2022; 12(5):653. https://doi.org/10.3390/min12050653
Chicago/Turabian StyleMeng, Yinsheng, Xiaoqiang Chen, Wenguo Wang, Ruihong Li, and Gang Wang. 2022. "Geophysical Implications for Prospective Prediction of Copper Polymetallic Ore Bodies: Northern Margin of Alxa Block, China" Minerals 12, no. 5: 653. https://doi.org/10.3390/min12050653
Note that from the first issue of 2016, this journal uses article numbers instead of page numbers. See further details here.