Article

Study on Fluid–Solid Characteristics of Grouting Filling Similar-Simulation Materials

1
Xinjiang Institute Engineering, Urumqi 830023, China
2
School of Mines, China University of Mining and Technology, Xuzhou 221116, China
*
Author to whom correspondence should be addressed.
Minerals 2022, 12(5), 502; https://doi.org/10.3390/min12050502
Submission received: 10 March 2022 / Revised: 12 April 2022 / Accepted: 17 April 2022 / Published: 19 April 2022
(This article belongs to the Special Issue Solid-Filling Technology in Coal Mining)

Abstract

:
The mining-induced overburden bed separation grouting technique can control surface subsidence through the high-pressure grouting and filling into the bed separation during mining. The physical simulation method can be used to objectively reproduce the dynamic migration process of filling slurry in the bed separation but the traditional similar-simulation materials are not suitable for the simulation of bed separation grouting. Considering the water disintegration, weak water storage capacity, and poor permeability of traditional simulation materials, the existing similar-simulation materials were modified in this study. The improved similar-simulation materials have adjustable physical and mechanical parameters, stable properties in a water-filled environment, and high water storage and permeability, and the reasonable ratio of similar-simulation materials was determined for hard rock, medium-hard rock, and soft rock. The similarity simulation function suitable for bed separation grouting was deduced and the time similarity coefficient and permeability similarity coefficient of the bed separation grouting simulation were obtained to judge the similarity and applicability of similar-simulation materials with specific proportions. This study provides a reliable experimental simulation scheme for the physical simulation of mining-induced bed separation grouting and provides a theoretical basis for the improvement of similar-simulation materials with fluid–solid characteristics.

1. Introduction

China is the main country of coal energy production and consumption [1], and coal mining brings many problems to the environment [2]. For example, underground coal mining activities can lead to ground subsidence [3,4] and the failure of the upper critical layer can lead to mining-induced fissures [5], which can cause serious problems such as damage to surface structures. Therefore, it is necessary to maintain a balance between mining and environmental protection [6,7]. As an efficient method in green mining, the mining-induced overburden bed separation grouting technique [8] can effectively reduce subsidence by the high-pressure grouting and filling into the bed separation during mining [9]. The key to its success lies in the reduction of mining subsidence by the support of the compacted ash body [10] formed by slurry bleeding and consolidation [11] in the filling layer [12]. Physical similarity simulation has been commonly used in the research of bed separation grouting. At present, transparency and visualization are the main development directions of similar-simulation materials [13] and the simulation method is the research focus. However, it is difficult to simulate the similarity of bed separation grouting.
In the traditional physical similarity simulation, gypsum powder is usually used as a cementing agent. However, gypsum powder tends to be muddy and disintegrate after absorbing water, and most grouting materials [14,15] are transported into bed separation by water. Therefore, the existing similar-simulation materials cannot meet the needs of grouting simulation.
Moreover, the improved new similar-simulation materials are mainly targeted for fluid–solid coupling problems and used for the simulation of the impermeable layer [16]. As a result, the permeability of these materials is relatively low. Aiming at the water-disintegrable problem of simulation materials, Qingxiang [17] used clay as a binder and developed a new type of similar-simulation material. The results show that the new similar-simulation material can maintain the corresponding physical and mechanical properties in the rich water environment and meet the needs of physical simulation. To prevent water disintegration of simulation material, Jie [18], Wenbin [19], and Huiqing [20] et al., developed a variety of similar-simulation materials with different binder bases. However, during the bed separation grouting process, the water released from the slurry penetrates and is stored in the rock mass. Therefore, in addition to the non-disintegration of water, the simulation material should have high permeability and a high water storage to achieve the physical similarity of the simulation process. Due to the significant hydrophobicity as well as poor permeability and water storage performance, the above similar-simulation materials are generally used as water-resisting layers. Although no disintegration and argillization occur after contacting water, the physical strength of these similar-simulation materials is significantly reduced, which cannot meet the requirements of grouting filling simulation.
To meet the simulation requirements of grouting filling material, simulation material should have strong water storage and permeability under the premise of similar physical and mechanical properties. The permeability of materials can be improved by the simulated rock strata with prefabricated micro-cracks. Relevant researchers [21] prefabricated the rock cracks to improve the permeability of simulated materials to study the pathway of water inrush from the coal mine floor. Since the simulation experiment is carried out under the condition of filling water, the water-soluble polyvinyl alcohol (PVA) [22] entity can be used to prefabricate cracks. Based on the previous research [23], straw powder can be used to improve the water storage performance of similar-simulation materials [24].
In this study, a similar-simulation material was developed to simulate the bed separation grouting and three ratios were determined to simulate hard rock, medium-hard rock, and soft rock. The physical property experiments were carried out under a dry state and after different immersion times. The innovation of simulation material is that the strength, water storage rate, and permeability can be adjusted, and the physical and mechanical properties in the slurry (water-bearing environment) are stable. Additionally, the time similarity coefficient of bed separation grouting simulation Π1 and the permeability similarity coefficient of bed separation grouting simulation Π2 are deduced. When models are built with different geometric dimensions, these coefficients can be used to efficiently adjust the experimental parameters by judging whether the time and permeability meet the requirements.

2. Experimental Program

2.1. Deduction of the Similarity of Fluid-Solid Materials

Similar-simulation materials should have some relations with the actual environment in geometric size, physical and mechanical characteristics, hydraulic properties, time factors, and other parameters considering similar-simulation materials have similarity to the prototype. When establishing a three-dimensional physical simulation system, the similarity ratio between the prototype and the model should be considered. Thus, it is necessary to derive the material similarity. In addition, the similarity criterion is required to quickly determine the similarity degree after adjusting the similarity parameters.
The geometric similarity, dynamic similarity, and physical similarity between materials in the similar-simulation model and the prototype should be fully met. According to the simulation effect and research content, the similarity should be adjusted to meet the similarity transformation between the model and the prototype, and the appropriate similarity ratio should be determined.
Geometric similarity can be used to determine the mathematical relationship between the geometric structure of the model and the prototype. It is assumed that the similarity of the system is uniform deformation, that is, there is no affine similarity. Therefore, the change in the coordinate direction of each field is consistent. Here, the similarity is determined by using the similarity constant. From the geometric similarity theorem, it is concluded that:
x x = y y = z z = l l = m m n n = C L
where x , y ,   and   z are the coordinates of the model; x ,   y ,   and   z are coordinates of the prototype; l ,   m , and   n are the sizes of the model; x ,   y ,   and   z are the sizes of the prototype; and C L is the similitude parameter.
The simultaneous similar system equation is as follows:
f 1 x , y , z , l , m , n = 0 f 2 x , y , z , l , m , n = 0
When the similarity transformation ratio is introduced, Equation (3) can be obtained as follows:
x = x 0 X   ; y = y 0 Y   ; z = z 0 Z   ; l = l 0 L   ; m = m 0 M   ; n = n 0 N x = x 0 X ; y = y 0 Y ; z = z 0 Z ; l = l 0 L ; m = m 0 M ; n = n 0 N
Then, Equation (3) can be converted into Equation (4):
X X = L 1 L 1 = L 2 L 2 = = L i L i = 1 Y Y = M 1 M 1 = M 2 M 2 = = M i M i = 1 Z Z = N 1 N 1 = N 2 N 2 = = N i N i = 1
From the above equations, Equation (5) can be obtained:
F 1 X , Y , Z , L ,   M , N = 0 F 2 X , Y , Z , L , M , N = 0
Due to the invariance of the similar system equation, F1 and F2 are identical. Thus,
F X , Y , Z , L , M , N = 0
Similar-simulation materials focus on the field phenomena of various physical quantities distributed in space, especially the steady field. Based on the derivation of the geometric similarity system equation, the following similar physical fields can be established:
φ = f x , y , z , d 1 , d 2 , d n , l 1 , l 2 , l n
where x , y , and   z are geometric coordinates, and d   and     l are physical parameters.
A simultaneous similar system equation is expressed as follows:
f 1 φ , x , y , z , d 1 , d 2 , d n , l 1 , l 2 , l n = 0               f 2 φ , x ,   y ,   z , d 1 , d 2 , d n , l 1 , l 2 , l n = 0
From the steady similarity, it can be found that:
x x = y y = z z = l l = m m n n = C L φ 1 φ 1 = φ 2 φ 2 = φ 3 φ 3 φ n φ n = C φ               d 1 d 1 = C d 1 , d 2 d 2 = C d 2 , d n d n = C d n ,
Since the steady similar physical field is affine similar, the similarity transformation on Equation (8) should be performed as follows:
φ = φ 0 Φ   ; x = l 0 X   ; y = l 0 Y   ; z = l 0 Z                       l 1 = l 0 L 1 ; l i = l 0 L i ; d 1 = d 0 D 1 ; d i = d 0 D i
f φ 0 Φ , l 0 X , l 0 Y , l 0 Z , l 0 L 1 , l 0 L i , d 0 D 1 , d 0 D i = 0 F Φ , X , Y , Z , L 1 , L i , D 1 , D i = 0                                                                                          
Similarly, the time similarity ratio is introduced to solve the velocity field similarity of unsteady physical quantities as follows:
l 0 l 0 = l 1 l 1 l i l i = C l t 0 t 0 = t 1 t 1 t i t i = C t v 0 v 0 = v 1 v 1 v i v i = C v
where C l is the geometric similarity ratio; C t is the time similarity ratio; and C v is the velocity similarity ratio. Then, Equation (13) can be obtained as follows:
C v C t C l v i = d l i d t i
To ensure the invariance of similar system equations, the motion similarity index is constrained:
C = C v C t C l = 1
To simplify the similarity simulation theory and determine the similarity criterion, the Π theorem is used to construct the physical variables of the physical phenomena involved in this experiment. When the similar-simulation material is used to realize the simulation of the mining-induced bed separation grouting process, the physical variables involved in this experiment mainly include mass m, size l, time t, bulk density γ, stress σ, permeability k, Poisson’s ratio μ, and water absorption Wa. Therefore, the function can be expressed as follows:
f m , l , t , γ , σ , μ , W a = 0
The dimensional matrix is solved as follows:
m l t γ σ k M 1 0 0 1 1 0 L 0 1 0 2 1 2 T 0 0 1 2 2 0 Π 1 1 2 2 1 0 0 Π 2 1 1 2 0 1 0 Π 3 0 2 0 0 0 1
In other words, Π1, Π2, and Π3 can be obtained as follows:
Π 1 = l 2 t 2 γ m Π 2 = l t 2 σ m   Π 3 = k l 2        
In summary, the similarity criterion of similar-simulation materials is obtained as Π1, Π2, and Π3, and the similarity ratio to be determined is Cγ, Ct, and Cl. The similarity assumption is made for the similar-simulation material in this experiment and the similarity constant is determined as CL = 0.0025. Then, the stress similarity ratio is obtained as Cσ = 0.0018 and the bulk density similarity ratio is obtained as Cγ = 0.72. After simplification, it can be obtained that Π1 = gt2/l, Π2 = gt2/l, and Π3 = k/l2, therefore Π1 = Π2. The solution of the similarity criterion must be determined in combination with subsequent experiments. The calculated similarity criterion can be used to quickly determine whether the similarity degree of the material meets the requirements and the water-physical properties of similar materials can be adjusted according to the similarity criterion. Since Π1 is mainly determined by geometric similarity ratio Cl and time similarity ratio Ct, then Π1 is defined as the simulation time similarity coefficient of bed separation grouting. Π3 is mainly determined by geometric similarity ratio Cl and permeability similarity ratio Ck. Therefore, Π3 is defined as the permeability similarity coefficient of the bed separation grouting simulation. According to the compressive strength of the original rock, the expected strength of the similar-simulation material can be determined. Based on the control variable method, similarity constant, and strength similarity ratio, the physical and mechanical parameters of the model are measured to verify the similarity of the similar-simulation material.

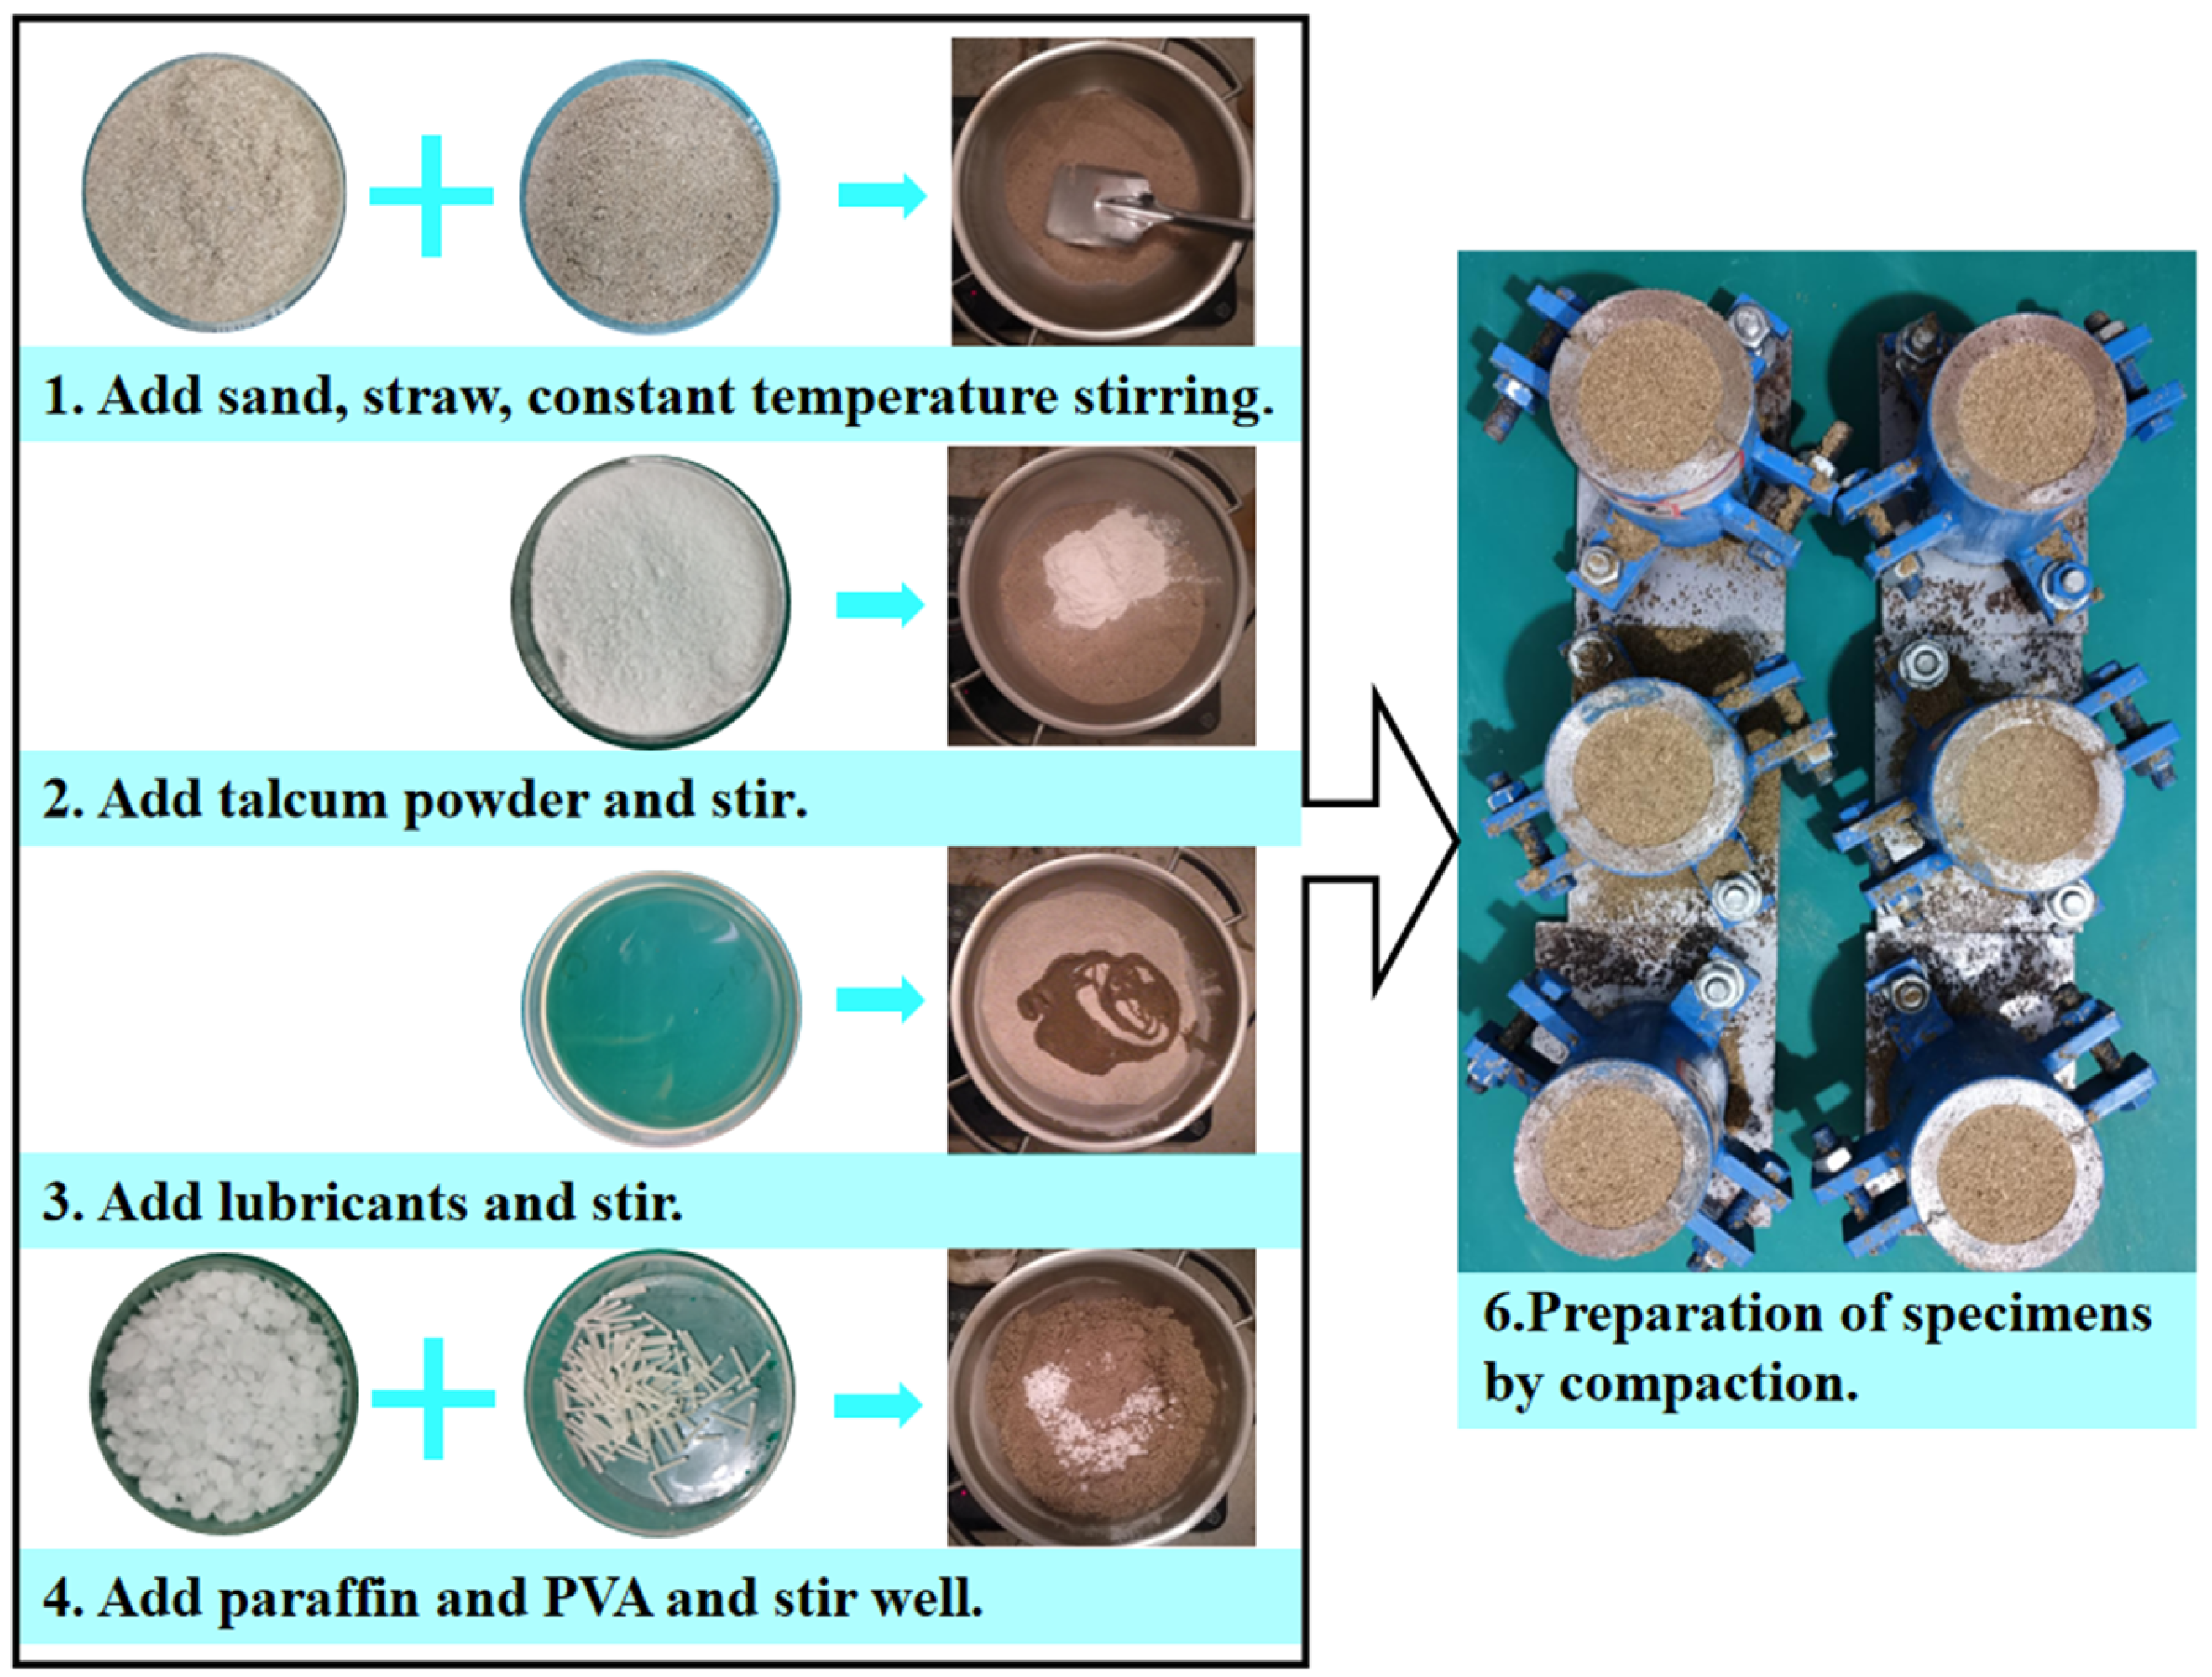
2.2. Determination of Preparation Parameters

Considering the results of the previous research and experiments, sand, paraffin, talcum powder, lubricating oil, straw powder, and polyvinyl alcohol (PVA) were selected as raw materials. Specifically, sand was used as an aggregate and paraffin was used to hot-melt bond the aggregate; lubricating oil and talc powder were used as modifiers to fill the gap, strengthen the continuity of the material, and properly adjust the brittleness and plasticity of the material; and straw powder and PVA melt water material were used to adjust the water storage and permeability of the material.
The straw powder is a kind of biomass powder with a porous structure. It has a large specific surface area, strong water absorption, and stable physical and chemical properties. Under the action of pressure, straw powder can maintain its structural characteristics and play a role in water storage and infiltration. PVA is a kind of solid formed by 3D printing and melted in water. According to its water-soluble properties, PVA material can be made into the crack entity in advance and mixed with similar-simulation materials. When PVA is dissolved in water, a specific crack cavity is left to simulate fractures in the rock mass. Figure 1 shows the detailed preparation process.
Through a large number of experiments, three groups of ratios were determined to simulate the hard rock, medium-hard rock, and soft rock in the similar-simulation experiments (Table 1).

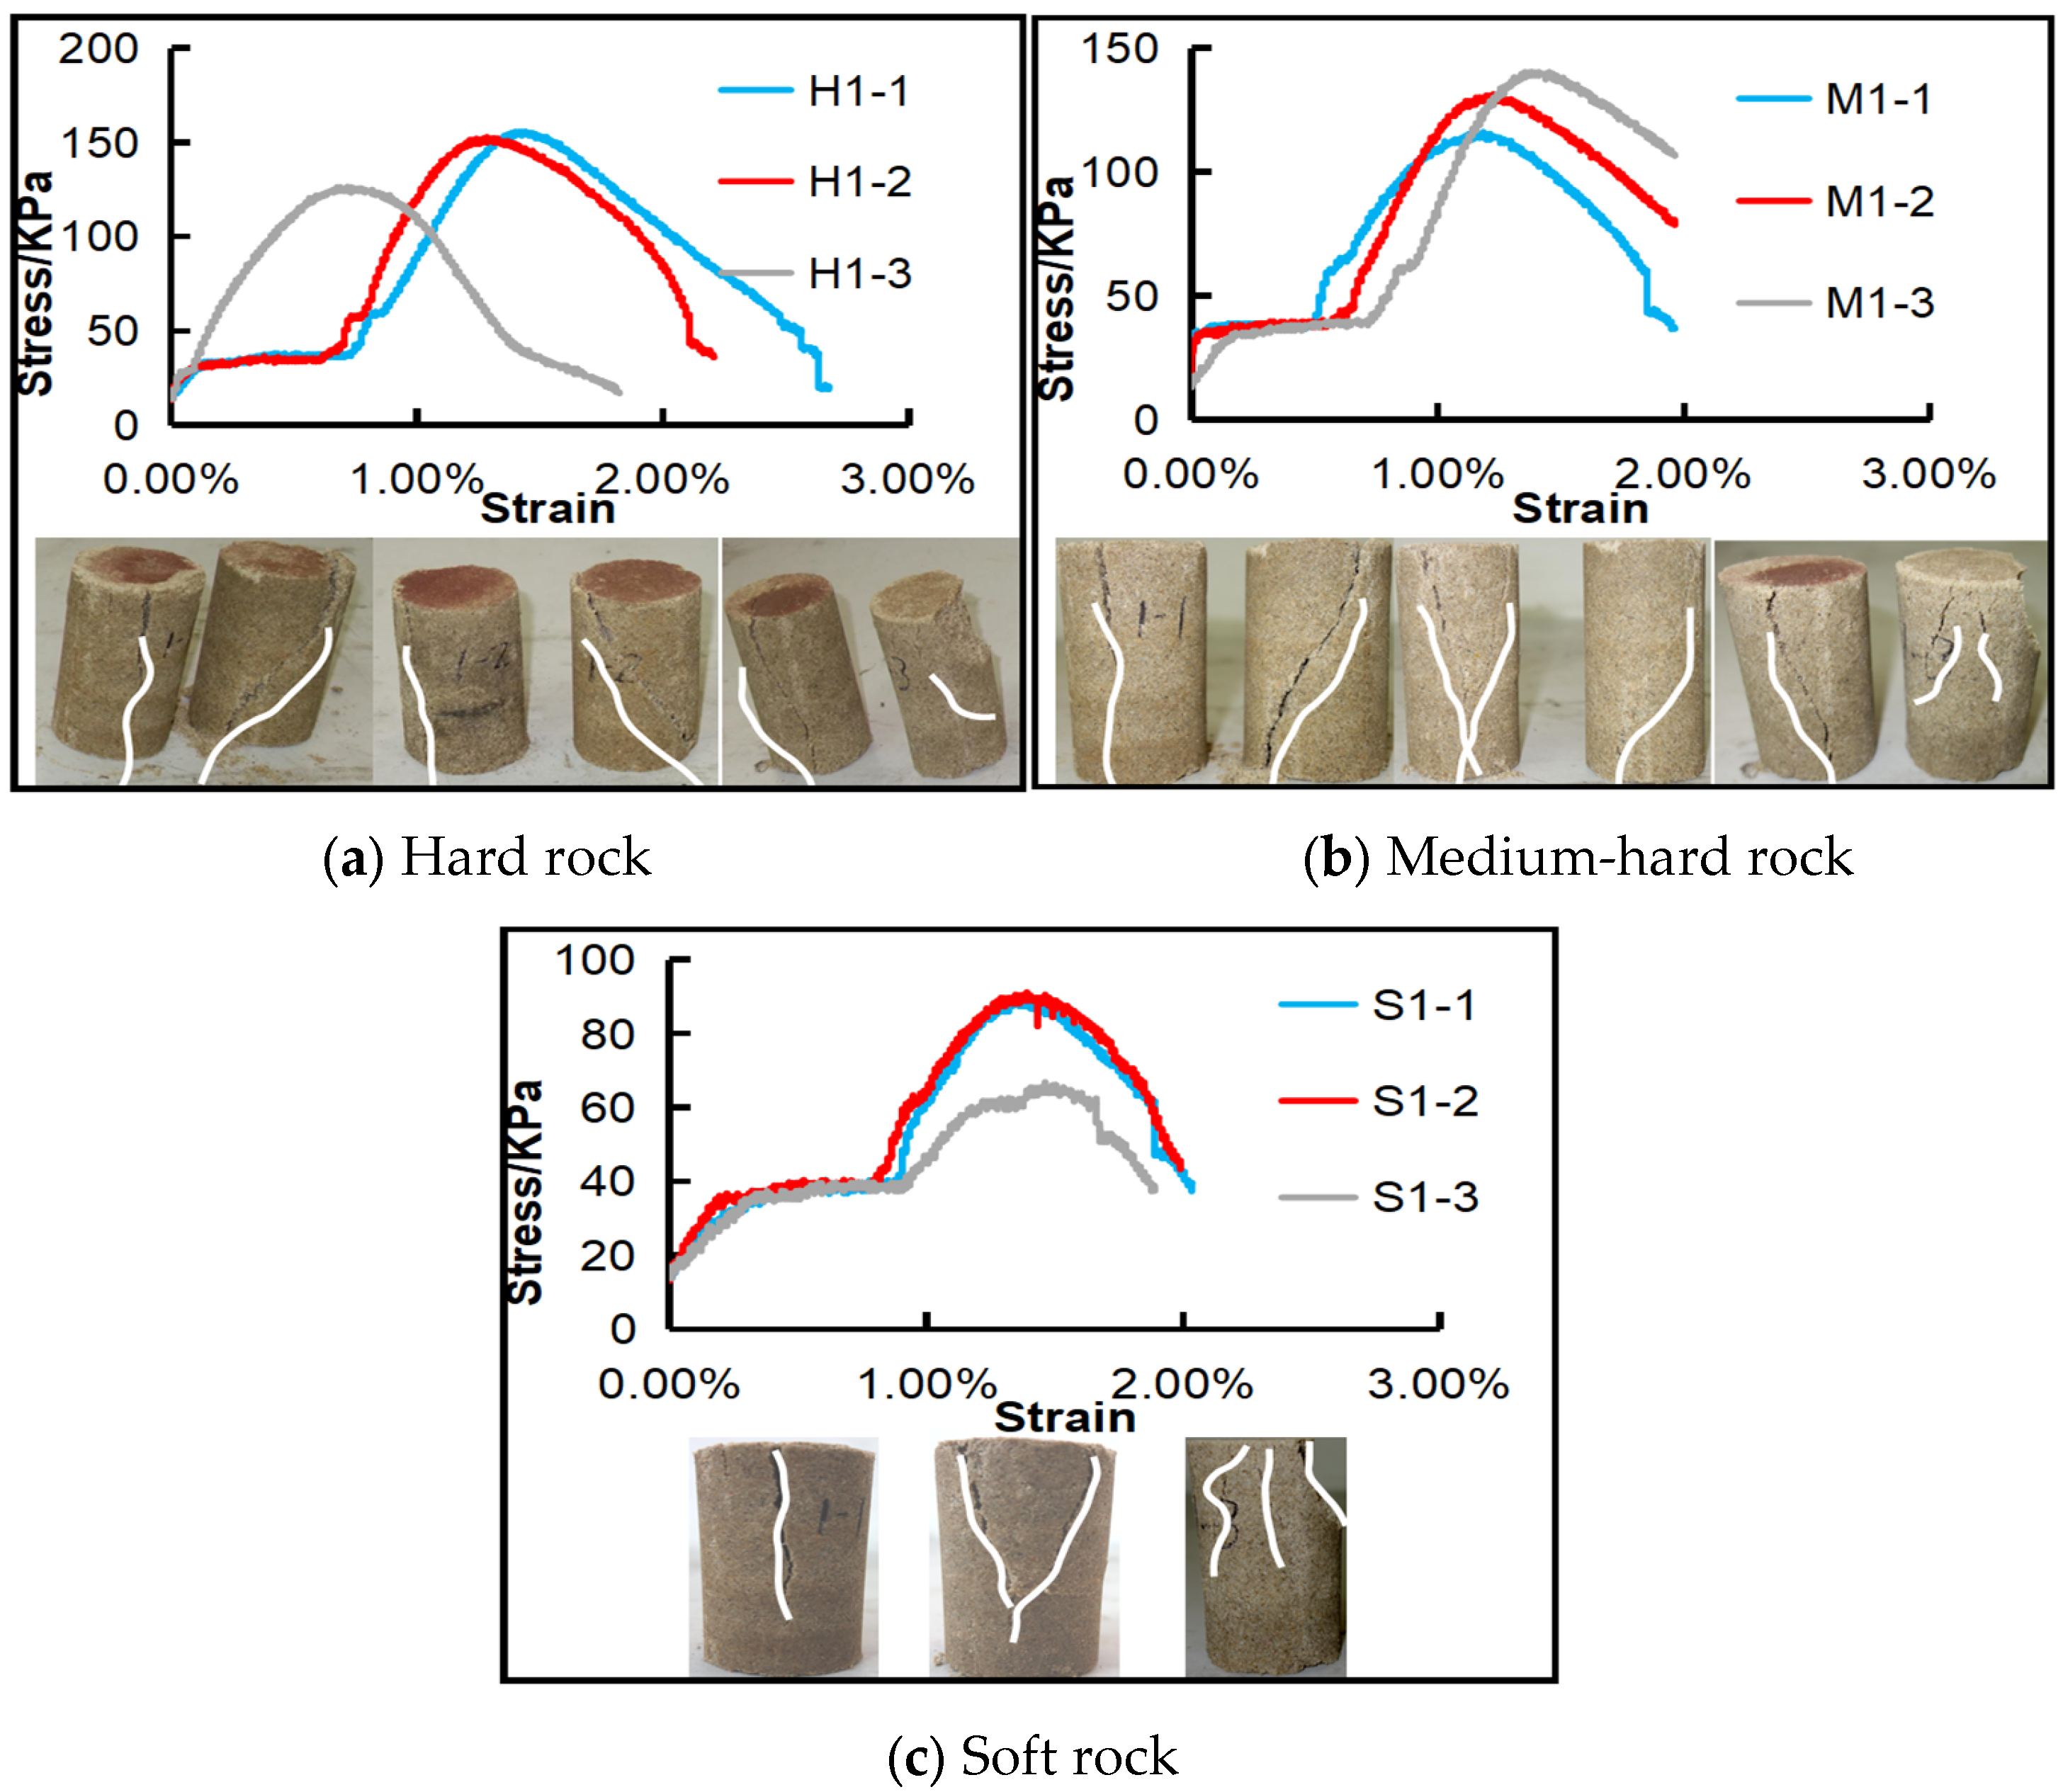
2.3. Physical and Mechanical Tests

Based on the above ratios of similar-simulation materials, standard cylindrical specimens with different ratios were prepared for the compressive strength test, including three groups of the hard rock group (H group), three groups of the medium-hard rock group (M group), and three groups of the soft rock group (S group). The specimens prepared in the same batch were in a group. To reduce the influence of human error caused by preparation, three batches of specimens with different ratios were prepared, respectively. These specimens were numbered 1-1, 1-2, and 1-3 (as shown in the figure). The standard cylinder specimen was prepared by the steel two-lobe mold and a uniaxial compression test was carried out on the universal servo testing machine. The complete stress–strain curve and failure characteristics were obtained, as shown in Figure 2.
The above experimental results show that:
  • For the hard rock group (H group), the compressive strength of rock specimens prepared in different batches is different; the maximum compressive strength is 154 KPa, the minimum compressive strength is 129 KPa, and the average compressive strength is 144 KPa, with a deviation of 10.2. The strength deviation of rock specimens in the H1-3 group is relatively large.
  • For the medium-hard rock group (M group), the maximum compressive strength of rock specimens is 137 KPa, the minimum compressive strength is 115 KPa, the average compressive strength is 126 KPa, the deviation is 6.6, and the overall data are credible.
  • For the soft rock group (S group), the maximum compressive strength of rock specimens is 89 KPa, the minimum compressive strength is 64 KPa, and the average compressive strength is 80 KPa, with a deviation of 11.1. The deviation of rock specimens in the S1-3 group is relatively large.
It can be seen that at the elastic stage, the strength limit of rock specimens with different lithologies is generally less than 40 KPa; at the yield stage, the serrated elastic-plastic deformation characteristics near the horizontal line continue to appear and the total strain is less than 5%; and at the failure stage, axial splitting or weak surface splitting commonly occurs in hard rock and medium-hard rock, with significant brittleness characteristics, while the Y-shaped failure and ductile failure occur in soft rock, and the two sides of the specimen are obviously bulged, with the significant plastic characteristics.
According to the above experimental conclusions, the physical and mechanical properties of rock specimens prepared by three ratios of simulation materials can meet the similar-simulation requirements.

3. Hydrological Experiments

In the physical simulation experiment of bed separation grouting, similar-simulation materials should fully absorb the free water precipitated in the slurry under the premise of maintaining the physical and mechanical stability, and quickly penetrate the water into the rock strata.
To avoid the experimental error caused by water filling in the bed separation, similar-simulation materials should maintain a certain compressive strength, high water absorption rate, and strong permeability and should not disintegrate in water.

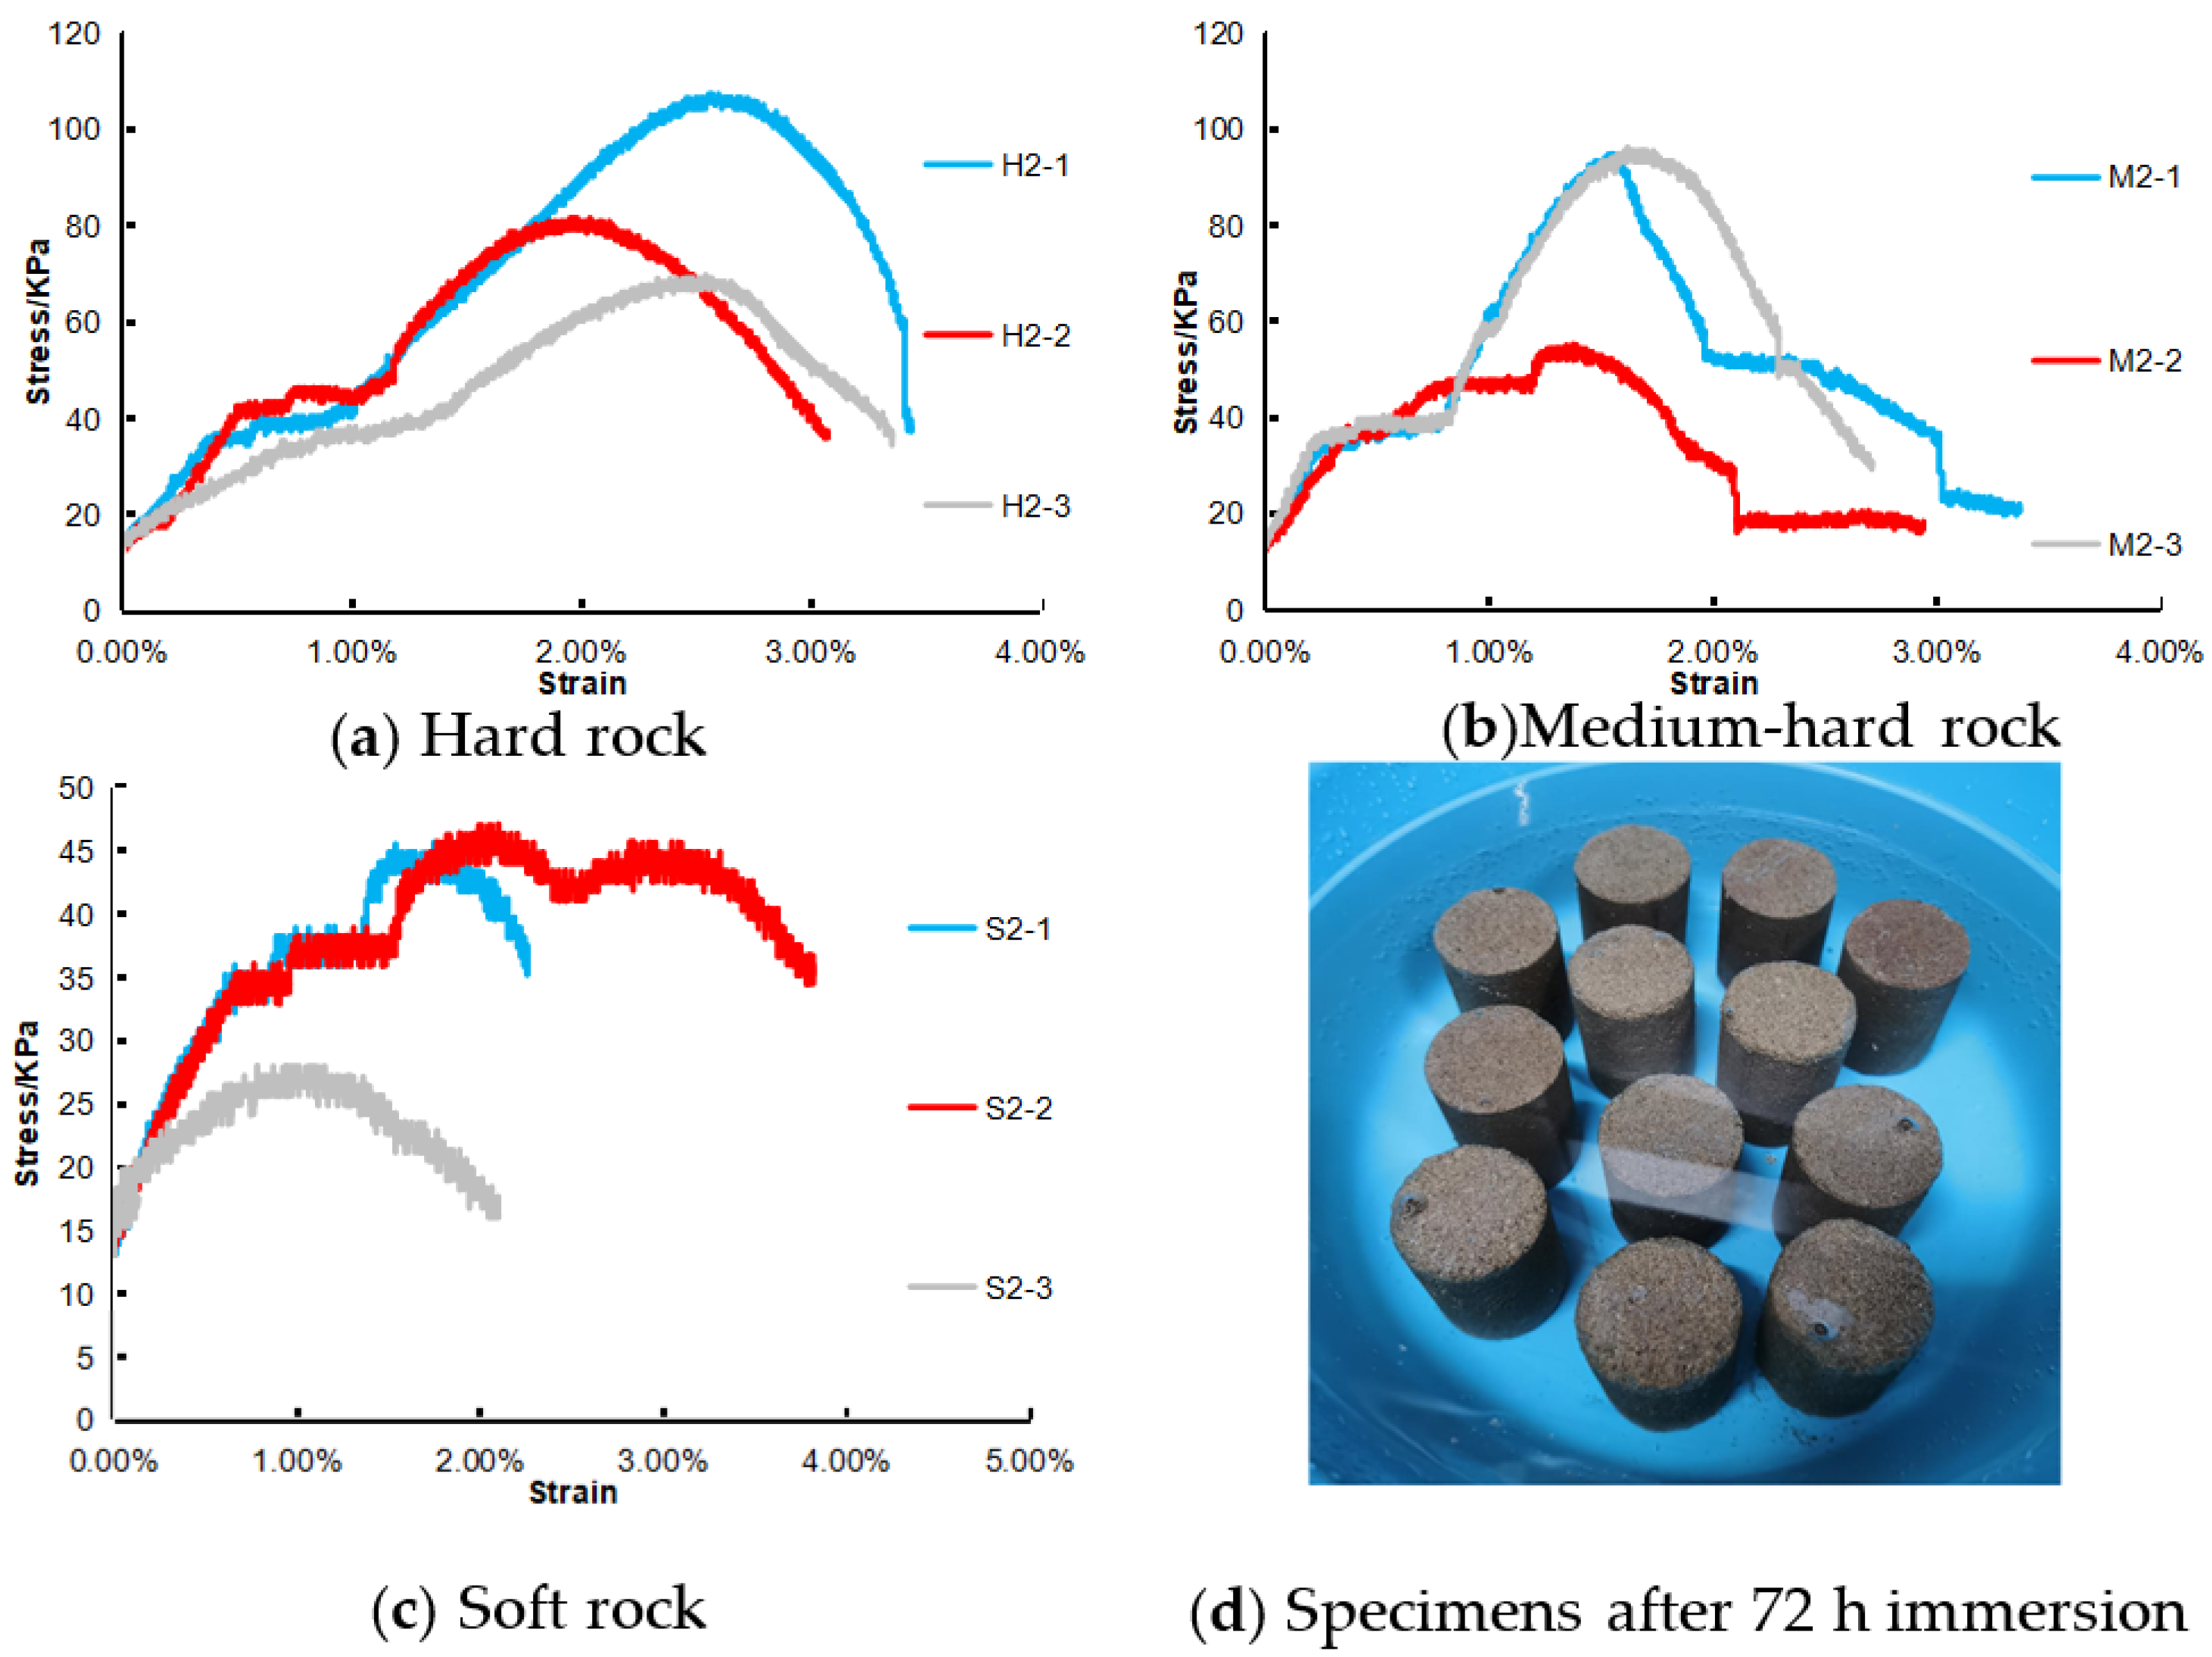
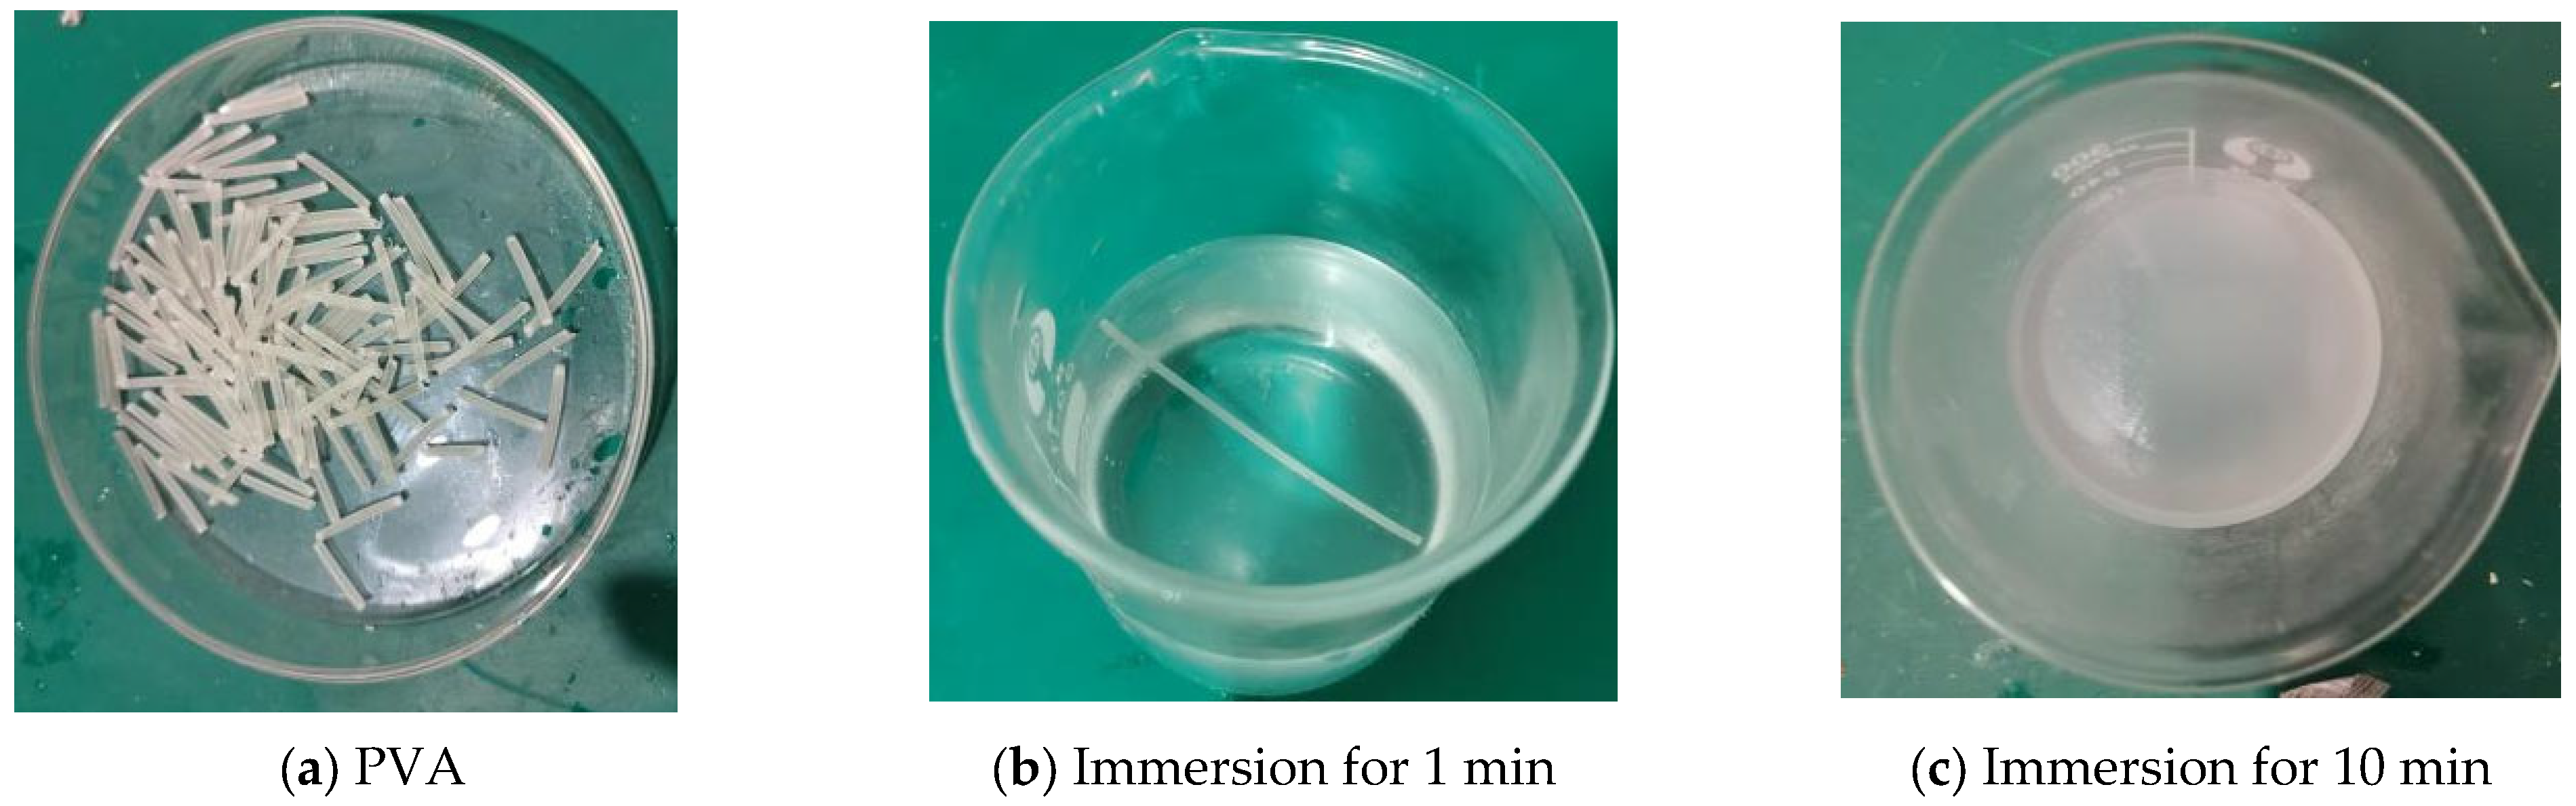
3.1. Water Immersion Experiment

Since the physical simulation experiment period is not more than 24 h, the standard specimens of the H, M, and S groups were soaked for 72 h and then the uniaxial compressive strength of the specimens was tested (Figure 3).
The results show that the sample prepared with this ratio can maintain its integrity after immersion in water for 72 h. After the immersion test, the strength of the sample decays to varying degrees. Specifically, the attenuation rate of the strength of the hard rock samples is 41%, that of the medium-hard rock samples is 36.7%, that of the soft rock samples is 48.8% and the attenuation rate of the average strength is 41.9%. In the limit state, the specimen can still maintain morphological integrity and has 58% of the strength of the original specimen, which can meet the needs of the experiment.

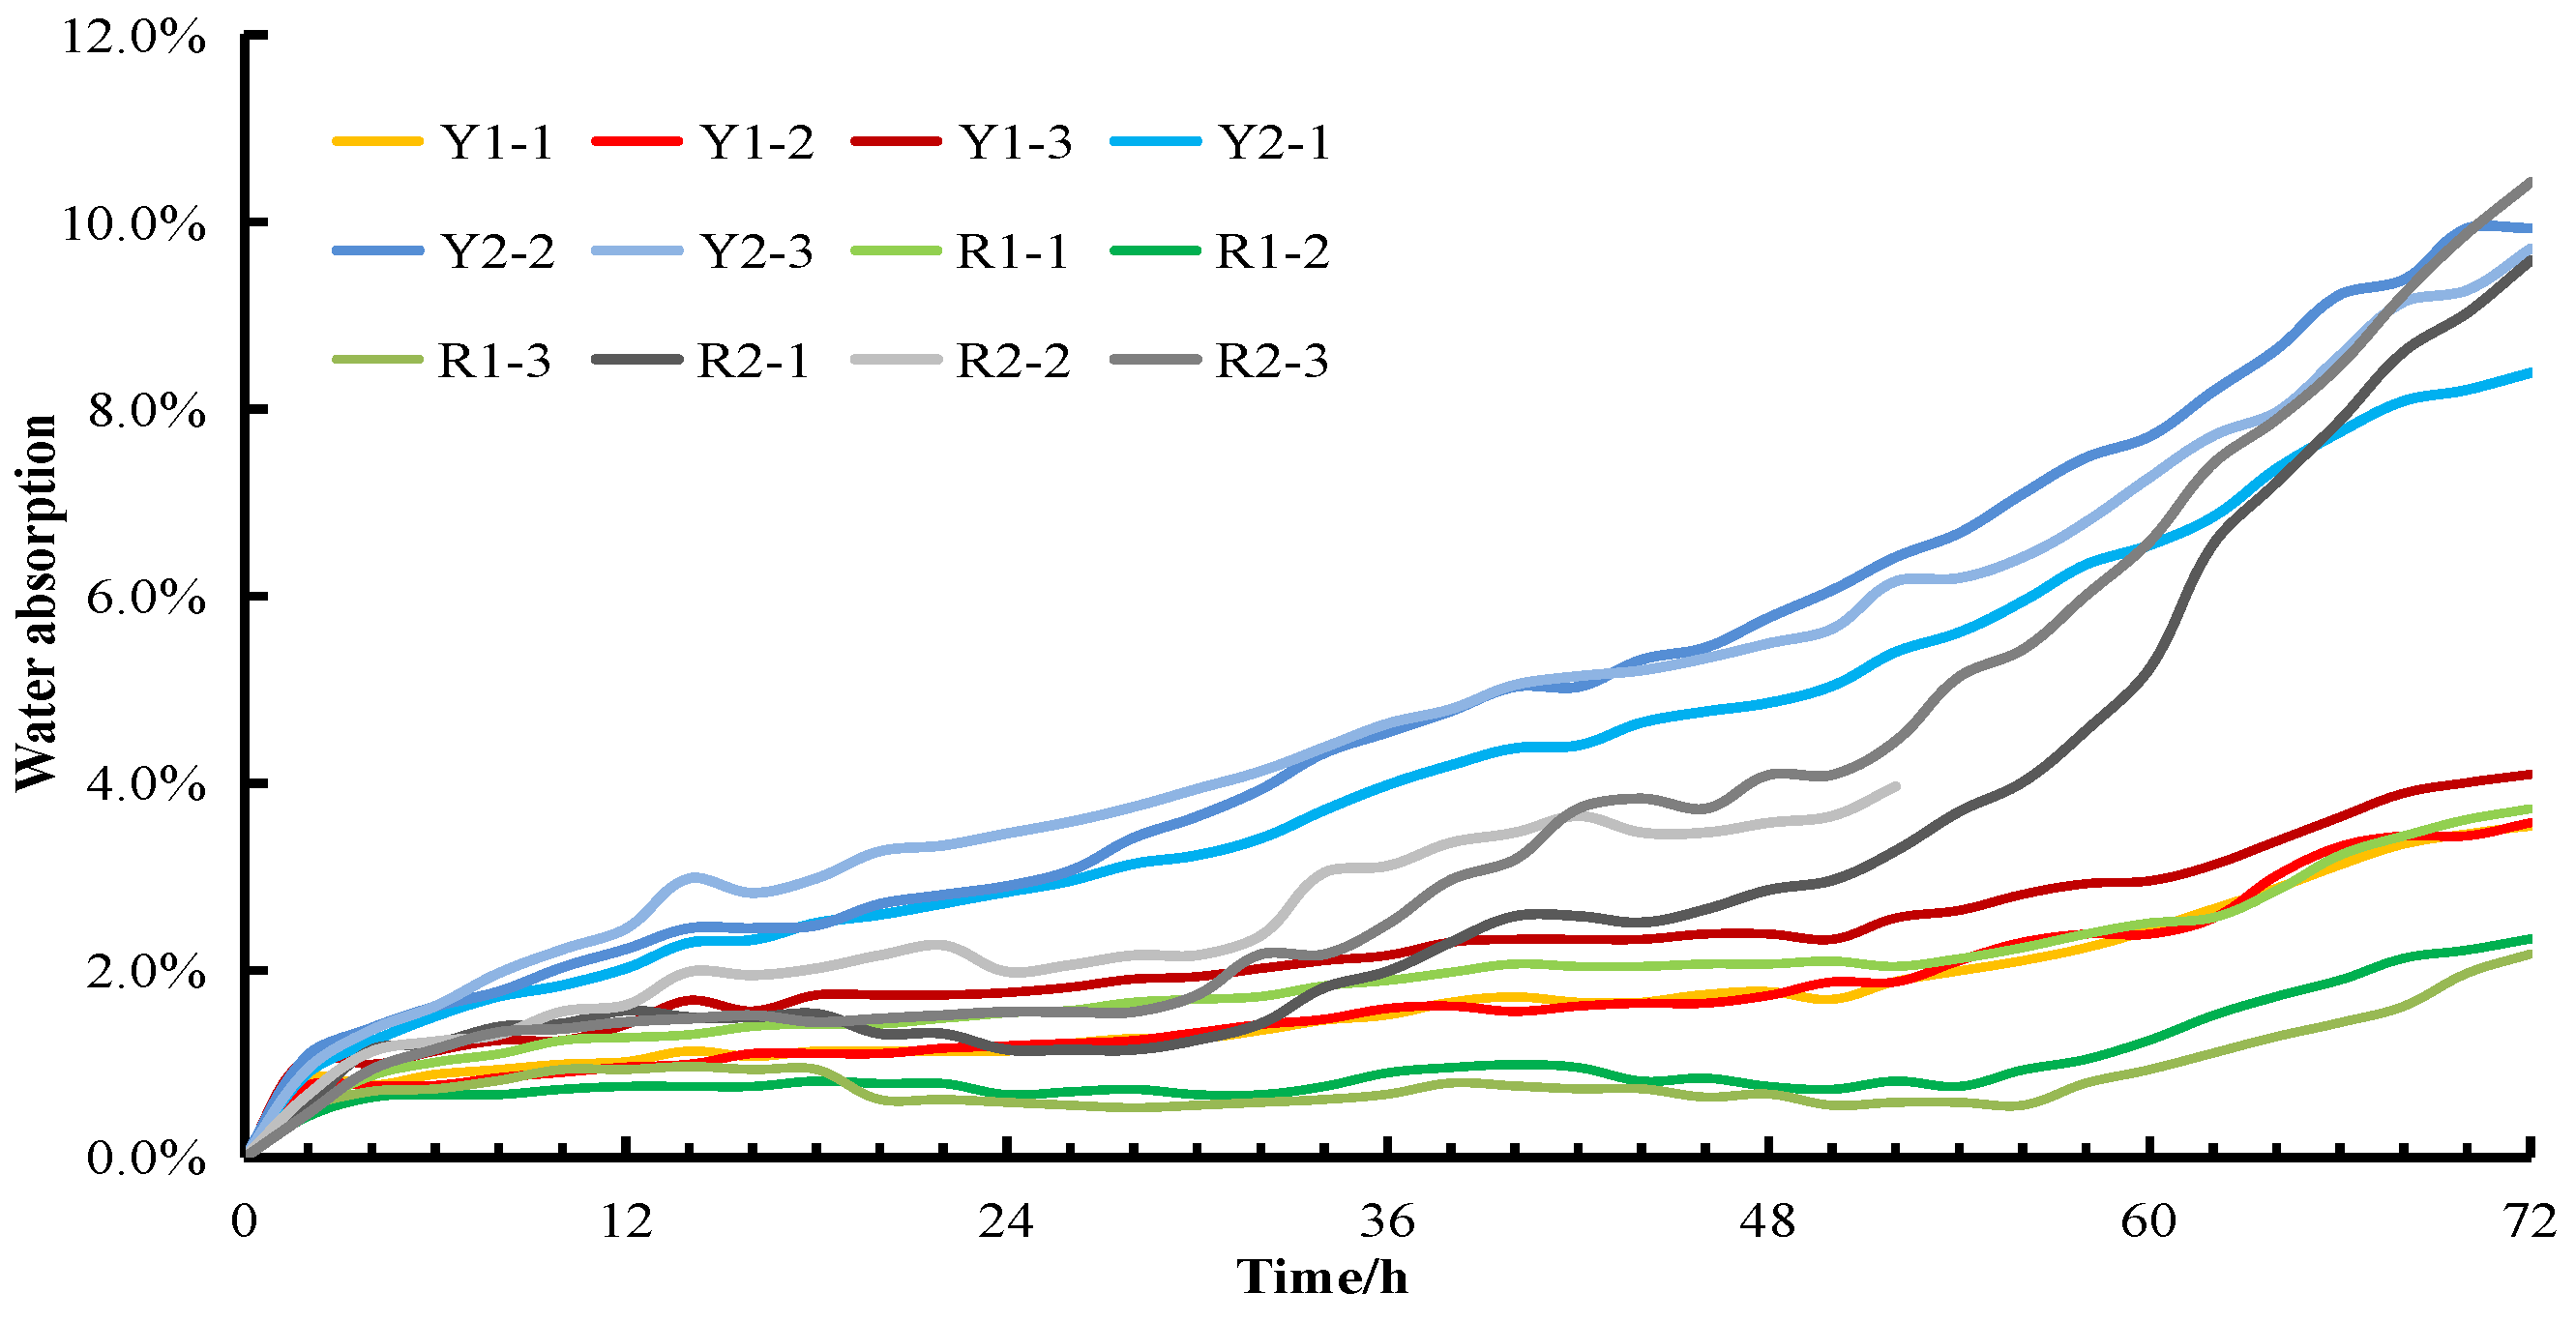
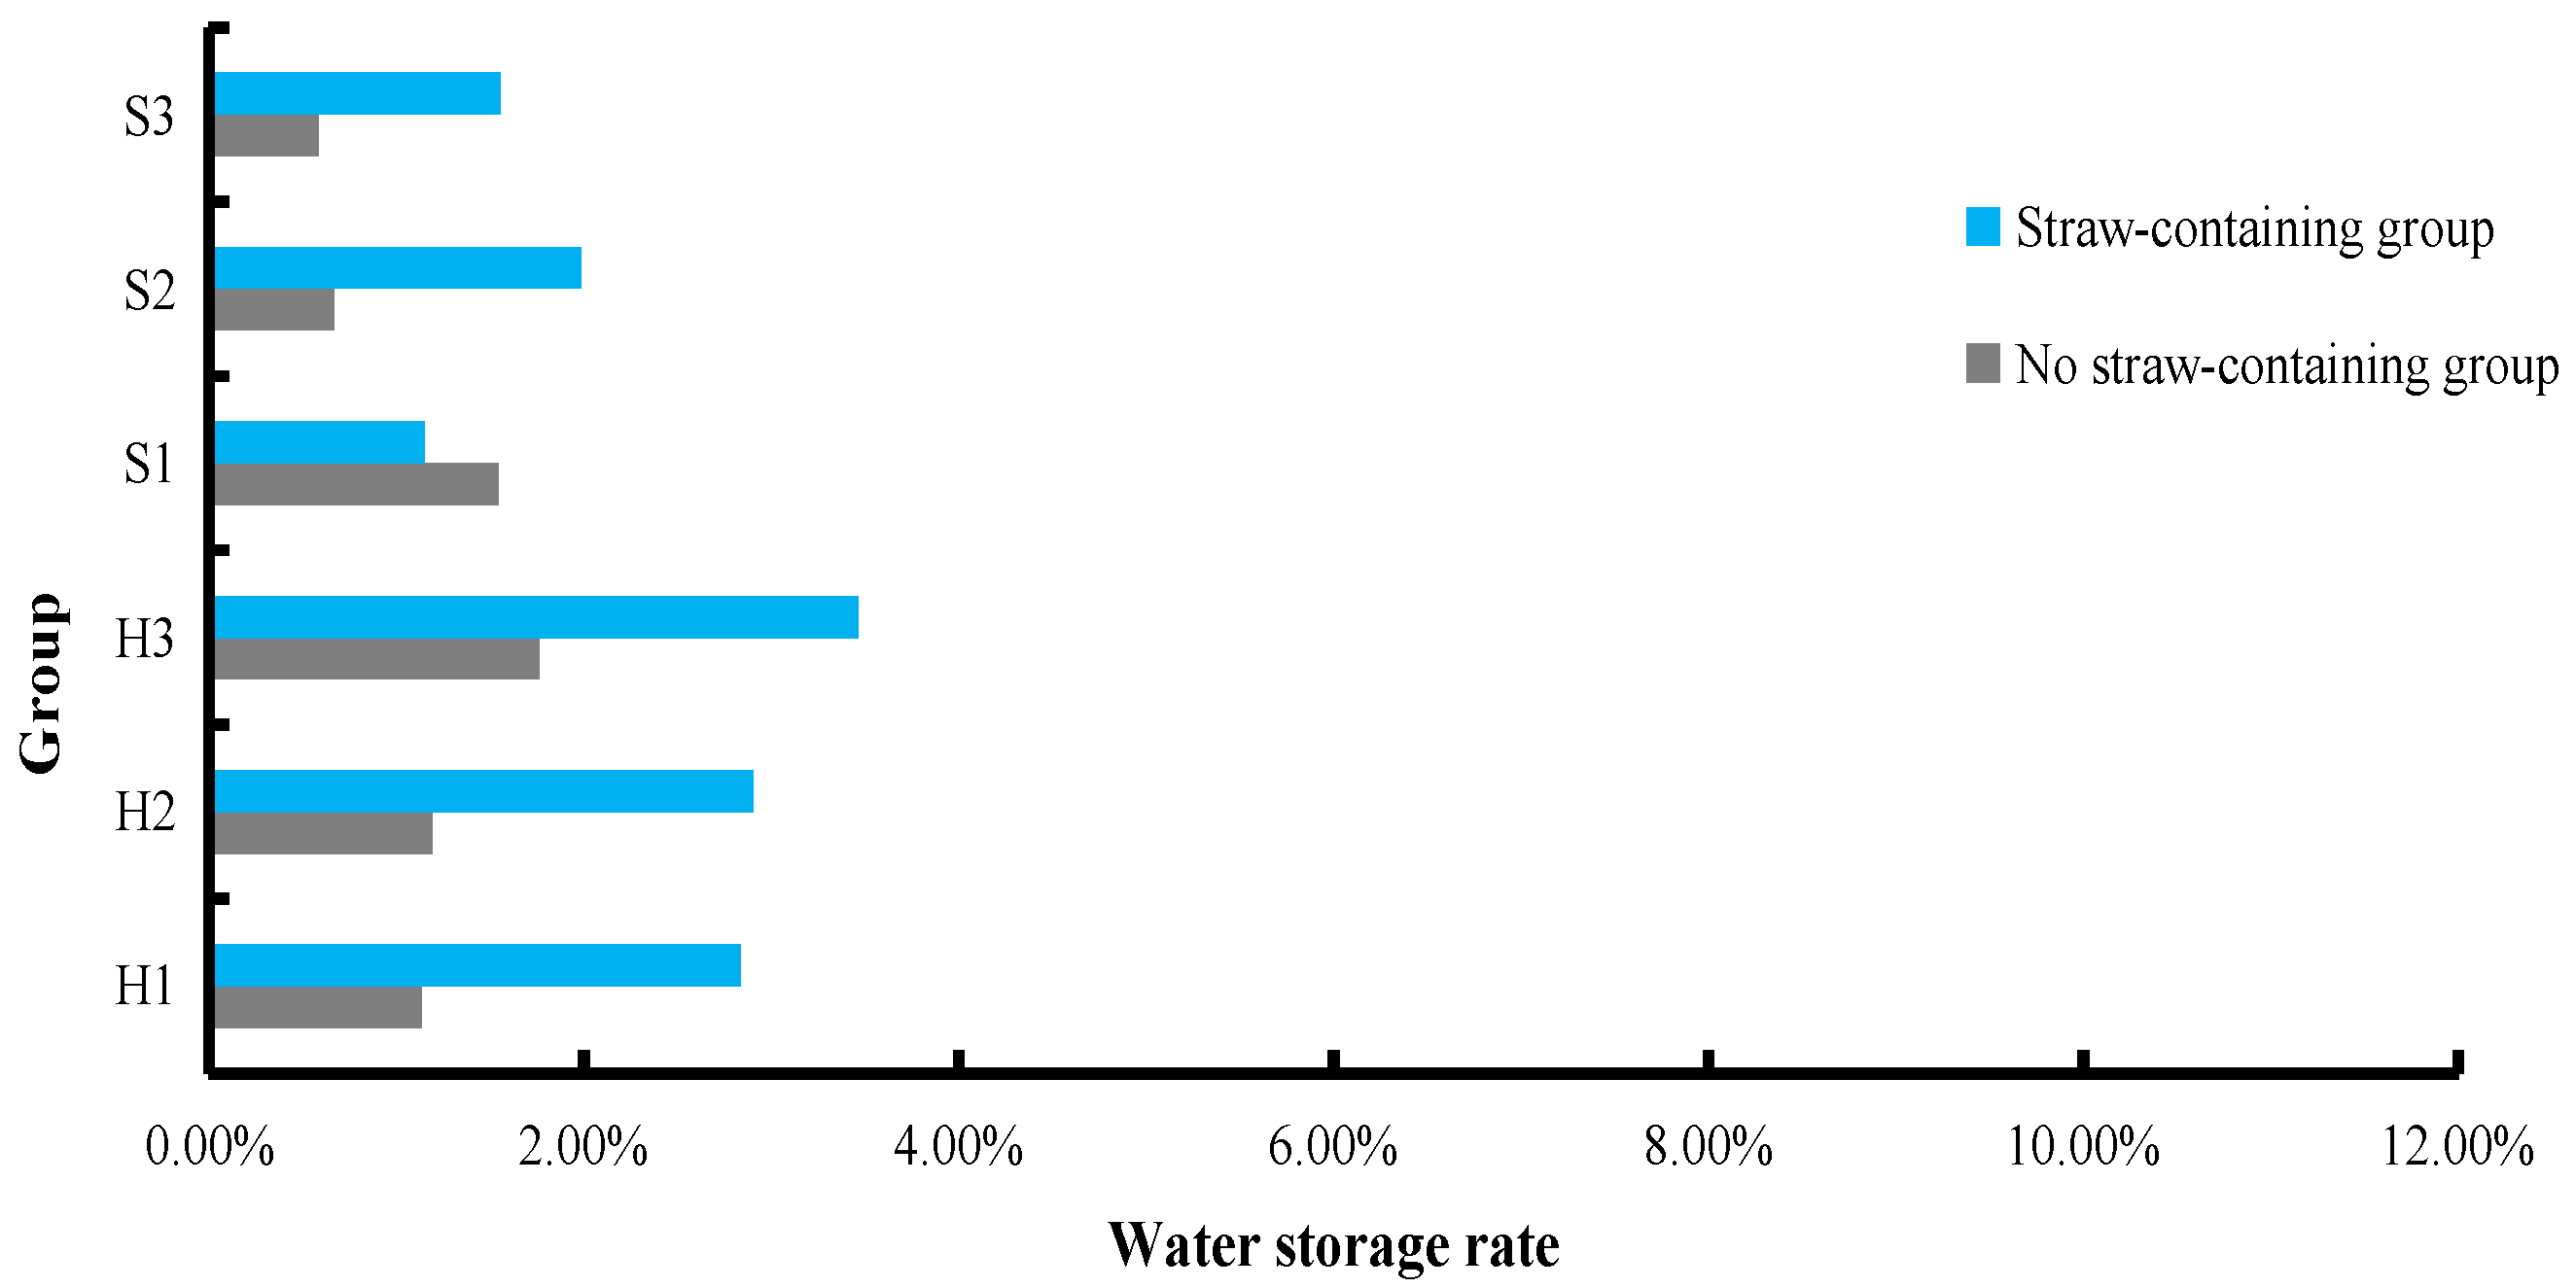
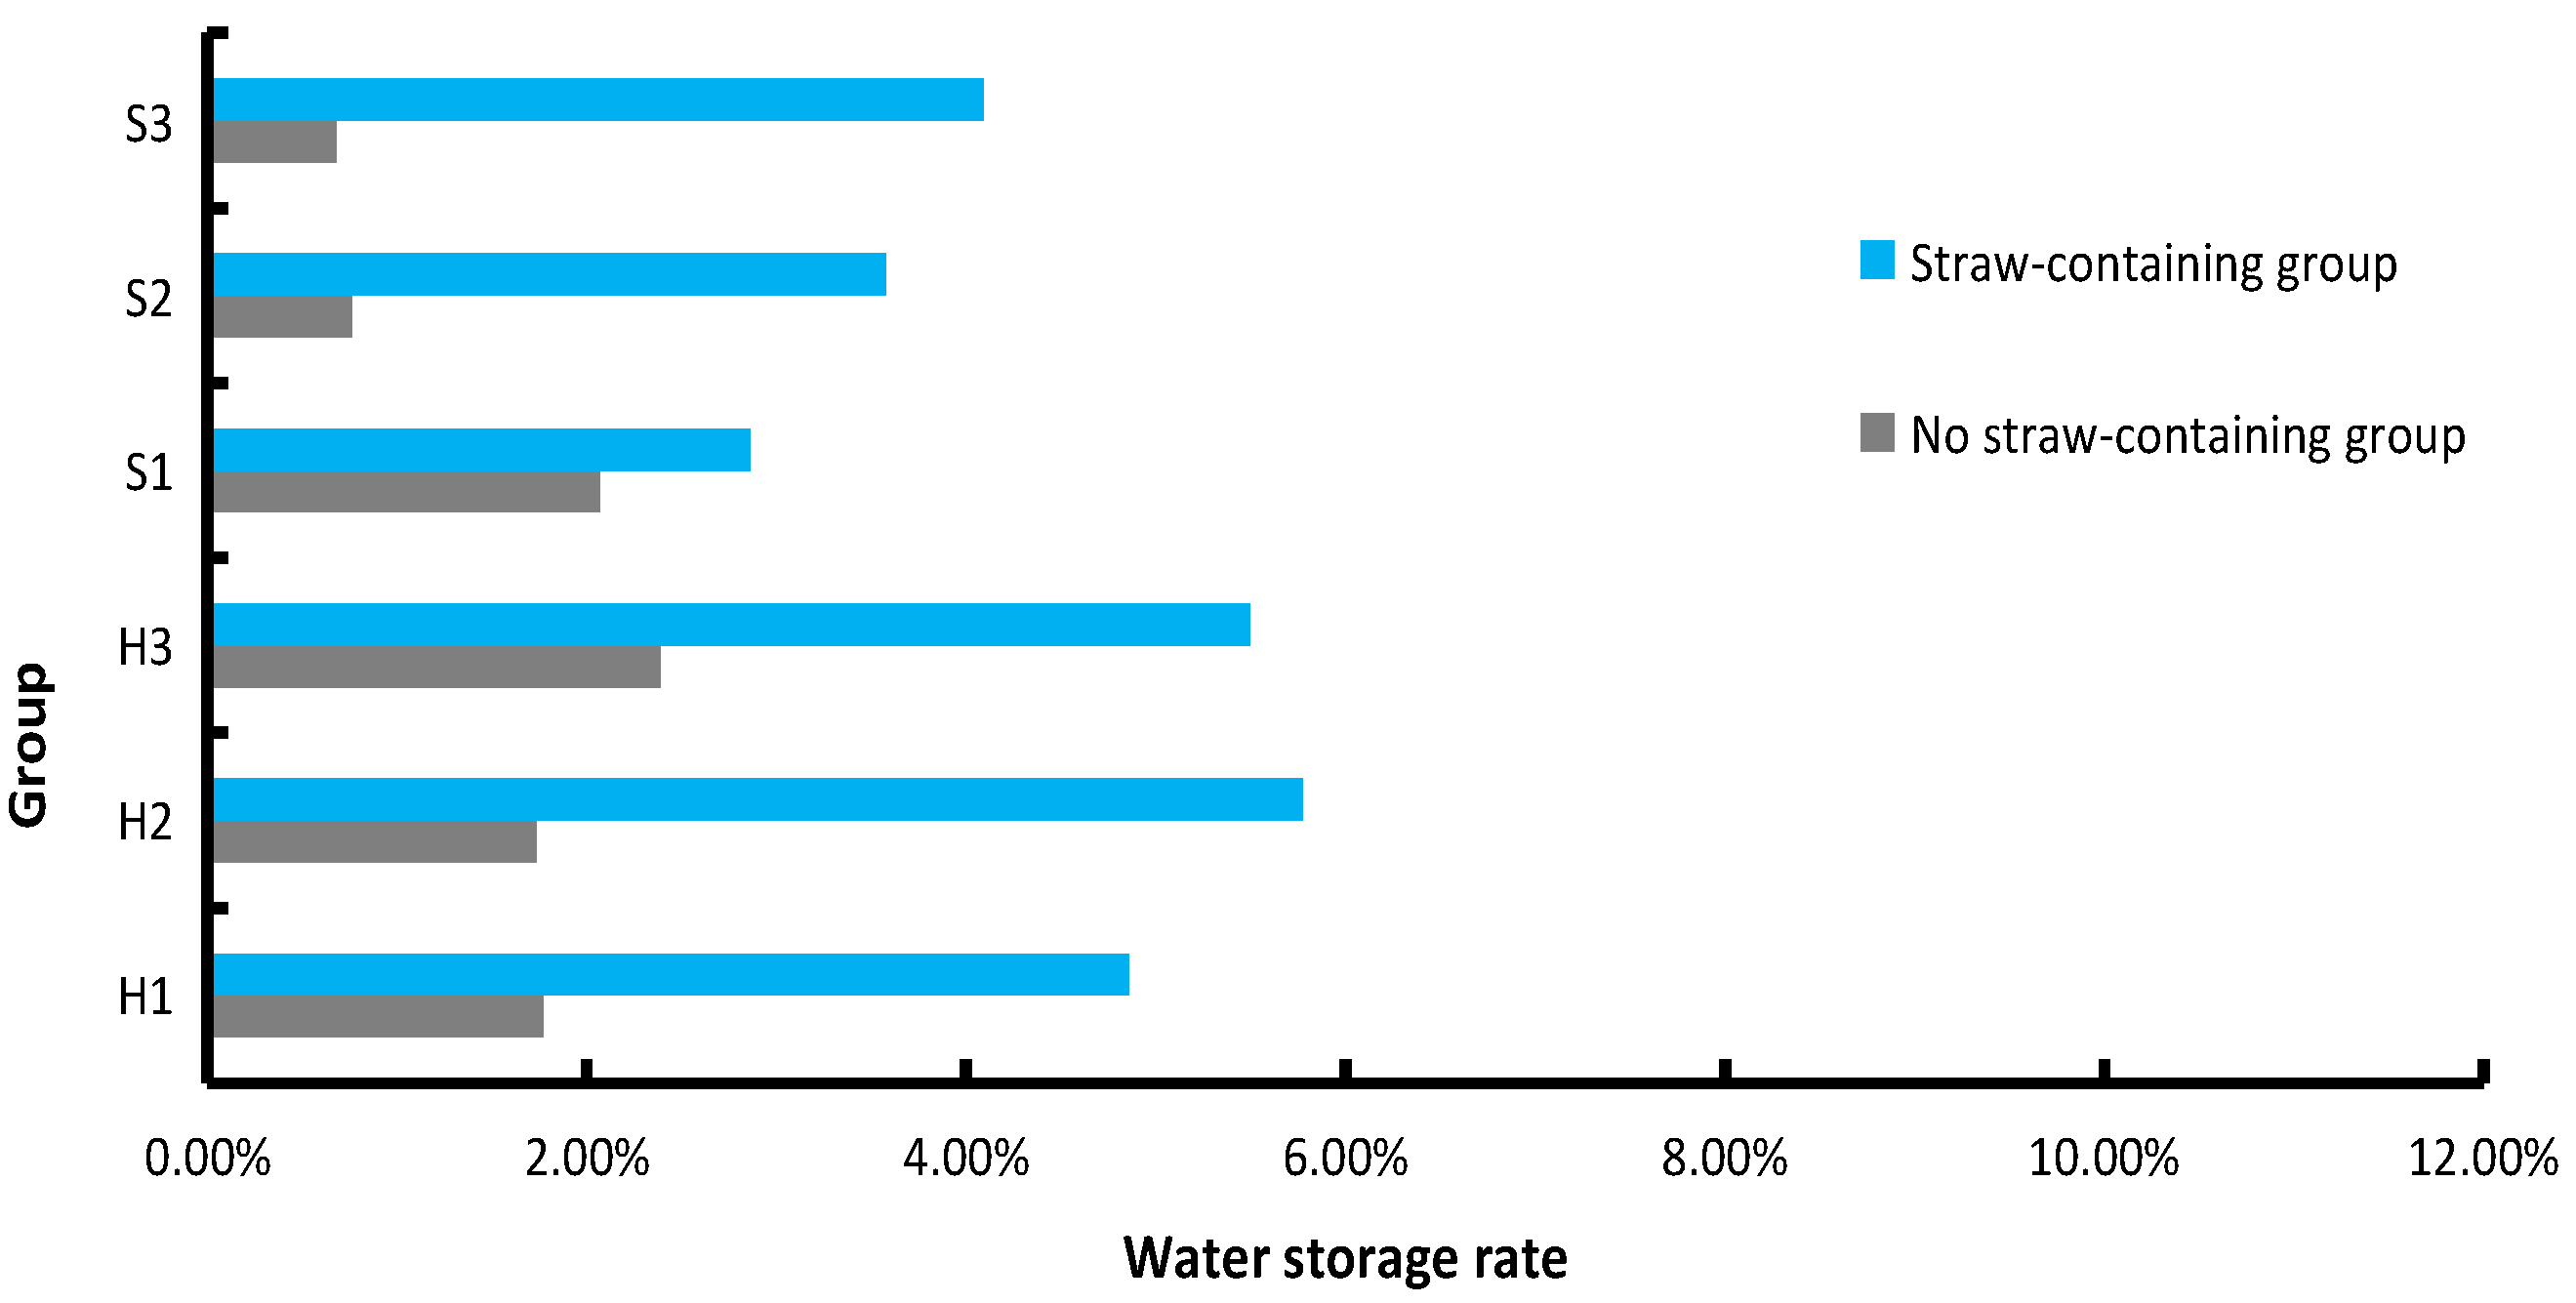
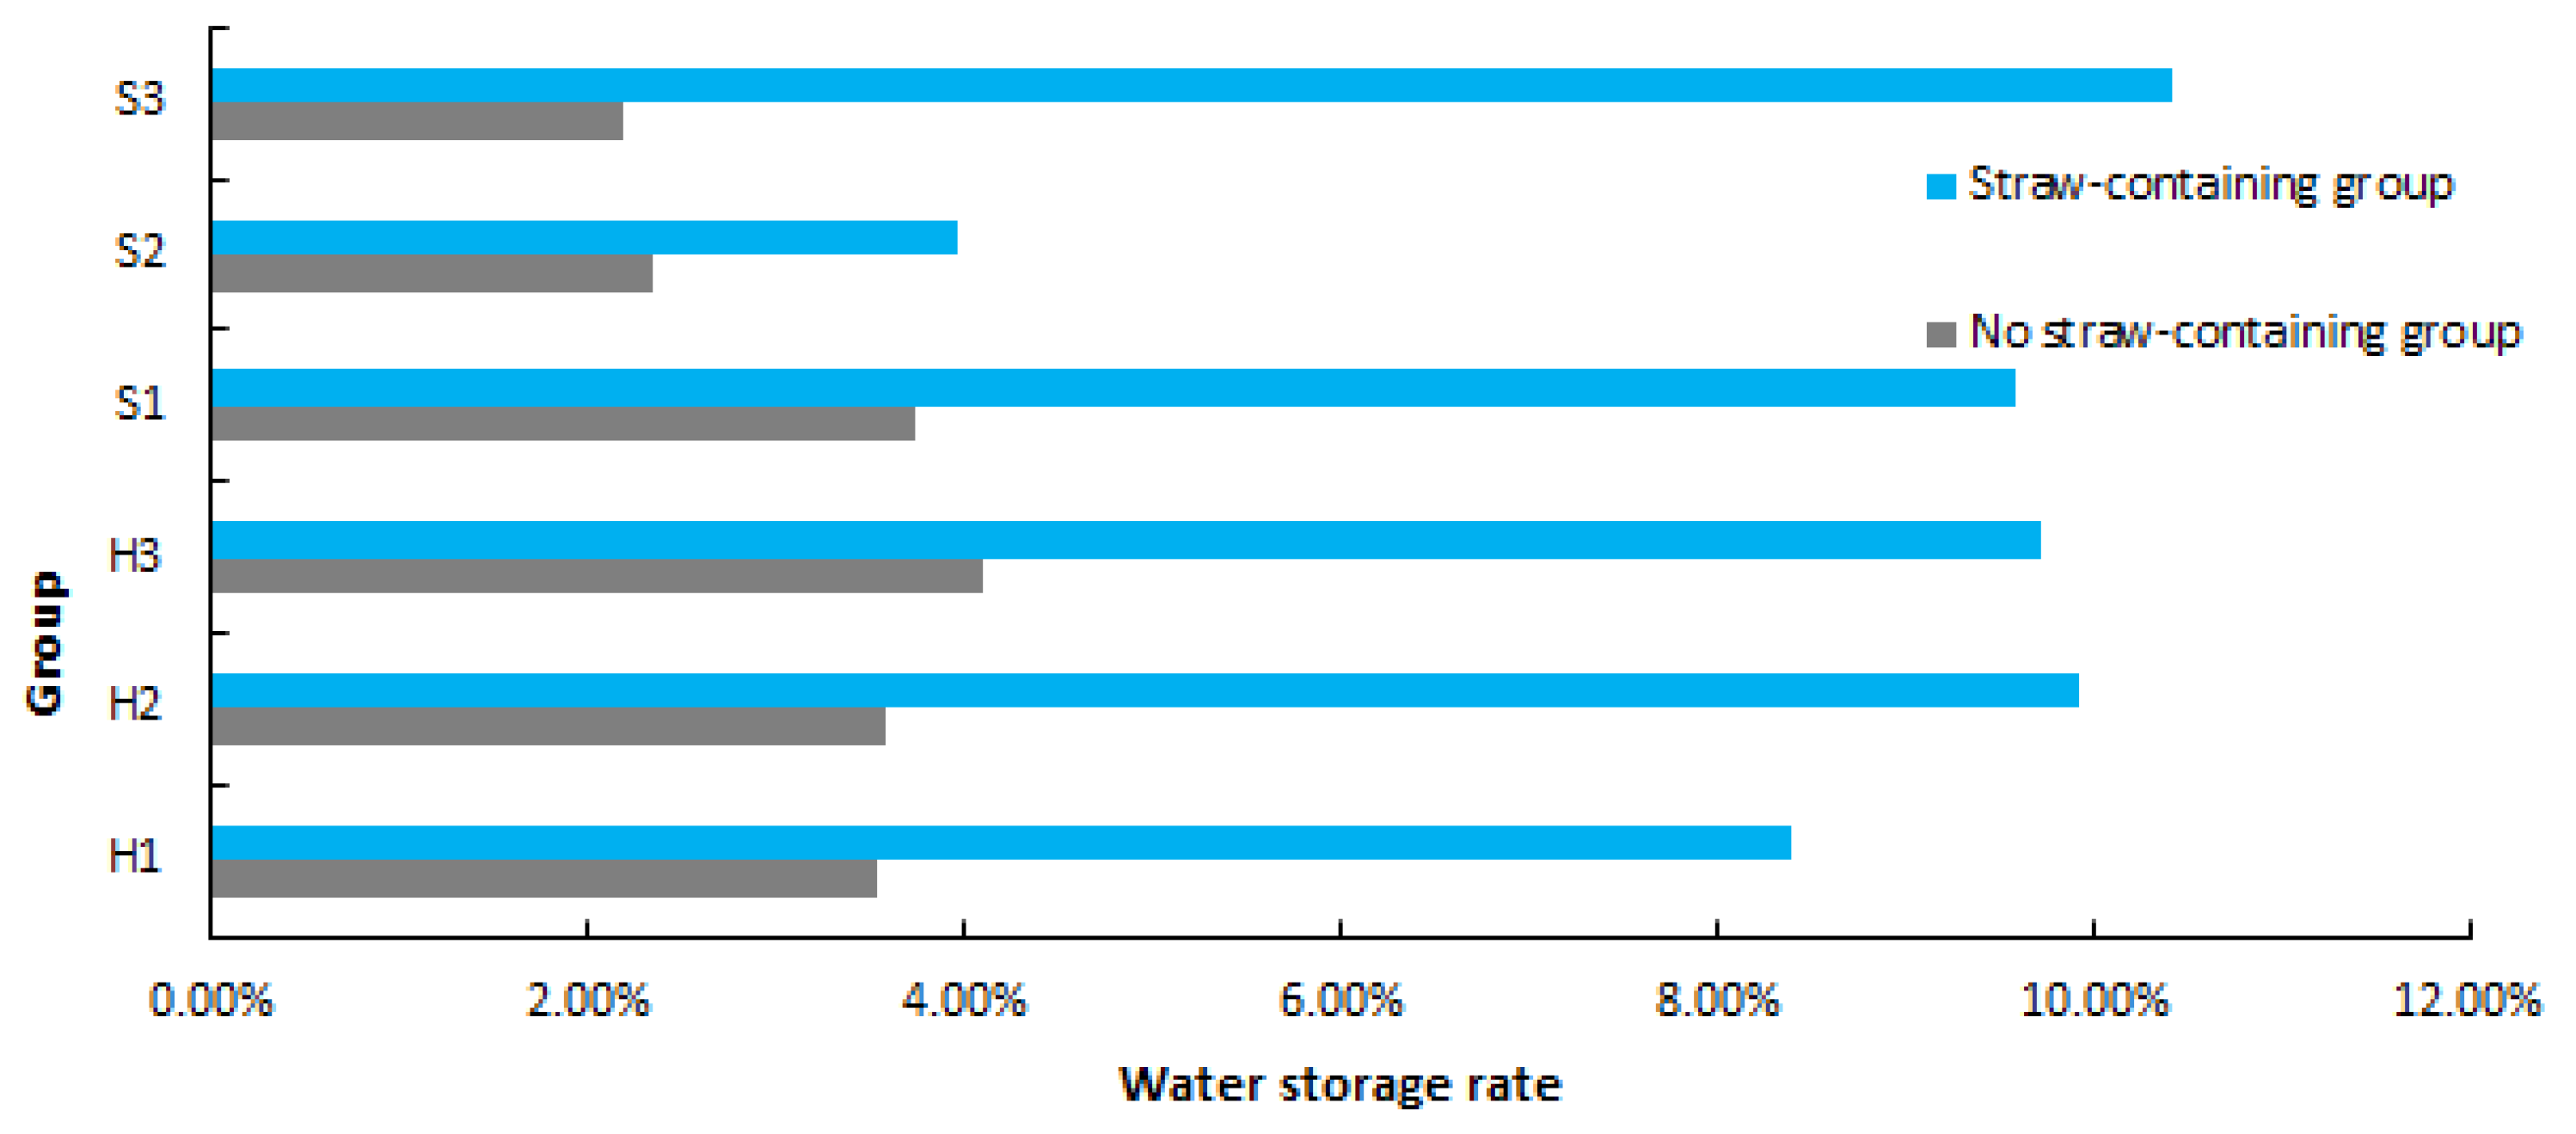
3.2. Water Storage Experiment

This study focused on the water storage rate of the rock material in a saturated state. Since the water storage rate is mainly determined by the proportion of straw powder, it is necessary to determine the water storage capacity of the specimen with different proportions of straw powder. To simplify the experimental process, the hard rock group and soft rock group were selected for 72 h of continuous measurement of water content.
For the specimen number, H indicates the hard rock group, S represents the soft rock group, 1-x represents the rock specimen without straw powder, and 2-x represents the rock specimen with straw powder. The overall curve of the water storage rate in all rock groups during 72 h of immersion is shown in Figure 4.
Figure 5 shows the water storage rate of rock specimens with and without straw powder after 24 h of immersion. Figure 6 shows the water storage rate of rock specimens with and without straw powder after 48 h of immersion. Figure 7 shows the water storage rate of rock specimens with and without straw powder after 72 h of immersion.
Through the above analysis, it can be concluded that:
  • There is a linear relationship between the time and the water absorption rate of rock specimens in different groups, and the saturation no longer increases after 72 h. The average saturated water storage rate of rock specimens with straw powder is 9.6% and that of rock specimens without straw powder is 3%. Therefore, the straw powder can improve the water storage rate of rock specimens by more than 300%.
  • The average water storage rate of rock specimens with straw powder is 2% within 24 h and that of rock specimens without straw powder is less than 1%. After 48 h, the average water storage rate of rock specimens with straw powder is more than 4.5%, while that of rock specimens without straw powder is less than 2%. It can be seen that the water absorption rate of rock specimens with straw powder is relatively slow at the first 24 h and then the water absorption rate significantly increases. This is because the oil film inside the material hinders the formation of the water absorption pathway. However, with the increased time, the oil film continues to seep out and form a pore channel inside the sample. Therefore, the water absorption rate slowly increases first and then increases rapidly.

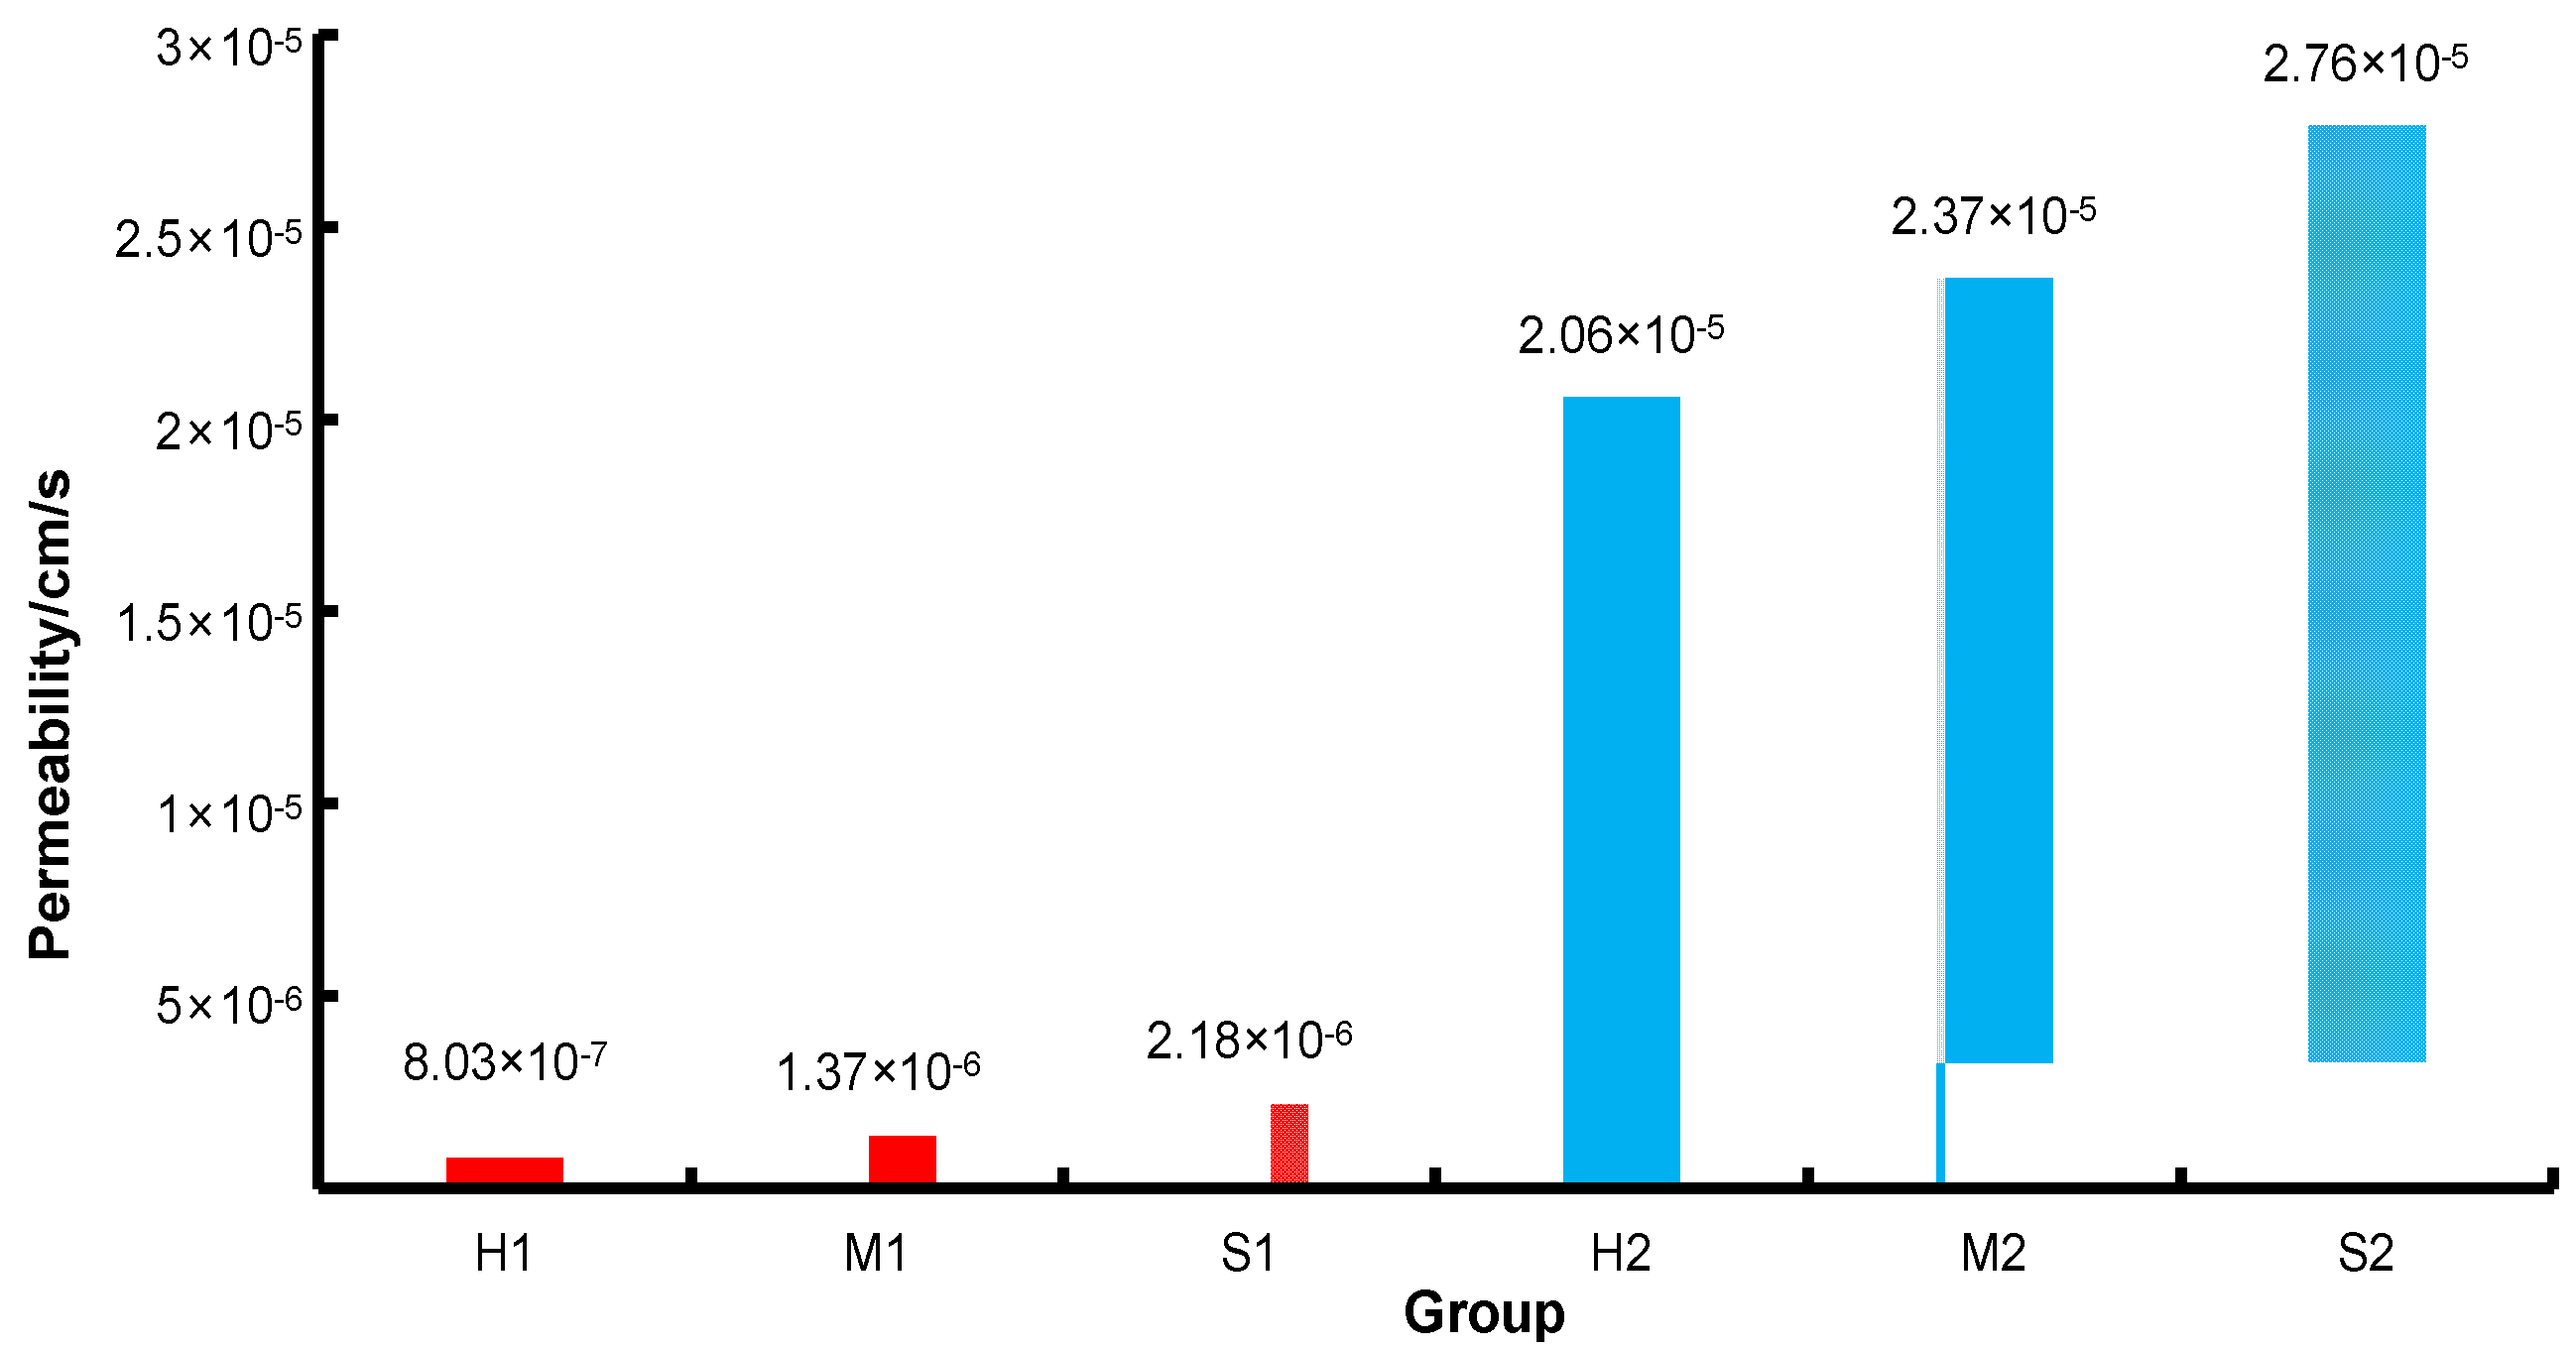
3.3. Permeation Experiments

In this section, the permeability of similar-simulation materials is mainly explored. Since the similar material without straw powder and PVA material has poor permeability, new materials were added to improve its permeability and PVA (Figure 8) was selected as the permeability improvement material in this experiment.
PVA is a kind of thermoplastic material dissolved in water. The prefabricated fracture entity can be formed by 3D printing. The specimen with a PVA content of 2% was used as a control group and then a variable head permeability test was conducted. The rock specimens with PVA material in different groups were numbered H1, M1, and S1, and the rock specimens without PVA material were numbered H2, M2, and S2. The permeability test results are shown in Figure 9.
Through the above analysis, it can be found that:
  • The permeability difference of rock groups with different lithologies is small and the greater the hardness of rock specimens, the worse the permeability.
  • The average permeability of the rock group without PVA is 1.45 × 10⁻⁶ cm/s, while the average permeability of the rock group with PVA can reach 2.36 × 10⁻⁵ cm/s. Therefore, PVA material significantly improves the permeability of rock materials and the permeability improvement rate reaches 1627%.
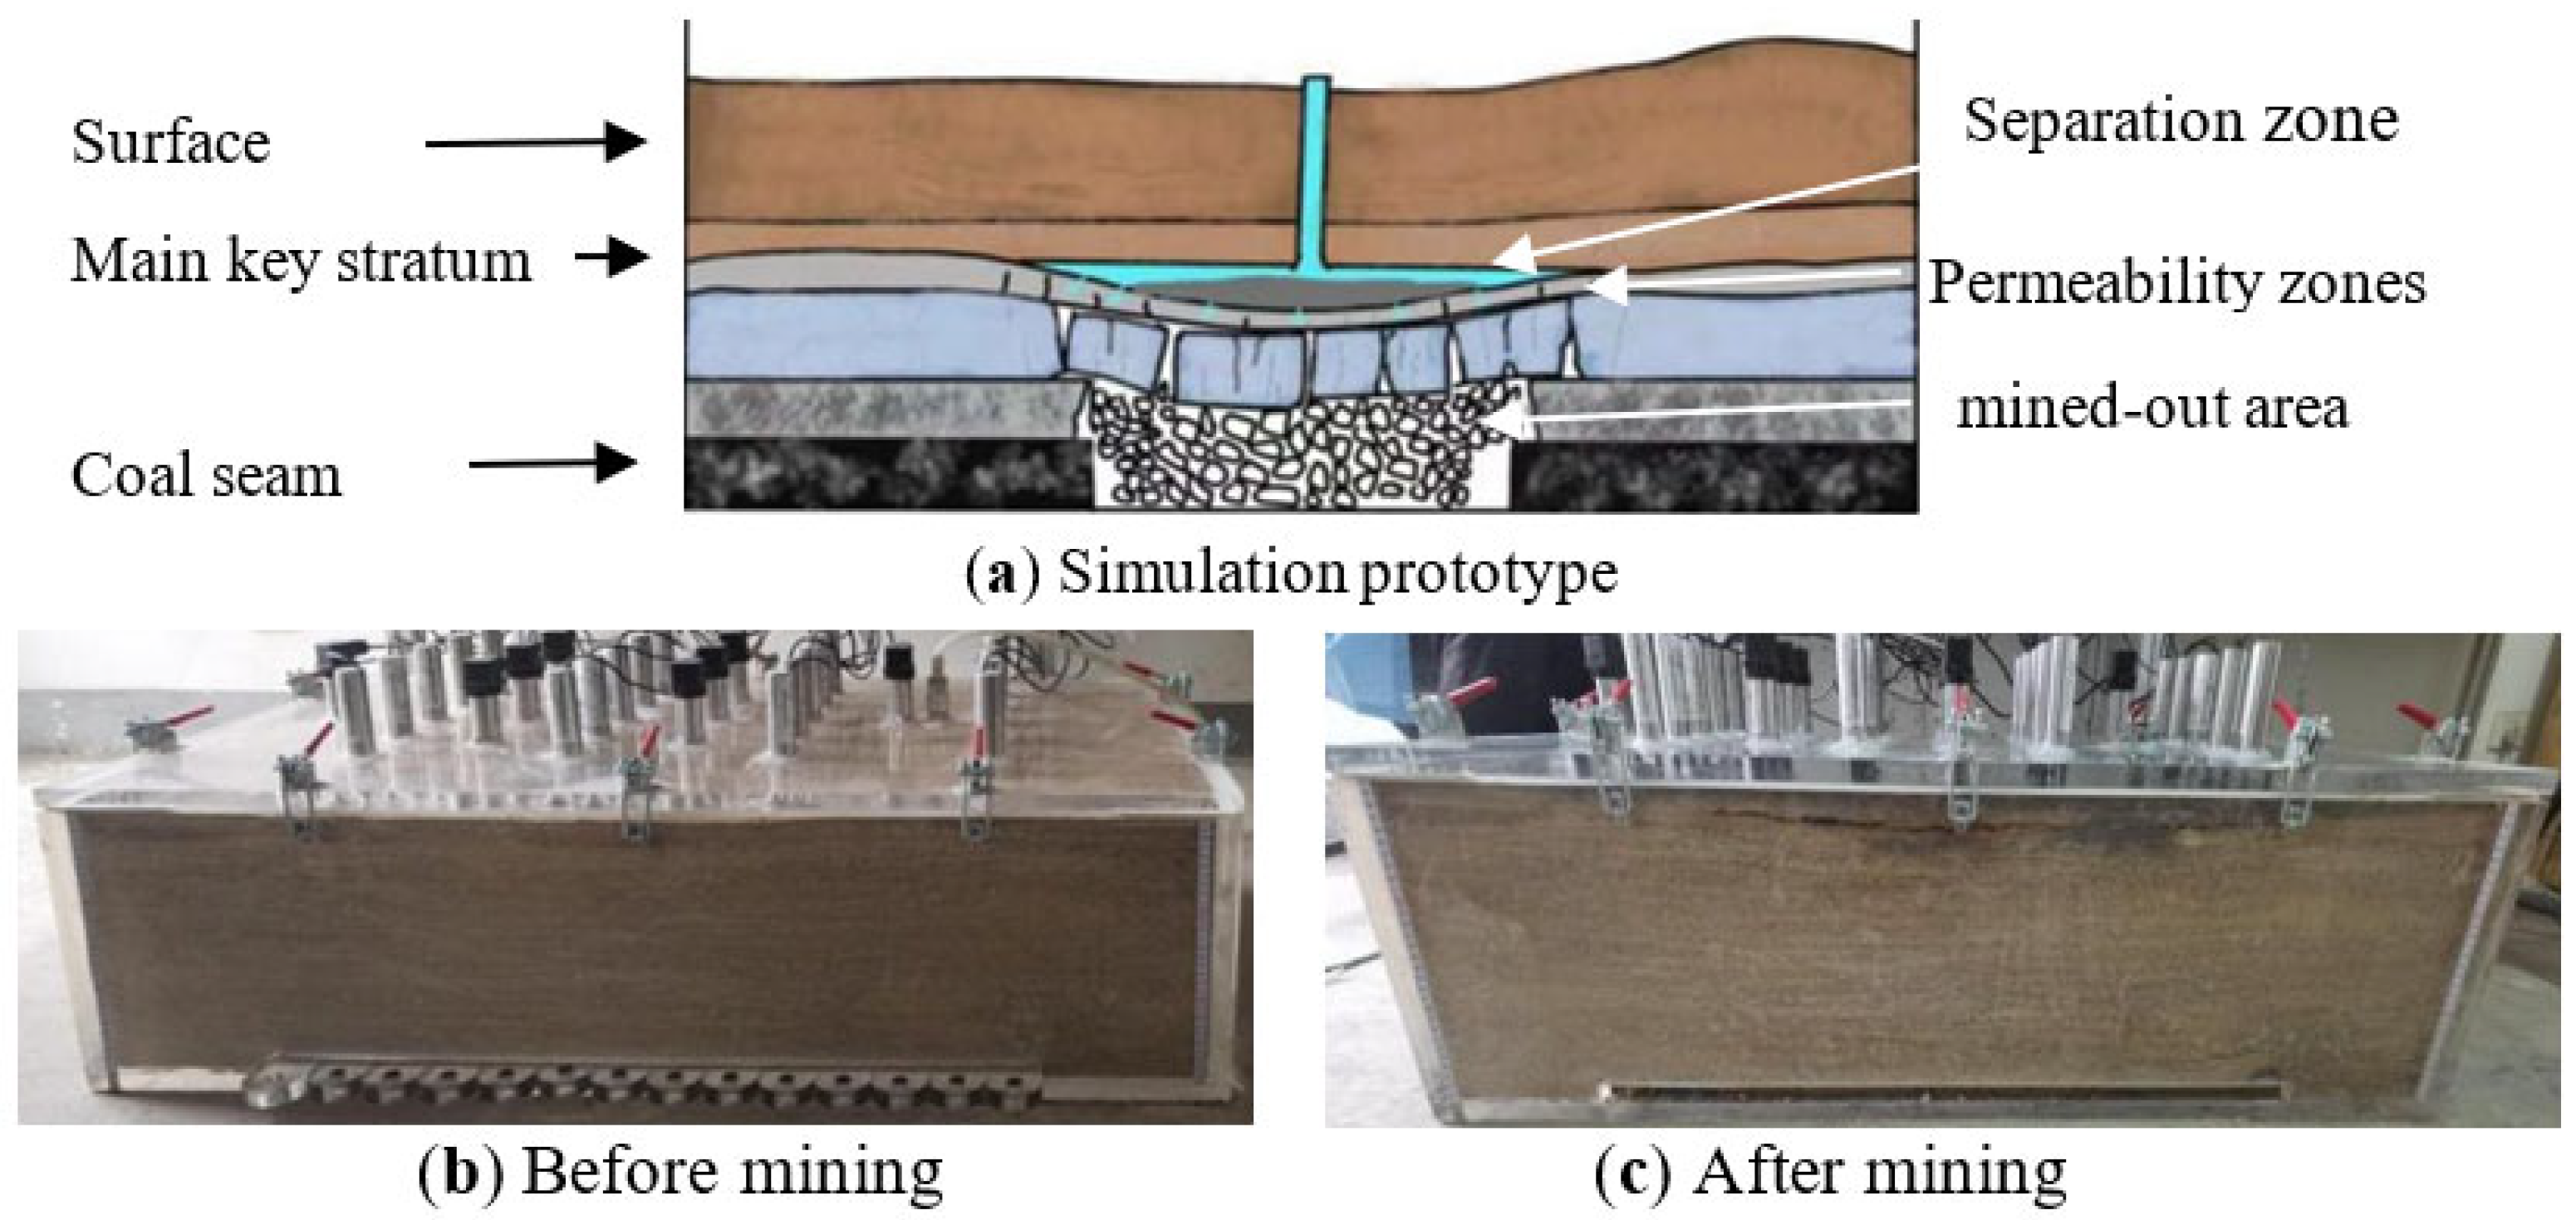
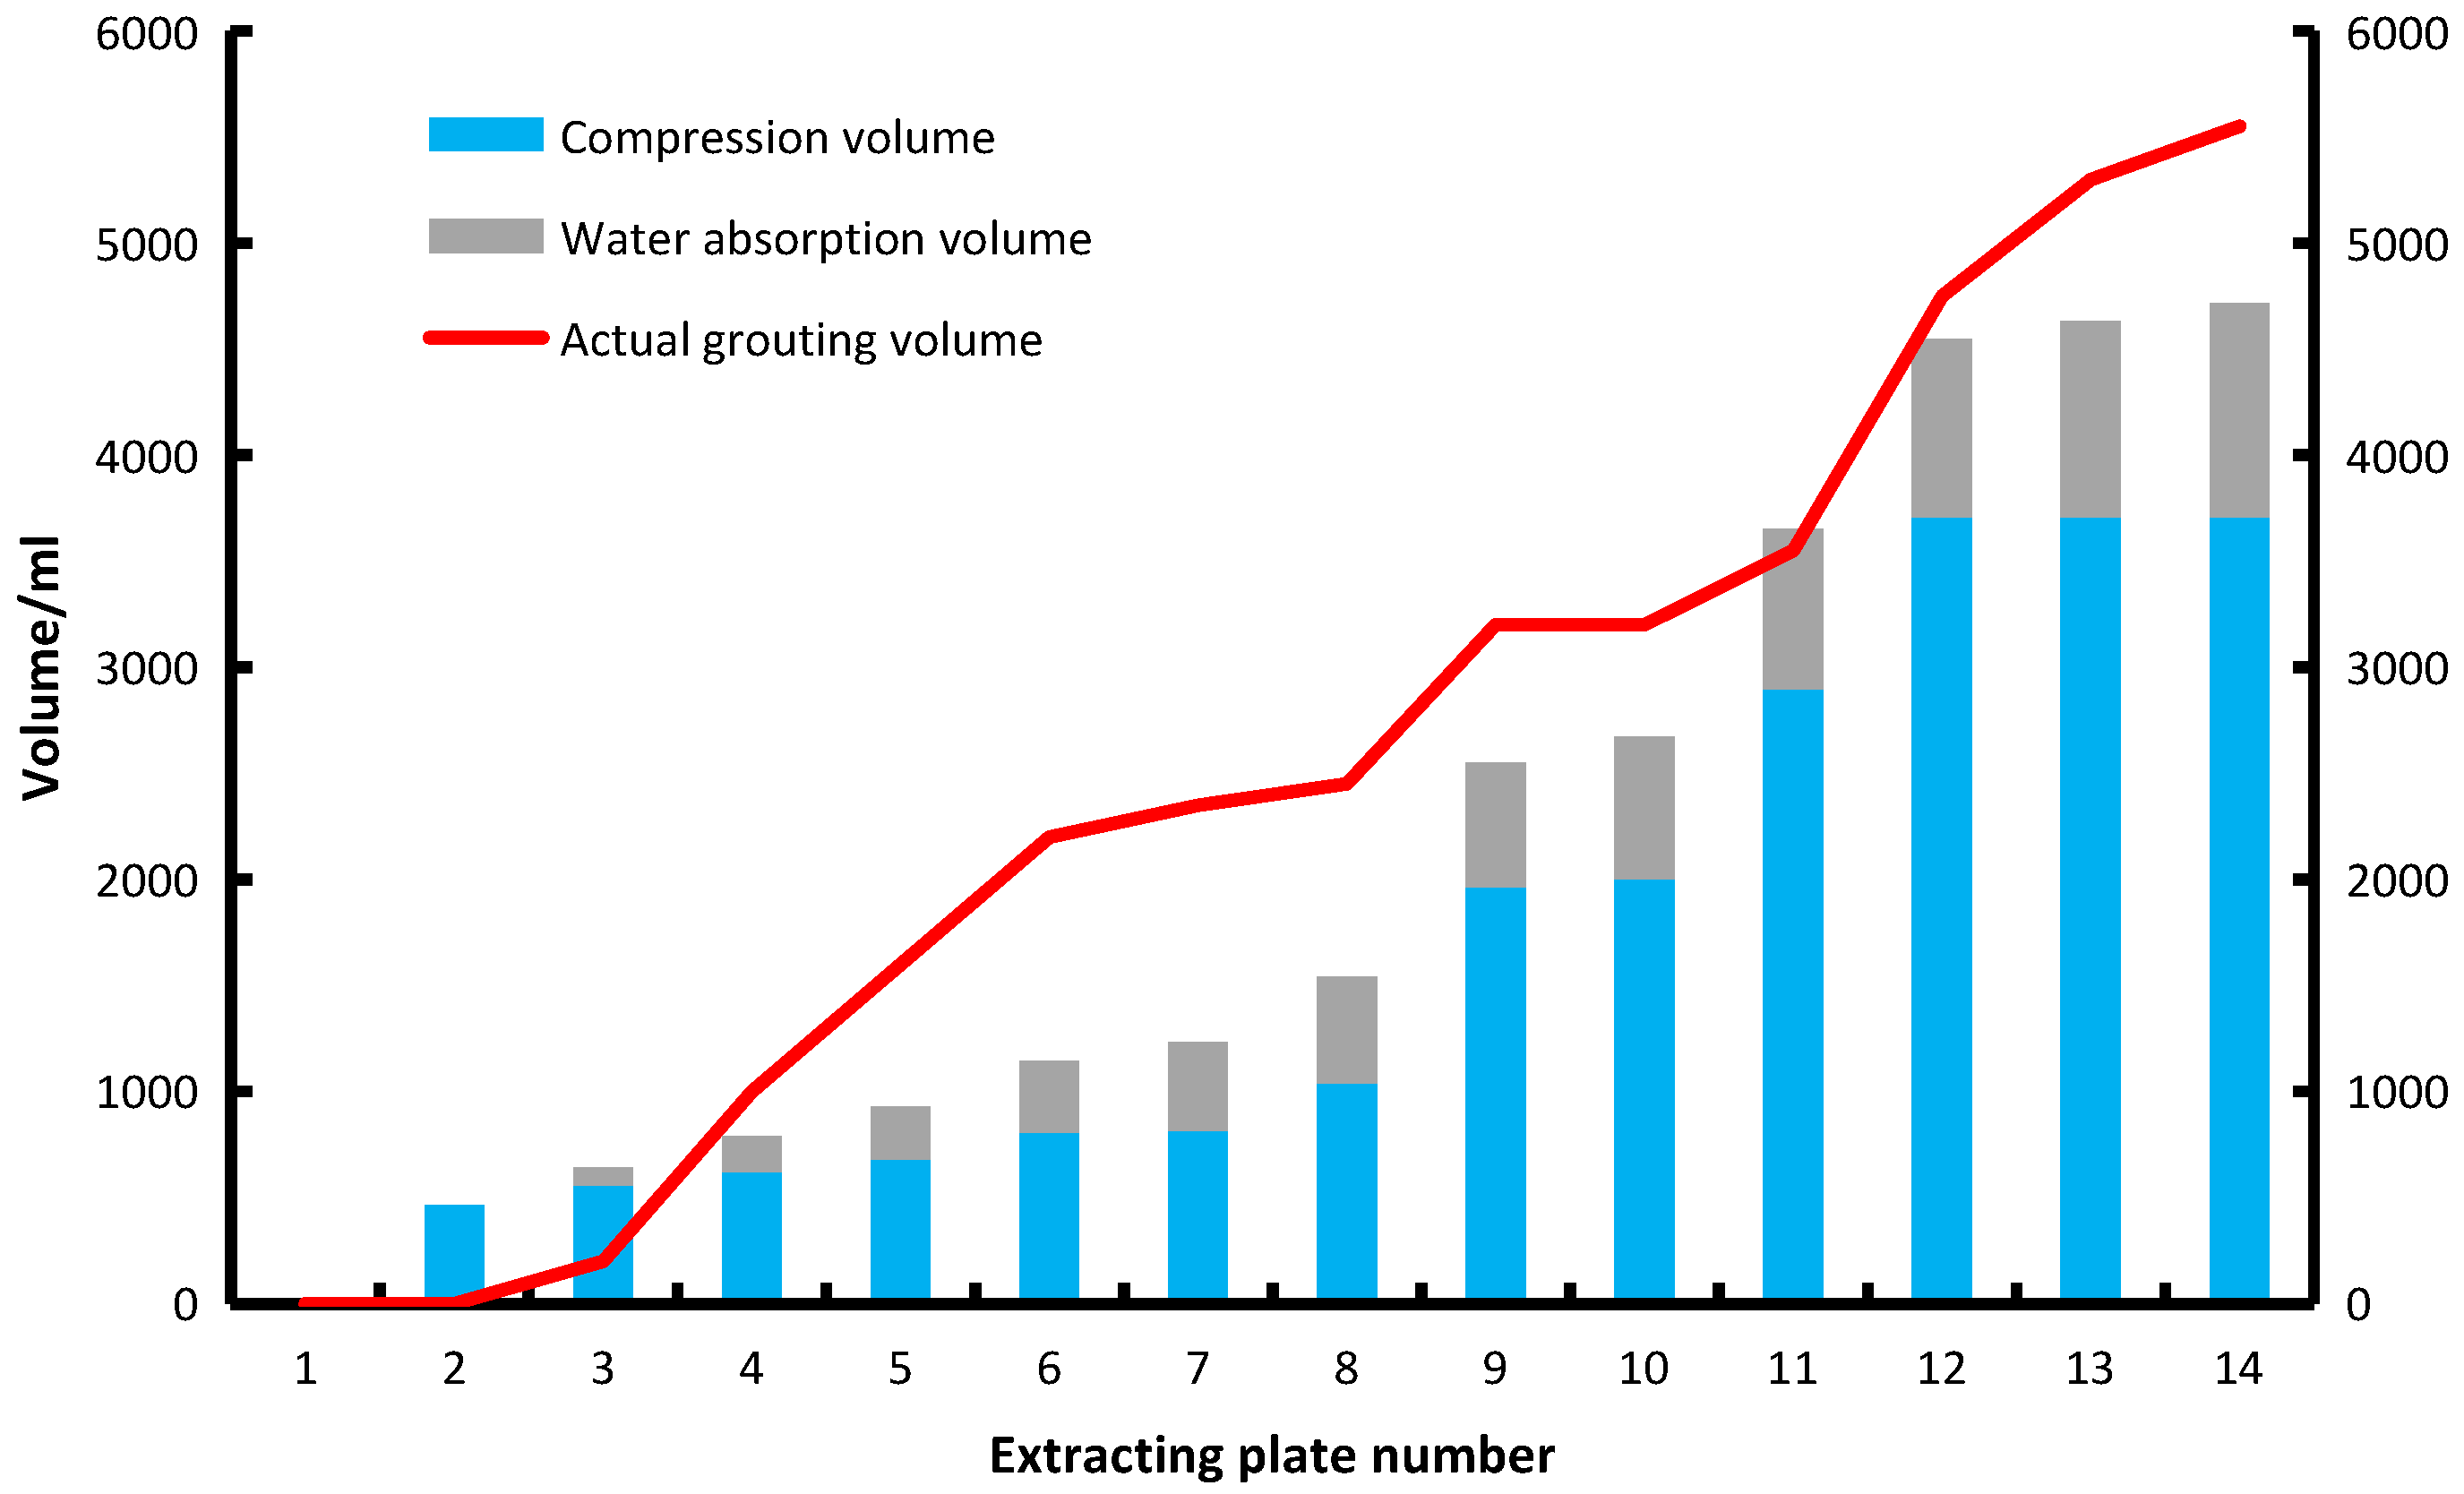
4. Application

Based on the above research results, three-dimensional physical simulation experiments were carried out by using the improved similar-simulation material to verify whether the simulated material can achieve the effect of insolubility in water and water absorption from the slurry.
The geometric similarity ratio was determined as 1:400. The experimental scale was 1000 mm × 500 mm × 300 mm and the widths of the coal pillars on the three sides of the working face were 150 mm, 150 mm, and 125 mm, respectively.
The mining period of the working face was 2 h. During mining, the simulated mining extraction plate was extracted one by one to represent coal seam mining. The separated cavity appeared above and the fly ash slurry was injected into the cavity, and the grouting compaction was used to improve the filling amount. The simulation process is shown in Figure 10.
The horizontal axis in the diagram represents the serial number of the extraction plate extracted from the simulated mining. The volume of the pressed solid (Figure 11) can be calculated after monitoring by the displacement sensor. The volume of the injected slurry can be obtained by flow monitoring. After slurry injection into the bed separation, a part of the water will penetrate into the rock layer and transform into a compressive solid. Therefore, the difference between the volume of the injected slurry and the volume of the pressed solid is the volume of secreted water absorbed by the rock.
In the process of simulated mining, the initial bed separation increased continuously and grouting began after grouting conditions were met. After the grout was injected into the bed separation, the water loss consolidation occurred under pressure and the compacted ash was formed. The water secreted by the grout was infiltrated into the similarly simulated rock strata. As shown in Figure 11, when the plate with the serial number 3 was extracted, the stopping distance accounted for 28% of the total length and the volume of injected slurry (1000 mL) was larger than that of the pressed solid (623 mL), indicating that the water in the slurry was secreted and infiltrated into the rock stratum.
With the further increase of the advancing distance, the difference between the injected slurry volume and the compressed solid volume increased continuously, indicating that more slurry outflow water flowed into the rock stratum. When plate number 9 was extracted (i.e., the stopping distance reached 64%), the difference between the injected slurry volume and the compressed solid volume was basically constant, indicating that the water absorption of rock strata was close to or was in a saturated state. The experiment shows that similar-simulation materials can well simulate the water absorption and seepage capacity of the overburden during the grouting.

5. Conclusions

In this study, a simulation material was developed for a similar-simulation process of bed separation grouting. The main characteristic of this material is that the strength, water storage rate, and permeability of similar materials have certain adjustability and similarity; it remains stable after encountering water rather than disintegrating. The effectiveness of the material has been verified by the model with a scale of 1:400. The main conclusions are as follows:
(1)
According to the above experimental results, the similarity coefficients of the time similarity ratio, geometric similarity ratio, and permeability similarity ratio are obtained as follows: Π1 = Π2 = gt2/l = 0.025 and Π3 = k/l2 = 1,600,000. Additionally, Π1 and Π2 are defined as the time similarity coefficients of the bed separation grouting simulation and Π3 as the permeability similarity coefficient of the bed separation grouting simulation.
These coefficients provide a reference for research and development of similar-simulation materials for the bed separation grouting simulation. According to the experimental needs, these coefficients can be used to adjust the geometric similarity ratio, time similarity ratio, and permeability similarity ratio.
(2)
A similar-simulation material with the adjustable strength of 80 KPa–144 KPa was obtained under limited experimental conditions. The experimental results verify that this material does not disintegrate in water and its water storage rate can be adjusted between 3% and 9.6%, and the permeability can reach 2.36 × 10⁻⁵ cm/s.
(3)
The similar-simulation experiment of mining-induced bed separation grouting was carried out in a three-dimensional physical experiment system at a similarity ratio of 1:400. The results show that the permeability of the similar-simulation material is strengthened by the generated cracks via the rock strata migration undermining and the volume of the bed separation is smaller than that of the grouting in the grouting process. This indicates that the material can successfully simulate the water loss and consolidation process of slurry and be used for grouting simulation experiments.

Author Contributions

Conceptualization, D.X.; methodology, J.L.; validation, K.Z.; formal analysis, K.Z.; investigation, J.L.; writing—original draft preparation, K.Z.; writing—review and editing, K.Z. All authors have read and agreed to the published version of the manuscript.

Funding

This work was supported by the State Key Laboratory of Coal Resources and Safe Mining-Xinjiang Institute Engineering Joint Open Research Fund Project (no. SKLCRSM-XJIEKF001), The funder is K.Z.

Acknowledgments

I wish to thank Zheng Kaidan for his advice on the experimental design.

Conflicts of Interest

The authors declare no conflict of interest.

References

  1. Miao, X.X.; Qian, M.G. Research Status and Prospect of Green Exploitation of Coal Resources in China. J. Min. Saf. Eng. 2009, 26, 1–14. [Google Scholar] [CrossRef]
  2. Qian, M.G.; Xu, J.L.; Wang, J.C. Further on the sustainable mining of coal. J. China Coal Soc. 2018, 43, 1–13. [Google Scholar] [CrossRef]
  3. Li, J.M.; Huang, Y.L.; Pu, H.; Gao, H.D.; Li, Y.; Ouyang, S.S.; Guo, Y.C. Influence of block shape on macroscopic deformation response and meso-fabric evolution of crushed gangue under the triaxial compression. Powder Technol. 2021, 384, 112–124. [Google Scholar] [CrossRef]
  4. Syd, S.P. Topical areas of research needs in ground control—A state of the art review on coal mine ground control. Int. J. Min. Sci. Technol. 2015, 25, 1–6. [Google Scholar] [CrossRef]
  5. Zhou, D.; Wu, K.; Bai, Z.; Hu, Z.; Li, L.; Xu, Y.; Diao, X. Formation and development mechanism of ground crack caused by coal mining: Effects of overlying key strata. B Eng. Geol. Env. 2019, 78, 1025–1044. [Google Scholar] [CrossRef]
  6. Liu, Z.X.; Cui, B.Q.; Liang, Y.B.; Guo, H.; Li, Y.Y. Study on Foundation Deformation of Buildings in Mining Subsidence Area and Surface Subsidence Prediction. Geotech. Geol. Eng. 2019, 37, 1755–1764. [Google Scholar] [CrossRef]
  7. Xu, J.L. Research and Progress of Green Mining in Coal Mine in 20 Years. Coal Sci. Technol. 2020, 48, 1–15. [Google Scholar] [CrossRef]
  8. Xu, J.L.; Xuan, D.; Zhu, W.B.; Wang, X.Z.; Teng, H. Research and Practice of Partial Filling Coal Mining Technology. Coal Sci. Technol. 2015, 40, 1303–1312. [Google Scholar] [CrossRef]
  9. Xu, J.L.; Xuan, D.; Zhu, W.B.; Wang, X.Z. Partial Backfilling Coal Mining Technology Based on Key Strata Control. J. Min. Strat. Control Eng. 2019, 1, 69–76. [Google Scholar]
  10. Zhang, L.; Xu, J.L.; Xuan, D.; Gan, M.G. Experiment and application of compression characteristics of overburden isolation grouting filling slurry. J. China Coal Soc. 2017, 42, 1117–1122. [Google Scholar] [CrossRef]
  11. Zhang, L.; Xu, J.L.; Xuan, D. Experimental study on drainage characteristics of isolated grouting filling slurry. China Coal 2017, 43, 121–124. [Google Scholar] [CrossRef]
  12. Xuan, D.; Wang, B.; Xu, J.L. A shared borehole approach for coal-bed methane drainage and ground stabilization with grouting. Int. J. Rock Mech. Min. 2016, 86, 235–244. [Google Scholar] [CrossRef]
  13. Sun, W.B.; Zhou, F.; Shao, J.L.; Du, H.Q.; Xue, Y.C. Development Status and Prospects of Mine Physical Similar Material Simulation Experiments. Geotech. Geol. Eng. 2019, 37, 3025–3036. [Google Scholar] [CrossRef]
  14. Qing-biao, W.; Zhu, Q.K.; Shao, T.S.; Yu, X.G.; Xu, S.Y.; Zhang, J.J.; Kong, Q.L. The rheological test and application research of glass fiber cement slurry based on plugging mechanism of dynamic water grouting. Constr. Build. Mater. 2018, 189, 119–130. [Google Scholar] [CrossRef]
  15. Wu, J.; Chen, B.; Chai, S.J.; Kong, W.L. Experimental Study on Compression Characteristics of Gangue Grouting Filling Materials. Geotech. Geol. Eng. 2020, 38, 4557–4565. [Google Scholar] [CrossRef]
  16. Huang, Q.X.; Zhang, W.Z.; Hou, Z.C. Study on Similar Materials of Waterproof Layer in Solid-liquid Coupling Test. Chin. J. Rock Mech. Eng. 2010, 29, 2813–2818. [Google Scholar]
  17. Huang, Q.X. Study on water resisting property of subsurface aquiclude in shallow coal seam mining. J. Coal Sci. Eng. 2008, 14, 369–372. [Google Scholar] [CrossRef]
  18. Zhang, J.; Hou, Z.J. Experimental study on simulation materials for solid-liquid coupling. Chin. J. Rock Mech. Eng. 2004, 23, 3157–3161. [Google Scholar] [CrossRef]
  19. Sun, W.B.; Zhang, S.C.; LI, Y.Y.; Lu, C. Development application of solid-fluld coupling similar material for floor strata and simulation test of waterinrush in deep mining. Chin. J. Rock Mech. Eng. 2015, 34, 2665–2670. [Google Scholar] [CrossRef]
  20. Lian, H.Q.; Xia, X.; Ran, W.; Zhao, Q.F. Experimental study on water resistance of new fluid-solid coupling similar simulation materials. Coal Min. Technol. 2015, 20, 12–16. [Google Scholar] [CrossRef]
  21. Zhang, S.C.; Guo, W.J.; Li, Y.Y.; Sun, W.B.; Yin, D.W. Experimental Simulation of Fault Water Inrush Channel Evolution in a Coal Mine Floor. Mine Water Env. 2017, 36, 443–451. [Google Scholar] [CrossRef]
  22. Tang, L.; Guo, P. Research and Application of 3D Printing Water Soluble Polyvinyl Alcohol Material. New Chem. Mater. 2019, 47, 221–223. [Google Scholar]
  23. Lin, F.; Zhao, J.L.; Wu, Q.P. Study on waste-metakaolin composite permeable material. J. Sci. Teach. Coll. Univ. 2017, 37, 56–58. [Google Scholar] [CrossRef]
  24. Zhao, H.K.; Zhao, P.P.; Bing, S.P.; Chen, J.; Zhang, K.H. Preparation and Analysis of Hydroxypropyl Methyl Cellulose Doped Straw Absorbent Materials. New Chem. Mater. 2020, 48, 249–253. [Google Scholar] [CrossRef]
Figure 1. Preparation process of similar-simulation materials.
Minerals 12 00502 g001
Figure 2. Stress–strain curves of specimens in different groups.
Minerals 12 00502 g002
Figure 3. Immersion characteristics and complete stress–strain curve of rock specimens.
Minerals 12 00502 g003
Figure 4. Total curves of water storage rate of rock specimens in 72 h.
Minerals 12 00502 g004
Figure 5. Comparison of water storage rate of specimens after 24 h immersion.
Minerals 12 00502 g005
Figure 6. Comparison of water storage rate of specimens after 48 h immersion.
Minerals 12 00502 g006
Figure 7. Comparison of water storage rate of specimens after 72 h immersion.
Minerals 12 00502 g007
Figure 8. Water immersion of PVA materials.
Minerals 12 00502 g008
Figure 9. Permeability test of specimens.
Minerals 12 00502 g009
Figure 10. Similar simulation of mining bed separation grouting.
Minerals 12 00502 g010
Figure 11. Comparison of injected slurry volume and solid volume.
Minerals 12 00502 g011
Table 1. Ratios of similar-simulation materials (%).
Simulated LithologyParaffinLubricating OilTalc PowderSandStraw PowderPVA
Hard rock4.54.598022
Medium-hard rock34.510.58022
Soft rock24.511.58022
Note: PVA disappeared after dissolving in water, thus it was not involved in the total mass ratio.
Publisher’s Note: MDPI stays neutral with regard to jurisdictional claims in published maps and institutional affiliations.

