Article

Geochemical Quantitative Assessment of Mineral Resource Potential in the Da Hinggan Mountains in Inner Mongolia, China

1
Institute of Geophysical and Geochemical Exploration, Chinese Academy of Geological Sciences, Langfang 065000, China
2
Beijing Institute of Geology for Mineral Resources Co., Ltd., Beijing 100012, China
3
State Key Laboratory of Geological Processes and Mineral Resources (GPMR), Faculty of Earth Sciences, China University of Geosciences, Wuhan 430074, China
4
Department of Geology, University of the Free State, Bloemfontein 9301, South Africa
5
Geological Sciences, School of Agricultural, Earth and Environmental Sciences, University of KwaZulu-Natal, Westville 3629, South Africa
*
Authors to whom correspondence should be addressed.
Minerals 2022, 12(4), 434; https://doi.org/10.3390/min12040434
Submission received: 8 December 2021 / Revised: 26 March 2022 / Accepted: 28 March 2022 / Published: 31 March 2022

Abstract

:
Studying surface geochemical anomalies is important for detecting the presence of mineral deposits. However, distinguishing inconspicuous geochemical anomalies is a challenge for geochemists. This paper studies geochemical quantitative prediction for Pb–Zn metallic mineral deposits by identifying inconspicuous surface geochemical anomalies mainly associated with the Permian and Jurassic strata in the middle-southern Da Hinggan Mountains metallogenic belt. Some new methods are employed to highlight weak surface geochemical anomalies. The weak surface geochemical anomalies of Pb and Zn are effectively highlighted by the average contrast values of Pb–Zn–Ag–Cd. The similarity coefficient with the large typical discovered deposits is used to identify new Pb–Zn mineralized anomalies and delineate new prospecting target areas. The denudation degree of mineral deposit is determined by the ratio of (W × Sn)/(As × Sb). The analogy method and areal productivity method are employed for resource prediction. Thirty-six prediction areas with Pb–Zn resources of 307.73 million tons are delineated. Five prediction areas are verified, and some new mineral deposits are proven by drilling. The verification results show that the predicted resources are very reasonable and credible. This paper is a successful case of quantitative prediction assessment of mineral resource potential, which can be used as a reference for future prospecting activities.

1. Introduction

With the development of the economy, the demand of human society for mineral resources is increasing. Moreover, a large number of surface mines and shallow buried mines have been found and exhausted. Mineral prospecting work has faced severe challenges [1,2,3,4], and it now has to be conducted in thick covered areas or some unknown areas [5,6,7]. Therefore, the difficulty of mineral prospecting is gradually increasing. How to improve the efficiency and ability of scientific mineral prospecting is increasingly being investigated by government departments and related scholars. The prediction of mineral resource potential, which can avoid and reduce exploration risks and improve exploration efficiency, has become an important means to deal with such challenges and has important research and practical significance [8,9,10,11,12,13,14,15].
China’s National Geochemical Mapping Project (Regional Geochemical–National Reconnaissance, RGNR project) initiated in 1979, has now covered more than six million square kilometers of China’s territory. Substantial geochemical data containing prospecting information have been obtained, with great contributions to China’s mineral exploration and geological work [16,17].
However, a great many of the previous studies focused on the screening and verification of geochemical anomalies with high concentration, multiple elements, and large size [18,19,20]. With the deepening of mineral prospecting, it can be generally found that the geochemical anomalies in mineralized bodies with large buried depth are very weak with low concentration and small-sized; hence, they are always ignored [21,22,23,24,25]. Therefore, it is of great significance to (a) summarize previous research and regional geochemical data of China, (b) identify the missed geochemical anomalies mentioned above, (c) establish geochemical models of metallogenic indicator elements for typical deposits, (d) explore the geochemical distribution of elements and its relationship with regional metallogeny and metallogenic potential, and (e) evaluate the potential for mineral resources. These studies can provide a scientific basis for the deployment of resource exploration work, for the discovery of new mineral resources, and to address the supply-and-demand situation of mineral resources.
The Da Hinggan Mountains metallogenic belt is one of the 19 important metallogenic zones in China [26]. New mineral deposits were frequently found in recent years in the middle-southern section of the Da Hinggan Mountains metallogenic belt. Therefore, it has gained more and more attention from many scholars, and it has been delineated by the China Geological Survey as a key prospecting area for Pb–Zn polymetallic mineral deposits [27,28,29,30,31]. Because of depletion of the previously proven deposits, there is a growing need to explore new deposits. Studying surface geochemical anomalies is important for detecting mineral deposits, but distinguishing inconspicuous geochemical anomalies poses a greater challenge for exploration geochemists. Therefore, this paper studies geological–geochemical prospecting information and quantitative prediction for Pb–Zn polymetallic mineral deposits in the middle-southern Da Hinggan Mountains metallogenic belt. This study reports the results from the geochemical quantitative prediction leading to the identification of some new Pb–Zn metallic deposits, located in the Da Hinggan Mountains metallogenic belt of China. This study could be a turning point for mineral exploration strategy in the metallogenic belts of China, especially for Pb–Zn metallic deposits.

2. Description of the Study Area

2.1. Geological Setting

The research area is located in the Inner Mongolia Autonomous Region of China, with Hebei to the south, Heilongjiang, Jilin, and Liaoning to the east, and Inner Mongolia to the north. The study area belongs to the southern part of the Da Hinggan Mountains in the late Paleozoic accretive orogenic belt, the southern part of the Da Hinggan Mountains volcanic belt, and the eastern and western sides of the deep fault of the main ridge of the Da Hinggan Mountains (Figure 1).
The rocks exposed in the region belong to the Paleoproterozoic Baoyintu Group and the Paleozoic and Cenozoic strata. The Baoyintu Group is a set of sedimentary rocks undergoing low greenschist phase transition with small amount of metamorphic volcanic rocks [32]. The Paleozoic strata are mainly Silurian and Permian. The Silurian is a set of clastic rocks, sandstone, limestone, slate, and foliated rhyolitic rocks of neritic facies [33]. The Permian, a shallow micrometamorphic volcanic–sedimentary rock system, is composed of volcanic lava, tuff, feldspar quartz sandstone, hard sandstone, slate, local sandwich-crystal tuff, limestone, and clastic arenas [34]. The Carboniferous system is mainly formed by carbonatite, and it partly contains sodium volcanic rocks. The Cenozoic strata mainly constitute the Quaternary system.
In the study area, tectonic activities are intense, and faults and folds are well developed. The trends of the main tectonic lines are NNE, and the faults control the formation of tectonic mountains and tectonic basins in the region. The most developed structures are NE-trending faults, while NW-trending faults are also developed, revealing multi-period activities. The regional faults are mainly the deep faults of Selamuron River, Erenhot–Hegen mountain, the main ridge of the Da Hinggan Mountains, and Nenjiang. The Erenhot–Hegen Mountain and Selamuron River faults are sutural. South of the Selamuron River fault belongs to the accretion zone of the continental margin of North China Cranton. The Erenhot–Hegen Mountain fault is the boundary between the northern and southern sections of the Da Hinggan Mountains Orogenic belt in late Paleozoic Erathem. The study area is located in the semiarid middle- and low-mountain landscape area. Streams are developed, and stream sediments are easy to be collected [35,36,37].
Mesozoic neutral–acidic magmatic activity is frequent and intense in the Da Hinggan Mountains metallogenic belt, which forms the famous Da Hinggan Mountains magmatic belt [38,39,40,41,42].
The intrusive rocks are well developed and widely distributed, and the overall distribution is in the NNE direction, which is consistent with the regional tectonic line [43]. The rock types are simple, mainly neutral–acidic intrusive rocks, with a small number of slightly alkaline intrusions [44]. They are composed mainly of granite of the Jurassic and the Early Cretaceous Epoch and diorite of the Permian.
The volcanic rocks are mainly produced in the Mesozoic strata, and the Paleozoic volcanic rocks are produced in the early Permian Dashizhai Formation [45]. The Paleozoic volcanic rocks are mainly neutral–acidic volcanic rocks and some acidic rocks. The Mesozoic volcanic rocks are dominated by acidic volcanic rocks, followed by neutral–acidic volcanic rocks, with eruptive facies. The Cenozoic volcanic rocks are dominated by basalt.
The Permian strata in this region generally underwent regional dynamic thermal metamorphism and formed increasing metamorphism from low-greenschist facies to high-greenschist facies to low-amphibolite facies [37]. The metamorphic strength weakened from the bottom to the top, and the low-greenschist facies rock assemblage was formed in the upper Permian.

2.2. Regional Mineral Characteristics

The study area is rich in mineral resources, and it is an important source of Cu, Pb, Zn, and Sn with a host of deposits; it has been divided into three subzones of the metallogenic belt. From west to east, they are the Pb–Zn–Ag–Cu metallogenic subzone, the Sn–Pb–Zn–Fe–Cu metallogenic subzone, and the Cu metallogenic subzone [46].
Several large-scale Ag–Pb–Zn polymetallic mineral deposits were found in the middle–southern section of the Da Hinggan Mountains metallogenic belt [47], such as the Bairendaba Ag–Pb–Zn polymetallic mineral deposit [36,48], the Baiyinnuoer Pb–Zn–Ag deposit [37,49], the Haobugao Pb–Zn–Cu–Sn deposit [50], the Dajing Cu–Sn–Pb–Zn–Ag polymetallic mineral deposit [51], the Longtoushan Pb–Zn deposit [52], and the Huaaobaote Pb–Zn–Ag polymetallic mineral deposit [53,54]. These mineral deposits are proven, independent, representative, and regarded as typical deposits in this belt [55,56].
More than 80% of the Ag–Cu–Pb–Zn polymetallic deposits are found in the Permian Dashizhai and Huanggangliang Formations [57]. Lead isotope tracer showed that most of the metallogenic materials of Pb and Zn in the study area come from the Permian, while some of them come from the Paleoproterozoic Baoyintu Group [28,37].
The NE-, E–W-, and NW-trending fault structures control the spatial distribution of magmatic rocks, mineral deposits and orebodies in this area. In general, the mineral deposits in this study area are zonal distribution in the NE and NW directions.
Mesozoic neutral–acidic magmatic activities were intensive, accounting for more than 50% of the area. Magmatic activities provide abundant material sources and thermodynamic conditions for the formation of mineral deposits and are the main controlling factor for the space–time structure of mineral deposits [58].
Most of the mineral deposits in the area are located in the inner and outer contact zones of volcanic-intrusive composite plutons [59]. Among them, Cu, Ag (Pb, Zn) mineral deposits are concentrated around the neutral–acidic rock, whereas Sn (Cu, Pb, Zn) polymetallic mineral deposits are mainly distributed in acidic rock and its surroundings. Alkaline granite is closely related to rare earth mineralization [15].

3. Materials and Methods

3.1. Materials

Geochemical data from stream sediment survey in the Da Hinggan Mountains metallogenic belt carried out by China Geological Survey in the RGNR project were used for delineating surface geochemical anomalies, and we identified the weak geochemical anomalies and delineated new prediction areas for ore prospecting in this paper.
The geological reports, geochemical reports, grade analysis reports of the ore body, reserves calculation and verification reports, soil data, and drilling data of the proven large ore deposits were used to summarize the geological–geochemical prospecting models of the typical ore deposits.
Drilling data and reserves reports of the newfound ore deposits were used to verify the accuracy and reliability of quantitative assessment results.

3.2. Methods

3.2.1. Data Analysis and Quality

Stream sediment samples were collected at a density of one sample per km2 in an area about 75,000 km2. Equal weight of samples in 4 km2 were combined into a composite sample for analysis of 39 elements or oxides: Ag, As, Au, B, Ba, Be, Bi, Cd, Co, Cr, Cu, F, Hg, La, Li, Mn, Mo, Nb, Ni, P, Pb, Sb, Sn, Sr, Th, Ti, U, V, W, Y, Zn, Zr, SiO2, Al2O3, K2O, Na2O, CaO, MgO, and Fe2O3 [60,61,62]. In this paper, the analytical data for 18,807 stream sediment samples were used.
The analytical procedures followed those in the RGNR guidelines [63]. Certified reference materials (CRMs) developed by IGGE [64,65,66], equal to about 8% of the total samples, were inserted randomly into each batch of 50 samples and analyzed along with field samples [7,67,68,69,70]. The relative error (RE%) to monitor the between-batch bias and the percent relative standard deviation (RSD%) to assess the analytical precision were then calculated as follows:
RE (%) = (CdCr)/Cr × 100,
RSD   ( % ) = [ i = 1 n ( C d - C r )   2 ] / n C r ,
where Cd is the determined concentration, and Cr is the certified reference concentration.
The analyses were considered acceptable if the absolute values of RE were ≤50% for samples with concentrations within three times the detection limit and ≤35% for samples with concentrations more than three times the detection limit. If the absolute REs fell outside these limits, the batch samples were reanalyzed.
The analyses were considered acceptable if the RSDs were ≤40% for samples with concentrations within three times the detection limits and ≤25% for samples with concentrations more than three times the detection limits.
Duplicate samples (equal to 5% of the total number of samples) were randomly inserted to evaluate the precision of the analyses. The percent relative deviation (RD%) was calculated as follows:
RD(%) = [(C1C2)/((C1 + C2)/2)] × 100,
where C1 is the first determination, and C2 is the second determination. Analyses were considered acceptable if the absolute RDs were ≤40%. All elements in all duplicates showed reliable precision.
The analysis of soil and rock samples from the typical ore deposits followed the analytical procedures above-mentioned.

3.2.2. Data Processing

A normal distribution test was conducted on raw data of each element. If the raw data followed the normal or lognormal distribution, the mean and standard deviation (S dev) of raw data were calculated. The threshold value for each element was defined as the mean value plus two standard deviations. If the raw data did not conform to the normal or lognormal distribution, the extreme outliers exceeding three times the standard deviations were removed from the geochemical data iteratively until all the remaining data fell within the range of the three standard deviations and met an approximate normal distribution. A new dataset composed of the remaining data was obtained. The mean values, as the background values of elements, were calculated using the remaining data [70].
The threshold value of each element used in this paper was defined as the background value plus two standard deviations. The contour maps for the elements were prepared using the kriging method available in Surfer 8.0 (Golden Software Inc., Golden, CO, USA).

3.2.3. Weak Geochemical Anomalies Extraction

The contrast value of an element is the ratio of its geochemical anomaly concentration to its background value. The contrast values of elements can be used to indicate the intensity and clarity of geochemical anomalies, and they are commonly used to delineate the anomalies and identify the weak anomalies [22,23,71]. In this study, the contrast values of elements were employed to identify and highlight the weak geochemical anomalies.

3.2.4. Selection of Element Combinations of the Typical Deposits

Six deposits (mainly large mineral deposits) were selected as typical deposits: the Bairendaba and Huaobaote hydrothermal vein Ag–Pb–Zn deposits in the western slope, the Baiyinnuoer skarn type Zn–Pb–Ag(–Sn) deposit, the Haobugao skarn type Pb–Zn–Cu–Sn deposit, and the Dajing hydrothermal vein Sn–Cu–Pb–Zn–Ag deposit in the main ridge, and the Longtoushan hydrothermal Ag–Pb–Zn deposit in the east slope of the central southern section of the Da Hinggan Mountains metallogenic belt. The typical deposits’ metallogenic geological environment, orebody characteristics, and geochemical anomaly characteristics were studied in detail in order to establish their geological–geochemical prospecting models as a reference for mineral prediction.
The indicator element combination characteristics of the typical deposits were distinguished as standard samples for mineral prediction. To reduce the influence of some extra high values on the assignment process and to strive for a reasonable assignment, the average concentrations of each element in the inner zone of geochemical anomalies of the typical mineral deposits were adopted. On the basis of the background values of element concentration in different stratum and magmatic rocks in the region, the geochemical anomaly threshold value of each element was determined, and one, two, and four times the threshold were taken as the outer, middle, and inner zones of geochemical anomalies. The average concentrations of elements in the inner zone of geochemical anomalies of the typical deposits were employed as the indicator element combinations in this study.

3.2.5. Similarity Coefficient Calculation

The similarity coefficient between each data point and the abovementioned standard sample (the major indicator element combinations of the typical deposit) was calculated as follows:
D ( S i ) = K = 1 P l g X s k l g X i k 2 m ,
where s is the standard sample (each typical deposit), i is the observed sample to be judged (each data point), m is the number of elements of the element association, Xsk is the concentration value of the k-th element of the standard sample, Xik is the concentration value of the k-th element of the observed sample, and D(Si) is the numerical distance between the observed sample and the standard sample.
The similarity coefficient can be obtained by the transformation of the above formula as follows:
R = 1 − D(Si)/Max(D),
where Max(D) is the maximum value of D(Si), and R is the similarity coefficient.
Finally, the similarity coefficients of all observation samples and standard samples are between 0 and 1, in which the observation points where the typical mineral deposits were located had a similarity degree of 1 with themselves, while the others were all less than 1. A closer R to 1 indicated the observed sample was closer to the standard sample.

3.2.6. Mineral Resource Prediction

In this study, the similarity coefficient between each stream sediment sampling site and typical deposits were calculated for prediction and evaluation of the prediction area.
The geochemical quantitative estimation of mineral resources was based on the geological–geochemical parameters of the six typical deposits. The areas close to the geological and geochemical characteristics of the typical deposits and with high similarity coefficients were considered favorable areas for mineralization and preferentially selected as the prediction areas. The reserves of the typical deposits were used to estimate the quantity of resource in the newly predicted favorable areas.

3.2.7. Estimation of the Degree of Denudation

The degree of denudation is one of the important parameters in the evaluation and prediction of mineral resource potential [72]. In this paper, the horizontal zoning of the elements was used to estimate the denudation degree of deposits. It has been indicated that the stream sediment distribution rules of zonality–evaluation values (i.e., the ratios between the linear productivities of front- and rear-halo elements) or the multiplicative (or additive) index (i.e., the ratios between multiplicative or additive values of the element contrast values of front- and rear-halo or indicator elements) in different parts of the orebodies serve as indicators of the degree of denudation [20]. After several such tests, the degree of denudation was determined by the ratio of (W × Sn)/(As × Sb) in this study.

3.2.8. Methods for Resource Prediction

Two geochemical methods were used for resource prediction in this paper: the analogy method (hereinafter referred to as P r 1 ) and the areal productivity method (hereinafter referred to as P r 2 ).
The core idea of the analogy method is that the resources of the deposit are in direct proportion to the anomaly size of elements in the stream sediments. The anomaly size means the product of the abnormal area and average concentration of Pb and Zn. The core idea of areal productivity method is that the resources in the region are proportional to the areal productivity of the anomaly area. The resources of Pb and Zn (hereinafter referred to as PR), anomaly dimension (AD), and areal productivity (AP) of the six typical deposits are listed in Table 1.
The calculation formula of the analogical method is as follows:
SC × A P P 1 w = A P r P r 1 1 w r .  
After the transformation, it becomes as follows:
P r 1 = A P r A P × 1 w r 1 w × 1 S C × P ,  
where AP is the product of the area and the average concentration of elements in the typical deposit, P is the resource of the typical deposit, APr is the product of the area and the average concentrations of elements in the metallogenic prediction area, Pr1 is the resource of the metallogenic prediction area, w is the denudation coefficient of the typical deposit, wr is the denudation coefficient of the metallogenic prediction area, and SC is the similarity coefficient between the metallogenic prediction area and the typical deposit.
The formula of the areal productivity method is calculated as follows:
SC × S X B P 1 w = S r X r   B r P r 2 1 w r .  
After the transformation, it becomes as follows:
P r 2 = S r X r   B r S X B × 1 w r 1 w × 1 S C × P ,  
where S is the area of the typical deposit, P is the resource of the typical deposit, X are the average concentrations of elements in the typical deposit area, B is the element background in the typical deposit area, Sr is the area of the metallogenic prediction area, Pr2 is the resource of the metallogenic prediction area, Xr are the average concentrations of elements in the metallogenic prediction area, Br is the element background in the metallogenic prediction area, w is the denudation coefficient of the typical deposit, wr is the denudation coefficient of the metallogenic prediction area, and SC is the similarity coefficient between the metallogenic prediction area and the typical deposit.

4. Results

4.1. Weak Anomaly Extraction

Geochemical contour maps were drawn by using the contrast values of Pb–Zn ore deposit indicator elements. Cumulative frequency classification was adopted for the contour map, with frequency as 25%, 50%, 80%, 90%, 95%, and 98%. Compared with the geochemical map of Pb, the average contrast values of Pb–Zn–Ag–Cd could highlight the known deposits more obviously, especially the Pb–Zn–Ag metallic deposits. In addition, it highlighted many low and weak geochemical anomalies. This can provide new clues for mineral exploration in the areas with weak and low surface geochemical anomalies (Figure 2).

4.2. Element Combinations Characteristics of the Typical Deposits

The average concentrations of elements in the inner zone of geochemical anomaly of the typical deposits employed as the indicator element combinations in this study are listed in Table 2.

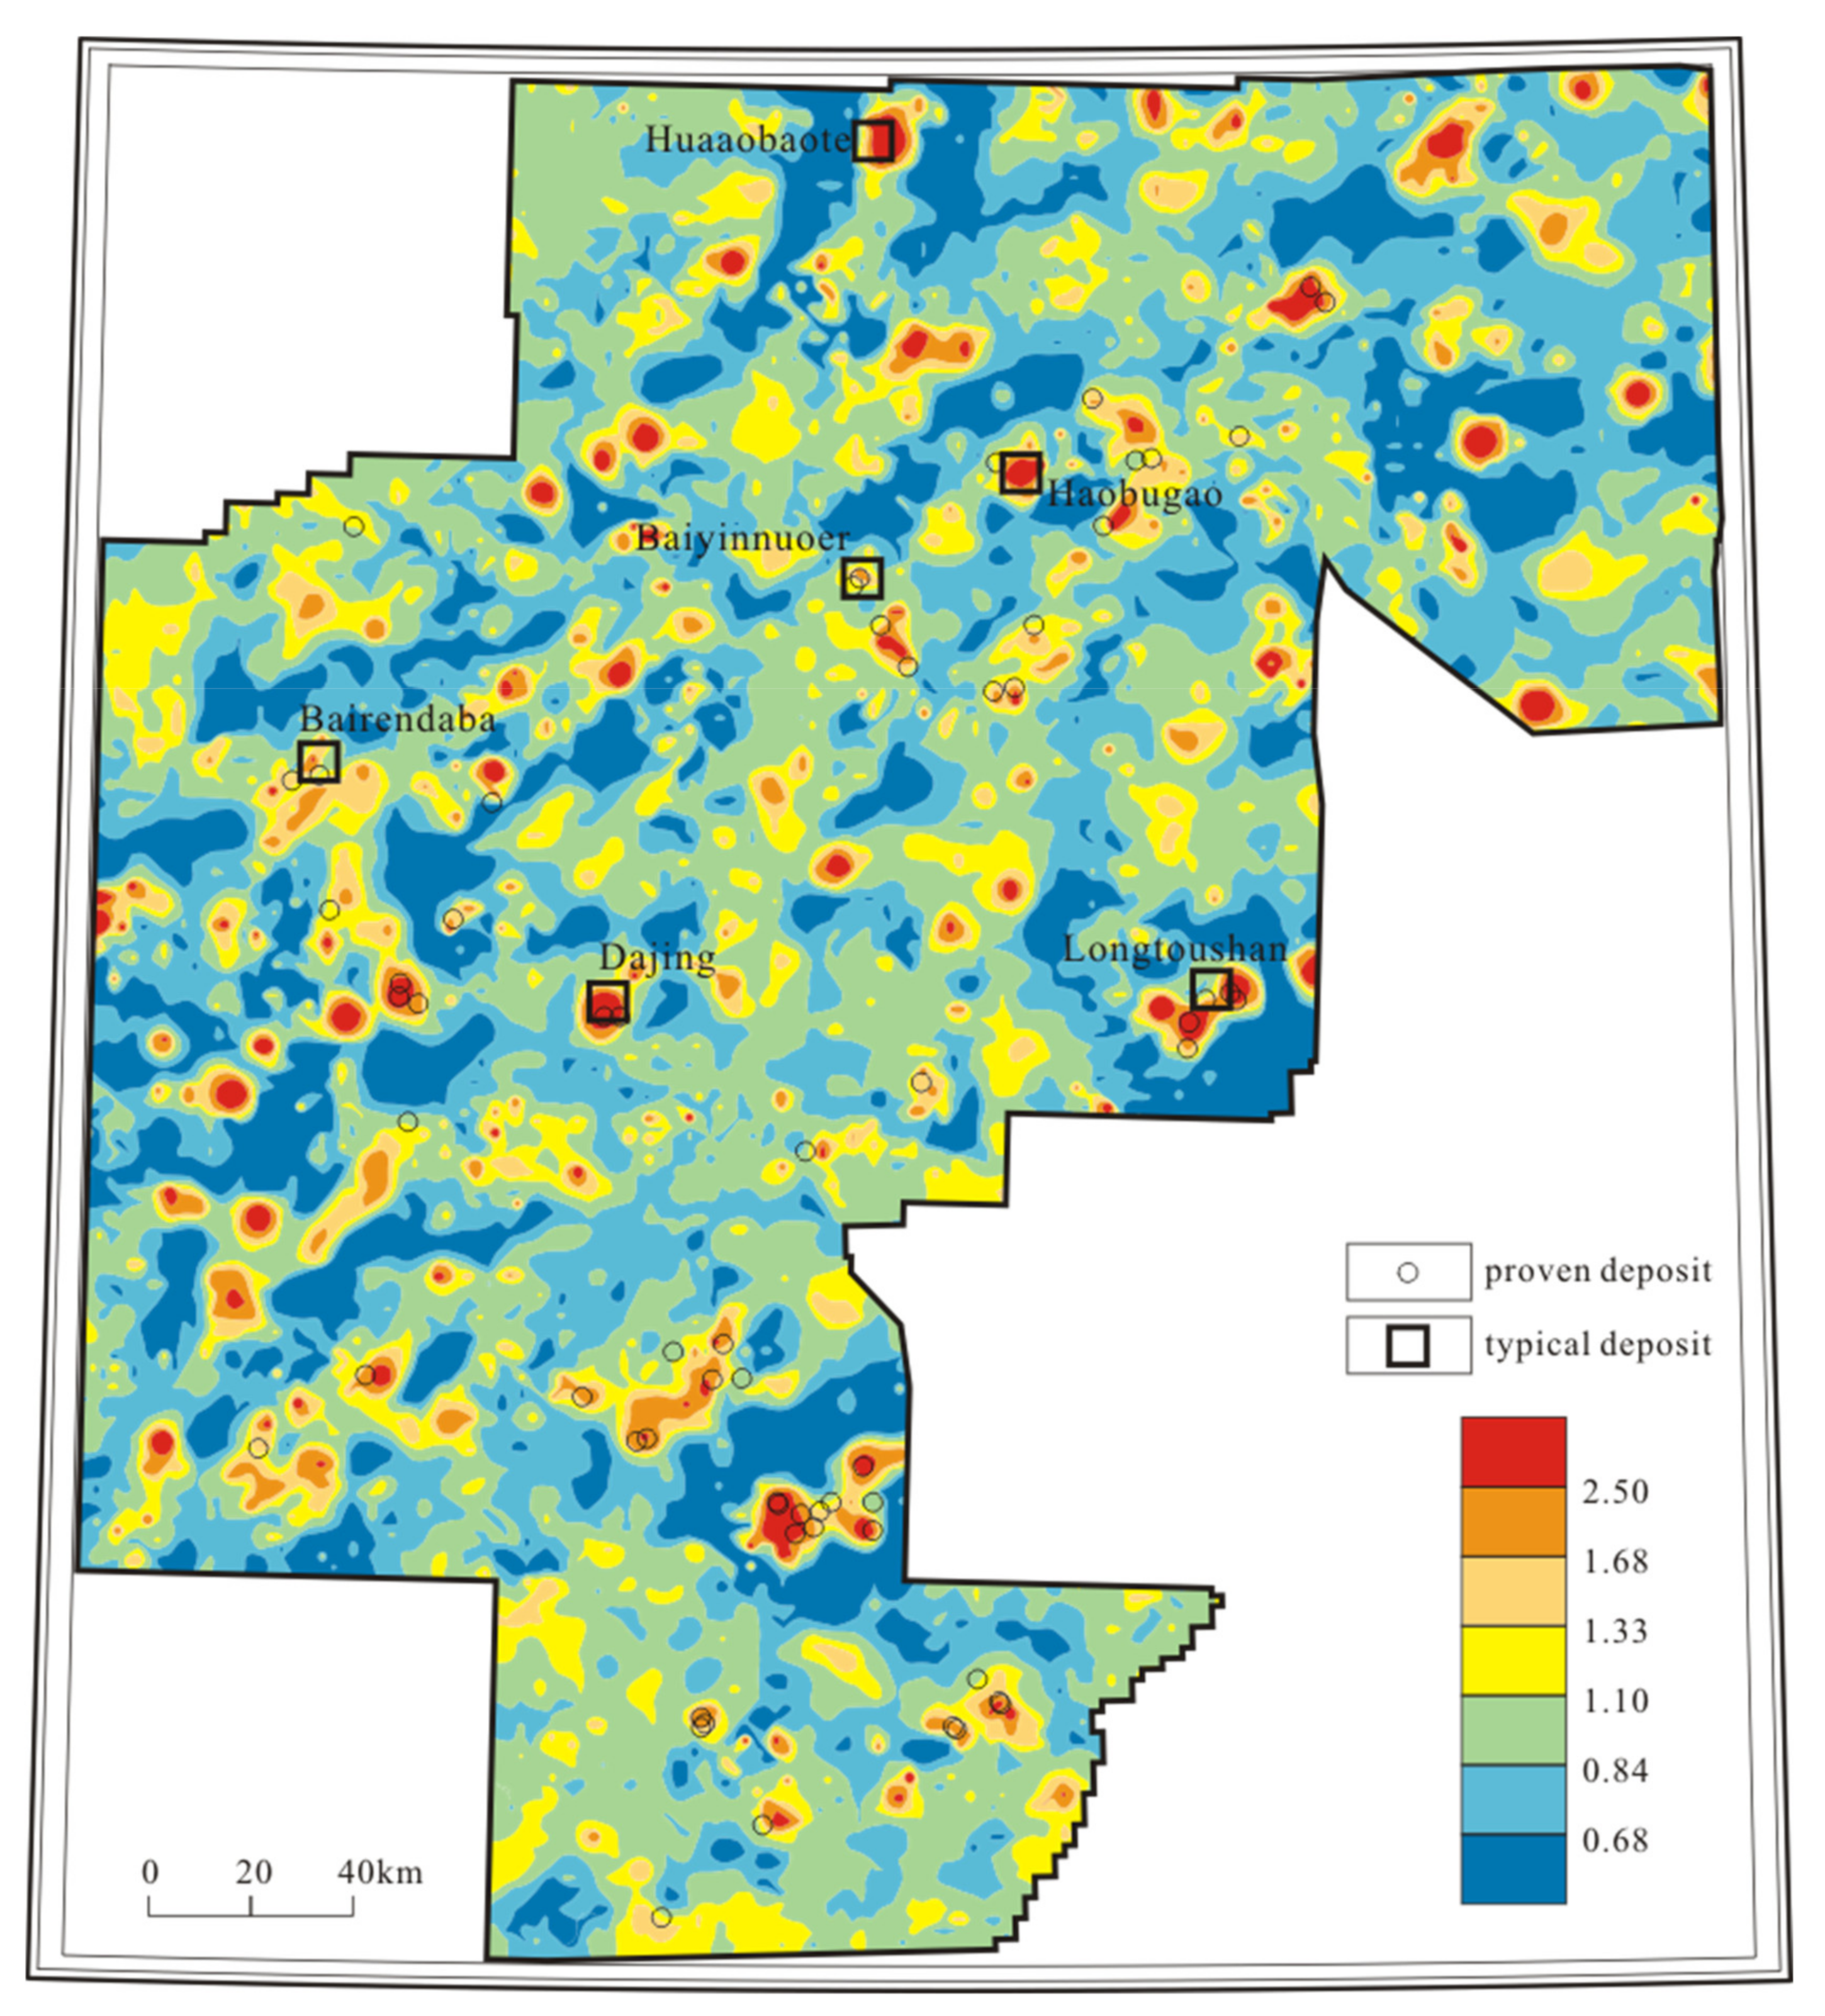
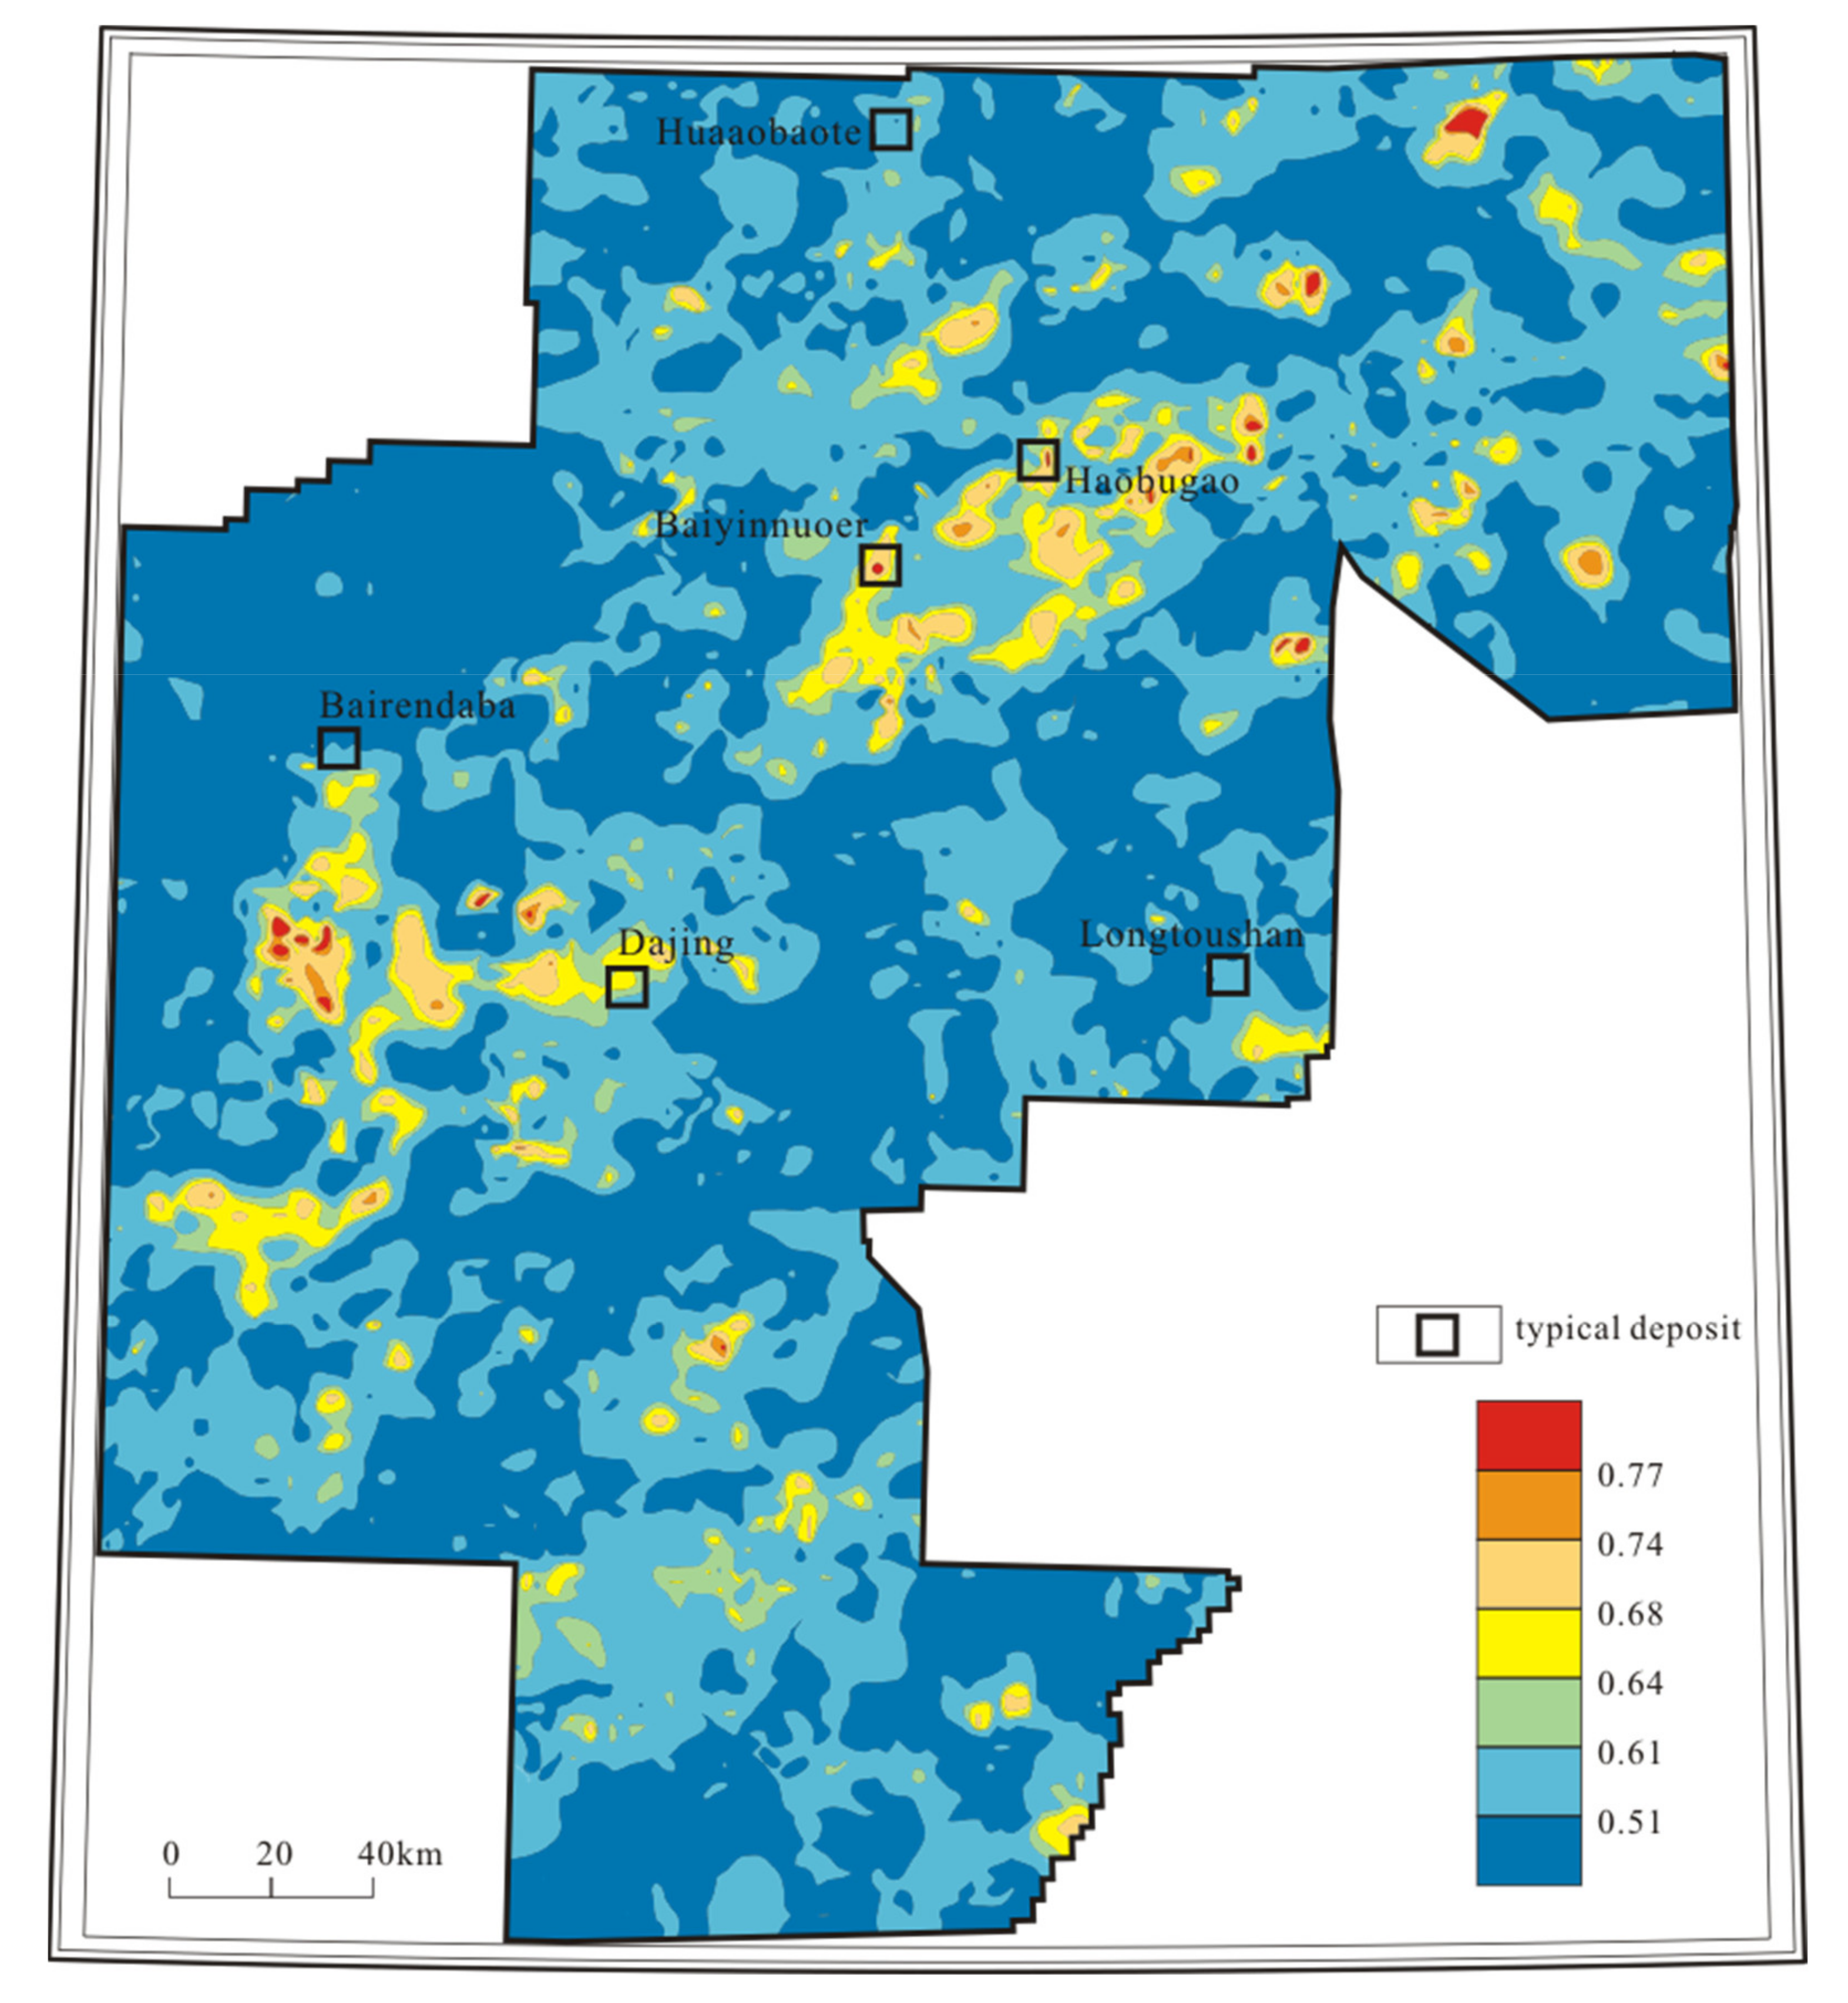
4.3. The Contour Map of the Similarity Coefficient

The mapping method of the similarity coefficient contour map was similar to that of the contrast value geochemical map. The cumulative frequency was adopted for classification in the similarity coefficient contour map, and it was divided into seven levels as follows: 50%, 80%, 90%, 95%, 97%, and 99%. If the cumulative frequency of the similarity coefficient reaches 99%, it indicates that 1% of the observed samples are similar to the standard samples and have prospecting potential. If the cumulative frequency of the similarity coefficient reaches 97%, it indicates that 3% of the observed samples are similar to the standard samples and have a certain mineralization rate.
Figure 3 is the contour map of the similarity coefficients of the Baiyinnuoer Pb–Zn deposit as the standard sample. It shows that the observation samples similar to the Baiyinnuoer Pb–Zn deposit were mainly concentrated in the southern middle ridge of the Da Hinggan Mountains metallogenic belt. It also clearly outlines the scope of the middle ridge of the Da Hinggan Mountains, refines the map content, and delineates some new geochemical anomalies referenced for further research.

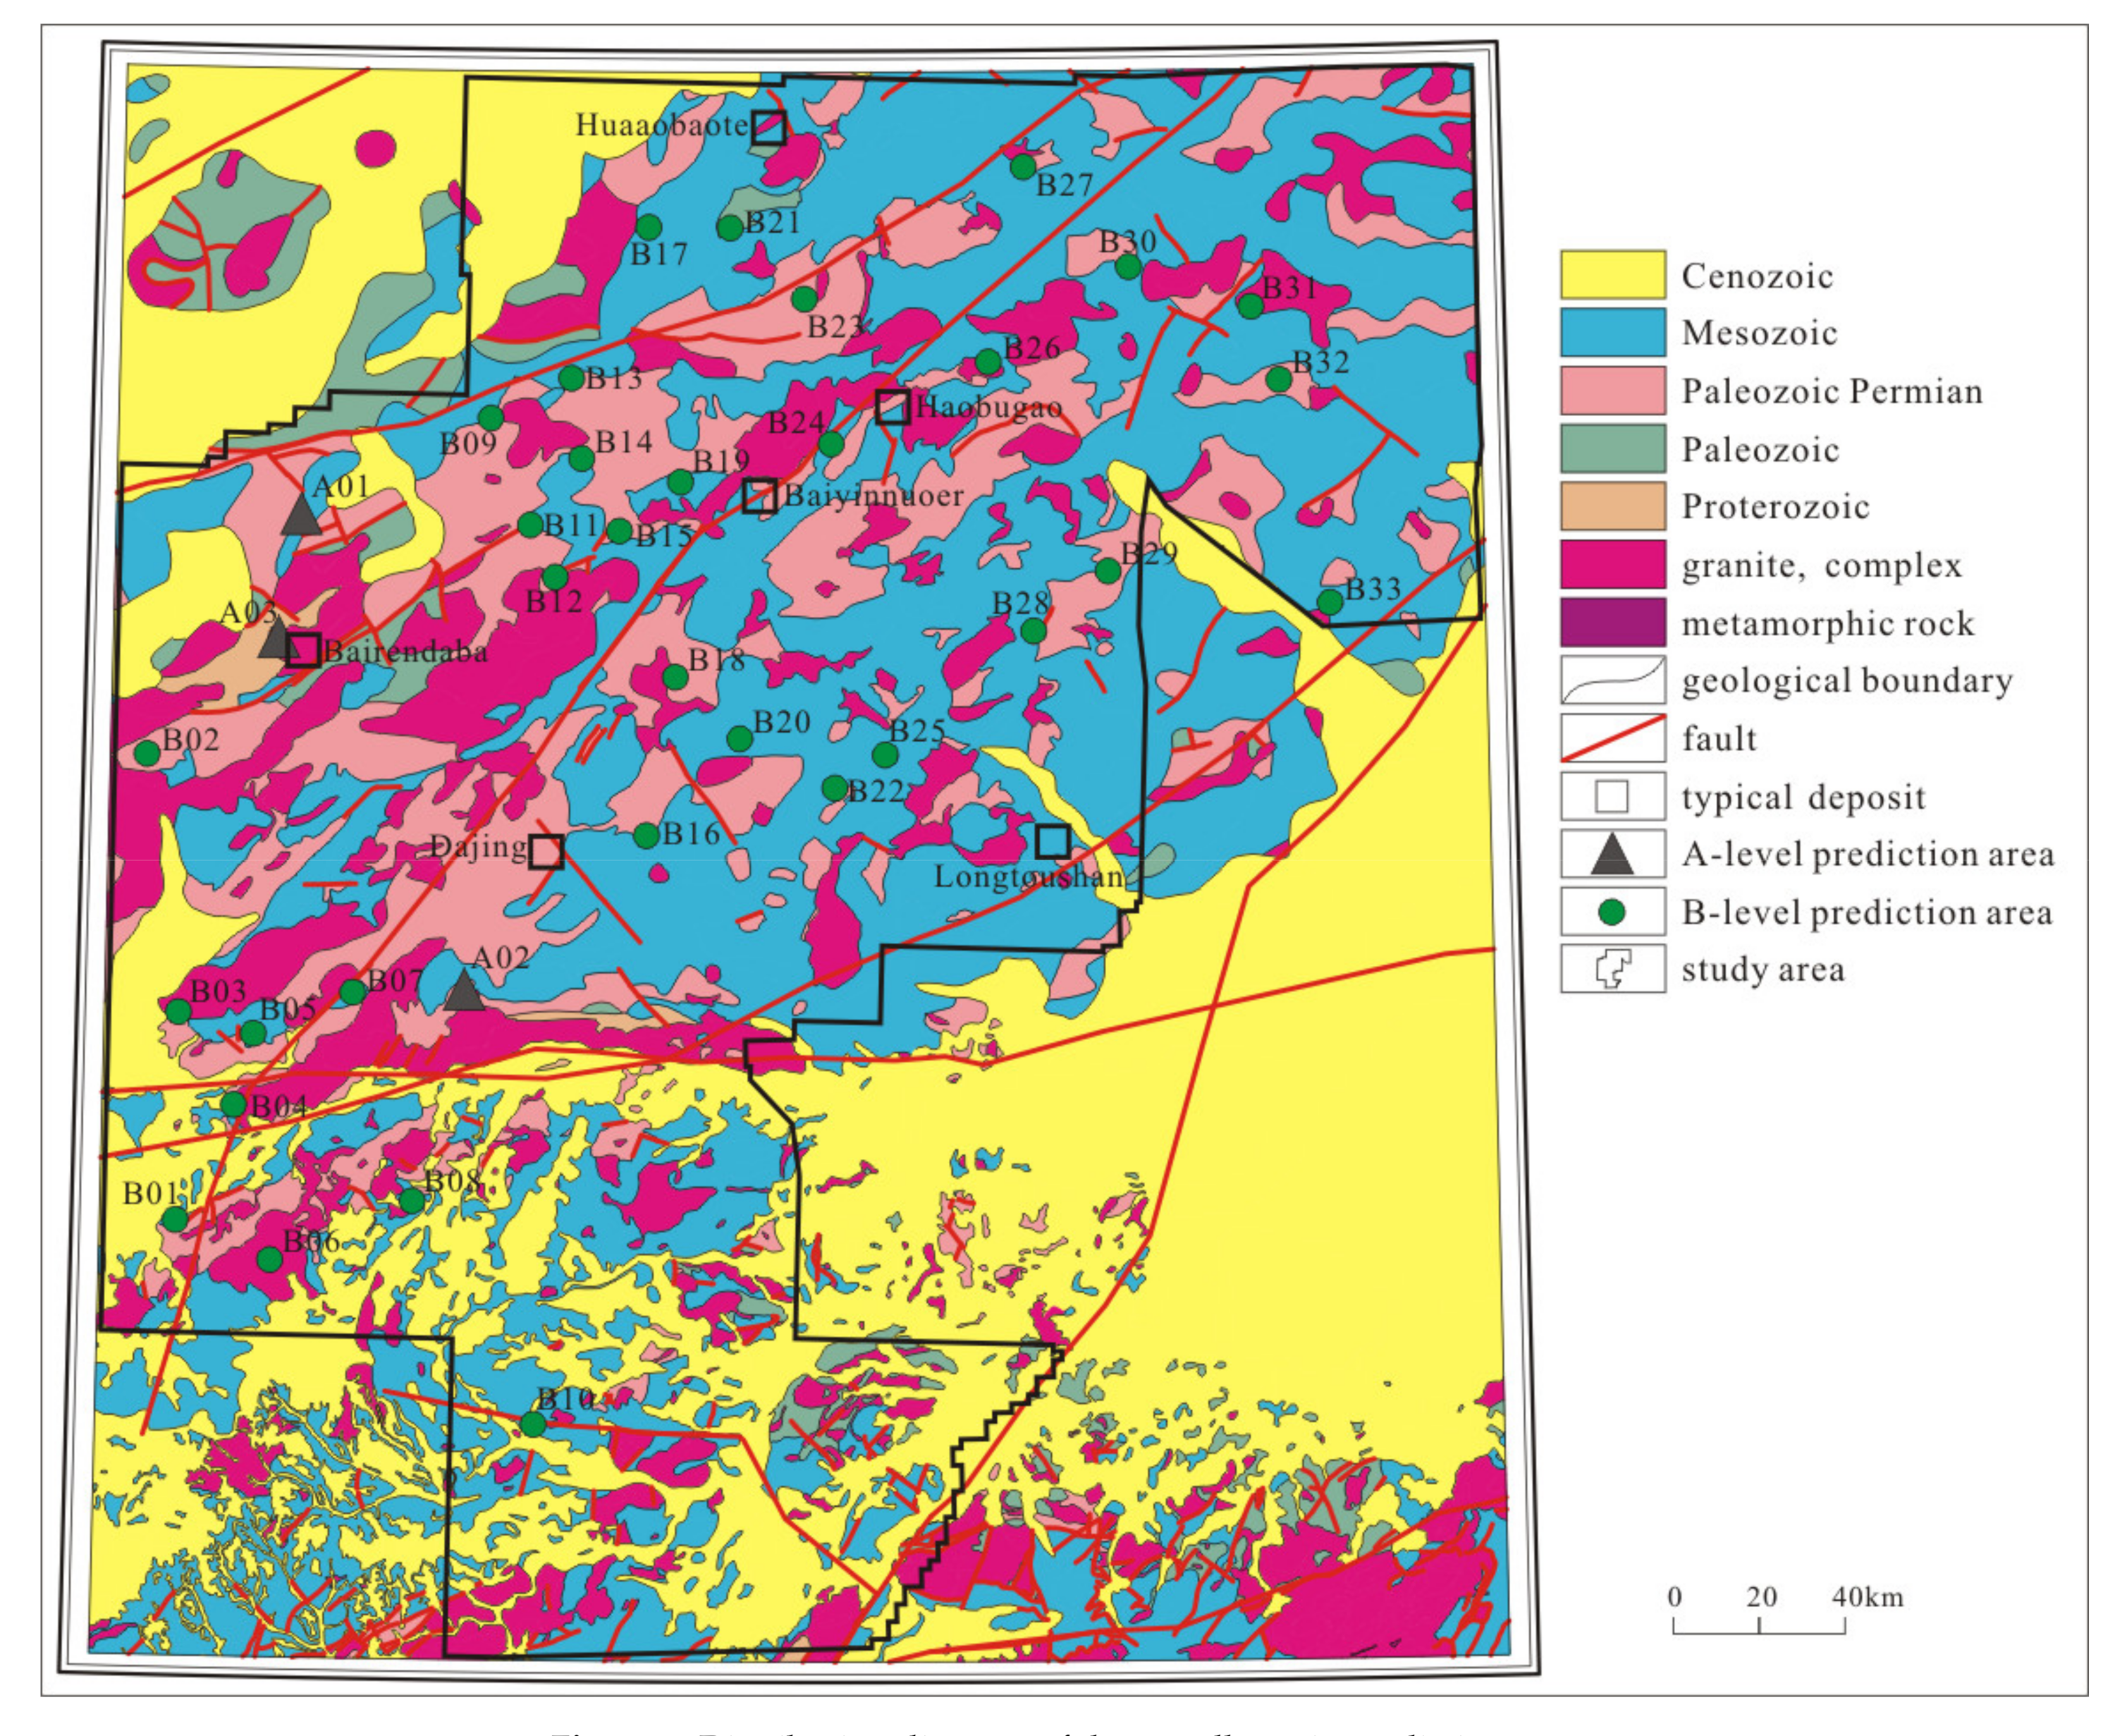
4.4. Metallogenic Prediction Area Delineation

4.4.1. The Criteria of the Metallogenic Prediction Area Delineation

On the basis of the comprehensive research of geological, mineral, geophysical, remote sensing data, the geochemical map, the geochemical anomaly map, the contrast value contour map, the contour map of denudation degree, the similarity coefficient contour map, and the typical mineral-prospecting models, the metallogenic prediction areas were optimized as follows:
Parameter 1: The similarity of element association between the observation sample and a typical deposit is large, and the cumulative frequency grading is equal or greater than 97%.
Parameter 2: The metallogenic geological conditions are favorable. The main ore-bearing strata in this study area are the Permian and Jurassic strata, where most of the Pb–Zn polymetallic deposits can be found. In addition, the favorable area for mineralization is one where the geological structure and magmatic rocks are well developed.
Parameter 3: There are discovered mineral deposits or mineralization points nearby.
Parameter 4: The contrast value of Pb or Zn is equal to or greater than 1.3 (cumulative frequency grading ≥ 90%).
Parameter 5: The average contrast value of Pb–Zn–Ag–Cd is equal to or greater than 1.3 (cumulative frequency grading ≥ 90%).
Parameter 6: There are at least three elements in Pb, Zn, Ag, and Cd whose contrast value is not lower than 1.1 (cumulative frequency grading ≥ 80%).
The prediction areas were divided into two subareas: A-level and B-level prediction areas. If the predicting area met all the parameters listed above, it was classified as an A-level prediction area. If the predicting area met the parameters listed above except for parameter 3, it was classified as a B-level prediction area.

4.4.2. The Result of the Metallogenic Prediction Area Delineation

According to the criteria of the metallogenic prediction area delineation, 36 predicting areas were delineated in the study area, including three A-level prediction areas and 33 B-level prediction areas (Figure 4).
What needs illustration is that predicted areas consistent with the known deposits were not included in the 36 predicted areas. If the prediction areas were similar to more than one typical deposit in the six standard samples at the same time, the typical deposit with a closer spatial distance and a closer geological condition was selected as the best similar typical deposit for subsequent resource estimation.

4.5. Estimation Results of Denudation Degree

The ratio of (W × Sn)/(As × Sb) indicated that the Huaobaote Pb–Zn ore deposit, Bairendaba Pb–Zn ore deposit, and Longtoushan Pb–Zn ore deposit showed a low degree of denudation. The Baiyinnuoer Pb–Zn ore deposit, Haobugao Pb–Zn ore deposit, and Dajing Sn–Pb–Zn–Ag ore deposit showed a middling degree of denudation (Figure 5).

4.6. Resources Prediction Results

A comparison showed that the resource calculation results of the two methods were relatively close to each other. The arithmetic weighted mean of predicted resources (PRs) from the two methods was adopted in this paper.
The final predicted resources (PRs) were calculated as follows:
PR = 0.6 P r 1   +   0.4   P r 2 .  
The result shows that the resources of the three A-level prediction areas and 33 B-level prediction areas were 52,500 tons and 3.2 million tons, respectively (Table 3).

4.7. Verification of the Prediction Areas and Reliability Analysis for the Prediction Resources

There were five prediction areas verified. Prediction area B02 was verified by the 10th Institute of Geology and Mineral Exploration of Inner Mongolia and the Beijing Institute of Geology for Mineral Resources. It was identified as a Pb–Zn–Ag metallic mineralization point by drilling, but a reserve report has not been published.
Prediction area B24 was verified by the 10th Institute of Geology and Mineral Exploration of Inner Mongolia and the Haihan Minerals Limited of Chifeng City, and a new Pb–Zn metallic ore was found. The new Pb–Zn metallic ore body, with a length of 200 m and a width of 1.03–3.10 m, is controlled by drilling. The spatial extension direction, proneness, and dip angle of the ore body are 40°, southeast, and 64°–66°, respectively. The contents of Pb and Zn are 2.15% and 2.32%, respectively.
The reserves of three prediction areas, B23, B29, and B33, have been reported.
The prediction area named B23 is located in the Shabuleng Mountain of the West Ujimqin in Inner Mongolia. Drilling data display 16 ore bodies with a length of 50–447 m and a width of 1.10–10.19 m. The spatial extension direction of the ore bodies is 40°–335°. The reserves of Zn are 101,700 tons.
Prediction area B29 is located in the Habutegai of Alukeerqin in Chifeng City in Inner Mongolia. Drilling data show that two ore bodies with a length of 100–200 m have been found. The reserves of Pb, Zn, and Ag are 39,257 tons, 26,399 tons, and 17.26 tons, respectively.
Prediction area B33 is located in the Laodaogou of Zhalute Banner in Tongliao City in Inner Mongolia. The reported reserves of Pb, Zn, and Ag are 8978.7 tons, 6226.8 tons, and 3.77 tons, respectively.
The proven resources (P) and the predicted resources of the three prediction areas mentioned above are compared in Table 4. The results show that the predicted resources are greater than the proven resources. The proportion of the proven resources in the predicted resources of the three different deposits are different, which may be related to their exploration degree, indicating that the predicted resources are credible.

5. Conclusions

Surface geochemical anomalies from stream sediment survey, including weak geochemical anomalies, contain a lot of prospecting information. Weak geochemical anomalies should be given enough attention for further study. The weak surface geochemical information of Pb, Zn can be highlighted by the average contrast values of Pb–Zn–Ag–Cd.
The similarity coefficients with large typical proven deposits can be used to identify new Pb–Zn mineralized anomalies and delineate new prospecting target areas.
The denudation degree of the proven ore deposits can also be determined by the ratio of (W × Sn)/(As × Sb) for stream sediment data.
Thirty-six prediction areas with Pb–Zn resources of 307.73 million tons were delineated, and some new ore deposits were found by drilling verification.
This paper reports a successful case of quantitative prediction assessment of mineral resource potential by geochemical methods, which can be used as a reference for future prospecting activities.

Author Contributions

Conceptualization, F.Y., S.X. and Z.H.; methodology, F.Y.; software, L.N., Y.S. and Q.L.; validation, F.Y., S.X. and Z.H.; formal analysis, F.Y. and Z.H.; investigation, F.Y., R.X., W.H., C.W. and Q.W.; data curation, F.Y., L.N., Y.S. and Q.L.; writing—original draft preparation, F.Y. and Z.H.; writing—review and editing, E.J.M.C., S.X. and Z.H.; visualization, E.J.M.C., Y.S. and Q.L.; supervision, F.Y.; project administration, F.Y.; funding acquisition, F.Y. All authors have read and agreed to the published version of the manuscript.

Funding

This research was financed by the National Nonprofit Institute Research Grant of IGGE (Nos. AS2020Y06 and AS2020J06), the National Resources Survey Projects (Grant Nos. 1212010660401, DD20221641), and the Natural Science Foundation of China (Nos. 41373048, 41773030, and 41872250).

Data Availability Statement

The data in this study are proprietary or confidential in nature.

Acknowledgments

The authors would like to thank all colleagues who participated in the project. The authors greatly appreciate the time of the anonymous reviewers, who exerted much effort in assessing and reviewing this manuscript. Their efforts resulted in significant improvements in the paper.

Conflicts of Interest

The authors declare no conflict of interest.

References

  1. Ilankoon, I.M.S.K.; Tang, Y.; Ghorbani, Y.; Northey, S.; Yellishetty, M.; Deng, X.Y.; McBride, D. The current state and future directions of percolation leaching in the Chinese mining industry: Challenges and opportunities. Miner. Eng. 2018, 125, 206–222. [Google Scholar] [CrossRef] [Green Version]
  2. Pasha, S.; Wenner, M.D.; Clarke, D. Toward the Greening of the Gold Mining Sector of Guyana: Transition Issues and Challenges; IDB Technical Note (Country Department Caribbean Group): Washington, DC, USA, 2017. [Google Scholar] [CrossRef]
  3. Qiu, K.F.; Taylor, R.D.; Song, Y.H.; Yu, H.C.; Song, K.R.; Li, N. Geologic and geochemical insights into the formation of the Taiyangshan porphyry copper-molybdenum deposit, Western Qinling Orogenic Belt, China. Gondwana Res. 2016, 35, 40–58. [Google Scholar] [CrossRef]
  4. Qiu, K.F.; Song, K.R.; Song, Y.H. Magmatic-hydrothermal fluid evolution of the Wenquan porphyry molybdenum deposit in the north margin of the West Qinling, China. Acta Petrol. Sin. 2015, 31, 3391–3404, (In Chinese with English Abstract). [Google Scholar]
  5. Ribeiro, M.C.; Ferreira, R.; Pereira, E.; Soares, J. Scientific, technical and legal challenges of deep sea mining. Vis. Port. Conf. Report. Mar. Policy 2020, 114, 103338. [Google Scholar] [CrossRef]
  6. Saunders, R. High-Value Minerals and Resource Bargaining in a Time of Crisis: A Case Study on the Diamond Fields of Marange, Zimbabwe; UNRISD Working Paper: Geneva, Switzerland, 2018; p. 1. Available online: http://hdl.handle.net/10419/186111 (accessed on 7 December 2021).
  7. Yang, F.; Xie, S.Y.; Carranza, E.J.M.; Yao, L.Y.; Tian, H.; Chen, Z.J. Vertical distribution of major ore-forming elements and the speciation in the semiarid system above the concealed Baiyinnuoer Pb-Zn deposit in inner Mongolia, China. Geochem. Explor. Environ. Anal. 2019, 19, 46–57. [Google Scholar] [CrossRef]
  8. Jordan, G. Sustainable Mineral Resources Management: From Regional Mineral Resources Exploration to Spatial Contamination Risk Assessment of Mining. Environ. Earth Sci. 2009, 58, 153–169. [Google Scholar] [CrossRef]
  9. Scholz, R.W.; Wellmer, F.W. Approaching a dynamic view on the availability of mineral resources: What we may learn from the case of phosphorus? Glob. Environ. Change-Hum. Policy Dimens. 2013, 23, 11–27. [Google Scholar] [CrossRef]
  10. Qiu, K.F.; Deng, J. Petrogenesis of granitoids in the Dewulu skarn copper deposit: Implications for the evolution of the Paleotethys ocean and mineralization in Western Qinling, China. Ore Geol. Rev. 2017, 90, 1078–1098. [Google Scholar] [CrossRef]
  11. Qiu, K.F.; Deng, J.; Taylor, R.D.; Song, K.R.; Song, Y.H.; Li, Q.Z.; Goldfarb, R.J. Paleozoic magmatism and porphyry Cu-mineralization in an evolving tectonic setting in the North Qilian Orogenic Belt, NW China. J. Asian Earth Sci. 2016, 122, 20–40. [Google Scholar] [CrossRef]
  12. Qiu, K.F.; Li, N.; Taylor, R.D.; Song, Y.H.; Song, K.R.; Han, W.Z.; Zhang, D.X. Timing and duration of metallogeny of the Wenquan deposit in the West Qinling, and its constraint on a proposed classification for porphyry molybdenum deposits. Acta Petrol. Sin. 2014, 30, 2631–2643, (In Chinese with English Abstract). [Google Scholar]
  13. Qiu, K.F.; Yang, L.Q. Genetic feature of monazite and its U-Th-Pb dating: Critical considerations on the tectonic evolution of Sanjiang Tethys. Acta Petrol. Sin. 2011, 27, 2721–2732, (In Chinese with English Abstract). [Google Scholar]
  14. Qiu, K.F.; Yu, H.C.; Deng, J.; McIntire, D.; Gou, Z.Y.; Geng, J.Z.; Chang, Z.S.; Zhu, R.; Li, K.N.; Goldfarb, R. The giant Zaozigou Au-Sb deposit in West Qinling, China: Magmatic- or metamorphic- hydrothermal origin? Miner. Depos. 2020, 55, 345–362. [Google Scholar] [CrossRef]
  15. Qiu, K.F.; Yu, H.C.; Wu, M.Q.; Geng, J.Z.; Ge, X.K.; Gou, Z.Y.; Taylor, R.D. Discrete Zr and REE mineralization of the Baerzhe rare-metal deposit, China. Am. Mineral. J. Earth Planet. Mater. 2019, 104, 1487–1502. [Google Scholar] [CrossRef]
  16. Xie, X.J.; Sun, H.Z.; Ren, T.X. Regional geochemistry—national reconnaissance project in China. J. Geochem. Explor. 1989, 33, 1–9. [Google Scholar] [CrossRef]
  17. Xi, X.H. Natural resources period: Big data and systematic science of the earth -More on exploration geochemistry during the overall development period. Geophys. Geochem. Explor. 2019, 43, 449–460, (In Chinese with English Abstract). [Google Scholar]
  18. Chen, Y.Q.; Zhang, L.N.; Zhao, B.B. Identification of the anomaly component using BEMD combined with PCA from element concentrations in the Tengchong tin belt, SW China. Geosci. Front. 2019, 10, 1561–1576. [Google Scholar] [CrossRef]
  19. Ilina, S.M.; Lapitskiy, S.A.; Alekhin, Y.V.; Viers, J.; Benedetti, M.; Pokrovsky, O.S. Speciation, Size Fractionation and Transport of Trace Elements in the Continuum Soil Water–Mire–Humic Lake–River–Large Oligotrophic Lake of a Subarctic Watershed. Aquat. Geochem. 2016, 22, 65–95. [Google Scholar] [CrossRef]
  20. Luo, D.W.; Zeng, G.P. Application and effects of singularity analysis in evaluating the denudation degree of Carlin-type gold deposits in southwest Guizhou, China. Ore Geol. Rev. 2018, 96, 164–180. [Google Scholar] [CrossRef]
  21. Cheng, Q.M. Singularity theory and methods for mapping geochemical anomalies caused by buried sources and for predicting undiscovered mineral deposits in covered areas. J. Geochem. Explor. 2012, 122, 55–70. [Google Scholar] [CrossRef]
  22. Zuo, R.G. Identification of weak geochemical anomalies using robust neighborhood statistics coupled with GIS in covered areas. J. Geochem. Explor. 2014, 136, 93–101. [Google Scholar] [CrossRef]
  23. Zuo, R.G.; Wang, J.; Chen, G.X.; Yang, M.G. Identification of weak anomalies: A multifractal perspective. J. Geochem. Explor. 2015, 148, 12–24. [Google Scholar] [CrossRef]
  24. Wu, R.Y.; Chen, J.L.; Zhao, J.N.; Chen, J.D.; Chen, S.Y. Identifying Geochemical Anomalies Associated with Gold Mineralization Using Factor Analysis and Spectrum–Area Multifractal Model in Laowan District, Qinling-Dabie Metallogenic Belt, Central China. Minerals 2020, 10, 229. [Google Scholar] [CrossRef] [Green Version]
  25. Li, C.; Liu, B.L.; Guo, K.; Li, B.B.; Kong, Y.H. Regional Geochemical Anomaly Identification Based on Multiple-Point Geostatistical Simulation and Local Singularity Analysis—A Case Study in Mila Mountain Region, Southern Tibet. Minerals 2021, 11, 1037. [Google Scholar] [CrossRef]
  26. Ouyang, H.G.; Mao, J.W.; Santosh, M. Anatomy of a large Ag–Pb–Zn deposit in the Great Xing’an Range, northeast China: Metallogeny associated with Early Cretaceous magmatism. Int. Geol. Rev. 2013, 55, 411–429. [Google Scholar] [CrossRef]
  27. Wang, X.; Ren, Y.S.; Zhao, D.S.; Ren, X.G. Ore-forming fluids and ore genesis of the large Bayanbaolege Ag polymetallic deposit, Southern Great Xing’an Range, NE China. Ore Geol. Rev. 2019, 111, 102987. [Google Scholar] [CrossRef]
  28. Wu, X.l.; Mao, J.W.; Zhou, Z.H.; Ouyang, H.G. H-O-S-Pb isotopic components of the Budunhua Cu deposit in the middle-south part of the Da Hinggan Mountains and their implications for the ore-forming process. Geol. China 2012, 39, 1812–1829, (In Chinese with English Abstract). [Google Scholar]
  29. Zhang, M.; Di, Y.S.; Shen, C.L.; Liu, Y.H.; Yang, S.S.; Di, D.G.; Yao, M.J.; Wang, J.B.; Wang, S.G.; Gao, Z.X.; et al. Metallogenic System of Copper Polymetallic Deposits in the Middle-southern Part of Da Hinggan Mountains, China. Geoscience 2011, 25, 819–831, (In Chinese with English Abstract). [Google Scholar]
  30. Goldfarb, R.J.; Mao, J.W.; Qiu, K.F.; Goryachev, N. The great Yanshanian metallogenic event of eastern Asia: Consequences from one hundred million years of plate margin geodynamics. Gondwana Res. 2021, 100, 223–250. [Google Scholar] [CrossRef]
  31. Qiu, K.F.; Goldfarb, R.J.; Deng, J.; Yu, H.C.; Gou, Z.Y.; Ding, Z.J.; Wang, Z.K.; Li, D.P. Gold deposits of the Jiaodong Peninsula, eastern China. SEG Spec. Publ. 2020, 23, 753–773. [Google Scholar]
  32. Chen, Y.P.; Wei, C.J.; Zhang, J.R.; Chu, H. Metamorphism and zircon U–Pb dating of garnet amphibolite in the Baoyintu Group, Inner Mongolia. Chin. Sci. Bull. 2015, 60, 1698–1707. [Google Scholar] [CrossRef] [Green Version]
  33. Xu, B.; Zhao, P.; Wang, Y.Y.; Liao, W.; Luo, Z.W.; Bao, Q.Z.; Zhou, Y.H. The pre-Devonian tectonic framework of Xing’an-Mongolia orogenic belt (XMOB) in north China. J. Asian Earth Sci. 2015, 97, 183–196. [Google Scholar] [CrossRef] [Green Version]
  34. Wang, Y.D.; Sun, F.Y.; Li, L.; Li, R.H.; Wang, J.; Xin, W. Geochronology, geochemistry, and geological implications of late Carboniferous—Early Permian mafic and felsic intrusive rocks from Urad Zhongqi, western Inner Mongolia. Geol. Mag. 2015, 152, 1057–1072. [Google Scholar] [CrossRef] [Green Version]
  35. Fan, W.M.; Guo, F.; Wang, Y.J.; Lin, G. Late Mesozoic calc-alkaline volcanism of post-orogenic extension in the northern Da Hinggan Mountains, northeastern China. J. Volcanol. Geotherm. Res. 2003, 121, 115–135. [Google Scholar] [CrossRef]
  36. Liu, J.M.; Zhang, R.; Zhang, Q.Z. The regional metallogeny of Da Hinggan line, China. Earth Sci. Front. 2004, 11, 269–277, (In Chinese with English Abstract). [Google Scholar]
  37. Zeng, Q.D.; Liu, J.M.; Zhang, Z.L.; Jia, C.S.; Yu, C.M.; Ye, J.; Liu, H.T. Geology and Lead-Isotope Study of the Baiyinnuoer Zn-Pb-Ag Deposit, South Segment of the Da Hinggan Mountains, Northeastern China. Resour. Geol. 2009, 59, 170–180. [Google Scholar] [CrossRef]
  38. Yan, G.H.; Xu, B.L.; Mu, B.L.; Wang, G.Y.; Chang, Z.S.; Chen, T.L.; Zhao, Y.C.; Wang, X.F.; Zhang, R.H.; Qiao, G.S.; et al. Alkaline intrusives at the east foot of the Taihang-Da Hinggan Mountains: Chronology, Sr, Nd and Pb isotopic characteristics and their implications. Acta Geol. Sin. -Engl. Ed. 2000, 74, 774–780. [Google Scholar] [CrossRef]
  39. Yu, H.C.; Qiu, K.F.; Hetherington, C.J.; Chew, D.; Huang, Y.Q.; He, D.Y.; Geng, J.Z.; Xian, H.Y. Apatite as an alternative petrochronometer to trace the evolution of magmatic systems containing metamict zircon. Contrib. Mineral. Petrol. 2021, 176, 68. [Google Scholar] [CrossRef]
  40. Wang, Y.; Qiu, K.F.; Müller, A.; Hou, Z.L.; Zhu, Z.H.; Yu, H.C. Machine Learning Prediction of Quartz Forming- Environments. J. Geophys. Res. Solid Earth 2021, 126, e2021JB021925. [Google Scholar] [CrossRef]
  41. Qiu, K.F.; Yu, H.C.; Hetherington, C.; Huang, Y.Q.; Yang, T.; Deng, J. Tourmaline composition and boron isotope signature as a tracer of magmatic-hydrothermal processes. Am. Mineral. J. Earth Planet. Mater. 2021, 106, 1033–1044. [Google Scholar] [CrossRef]
  42. Wu, D.T.; Li, Z.M.; Lv, J.C.; Xu, J.; Shu, G.L. Redetermination of the Zalantun Group in the ARong Qi Area of Da Hinggan Mountains (Northeastern China): Evidence from Petrology, Geochronology and Geochemistry. Minerals 2022, 12, 197. [Google Scholar] [CrossRef]
  43. Zhang, J.H.; Ge, W.C.; Wu, F.Y.; Liu, X.M. Mesozoic bimodal volcanic suite in Zhalantun of the Da Hinggan Range and its geological significance: Zircon U-Pb age and Hf isotopic constraints. Acta Geol. Sin. Engl. Ed. 2006, 80, 58–69. [Google Scholar] [CrossRef]
  44. Jiang, S.H.; Chen, C.L.; Bagas, L.; Liu, Y.; Han, N.; Kang, H.; Wang, Z.H. Two mineralization events in the Baiyinnuoer Zn-Pb deposit in Inner Mongolia, China: Evidence from field observations, S-Pb isotopic compositions and U-Pb zircon ages. J. Asian Earth Sci. 2017, 144, 339–367. [Google Scholar] [CrossRef]
  45. Liu, J.M.; Ye, J.; Li, Y.B.; Chen, X.S.; Zhang, R.B. A Preliminary Study on Exhalative Mineralization in Permian Basins, the Southern Segment of the Da Hinggan Mountains, China–Case Studies of the Huanggang and Dajing Deposits. Resour. Geol. 2001, 51, 345–358. [Google Scholar] [CrossRef]
  46. Zhao, P.Z. Regional geochemical background and division of metallogenic belt in north Da Hinggan Mountain. Acta Geol. Sin. 2014, 88, 99–108, (In Chinese with English Abstract). [Google Scholar]
  47. Wang, J.B.; Wang, Y.W.; Wang, L.J.; Uemoto, T. Tin–polymetallic Mineralization in the Southern Part of the Da Hinggan Mountains, China. Resour. Geol. 2001, 51, 283–291. [Google Scholar] [CrossRef]
  48. Jiang, S.H.; Nie, F.J.; Liu, Y.F.; Yun, F. Sulfur and lead isotopic compositions of Bairendaba and Weilasituo silver-polymetallic deposits, Inner Mongolia. Miner. Depos. 2010, 29, 101–112, (In Chinese with English Abstract). [Google Scholar]
  49. Jiang, B.B.; Zhu, X.Y.; Huang, X.K.; Zou, T.; Xu, Q.; Liu, Z. Determination of metallogenic age and prospecting significance of the Baiyinnuoer lead-zinc deposit in the southern Da Hinggan Mountains. Acta Geol. Sin. 2020, 94, 2844–2855, (In Chinese with English Abstract). [Google Scholar] [CrossRef]
  50. Wang, X.D. Magmatism and Mineralization of Ag-Pb-Zn Ploymetallic Deposits in the Lingdong District, Inner Mongolia. Ph.D. Thesis, China University of Geosciences (Wuhan), Wuhan, China, 2017; p. 107, (In Chinese with English Abstract). [Google Scholar]
  51. Wang, C.Y. Lead-Zinc polymetallic metallogenic series and prospecting direction of Huanggangliang—Ganzhuermiao metallogenic belt, Inner Mongolia. Ph.D. Thesis, Jilin University, Changchun, China, 2015; p. 124, (In Chinese with English Abstract). [Google Scholar]
  52. Sun, X.G.; Li, Y.B. Characteristics of fluid inclusions of barite in the Longtoushan polymetallic sulfide deposit, Inner Mongolia: Evidence for submarine hydrothermal sedimentary origin. Acta Petrol. Et Mineral. 2011, 30, 637–644, (In Chinese with English Abstract). [Google Scholar]
  53. Niu, S.Y.; Sun, A.Q.; Guo, L.J.; Wang, B.D.; Hu, H.B.; Liu, J.M. Ore-control structures and prospecting for the Baiyinnuo’er Pb-Zn deposit in the Da Hinggan Range. Geotecton. Metallog. 2008, 32, 72–80, (In Chinese with English Abstract). [Google Scholar]
  54. Chen, Y.Q.; Zhou, D.; Guo, L.F. Genetic study on the Huaaobaote Pb-Zn-Ag polymetallic deposit in Inner Mongolia: Evidence from fluid inclusions and S, Pb, H, O isotopes. J. Jiliin Univ. Earth Sci. Ed. 2014, 44, 1478–1491. [Google Scholar] [CrossRef]
  55. Na, F.C. Regional Volcanic Bodies and Their Ore-Controlling Characteristics of the Trees Ditch. Master’s Thesis, China University of Geosciences (Beijing), Beijing, China, 2012; p. 107, (In Chinese with English Abstract). [Google Scholar]
  56. Ouyang, H.G. Metallogenesis of Bairendaba—Weilasituo silver—Polymetallic Deposit and Its Geodynamic Setting, in the Southern Segment of Great Xing’an Range, NE China. Ph.D. Thesis, China University of Geosciences (Beijing), Beijing, China, 2013; pp. 31–34, (In Chinese with English Abstract). [Google Scholar]
  57. Zeng, Q.D.; Liu, J.M.; Liu, H.T. Geology and Geochemistry of the Bianbianshan Au-Ag-Cu-Pb-Zn Deposit, Southern Da Hinggan Mountains, Northeastern China. Acta Geol. Sin. Engl. Ed. 2012, 86, 630–639. [Google Scholar] [CrossRef]
  58. Zhai, D.G.; Liu, J.J.; Wang, J.P.; Yao, M.J.; Wu, S.H.; Fu, C.; Liu, Z.J.; Wang, S.G.; Li, Y.X. Fluid evolution of the Jiawula Ag-Pb-Zn deposit, Inner Mongolia: Mineralogical, fluid inclusion, and stable isotopic evidence. Int. Geol. Rev. 2013, 55, 204–224. [Google Scholar] [CrossRef]
  59. Wang, J.B.; Wang, Y.W.; Wang, L.J. Copper metallogenic setting and prospecting potential in the middle-southern part of Da Hinggan Mountains. Geol. Prospect. 2000, 36, 1–4, (In Chinese with English Abstract). [Google Scholar]
  60. MLR (Ministry of Land and Resources of the People’s Republic of China). Specifications for Geochemical Reconnaissance Survey (1∶50 000) (DZ/T0011-2015); Geological Publishing House: Beijing, China, 2015; pp. 1–35. (In Chinese)
  61. MLR (Ministry of Land and Resources of the People’s Republic of China). Code of Practice for Soil Geochemical Survey (DZ/T0145-2017); Geological Publishing House: Beijing, China, 2015; pp. 1–38. (In Chinese)
  62. China Geological Survey. Specifications for Regional Geochemistry Exploration (DZ/T0167-2006). In China Geological Survey; Geological Publishing House: Beijing, China, 2006. (In Chinese) [Google Scholar]
  63. Xie, X.J.; Shao, Y.; Wang, X.Q. Mineral Exploiting and Geochemistry in 21st Century; Geological Publishing House: Beijing, China, 1999; pp. 3–11, 35–41, (In Chinese with English Abstract). [Google Scholar]
  64. Xie, X.J.; Yan, M.C.; Li, L.Z.; Shen, H.J. Usable values for Chinese standard reference samples of stream sediments, soils, and rocks: GSD 9–12, GSS 1–8 and GSR 1–6. Geostand. Geoanalytical Res. 1985, 9, 277–280. [Google Scholar] [CrossRef]
  65. Xie, X.J.; Yan, M.C.; Wang, C.S.; Li, L.Z.; Shen, H.J. Geochemical standard reference samples GSD 9–12, GSS 1–8 and GSR 1–6. Geostand. Newsl. 1989, 13, 83–179. [Google Scholar] [CrossRef]
  66. Wang, C.S.; Gu, T.X.; Chi, Q.H.; Yan, W.D.; Yan, M.C. New geochemical standard materials for rocks and stream sediments. Geophys. Geochem. Explor. 2000, 24, 246–249, (In Chinese with English Abstract). [Google Scholar] [CrossRef]
  67. Ye, J.Y. Quality monitoring and quality control of sample analysis in regional geochemical survey. Geophys. Geochem. Explor. 2002, 21, 6–11, (In Chinese with English Abstract). [Google Scholar]
  68. Zhang, Q.; Bai, J.F.; Wang, Y. Analytical scheme and quality monitoring system for China Geochemical Baselines. Earth Sci. Front. 2012, 19, 33–42, (In Chinese with English Abstract). [Google Scholar]
  69. Lancianese, V.; Dinelli, E. Different spatial methods in regional geochemical mapping at high density sampling: An application on stream sediment of Romagna Apennines, Northern Italy. J. Geochem. Explor. 2015, 154, 143–155. [Google Scholar] [CrossRef]
  70. Yang, F.; Kong, M.; Liu, H.Z.; Yu, J.S.; Yang, S.P.; Hao, Z.H.; Zhang, D.H.; Cen, K. Discovery of Wolitu Pb-Zn deposit through geochemical prospecting under loess cover in Inner Mongolia, China. Geosci. Front. 2017, 8, 951–960. [Google Scholar] [CrossRef] [Green Version]
  71. Xiao, F.; Chen, J.G.; Zhang, Z.Y.; Wang, C.B.; Wu, G.M.; Agterberg, F.P. Singularity mapping and spatially weighted principal component analysis to identify geochemical anomalies associated with Ag and Pb-Zn polymetallic mineralization in Northwest Zhejiang, China. J. Geochem. Explor. 2012, 122, 90–100. [Google Scholar] [CrossRef]
  72. Chen, J.; Chen, R.Y.; Mao, Z.X.; Yang, H.Z.; Zhang, C.P.; Han, R.P. Regional mineral resources assessment based on rasterized geochemical data: A case study of porphyry copper deposits in Manzhouli, China. Ore Geol. Rev. 2016, 74, 15–25. [Google Scholar] [CrossRef]
Figure 1. The geological (a) and geotectonic (b) map of the study area [32,33,34,35,36,37].
Minerals 12 00434 g001
Figure 2. Geochemical contour map of the average contrast values of Pb–Zn–Ag–Cd.
Minerals 12 00434 g002
Figure 3. The contour map of the similarity coefficients with the Baiyinnuoer Pb–Zn deposit.
Minerals 12 00434 g003
Figure 4. Distribution diagram of the metallogenic prediction areas.
Minerals 12 00434 g004
Figure 5. The contour map of the ratio of (W × Sn)/(As × Sb).
Minerals 12 00434 g005
Table 1. The resources of Pb and Zn, anomaly dimension, areal productivity of the six typical deposits.
Typical DepositResources (×104 Tons)ADAP
Bairendaba132.569516.518507.1
Huaaobaote42.826439.695747.28
Haobugao63.264143.23306.71
Baiyinnuoer123.062831.092281.82
Dajing502378.831934.45
Longtoushan53.124713.74451.98
Table 2. The average concentrations of major indicator elements in the inner zone of geochemical anomaly of the typical deposits.
Name of DepositIndicator Element Combination (the Mean Value of the Inner Zones of Geochemical Anomalies). The Concentration of Elements Is 10−6 g/g; That of Ag and Cd Is 10−9 g/g.
BairendabaAg(784.00) + Bi(8.58) + Cd(283.80) + Mo(7.07) + Sb(50.19) + Zn(249.38)
HuaaobaoteAg(2263.13) + As(313.36) + Cd(971.10) + Mo(6.22) + Sb(26.17) + W(33.42) + Zn(500.96)
HaobugaoAg(1416.80) + As(486.82) + Bi(2.88) + Cd(9507.90) + Cu(66.07) + Pb(245.44) + Sb(8.28) + Sn(41.98) + W(9.24) + Zn(1191.31)
BaiyinnuoerAs(265.70) + Bi(3.17) + Cd330.50) + Pb(44.42) + Sn(25.10)
DajingAg(1506.50) + As(210.94) + Cd(1014.00) + Pb(644.03) + Sb(4.45) + Zn(83.97)
LongtoushanAg(4005.00) + As(609.35) + Bi(43.86) + Cd(713.77) + Mo(300.90) + Pb(560.47) + Sb(17.92) + Zn(2517.98)
Table 3. The predicted resources of the prediction areas (×104 tons).
NumberPr1Pr2PR
A010.940.580.8
A024.012.763.51
A031.050.780.94
B019.367.718.7
B029.547.138.58
B035.834.135.15
B0420.6916.2318.9
B0525.5125.9225.67
B0628.1119.8524.8
B079.676.68.44
B083.612.473.15
B0921.1717.4719.69
B102.21.611.96
B119.066.247.93
B1217.9817.2617.69
B1324.8322.8424.03
B145.63.784.88
B1511.387.859.97
B165.263.594.59
B173.83.273.59
B185.683.534.82
B193.892.663.4
B209.838.529.31
B213.562.263.04
B221.520.931.28
B2322.2619.221.04
B2415.8910.9513.91
B251.731.161.5
B2612.99.7511.64
B271.470.921.25
B281.831.731.79
B2910.831.947.27
B3010.248.269.45
B315.193.774.62
B327.196.236.81
B333.993.093.63
Table 4. Comparison table of the predicted and proved resources (×104 tons).
NumberPr1Pr2PRP
B2322.2619.221.0410.17
B2910.831.947.276.57
B333.993.093.631.52
Publisher’s Note: MDPI stays neutral with regard to jurisdictional claims in published maps and institutional affiliations.

