Article

The Relationship between Particle Size and Element Distribution in Stream Sediments from the Dongyuan W-Mo Deposit, Eastern China

1
Institute of Geophysical and Geochemical Exploration, Chinese Academy of Geological Sciences, Langfang 065000, China
2
Beijing Institute of Geology for Mineral Resources Co., Ltd., Beijing 100012, China
3
State Key Laboratory of Geological Processes and Mineral Resources (GPMR), Faculty of Earth Sciences, China University of Geosciences, Wuhan 430074, China
4
Department of Geology, University of the Free State, Bloemfontein 9301, South Africa
5
Geological Sciences, School of Agricultural, Earth and Environmental Sciences, University of KwaZulu-Natal, Pietermaritzburg 3201, South Africa
*
Authors to whom correspondence should be addressed.
Minerals 2022, 12(4), 431; https://doi.org/10.3390/min12040431
Submission received: 22 December 2021 / Revised: 27 March 2022 / Accepted: 28 March 2022 / Published: 31 March 2022

Abstract

:
Particle size exerts significant control on the concentration of elements in stream sediments and is therefore critical in stream sediment-based geochemical exploration, which has proved important in China’s National Geochemical Mapping Project. There are various geographical landscapes in China with different distribution characteristics of stream sediments. Therefore, we studied the relationship between particle size and element distribution in stream sediments, which is always a crucial but challenging issue in geochemical surveys. The distributions of minerals and elements in eight size fractions of stream sediments (2–0.84, 0.84–0.42, 0.42–0.25, 0.25–0.177, 0.177–0.125, 0.125–0.096, 0.096–0.074, and <0.074 mm) from the Dongyuan W-Mo deposit in eastern China were studied. The results show that the 2–0.25 mm particle size fraction of stream sediments is composed mainly of rock debris and various minerals from broken bedrock upstream, while the <0.25 mm fraction is composed mainly of clay, individual minerals, and organic matter. The pilot survey results prove that using 2–0.25 mm as the sampling particle size fraction is better than using <0.25 mm, especially in geochemical prospecting and geological body delineation. Sampling the 2–0.25 mm particle size fraction of stream sediments can help to delineate proven ore bodies, ore-related anomalies, and geological bodies more effectively and more credibly. The suggested sampling particle size fraction for a stream sediment geochemical survey in a humid to semi-humid low mountain landscape in eastern China is therefore 2–0.25 mm, rather than the particle size fraction of <0.25 mm that was used for sampling in this area before. This paper depicts a successful example for determining the optimal sampling particle size fraction for stream sediment-based geochemical exploration.

1. Introduction

China’s National Geochemical Mapping Project (Regional Geochemical-National Reconnaissance, RGNR project) initiated in 1978 [1] has now covered more than 6 million square kilometers of China’s territory, which contributed significantly to China’s mineral exploration. Particle size exerts significant control on the concentration of elements in stream sediments; therefore, it is critical to stream sediment-based geochemical exploration, which is important in the RGNR project [2,3].
Sample particle size fraction is one of the crucial considerations in geochemical mapping and it is one of the important factors that influence the results of stream sediment geochemical surveys [4,5,6,7]. Optimal sample particle size is critical for accurate delineation of geochemical information and better exploration outcomes [8,9]. Therefore, an optimal sample particle size fraction should be determined in geochemical surveys [2,3,10,11,12,13,14,15,16,17,18,19,20,21].
The sample particle size fraction used in stream sediment geochemical surveys for China’s regional geochemical mapping in large areas was <0.25 mm, except in some special landscape areas such as arid, semi-arid, loess covered area, and karst landform [1,3,21,22,23,24]. For decades, a large number of ore deposits have been found using this sample particle size fraction in stream sediment geochemical surveys [1]. However, some important large ore deposits were missed by using this sample particle size fraction, such as the Beichagoumen large-size Pb–Zn deposit in Hebei province and the Suoluogou large gold deposit in Sichuan province [25]. In such situations, the <0.25 mm sample particle size fraction for stream sediment geochemical surveys has been questioned in some landscape areas in China, especially in humid and semi-humid low mountain landscapes. There are also some exploration geochemists who insist that the <25 mm sampling particle size fraction for stream sediment geochemical surveys in humid and semi-humid low mountain landscapes can continue to be used, and that some deposits have been found despite the loss of several large deposits. Therefore, there is controversy about the optimal sample particle size fraction for stream sediment geochemical surveys in the above-mentioned landscapes [24].
Therefore, the relationship between particle size and stream sediment element concentrations was studied in this study, aiming to determine the optimal sampling particle size for stream sediment-based geochemical exploration in the humid and semi-humid low mountain landscapes in eastern China. The study area is in and around the Dongyuan W-Mo deposit in Anhui Province, which is situated in a typical humid and semi-humid low mountain landscape in China. This research aimed to settle the above-discussed scientific disputes, and the results will help to improve the geochemical mapping outcomes in the vast humid and sub-humid landscapes in China, reduce exploration capital waste, and increase the productivity of exploration funds.

2. Materials and Methods

2.1. Description of Study Area

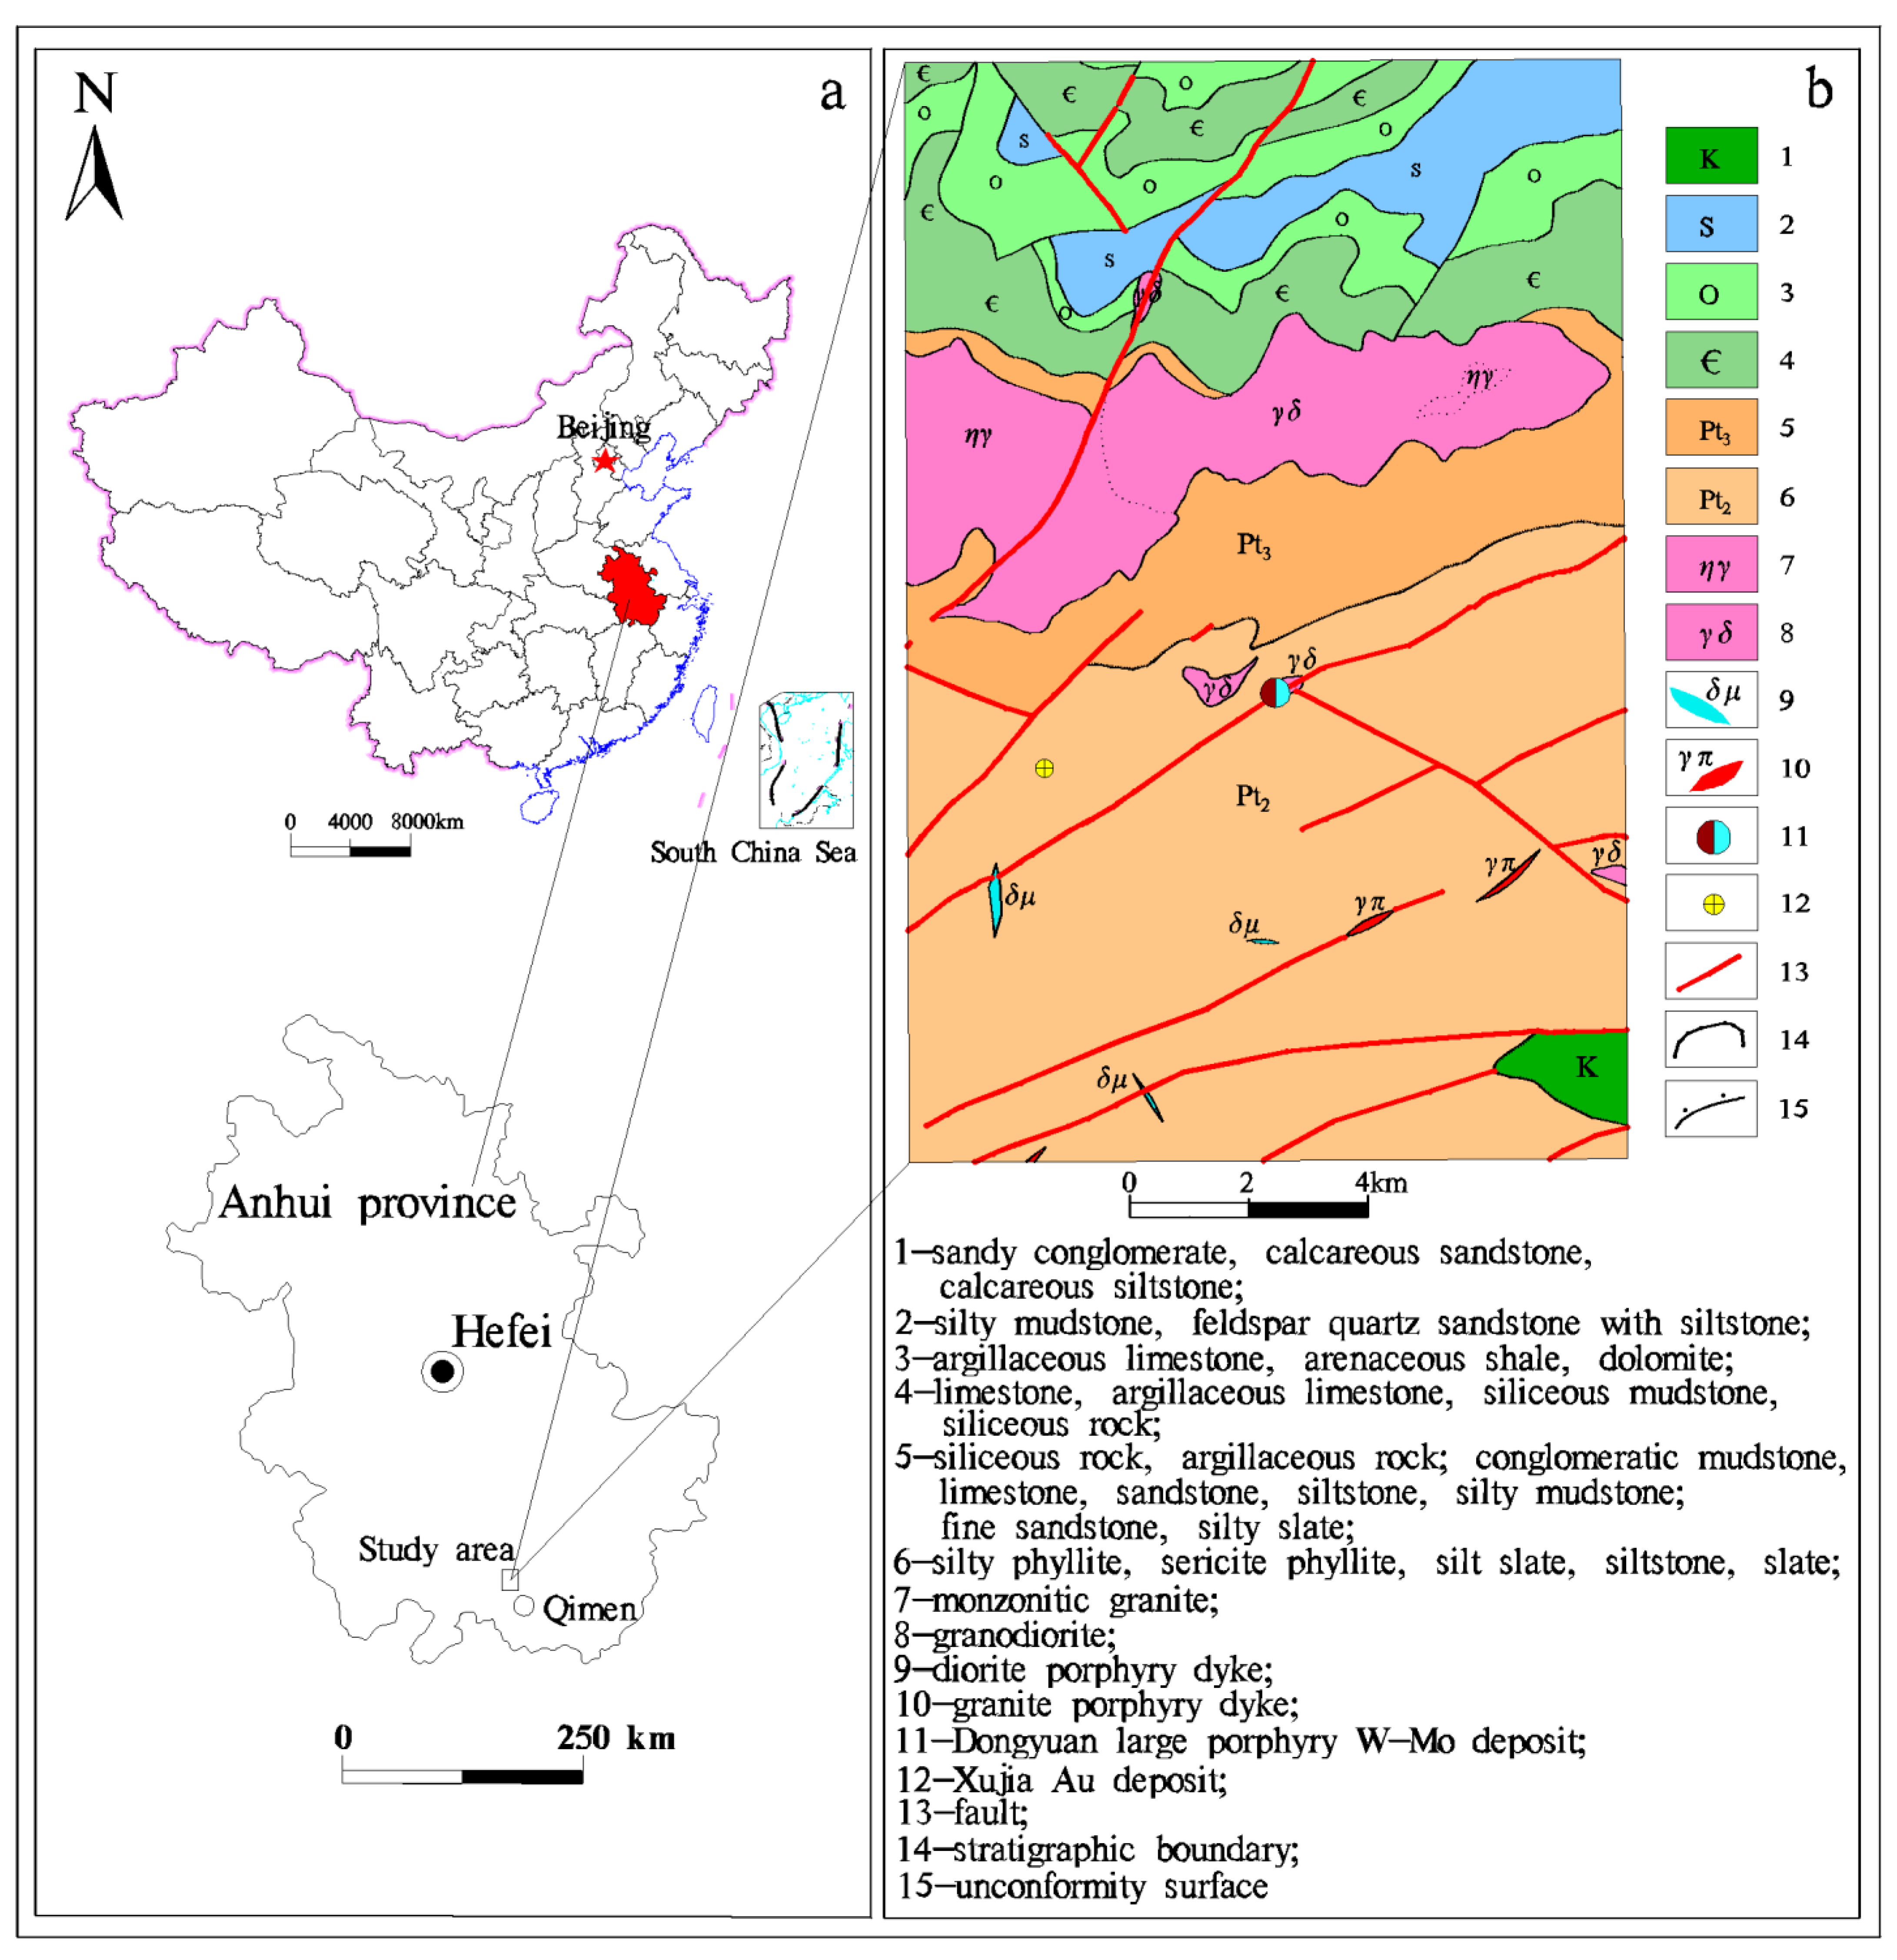
2.1.1. Geological Setting

The study area is the Dongyuan large porphyry W-Mo deposit in Qimen County of Anhui Province in eastern China (Figure 1). The ore-forming age is 148 Ma, which is late Jurassic [26,27,28,29,30]. At present, about 140,000 tons of WO3, 10,000 tons of molybdenum, 203 tons of associated silver, and about 1.4 million tons of sulfur have been proved by drilling. In addition, a large new porphyry molybdenum ore body was found in the northeast of the W-Mo deposit [31].
The main strata are shallow metamorphic silty phyllite, sericite phyllite, silt slate, and siltstone of the Middle Proterozoic. The NE-trending fault system is very common in the area. There are also some faults with NW and NWW orientations [31,32,33,34]. Folds are well developed. There were multiple periods of geological-structural events, which formed a set of isoclinal inversion folds in the EW direction and folds in the NE direction. The synclines are wider than the anticlines in the NE direction folds. Some strata are in unconformable contact. Some strata are in intrusive contact with magmatite. The Dongyuan large porphyry W-Mo deposit is located at the intersection of an NE-trending fault and an NW-trending fault [35]. Magmatite, mainly intermediate-acidic rocks, in the form of small stocks and apophyses, are very common. There are several dike rocks and veins that are mainly felsic granodiorite porphyry, granite porphyry, and mafic diorite (porphyrite) rock, diabase, and lamprophyre [36].
The ore-bearing rock is granodiorite porphyry. The surrounding rocks, which are hornfelsic, are low-grade metamorphic rocks of the Middle Proterozoic [37,38,39,40,41]. The main types of the alteration include silicification, sericitization, potassic feldspathization, chloritization, muscovitization, carbonatization, and pyritization. The major ore mineral is molybdenite, scheelite, copper scheelite, pyrite, quartz, sericite, and chlorite [31]. The major metallogenic elements are W and Mo [42]. The main associated elements are Ag, Sn, Bi, Pb, Zn, As, Cu, and Sb.
Figure 1. Geographical location (a) [43] and geological (b) map of the study area.
Minerals 12 00431 g001

2.1.2. Landscape Features
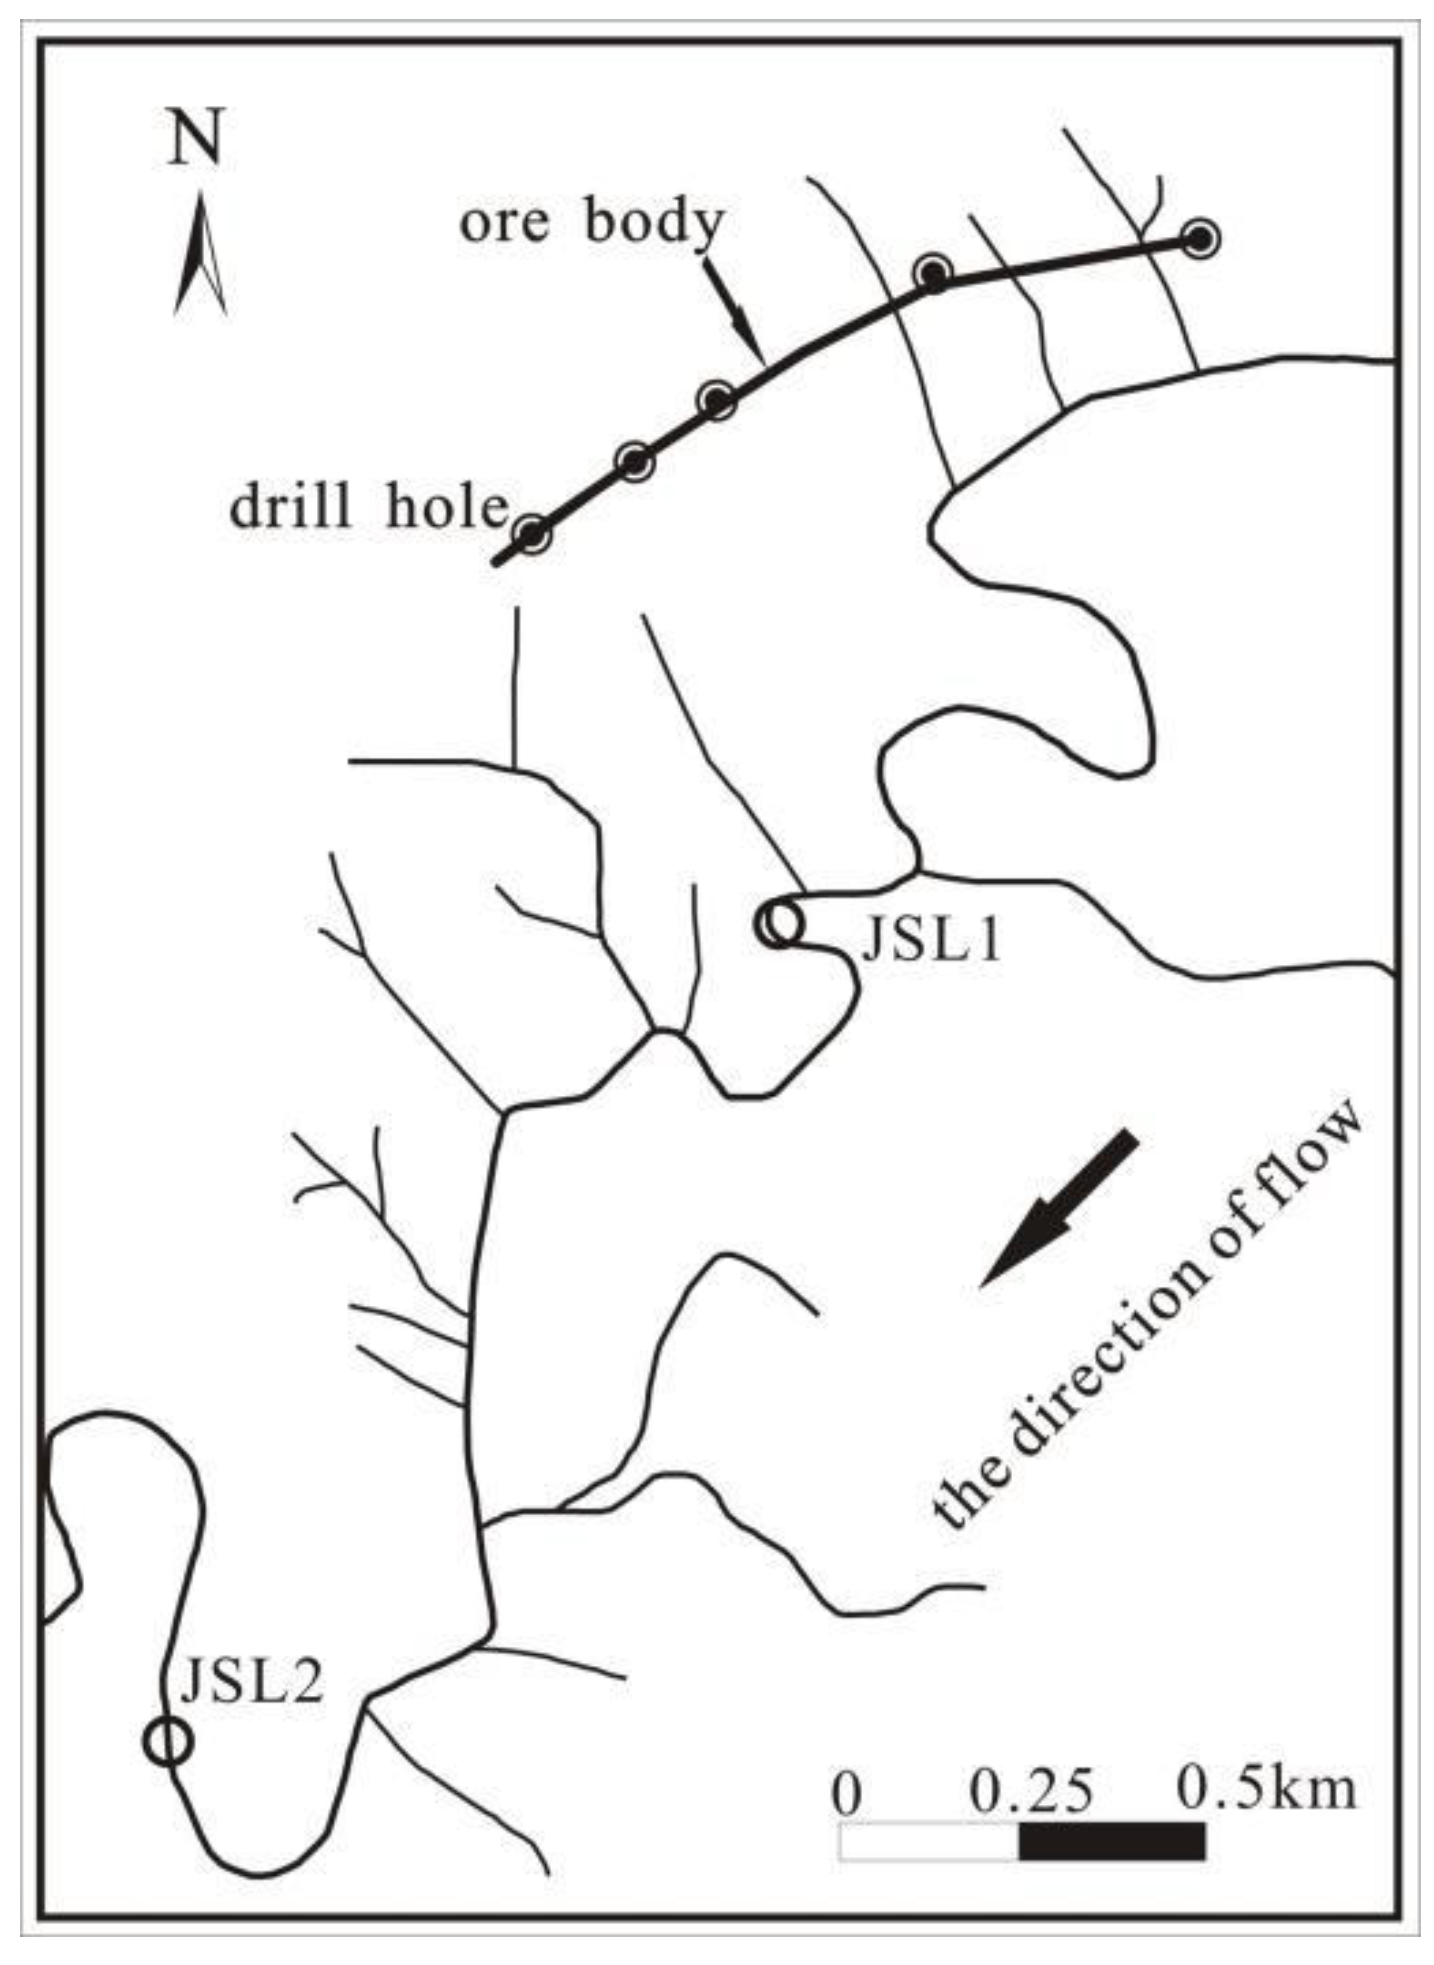
The elevation range is 200–600 m, and the range of relative height difference is 200–400 m. The annual rainfall is 1700 mm, and the area is efficiently drained by shallow cutting streams. The study area is situated in a humid and semi-humid hilly landscape, wherein sediments are rich in organic matter and clay. Dendritic streams with steep banks are developed. The difference between the highest and lowest elevation of the streams is about 400 m [37].

2.2. Sampling

2.2.1. Sampling Method for Test Samples

The test samples used to determine the optimal sampling particle size fraction for stream sediment geochemical survey were collected along the stream below the W–Mo polymetallic deposit and with stream sediment geochemical anomalies. The JSL1 and JSL2 sampling points are located downstream of the deposit; the JSL1 sampling point is about one kilometer from the deposit (Figure 2).
Stream sediment samples with complex lithology and a mixture of various particle sizes were collected in the stream. Each sample was gathered from five sub-sites within 100 m of the designed sampling point. Stream sediments with particle sizes greater than 10 mm were removed from the samples. The weight of each sample was greater than 50 kg.

2.2.2. Sampling Method for Geochemical Mapping Experiment

Stream sediment geochemical survey was carried out in the pilot area. The pilot area is around the large porphyry W–Mo deposit and covers an area of about 892.42 square kilometers. One sample site per square kilometer was designed. Each sample was gathered from five sub-sites within 100 m of the designed sampling point. Four samples in 4 km2 were combined into a composite sample for analysis. The samples were collected from the bottom of the stream bed or at the contact position between shore and water surface [23]. Stream sediment samples with 2–0.25 mm and <0.25 mm particle size fractions were collected for comparison. The numbers of stream sediment samples with 2–0.25 mm and with <0.25 mm particle size fractions were analyzed.

2.3. Sample Preparation, Analysis, and Quality Control

2.3.1. Sample Preparation

All the samples were prepared according to the standard procedure in the stream sediment geochemical survey guidebook enacted by China Geological Survey [1,23]. The samples were first air-dried at room temperature. After drying, the test samples were sieved into eight size fractions (2–0.84, 0.84–0.42, 0.42–0.25, 0.25–0.177, 0.177–0.125, 0.125–0.096, 0.096–0.074, <0.074 mm) using a set of nylon screen. Coarse stream sediment particles (>2 mm) were crushed in a jaw crusher until <2 mm, and then sieved into the eight size fractions listed above. The composite samples from the experimental area were sieved into two size fractions (2–0.25 mm and <0.25 mm). For determination of element concentrations, 150 g of each sample was weighed. The rest of the samples were used for mineral separation and identification.

2.3.2. Sample Analysis

Element concentrations in the samples were analyzed at the Analytical Center of the Institute of Geophysical and Geochemical Exploration, Chinese Academy of Geological Sciences (IGGE). Bi, Cd, Co, Cr, Cu, La, Mo, Ni, Pb, Th, W, and Zn were determined using inductively coupled plasma-mass spectrometry (ICP-MS). As, Sb, and Hg were determined by atomic fluorescence spectrometry (AFS). Ag and Sn were determined using solid emission spectrometry (ES). Mn, SiO2, CaO, Al2O3, and Fe2O3 were determined by X-ray fluorescence spectrometry (XRF). Organic carbon was determined by oxidative pyrolysis—potential method (POT). The detection limit was Bi 0.05 μg/g, Cd 0.03 μg/g, Co 1 μg/g, Cr 5 μg/g, Cu 1 μg/g, La 5 μg/g, Mo 0.3 μg/g, Ni 1 μg/g, Pb 2 μg/g, Th 2 μg/g, W 0.3 μg/g, Zn 4 μg/g, As 0.1 μg/g, Sb 0.1 μg/g, Hg 2 μg/g, Ag 0.02 μg/g, Sn 1 μg/g, Mn 10 μg/g, SiO2 0.1%, CaO 0.05%, Al2O3 0.05%, Fe2O3 0.05%, and organic carbon 400 μg/g [1,3,24].
The test samples were sent to the laboratory at the Institute of Regional Geology and Mineral Resources Survey of Hebei Province for mineral separation and identification. Four mineral groups (nonmagnetic heavy minerals, ferromagnetic heavy minerals, electromagnetic heavy minerals, and light minerals) in the stream sediment samples were separated [44,45]. The technological process of mineral separation and identification was according to the standard procedure in the guidebook for mineral separation and identification of rock [23,46]. This process involved the following.
After weighing a sample (accurate to 0.1 g), dirt was washed away from it using a panning plate. The sample was divided into heavy (density > 2.87 g/cm3) and light (density < 2.87 g/cm3) components using bromoform heavy liquid (density = 2.87 g/cm3). The heavy part was divided into ferromagnetic heavy minerals and weakly magnetic heavy minerals using a big hand magnet. The weakly magnetic heavy minerals were sorted out from the electromagnetic heavy minerals and nonmagnetic heavy minerals using a belt-type electromagnetic mineral separation instrument (LZC-1B). All of the aforementioned four mineral groups were weighed (accurate to 0.1 g), from which single minerals were identified using binoculars.
Then, element concentrations in each of the mineral groups were also analyzed at the Analytical Center of the Institute of Geophysical and Geochemical Exploration, Chinese Academy of Geological Sciences (IGGE).

2.3.3. Assessment of Data Quality

Certified reference materials (CRMs) and duplicate samples were used during the process of sample analysis for data quality assessment. A set of CRMs, including GSD1a [47], GSD9, GSD13, and GSD14 [48,49,50], developed by IGGE, at a rate of 8% of the total number of samples [51], were inserted randomly into each batch of 50 samples and analyzed along with the field samples [51,52,53,54,55].
To monitor the accuracy of the sample analyses and the between-batch bias, the logarithmic difference (ΔlgCCRM) between the analytical value and the standard value of each determination was calculated as:
ΔlgCSRM = |lgCd − lgCC|
where Cd is the determined concentration and CC is the certified reference concentration. Analyses were considered acceptable if the ΔlgCCRM were <0.12 for samples with concentrations within three times the detection limits and <0.10 for samples with concentrations over three times the detection limits.
Duplicate samples, equal to 5% of the total number of samples, were inserted randomly to evaluate the analytical precision [40,42,44]. The percent relative deviation (RD) was calculated as:
RD (%) = |C1 − C2|/[(C1 + C2)/2] × 100
where C1 and C2 are the first and second determinations. Analyses were considered acceptable if the RD ≤ 50%.
The logarithmic difference of the standard reference samples (GSD1a, GSD9, GSD13, and GSD14) ranged from 0.000 to 0.037, the precision obtained from replicate analysis varied from 0.00% to 29.75%, with an average RD of 4.86% (Table 1). The results showed that all the analyses were acceptable.

3. Results and Discussion

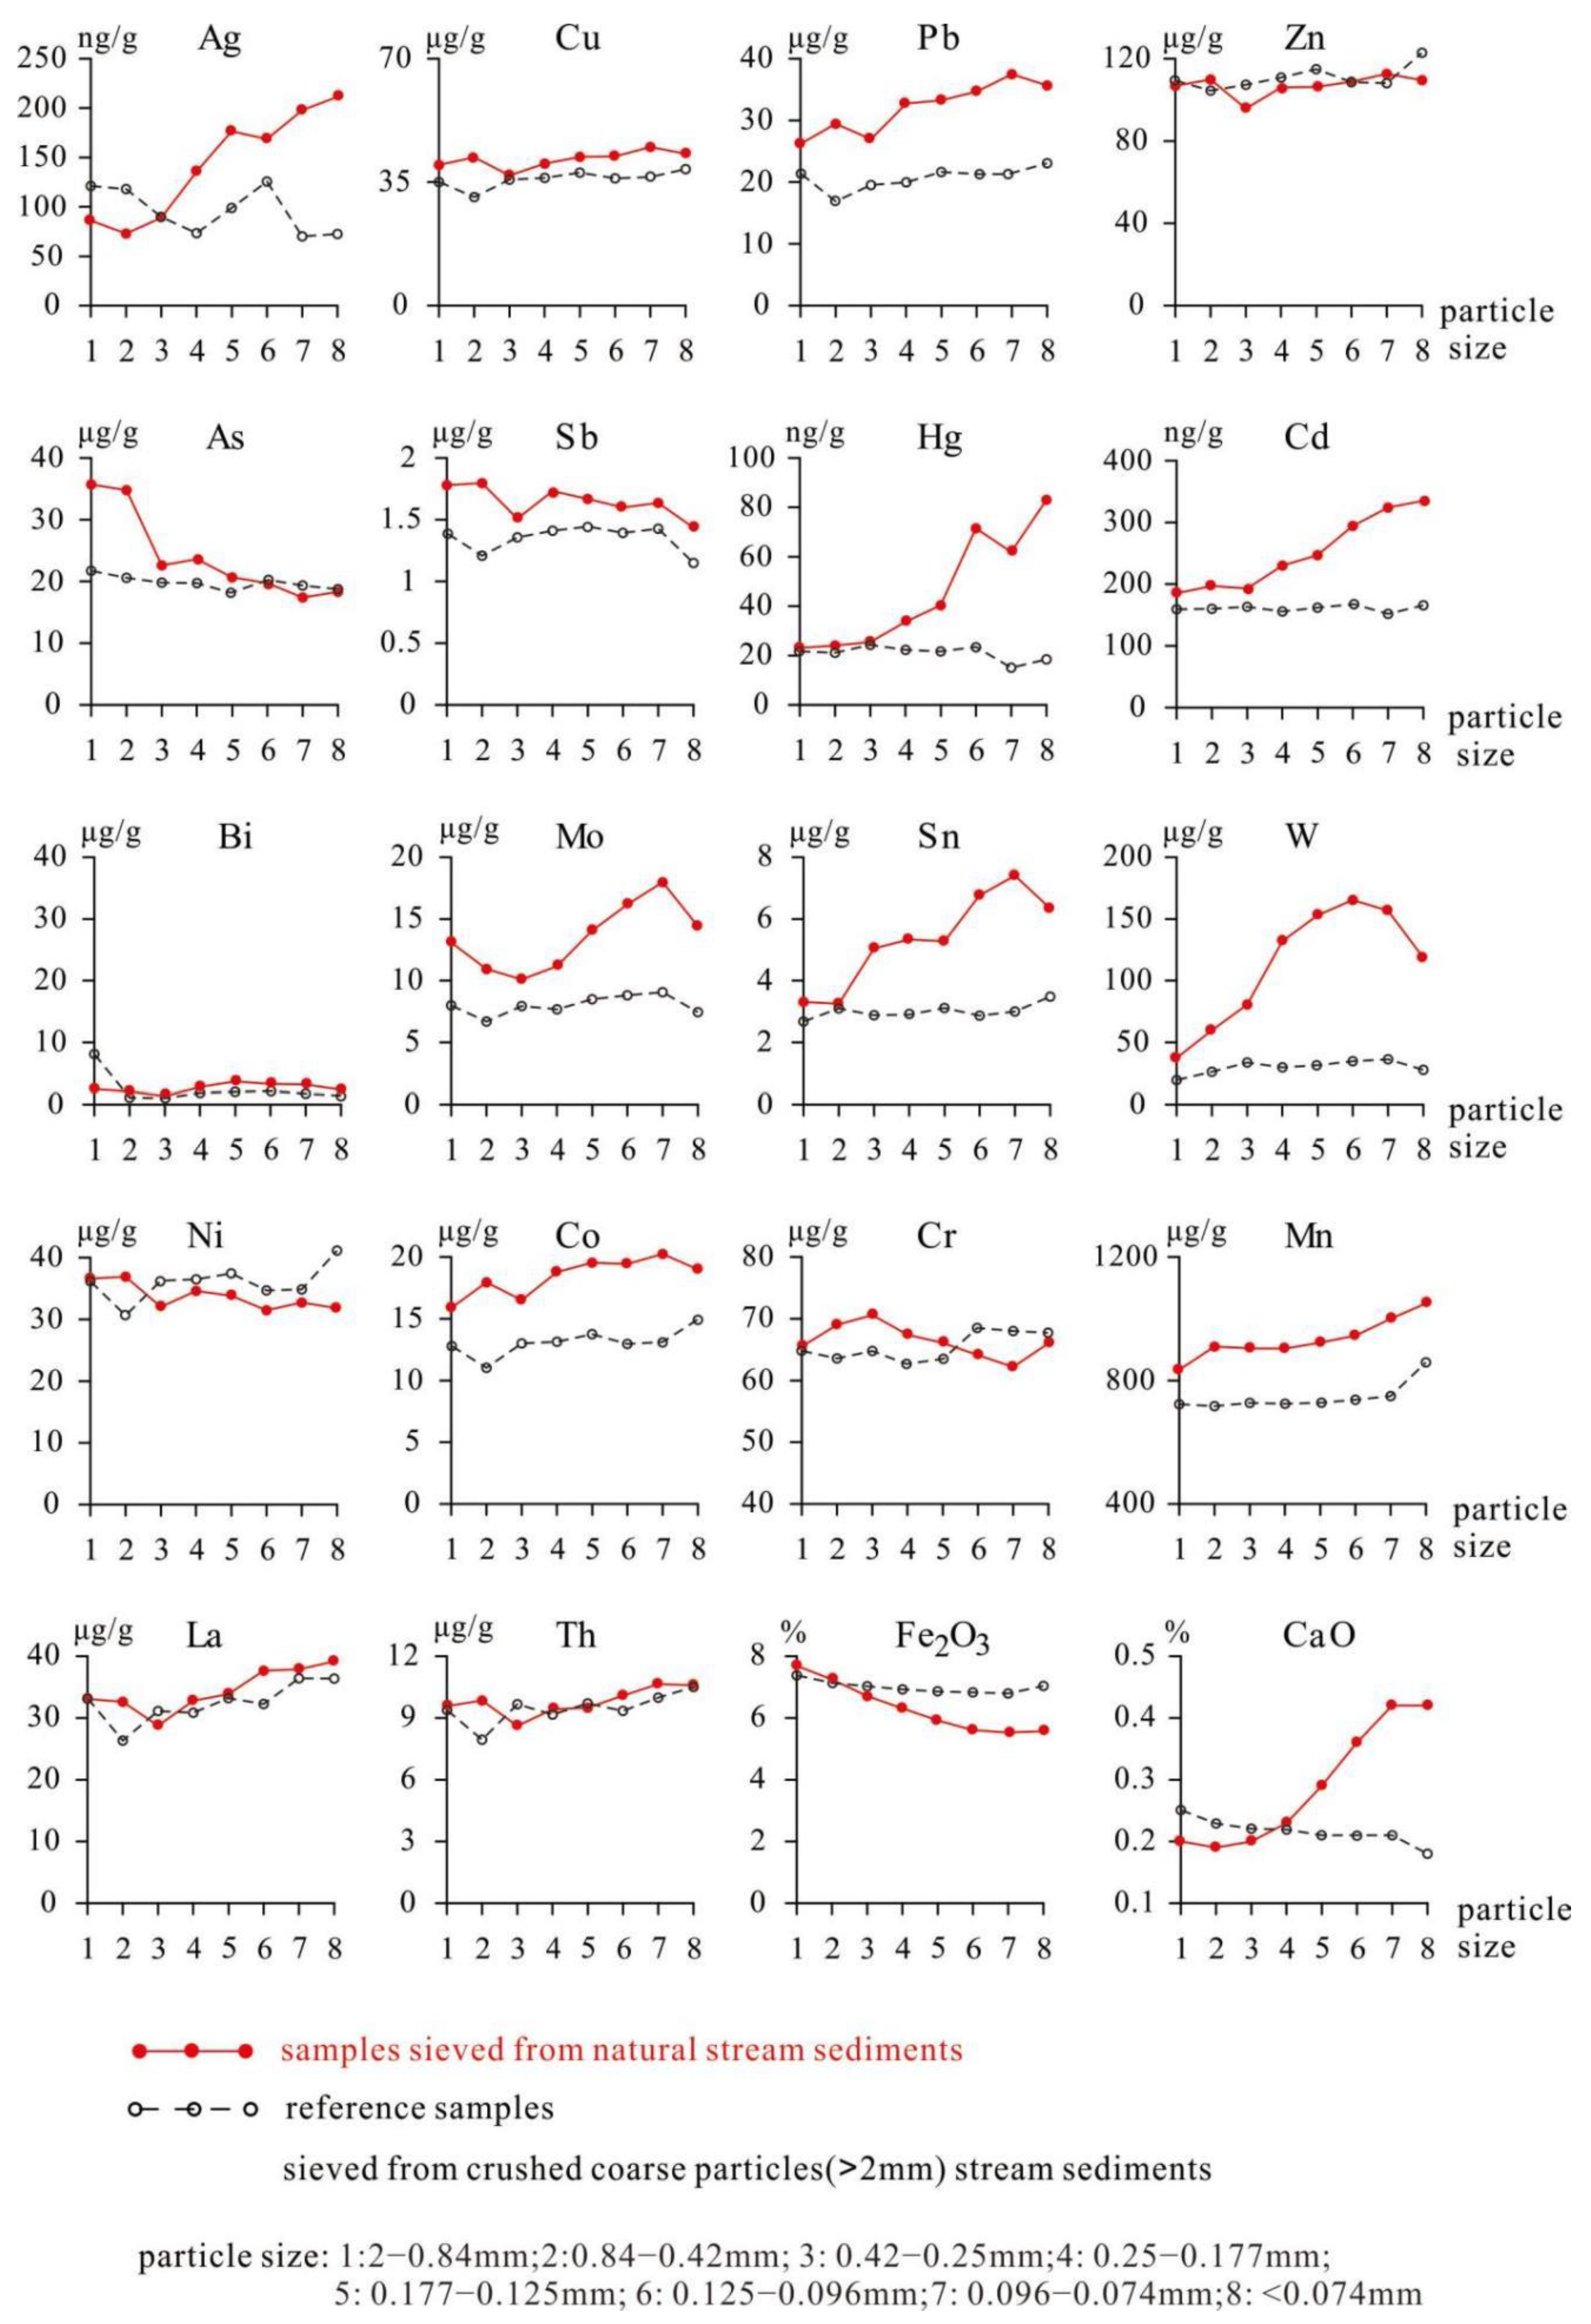
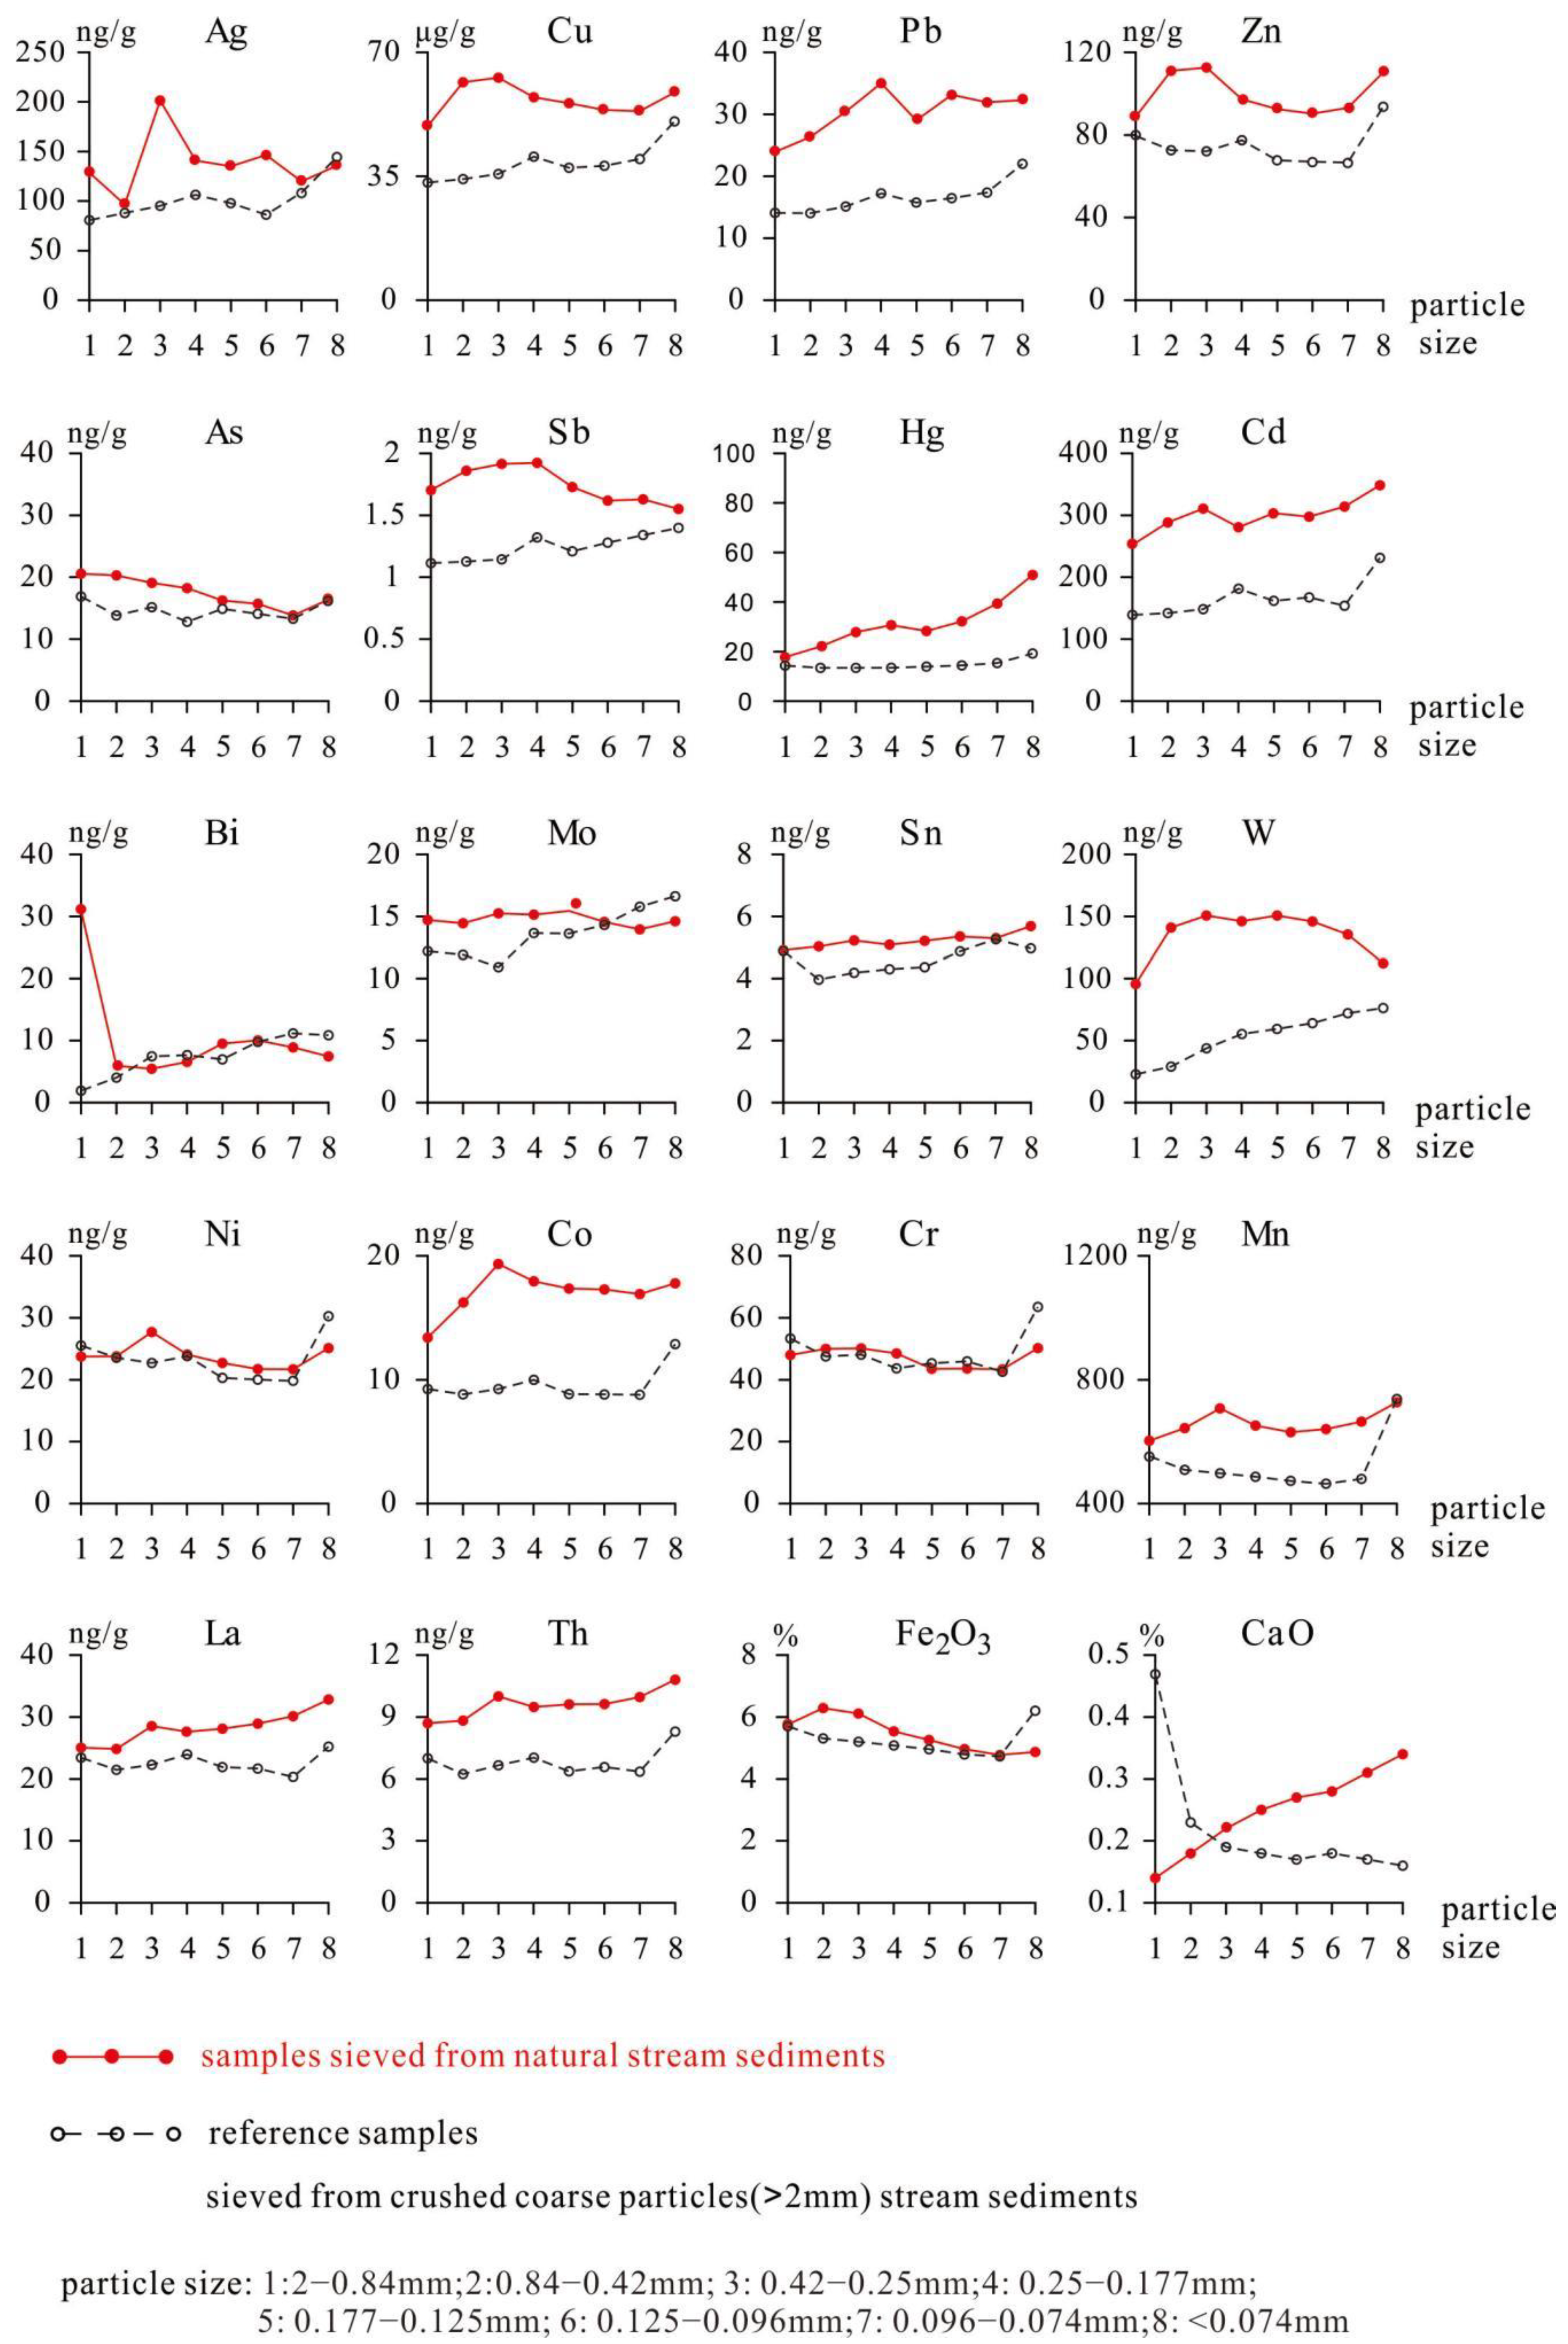
3.1. Distributions of Element Concentrations in Different Particle Size Fractions of Samples

The distribution of element concentrations in the sieved stream sediment samples from coarse to fine particles show significant differences (Figure 3 and Figure 4).
In the samples from the JSL2 sampling point, as the particle size fractions vary from coarse to fine, concentrations of Pb, Hg, Cd, La, Th, and CaO show an increasing trend, while concentrations of W, Mo, and Sn show little change. The 0.42–0.25 mm particle size fraction of stream sediments (category 3 in Figure 4) possessed the highest concentrations of Ag, Cu, Ni, Co, Cr, and Mn. Concentrations of Ag, Bi, Cu, Ni, Co, Cr, and Mn show a fluctuating with subtle decreasing trend (Figure 4).
However, element concentrations in the reference samples of the eight above-mentioned size fractions show relatively stable variation characteristics; element concentrations in the upstream reference samples (JSL1) are closely similar to those in the downstream reference samples (JSL2) (Figure 3 and Figure 4). As previously mentioned, the reference samples mechanically crushed from coarse stream sediment particles (>2 mm), which were mainly rock debris, were viewed as the samples with element concentrations that were not influenced by particle size (i.e., could be regarded as original concentrations of elements in bedrock).
Compared with the distribution of elements in the reference samples, the distribution of elements in the natural sieved samples shows significant variations in the eight particle size fractions. Depending on which element, the general trend of element concentrations is either increasing or decreasing with particle size fractions. The turning points are mainly at the 0.42–0.25 mm fraction (category 3 in Figure 3 and Figure 4) and the 0.25–0.177 mm fraction (category 4 in Figure 3 and Figure 4).

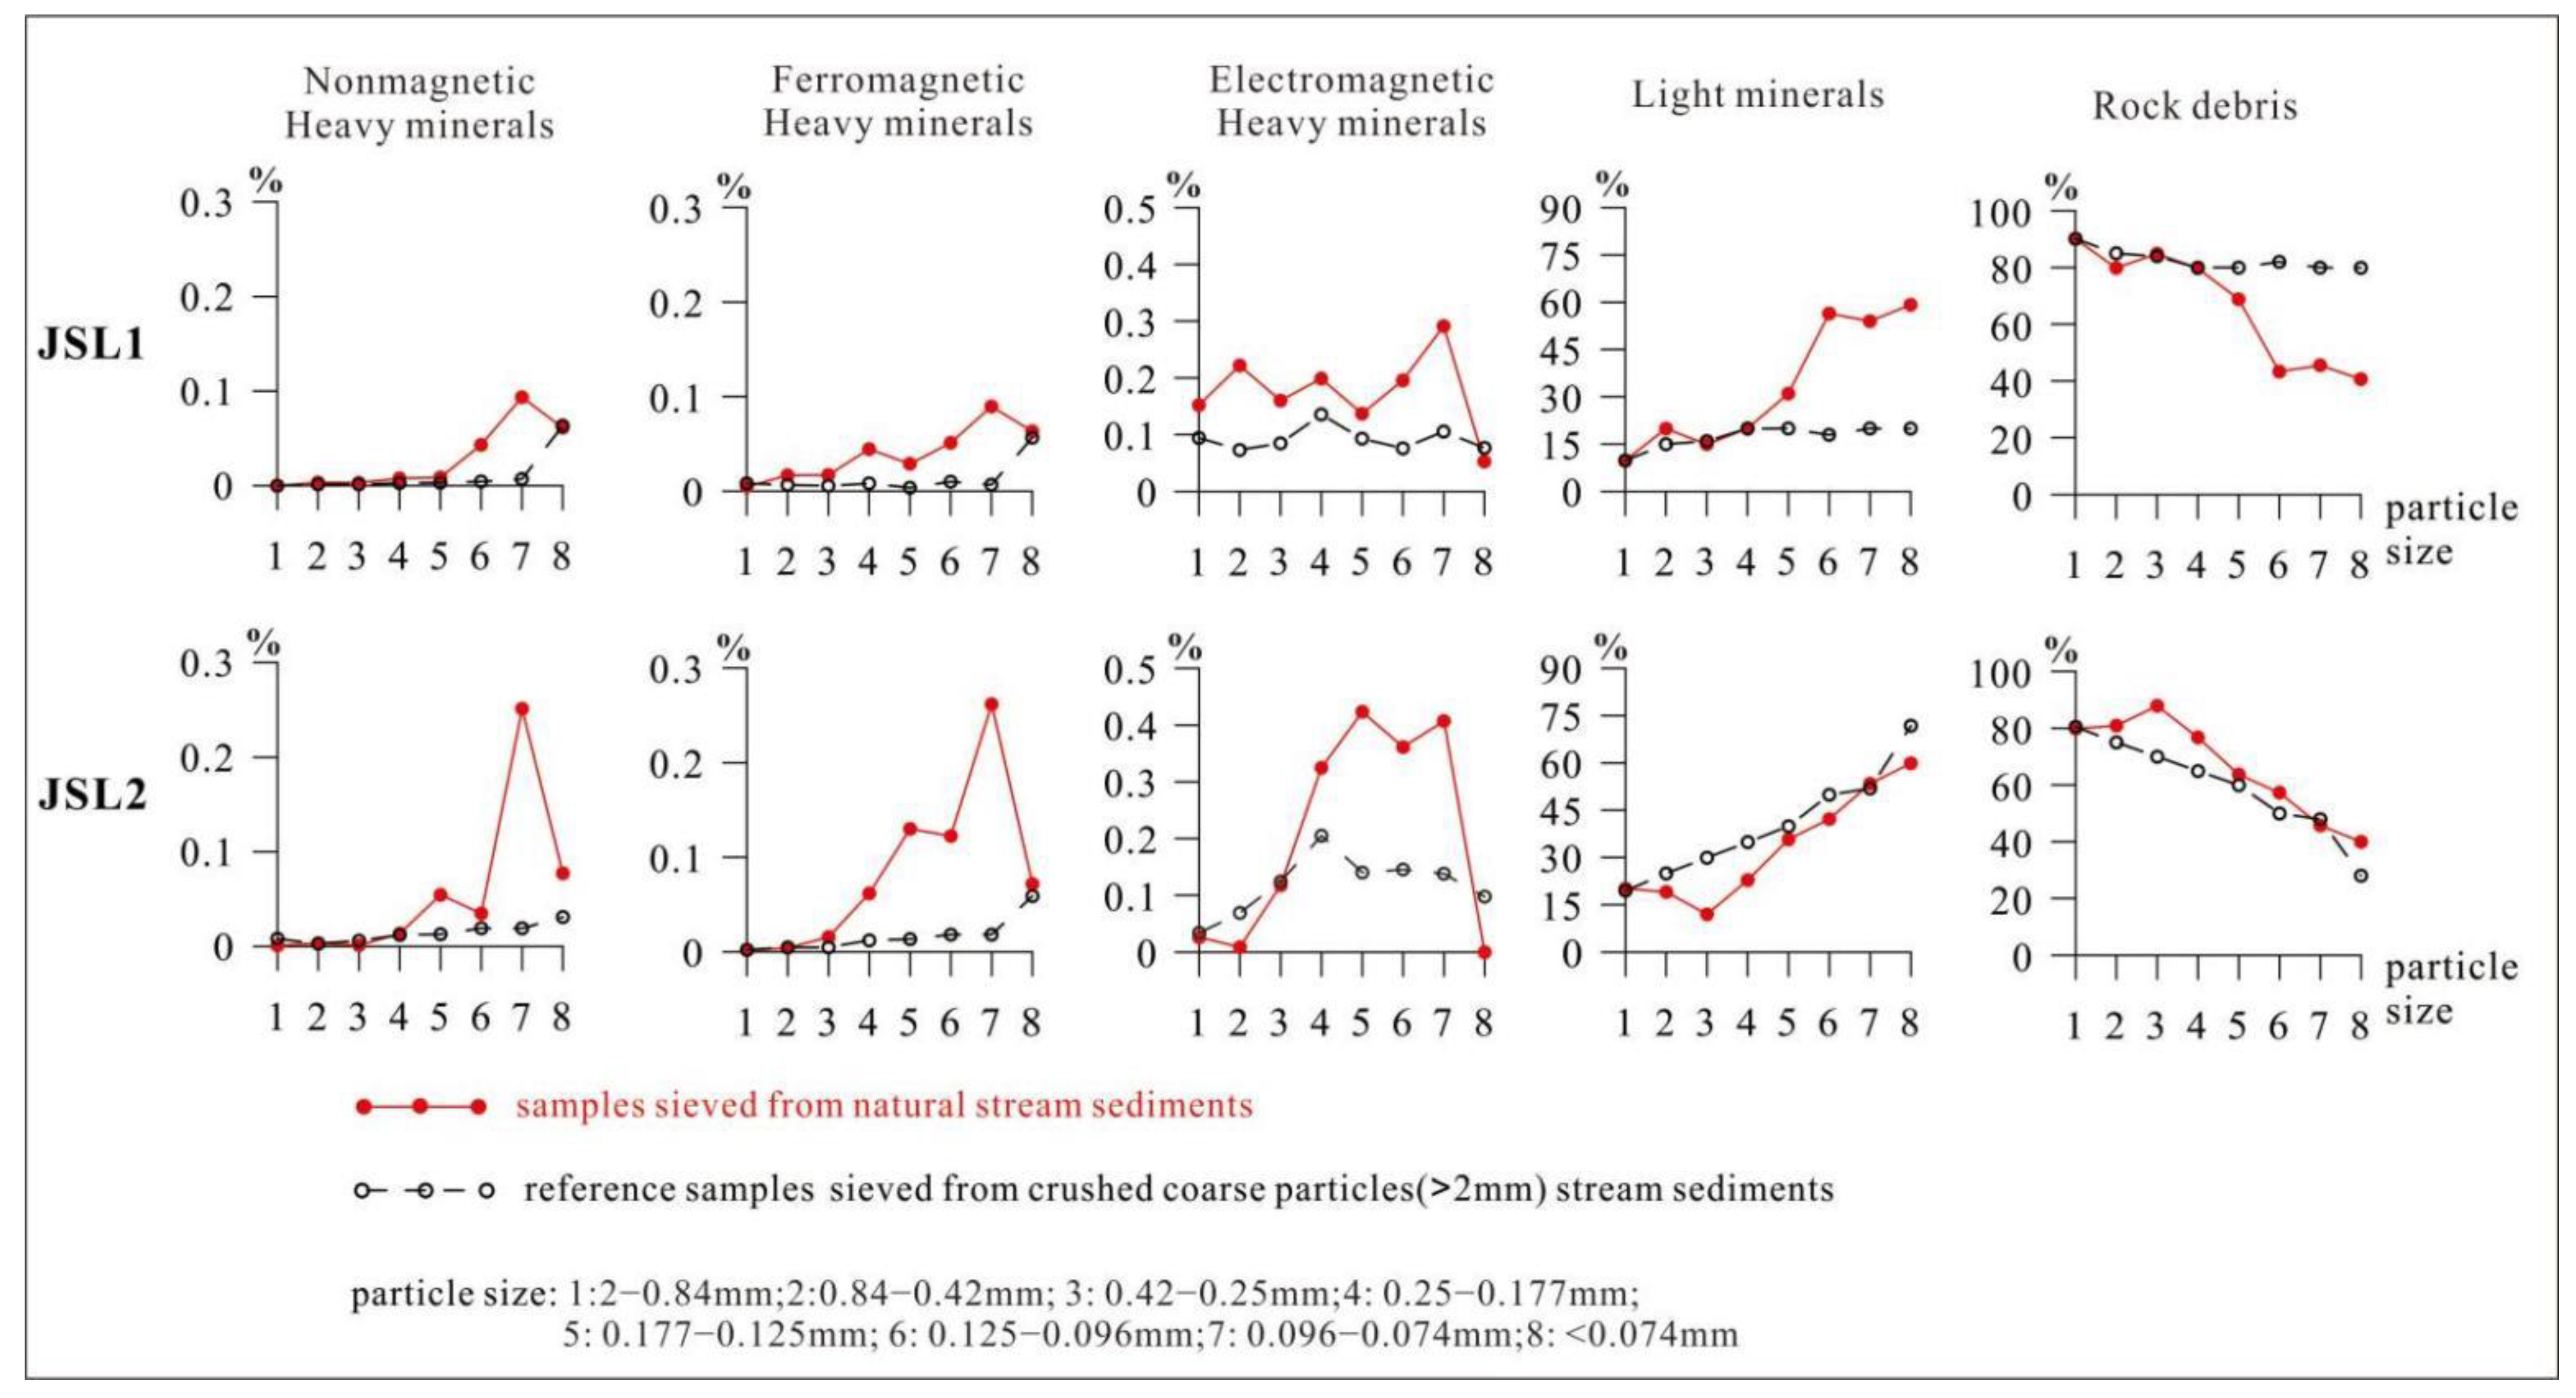
3.2. Distribution of Minerals in Stream Sediments

As is known, rocks are composed of minerals with different specific gravities and minerals are the main carrier of elements. Therefore, the distribution of minerals in the stream sediments was investigated in order to determine the main reason for variations in element concentrations and to analyze further the influence of sample particle size on element distribution in stream sediments [56,57].
Four mineral groups were separated from the stream sediment samples, including nonmagnetic heavy minerals, ferromagnetic heavy minerals, electromagnetic heavy minerals, and light minerals (specific gravity < 2.87 g/cm3). The main single minerals in each mineral group were identified and weighed.
As shown in Figure 5, the distribution of minerals in the natural sieved samples are as follows. (1) As the particle sizes of sediments become smaller, the amount of nonmagnetic heavy minerals, ferromagnetic heavy minerals, electromagnetic heavy minerals, and light minerals increases gradually, whereas rock debris shows a decreasing trend [4,14,58,59]. (2) In the 0.177–0.096 mm particle size fraction (category 6 in Figure 5), most of the heavy minerals are separated, and the rock debris are almost replaced by the four mineral groups. A small amount of rock debris exists in this fraction of sediments, mainly because there is slate, phyllite, and shale in the study area. (3) Electromagnetic heavy minerals are separated well from 0.42–0.25 mm particle size fraction (category 3 in Figure 5), which is relevant to pyrite and hematite–limonite with large particles. (4) Light minerals show a sharp increasing trend from coarse to fine particle sizes, and with relatively low weight percentage in the 0.42–0.25 mm particle size fraction (category 3 in Figure 5). (5) The species and amount of minerals in the samples from JSL2 are higher than that in the samples from JSL1. This indicates that the samples from downstream were carried over a longer distance and the minerals in the downstream samples were separated at a high level. (6) The >0.25 mm fraction of sediments (category 1 + 2 + 3 in Figure 5) are mainly composed of rock debris. The <0.25 mm particle size fraction of sediments (categories 4–9 in Figure 5) has large quantities of minerals separated from rock debris.
The distributions of heavy minerals in the reference samples show a stable curve [60]. From upstream to downstream, the distribution of minerals in stream sediments has little variation. This indicates that the reference samples approximatively represent the original distribution of minerals in the rock.
The main single minerals enriched in the natural sieved samples are zircon, ilmenite, anatase, leucoxene, garnet, hematite–limonite, and altered rock debris, which increase gradually from the 0.42–0.25 mm fraction (category 3 in Figure 5) to fine particle size. Minerals closely associated with the mineralization, such as pyrite, cerussite, scheelite, bismutite, galena, and sphalerite, are enriched in the reference samples, and these minerals were rarely found in the natural sieved samples. This indicates that the <0.25 mm fraction of natural sieved stream sediments is rich in minerals with high specific gravity, high wear resistance, and high breakage resistance, but lacks fragile minerals associated with the mineralization such as galena and sphalerite.

3.3. Relationship between Elements and Minerals in Stream Sediments

Element concentrations in the four mineral groups in the eight particle size fractions were analyzed to study the relationship between elements and minerals in stream sediments. Considering the length of this study, we selected two particle size fractions to discuss. As previously mentioned, the distribution of elements in the different particle size fractions of stream sediments shows that the turning points of element concentrations are mainly at the 0.42–0.25 mm and the 0.25–0.177 mm particle size fractions. The main single minerals enriched in the natural sieved samples increase gradually from the 0.42–0.25 mm fraction to fine particle size fractions.
Therefore, we discuss the element concentrations in the four mineral groups in the 0.84–0.42 mm and 0.177–0.125 mm fractions (Table 2 and Table 3). The 0.84–0.42 mm fraction (category 2 in Figure 3, Figure 4 and Figure 5) is adjacent to the 0.42–0.25 mm fraction (category 3 in Figure 3, Figure 4 and Figure 5), and it was used to represent relatively coarse particle size fractions. The 0.177–0.125 mm fraction (category 5 in Figure 3, Figure 4 and Figure 5) is next to the 0.25–0.177 mm fraction (category 4 in Figure 3, Figure 4 and Figure 5), and it was used to represent relatively fine particle size fractions.
In the same fraction of the reference samples and the natural samples, the elements with the highest concentrations in the same mineral groups were very similar. However, the element concentrations in the four mineral groups were quite different in the two natural particle size fractions (Table 2 and Table 3). The element concentrations in different mineral groups were relatively different [61]. Because of the differences in the main carrier minerals of each element [62,63,64], the element concentrations differed significantly in various mineral materials [15,65,66]. In the 0.84–0.42 mm particle size fraction, the element concentrations in the four mineral groups in the natural samples were consistent with that in the reference samples. However, in the 0.177–0.125 mm particle size fraction, the element concentrations in the four mineral groups in the natural samples were relatively inconsistent with that in the reference samples (Table 2 and Table 3).
In streams, rock debris is moved and crushed in water, and it becomes progressively smaller by collision and abrasion. In this process, minerals with different specific gravities are separated. The migration distance and deposition location of minerals along streams are different because of their differences in specific gravity [67,68,69,70,71]. During migration, the original association of minerals and the element associations in the rock debris are changed, resulting in changes in the geochemical distribution of elements in stream sediments [72,73,74].

3.4. Component of the <0.25 mm Fraction of Stream Sediment

The previous discussion has proven that the 2–0.25 mm particle size fraction of stream sediments is mainly composed of rock debris.
It is worth mentioning that clay is developed in the study area. Some studies have shown that clay minerals can adsorb metal ions [75,76,77,78], and this can influence the distribution of elements in stream sediments [78]. Therefore, granulometrical analysis of the <0.25 mm particle size fraction sediments was carried out. The results show that about 10% of the <0.25 mm particle size fraction sediment is clay, which is inconsistent with the strata composition (Table 4).
Due to the high clay content in the <0.25 mm particle size fraction of samples, organic carbon concentrations in the samples were determined (Table 5) to study their distribution. As is known, concentrations of organic carbon in terrigenous materials are related to organic matter [79,80,81,82,83]. Some studies have shown that organic matter can seriously interfere with the results of a stream sediment geochemical survey [84,85]. Less influence could be observed when concentration of organic carbon in the sample is <1.5%, whereas significant enrichment of many elements could occur when the concentration of organic carbon is >1.5%. However, this could be avoided if the 2–0.25 mm particle size fraction is sampled in a stream sediment geochemical survey, so as to obtain geochemical data that can adequately reflect the geological situation in the surveyed area [86].
In this study, the average organic carbon concentration in the <0.25 mm particle size fraction samples are is 3.27%, organic carbon concentrations in most of the samples studied are over 2%, and the highest content of organic carbon is 10.36% (Table 5). For comparing and analyzing the influence of organic matter, concentrations of organic carbon in the 2–0.25 mm particle size fraction samples were also determined. The results show that the minimum and maximum concentrations of organic carbon in the 2–0.25 mm particle size fraction are <1% and <2%, respectively. Thus, little influence on the concentration of elements could be found in the 2–0.25 mm particle size fraction of stream sediments, whereas significant enrichment for many elements would occur in the <0.25 mm particle size fraction of stream sediments. Therefore, it can also be deduced that stream sediment geochemical surveys that use the 2–0.25 mm particle size fraction of samples will provide results that are better than those that use the <0.25 mm particle size fraction of samples in a study area.

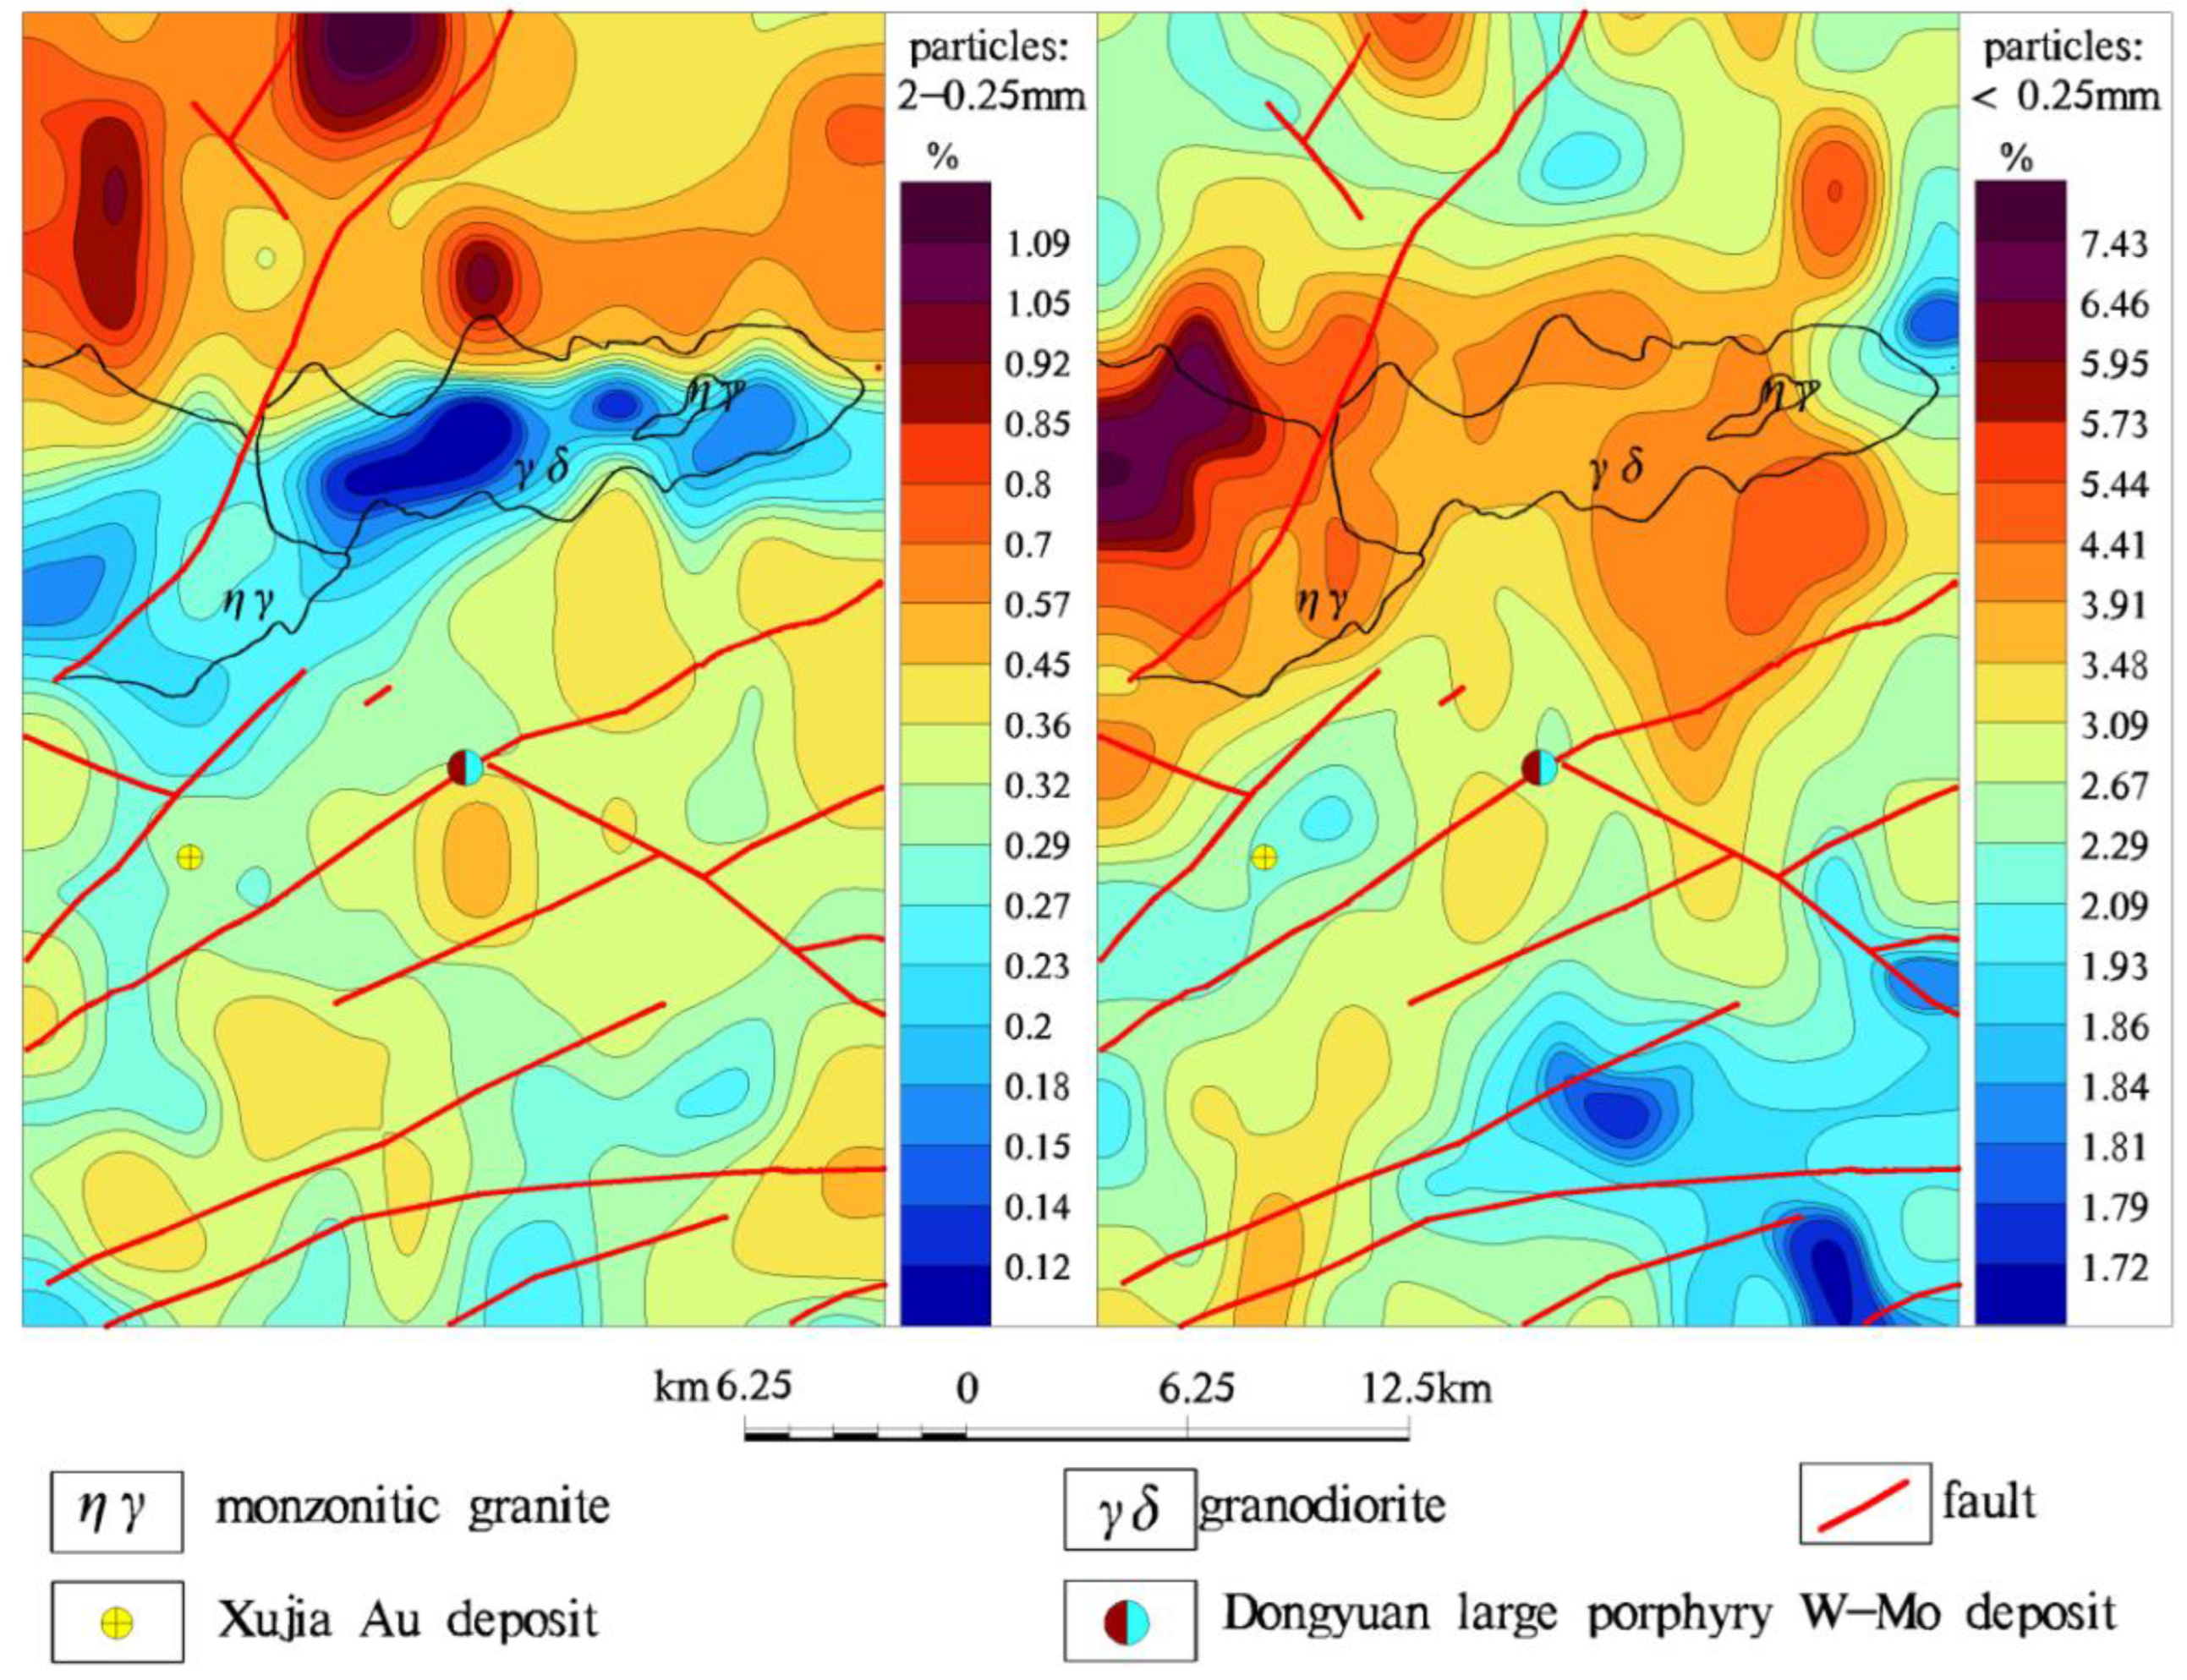
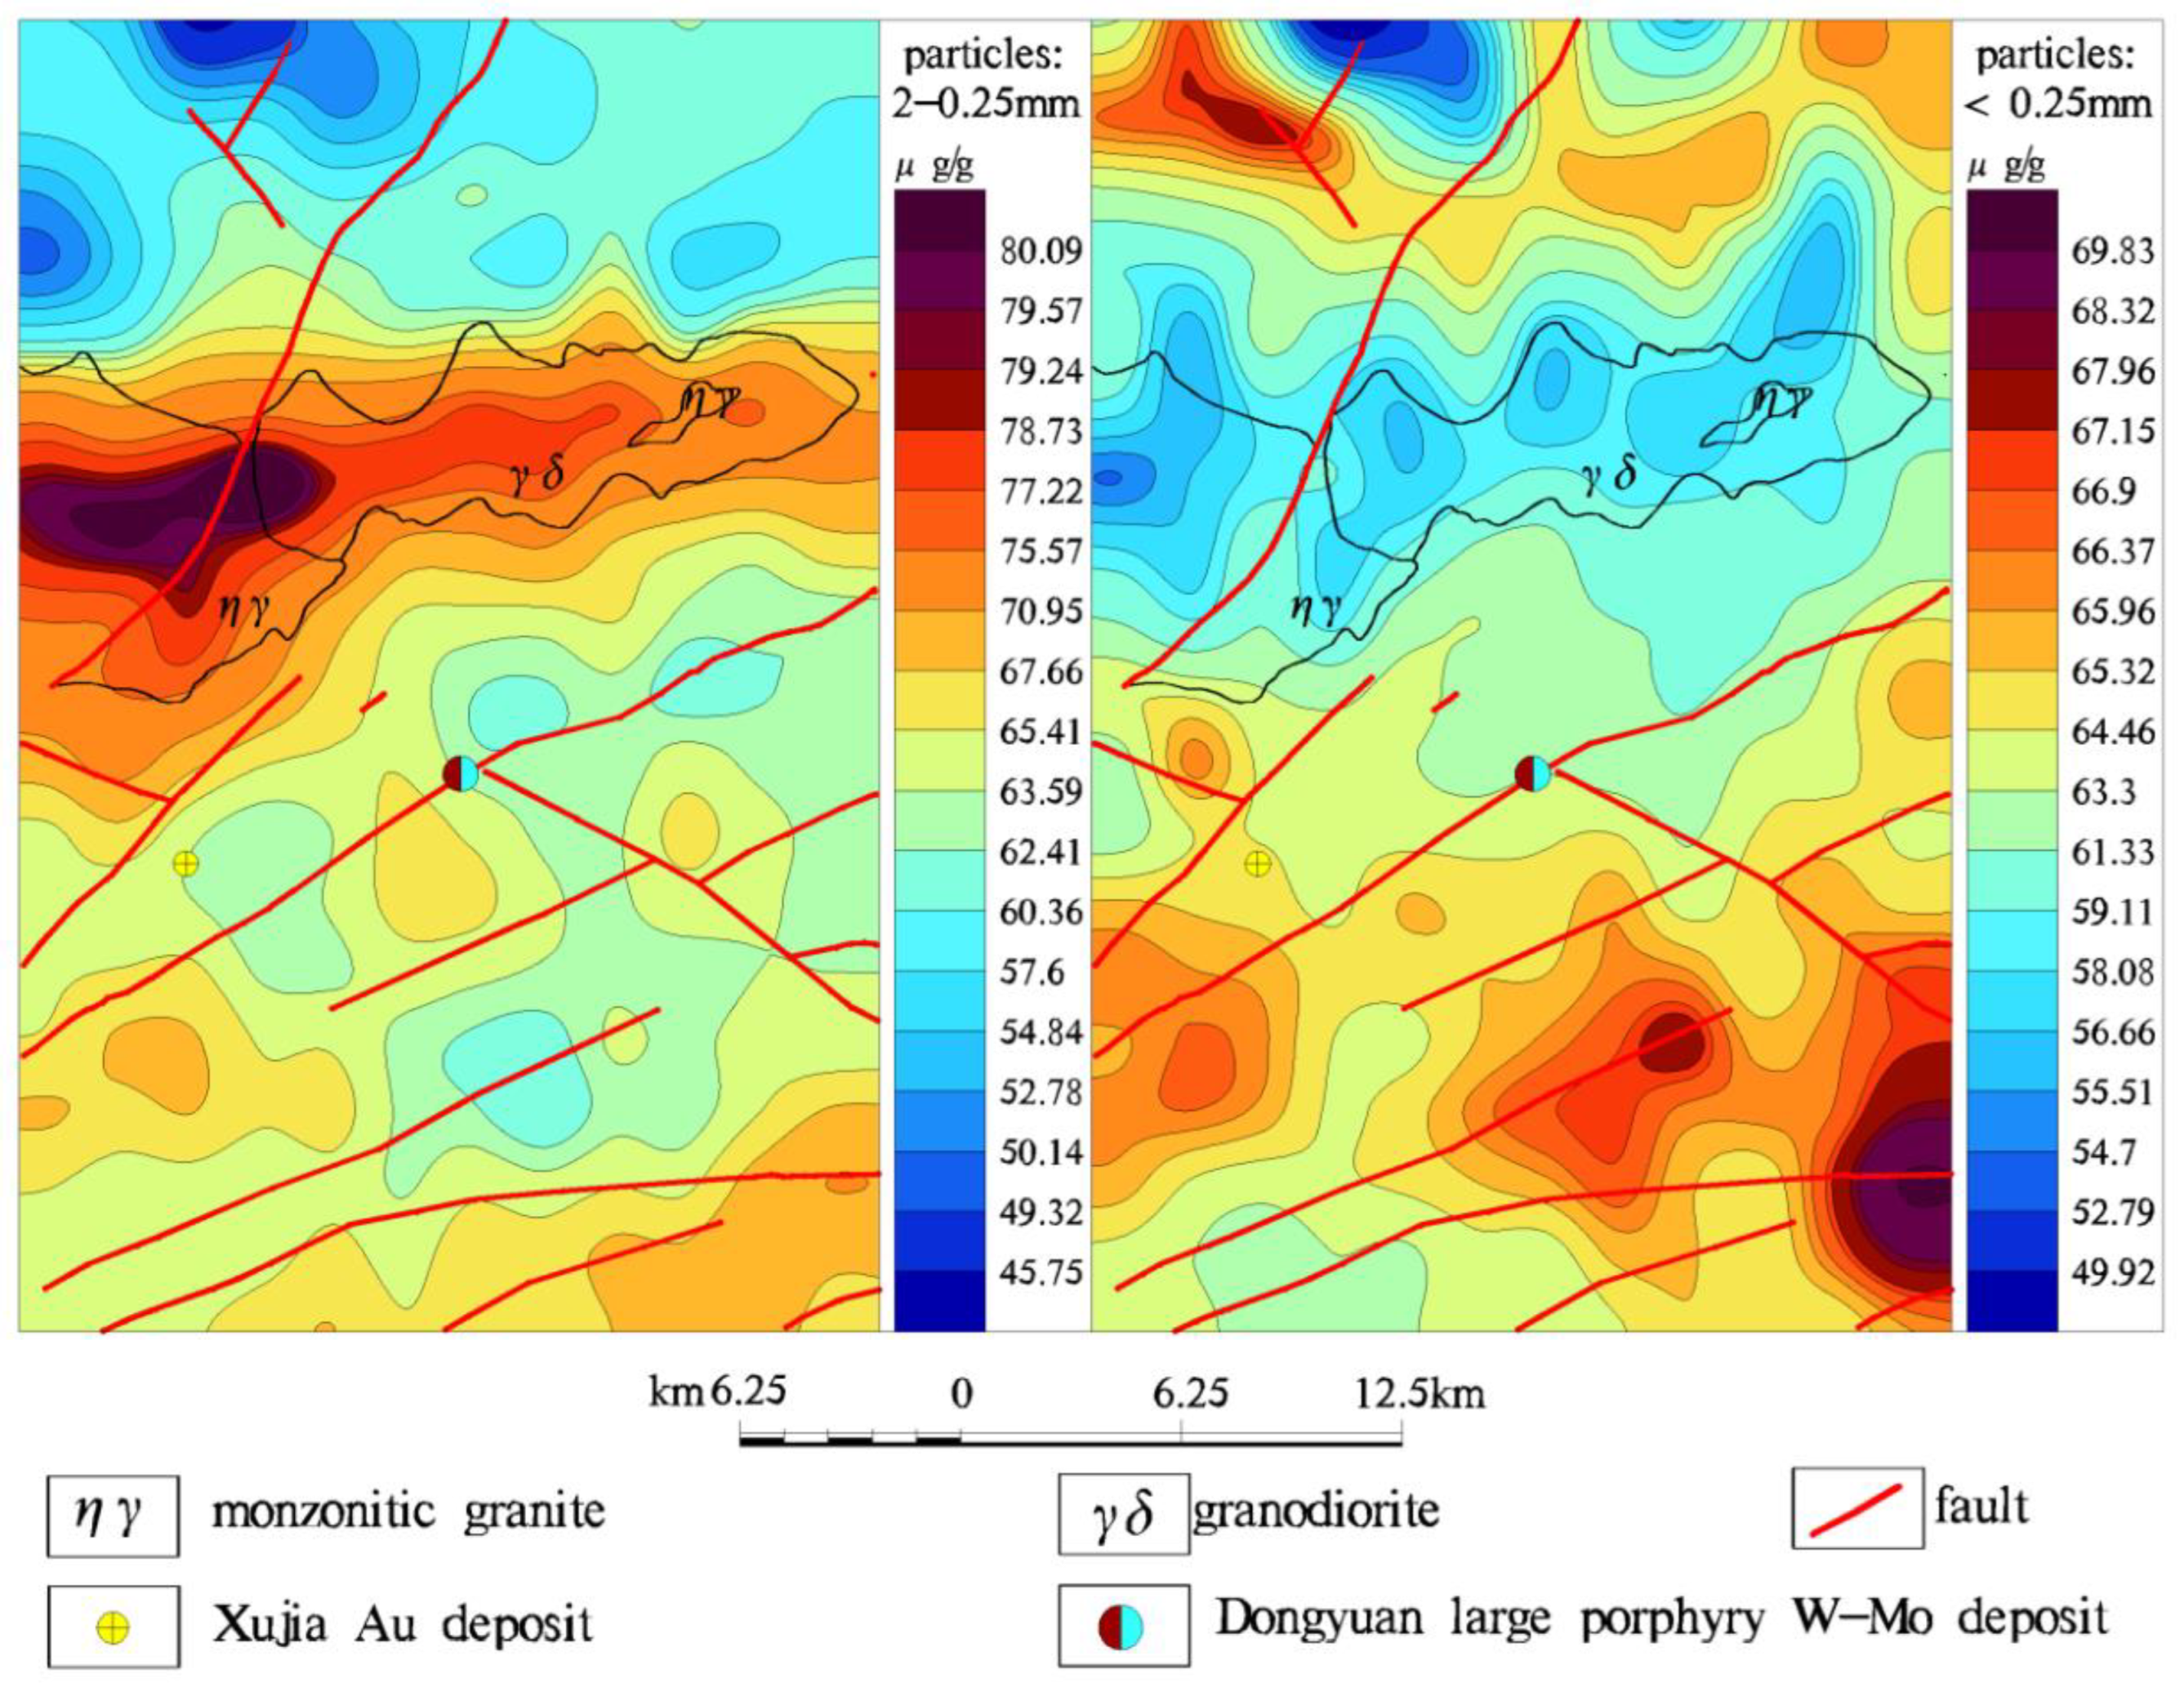
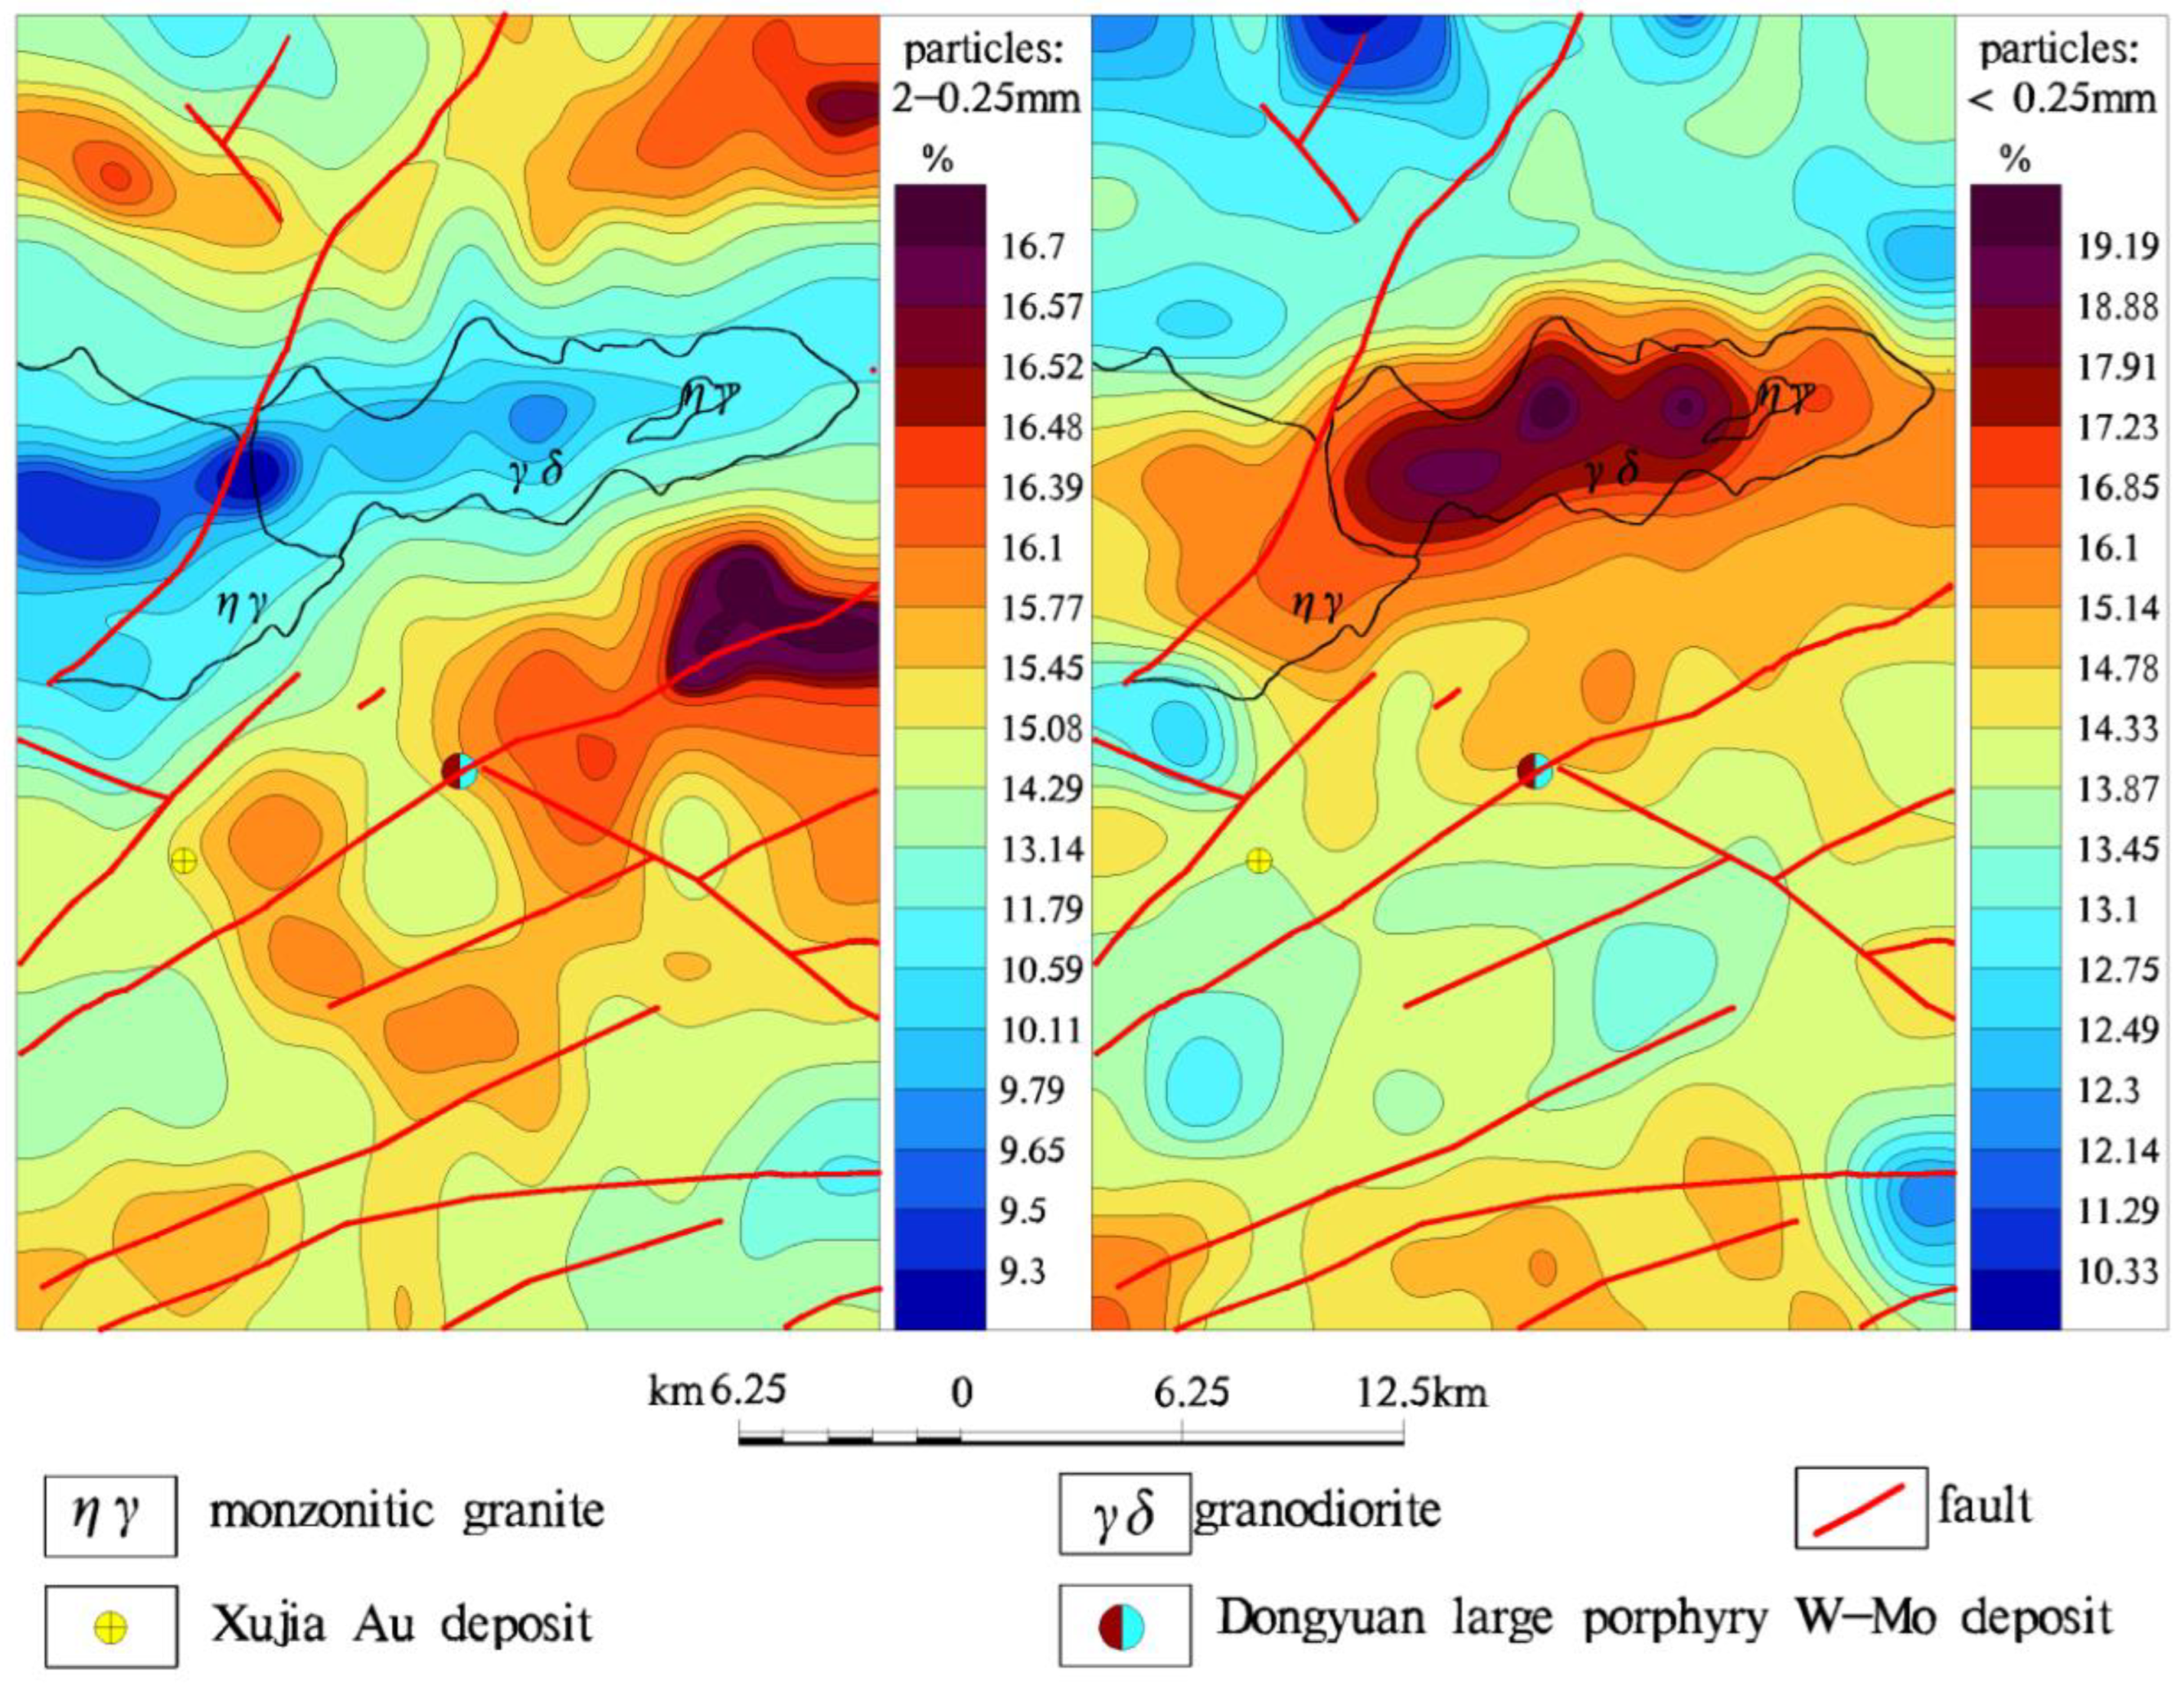
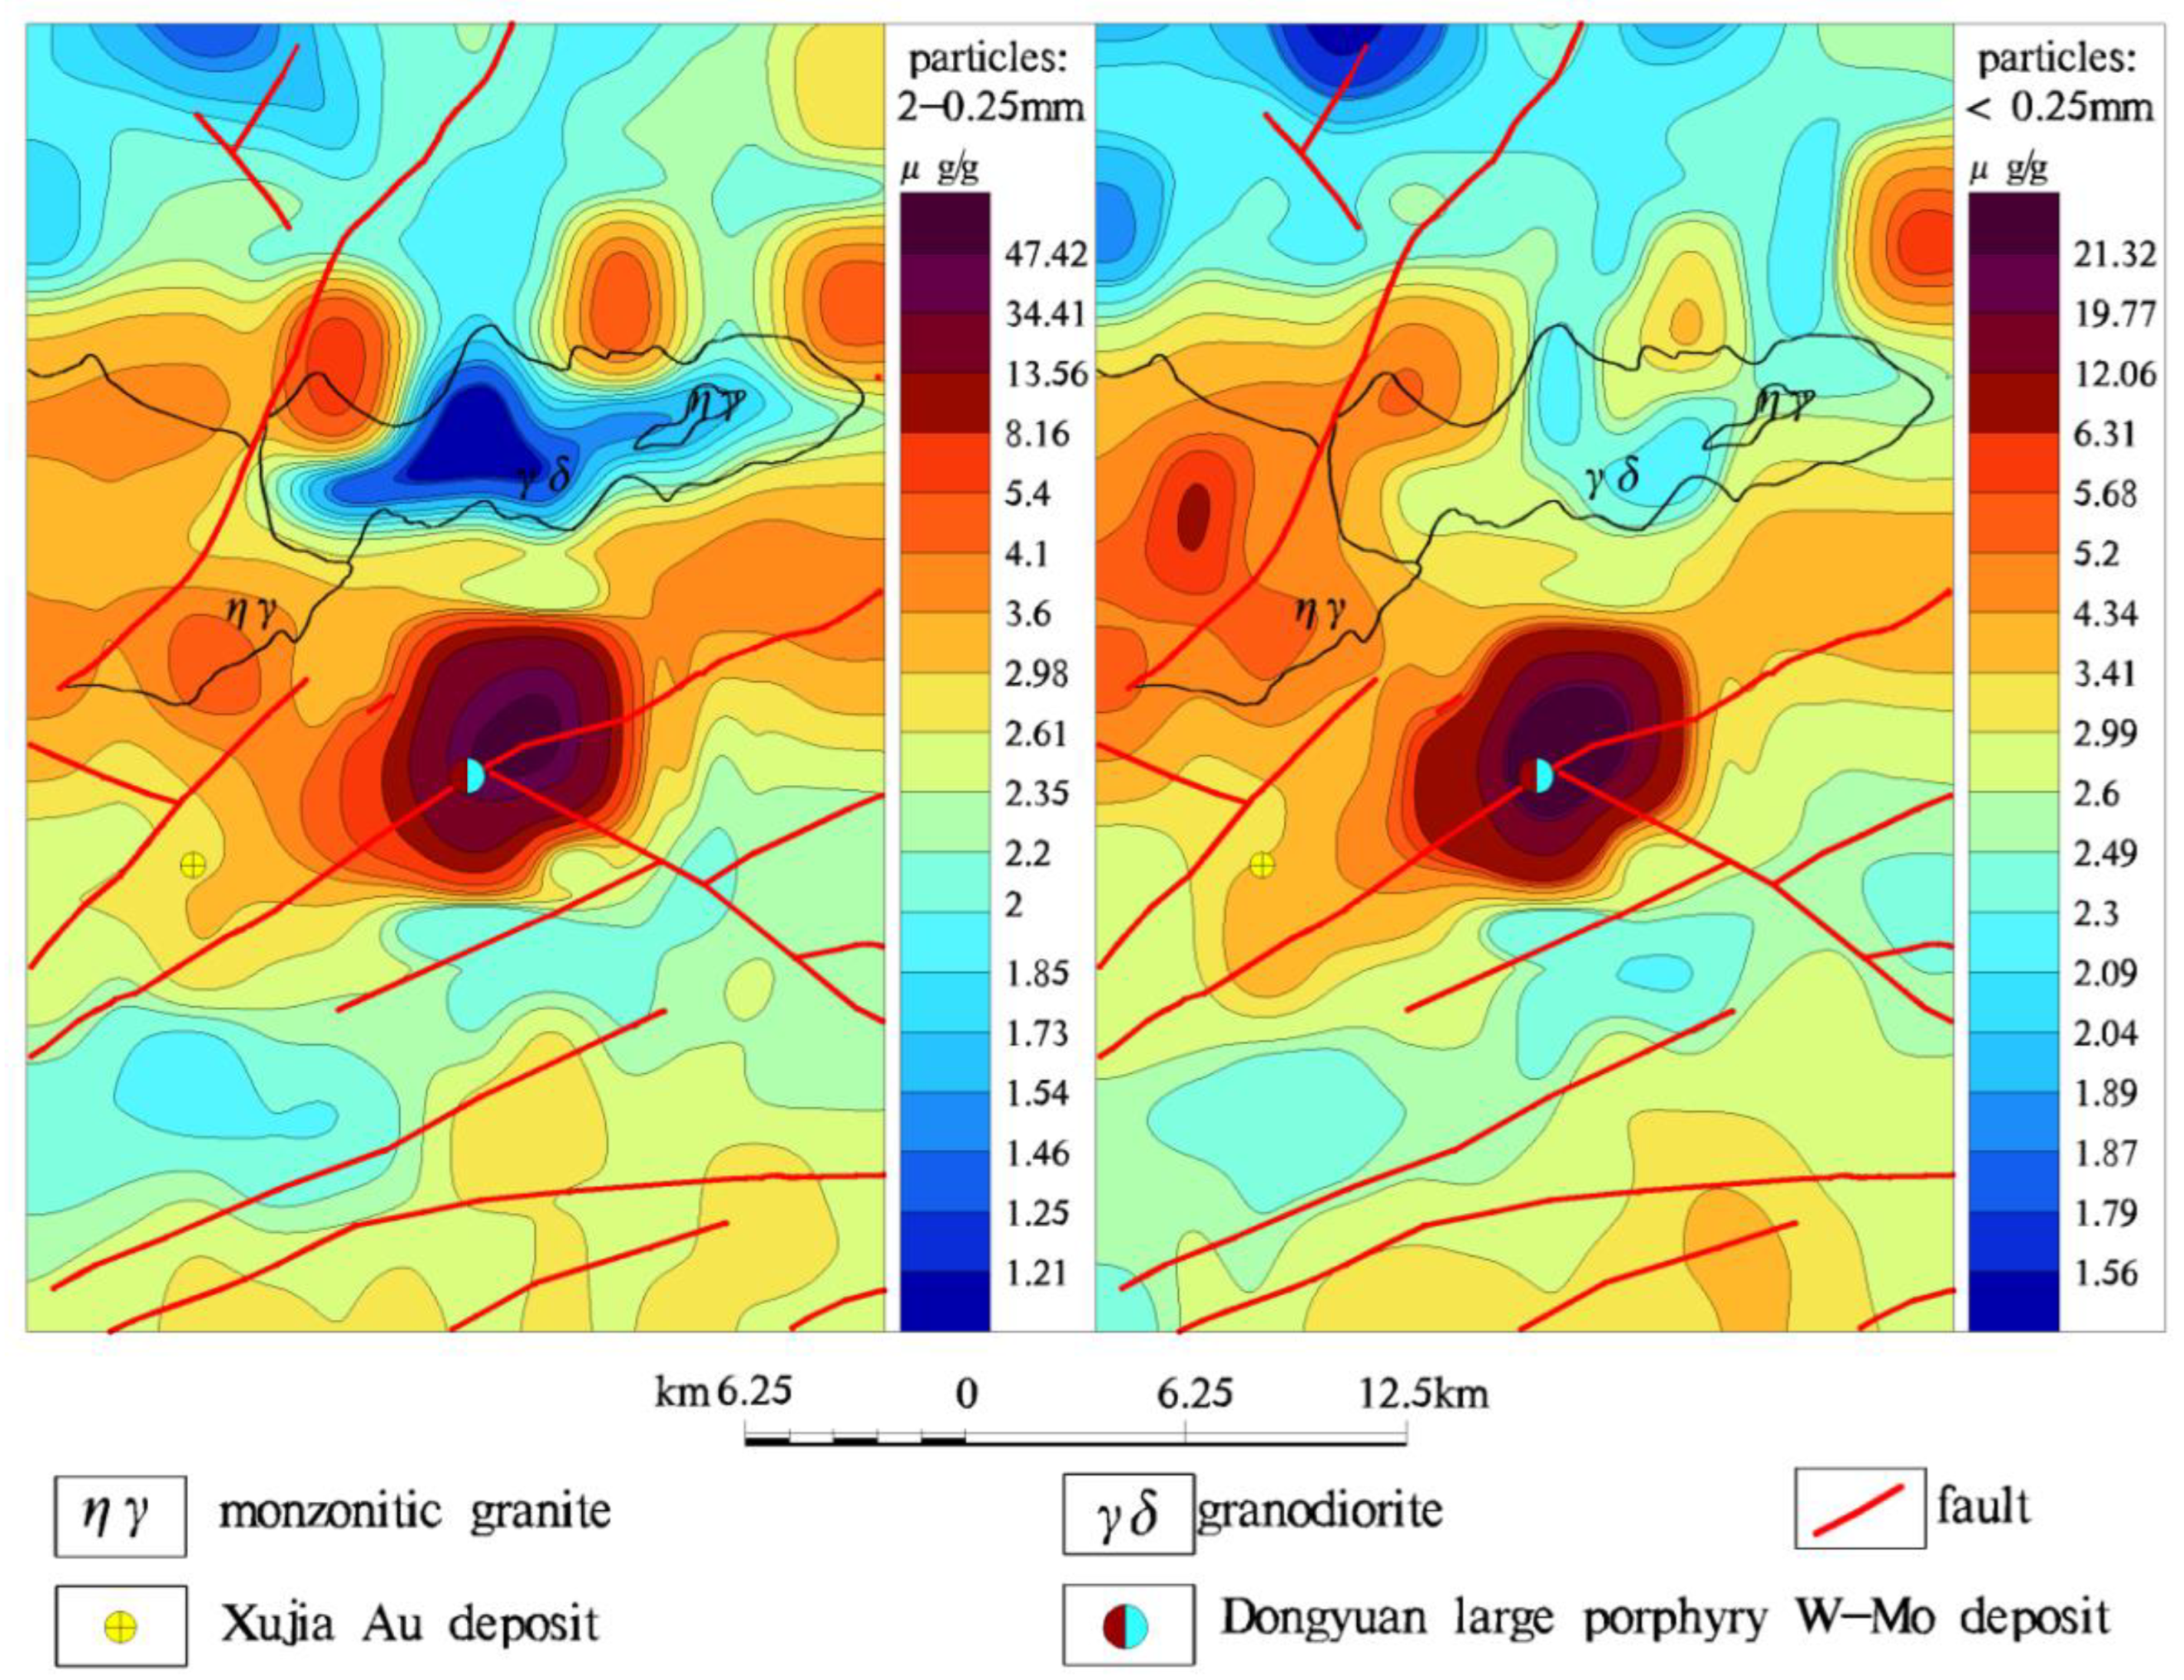
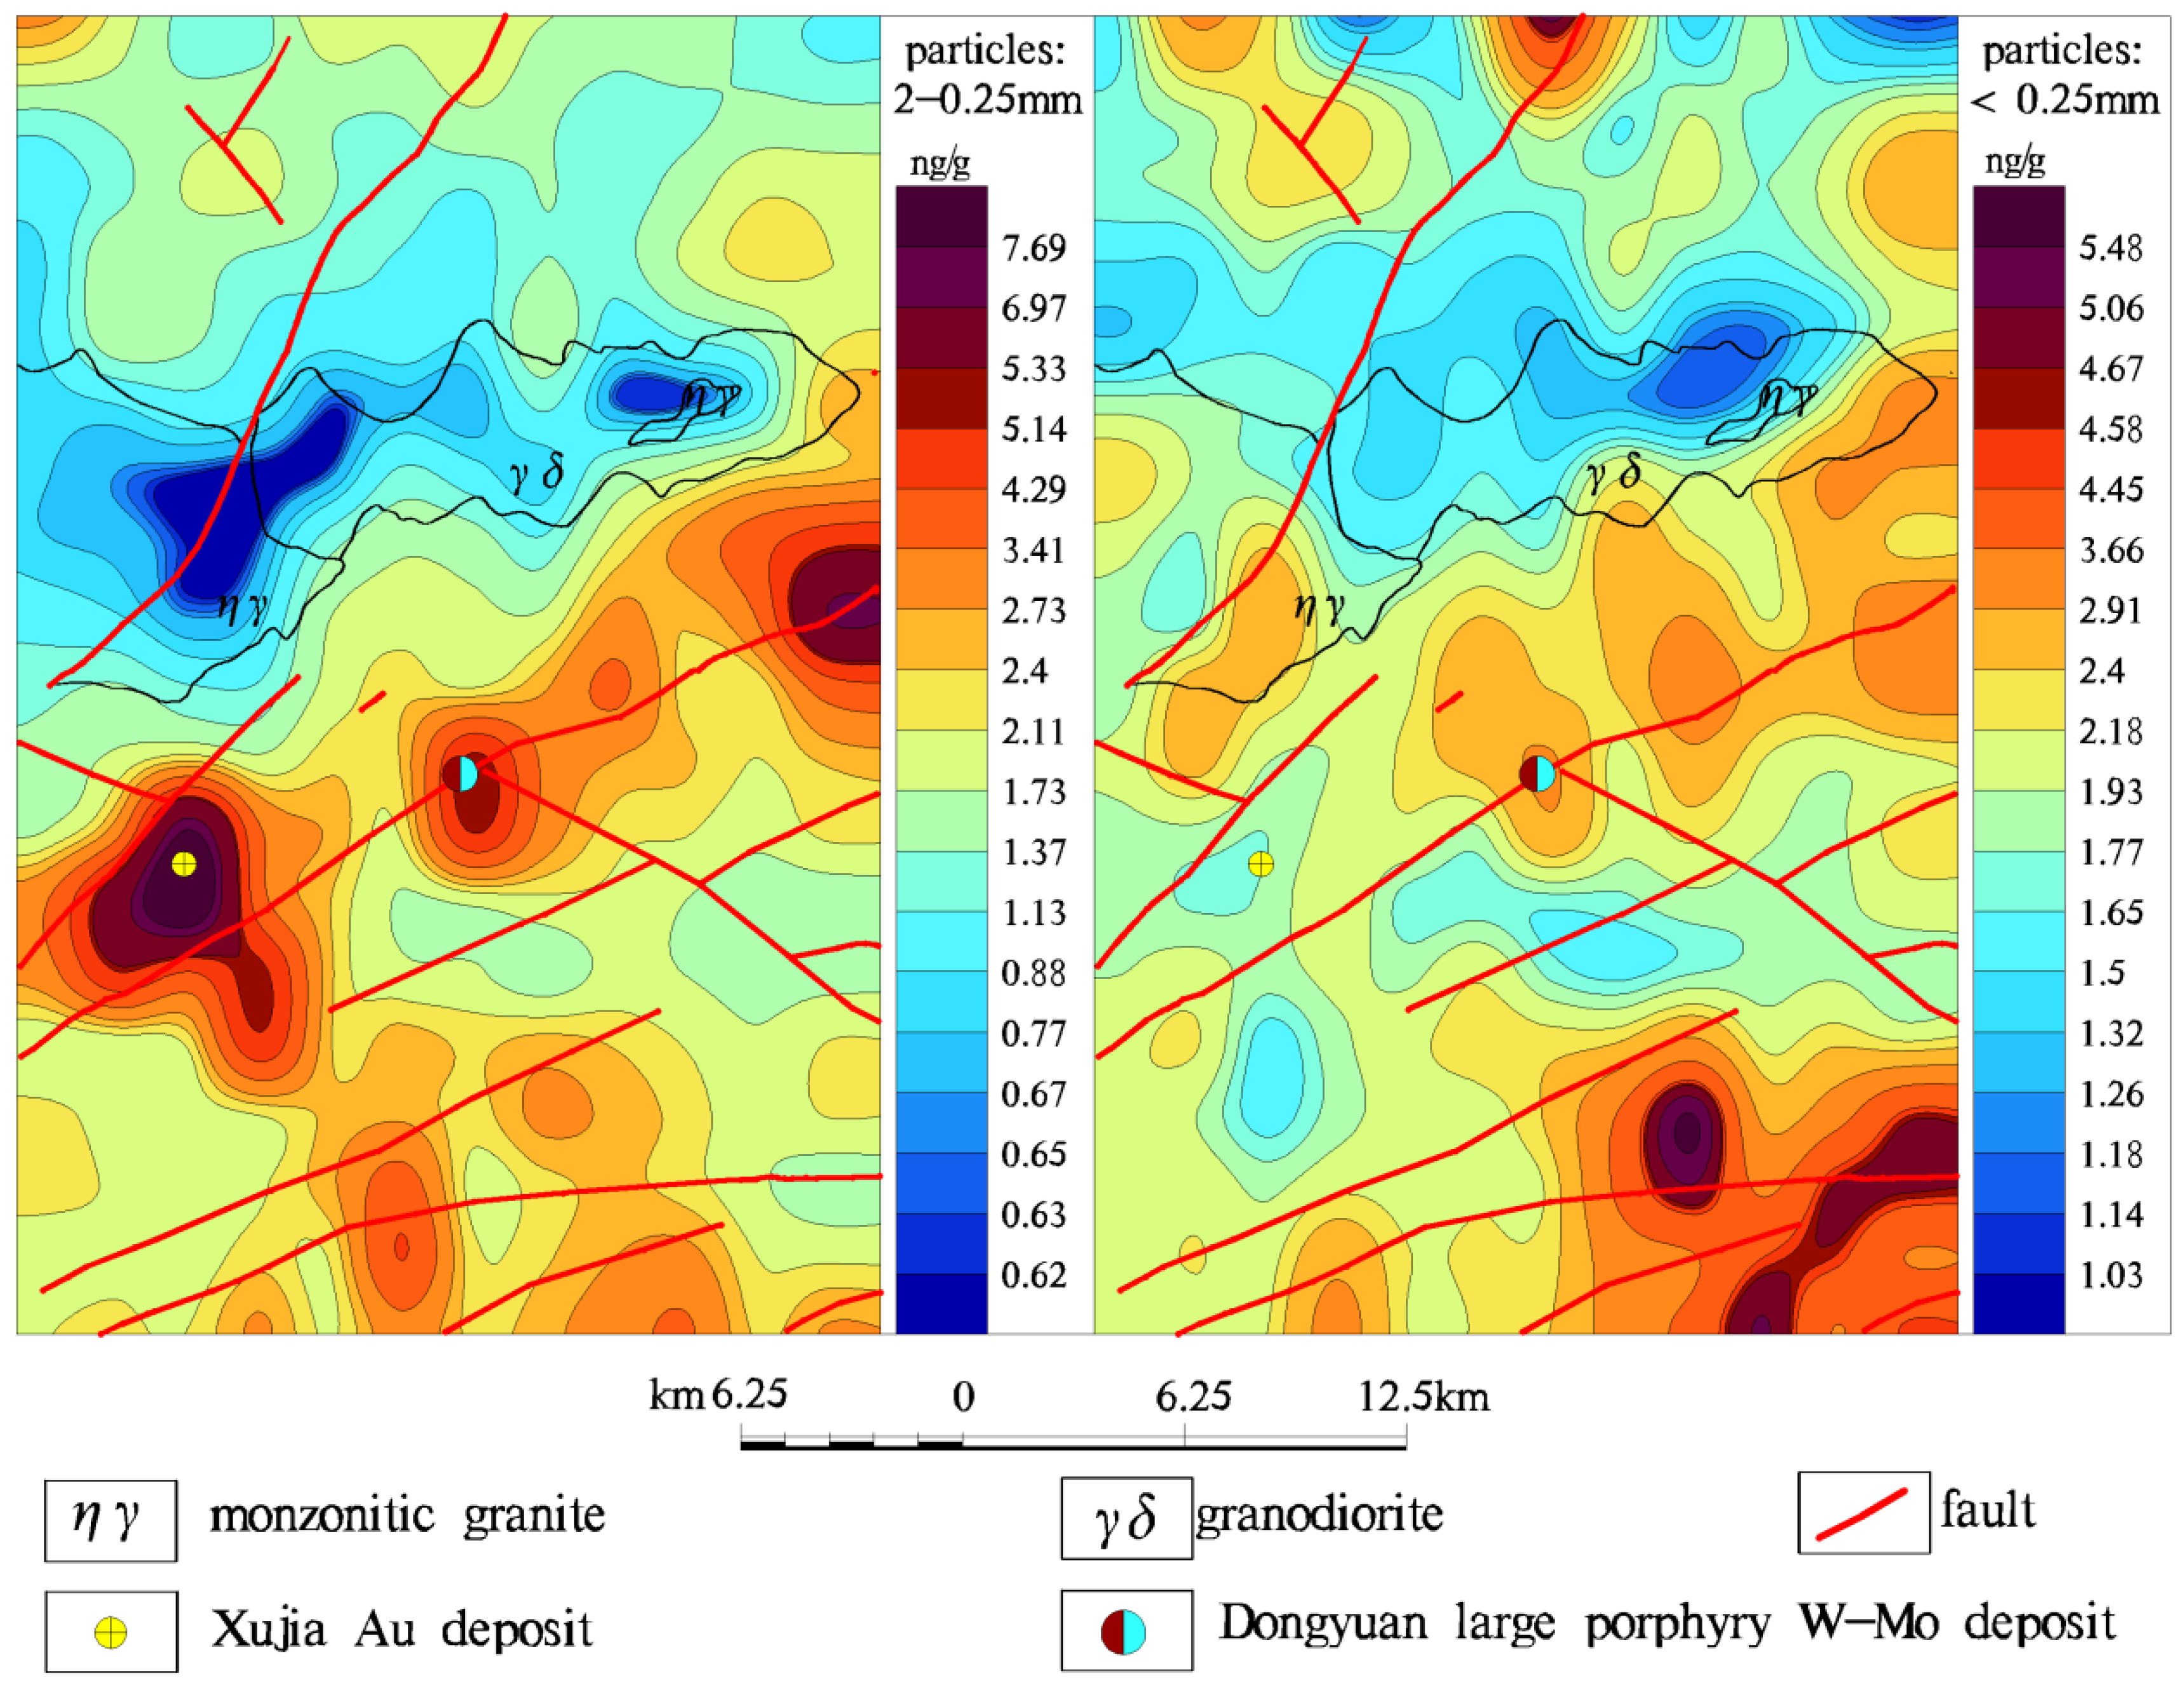
3.5. Results of Stream Sediment Geochemical Survey in the Experimental Area

The element concentration data from the stream sediment geochemical survey were used to draw geochemical contour maps. The data were prepared for the normal distribution test and gridding. The data gridding method used was kriging. The classification of the data for the geochemical mapping was determined using the cumulative frequency method. The data gridding and geochemical map preparation were conducted using the software Jinwei Geoscience Information Processing Applications (GeoIPAS). The search radius used was 5 km, and the movement spacing used was 2 km.
As shown in Figure 1, there is a large outcrop area of intrusive rocks with a low level of weathering in the north–central part of the study area. The lithology of these rocks is granodiorite (γδ) and monzogranite (ηγ), which are rich in silicon but low in aluminum.
The geochemical maps of organic carbon (Figure 6) illustrate that low concentrations of organic matter in the 2–0.25 mm particle size fraction samples coincide with the intrusive geologic body (granodiorite, monzogranite, low-scale organic matter). In contrast, concentrations of organic matter in the <0.25 mm particle size fraction of samples are significantly variable over the intrusive rocks, and thus show little correlation with the intrusive rocks.
The geochemical maps of SiO2 (Figure 7) and Al2O3 (Figure 8) show that variations in concentrations of these two oxides in the 2–0.25 mm particle size fraction of samples are consistent with the shape and extent of the intrusive rocks. As mentioned above, these intrusive rocks have a high level of silicon and low level of aluminum [25,31,35]. In contrast, the concentrations of these two oxides in the <0.25 mm particle size fraction are inconsistent with the geochemical characteristics of intrusive rocks.
However, the geochemical maps of W show that the two studied particle size fractions of stream sediments can be used to delineate geochemical anomalies of W associated with the W–Mo deposit (Figure 9). It is well-known that scheelite (CaWO4) is one of the two tungsten ore minerals, and it is exploited mainly from skarn deposits and porphyry-type deposits. It has well-developed cleavage, and it is brittle [87]. Scheelite was found in all the particle size fractions of stream sediments during the mineral identification stage of this study. Therefore, both of the discussed particle size fractions of stream sediments can help to delineate this large W-Mo deposit.
The geochemical maps of Au of the two studied size fractions exhibit a couple of significant contrasting features (Figure 10). Firstly, the geochemical anomaly intensity and scale delineated by the 2–0.25 mm particle size fraction of samples are better than those by the <0.25 mm particle size fraction of samples. Secondly, a deposit-related anomaly of Au with high intensity was delineated in the area by using the 2–0.25 mm particle size fraction samples. This Au anomaly later led to discovery of a new gold deposit. However, no deposit-related Au anomaly was delineated by using the <0.25 mm particle size fraction of samples.
Therefore, the results of the stream sediment geochemical survey in the pilot area proved that using the 2–0.25 mm particle size fraction of samples was better than using the <0.25 mm particle size fraction of samples, especially in the aspect of ore-prospecting and delineating geological bodies. The probable major causes for this finding are the two following points.
(1) The 2–0.25 mm fraction of sediments is composed mainly of debris of various minerals from broken bedrock upstream. This particle size fraction can reflect well the real distribution of element concentrations in the study area. However, the <0.25 mm particle size fraction of sediments is composed mainly of clay, some individual minerals separated from debris, and organic matter. The <0.25 mm particle size fraction of sediments could not reflect the real distribution of element concentrations in the study area.
(2) Due to organic matter and clay in the samples of the <0.25 mm particle size fraction, the data represent secondary enrichment or depletion in the supergene environment, and so the geochemical maps of SiO2 and Al2O3 do not reflect the actual geochemical characteristics of bedrock.

4. Conclusions

The single mineral species and quantity vary with the particle size fractions of stream sediments. As stream sediments become finer and finer, minerals in the sediments are separated and deposited in different places along the stream. In this study, the separation of minerals in stream sediments mainly occurred in the <0.25 mm particle size fractions.
The concentration of elements in stream sediments with different particle size fractions is different. The stream sediment geochemical survey in the pilot area has proven that using 2–0.25 mm as the sampling particle size fraction was better than using <0.25 mm as the sampling particle size fraction, both in the aspect of geochemical prospecting and geological body delineation. Therefore, the suggested sampling particle size fraction for stream sediment geochemical survey in the humid to semi-humid low mountain landscape in eastern China is 2–0.25 mm.

Author Contributions

Conceptualization, F.Y., M.K. and S.X.; methodology, F.Y.; software, L.N., Y.S. and W.H.; validation, F.Y., M.K. and S.X.; formal analysis, F.Y. and L.N.; investigation, F.Y., Y.S., C.W., W.H. and Q.W.; data curation, F.Y. and Z.G.; writing—original draft preparation, F.Y. and M.K.; writing—review and editing, E.J.M.C. and S.X.; visualization, Y.S., C.W., W.H. and Q.W.; supervision, F.Y. and M.K.; project administration, F.Y.; funding acquisition, F.Y. and M.K. All authors have read and agreed to the published version of the manuscript.

Funding

This research was financed by the National Nonprofit Institute Research Grant of IGGE (No. AS2020Y06 and No. AS2020J06), the National Resources Survey Projects (No. DD20221641), and the support from the Natural Science Foundation of China (No. 41773030 and No. 41872250).

Data Availability Statement

The data used in this paper is offline and initially from our program. All the data can be found in the data center of Institute of Geophysical and Geochemical Exploration, Chinese Academy of Geological Sciences (IGGE, Langfang 065000, Hebei, China). These data can be accessed by relevant researchers through corresponding data collection procedures of China Geological Survey.

Acknowledgments

The authors would like to thank all our colleagues who participated in the project. The authors greatly appreciate the time and effort spent by the anonymous reviewers in assessing and critiquing this manuscript. Their efforts have resulted in significant improvements in the paper. The authors would also like to acknowledge the Central Chemical Laboratory of the Institute of Geophysical and Geochemical Exploration, Chinese Academy of Geological Sciences, and the Heibei Institute of Regional Geological and Mineral Resource Survey.

Conflicts of Interest

The authors declare no conflict of interest.

References

  1. Xie, X.J.; Sun, H.Z.; Ren, T.X. Regional geochemistry—National reconnaissance project in China. J. Geochem. Explor. 1989, 33, 1–9. [Google Scholar] [CrossRef]
  2. Day, S.; Fletcher, K. Particle size and abundance of gold in selected stream sediments, southern British Columbia, Canada. J. Geochem. Explor. 1986, 26, 203–214. [Google Scholar] [CrossRef]
  3. Ren, T.X.; Zhao, Y.; Zhang, H.; Yang, S.P. Regional geochemical surveys in arid and semiarid regions in the middle and western part of Inner Mongolia. J. Geochem. Explor. 1989, 33, 11–26. [Google Scholar] [CrossRef]
  4. Horowitz, A.J.; Elrick, K.A. The relation of stream sediment surface area, grain size and composition to trace element chemistry. Appl. Geochem. 1987, 2, 437–451. [Google Scholar] [CrossRef]
  5. Rawlins, B.G.; Turner, G.; Mounteney, I.; Wildman, G. Estimating specific surface area of fine stream bed sediments from geochemistry. Appl. Geochem. 2010, 25, 1291–1300. [Google Scholar] [CrossRef] [Green Version]
  6. Guagliardi, I.; Apollaro, C.; Scarciglia, F.; Rosa, R.D. Influence of particle size on geochemical distribution of stream sediments in the Lese river catchment, southern Italy. Biotechnol. Agron. Soc. Environ. 2013, 17, 43–55. [Google Scholar]
  7. von Eynatten, H.; Tolosana-Delgado, R.; Karius, V.; Bachmann, K.; Caracciolo, L. Sediment generation in humid Mediterranean setting: Grain-size and source-rock control on sediment geochemistry and mineralogy (Sila Massif, Calabria). Sediment. Geol. 2016, 336, 68–80. [Google Scholar] [CrossRef]
  8. El-Kammar, A.; El-Wakil, M.; Abd El-Rahman, Y.; Fathy, M.; Abdel-Azeem, M. Stream sediment geochemical survey of rare elements in an arid region of the Hamadat area, Central Eastern Desert, Egypt. Ore Geol. Rev. 2019, 117, 103287. [Google Scholar] [CrossRef]
  9. Lancianese, V.; Dinelli, E. Geochemical mapping based on geological units: A case study from the Marnoso-arenacea formation (Northern Apennines, Italy). Chem. Erde 2016, 76, 197–210. [Google Scholar] [CrossRef]
  10. Watt, J.T.; Tooms, J.S.; Webb, J.S. Geochemical dispersion of niobium from pyochlore-bearing carbonatites in Northern Rhodesia. Trans. Inst. Min. Metall. Sect. B 1962, 72, 729–747. [Google Scholar]
  11. Bugrov, V. Geochemical sampling techniques in the Eastern Desert of Egypt. J. Geochem. Explor. 1974, 3, 67–75. [Google Scholar] [CrossRef]
  12. Tessier, A.; Campbell, P.G.C.; Bisson, M. Particulate trace metal speciation in stream sediments and relationships with grain size: Implications for geochemical exploration. J. Geochem. Explor. 1982, 16, 77–104. [Google Scholar] [CrossRef]
  13. Beeson, R. The use of the fine fractions of stream sediments in geochemical exploration in arid and semi-arid terrains. J. Geochem. Explor. 1984, 22, 119–132. [Google Scholar] [CrossRef]
  14. Mudroch, A.; Duncan, G.A. Distribution of metals in different size fractions of sediment from the Niagara River. J. Great Lakes Res. 1986, 12, 117–126. [Google Scholar] [CrossRef]
  15. Brook, E.J.; Moore, J.N. Particle-size and chemical control of As, Cd, Cu, Fe, Mn, Ni, Pb, and Zn in bed sediment from the Clark Fork River, Montana (U.S.A.). Sci. Total Environ. 1988, 76, 247–266. [Google Scholar] [CrossRef]
  16. Fletcher, W.K. Stream sediment geochemistry in today’s exploration world. In Geophysics and Geochemistry at the Millennium, Proceedings of the Exploration 97: 4th Decennial International Conference on Mineral Exploration, Toronto, Canada, 14–18 September 1997; Gubins, A.G., Ed.; Prospectors and Developers Association of Canada: Toronto, ON, Canada, 1997; pp. 249–260. [Google Scholar]
  17. Melo, G., Jr.; Fletcher, W.K. Dispersion of gold and associated elements in stream sediments under semi-arid conditions, northeast brazil. J. Geochem. Explor. 1999, 67, 235–243. [Google Scholar] [CrossRef]
  18. Cohen, D.R.; Dunlop, A.C.; Rose, T. Contrasting dispersion patterns for gold in stream sediments at Timbarra, NSW, Australia. J. Geochem. Explor. 2005, 85, 1–16. [Google Scholar] [CrossRef]
  19. Giuliano., V.; Pagnanelli., F.; Bornoroni., L.; Toro, L.; Abbruzzese., C. Toxic elements at a disused mine district: Particle size distribution and total concentration in stream sediments and mine tailings—ScienceDirect. J. Hazard. Mater. 2007, 148, 409–418. [Google Scholar] [CrossRef]
  20. Darwish, M.A.G.; Poellmann, H. Geochemical exploration for gold in the Nile Valley Block(A) area, Wadi Allaqi, South Egypt. Chem. Erde—Geochem. 2010, 70, 353–362. [Google Scholar] [CrossRef]
  21. Wang, X. China geochemical baselines: Sampling methodology. J. Geochem. Explor. 2015, 148, 25–39. [Google Scholar] [CrossRef]
  22. Teng, Y.G.; Tuo, X.G.; Ni, S.J.; Zhang, C.J.; Xu, Z.Q. Environmental geochemistry of heavy metal contaminants in soil and stream sediment in Panzhihua mining and smelting area, Southwestern China. Chin. J. Geochem. 2003, 22, 253–262. [Google Scholar]
  23. CGS (China Geological Survey). Specifications for Regional Geochemistry Exploration (DZ/T 0167-2006). In China Geological Survey; Geological Publishing House: Beijing, China, 2006; pp. 95–113. [Google Scholar]
  24. Li, C.; Hao, Z.H.; Zhang, Z.J. A study on 1:50 000 stream sediments survey in Beishi area, Guangdong Province. Geophys. Geochem. Explor. 2018, 42, 303–311, (In Chinese with English abstract). [Google Scholar]
  25. Zhang, C.Q.; Liu, H.; Wang, D.H.; Chen, Y.C.; Rui, Z.Y.; Lou, D.B.; Wu, Y.; Jia, F.D.; Chen, Z.H.; Meng, X.Y. A Preliminary Review on the Metallogeny of Pb-Zn Deposits in China. Acta Geol. Sin.-Engl. Ed. 2015, 89, 1333–1358. [Google Scholar]
  26. Qiu, K.F.; Song, K.R.; Song, Y.H. Magmatic-hydrothermal fluid evolution of the Wenquan porphyry molybdenum deposit in the north margin of the West Qinling, China. Acta Petrol. Sin. 2015, 31, 3391–3404, (In Chinese with English abstract). [Google Scholar]
  27. Qiu, K.F.; Yang, L.Q. Genetic feature of monazite and its U-Th-Pb dating: Critical considerations on the tectonic evolution of Sanjiang Tethys. Acta Petrol. Sin. 2011, 27, 2721–2732, (In Chinese with English abstract). [Google Scholar]
  28. Goldfarb, R.J.; Mao, J.W.; Qiu, K.F.; Goryachev, N. The great Yanshanian metallogenic event of eastern Asia: Consequences from one hundred million years of plate margin geodynamics. Gondwana Res. 2021, 100, 223–250. [Google Scholar] [CrossRef]
  29. Qiu, K.F.; Goldfarb, R.J.; Deng, J.; Yu, H.C.; Gou, Z.Y.; Ding, Z.J.; Wang, Z.K.; Li, D.P. Gold deposits of the Jiaodong Peninsula, eastern China. SEG Spec. Publ. 2020, 23, 753–773. [Google Scholar]
  30. Qiu, K.F.; Yu, H.C.; Hetherington, C.; Huang, Y.Q.; Yang, T.; Deng, J. Tourmaline composition and boron isotope signature as a tracer of magmatic-hydrothermal processes. Am. Mineral. J. Earth Planet. Mater. 2021, 106, 1033–1044. [Google Scholar] [CrossRef]
  31. Qin, Y.; Wang, D.H.; Wu, L.B.; Wang, K.Y.; Mei, Y.P. SHRIMP U-Pb dating of zircons in mineralized porphyry of the Dongyuan W deposit in Anhui province and its Geological significance of the newly found Dongyuan W-Mo deposit in Huangshan area, Anhui province. Acta Geol. Sin. 2010, 84, 479–484, (In Chinese with English abstract). [Google Scholar]
  32. Qiu, K.F.; Deng, J. Petrogenesis of granitoids in the Dewulu skarn copper deposit: Implications for the evolution of the Paleotethys ocean and mineralization in Western Qinling, China. Ore Geol. Rev. 2017, 90, 1078–1098. [Google Scholar] [CrossRef]
  33. Qiu, K.F.; Deng, J.; Taylor, R.D.; Song, K.R.; Song, Y.H.; Li, Q.Z.; Goldfarb, R.J. Paleozoic magmatism and porphyry Cu-mineralization in an evolving tectonic setting in the North Qilian Orogenic Belt, NW China. J. Asian Earth Sci. 2016, 122, 20–40. [Google Scholar] [CrossRef]
  34. Qiu, K.F.; Yu, H.C.; Wu, M.Q.; Geng, J.Z.; Ge, X.K.; Gou, Z.Y.; Taylor, R.D. Discrete Zr and REE mineralization of the Baerzhe rare-metal deposit, China. Am. Mineral. J. Earth Planet. Mater. 2019, 104, 1487–1502. [Google Scholar] [CrossRef]
  35. Du, Y.D.; Yu, X.Q.; Zhou, X.; Fu, J.Z. The composition of sulfur and lead isotope and the source of metallogenic material from Xiyuan and Jiangjia Ore Blocks in the Dongyuan W-Mo deposit in southern Anhui province. Geoscience 2011, 25, 861–868, (In Chinese with English abstract). [Google Scholar]
  36. Wang, D.E.; Zhou, X.; Yu, X.Q.; Du, Y.D.; Yang, H.M.; Fu, J.Z.; Dong, H.M. SHRIMP zircon U-Pb dating and characteristics of Hf isotopes of the granodiorite porphyries in the Dongyuan W-Mo ore district, Qimen area, southern Anhui. Geol. Bull. China 2011, 30, 1514–1529. [Google Scholar]
  37. Zhou, X.; Yu, X.Q.; Wang, D.E.; Zhang, D.H.; Li, C.L.; Fu, J.Z.; Dong, H.M. Characteristics and Geochronology of the W, Mo-bearing Granodiorite Porphy in Dongyuan, Southern Anhui. Geoscience 2011, 25, 201–210, (In Chinese with English abstract). [Google Scholar]
  38. Qiu, K.F.; Li, N.; Taylor, R.D.; Song, Y.H.; Song, K.R.; Han, W.Z.; Zhang, D.X. Timing and duration of metallogeny of the Wenquan deposit in the West Qinling, and its constraint on a proposed classification for porphyry molybdenum deposits. Acta Petrol. Sin. 2014, 30, 2631–2643, (In Chinese with English abstract). [Google Scholar]
  39. Qiu, K.F.; Yu, H.C.; Deng, J.; McIntire, D.; Gou, Z.Y.; Geng, J.Z.; Chang, Z.S.; Zhu, R.; Li, K.N.; Goldfarb, R. The giant Zaozigou Au-Sb deposit in West Qinling, China: Magmatic- or metamorphic- hydrothermal origin? Min. Depos. 2020, 55, 345–362. [Google Scholar] [CrossRef]
  40. Yu, H.C.; Qiu, K.F.; Hetherington, C.J.; Chew, D.; Huang, Y.Q.; He, D.Y.; Geng, J.Z.; Xian, H.Y. Apatite as an alternative petrochronometer to trace the evolution of magmatic systems containing metamict zircon. Contrib. Mineral. Petrol. 2021, 176, 1–19. [Google Scholar] [CrossRef]
  41. Wang, Y.; Qiu, K.F.; Müller, A.; Hou, Z.L.; Zhu, Z.H.; Yu, H.C. Machine Learning Prediction of Quartz Forming-Environments. J. Geophys. Res. Solid Earth 2021, 126, e2021JB021925. [Google Scholar] [CrossRef]
  42. Qiu, K.F.; Taylor, R.D.; Song, Y.H.; Yu, H.C.; Song, K.R.; Li, N. Geologic and geochemical insights into the formation of the Taiyangshan porphyry copper-molybdenum deposit, Western Qinling Orogenic Belt, China. Gondwana Res. 2016, 35, 40–58. [Google Scholar] [CrossRef]
  43. Xie, X.J.; Ren, T.X.; Sun, H.Z. Geochemical Atlas of China; Geological Publishing House: Beijing, China, 2012; p. 13. [Google Scholar]
  44. Konstantinova, I.M. The composition of river silts and the distribution of hand elements in them in areas of scattering flows in Eastern Transbaikalia. In Ezhegotsnnk−1969 Institute of Geochemistry; Siberian Branch of the USSR Academy of Sciences: Irkutsk, Russia, 1970; pp. 234–235. [Google Scholar]
  45. Zhang, H.; Kong, M.; Yang, S.P.; Zhao, Y.J.; Ren, T.X.; Sun, Z.J.; Liu, H.Z.; Xu, R.T.; Yang, F.; Yu, J.S.; et al. Theories and Methods of Regional Geochemical Exploration in Major Landscape Areas in China; China Geological Publishing House: Beijing, China, 2017; pp. 129–186. [Google Scholar]
  46. MLR (Ministry of Land and Resources of the People’s Republic of China). Specification Identification of Rock and Mineral. Part. 1: General Rules and Regulation (DZ/T0275.1-2015); China Quality and Standards Publishing House: Beijing, China, 2015; pp. 1–8. [Google Scholar]
  47. Wang, C.S.; Gu, T.X.; Chi, Q.H.; Yan, W.D.; Yan, M.C. New geochemical standard materials for rocks and stream sediments. Geophys. Geochem. Explor. 2000, 24, 246–249, (In Chinese with English abstract). [Google Scholar]
  48. Xie, X.J.; Yan, M.C.; Li, L.Z.; Shen, H.J. Usable values for Chinese standard reference samples of stream sediments, soils, and rocks: GSD 9-12, GSS 1-8 and GSR 1-6. Geostand. Geoanal. Res. 1985, 9, 277–280. [Google Scholar] [CrossRef]
  49. Xie, X.J.; Yan, M.C.; Wang, C.S.; Li, L.Z.; Shen, H.J. Geochemical standard reference samples GSD 9-12, GSS 1-8 and GSR 1-6. Geostand. Geoanal. Res. 1989, 13, 83–179. [Google Scholar] [CrossRef]
  50. Ye, J.Y. Quality Control in Geochemical Sample Analysis. In Selected Analytical Methods of 57 Elements for Multi-Purpose Geochemical Survey; Zheng, K., Ye, J., Jiang, B., Eds.; Geological Publishing House: Beijing, China, 2005; pp. 295–306. [Google Scholar]
  51. Yang, F.; Kong, M.; Liu, H.Z.; Yu, J.S.; Yang, S.P.; Hao, Z.H.; Zhang, D.H.; Cen, K. Discovery of Wolitu Pb-Zn deposit through geochemical prospecting under loess cover in Inner Mongolia, China. Geosci. Front. 2017, 8, 951–960. [Google Scholar] [CrossRef] [Green Version]
  52. Xie, X.J. Perspective. Analytical requirements in international geochemical mapping. Analyst 1995, 120, 1497–1504. [Google Scholar]
  53. Cheng, H.X.; Zhao, C.D.; Liu, Y.H.; Zhang, Q.; Yang, K.; Liu, F.; Li, K.; Peng, M.; Li, M. Geochemical exploration for platinum-group element deposits in Miyi County, Sichuan province, southwestern China. Geochem. Explor. Environ. Anal. 2015, 15, 39–53. [Google Scholar] [CrossRef]
  54. Lancianese, V.; Dinelli, E. Different spatial methods in regional geochemical mapping at high density sampling: An application on stream sediment of Romagna Apennines, Northern Italy. J. Geochem. Explor. 2015, 154, 143–155. [Google Scholar] [CrossRef]
  55. Yang, F.; Xie, S.; Carranza, E.J.M.; Yao, L.; Tian, H.; Chen, Z. Vertical distribution of major ore-forming elements and the speciation in the semiarid system above the concealed Baiyinnuoer Pb-Zn deposit in inner Mongolia, China. Geochem.-Explor. Environ. Anal. 2019, 19, 46–57. [Google Scholar] [CrossRef]
  56. Young, S.M.; Pitawala, A.; Ishiga, H. Geochemical characteristics of stream sediments, sediment fractions, soils, and basement rocks from the Mahaweli River and its catchment, Sri Lanka. Chem. Erde 2013, 73, 357–371. [Google Scholar] [CrossRef]
  57. Ivanić, M.; Durn, G.; Škapin, S.D.; Sondi, I. Size-related mineralogical and surface physicochemical properties of the mineral particles from the recent sediments of the Eastern Adriatic Sea. Chemosphere 2020, 249, 126531. [Google Scholar] [CrossRef]
  58. Mudroch, A. Particle size effects on concentration of metals in lake Erie bottom sediments. Water Pollut. Res. J. Can. 1984, 19, 27–35. [Google Scholar] [CrossRef]
  59. Vital, H.; Stattegger, K. Major and trace elements of stream sediments from the lowermost Amazon River. Chem. Geol. 2000, 168, 151–168. [Google Scholar] [CrossRef]
  60. Ohta, A.; Imai, N.; Terashima, S.; Tachibana, Y.; Ikehara, K.; Katayama, H.; Noda, A. Factors controlling regional spatial distribution of 53 elements in coastal sea sediments in northern Japan: Comparison of geochemical data derived from stream and marine sediments. Appl. Geochem. 2010, 25, 357–376. [Google Scholar] [CrossRef]
  61. Garzanti, E.; Andó, S.; France-Lanord, C.; Censi, P.; Vignola, P.; Galy, V.; Lupker, M. Mineralogical and chemical variability of fluvial sediments 2. Suspended-load silt (Ganga-Brahmaputra, Bangladesh). Earth Planet. Sci. Lett. 2011, 302, 107–120. [Google Scholar] [CrossRef]
  62. Mudroch, A.; Sarazin, L.; Lomas, T. Summary of surface and background concentrations of selected elements in the Great Lakes Sediments. J. Great Lakes Res. 1988, 14, 241–251. [Google Scholar] [CrossRef]
  63. Wu, W.; Xu, S.; Lu, H.; Yang, J.; Yin, H.; Liu, W. Mineralogy, major and trace element geochemistry of riverbed sediments in the headwaters of the Yangtze, Tongtian River and Jinsha River. J. Asian Earth Sci. 2011, 40, 611–621. [Google Scholar] [CrossRef]
  64. Kelepertzis, E.; Argyraki, A.; Daftsis, E. Geochemical signature of surface water and stream sediments of a mineralized drainage basin at NE Chalkidiki, Greece: A pre-mining survey. J. Geochem. Explor. 2012, 114, 70–81. [Google Scholar] [CrossRef]
  65. Martinčić, D.; Kwokal, Ž.; Branica, M. Distribution of zinc, lead, cadmium and copper between different size fractions of sediments II. The Krka River Estuary and the Kornati Islands (Central Adriatic Sea). Sci. Total Environ. 1990, 95, 217–225. [Google Scholar] [CrossRef]
  66. Chandrajith, R.; Dissanayake, C.B.; Tobschall, H.J. Application of multi-element relationships in stream sediments to mineral exploration: A case study of Walawe Ganga Basin, Sri Lanka. Appl. Geochem. 2001, 16, 339–350. [Google Scholar] [CrossRef]
  67. Mackay, B.R. Beauceville Map-Area, Quebec; Memoir (Geological Survey of Canada), FA Acland: Ottawa, ON, Canada, 1921; Volume 108, p. 105. [Google Scholar]
  68. Boyle, R.W. The Geochemistry of Gold and Its Deposits (Together with a Chapter on Geochemical Prospecting for the Element); Minister of Supply and Services Canada: Ottawa, ON, Canada, 1979.
  69. Franz, G.; Spear, F.S. Aluminous titanite (sphene) from the Eclogite Zone, south-central Tauern Window, Austria. Chem. Geol. 1985, 50, 33–46. [Google Scholar] [CrossRef]
  70. Sensarma, S.; Rajamani, V.; Tripathi, J.K. Petrography and geochemical characteristics of the sediments of the small River Hemavati, Southern India: Implications for provenance and weathering processes. Sediment. Geol. 2008, 205, 111–125. [Google Scholar] [CrossRef]
  71. Singh, P. Geochemistry and provenance of stream sediments of the Ganga River and its major tributaries in the Himalayan region, India. Chem. Geol. 2010, 269, 220–236. [Google Scholar] [CrossRef]
  72. Dasgupta, S. Contrasting mineral parageneses in high-temperature calc-silicate granulites: Examples from the Eastern Ghats, India. J. Metamorph. Geol. 1993, 11, 193–202. [Google Scholar] [CrossRef]
  73. Morton, A.C.; Hallsworth, C.R. Processes controlling the composition of heavy mineral assemblages in sandstones. Sediment. Geol. 1999, 124, 3–29. [Google Scholar] [CrossRef]
  74. Das, A.; Krishnaswami, S. Elemental geochemistry of river sediments from the Deccan Traps, India: Implications to sources of elements and their mobility during basalt-water interaction. Chem. Geol. 2007, 242, 232–254. [Google Scholar] [CrossRef]
  75. Ćurković, L.; Cerjan-Stefanović, Š.; Filipan, T. Metal ion exchange by natural and modified zeolites. Croat. Chem. Acta 1997, 31, 281–290. [Google Scholar] [CrossRef]
  76. Erdem, E.; Karapinar, N.; Donat, R. The removal of heavy metal cations by natural zeolites. J. Colloid Interface Sci. 2004, 280, 309–314. [Google Scholar] [CrossRef]
  77. Donat, R.; Akdogan, A.; Erdem, E.; Cetisli, H. Thermodynamics of Pb2+ and Ni2+ adsorption onto natural bentonite from aqueous solutions. J. Colloid Interface Sci. 2005, 286, 43–52. [Google Scholar] [CrossRef]
  78. Wang, X.L.; Li, Y. Measurement of Cu and Zn adsorption onto surficial sediment components: New evidence for less importance of clay minerals. J. Hazard. Mater. 2011, 189, 719–723. [Google Scholar] [CrossRef]
  79. Jiménez, E.I.; García, V.P. Relationships between organic carbon and total organic matter in municipal solid wastes and city refuse composts. Bioresour. Technol. 1992, 41, 265–272. [Google Scholar] [CrossRef]
  80. Navarro, A.F.; Cegarra, J.; Roig, A.; Garcia, D. Relationships between organic matter and organic carbon of organic wastes. Bioresour. Technol. 1993, 44, 203–207. [Google Scholar] [CrossRef]
  81. Dinakaran, J.; Krishnayya, N.S.R. Variations in total organic carbon and grain size distribution in ephemeral river sediments in western India. Int. J. Sediment. Res. 2011, 26, 239–246. [Google Scholar] [CrossRef]
  82. Ma, L.; Jin, L.; Brantley, S.L. How mineralogy and slope aspect affect REE release and fractionation during shale weathering in the Susquehanna/Shale Hills Critical Zone Observatory. Chem. Geol. 2011, 290, 31–49. [Google Scholar] [CrossRef]
  83. Ma, Y.; Lu, W.; Lin, C. Downstream patterns of bed sediment-borne metals, minerals and organic matter in a stream system receiving acidic mine effluent: A preliminary study. J. Geochem. Explor. 2011, 110, 98–106. [Google Scholar] [CrossRef]
  84. Gier, S.; Johns, W.D. Heavy metal-adsorption on micas and clay minerals studied by x-ray photoelectron spectroscopy. Appl. Clay Sci. 2000, 16, 289–299. [Google Scholar] [CrossRef]
  85. Buyang, S.J.; Yi, Q.T.; Cui, H.B.; Wa, K.K.; Zhang, S.L. Distribution and adsorption of metals on different particle size fractions of sediments in a hydrodynamically disturbed canal. Sci. Total Environ. 2019, 670, 654–661. [Google Scholar] [CrossRef]
  86. Yang, S.P.; Kong, M.; Liu, H.Z.; Liu, S.J.; Liang, J.Q.; Wang, S. A research on regional geochemical methodology for the landscape of forest-swamp in the northeast of China. Geol. Prospect. 2003, 39, 94–98, (In Chinese with English abstract). [Google Scholar]
  87. Sun, K.K.; Chen, B.; Deng, J. Ore genesis of the Zhuxi supergiant W-Cu skarn polymetallic deposit, South China: Evidence from scheelite geochemistry. Ore Geol. Rev. 2019, 107, 14–29. [Google Scholar] [CrossRef]
Figure 2. Location map of test samples.
Minerals 12 00431 g002
Figure 3. Element distributions in the different particle size fractions of stream sediments (JSL1).
Minerals 12 00431 g003
Figure 4. Element distributions in different particle size fractions of stream sediments (JSL2).
Minerals 12 00431 g004
Figure 5. Mineral distribution in different particle size fractions of the stream sediments.
Minerals 12 00431 g005
Figure 6. Geochemical maps of organic carbon in 0.25–2 mm and <0.25 mm fraction of stream sediments in the pilot area.
Minerals 12 00431 g006
Figure 7. Geochemical maps of SiO2 in 0.25–2 mm and <0.25 mm fraction of stream sediments in the pilot area.
Minerals 12 00431 g007
Figure 8. Geochemical maps of Al2O3 in 0.25–2 mm and <0.25 mm fraction of stream sediments in the pilot area.
Minerals 12 00431 g008
Figure 9. Geochemical maps of W in 0.25–2 mm and <0.25 mm fraction of stream sediments in the pilot area.
Minerals 12 00431 g009
Figure 10. Geochemical maps of Au in 0.25–2 mm and <0.25 mm fraction of stream sediments in the pilot area.
Minerals 12 00431 g010
Table 1. Analysis of precision and quality control parameters.
Element∆LogCSRMRD (%)
GSD1aGSD9GSD13GSD14MaxMeanMin
n = 5n = 4n = 4n = 4n = 13n = 13n = 13
Ag0.0080.0260.0250.00922.123.160.10
Au0.0370.0400.0240.03429.757.630.16
Al2O30.0310.0000.0120.03314.023.520.00
As0.0200.0250.0240.00622.080.980.00
Bi0.0170.0040.0240.01722.1310.360.04
CaO0.0300.0210.0230.02218.0215.270.00
Cd0.0290.0220.0000.02018.670.700.45
Co0.0150.0020.0170.0108.081.610.00
Corg.C0.0010.0110.0260.0020.770.160.07
Cr0.0140.0150.0160.0175.810.320.30
Cu0.0170.0130.0180.0109.751.530.04
Fe2O30.0160.0100.0050.0111.140.270.00
Hg0.0370.0060.0100.03111.571.970.00
La0.0120.0110.0270.01213.396.101.91
Mn0.0260.0090.0100.0231.200.020.04
Mo0.0100.0230.0150.02217.086.360.69
Ni0.0150.0040.0280.0078.021.290.12
Pb0.0100.0170.0190.00416.9212.242.53
Sb0.0200.0210.0270.02114.946.681.08
SiO20.0000.0160.0010.0159.980.820.12
Sn0.0210.0250.0190.02118.139.100.00
Th0.0170.0270.0220.02719.7710.431.49
W0.0270.0210.0230.00919.7115.040.24
Zn0.0150.0020.0260.03011.651.101.10
Table 2. Element concentrations in minerals in 0.84–0.42 mm fraction of stream sediments.
Sample TypeMineral TypeAgAsBiCdCoCrCuHgLaMn
natural sizeN0.5410.0513.710.13150.023.720.01118
E4.92722122.81.09152.8394.8345.70.28140.73390
F0.74514.919.331.6487.3166.7130.91.530.011035
L0.0828.11.660.416.280.340.40.11926.6923
artificial reference sizeN0.01136.65.3346.910.10.60.020.520.011218
E1.25605.737.550.9773.4107.4171.10.45351662
F0.01206.62.330.2117.35564.20.22702068
L0.0819.41.210.1611.366.431.20.02432.2721
Sample TypeMineral TypeMoNiPbSbSnThWZnFe2O3CaO
natural sizeN11.1174.73758.818.60.00519,376.134694.531.13
E65.51199.926725.344.911.1291.222665.530.13
F16.9386.442523.3160.318102.4323756.50.94
L2.3835.76523.49.123.781837.440.3
artificial reference sizeN0.01204.7227.80.1812,006.122,49913.5311.13
E41.08114.914918.31.99.361.8450351.034.63
F9.684.7220.38.683177.6240.531.2
L2.0438.1291.42.79.66.361057.330.33
Note: the content unit for Ag is ng/g, for other elements is μg/g; N is nonmagnetic heavy minerals, E is electromagnetic heavy minerals, F is ferromagnetic heavy minerals, and L is light minerals.
Table 3. Element concentrations in minerals in 0.177–0.125 mm fraction of stream sediments.
Sample TypeMineral TypeAgAsBiCdCoCrCuHgLaMn
natural sizeN37.5976.613,823.8319.367.3301214.266.420.01168
E8.98436661.421.71106.1420.3359.51.76296.52453
F0.29218.38.660.5670.6448.390.90.680.012785
L0.1123.42.360.2917.373.838.60.09130.8850
artificial reference sizeN5.69546.62688.3367.61142.30.674.29.170.011168
E2.59905.2154.360.98128.3157.7335.30.3976.42109
F0.01931.69.330.71107.3440404.20.020.016468
L0.0519.81.050.151162.431.30.04131.9715
Sample TypeMineral TypeMoNiPbSbSnThWZnFe2O3CaO
natural sizeN432.19.724,66048.82438.60.00579,851.159796.536.63
E38.6611028129.2342.155.4482.2837277.70.13
F14.9399.720010.6155.30.00598.146455.121.42
L3.7231.66724.69.233.911196.040.32
artificial reference sizeN146.1924.730525.328.65871,651.134,73967.039.63
E63.5138.922229.74.118.1213.3931694.75.13
F48.6299.74540.858.60.005131.129948.581.66
L1.6636.1261.43.59.47.39956.750.29
Note: the content unit for Ag is ng/g, for other elements is μg/g; N is nonmagnetic heavy minerals, E is electromagnetic heavy minerals, F is ferromagnetic heavy minerals, and L is light minerals.
Table 4. Granulometrical analysis of <0.25 mm fraction of stream sediments.
CompositionSilt and SandClay
Particle size (μm)5–250<5
Percentage (%)91.159.85
Table 5. Concentrations of organic carbon in 0.25–2 mm and <0.25 mm fraction of stream sediments.
Particle Size (mm)Concentration of Organic Carbon (%)
nMaxMinMean
0.25–22281.750.050.47
<0.2522810.361.43.27
Publisher’s Note: MDPI stays neutral with regard to jurisdictional claims in published maps and institutional affiliations.

