
Coal Sludge Permeability Assessment Based on Rowe Cell Consolidation, and Filtration Investigations


Abstract
:1. Introduction
2. Theory Background
2.1. Soil Consolidation
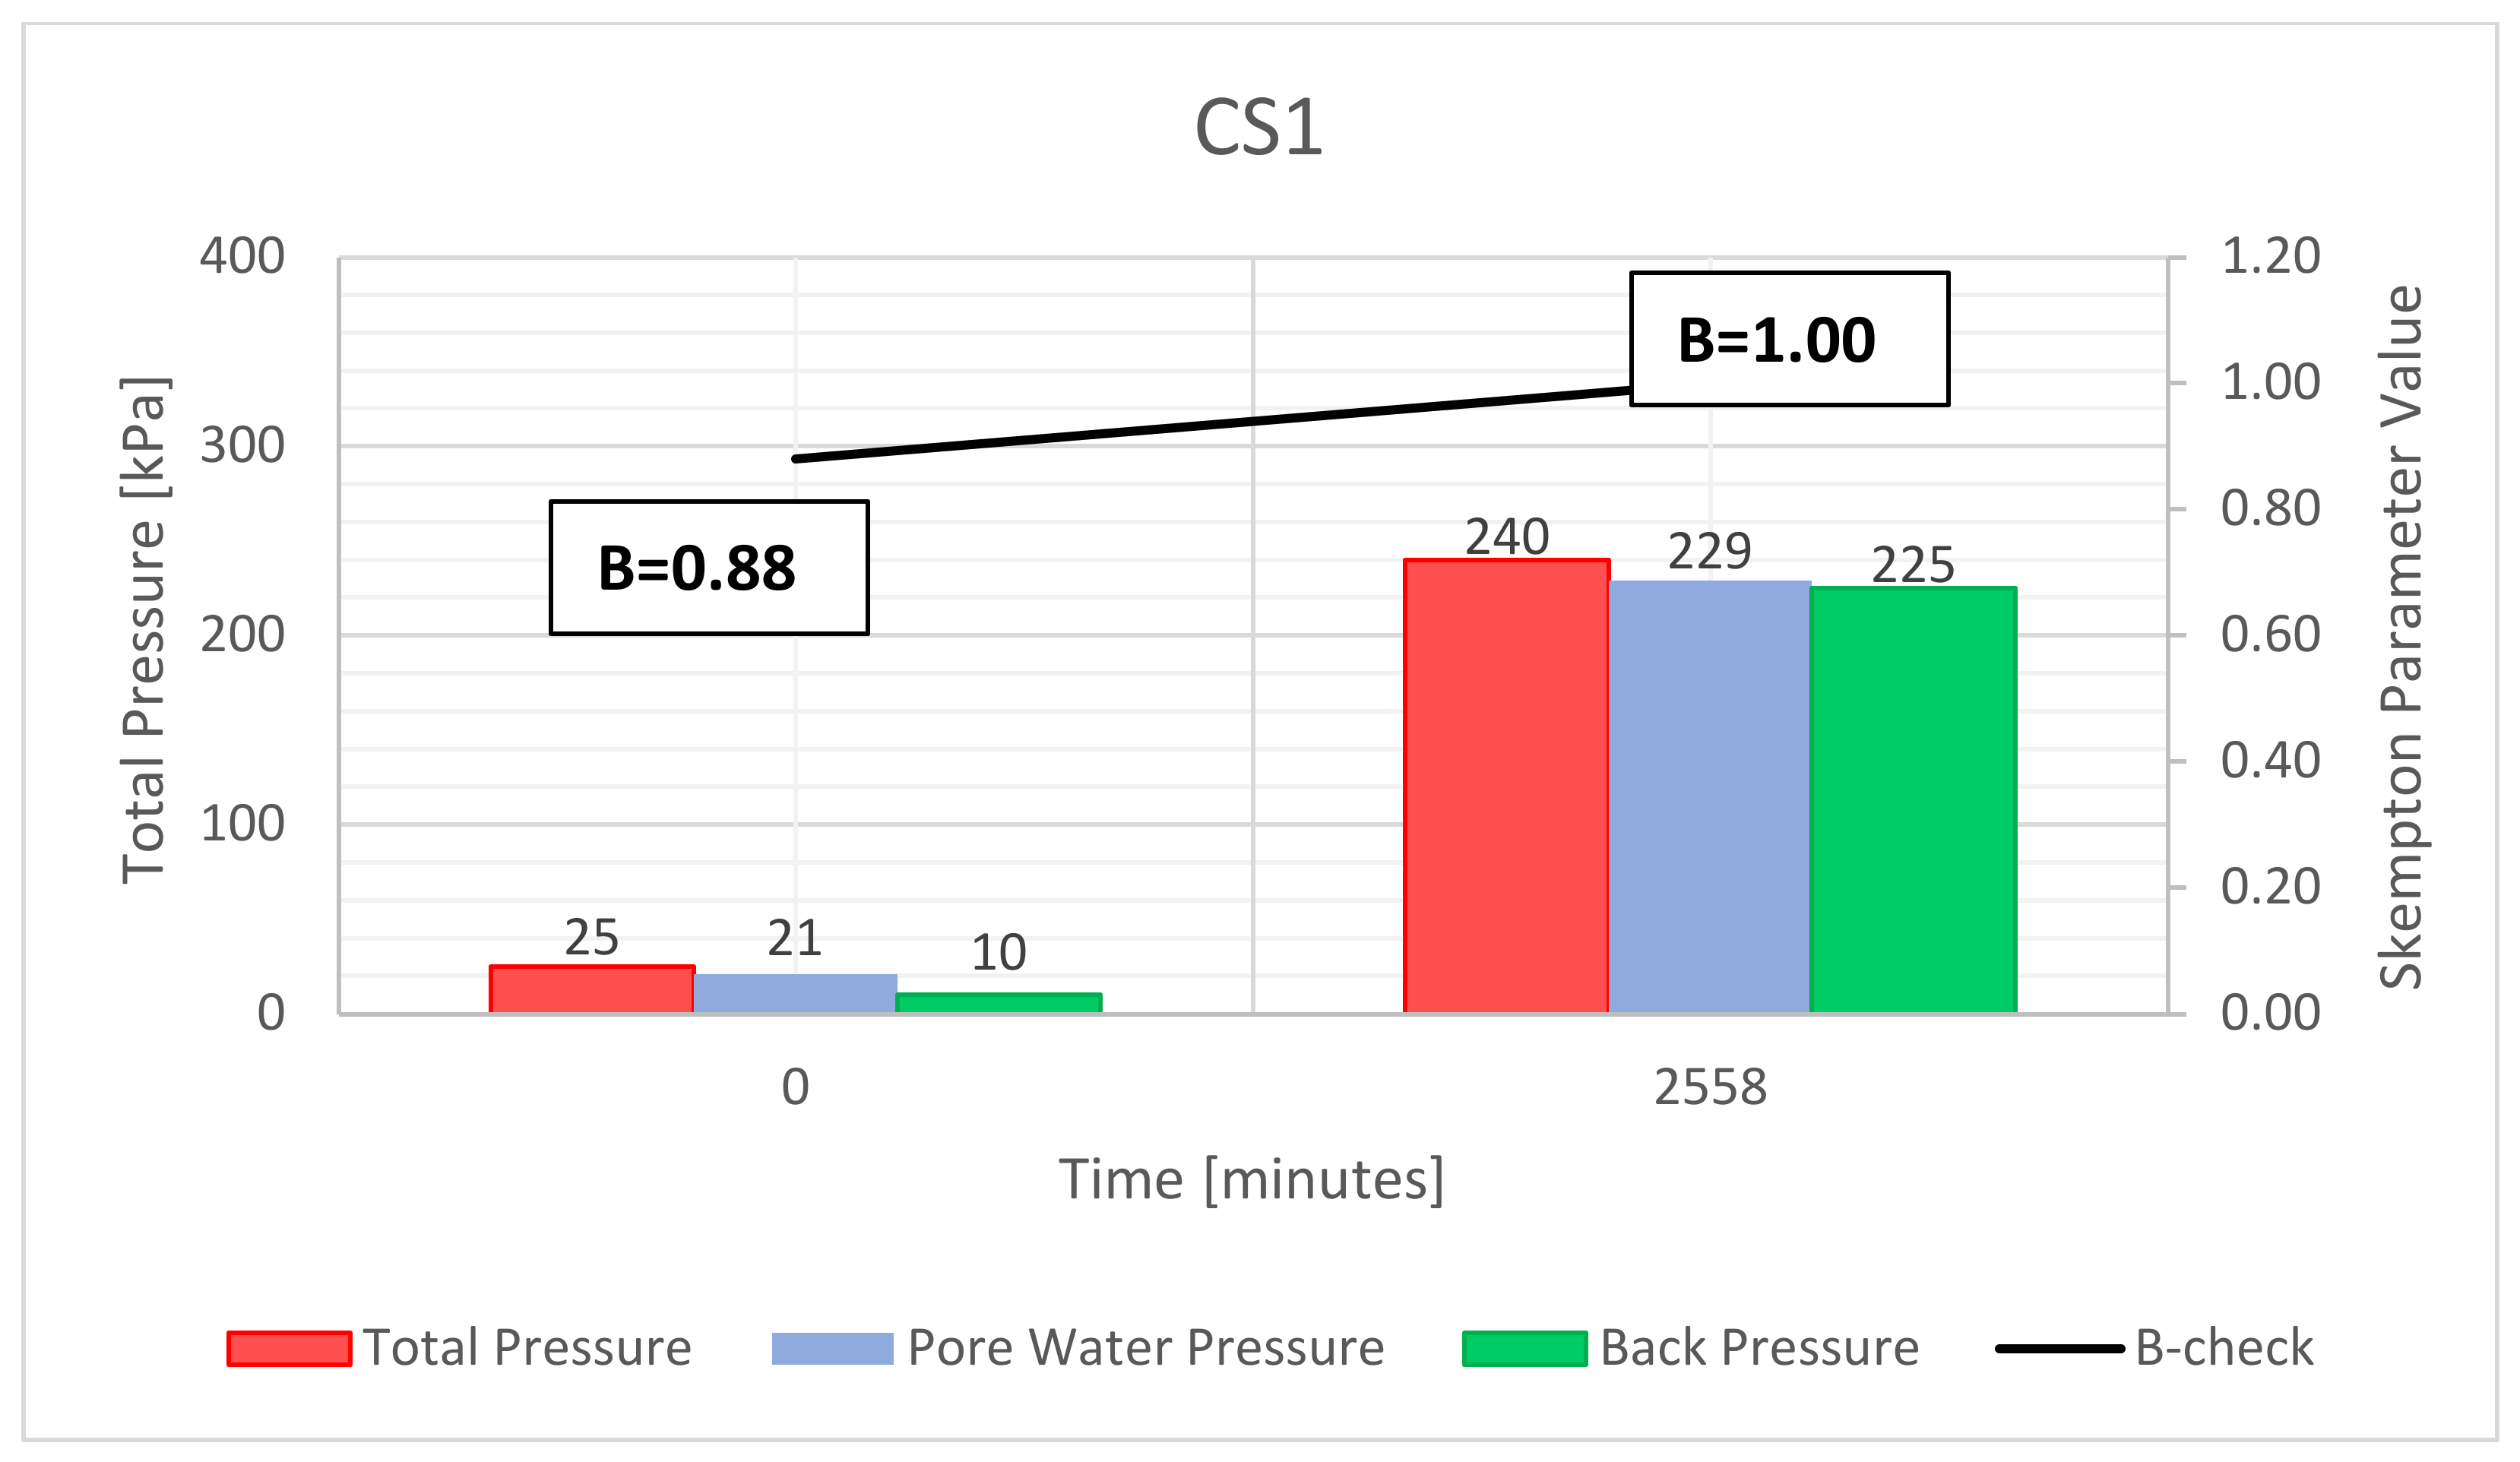
2.1.1. Saturation
2.1.2. Characteristics of Soil Consolidation
2.1.3. Phases of the Soil Consolidation
2.2. Soil Water Permeability
2.2.1. Movement of Water in the Ground
2.2.2. Methods for the Determination of the Filtration Coefficient
- analytical and empirical formulas based on the grain size distribution (Hazena, and Kozeny-Carman formulas [51,52]; Hazen, Slichter, Terzaghi, Beyer, Sauber, Krueger, Kozeny, Zunker, Zamarin, USBR, Alyamani, and Sen, Shepherd, and Loudon [53]; Terzaghi, Kozeny, Carman, Zunker, and Chapuis [54,55,56]; Hazen [57]; Kruger [58]),
2.2.3. Laboratory Tests
3. Materials and Methods
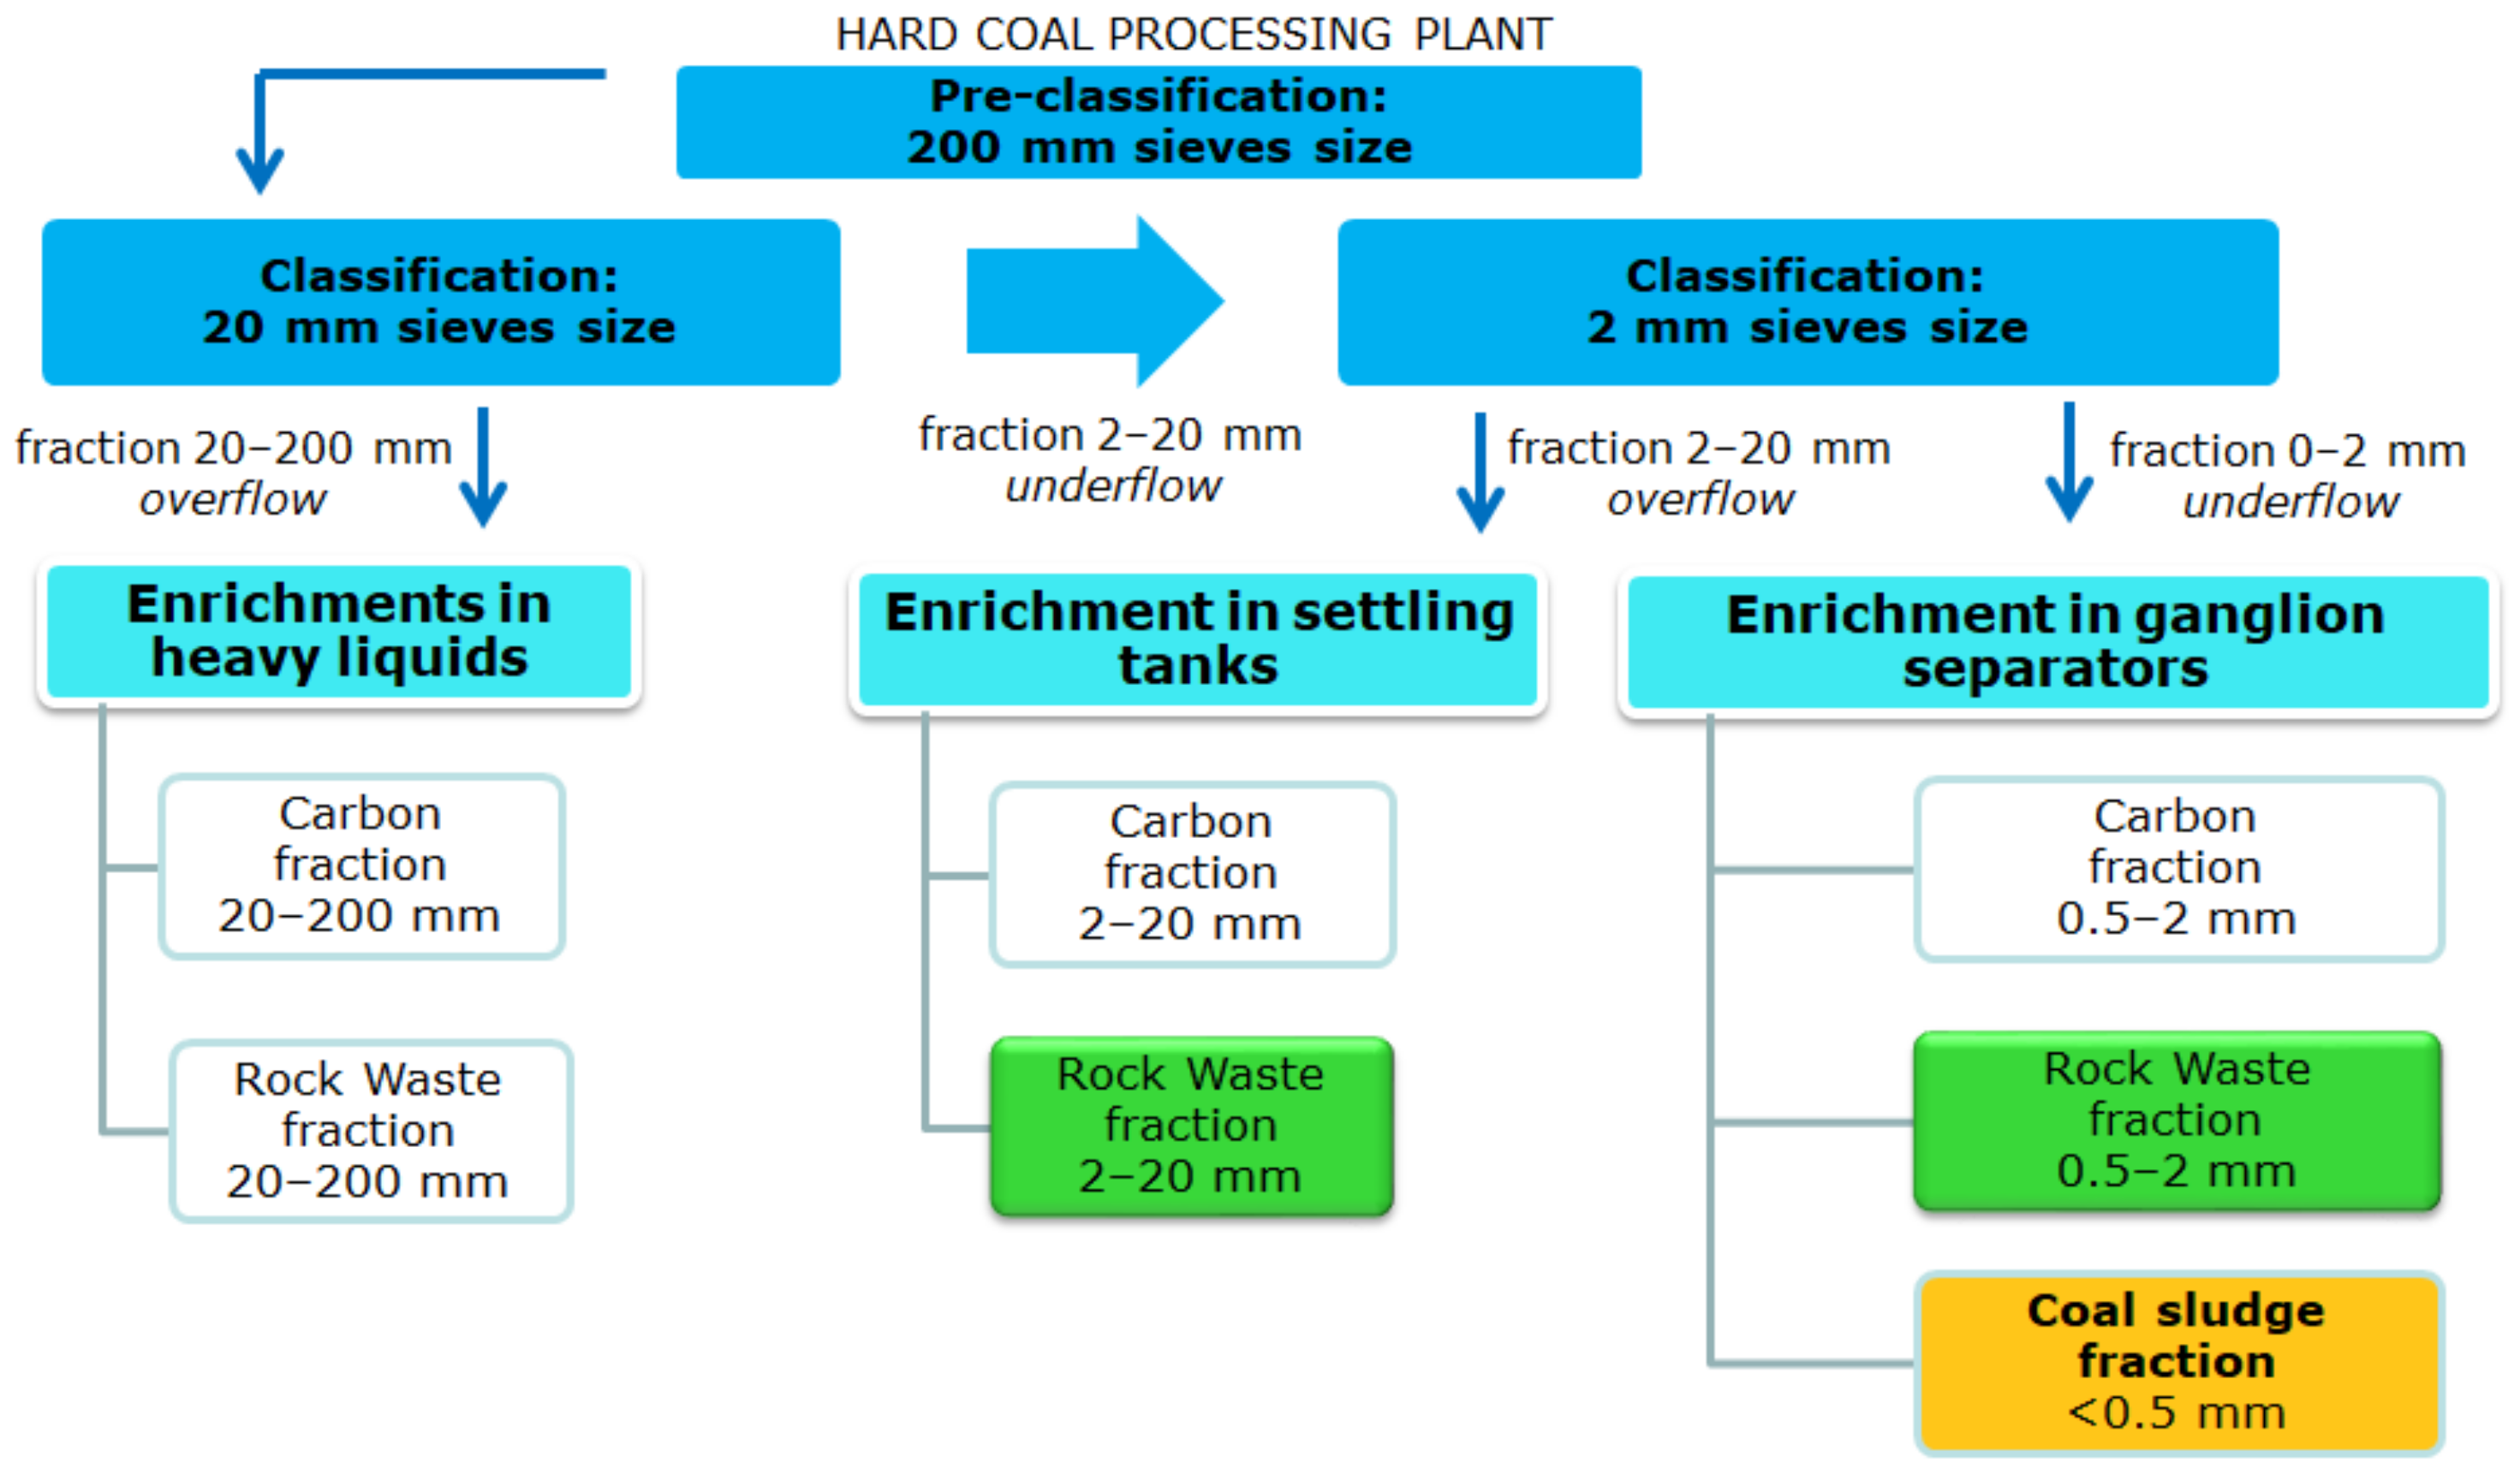
3.1. The Origin of the Samples
3.2. Coal Sludge Characteristic
3.3. Laboratory Testing Program
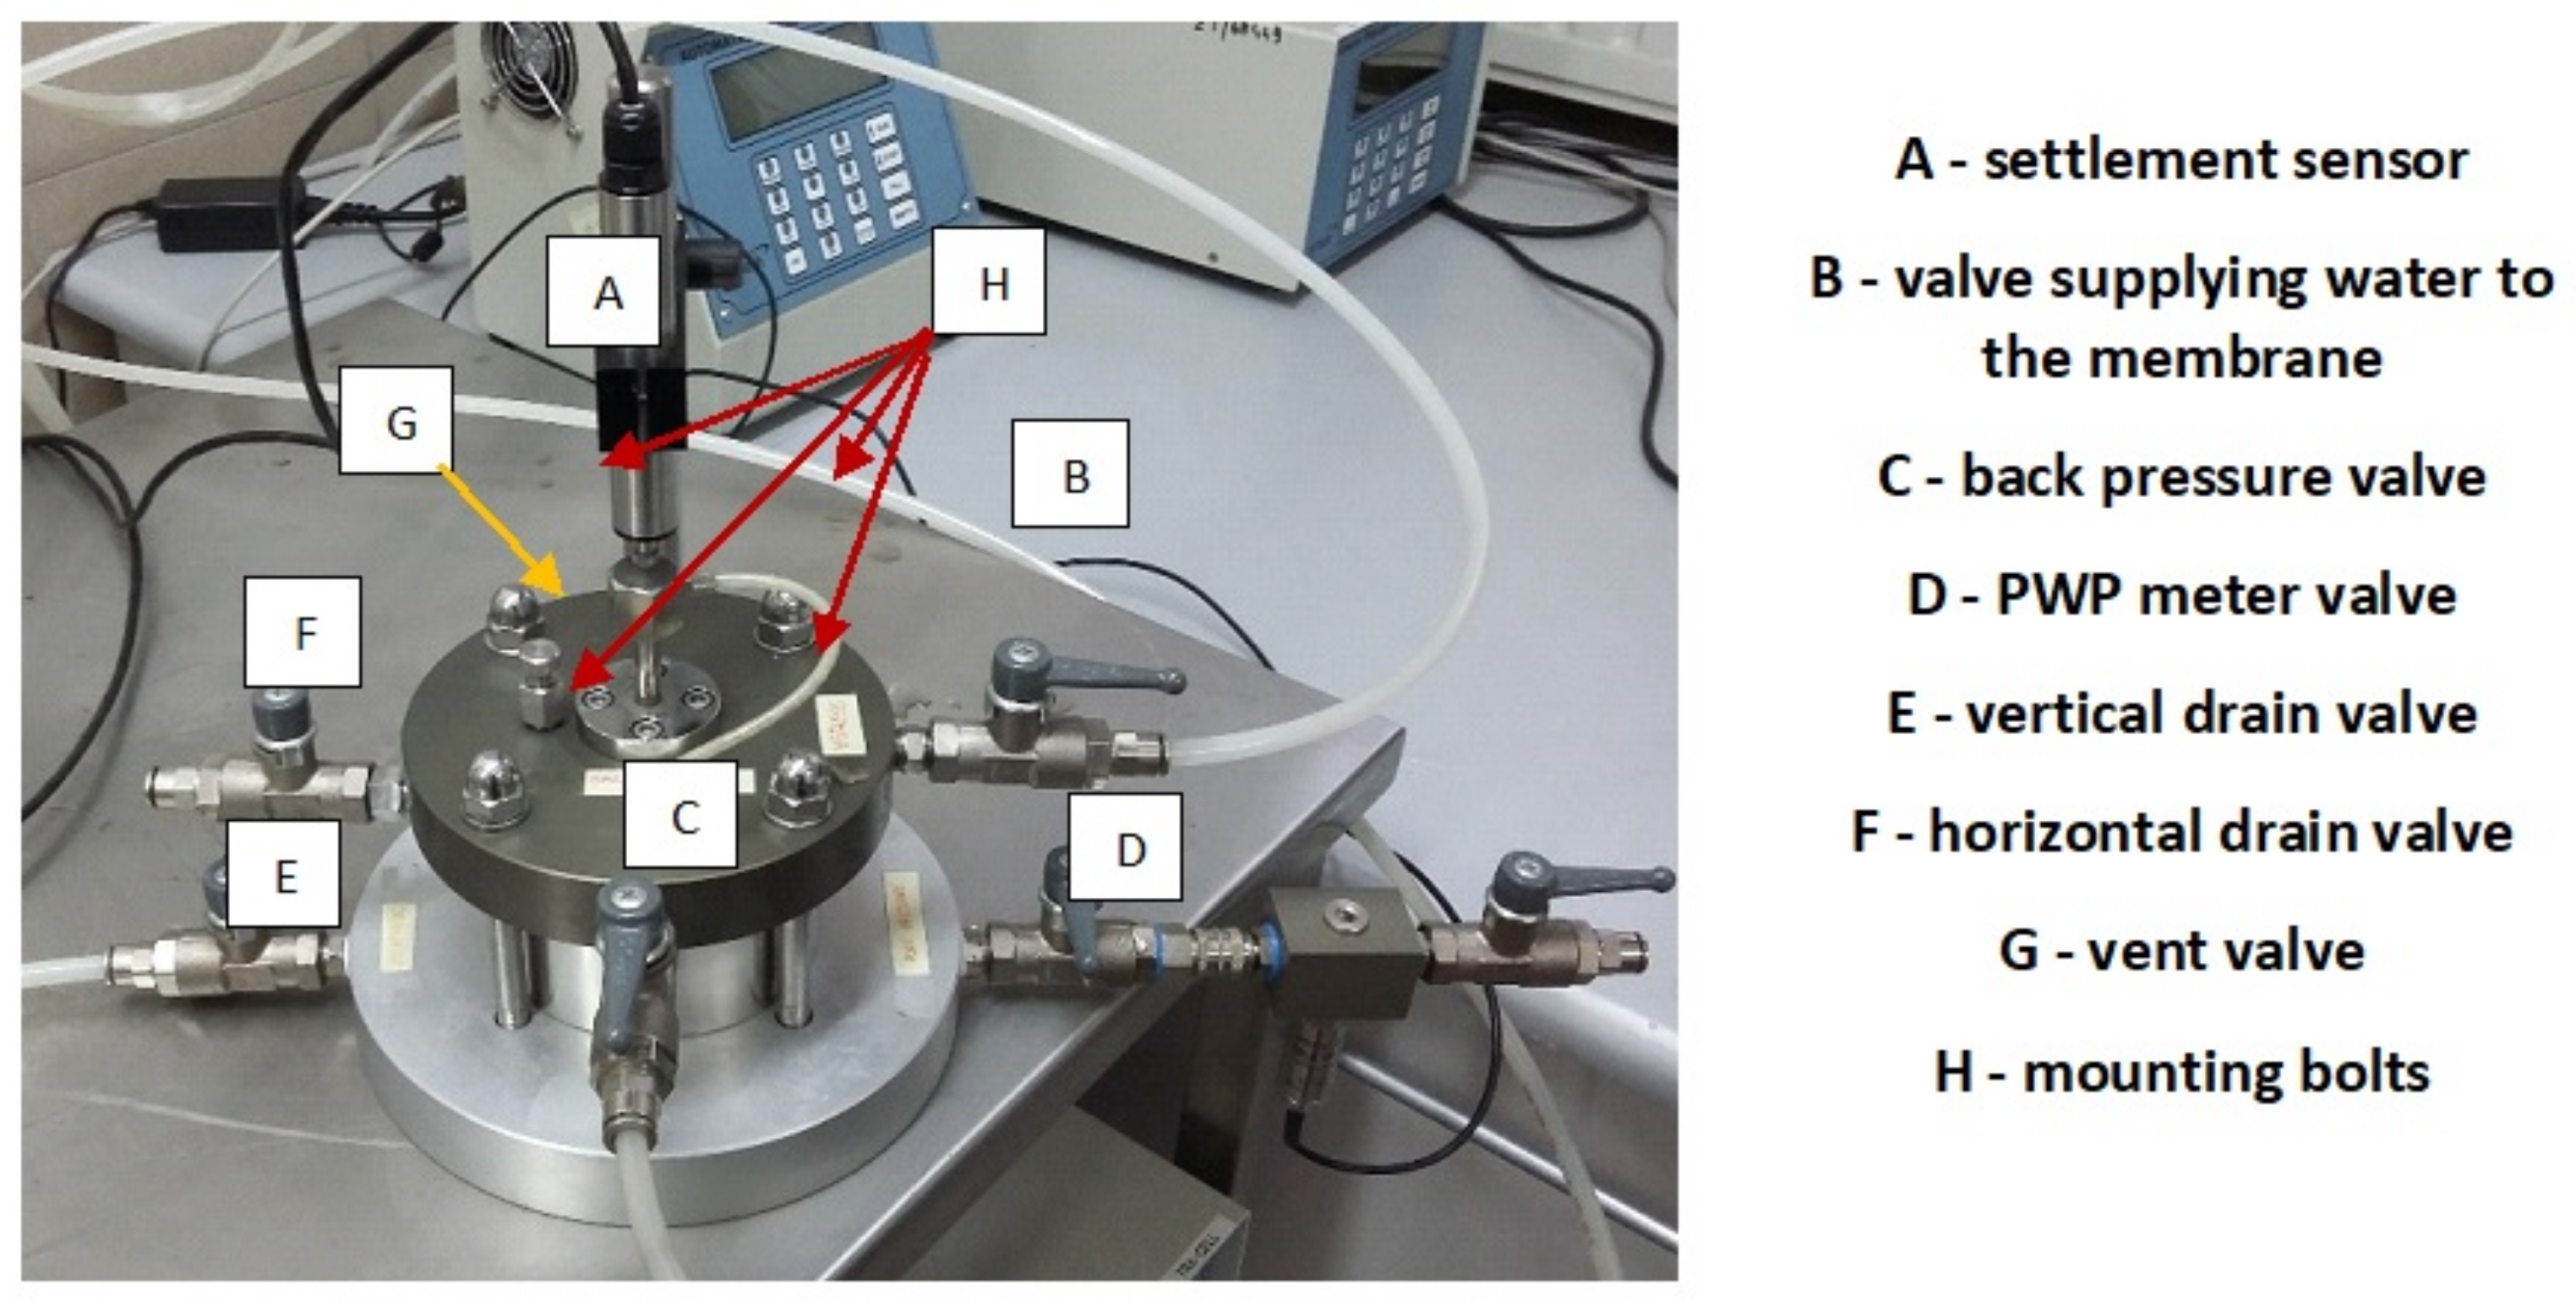
3.3.1. Testing Apparatus
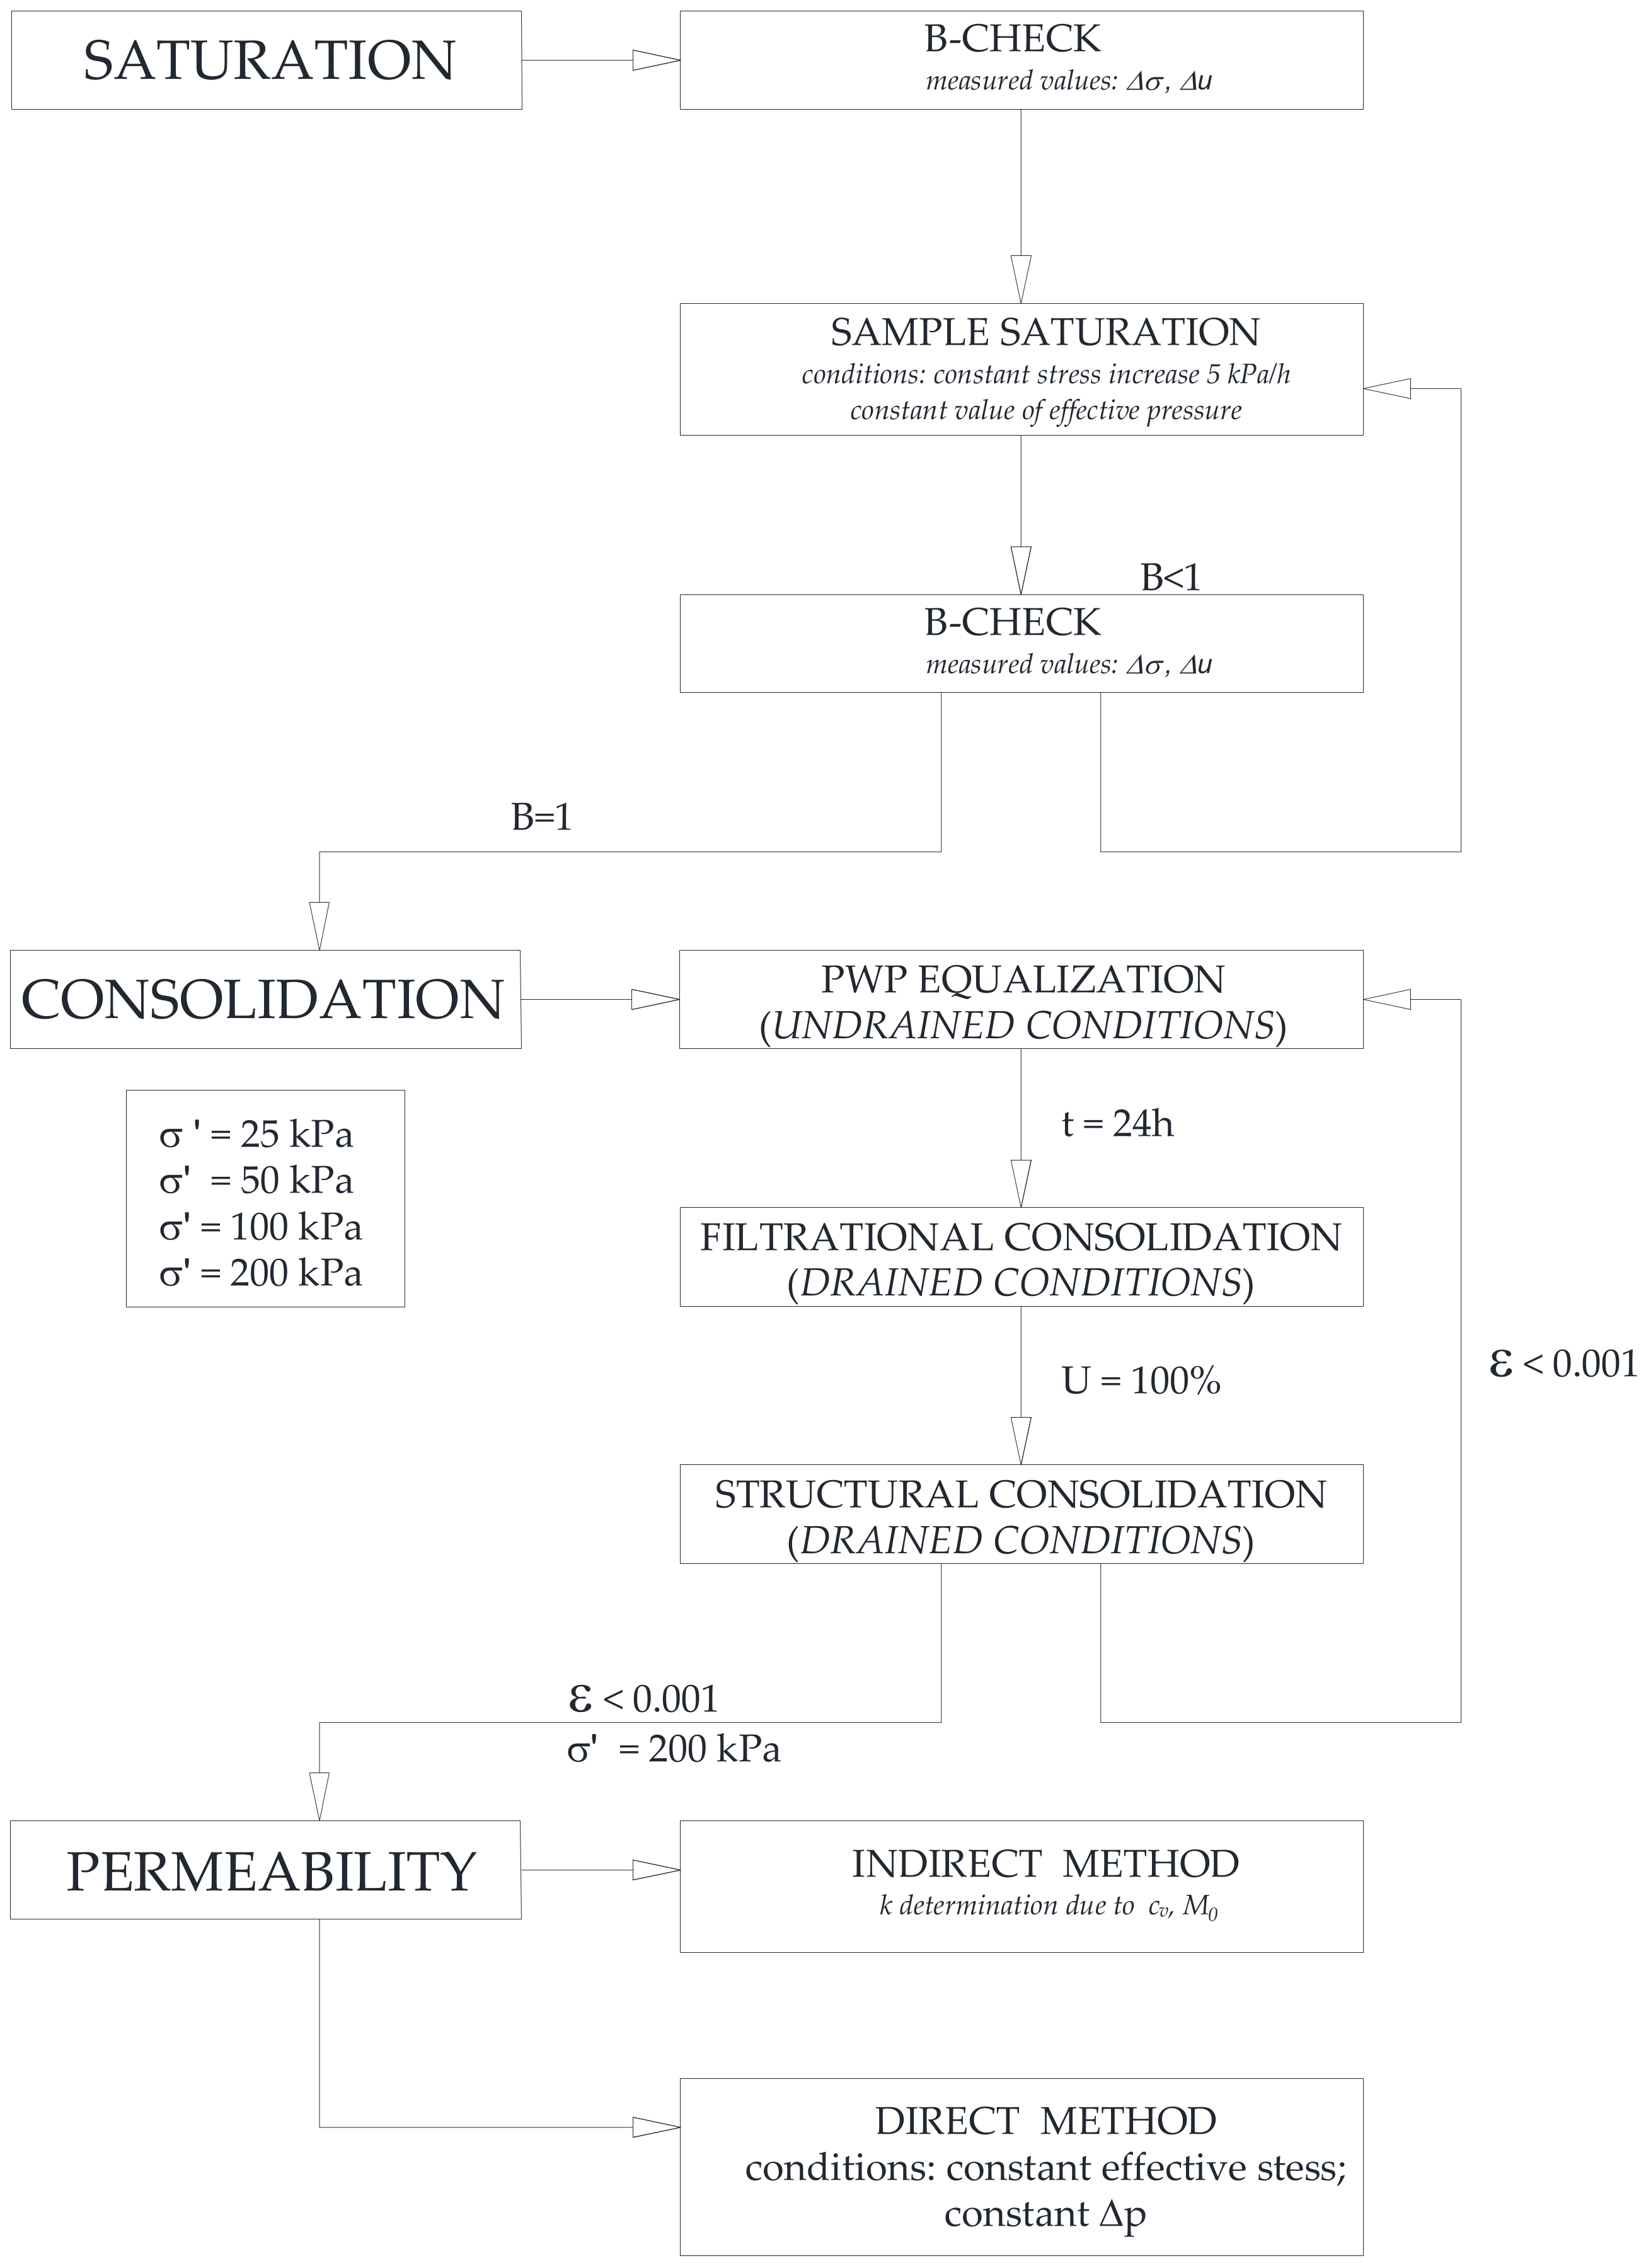
3.3.2. Testing Procedure
- Saturation
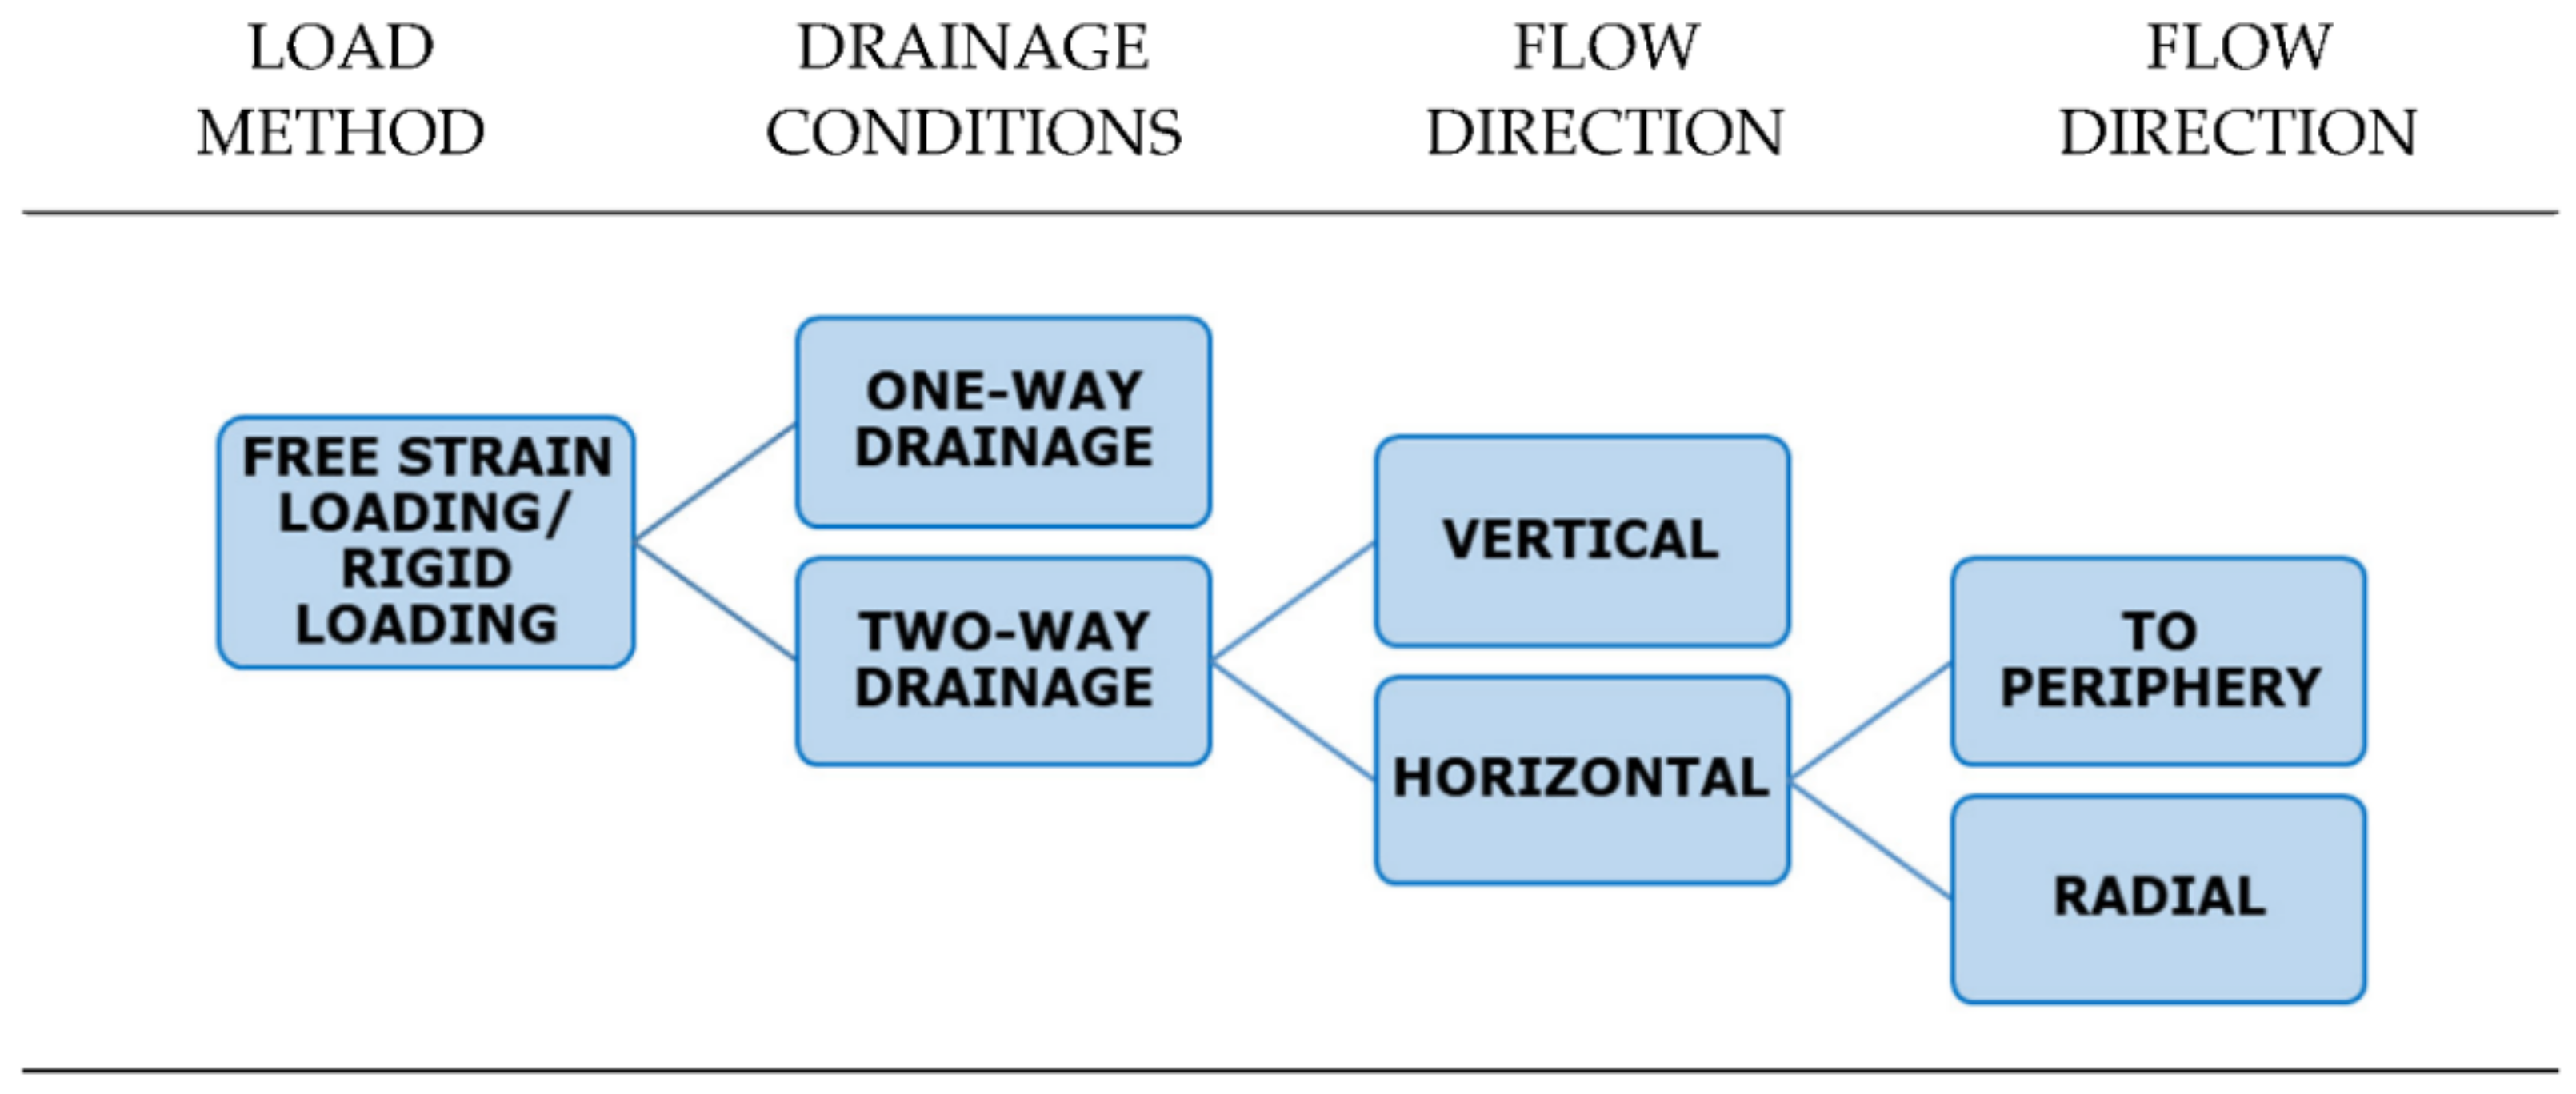
- Consolidation
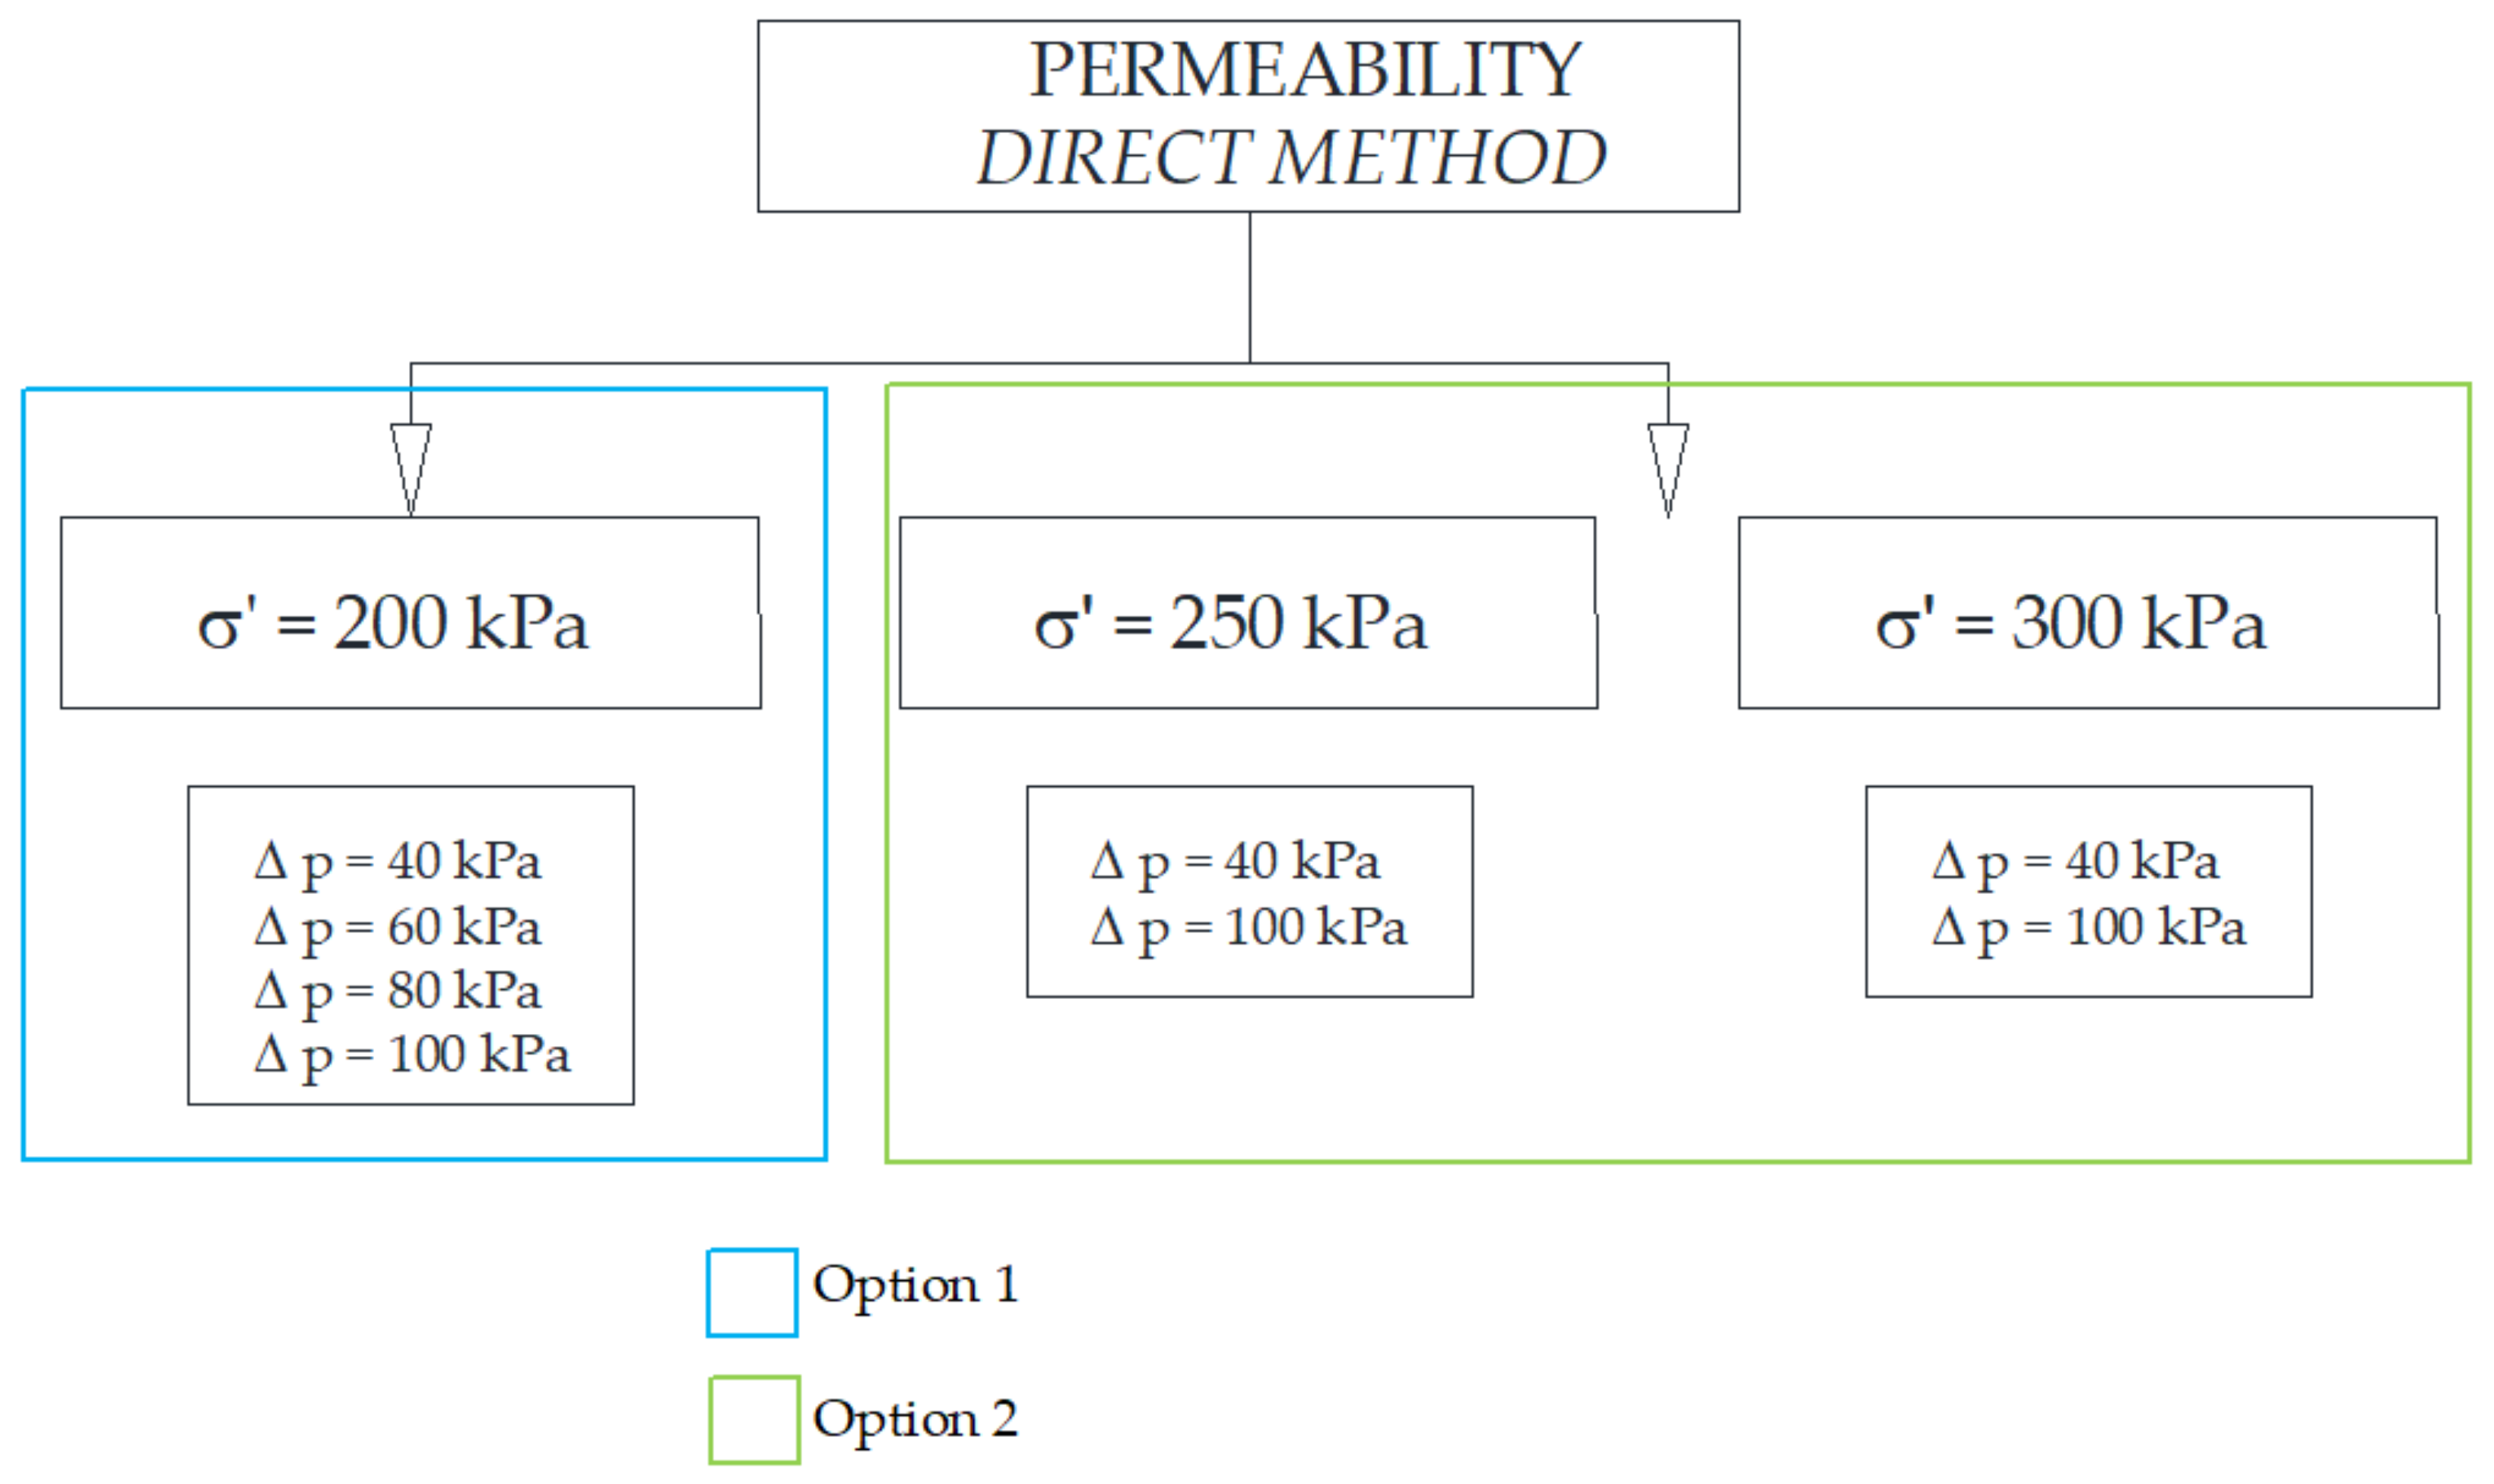
- Permeability
- fixed effective stress = 200 [kPa], with four different pressure gradients (40, 60, 80, 100 kPa)
- constant pressure gradient, with two different effective stress = 250 [kPa] and = 300 [kPa]:= 40 kPa—samples: CS2, CS3,= 100 kPa—sample CS1.
3.3.3. Specimen Preparation
4. Results and Discussion
4.1. Material Characteristic
4.1.1. The Grain Composition
4.1.2. The Chemical Properties
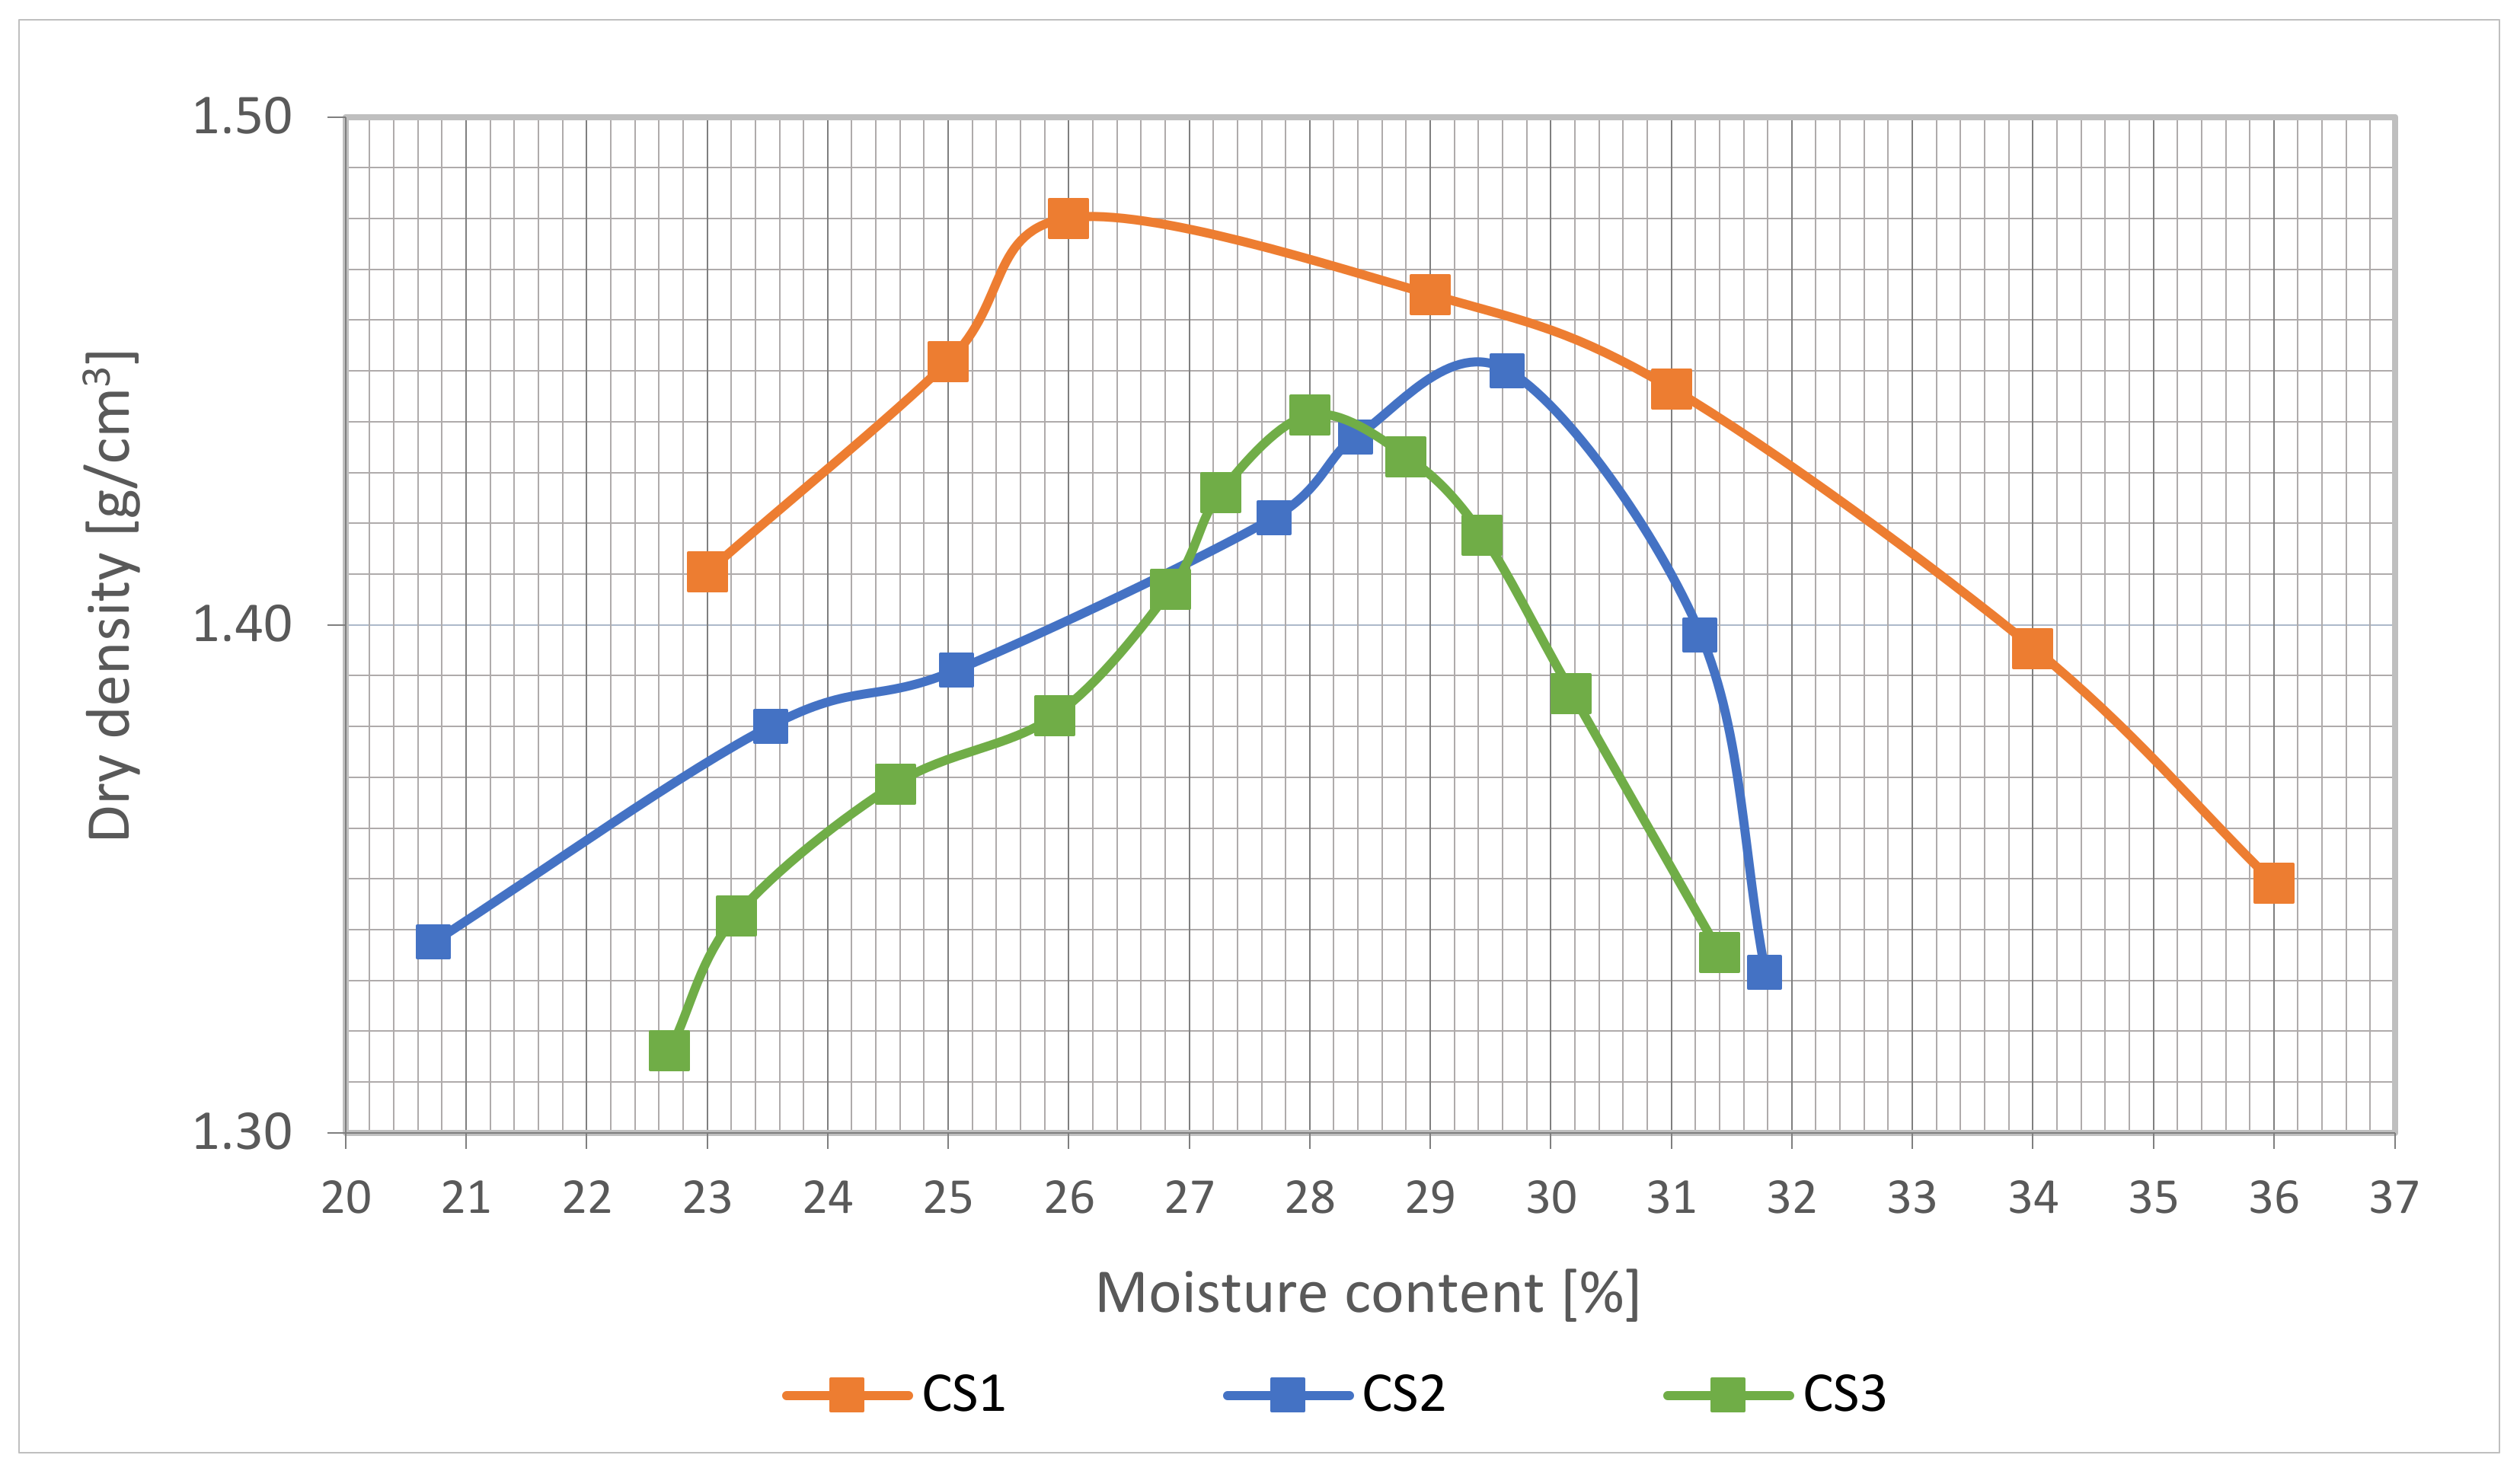
4.1.3. The Optimum Moisture
4.1.4. The Trace Element Content and Leachability of Chemical Impurities
4.1.5. The Radioactivity
4.1.6. The Mineralogical and Petrographic Properties
- The microscopic analysis
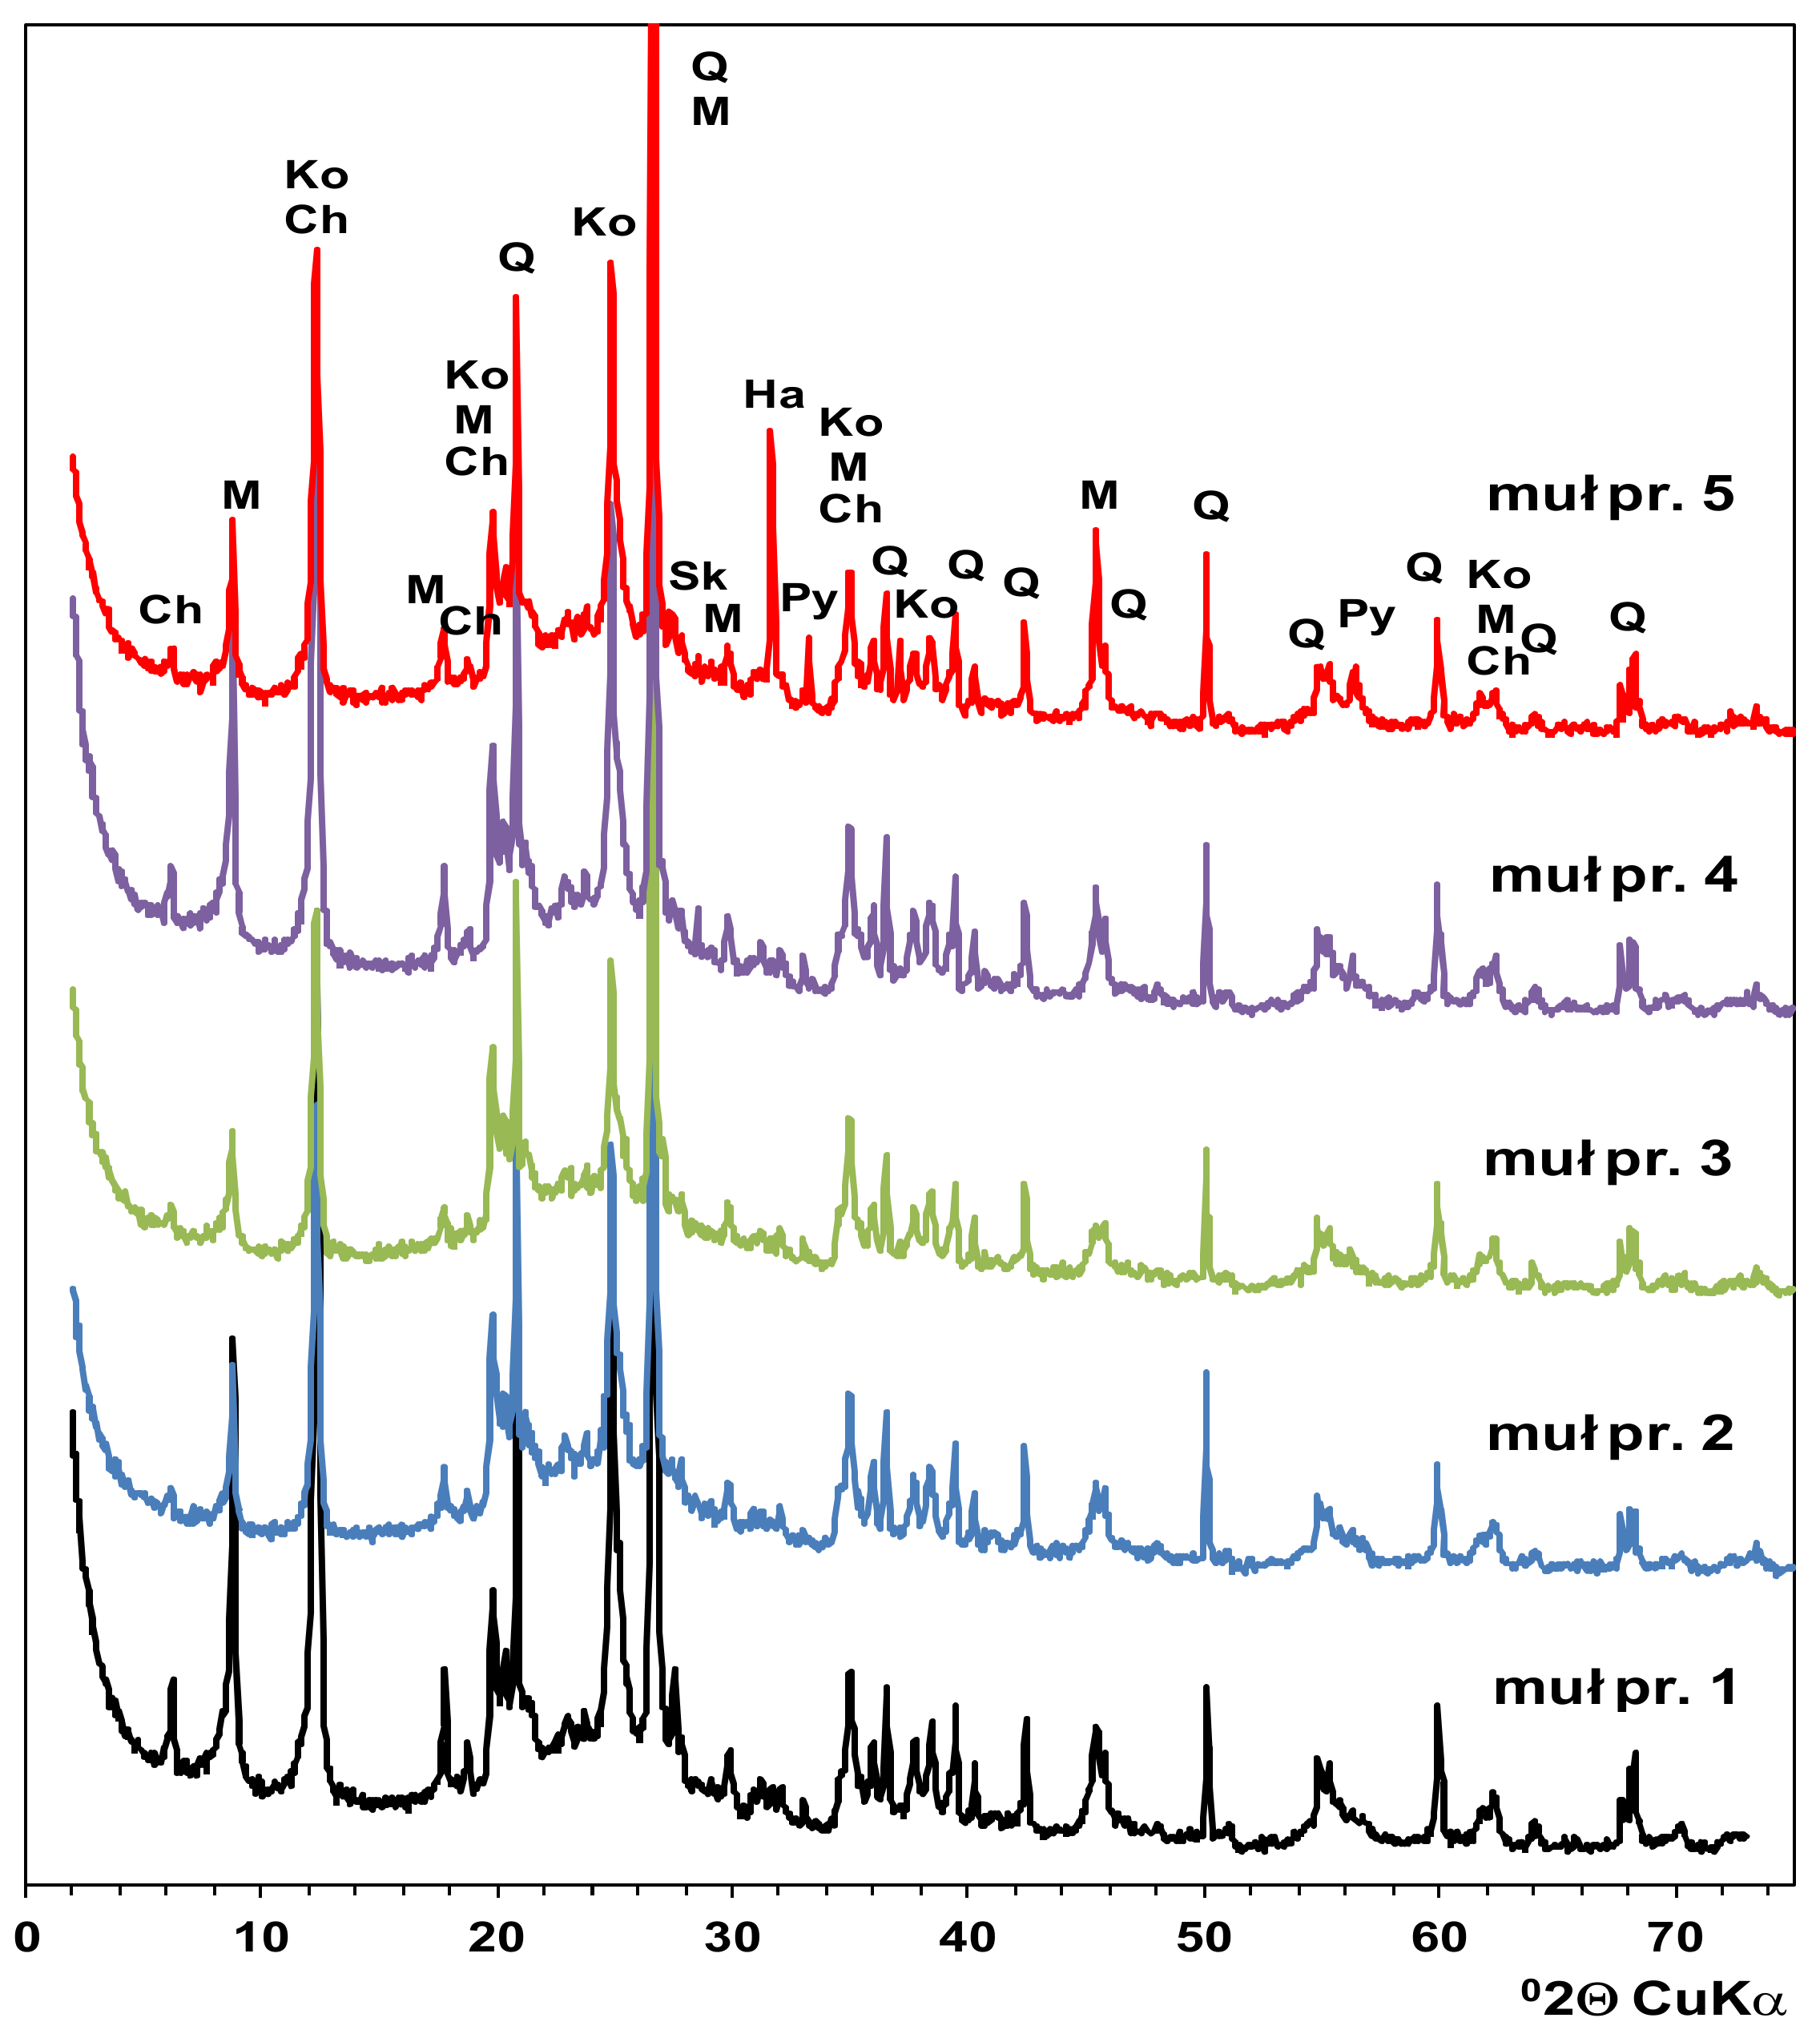
- The phase composition
4.2. Saturation
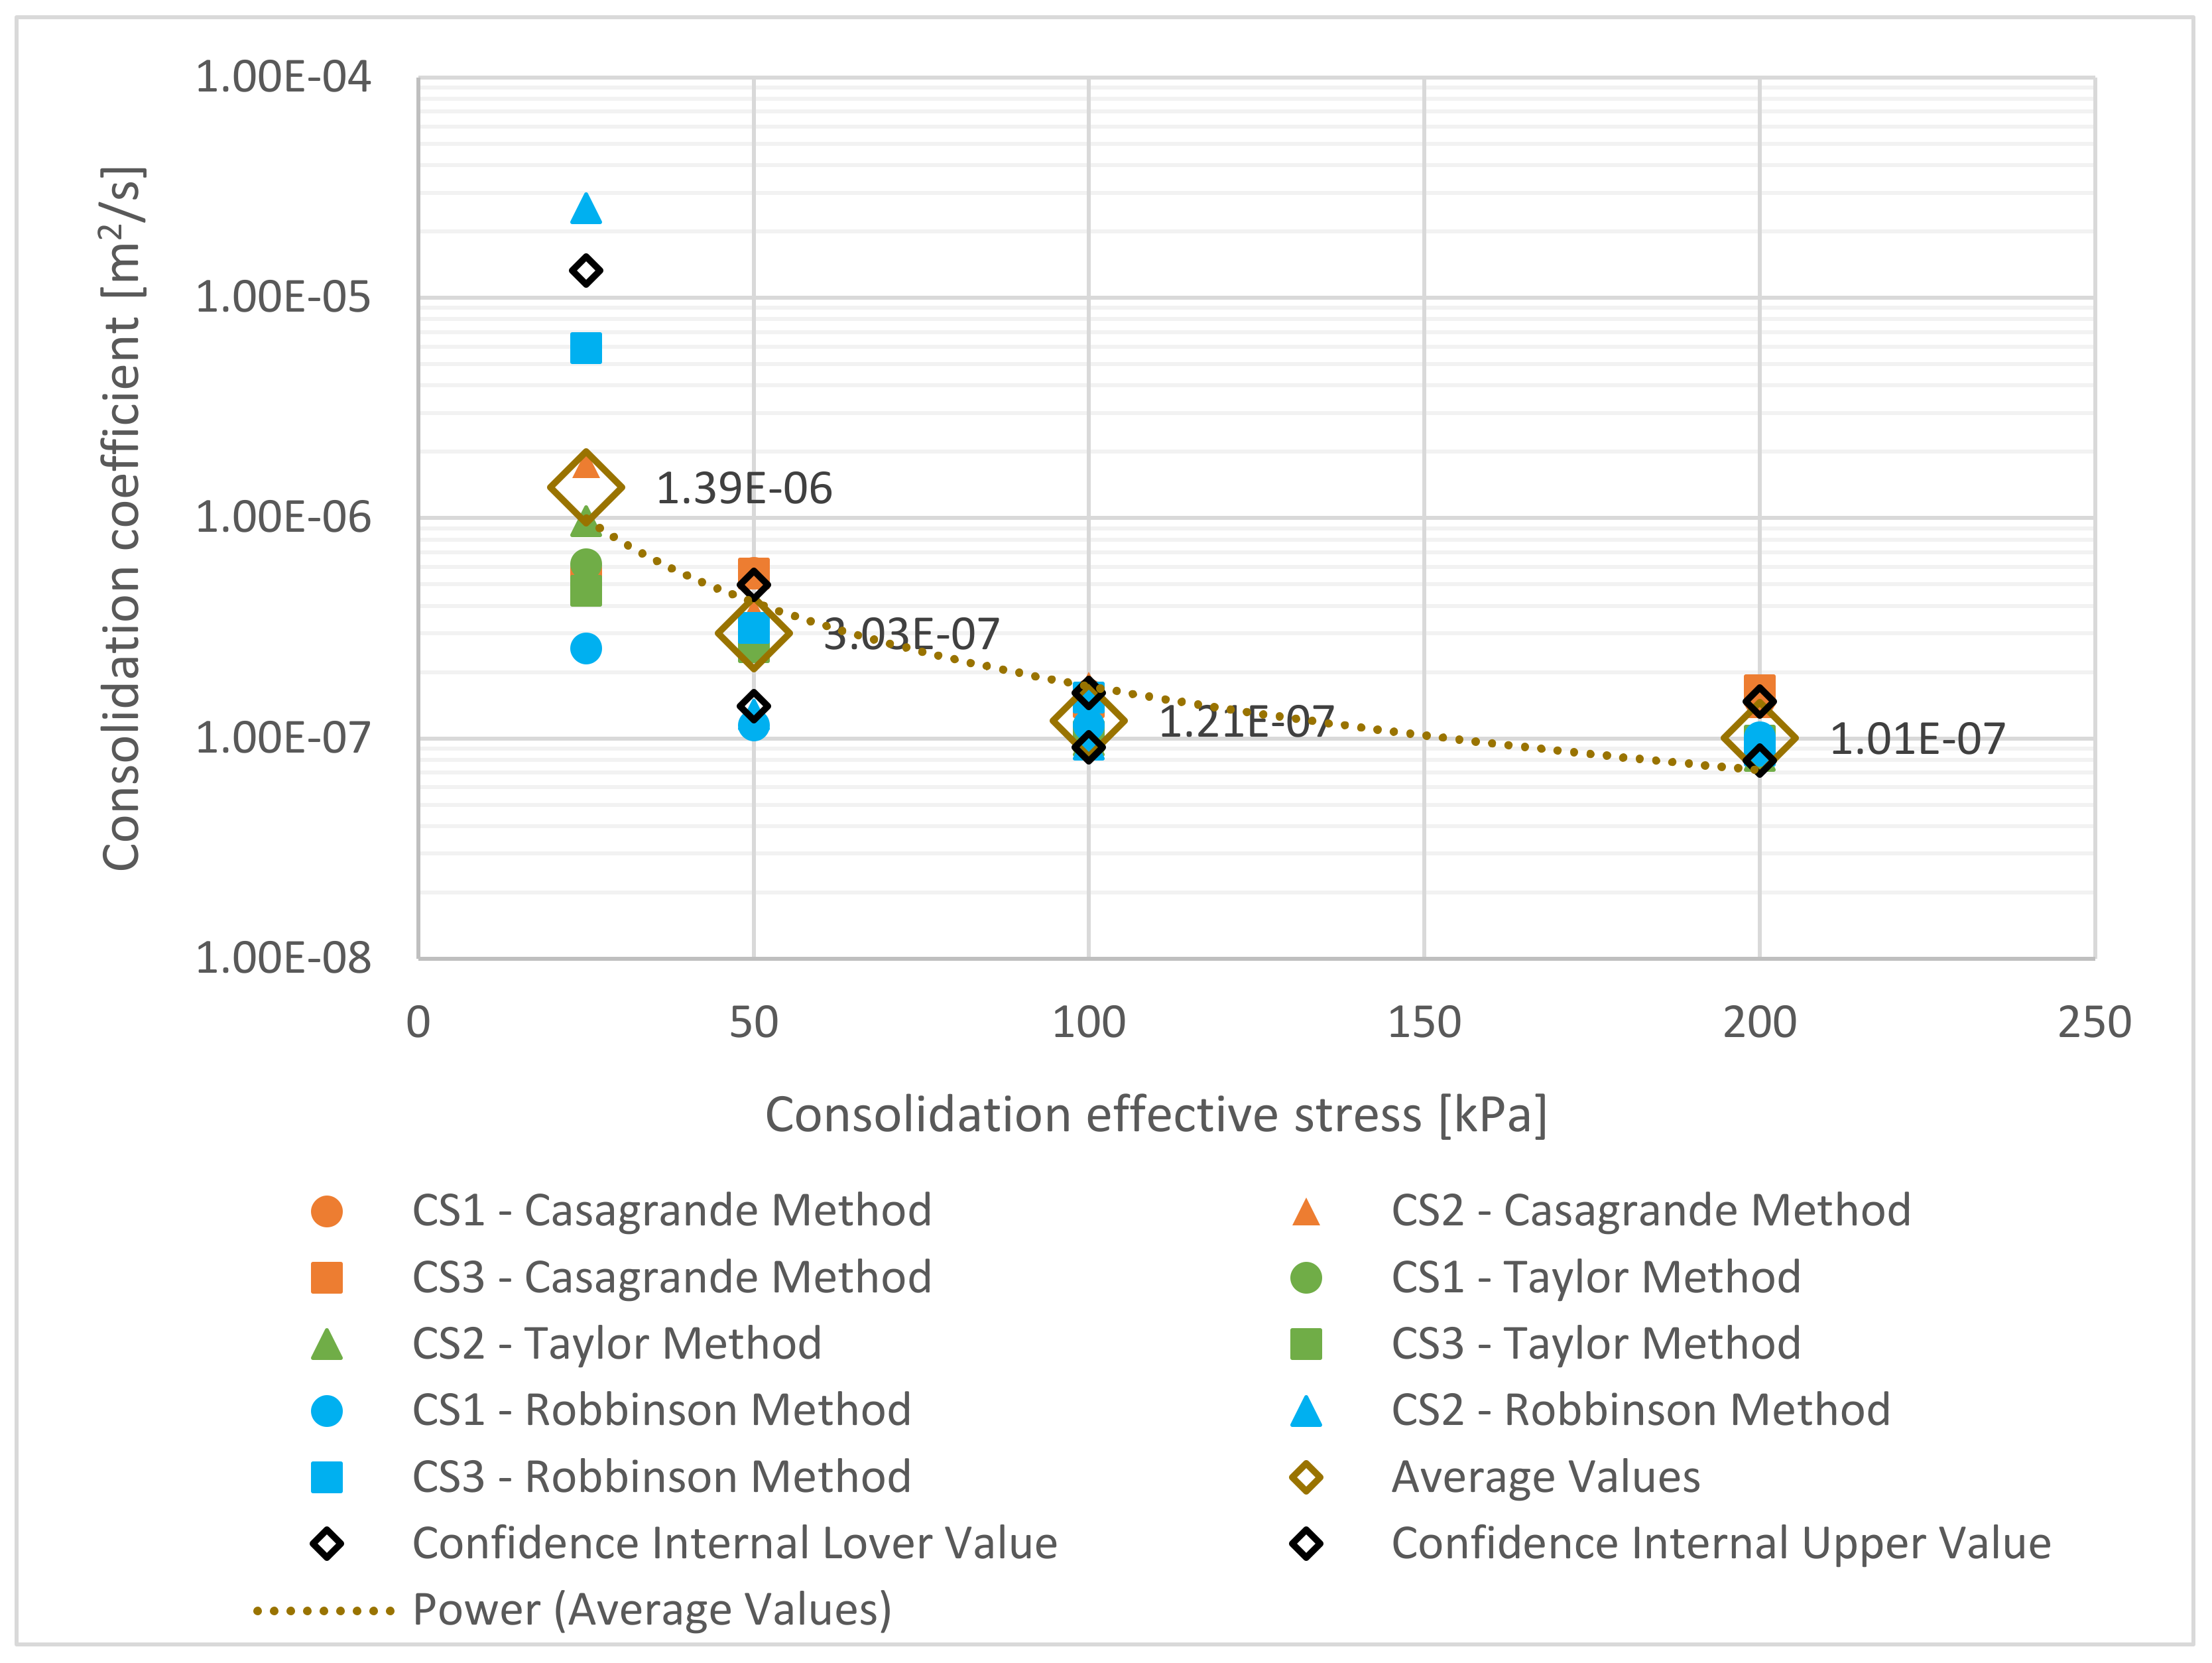
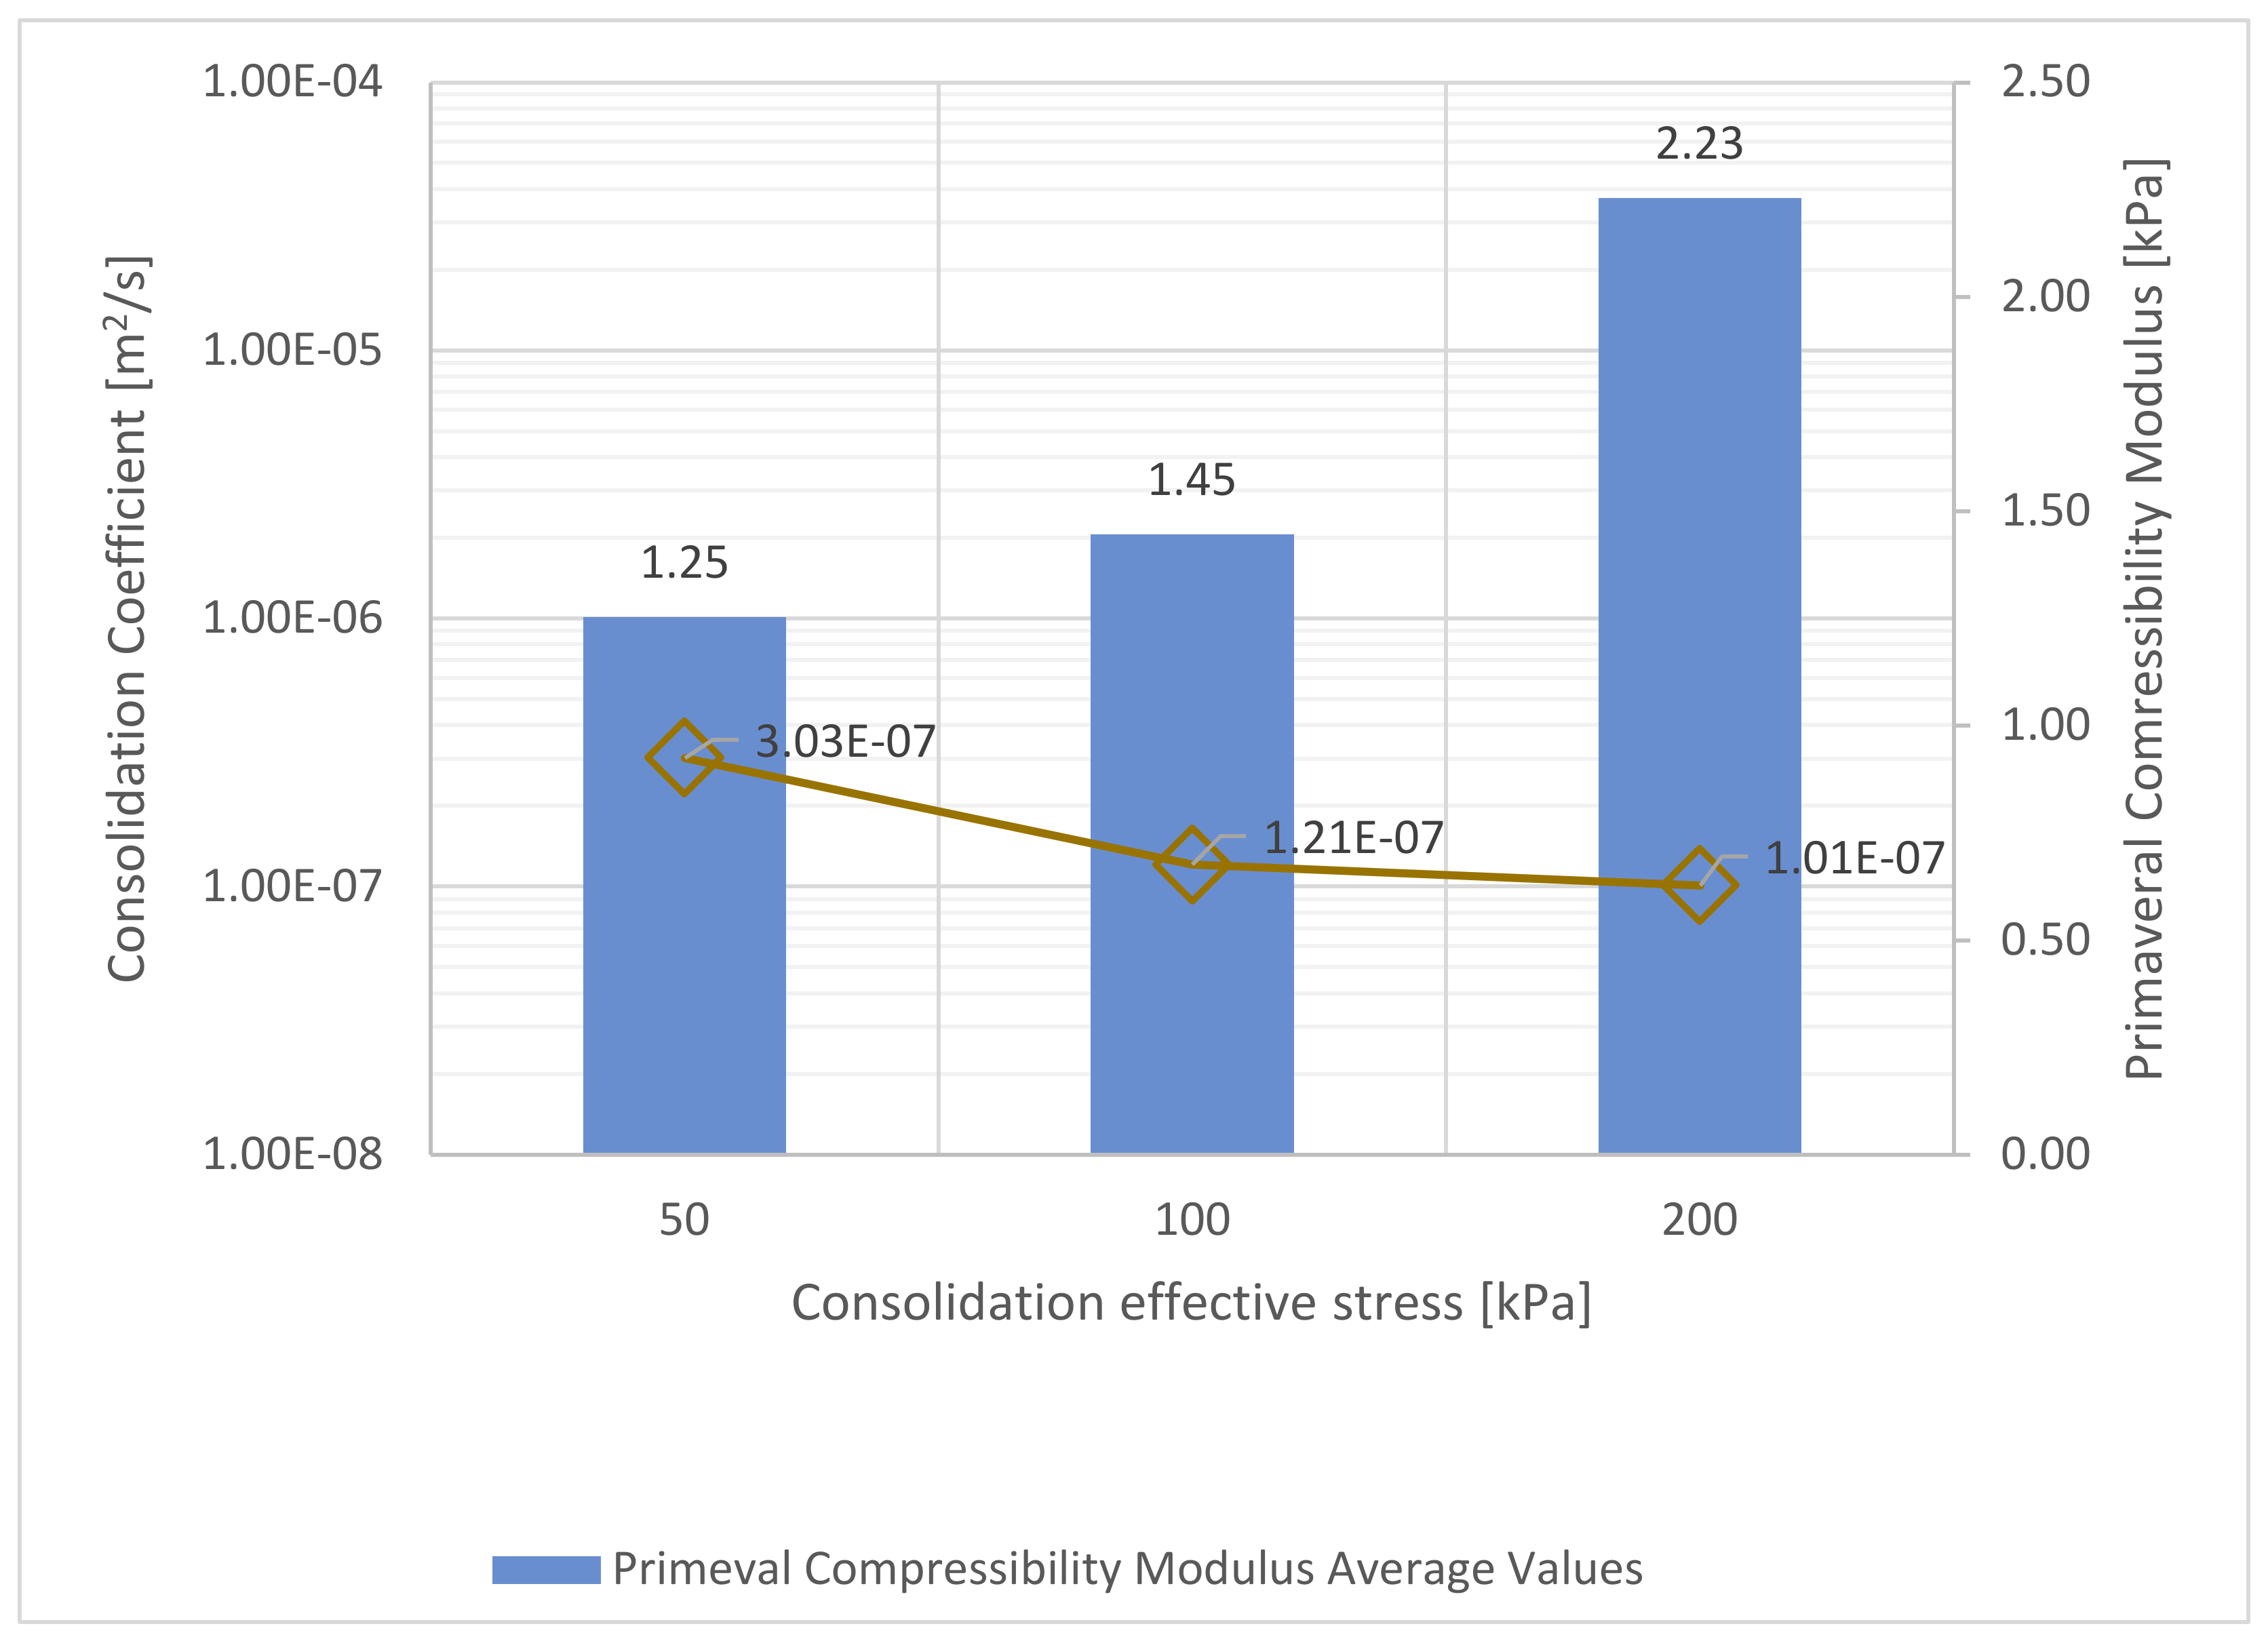
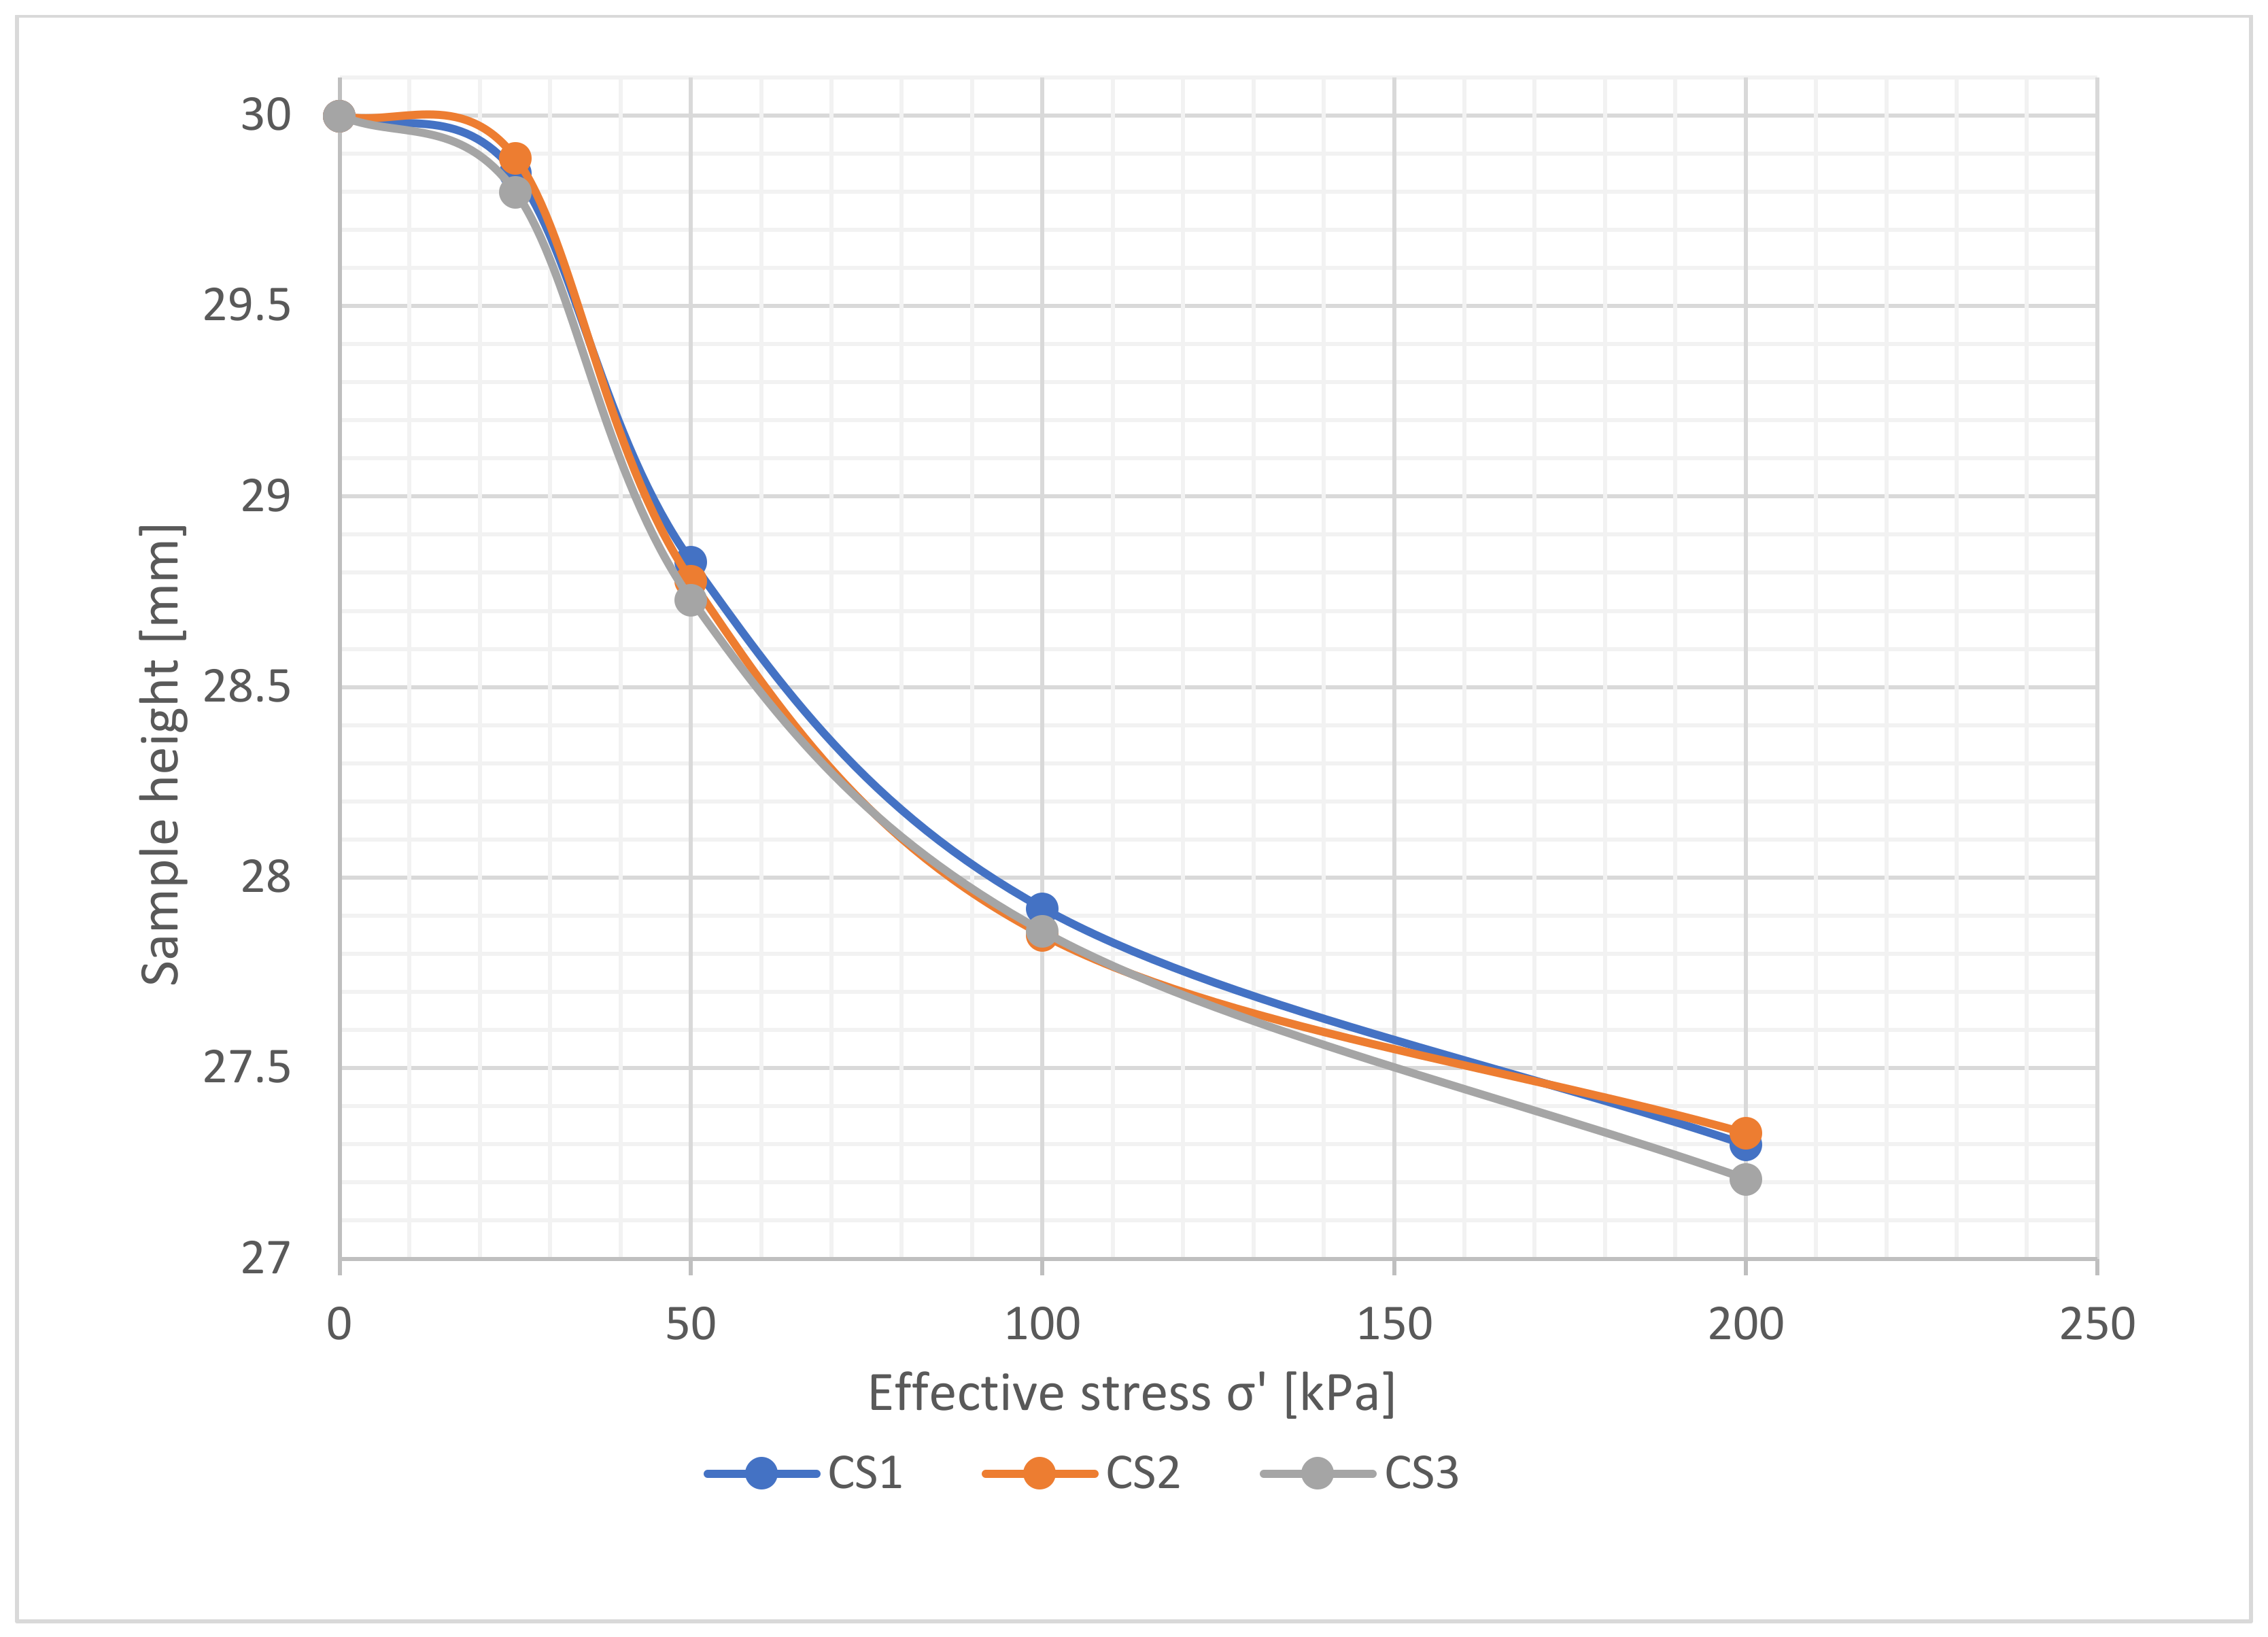
4.3. Consolidation
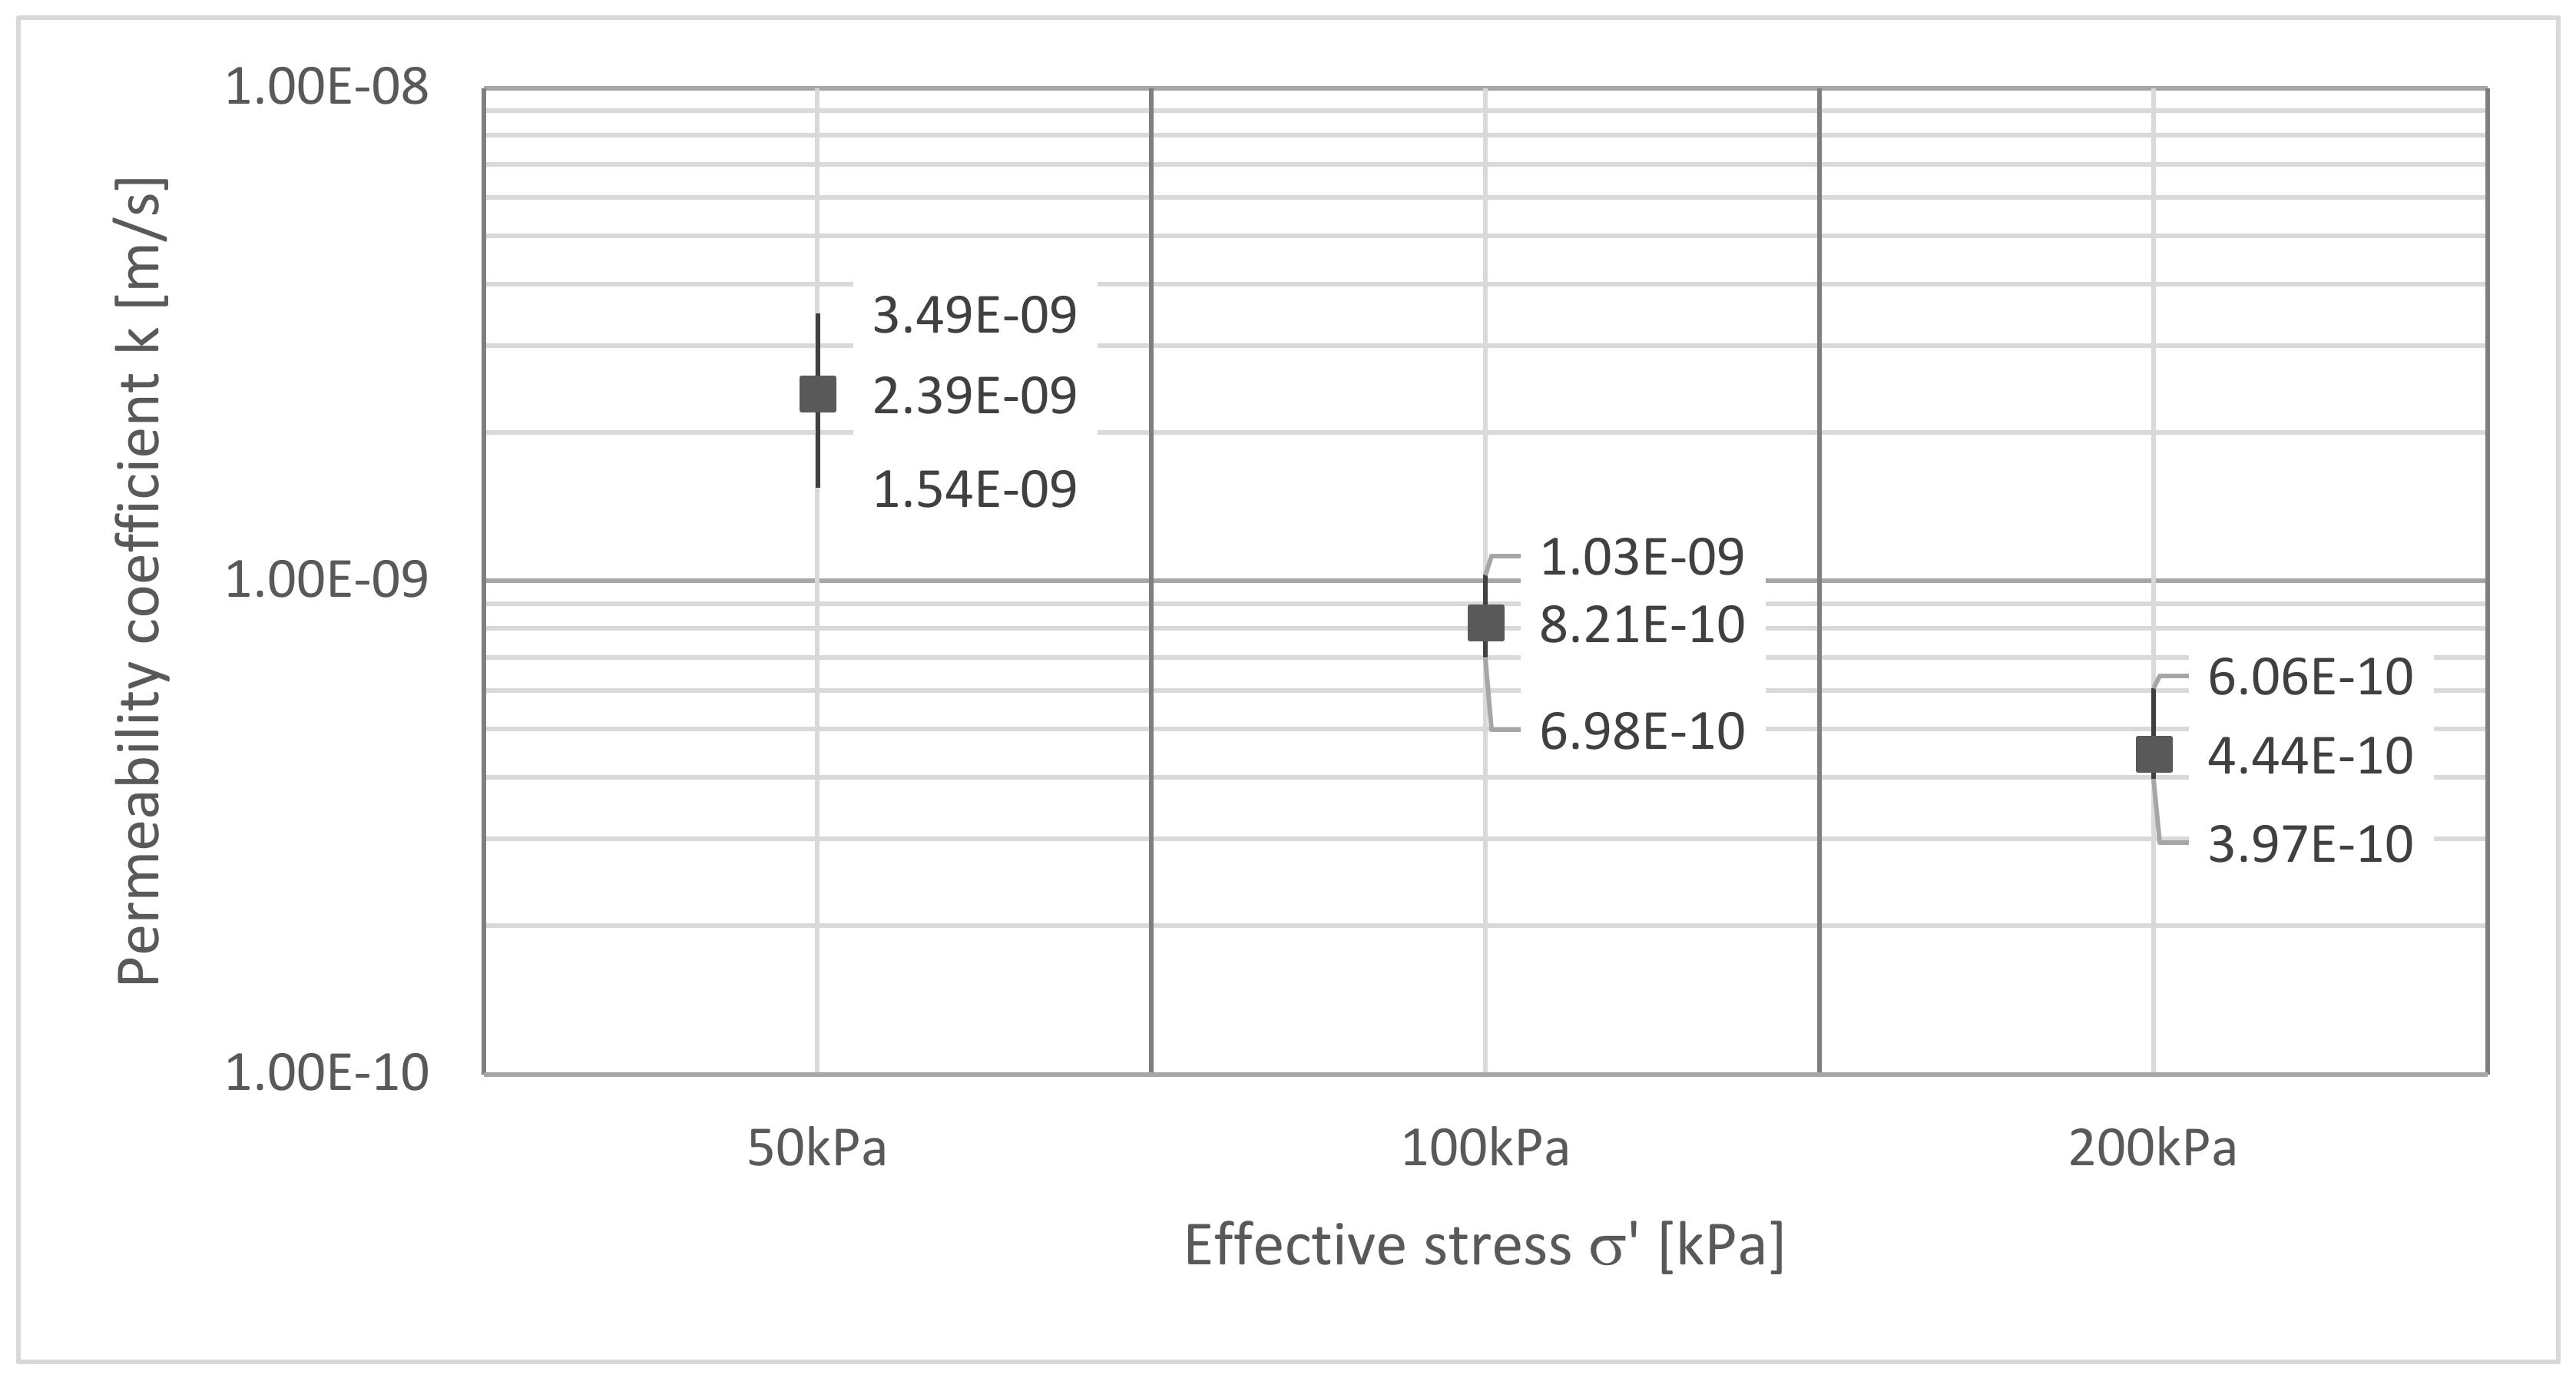
4.4. Permeability
4.4.1. Indirect Method
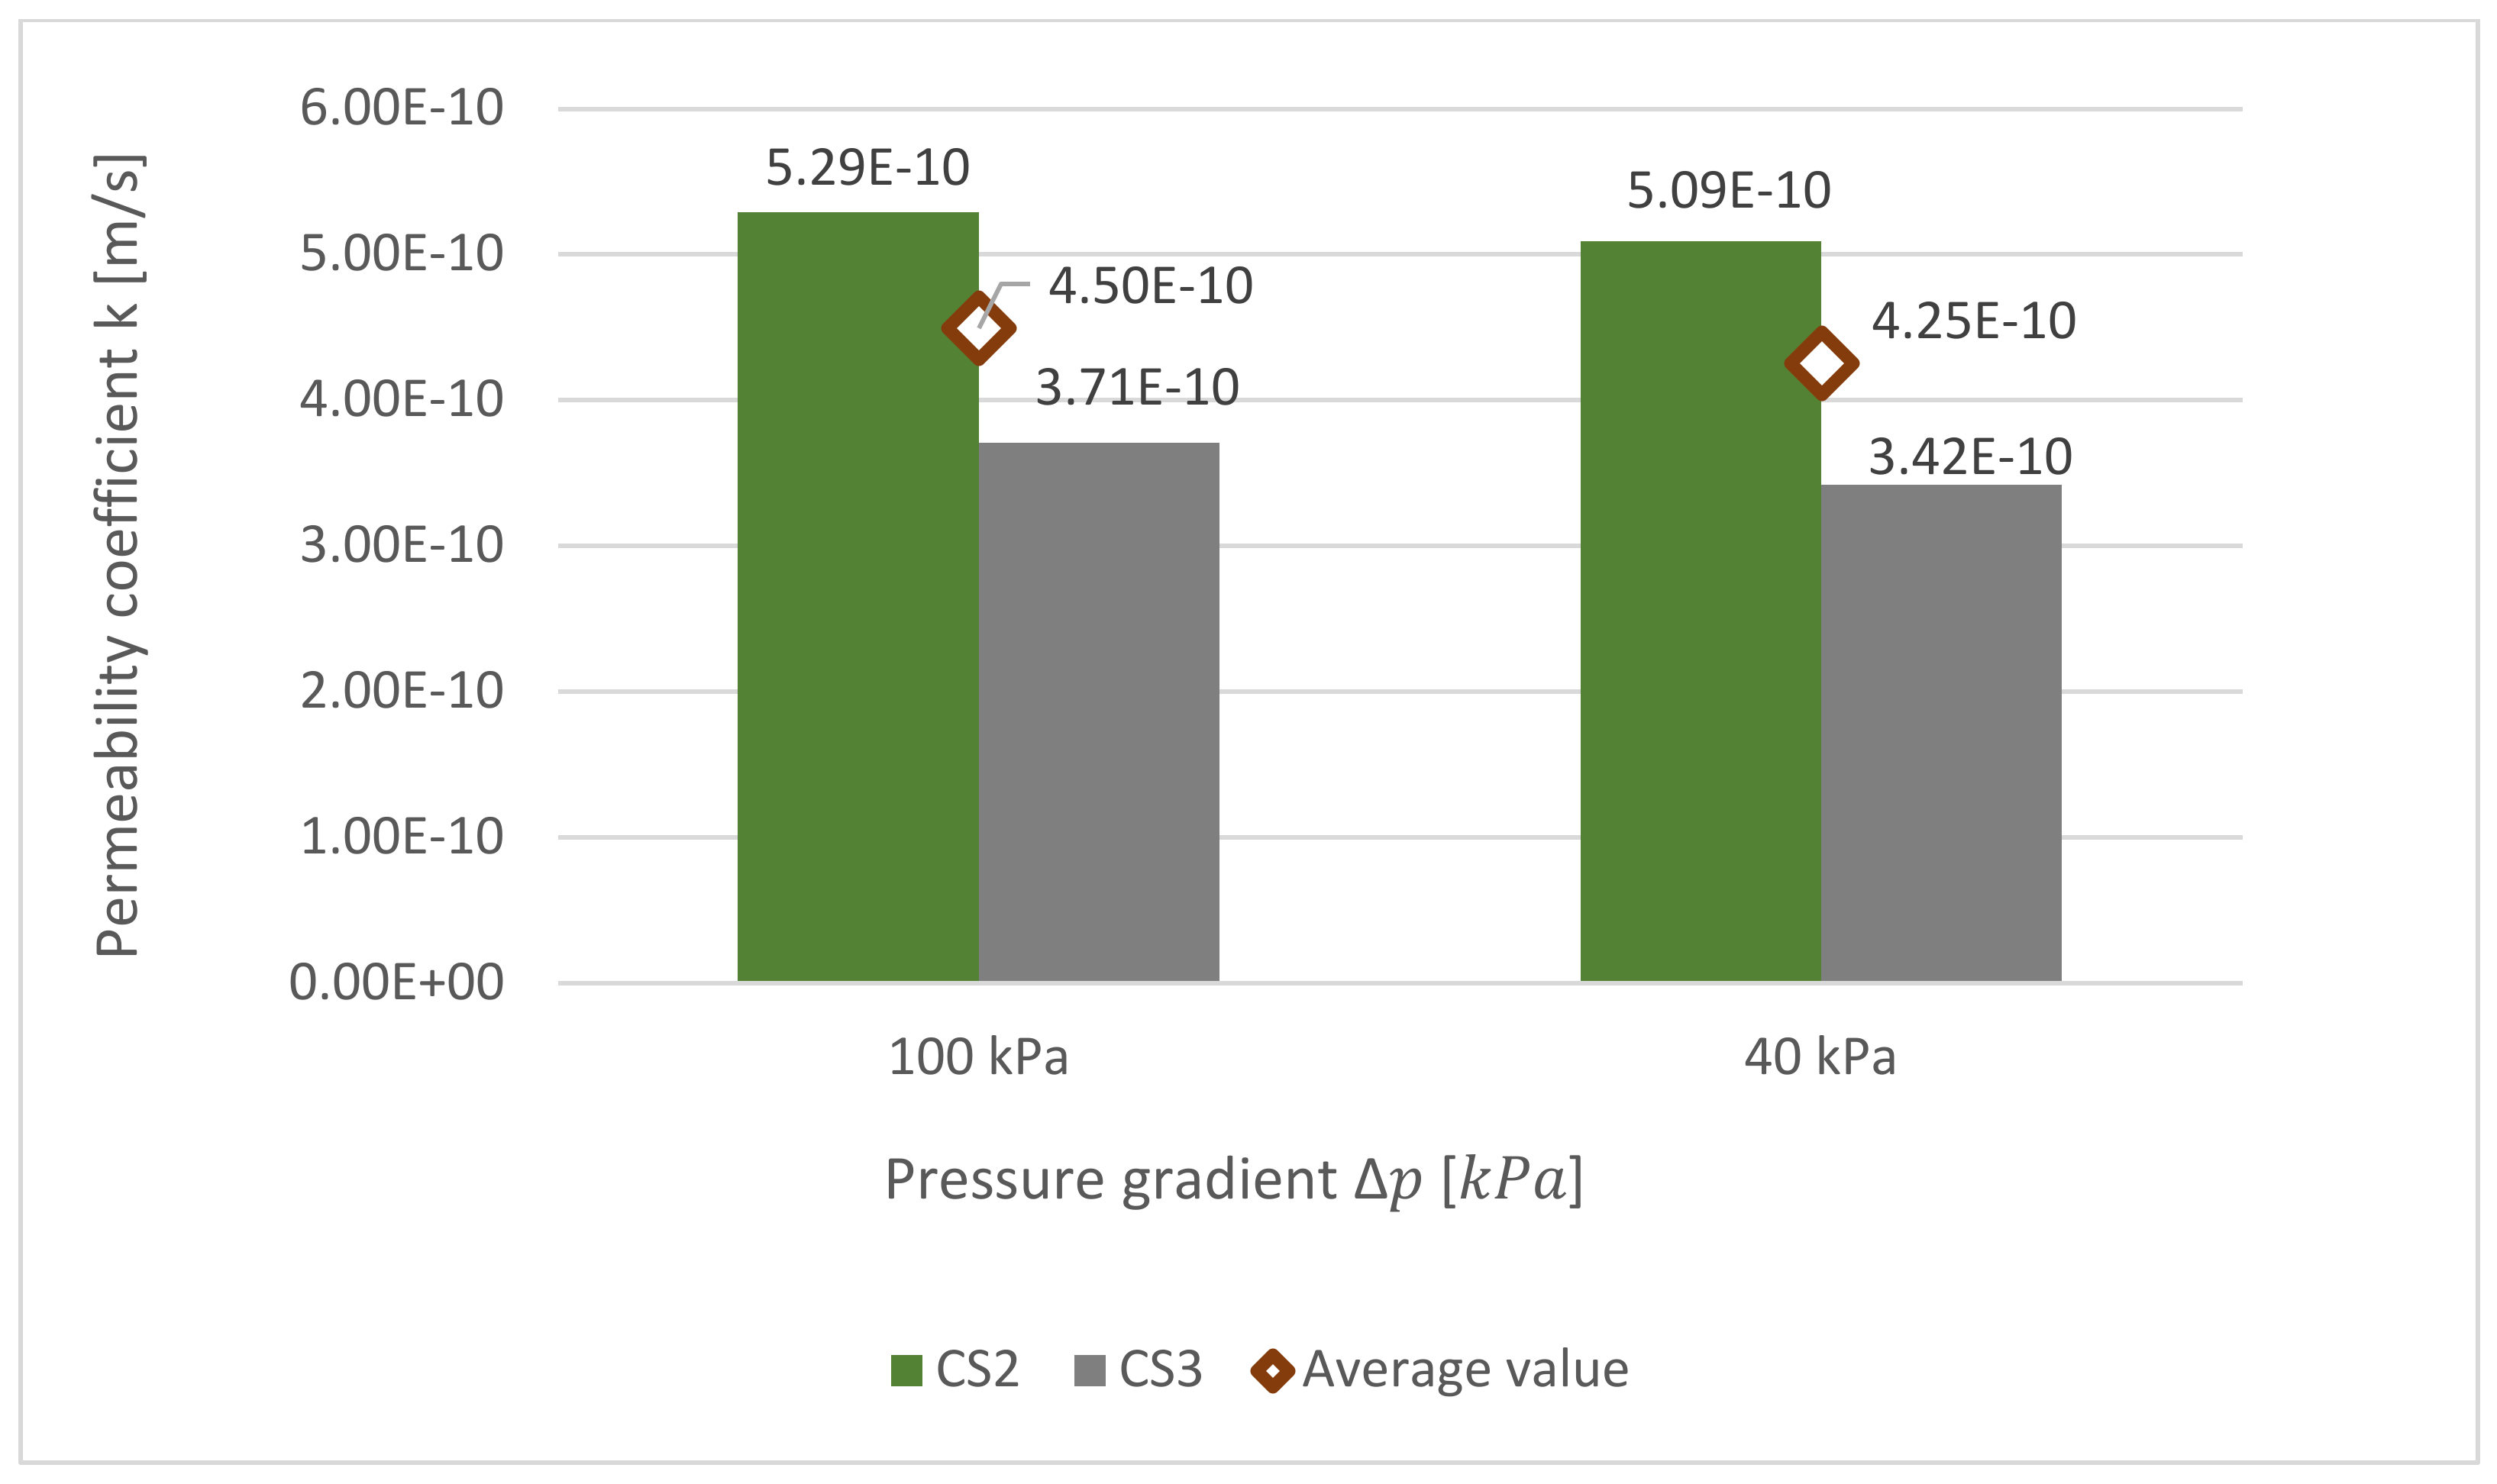
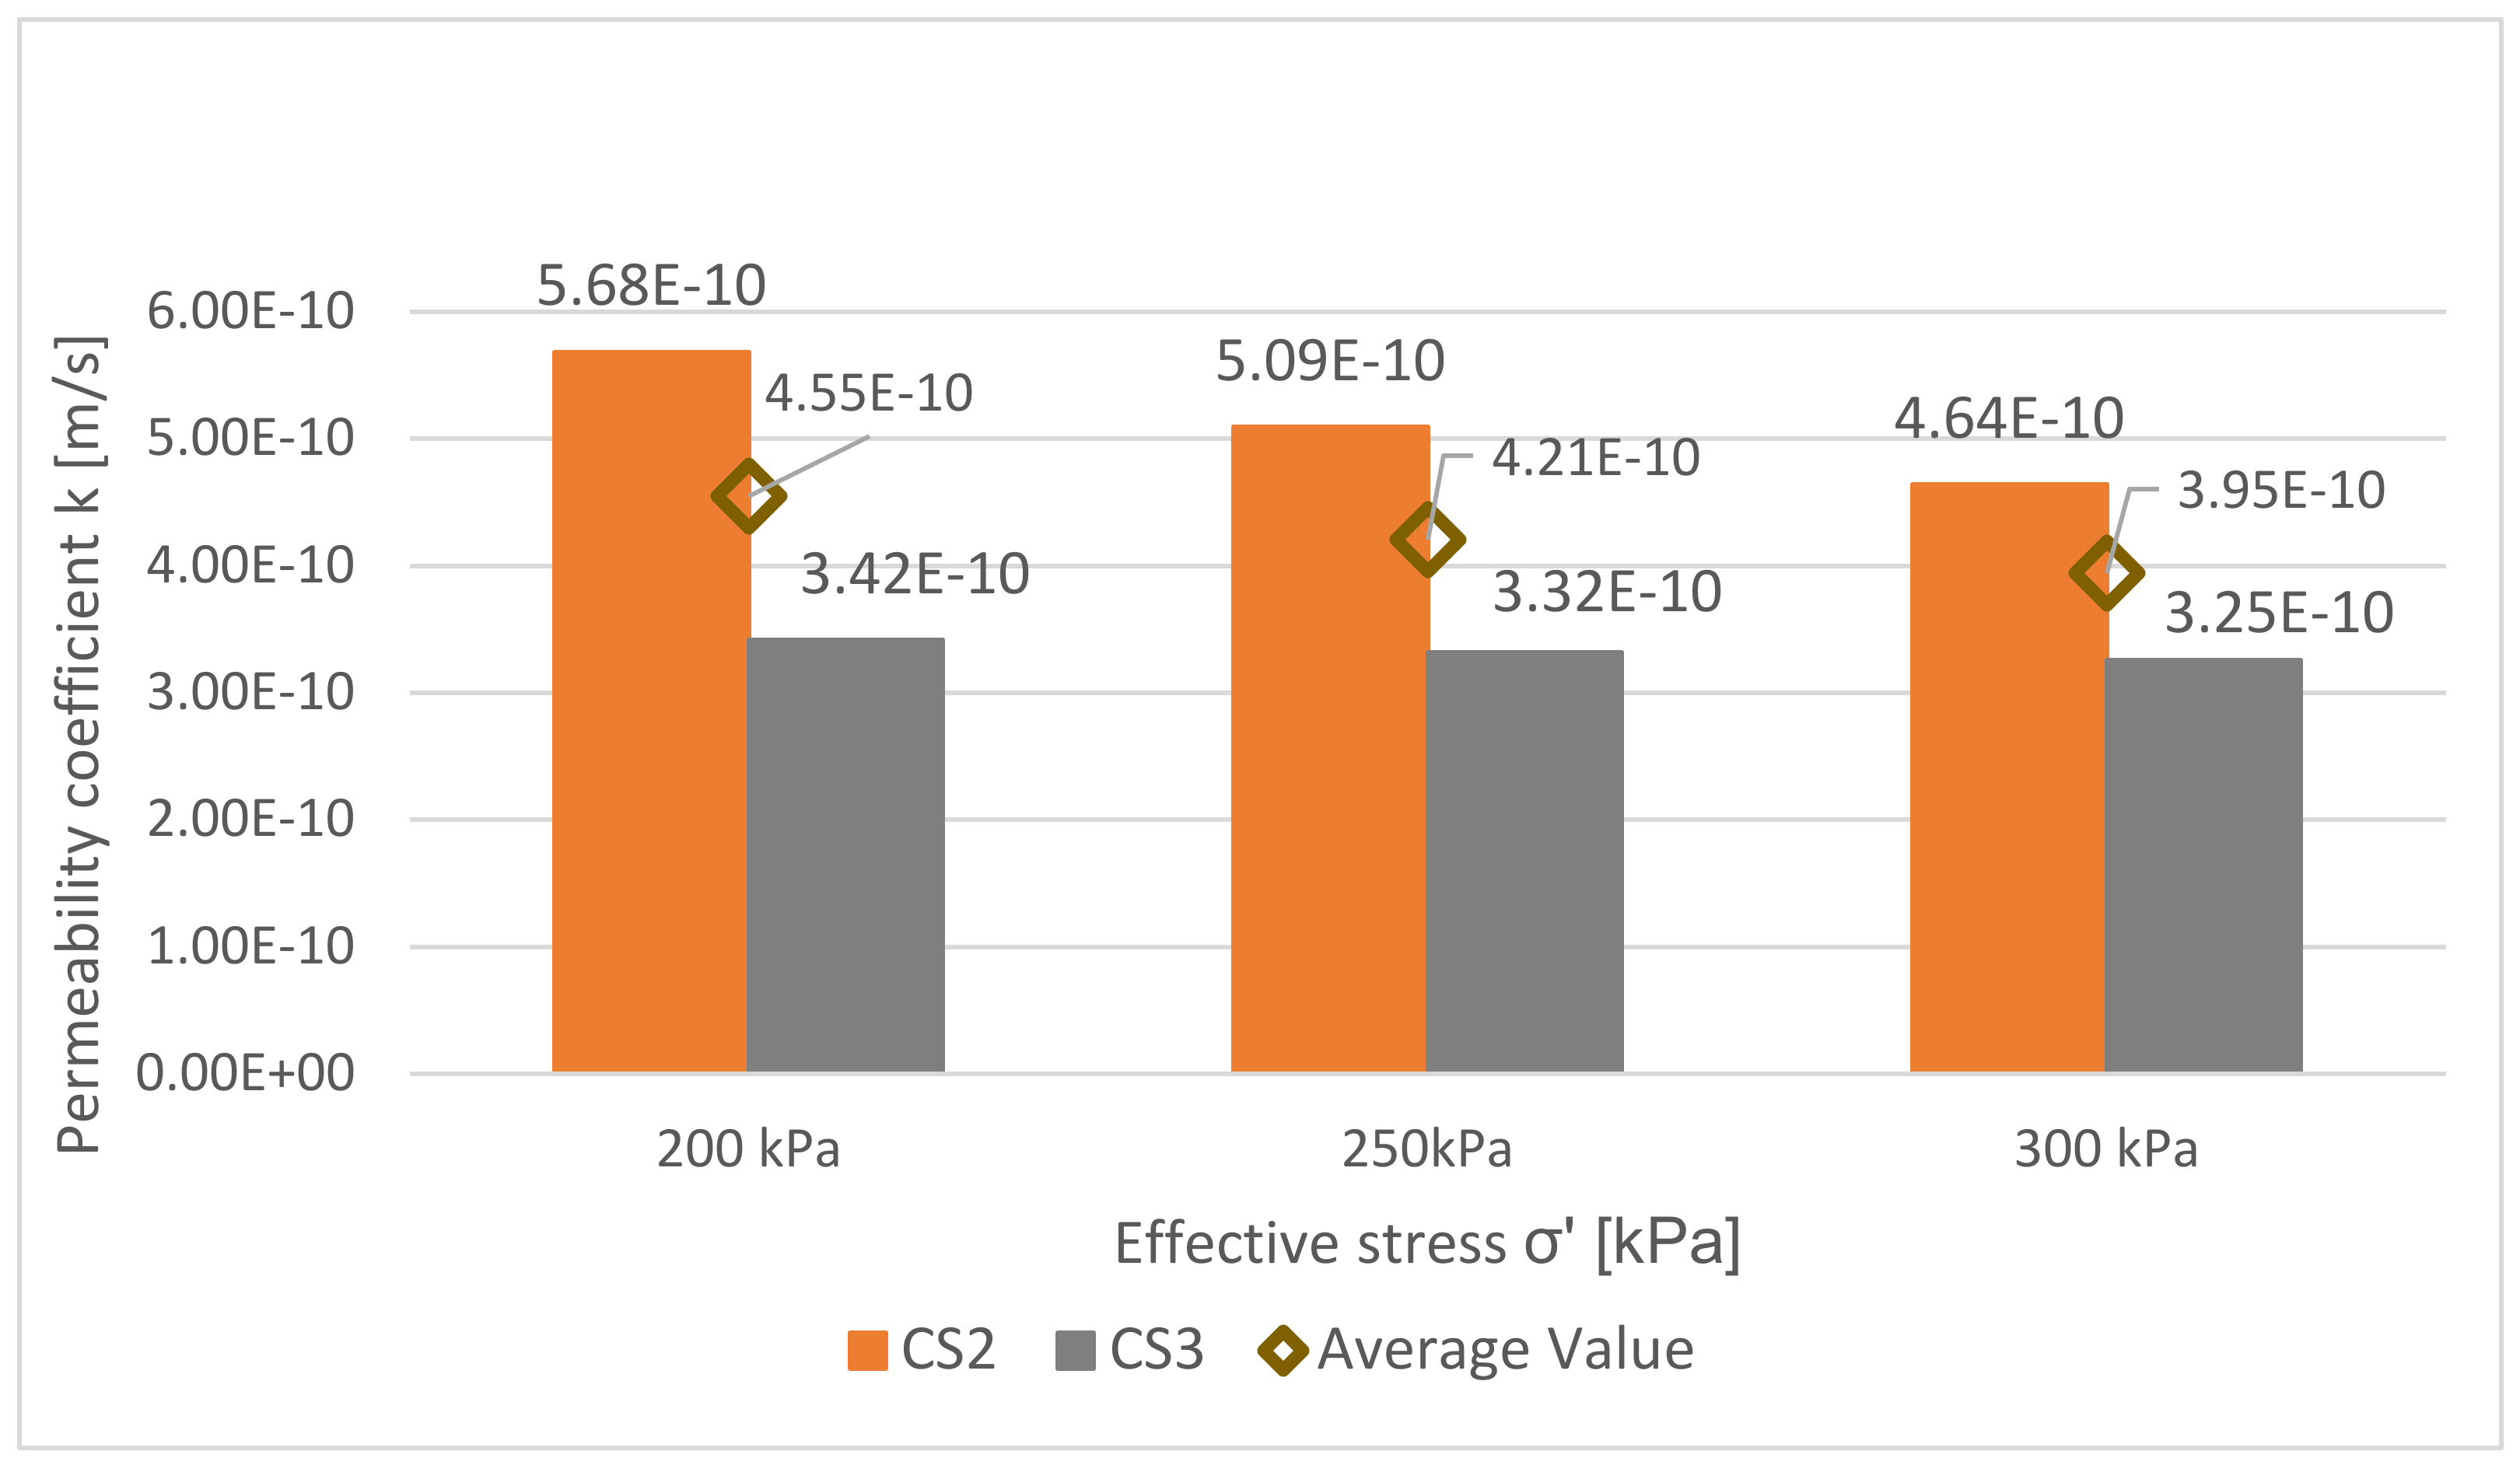
4.4.2. Direct Method
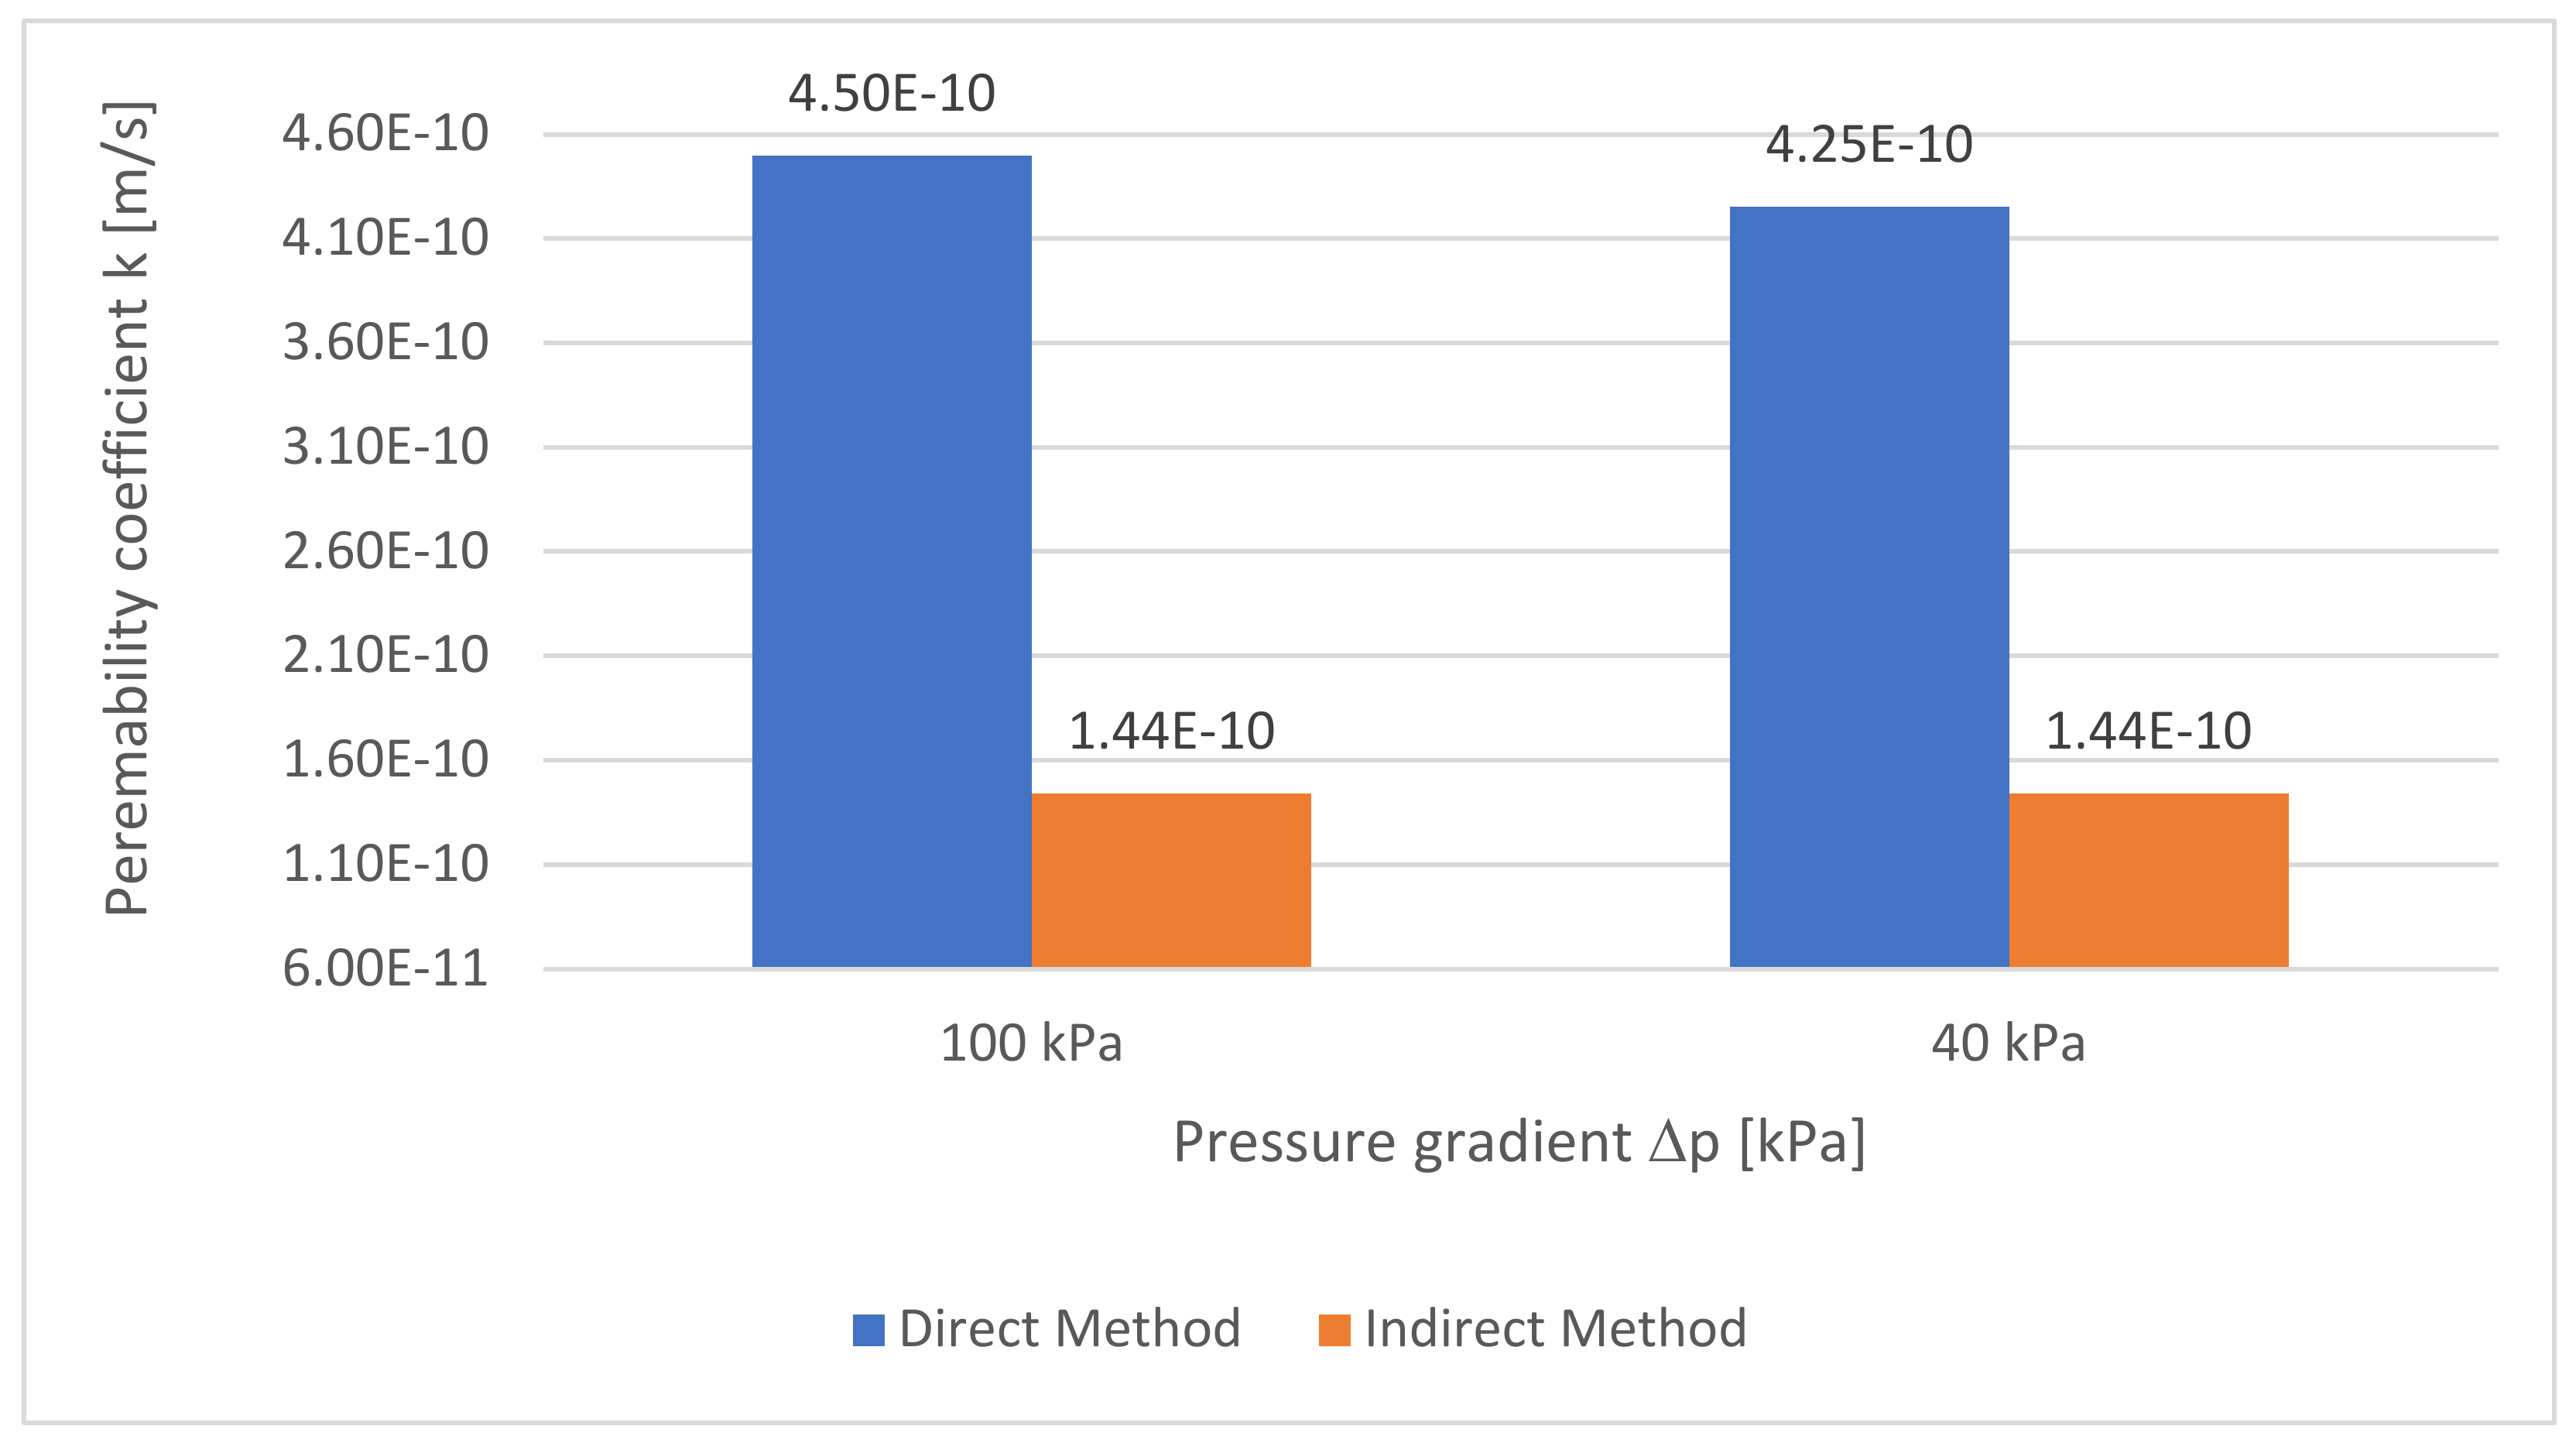
4.4.3. The Indirect and Direct Method Results Comparison
4.5. Summary of Research Results
5. Conclusions
Supplementary Materials
Author Contributions
Funding
Acknowledgments
Conflicts of Interest
Nomenclature
| A | cross-sectional area of the sample, |
| B | Skempton parameter, |
| CS | coal sludge, |
| cv | coefficient of consolidation, m2/s |
| water weight, | |
| k | coefficient of permeability, m/s |
| L | sample length, m, mm |
| one-sided primary compressibility modulus of the soil, | |
| volumetric compressibility factor of the soil, | |
| pc | pressure loss in the system for flow rate q [kPa], |
| q | the average rate of water flow through the sample [mL/min], |
| Rt | temperature correction factor for water viscosity, |
| t | consolidation process duration time (time elapsed since the load was applied), s |
| u | pore water pressure after time t, |
| U | degree of dissipation of water pressure in the pores of the ground, |
| u0 | excess pore water pressure in the soil at the beginning of the consolidation phase, |
| u1 | pore water pressure at the beginning of the consolidation process, |
| u2 | pore pressure in the soil at the end of the consolidation phase, |
| ut | excess water pressure in the soil pores during consolidation time t, |
| increase in pore water pressure in the soil [kPa], | |
| increment of vertical consolidation pressure [ kPa], | |
| Uz | degree of consolidation, |
| Δp = (p1 − p2) | the difference between the pressure of water entering the sample, and the pressure of water leaving it [kPa]. |
References
- Skarżyńska, K.M. Reuse of coal mining waste in civil engineering–part 1: Properties of minestone. Waste Manag. 1995, 15, 2–42. [Google Scholar] [CrossRef]
- Zawisza, E. Wpływ zagęszczenia i wilgotności na wytrzymałość na ścinanie wybranych odpadów przemysłowych i gruntu mineralnego (Influence of compaction and humidity on shear strength of selected industrial waste and mineral soil, Polish). Przegląd Górniczy 2006, 62, 27–32. [Google Scholar]
- Kuranchie, F.A.; Shukla, S.K.; Habibi, D. Mine wastes in Western Australia and their suitability for embankment construction. In Proceedings of the Geotechnical Special Publication, San Diego, CA, USA, 3–7 March 2013; pp. 1443–1452. [Google Scholar]
- Amrani, M.; Taha, Y.; El Haloui, Y.; Benzaazoua, M.; Hakkou, R. Sustainable Reuse of Coal Mine Waste: Experimental and Economic Assessments for Embankments and Pavement Layer Applications in Morocco. Minerals 2020, 10, 851. [Google Scholar] [CrossRef]
- Banerjee, L.; Chawla, S.; Kumar Dash, S. Application of geocell reinforced coal mine overburden waste as subballast in railway tracks on weak subgrade. Constr. Build. Mater. 2020, 265, 120774. [Google Scholar] [CrossRef]
- Chugh, Y.P.; Behum, P.T. Coal waste management practices in the USA: An overview. Int. J. Coal Sci. Technol. 2014, 1, 163–176. [Google Scholar] [CrossRef] [Green Version]
- Fan, G.; Zhang, D.; Wang, X. Reduction and utilization of coal mine waste rock in China: A case study in Tiefa coalfield. Resources. Conserv. Recycl. 2014, 83, 24–33. [Google Scholar] [CrossRef]
- Gruchot, A.; Zawisza, E. Zagęszczalność i nosność wybranych odpadów powęglowych i pohutniczych Compactability and bearing capacity of selected coal and metallurgical waste. Przegląd Górniczy 2007, 63, 26–30. [Google Scholar]
- Adamczyk, J. Basic geotechnical properties of mining, and processing waste–a state of the art analysis. AGH J. Min. Geoengin. 2012, 36, 31–41. [Google Scholar]
- Gruchot, A. Wskaźnik nosnosci CBR kompozytów z odpadów powęglowych i popiołu lotnego. Przegląd Górniczy 2014, 2, 12–17. [Google Scholar]
- Baic, I.; Blaschke, W.; Szafarczyk, J. Deposits of coal sludge as a source of energy fuel-information on the development project. Przegląd Górniczy 2010, 1, 73. [Google Scholar]
- Hycnar, J.; Fraś, A.; Przystać, R.; Foltyn, R. Opportunities to improve the quality of coal sludge for power generation, and industry. Ind. FurnancesBoilers 2015, 2, 17–25. [Google Scholar]
- Tora, B.; Pasiowiec, P.; Hycnar, J.J. Fine Coal Waste Utilisation. Inżynieria Miner.—J. Pol. Miner. Eng. Soc. 2016, 37, 213–222. [Google Scholar]
- Biernatowski, K.; Rybak, C.; Sarniak, W. Foundation Engineering. A Guide to Designing; Wydawnictwo Politechniki Wrocławskiej: Wrocław, Poland, 1972. [Google Scholar]
- Taha, Y.; Benzaazoua, M.; Hakkou, R.; Mansori, M. Coal mine wastes recycling for coal recovery and eco-friendly bricks production. Miner. Eng. 2017, 107, 123–138. [Google Scholar] [CrossRef]
- Vasić, M.V.; Goel, G.; Vasić, M.; Radojević, Z. Recycling of waste coal dust for the energy-efficient fabrication of bricks: A laboratory to industrial-scale study. Environ. Technol. Innov. 2021, 21, 101350. [Google Scholar] [CrossRef]
- Łabaj, J.; Blacha, L.; Smalcerz, A.; Wieczorek, J.; Fröhlichová, M.; Vadasz, P.; Findorak, R.; Niesler, M. Utilization of waste coal flotation concentrate for copper matte smelting. Eng. Sci. Technol. Int. J. 2021, 24, 996–1004. [Google Scholar] [CrossRef]
- Pomykała, R.; Kępys, W. The properties of the backfill mixtures based on own fine-grained waste. In Minefill 2020–2021; CRC Press: Boca Raton, FL, USA, 2021. [Google Scholar]
- Klojzy-Karczmarczyk, B.; Mazurek, J.; Paw, K. Możliwości zagospodarowania kruszyw i odpadów wydobywczych górnictwa węgla kamiennego ZG Janina w procesach rekultywacji wyrobisk odkrywkowych. Gospod. Surowcami Miner. 2016, 32, 111–134. [Google Scholar] [CrossRef] [Green Version]
- Grela, A.; Łach, M.; Bajda, T.; Mikuła, J. Alkaliczna aktywacja popiołów po spalaniu mułów węglowych. Zesz. Nauk. Inst. Gospod. Surowcami Miner. I Energią PAN Rok 2016, 95, 181–192. [Google Scholar]
- Stankiewicz, J.; Góralczyk, S. Kierunki gospodarczego wykorzystania odpadów po procesach wzbogacania depozytów mułów węglowych. Czas. Tech. 2012, 63. [Google Scholar]
- Baic, I. Analysis of the Chemical, Physical and Energetic Parameters of Coal Sludge Deposits Inventoried in the Silesian Province. Annu. Set Environ. Prot. 2013, 15, 1525–1548. (In Polish) [Google Scholar]
- Alam, S.; Das, S.K.; Rao, B.H. Strength, and durability characteristic of alkali activated GGBS stabilized red mud as geo-material. Constr. Build. Mater. 2019, 211, 932–942. [Google Scholar] [CrossRef]
- Liu, J.P.; Lu, Y.S.; Bai, X.H.; He, B. Mechanical properties, and strength mechanism of coal metakaolin-bayer red mud complex. Fresenius Environ. Bull. 2020, 29, 8610. [Google Scholar]
- Wichliński, M.; Kobylecki, R.; Bis, Z. Badania zawartości rtęci w mułach węglowych (Tests of mercury content in coal sludge; Polish). Polityka Energetyczna 2016, 19, 115–124. [Google Scholar]
- Liew, M.; Xiao, M.; Liu, S.; Rudenko, D. In Situ Seismic Investigations for Evaluating Geotechnical Properties, and Liquefaction Potential of Fine coal Tailings. J. Geotech. Geoenviron. Eng. 2020, 146, 04020014. [Google Scholar] [CrossRef]
- Islam, S.; Williams, D.J.; Zhang Ch Liano-Serna, M. Geotechnical characterization of coal tailings down the beach, and constant rate of loading consolidation in a slurry consolidometer. Min. Technol. 2021, 130, 67–80. [Google Scholar] [CrossRef]
- Doniecki, T.; Siedlecka, E. Waste coal sludge as an element of mineral insulation of landfills. Min. Geoengin. 2006, 30, 41–46. [Google Scholar]
- Sajjad, S.; Xiao, M.; Khosravifar, A.; Liew, M.; Liu, S.; Rostami, J. Characterization of static, and dynamic geotechnical properties, and behaviors of fine coal refuse. Can. Geotech. J. 2019, 56, 12. [Google Scholar] [CrossRef]
- Yu, H.; Zeng, X.; Michael, P.R. Geotechnical Properties, and flow Behavior of Coal Refuse, and Static, and Impact Loading. J. Geotech. Geoenviron. Eng. 2019, 145, 04019024. [Google Scholar] [CrossRef] [Green Version]
- Klojzy-Kaczmarczyk, B.; Staszczak, J. The use of coal sludge to isolation municipal landfills-recognition of the possibility. Zesz. Nauk. Inst. Gospod. Surowcami Miner. Pol. Akad. Nauk. 2018, 105, 95–108. [Google Scholar]
- Doniecki, T.; Siedlecka, E. Variability of filtration coefficient in coal sludge proposed for construction of isolation barriers. Eng. Environ. Prot. 2009, 12, 219–230. [Google Scholar]
- Witczak, S.; Adamczyk, A. A Catalogue of Selected Physical, and Chemical Coefficients for Underground Waters Contamination, and the Methods to Determine such Ones; Biblioteka Monitoringu Środowiska: Warsaw, Poland, 1994. [Google Scholar]
- Dowgiałło, J.; Kozerski, B.; Krajewski, S.; Macher, J.; Macioszczyk, T.; Malinowski, J.; Paczyński, B.; Płochniewski, Z.; Stenzel, P.; Szymanko, J.; et al. A Guidebook for Hydrogeologist; Wydawnictwo Geologiczne: Warsaw, Poland, 2007. [Google Scholar]
- Gavich, I.K. Teoreticheskiye osnowy izuczenija dwiżenija podziemnych wod v zemnoj kore. In Osnovy gidrogeologii, T.II: Gidrogeodinamika; Zekcer, I.S., Ed.; Izdatelstvo Nauka: Novosybirsk, Russia, 1983. [Google Scholar]
- Szymański, A. Mechanics of Soils; SGGW Publishing House: Warsaw, Poland, 2007. [Google Scholar]
- Das, B.M. Fundamentals of Geotechnical Engineering; Brooks/Cole Thomson Learning: Stanford, CA, USA, 2000. [Google Scholar]
- Craig, R.F. Soil Mechanics; Taylor & Francis e-Library: Dundee, UK, 2004. [Google Scholar]
- Olek, B.; Woźniak, H. Determination of quasi-filtration phase of consolidation based on experimental, and theoretical course of the uniaxial deformation, and distribution of pore pressure. Geol. Geophys. Environ. 2016, 42, 353–363. [Google Scholar] [CrossRef] [Green Version]
- Jastrzębska, M.; Kalinowska-Pasieka, M. Selected research methods in a modern geotechnical laboratory. In From Subsoil to Ground Parameters; Publishing House of the Silesian University of Technology: Gliwice, Poland, 2015. [Google Scholar]
- ISO/TS 17892-5:2004; Geotechnical Investigation, and Testing-Laboratory Testing of Soil-Part 5: Incremental Loading Oedometer Test. ISO: Geneva, Switzerland, 2004.
- Gruchot, A.; Zawisza, E.; Gubała, S. Badania wytrzymałości na ścinanie odpadów powęglowych z KWK, Wesoła w aparacie trójosiowego ściskania. Przegląd Górniczy 2009, 65, 73–78. [Google Scholar]
- BS 1377-6 1990; Methods of Test for Soils for Civil Engineering Purposes-Part 6: Consolidation, and Permeability Tests in Hydraulic Cells, and with Pore Pressure Measurement. Road Engineering Standards Policy Committee: London, UK, 1990.
- Lambe, T.W.; Whitman, R.V. Soil Mechanics; Arkady: Warsaw, Poland, 1978. [Google Scholar]
- Malinowska, E.; Bursa, B.; Chmielnicki, P.; Dziuba, W. Determination of vertical, and horizontal consolidation coefficient in weak-bearing organic soils. Architectura 2013, 12, 63–74. [Google Scholar]
- Casagrande, A.; Fadum, R.E. Notes on Soil Testing for Engineering Purposes; Harvard Soil Mechanics Series; No. 8; Harvard University, Graduate School of Engineering: Cambridge, MA, USA, 1940; p. 71. [Google Scholar]
- Taylor, D.W.; Merchant, W. A theory of clay consolidation accounting for secondary compression. J. Math. Phys. 1940, 19, 167–185. [Google Scholar] [CrossRef]
- Malinowska, E.; Szymański, A.; Sas, W. Determination of flow characteristics for organis soil by flow-pump method. In Przegląd Naukowy Inżynieria i Kształtowanie Środowiska; Wydawnictwo Szkoły Głównej Gospodarstwa Wiejskiego w Warszawie: Warsaw, Poland, 2005. [Google Scholar]
- Wiłun, Z. Zarys Geotechniki; Wydawnictwa Komunikacji i Łączności WKŁ: Warszawa, Poland, 1987. [Google Scholar]
- Pazdro, Z. General Hydrogeology; Wydawnictwo Geologiczne: Warsaw, Poland, 1983. [Google Scholar]
- McDowell, G.; de Bono, J. Relating Hydraulic Conductivity to Particle Size Using DEM. Int. J. Geomech 2021, 21, 06020034. [Google Scholar] [CrossRef]
- Carrier, W.D., III. Goodbye, Hazen; Hello, Kozeny-Carman. J. Geotech. Geoenviron. Eng. 2003, 129, 1054–1056. [Google Scholar] [CrossRef]
- Pliakas, F.; Petalas, C. Determination of Hydraulic conductivity of Unconsolidates River Alluvium from Permameter Tests, Empirical formulas, and Statistical Parameters Effect Analysis. Water Resour. Manag. 2011, 25, 2877–2899. [Google Scholar] [CrossRef]
- Riha, J.; Petrula, L.; Hala, M.; Alhasan, Z. Assessment of empirical formulae for determining the hydraulic conductivity of glass beads. J. Hydrol. Hydromech. 2018, 66, 337–347. [Google Scholar] [CrossRef] [Green Version]
- Shamsuddin, M.K.N.; Sulaiman, W.N.A.; Ramli, M.F. Vertical hydraulic conductivity of riverbank, and hyporheic zone sediment at Muda River riverbank filtration site, Malaysia. Appl. Water Sci. 2019, 9, 8. [Google Scholar] [CrossRef] [Green Version]
- Odong, J. Evaluation of Emirical Formulae for Determination of Hydraulic conductivity based on Gran-size Analysis. J. Am. Sci. 2007, 3, 54–60. [Google Scholar]
- Eggleston, J.; Rojstaczer, S. The Value of Grain-size Hydraulic Conductivity Estimates: Comparision with High Resolution In-situ Field Hydraulic Conductivity. Geophys. Res. Lett. 2001, 28, 4255–4258. [Google Scholar] [CrossRef] [Green Version]
- Świrska, J. Estimation of the Filtration Coefficients for Granular Materials. In Roczniki Inżynierii Budowlanej; Komisja Inżynierii Budowlanej Oddział Polskiej Akademii Nauk w Katowicach: Katowice, Poland, 2009; Volume 9. [Google Scholar]
- Cheng, C.; Song, J.; Chen, X.; Wang, D. Statistical Distribution of Streambed Vertical Hydraulic Conductivity along the Platte river, Nebraska. Water Resour. Manag. 2011, 25, 265–285. [Google Scholar] [CrossRef] [Green Version]
- Gruchot, A.T.; Zydroń, E.; Zawisza, E.; Szałucha, Ł. Analysis of filtration processes by earth hydrotechnical structures. Acta Sci. Pol. Form. Circumiectus 2019, 18, 39–50. [Google Scholar] [CrossRef]
- Koś, K.; Gruchot, A.; Zawisza, E. Bottom Sediments from a Dam Reservoir as a Core in Embankments-Filtration, and Stability: A Case Study. Sustainability 2021, 13, 1221. [Google Scholar] [CrossRef]
- Olek, B.S. Experimental insights into consolidation rates during one-dimentional loading with special reference to excess pore water pressure. Acta Geotech. 2020, 15, 3571–3591. [Google Scholar] [CrossRef]
- Malinowska, E.; Hyb, M. Determination of Filtration Coefficient Based on Laboratory Tests, Department of Geoengineering, Warsaw University of Life Sciences: Warsaw, Poland. Available online: www.kg.sggw.pl (accessed on 22 December 2021).
- Marciniak, M.; Przybyłek, J.; Herzig, J.; Szczepańska, J. Investigations of the Filtration Coefficient of Semi-Permeable Formations; Sorus: Poznan, Poland, 1999. [Google Scholar]
- Pisarczyk, S.; Rymsza, B. Laboratory, and Field Studies of Soils; Oficyna Wydawnicza Politechniki Warszawskiej: Warsaw, Poland, 1993. [Google Scholar]
- EN 13286-2:2010; Unbound and Hydraulically Bound Mixtures—Part 2: Test Methods for Laboratory Reference Density and water–Proctor Compaction. European Committee for Standardization: Brussels, Belgium, 2010.
- EN 12457-4:2010; Characterization of Waste Leaching Compliance test for Leaching of Granular Waste Materials and Sludges. Part 4: One Stage Batch Test at a Liguid to Solid Ratio of 1l/kg for Materials with Particle Size below 10 mm (without or with Size reduction). European Committee for Standardization: Brussels, Belgium, 2010.
- Regulation of the Minister of the Environment on the method of assessing the pollution of the Earth’s Surface. J. Laws 2016. item 1395.
- Regulation of the Minister of the Environment on the conditions to be met when discharging sewage into waters or into the ground, and on substances particularly harmful to the aquatic environment. J. Laws 2014. item 1800.
- Regulation of the Council of Ministers on the requirements for the content of natural radioactive isotopes of potassium K-40, radium Ra-226 and thorium Th-228 in raw materials and materials used in buildings intended for the stay of people and livestock, as well as in industrial waste used in construction, and control of the content of these isotopes is defined by two activity indicators. J. Laws 2007. No. 4, item 29.
- User Guide: Rowe Cell System; Version 2; VJ Tech Ltd.: Berkshire, UK, 2016.
- EN ISO 14688-2; Geotechnical Investigation, and Testing—Identification, and Classification of Soil—Part 2: Principles for a Classification. ISO: Geneva, Switzerland, 2017; Technical Committee ISO/TC 182, Geotechnics.
- Adamczyk, J. Assessment of Aggregate and Coal Sludge Waste Mixtures in Earthworks Application. PhD Thesis, AGH University of Science and Technology, Krakow, Poland, 2019. [Google Scholar]
- Wysokiński, L. Rules for the Construction of Waste Landfills, Building Research Institute, Instructions, Guidelines, Guides no 444/2009; Instytut Techniki Budowlanej: Warsaw, Poland, 2009. [Google Scholar]
- Darkin, M.G.; Gilpin, C.; Sangha, C.M. Direct wet surface imaging of an anaerobic biofilm by environmental scanning electron microscopy: Application to landfill clay liner barriers. Scanning 2001, 23, 346–350. [Google Scholar] [CrossRef] [PubMed]
- Luczak-Wilamowska, B. Neogene clays from Poland as mineral sealing barriers for landfills: Experimental study. Appl. Clay Sci. 2020, 21, 22–43. [Google Scholar] [CrossRef]
- Zabielska-Adamska, K.; Wasil, M. Tensile Strength of Barrier Material. In Proceedings of the 10th International Conference of Environmental Engineering (10th ICEE), Vilnius, Lithuania, 27–28 April 2017. [Google Scholar]


| Ingredient | Percentage [%] | Ingredient | Percentage [%] |
|---|---|---|---|
| P2O5 | 0.10 | CaO | 0.26 |
| Mn2O5 | 0.02 | MgO | 0.61 |
| SiO2 | 33.50 | Na2O | 0.53 |
| TiO2 | 0.02 | Li2O | 0.01 |
| Al2O3 | 21.00 | K2O | 1.10 |
| Fe2O3 | 3.76 | SO3 | 0.89 |
| LOI * | 38.2 |
| No. | Parameter | Result [ppm] | No. | Parameter | Result [ppm] |
|---|---|---|---|---|---|
| 1. | Zinc (Zn) | 62.54 | 7. | Nickel (Ni) | 19.25 |
| 2. | Barium (Ba) | 239.56 | 8. | Lead (Pb) | 19.64 |
| 3. | Cadmium (Cd) | 2.07 | 9. | Molybdenum (Mo) | 2.20 |
| 4. | Cobalt (Co) | 6.20 | 10. | Tin (Sn) | 8.14 |
| 5. | Chromium (Cr) | 56.98 | 11. | Arsenic (As) | 2.58 |
| 6. | Copper (Cu) | 24.55 | 12. | Mercury (Hg) | 0.01 |
| Indicator | [mg/dm3] | * [mg/dm3] | Indicator | [mg/dm3] | * [mg/dm3] |
|---|---|---|---|---|---|
| pH | 9.19 | 6.5–9 | Lead | <0.0002 | 0.5 |
| Sodium | 197.30 | 800 | Mercury | <0.0001 | b.w. |
| Potassium | 6.75 | 80 | Cadmium | <0.00003 | b.w. |
| Beryllium | <0.00001 | 1 | Selenium | <0.020 | 1 |
| Calcium | 10.48 | b.w. | Antimony | 0.00210 | 0.3 |
| Magnesium | 10.22 | b.w. | Aluminum | 0.020 | 3 |
| Barium | 0.009 | 2 | Chromium | 0.0130 | 0.5 |
| Strontium | 0.090 | b.w. | Molybdenum | 0.0003 | 1 |
| Manganese | 0.020 | b.w. | Titanium | <0.002 | 1 |
| Zinc | <0.0010 | 2 | Arsenic | 0.001 | 0.1 |
| Copper | 0.0025 | 0.5 | Thallium | 0.0005 | 1 |
| Nickel | <0.00001 | 0.5 | Chlorides | 295.0 | 1000 |
| Cobalt | 0.00054 | 1 | Sulfates | 59.6 | 500 |
| Sample Designation | Specific Activity | ||
|---|---|---|---|
| 40K | 226Ra | 228Th (228Ra) | |
| [Bq/kg] | [Bq/kg] | [Bq/kg] | |
| Coal sludge (CS) | 511 ± 30 | 76 ± 5 | 68 ± 5 |
| Consolidation Stress [kPa] | ||||
|---|---|---|---|---|
| 50 kPa | 100 kPa | 200 kPa | ||
| Permeability Coefficient [m/s] | ||||
| CS1 | Casagrande Method | 4.27 × 10⁻⁹ | 1.05 × 10⁻⁹ | 6.55 × 10⁻¹⁰ |
| Taylor Method | 2.14 × 10⁻⁹ | 6.53 × 10⁻¹⁰ | 4.12 × 10⁻¹⁰ | |
| PWP Method * | 8.67 × 10⁻⁹ | 7.63 × 10⁻¹⁰ | 4.44 × 10⁻¹⁰ | |
| CS2 | Casagrande Method | 2.96 × 10⁻⁹ | 1.20 × 10⁻⁹ | 6.24 × 10⁻¹⁰ |
| Taylor Method | 2.15 × 10⁻⁹ | 6.76 × 10⁻¹⁰ | 3.64 × 10⁻¹⁰ | |
| PWP Method * | 1.01 × 10⁻⁹ | 6.47 × 10⁻¹⁰ | 4.25 × 10⁻¹⁰ | |
| CS3 | Casagrande Method | 4.56 × 10⁻⁹ | 1.01 × 10⁻⁹ | 7.45 × 10⁻¹⁰ |
| Taylor Method | 2.12 × 10⁻⁹ | 7.10 × 10⁻¹⁰ | 4.43 × 10⁻¹⁰ | |
| PWP Method * | 2.59 × 10⁻⁹ | 1.06 × 10⁻⁹ | 3.99 × 10⁻¹⁰ | |
Publisher’s Note: MDPI stays neutral with regard to jurisdictional claims in published maps and institutional affiliations. |
© 2022 by the authors. Licensee MDPI, Basel, Switzerland. This article is an open access article distributed under the terms and conditions of the Creative Commons Attribution (CC BY) license (https://creativecommons.org/licenses/by/4.0/).
Share and Cite
Adamczyk, J.; Pomykała, R. Coal Sludge Permeability Assessment Based on Rowe Cell Consolidation, and Filtration Investigations. Minerals 2022, 12, 212. https://doi.org/10.3390/min12020212
Adamczyk J, Pomykała R. Coal Sludge Permeability Assessment Based on Rowe Cell Consolidation, and Filtration Investigations. Minerals. 2022; 12(2):212. https://doi.org/10.3390/min12020212
Chicago/Turabian StyleAdamczyk, Justyna, and Radosław Pomykała. 2022. "Coal Sludge Permeability Assessment Based on Rowe Cell Consolidation, and Filtration Investigations" Minerals 12, no. 2: 212. https://doi.org/10.3390/min12020212