
X-ray Diffraction Techniques for Mineral Characterization: A Review for Engineers of the Fundamentals, Applications, and Research Directions


Abstract
:1. Introduction
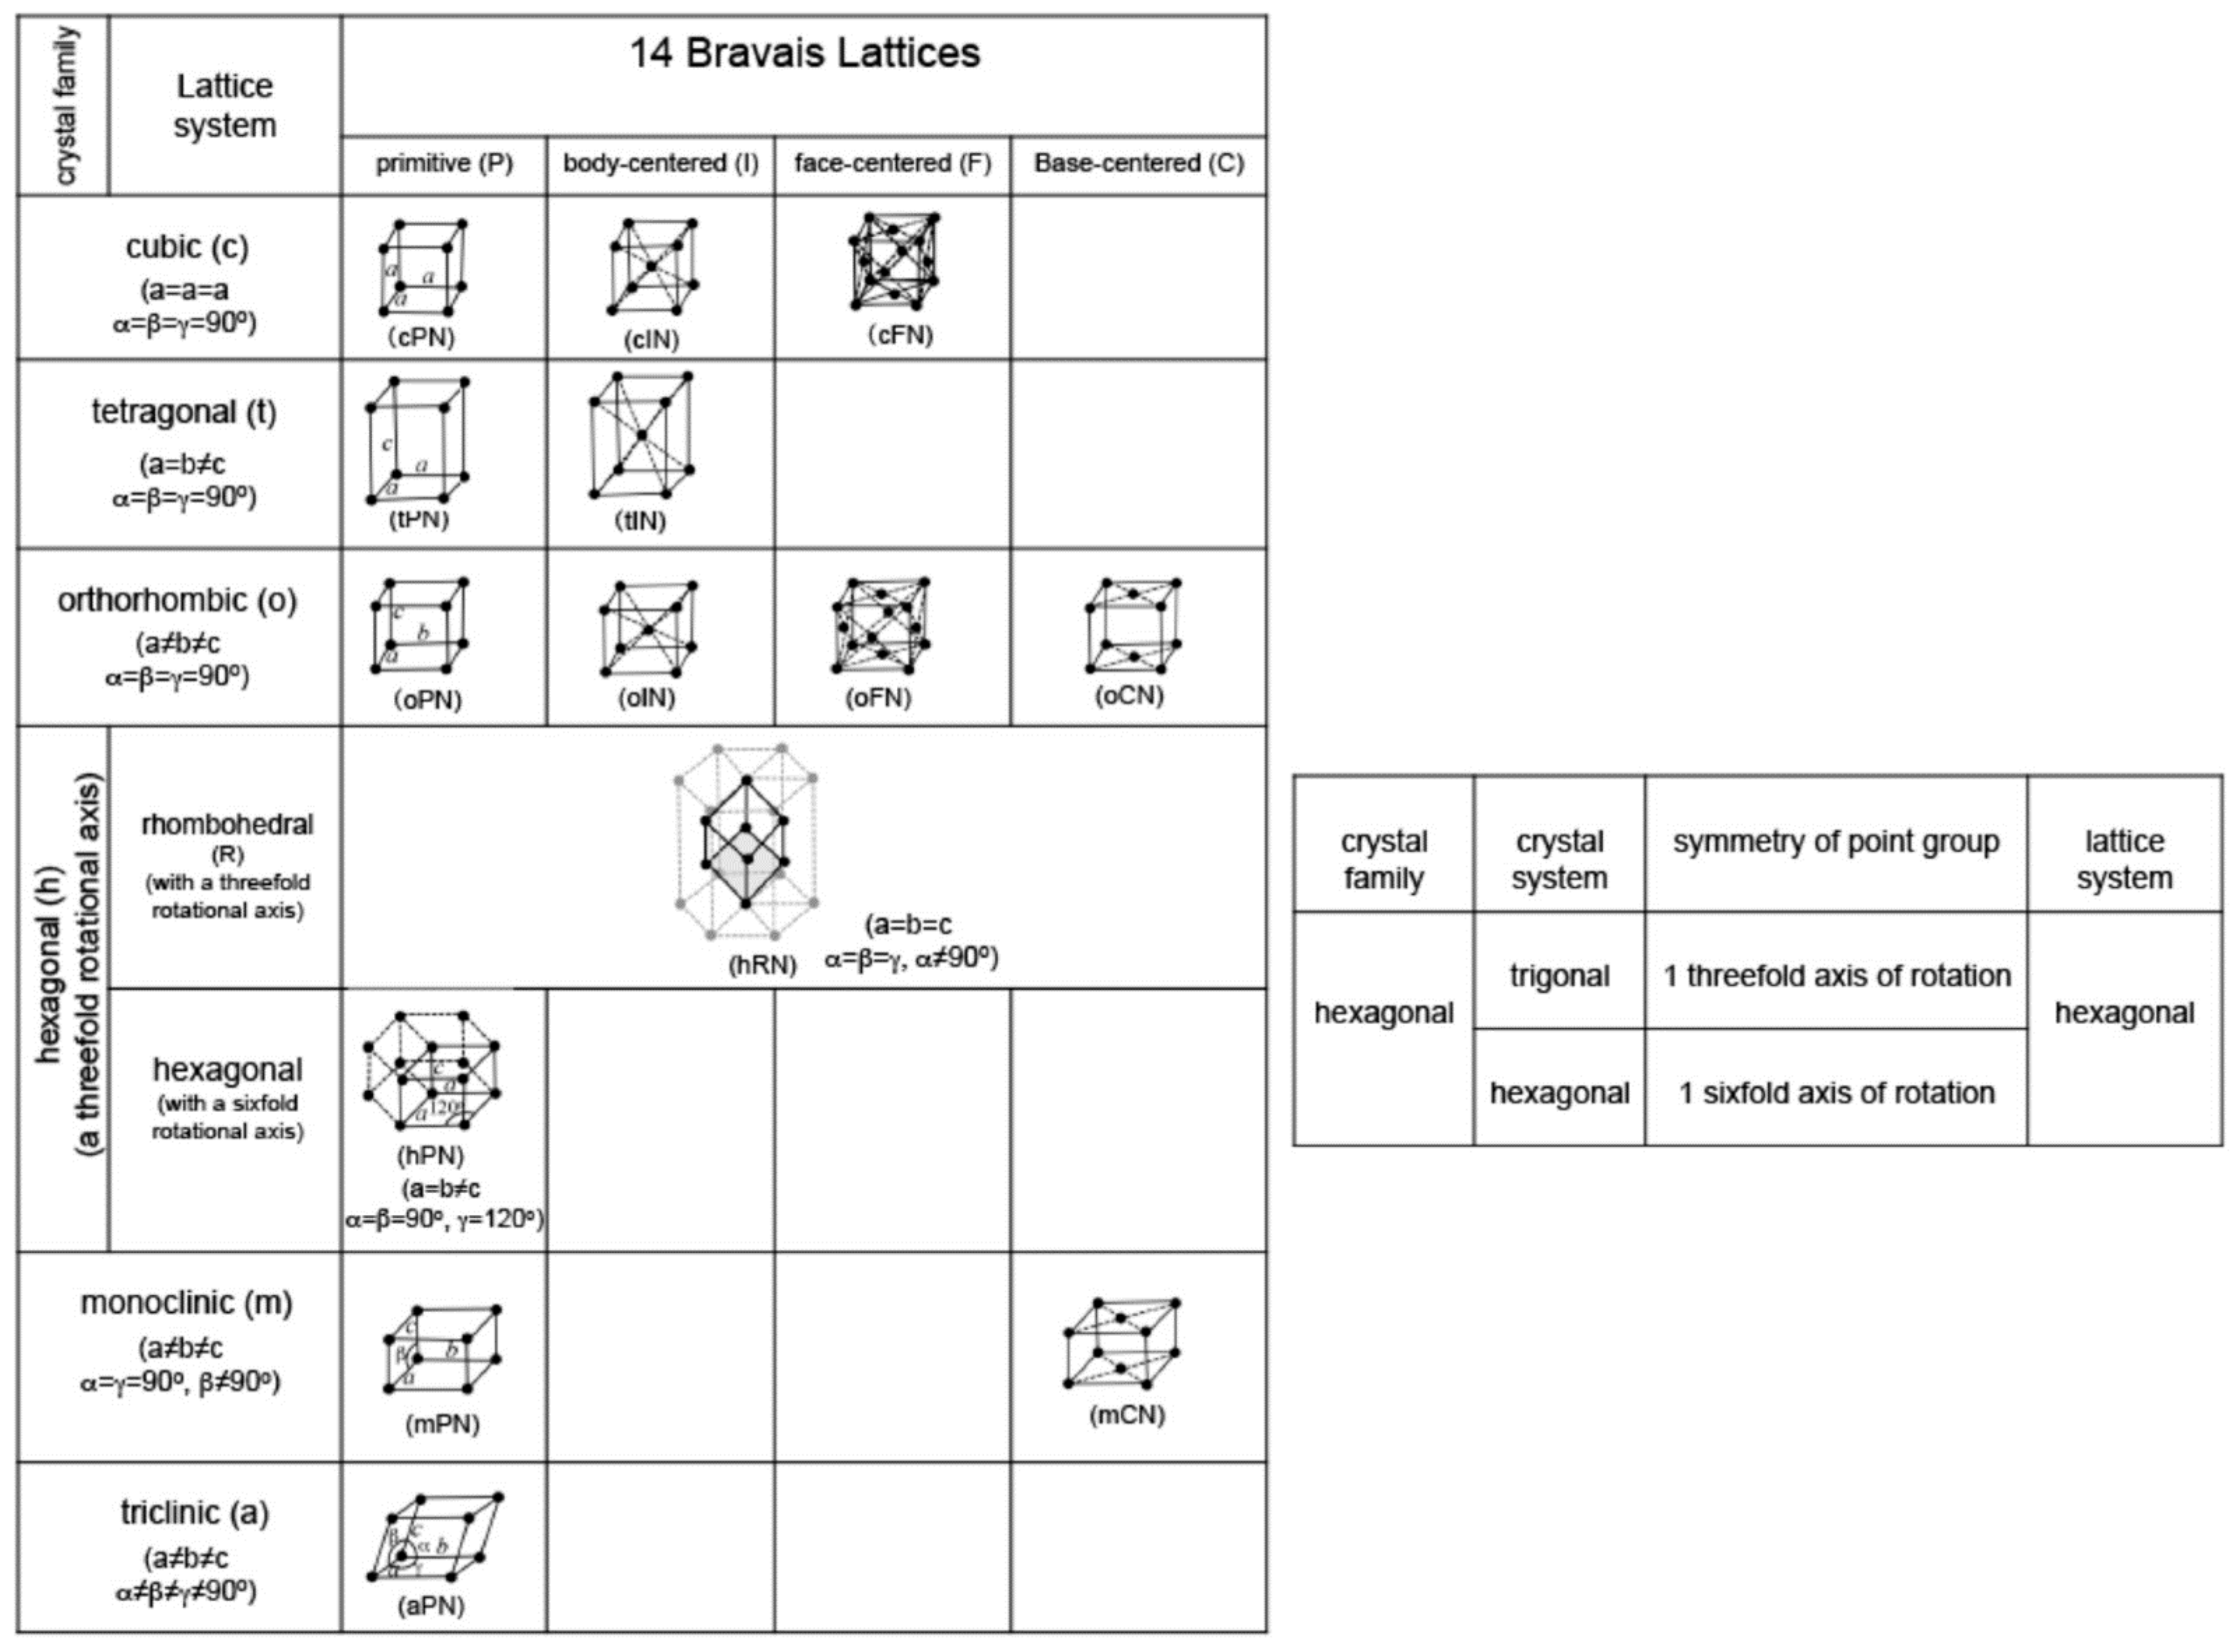
2. Crystal Structure
3. X-ray Diffraction Principle
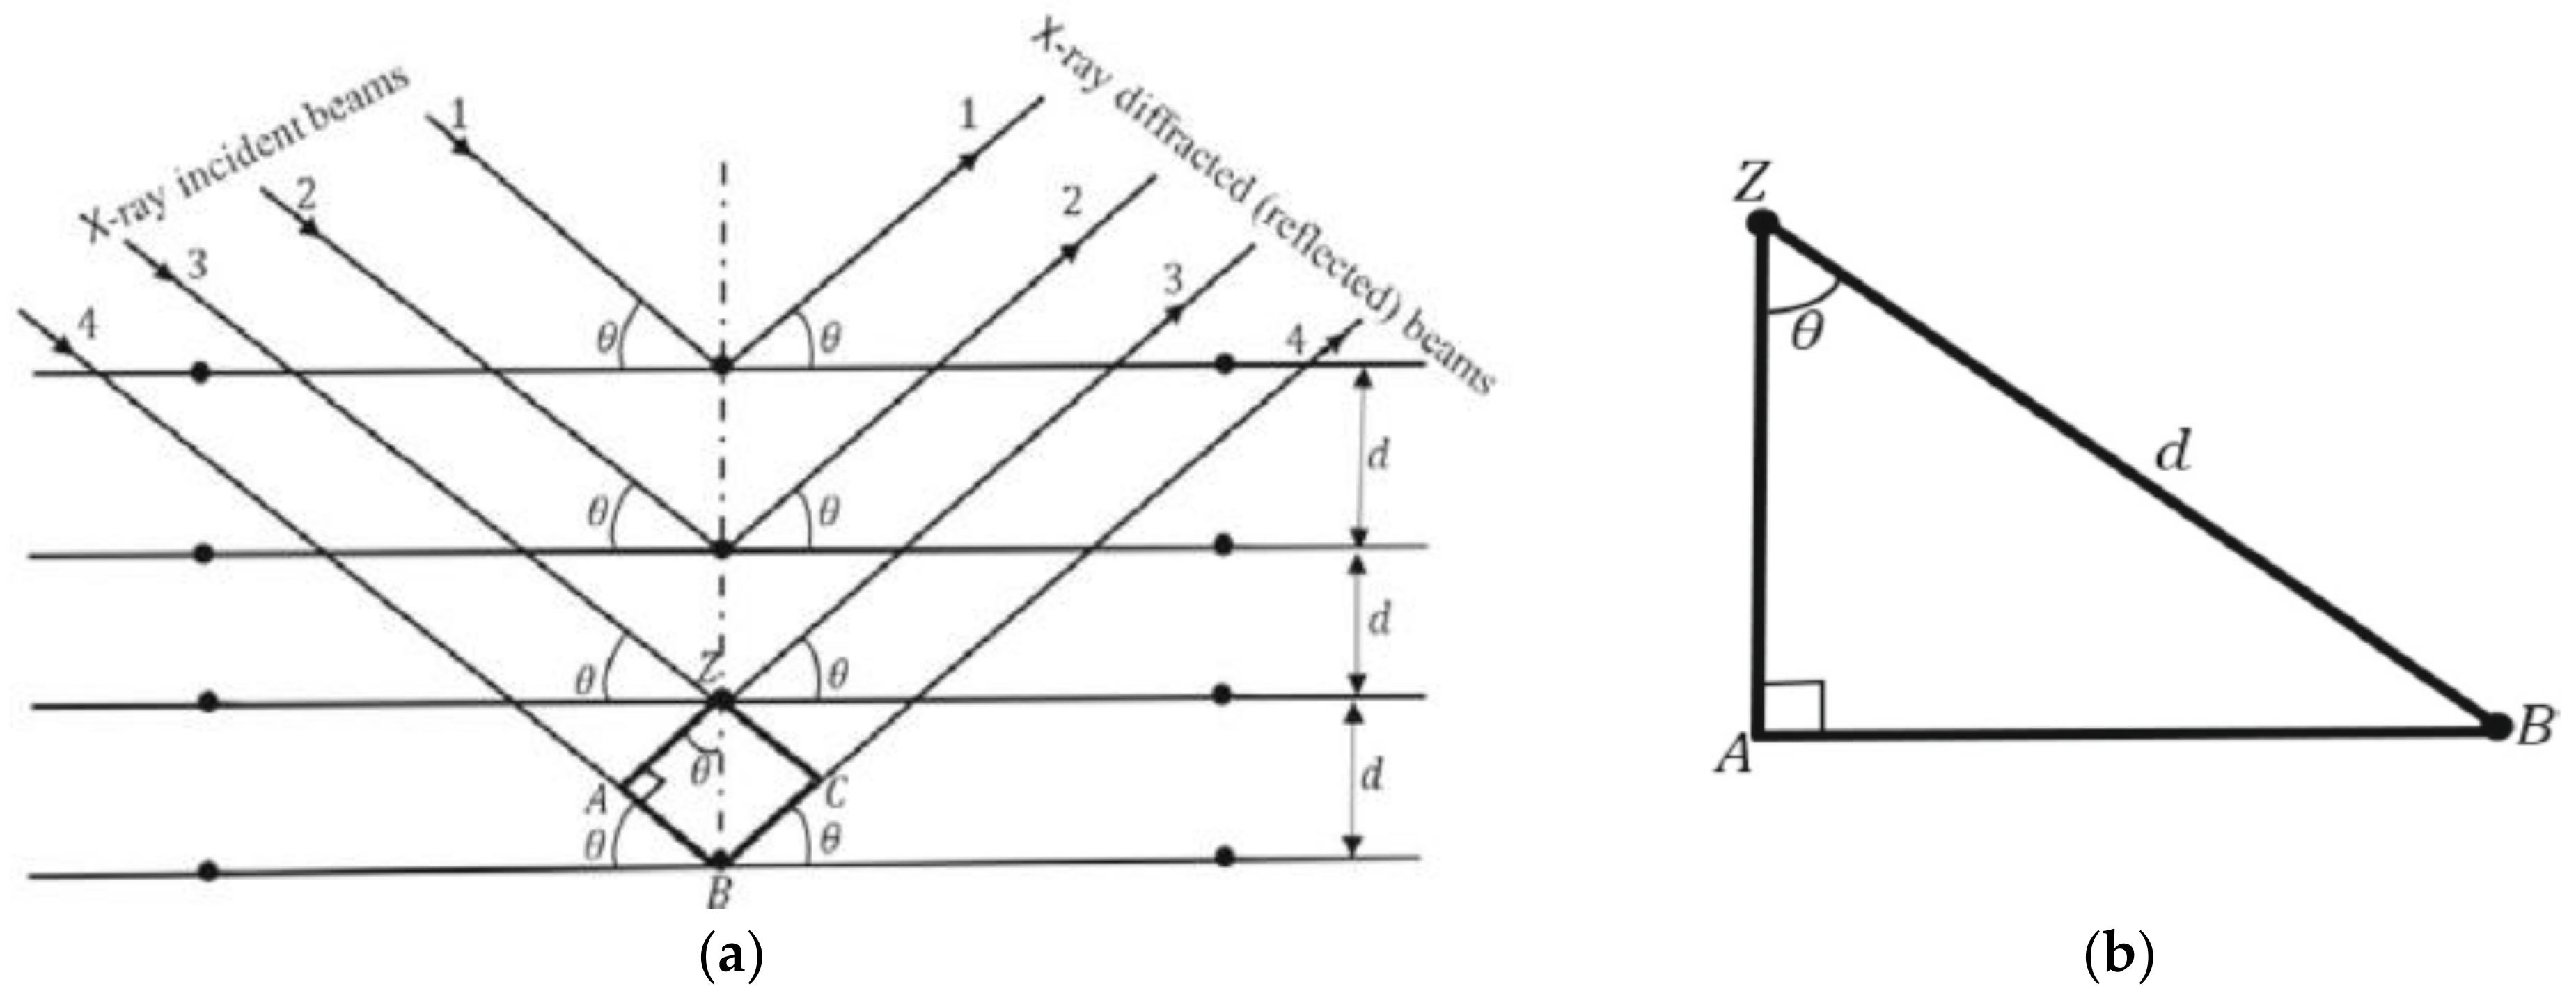
3.1. Bragg’s Law
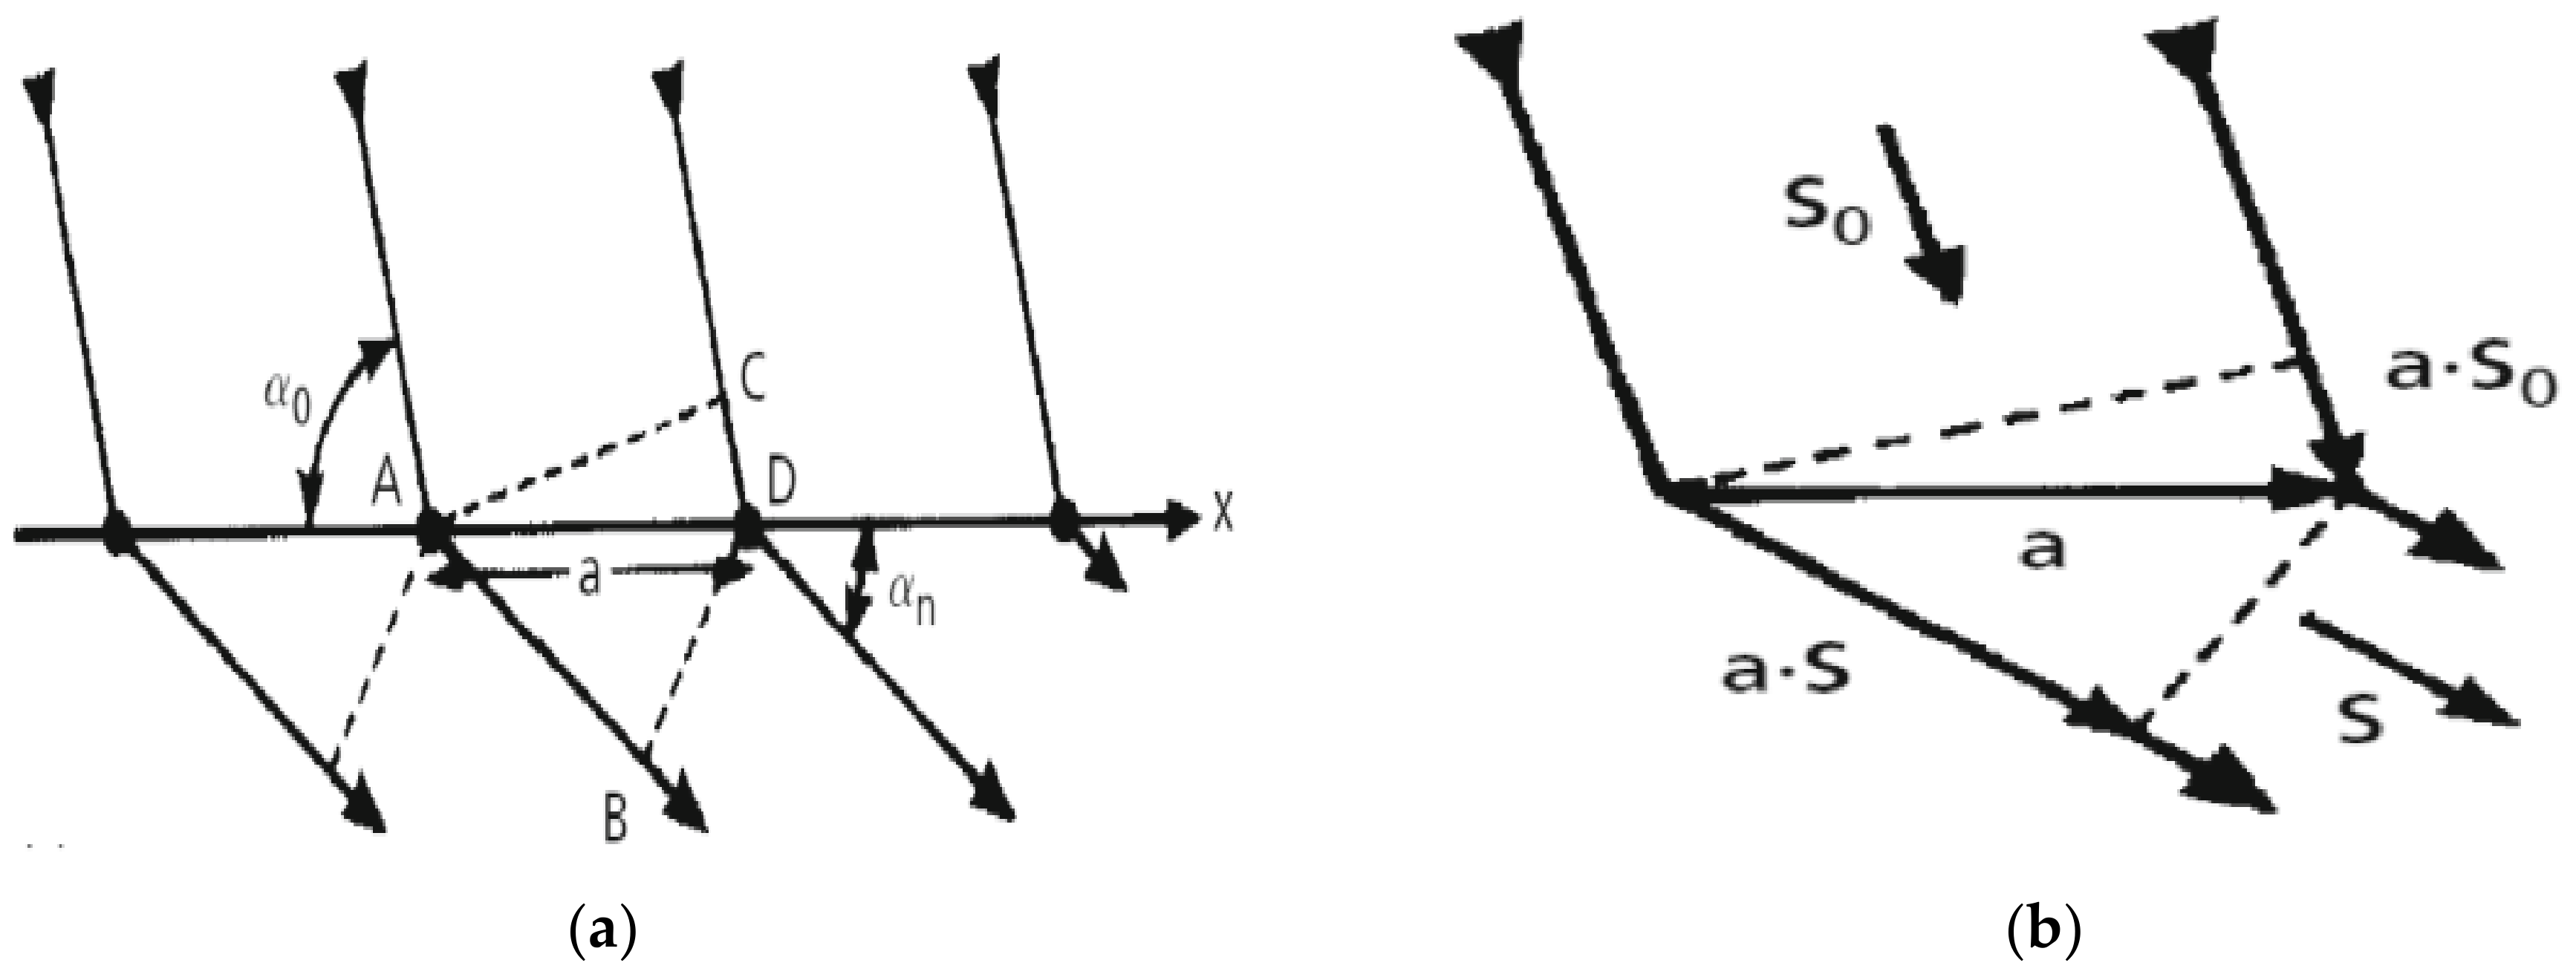
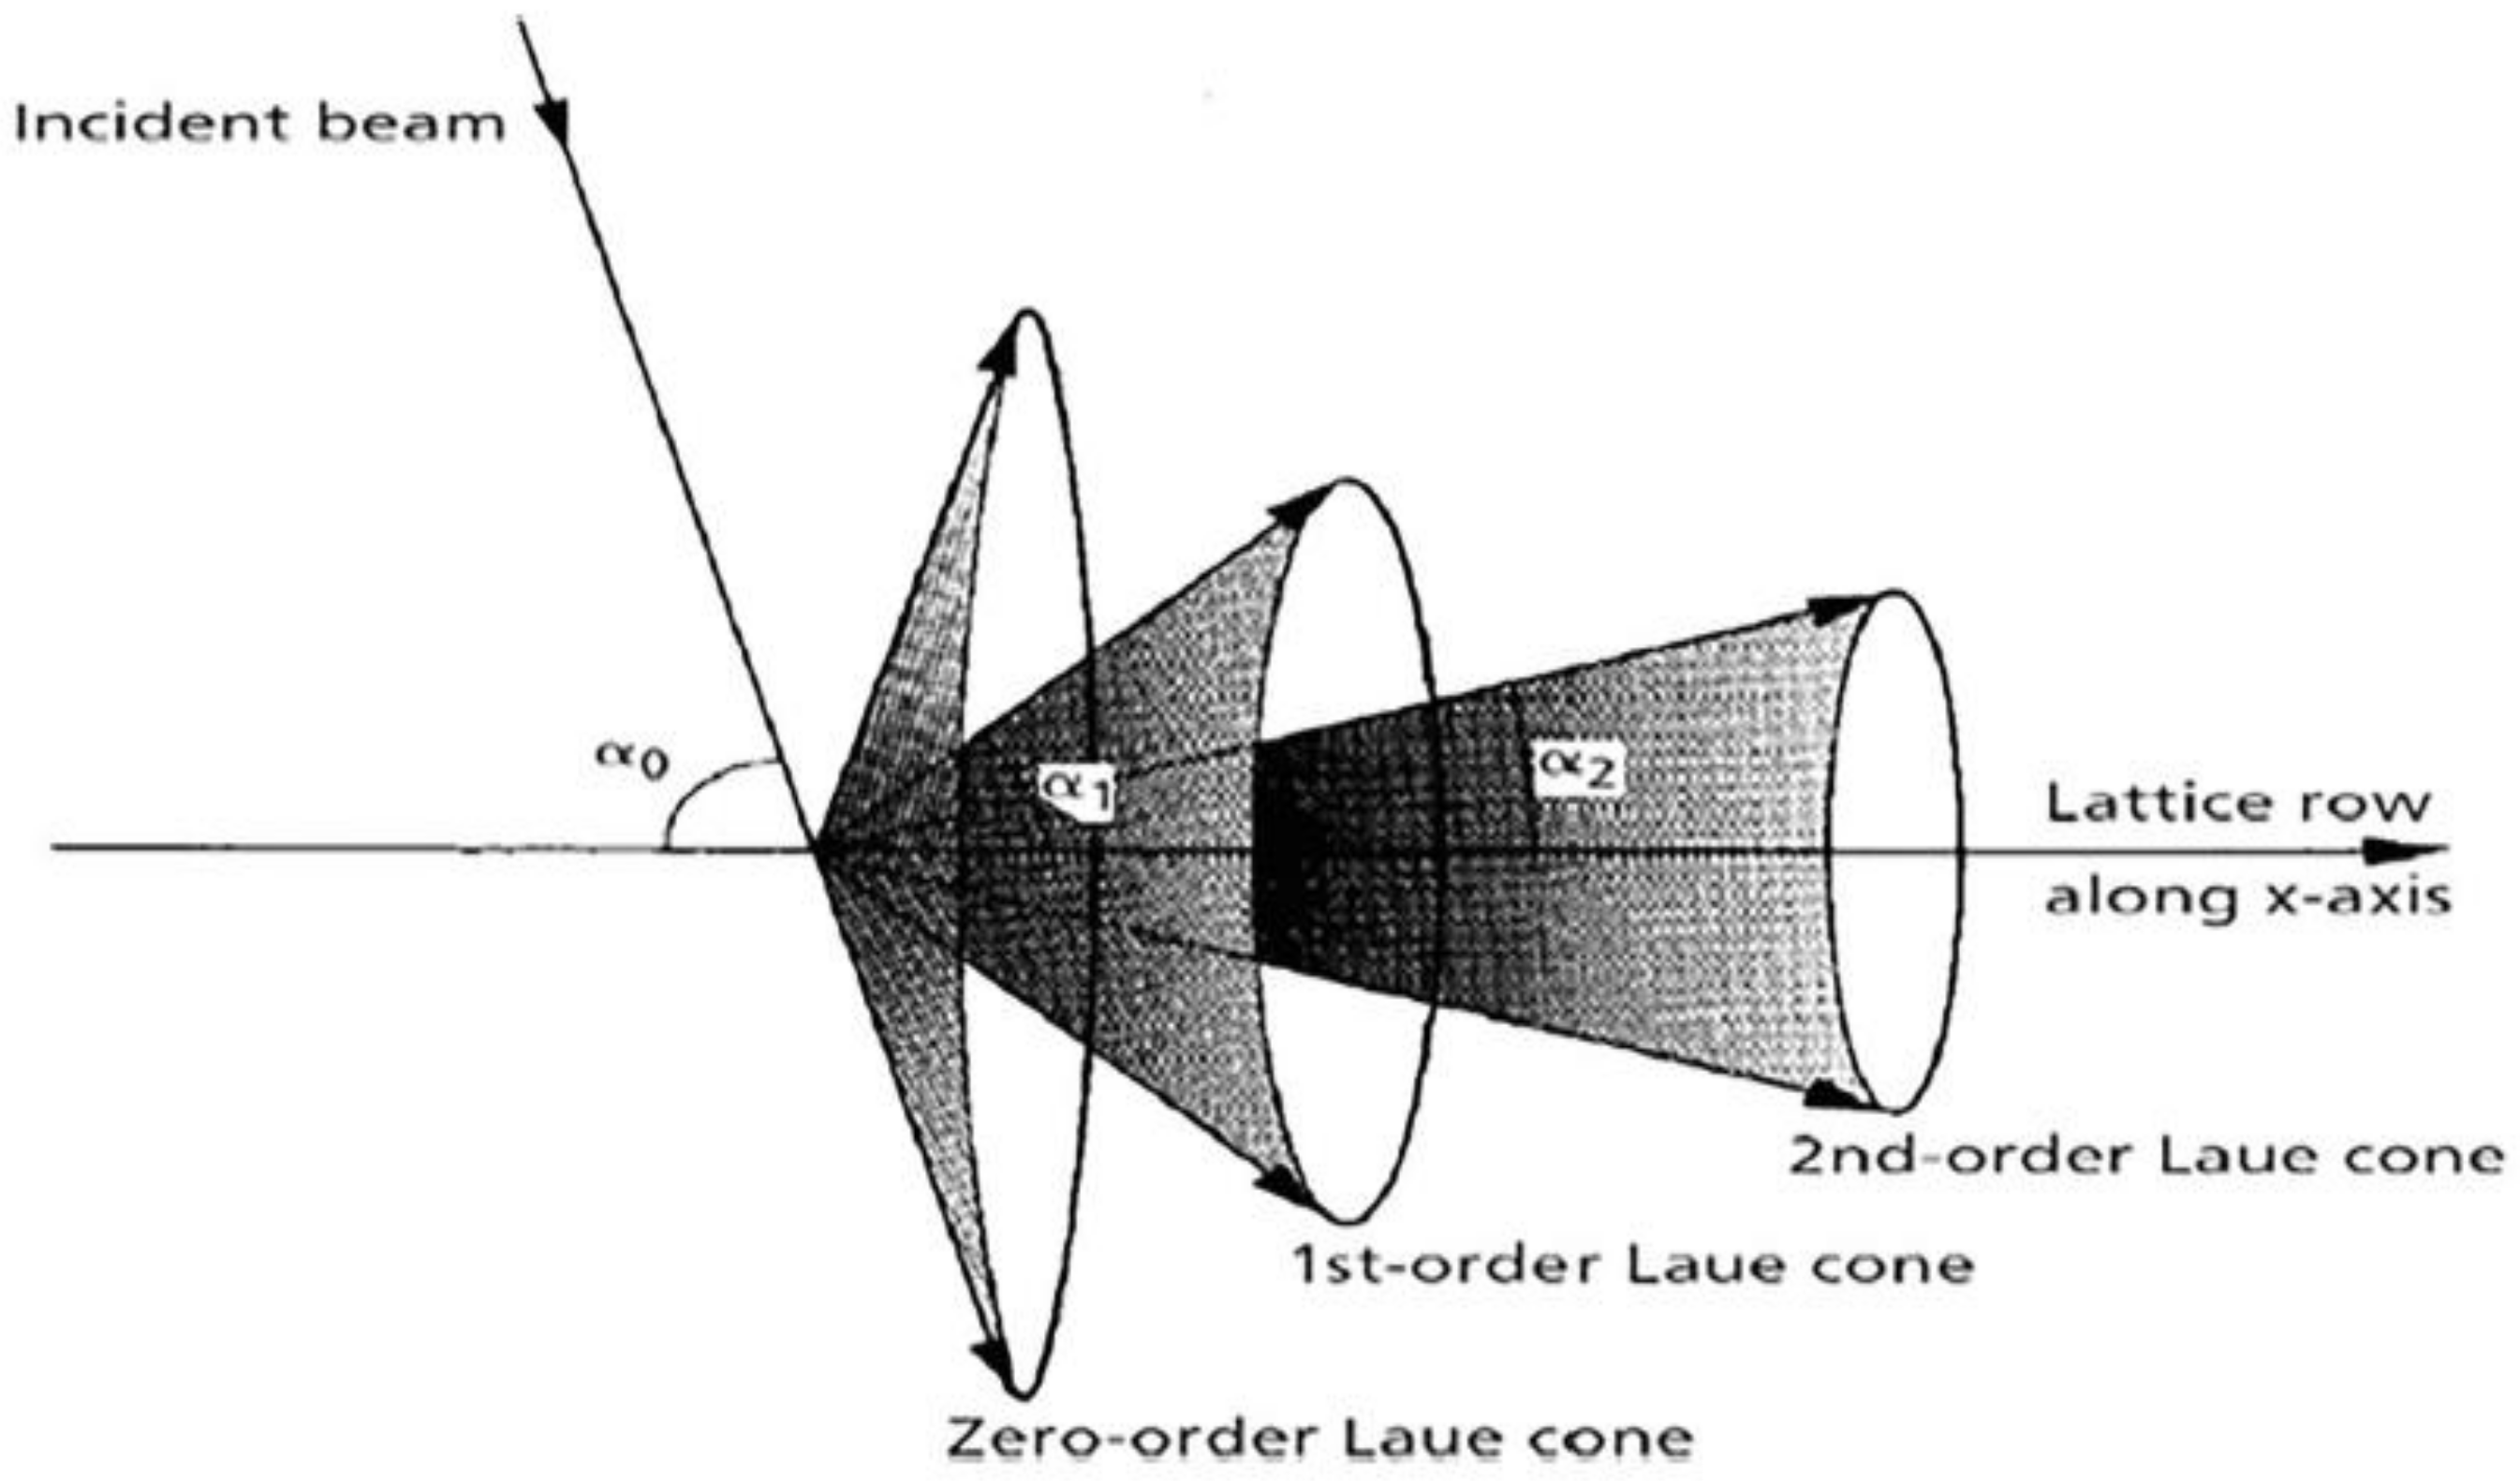
3.2. Laue Equations
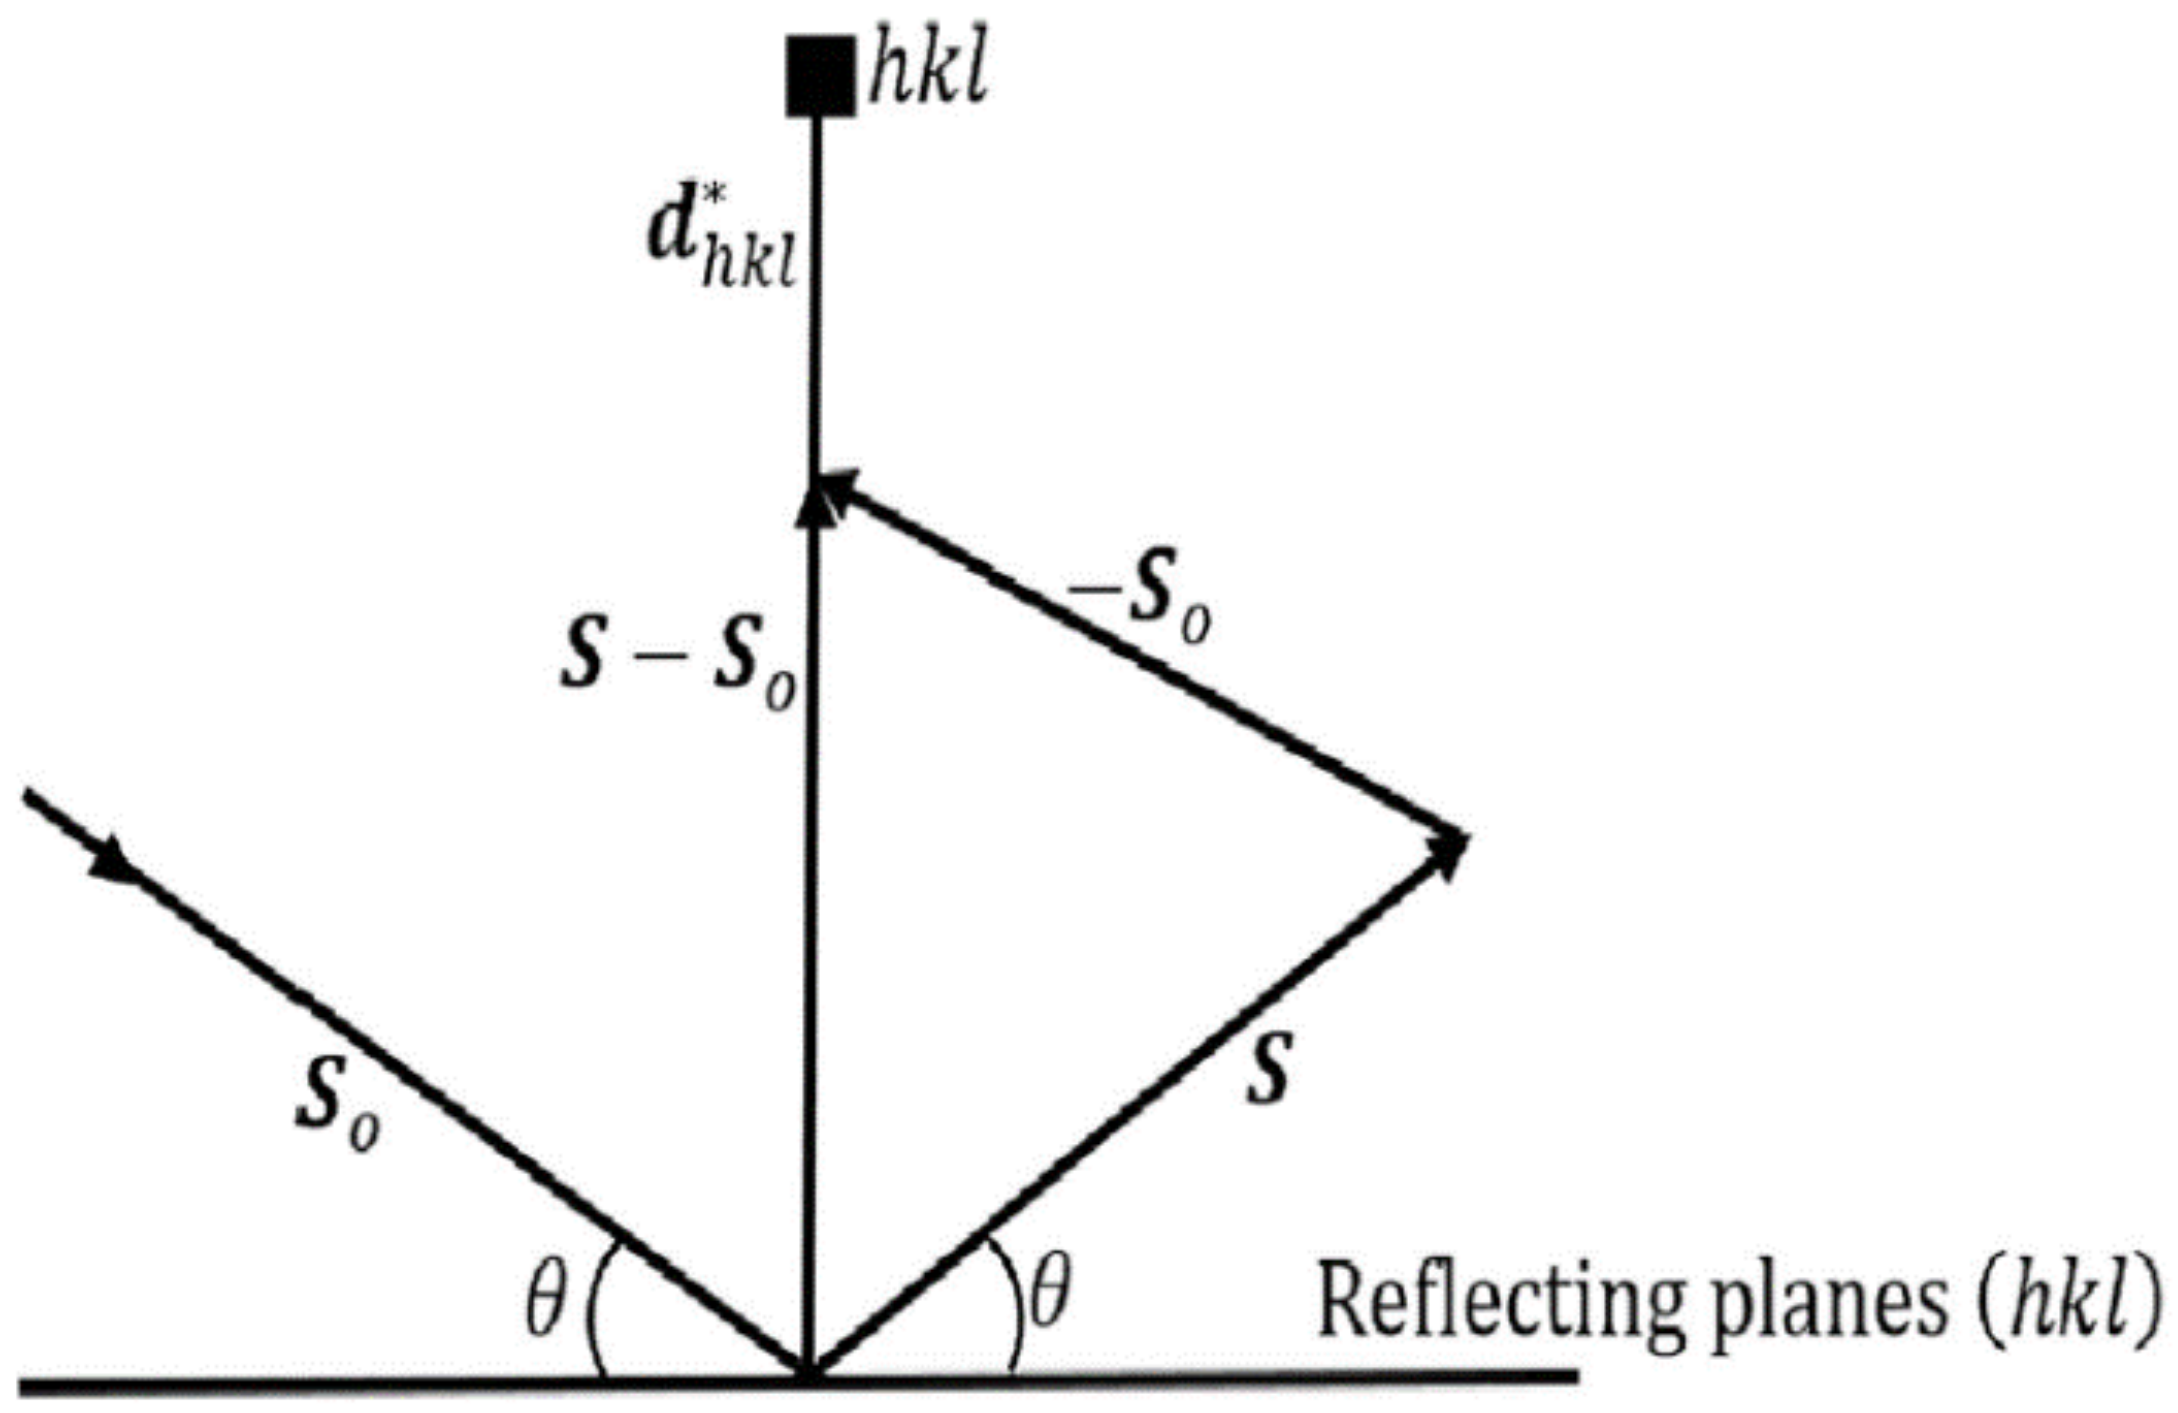
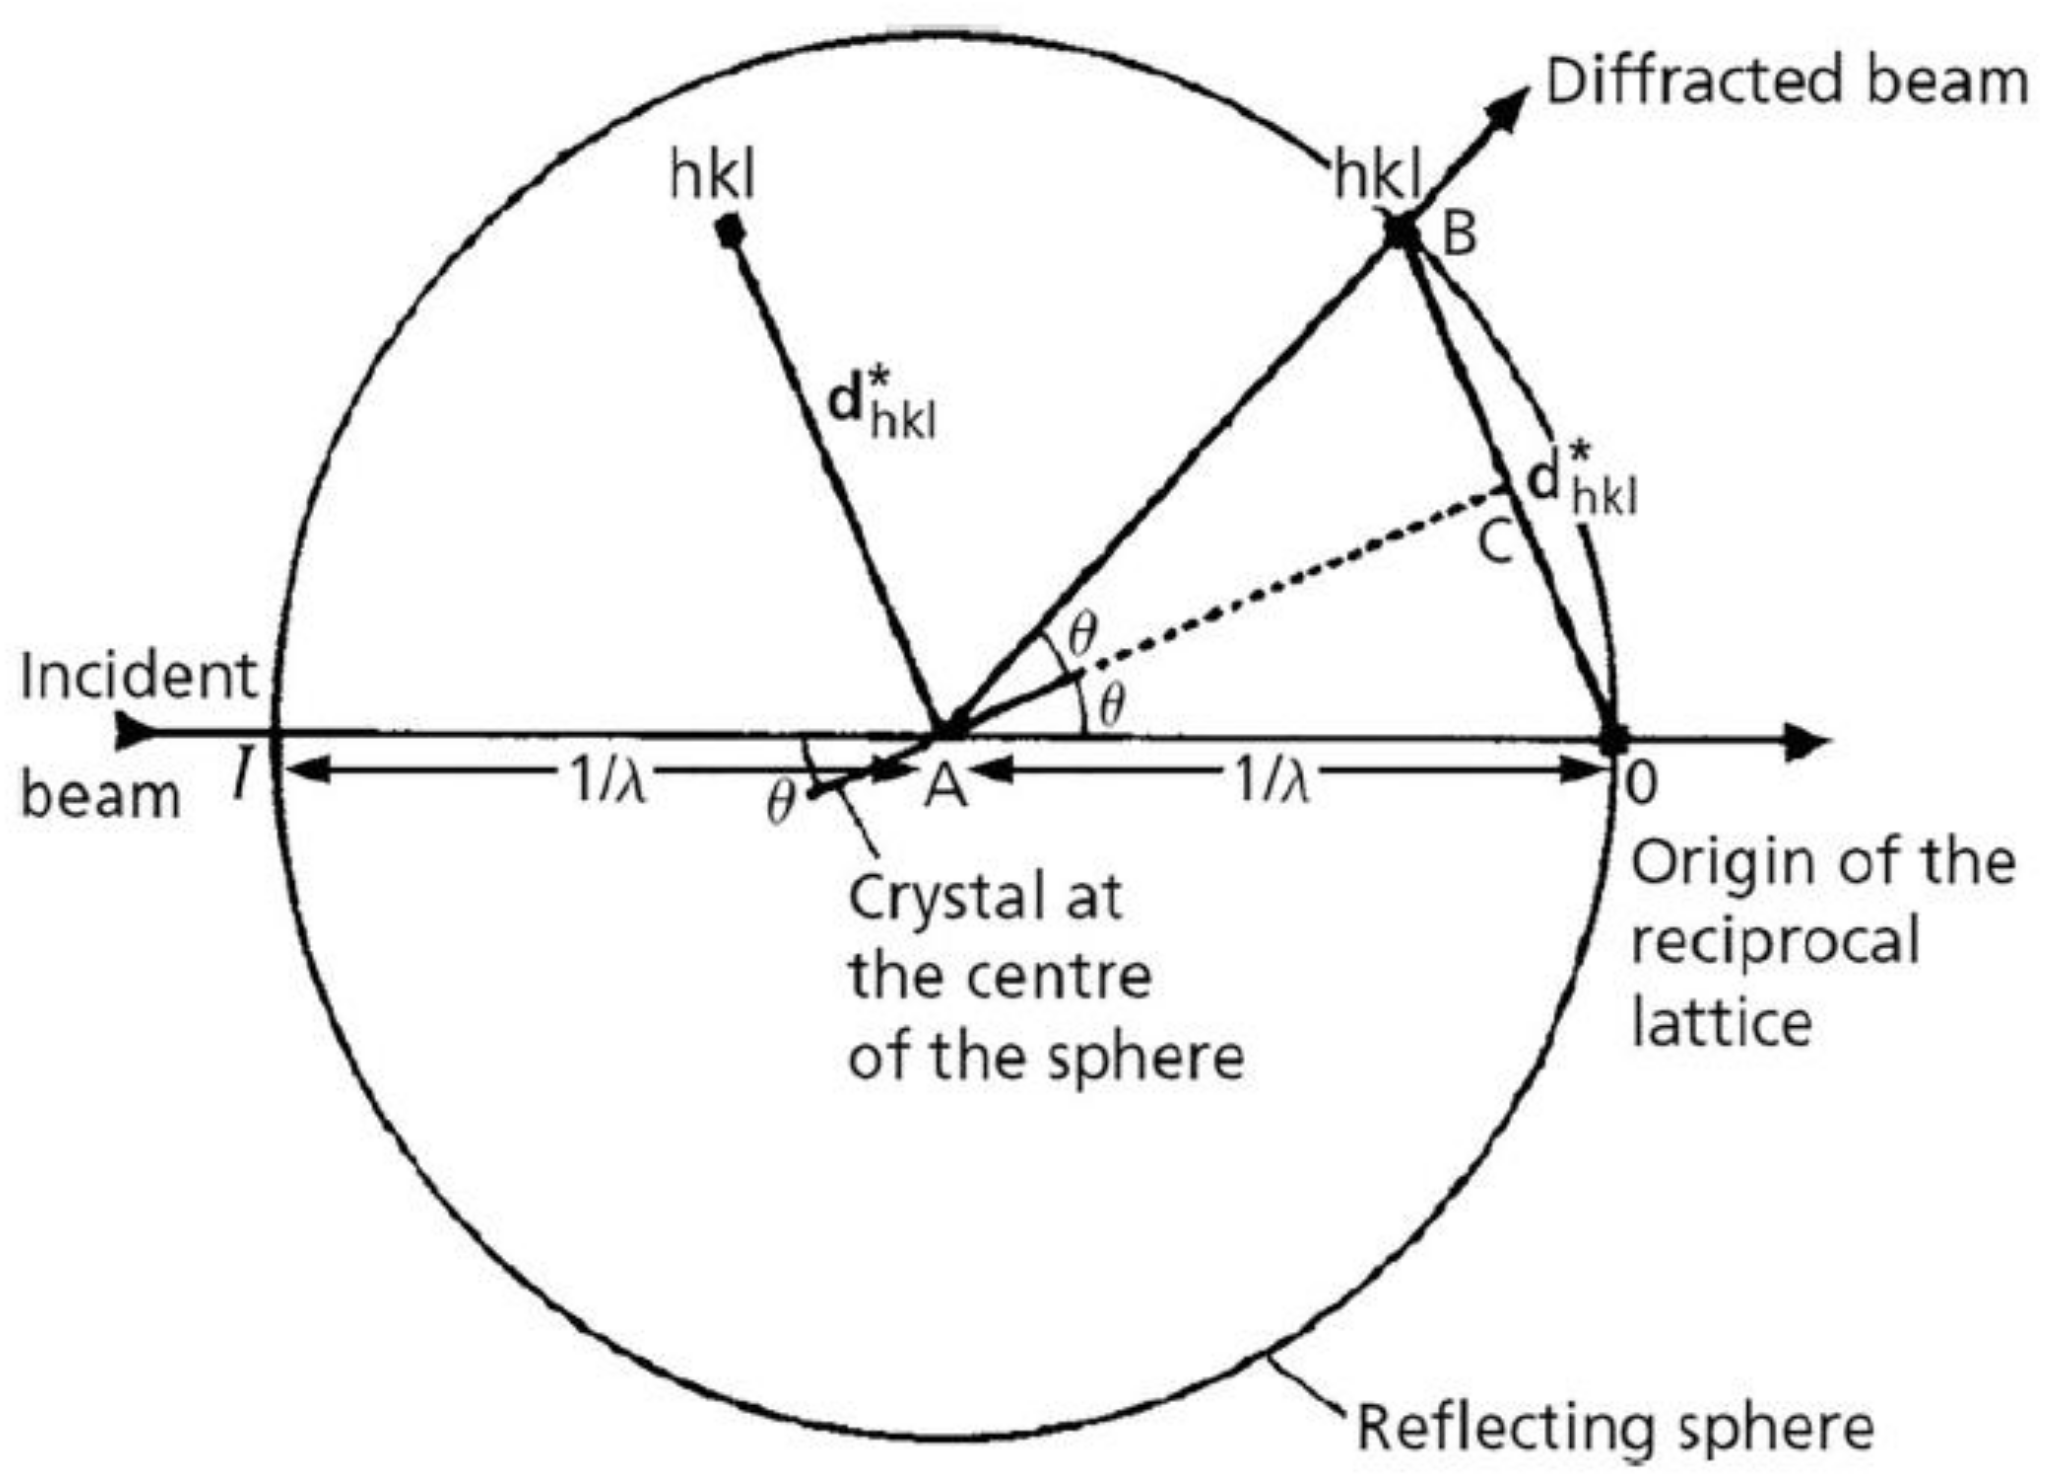
3.3. Ewald Theory
4. Applications of X-ray Diffraction in Mineral Characterization
4.1. Phase Identification and Quantification
4.2. Lattice Parameters
4.3. Crystalline Structure
4.4. Crystal Size and Orientation
4.5. Phase Transformation
4.6. Residual Stress and Strain
4.7. Dislocation Density
4.8. Thermal Expansion Coefficient
4.9. Examples of XRD-Characterized Minerals and Complementary Techniques
5. Uncertainty
5.1. Constraints
5.2. Sources of Error
5.2.1. Instrumental Errors
5.2.2. Compositional Variations Errors
5.3. Detection Limits
5.4. Quantification Limits
5.5. Crystallinity
6. Safety Considerations
7. Future Research Directions
8. Conclusions
- These days, several mineral characterization operations including crystallite size measurement, residual stress and strain measurement within the crystal, determination of crystal structure, and others are conducted with sophisticated equipment and automated procedures.
- It was covered in the present review how Bragg’s theory provides practical utilization of XRD. Mineral crystal structure characterization significantly depends upon an accurate measurement of intensities and peak position of XRD patterns.
- The simplified mathematical model of Bragg’s theory made the capabilities of various XRD applications possible for measuring peak intensities and positions. In the characterization of minerals, it can be said that peak position influences unit cell parameters more as compared to peak intensity or peak width.
- XRD is still tackling the same questions since its embarkment over 100 years ago. Now we have the possibility to attach cooling and heating stages, and it is possible to make measurements with variations in temperature profiles and their effect on crystal parameters. Today, XRD equipment has become more user-friendly than ever, including portable equipment and smaller benchtop models.
- XRD possesses wide application areas, however, few complex crystal structures and diffraction patterns linked with crystal shape are still misunderstood. Hence, neither Laue’s nor Bragg’s theory can fully comprehend XRD patterns of complex crystal structures. More investigations are needed for a better understanding of intricate XRD patterns aimed for further improvements in mineral characterization.
- Other limitations of XRD applications include powdering of the sample as XRD works well with a powdered sample. It requires particle-size fractionation, milling, and careful sample splitting, which can be laborious. Due to the lack of contrast of peaks in the diffraction pattern and overlapping interference, XRD use is complicated as well. Moreover, sample preparation, K-value calculation, and drawing calibration curves are also intricate processes limiting the value of the XRD technique. Further research is needed for improving the overall XRD testing and analyses processes, especially for complex mineralogical structures.
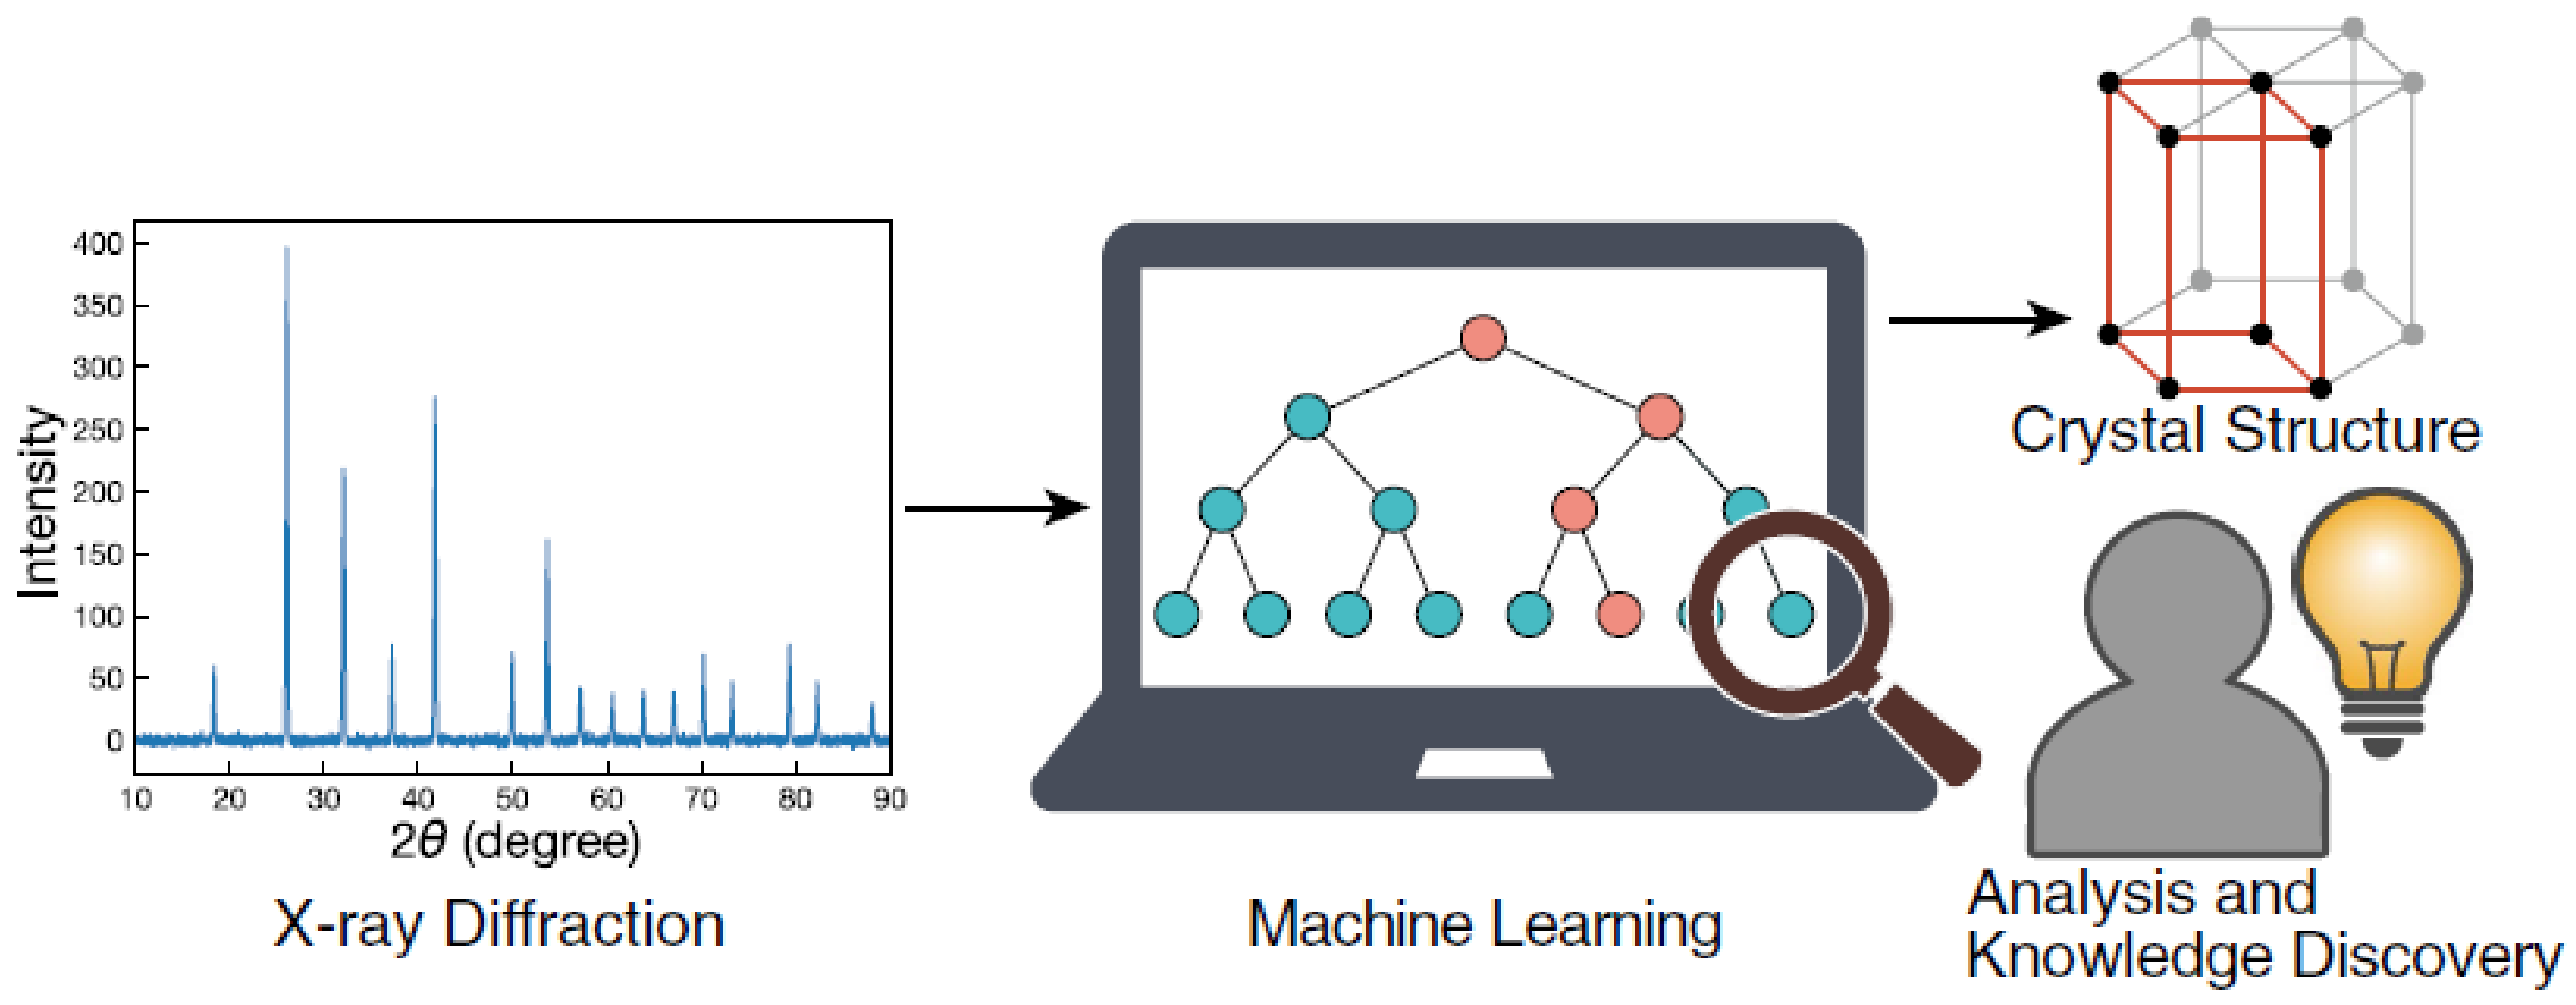
- It was discussed how the use of deep and machine learning tools can aid the XRD technique to improve its accuracy and effectiveness. Furthermore, with the advent of these artificial intelligence techniques, it was also discussed how XRD technique can be pushed beyond its research frontiers, especially in the area of mineral characterization.
Author Contributions
Funding
Data Availability Statement
Conflicts of Interest
Nomenclature
| length of unit cell dimensions in directions, respectively | |
| Miller indices of crystallographic structure | |
| respective angles between unit cell dimensions in directions | |
| angles of incident and diffracted beams, respectively in direction | |
| angles of incident and diffracted beams, respectively in direction | |
| angles of incident and diffracted beams, respectively in direction | |
| X-ray wavelength | |
| unit vectors along the incident and diffracted beam directions, respectively | |
| unit vectors along the incident and diffracted beam directions, respectively, in the reciprocal lattice | |
| full width at half maximum | |
| instrument broadening | |
| size broadening | |
| strain broadening | |
| total broadening | |
| crystallographic directions | |
| crystallographic direction vector | |
| atomic distance between two adjacent atoms in space | |
| correspondence of wavelengths with integer numbers | |
| dislocation density | |
| lattice tensor | |
| Scherrer constant | |
| strain | |
| space distance | |
| reciprocal space distance | |
| particle size |
References
- Gilmore, C.J.; Kaduk, J.A.; Schenk., H. International Tables for Crystallography, Volume H: Powder Diffraction; Wiley: Hoboken, NJ, USA, 2019. [Google Scholar]
- Cuéllar-Franca, R.M.; Azapagic, A. Carbon capture, storage and utilisation technologies: A critical analysis and comparison of their life cycle environmental impacts. J. CO2 Util. 2015, 9, 82–102. [Google Scholar] [CrossRef]
- Gao, J.; Li, C.; Liu, W.; Hu, J.; Wang, L.; Liu, Q.; Liang, B.; Yue, H.; Zhang, G.; Luo, D.; et al. Process simulation and energy integration in the mineral carbonation of blast furnace slag. Chin. J. Chem. Eng. 2018, 27, 157–167. [Google Scholar] [CrossRef]
- Razeghi, M. Crystalline Properties of Solids. In Fundamentals of Solid State Engineering; Kluwer Acad.: New York, NY, USA, 2002; pp. 1–43. [Google Scholar]
- Shackelford, J.F. Introduction to Materials Science for Engineers, 6th ed.; Pearson: London, UK, 2005. [Google Scholar]
- Bhadeshia, H.K.D.H. Teaching Materials. Available online: http://www.phase-trans.msm.cam.ac.uk/teaching.html (accessed on 4 October 2021).
- Sharma, R.; Bisen, D.P.; Shukla, U.; Sharma, B.G. X-RRY diffraction: A powerful method of characterizing nanomaterials. Recent Res. Sci. Technol. 2012, 4, 77–79. [Google Scholar]
- ICDD. PDF-4+; ICDD: Newtown Square, PA, USA, 2022. [Google Scholar]
- Pappas, N. Calculating retained austenite in steel post magnetic processing using X-ray diffraction. B. S. Undergr. Maths Exch. 2006, 4, 8–14. [Google Scholar]
- Guma, T.N.; Madakson, P.B.; Yawas, D.S.; Aku, S.Y. X-ray diffraction analysis of the microscopies of same corrosion protective bitumen coating. Int. J. Mod. Eng. Res. 2012, 2, 4387–4395. [Google Scholar]
- Hull, B.; John, V.B. Non-Destructive Testing; Macmillan and Hound Mills Education Ltd.: Hampshire, UK, 1989. [Google Scholar]
- Hart, M. Bragg angle measurement and mapping. J. Cryst. Growth 1981, 55, 409–427. [Google Scholar] [CrossRef]
- Fewster, P.F. Absolute lattice parameter measurement. J. Mater. Sci. Mater. Electron. 1999, 10, 175–183. [Google Scholar] [CrossRef]
- Magner, S.H.; Angelis, R.J.O.; Weins, W.N.; Makinson, J.D. A historical review of retained austenite and its measurement by X-ray diffraction. Adv. X-ray Anal. 2002, 45, 85–97. [Google Scholar]
- Jesche, A.; Fix, M.; Kreyssig, A.; Meier, W.R.; Canfield, P.C. X-ray diffraction on large single crystals using a powder diffractometer. Philos. Mag. 2018, 96, 2115–2124. [Google Scholar] [CrossRef] [Green Version]
- Matsubara, E.; Shinoda, K.; Waseda, Y. X-ray Diffraction Crystallography: Introduction, Examples and Solved Problems; Springer: Berlin/Heidelberg, Germany, 2011. [Google Scholar]
- Putnam, C.; Hammel, M.; Hura, G.L.; Tainer, J. X-ray solution scattering (saxs) combined with crystallography and computation: Defining accurate macromolecular structures, conformations and assembling in solution. Q. Rev. Biophys. 2007, 40, 191–285. [Google Scholar] [CrossRef] [PubMed]
- Dekker, A.J. The Crystalline State. In Solid State Physics; MacMillan Co Ltd.: New York, NY, USA, 1952; pp. 1–31. [Google Scholar]
- Aroyo, M.I. International Tables for Crystallography Volume A: Space-Group Symmetry; Wiley: Hoboken, NJ, USA, 2016. [Google Scholar]
- Wang, L.; Essin, A.; Hermele, M.; Motrunich, O. Numerical detection of symmetry-enriched topological phases with space-group symmetry. Phys. Rev. B 2015, 91, 121103. [Google Scholar] [CrossRef] [Green Version]
- Hu, S.Z.; Ng, S.W. Revisions of P-1 Space Groups to Higher Symmetry Space Groups. Chin. J. Struct. Chem. 2014, 33, 148–164. [Google Scholar]
- Palistrant, A.F. Using the P-symmetry space groups of crystals to investigate 6D symmetry groups. Crystallogr. Rep. 2009, 54, 539–547. [Google Scholar] [CrossRef]
- Hahn, T. Status of Volume A: Space-group Symmetry. ACTA Crystallogr. A—Found. Adv. 2005, 61, C132. [Google Scholar] [CrossRef]
- Mizutani, U.; Sato, H. The Physics of the Hume-Rothery Electron Concentration Rule. Crystals 2017, 7, 9. [Google Scholar] [CrossRef] [Green Version]
- Fultz, B.; Howe, J. Transmission Electron Microscopy and Diffractometry of Materials; Springer: Berlin/Heidelberg, Germany, 2013. [Google Scholar]
- Lamas, D.G.; Neto, M.D.O.; Kellermann, G.; Craievich, A.F. X-ray Diffraction and Scattering by Nanomaterials. In Nanocharacterization Techniques; William Andrew Publishing: Oxford, UK, 2017; Chapter 5; pp. 111–182. [Google Scholar]
- Sjöström, J.K.; Bindler, R.; Granberg, T.; Kylander, M.E. Procedure for Organic Matter Removal from Peat Samples for XRD Mineral Analysis. Wetlands 2019, 39, 473–481. [Google Scholar] [CrossRef] [Green Version]
- Lee, M. X-ray Diffraction for Materials Research from Fundamentals to Applications; CRC Press: Boca Raton, FL, USA, 2021. [Google Scholar]
- Macías-Quiroga, I.F.; Giraldo-Gómez, G.I.; Sanabria-González, N.R. Characterization of Colombian Clay and Its Potential Use as Adsorbent. Sci. World J. 2018, 2018, 5969178. [Google Scholar] [CrossRef] [Green Version]
- Authier, A. Dynamical Theory of X-ray Diffraction; Oxford University Press: Oxford, UK, 2001. [Google Scholar]
- Sivia, D.S. Elementary Scattering Theory for X-ray and Neutron Users; Oxford University Press: New York, NY, USA, 2011. [Google Scholar]
- Ameh, E.S. A review of basic crystallography and X-ray diffraction applications. Int. J. Adv. Manuf. Technol. 2019, 105, 3289–3302. [Google Scholar] [CrossRef]
- Hammond, C. The Basics of Crystallography and Diffraction, 3rd ed.; Oxford University Press: Oxford, UK, 2009. [Google Scholar]
- Ashcroft, N.W.; Mernin, N.D. Solid State Physics; Harcourt College Publishers: Fort Worth, TX, USA, 1976. [Google Scholar]
- Helliwell, J.R.; Blake, A.J.; Blunden-Ellis, J.; Moore, M.; Schwalbe, C.H. Some historical extracts relevant to the discovery and application of the diffraction of X-rays by crystals to contribute to the Centennial celebration and the International Year of Crystallography. Crystallogr. Rev. 2011, 18, 3–19. [Google Scholar] [CrossRef]
- Wood, E.A. Vocabulary of surface crystallography. J. Appl. Physiol. 1964, 35, 1306–1312. [Google Scholar] [CrossRef]
- Fewster, P.F. Response to Fraser & Wark’s comments on a new theory for X-ray diffraction. Acta Crystallogr. Sect. A 2018, 74, 457–465. [Google Scholar]
- Gilmore, C.J.; Barr, G.; Paisley, J. High throughput powder diffraction. A new approach to qualitative and quantitative powder diffraction pattern analysis using full pattern profile. J. Appl. Crystallogr. 2004, 37, 231–242. [Google Scholar] [CrossRef] [Green Version]
- Lou, W.; Zhang, D.; Bayless, R.C. Review of mineral recognition and its future. Appl. Geochem. 2020, 122, 104727. [Google Scholar] [CrossRef]
- Bish, D.L.; Plötze, M. X-ray Powder Diffraction with Emphasis on Qualitative and Quantitative Analysis in Industrial Min-eralogy. In Advances in the Characterization of Industrial Minerals; European Mineralogical Union: London, UK, 2010. [Google Scholar]
- Ran, J.; Du, G.; Wang, F.Y. Rapid analysis of feldspar by X-ray diffractometry rietveld refinement method. Rock Miner. Anal. 2017, 36, 489–494. [Google Scholar]
- Wang, C.; Yang, R.; Wang, H. Synthesis of ZIF-8/Fly Ash Composite for Adsorption of Cu2+, Zn2+ and Ni2+ from Aqueous Solutions. Materials 2020, 13, 214. [Google Scholar] [CrossRef] [Green Version]
- Hamilton, J.; Wilson, S.; Turvey, C.; Morgan, B.; Tait, A.; McCutcheon, J.; Fallon, S.; Southam, G. Carbon accounting of mined landscapes, and deployment of a geochemical treatment system for enhanced weathering at Woodsreef Chrysotile Mine, NSW, Australia. J. Geochem. Explor. 2021, 220, 106655. [Google Scholar] [CrossRef]
- Rodríguez, I.; Gautam, R.; Tinoco, A. Using X-ray Diffraction Techniques for Biomimetic Drug Development, Formulation, and Polymorphic Characterization. Biomimetics 2021, 6, 1. [Google Scholar] [CrossRef]
- Haque, F.; Santos, R.M.; Chiang, Y.W. Optimizing Inorganic Carbon Sequestration and Crop Yield With Wollastonite Soil Amendment in a Microplot Study. Front. Plant Sci. 2020, 11, 1012. [Google Scholar] [CrossRef]
- Taylor, J.; Clapp, R. New Features and Advanced Applications of Siroquant: A Personal Computer XRD Full Profile Quantitative Analysis Software Package. Adv. X-ray Anal. 1991, 35, 49–55. [Google Scholar] [CrossRef]
- Walenta, C.; Fullmann, T. Advances in quantitative XRD analysis for clinker, cements, and cementitious additions. Int. Cent. Diffr. Data 2004, 19, 40–44. [Google Scholar] [CrossRef] [Green Version]
- Henry, N.F.M.; Lipson, H.; Wooster, W.A.; Cullity, B.D. The Interpretation of X-ray Diffraction Photographs; Macmillian Ltd.: London, UK, 1961. [Google Scholar]
- Tilley, R. Understanding Solids: The Science of Materials; John Wiley & Sons Ltd.: West Sussex, UK, 2004. [Google Scholar]
- Rietveld, H.M. The Rietveld method. Phys. Scr. 2014, 89, 098002. [Google Scholar] [CrossRef]
- Rojas-Mantilla, H.D.; Ayala-Duran, S.C.; Nogueira, R.F.P. Nontronite mineral clay NAu-2 as support for hematite applied as catalyst for heterogeneous photo-Fenton processes. Chemosphere 2021, 277, 130258. [Google Scholar] [CrossRef]
- Harris, W.; White, N. X-ray Chapter 4-Diffraction Techniques for Soil Mineral Identification. Methods Soil Anal. Part Mineral. Methods 2008, 5, 81–115. [Google Scholar]
- Jacob, R.; Nair, H.G.; Isac, J. Structural and morphological studies of nano-crystalline ceramic BaSr0.9Fe0.1TiO4. Int. Lett. Chem. Phys. Astron. 2015, 41, 100–117. [Google Scholar] [CrossRef] [Green Version]
- Barman, B.; Sarma, K.C. Structural characterization of PVA capped ZnS nano structured thin film. Indian J. Phys. 2010, 86, 703–707. [Google Scholar] [CrossRef]
- West, A.R. Solid State Chemistry and Its Application; Wiley & Sons: New York, NY, USA, 1974. [Google Scholar]
- Artioli, G. Science for the cultural heritage: The contribution of X-ray diffraction. X-ray Diffr. 2013, 24, 55–62. [Google Scholar] [CrossRef]
- Cléton, F.; Jouneau, P.H.; Henry, S.; Gäumann, M.; Buffat, P.A. Crystallographic orientation assessment by electron backscattered diffraction. Scanning 1999, 21, 232–237. [Google Scholar] [CrossRef] [Green Version]
- Gräfe, M.; Klauber, C.; Gan, B.; Tappero, R.V. Synchrotron X-ray microdiffraction (μXRD) in minerals and environmental research. Powder Diffr. 2014, 29, 64–72. [Google Scholar] [CrossRef]
- Lekston, Z.; Zubko, M. X-ray diffraction studies of the reversible phase transformation in niti shape memory alloy. Acta Phys. Pol. A 2016, 130, 1059–1062. [Google Scholar] [CrossRef]
- Lamiri, I.; Martinez-Blanco, D.; Abdelbaky, M.S.; Mari, D.; Hamana, D.; Garcia-Granda, S. Investigation of the order -disorder phase transition series in AuCu by in-situ temperature XRD and mechanical spectroscopy. J. Alloys Compd. 2019, 770, 748–754. [Google Scholar] [CrossRef]
- McCormack, S.J.; Tseng, K.P.; Weber, R.J.; Kapush, D.; Ushakov, S.V.; Navrotsky, A.; Kriven, W.M. In Situ Determination of the HfO2-Ta2O5-Temperature Phase Diagram up to 3000 °C. J. Am. Ceram. Soc. 2018, 102, 4848–4861. [Google Scholar] [CrossRef]
- Malinov, S.; Sha, W.; Guo, Z.; Tang, C.; Long, A. Synchrotron X-ray diffraction study of the phase transformation in titanium alloys. Mater. Charact. 2002, 48, 279–295. [Google Scholar] [CrossRef] [Green Version]
- Ashiri, R.; Nemati, A.; Ghamsari, M.S.; Sanjabi, S.; Aalipour, M. A modified method for barium titanate nanoparticles synthesis. Mater. Res. Bull. 2011, 46, 2291–2295. [Google Scholar] [CrossRef]
- Bemporad, E.; Brisotto, M.; Depero, L.; Gelfi, M.; Korsunsky, A.; Lunt, A.; Sebastiani, M. A critical comparison between XRD and FIB residual stress measurement techniques in thin films. Thin Solid Films 2014, 572, 224–231. [Google Scholar] [CrossRef]
- Singh, J.; Ranwa, S.; Akhtar, J.; Kumar, M. Growth of residual stress-free ZnO films on SiO2/Si substrate at room temperature for MEMS devices. AIP Adv. 2015, 5, 067140. [Google Scholar] [CrossRef]
- Ungar, T. Strain broadening caused by dislocation. Mater. Sci. Forum 1994, 923, 166–169. [Google Scholar] [CrossRef]
- Weertman, J.R. Hall-Petch strengthening in nano crystalline metal. Mater. Sci. Eng. A 1993, 166, 161–167. [Google Scholar] [CrossRef]
- Subbaiah, Y.V.; Prathap, P.; Reddy, K.R. Structural, electrical and optical properties of ZnS film deposited by close-spaced evaporation. Appl. Surf. Sci. 2006, 253, 2409–2415. [Google Scholar] [CrossRef]
- Huang, C.-Y.; Hsu, Y.-C.; Chen, J.-G.; Suryanarayanan, V.; Lee, K.-M.; Ho, K.-C. The effects of hydrothermal temperature and thickness of TiO2 film on the performance of a dye-sensitized solar cell. Sol. Energy Mater. Sol. Cells 2006, 90, 2391–2397. [Google Scholar] [CrossRef]
- Hummer, D.R.; Heaney, P.J.; Post, J.E. Thermal expansion of anatase and rutile between 300 and 575 K using synchrotron powder X-ray diffraction. Powder Diffr. 2007, 22, 352–356. [Google Scholar] [CrossRef]
- Nagash, S.; Gerhards, M.T.; Tietz, F.; Guillon, O. Coefficient of thermal expansion of Al- and Y-substituted NaSICON solid solution Na3+2xAlxYxZr2−2xSi2PO12. Batteries 2018, 4, 33. [Google Scholar] [CrossRef] [Green Version]
- Pathak, P.D.; Vasavada, N.G. Thermal expansion of NaCl, KCl and CSBr by X-ray diffraction and the law of corresponding states. Acta Crystallogr. Sect. A 1970, 26, 655–661. [Google Scholar] [CrossRef]
- Bouyrie, Y.; Candolfi, C.; Pailhès, S. From crystal to glass-like thermal conductivity in crystalline minerals. Phys. Chem. Chem. Phys. 2015, 17, 19751–19758. [Google Scholar] [CrossRef]
- Heidari, Z.; Pelalak, R.; Alizadeh, R.; Oturan, N.; Shirazian, S.; Oturan, M.A. Application of Mineral Iron-Based Natural Catalysts in Electro-Fenton Process: A Comparative Study. Catalysts 2021, 11, 57. [Google Scholar] [CrossRef]
- Bora, J.; Deka, P.; Bhuyan, P.; Sarma, K.P.; Hoque, R.R. Morphology and mineralogy of ambient particulate matter over mid-Brahmaputra Valley: Application of SEM–EDX, XRD, and FTIR techniques. SN Appl. Sci. 2021, 3, 137. [Google Scholar] [CrossRef]
- Mulenshi, J.; Gilbricht, S.; Chelgani, S.C.; Rosenkranz, J. Systematic characterization of historical tailings for possible remediation and recovery of critical metals and minerals—The Yxsjöberg case. J. Geochem. Explor. 2021, 226, 106777. [Google Scholar] [CrossRef]
- Gong, X.; Jiang, W.; Hu, S.; Yang, Z.; Liu, X.; Fan, Z. Comprehensive utilization of foundry dust: Coal powder and clay minerals separation by ultrasonic-assisted flotation. J. Hazard. Mater. 2021, 402, 124124. [Google Scholar] [CrossRef]
- Yuan, L.; Liu, Q.; Mathews, J.P.; Zhang, H.; Wu, Y. Quantifying the Structural Transitions of Chinese Coal to Coal-Derived Natural Graphite by XRD, Raman Spectroscopy, and HRTEM Image Analyses. Energy Fuels 2021, 35, 2335–2346. [Google Scholar] [CrossRef]
- Li, Q.; Zhang, L.; Gao, X.; Zhang, J. Effect of pulverized fuel ash, ground granulated blast-furnace slag and CO2 curing on performance of magnesium oxysulfate cement. Constr. Build. Mater. 2019, 230, 116990. [Google Scholar] [CrossRef]
- Nergis, D.D.; Abdullah, M.M.A.B.; Sandu, A.V.; Vizureanu, P. XRD and TG-DTA Study of New Alkali Activated Materials Based on Fly Ash with Sand and Glass Powder. Materials 2020, 13, 343. [Google Scholar] [CrossRef] [Green Version]
- Zhang, X.; Ge, J.; Kamali, F.; Othman, F.; Wang, Y.; Le-Hussain, F. Wettability of sandstone rocks and their mineral components during CO2 injection in aquifers: Implications for fines migration. J. Nat. Gas Sci. Eng. 2019, 73, 103050. [Google Scholar] [CrossRef]
- Song, Q.; Zhao, H.; Jia, J.; Yang, L.; Lv, W.; Gu, Q.; Shu, X. Effects of demineralization on the surface morphology, microcrystalline and thermal transformation characteristics of coal. J. Anal. Appl. Pyrolysis 2019, 145, 104716. [Google Scholar] [CrossRef]
- Jacob, S.R.; Wellington, D.F.; Bell, J.F.; Achilles, C.; Fraeman, A.A.; Horgan, B.; Johnson, J.R.; Maurice, S.; Peters, G.H.; Rampe, E.B.; et al. Spectral, Compositional, and Physical Properties of the Upper Murray Formation and Vera Rubin Ridge, Gale Crater, Mars. J. Geophys. Res. Planets 2020, 125, e2019JE006290. [Google Scholar] [CrossRef]
- Fang, S.; Xu, L.; Wu, H.; Xu, Y.; Wang, Z.; Shu, K.; Longhua, X. Influence of surface dissolution on sodium oleate adsorption on ilmenite and its gangue minerals by ultrasonic treatment. Appl. Surf. Sci. 2019, 500, 144038. [Google Scholar] [CrossRef]
- Fahad, M.; Ali, S.; Iqbal, Y. Plasma diagnostics by optical emission spectroscopy on manganese ore in conjunction with XRD, XRF and SEM-EDS. Plasma Sci. Technol. 2019, 21, 085507. [Google Scholar] [CrossRef]
- Idris, A.; El-Zahhar, A.A. Indicative properties measurements by SEM, SEM-EDX and XRD for initial homogeneity tests of new certified reference materials. Microchem. J. 2019, 146, 429–433. [Google Scholar] [CrossRef]
- Awadh, S.M.; Yaseen, Z.M. Investigation of silica polymorphs stratified in siliceous geode using FTIR and XRD methods. Mater. Chem. Phys. 2019, 228, 45–50. [Google Scholar] [CrossRef]
- Qin, L.; Gao, X.; Chen, T. Influence of mineral admixtures on carbonation curing of cement paste. Constr. Build. Mater. 2019, 212, 653–662. [Google Scholar] [CrossRef]
- Zhang, L.; Li, Y.; Guo, H.; Zhang, H.; Zhang, N.; Hayat, T.; Sun, Y. Decontamination of U(VI) on graphene oxide/Al2O3 composites investigated by XRD, FT-IR and XPS techniques. Environ. Pollut. 2019, 248, 332–338. [Google Scholar] [CrossRef]
- Joni, I.M.; Nulhakim, L.; Vanitha, M.; Panatarani, C. Characteristics of crystalline silica (SiO2) particles prepared by simple solution method using sodium silicate (Na2SiO3) precursor. J. Phys. Conf. Ser. 2018, 1080, 012006. [Google Scholar] [CrossRef]
- Zhou, X.; Liu, D.; Bu, H.; Deng, L.; Liu, H.; Yuan, P.; Du, P.; Song, H. XRD-based quantitative analysis of clay minerals using reference intensity ratios, mineral intensity factors, Rietveld, and full pattern summation methods: A critical review. Solid Earth Sci. 2018, 3, 16–29. [Google Scholar] [CrossRef]
- Loganathan, N.; Bowers, G.M.; Yazaydin, A.O.; Schaef, H.T.; Loring, J.S.; Kalinichev, A.G.; Kirkpatrick, R.J. Clay Swelling in Dry Supercritical Carbon Dioxide: Effects of Interlayer Cations on the Structure, Dynamics, and Energetics of CO2 Intercalation Probed by XRD, NMR, and GCMD Simulations. J. Phys. Chem. C 2018, 122, 4391–4402. [Google Scholar] [CrossRef] [Green Version]
- Sun, Z.; Vollpracht, A. Isothermal calorimetry and in-situ XRD study of the NaOH activated fly ash, metakaolin and slag. Cem. Concr. Res. 2018, 103, 110–122. [Google Scholar] [CrossRef]
- Hupp, B.N.; Donovan, J.J. Quantitative mineralogy for facies definition in the Marcellus Shale (Appalachian Basin, USA) using XRD-XRF integration. Sediment. Geol. 2018, 371, 16–31. [Google Scholar] [CrossRef]
- Li, Z.; Tang, L.; Zheng, Y.; Tian, D.; Su, M.; Zhang, F.; Ma, S.; Hu, S. Characterizing the Mechanisms of Lead Immobilization via Bioapatite and Various Clay Minerals. ACS Earth Space Chem. 2017, 1, 152–157. [Google Scholar] [CrossRef]
- Induja, I.; Sebastian, M. Microwave dielectric properties of mineral sillimanite obtained by conventional and cold sintering process. J. Eur. Ceram. Soc. 2017, 37, 2143–2147. [Google Scholar] [CrossRef] [Green Version]
- Khan, H.; Yerramilli, A.S.; D’Oliveira, A.; Alford, T.L.; Boffito, D.C.; Patience, G.S. Experimental methods in chemical engineering: X-ray diffraction spectroscopy-XRD. Can. J. Chem. Eng. 2020, 98, 1255–1266. [Google Scholar] [CrossRef]
- Awad, M.E.; López-Galindo, A.; Sánchez-Espejo, R.; Sainz-Díaz, C.I.; El-Rahmany, M.M.; Viseras, C. Crystallite size as a function of kaolinite structural order-disorder and kaolin chemical variability: Sedimentological implication. Appl. Clay Sci. 2018, 162, 261–267. [Google Scholar] [CrossRef]
- Silva, A.L.D.; Oliveira, A.H.D.; Fernandes, M.L.S. Influence of preferred orienation of minerals in the mineralogical identification process by X-ray diffraction. In Proceedings of the INAC 2011: International Nuclear Atlantic Conference, Belo Horizonte, MG, Brazil, 24–28 October 2011. [Google Scholar]
- Cullity, B.; Stock, S. Elements of X-ray Diffraction; Pearson Education Limited: New Delhi, India, 2014. [Google Scholar]
- Hermann, H.; Ermrich, M. Microabsorption Correction of X-Ray Intensities Diffracted by Multiphase Powder Specimens. Powder Diffr. 1989, 4, 189–195. [Google Scholar] [CrossRef]
- Scarlett, N.V.Y.; Madsen, I.C.; Cranswick, L.M.D.; Lwin, T.; Groleau, E.; Stephenson, G.; Aylmore, M.; Agron-Olshinaa, N. Outcomes of the International Union of Crystallography Commission on Powder Diffraction Round Robin on Quantitative Phase Analysis: Samples 2, 3, 4, synthetic bauxite, natural granodiorite and pharmaceut. J. Appl. Crystallogr. 2002, 35, 383–400. [Google Scholar] [CrossRef]
- De Campos, M.F.; Machado, J.C.D.R.; Achete, C.A. Metrology for a Sustainable Development Brazil. In Proceedings of the XVIII IMEKO World Congress, Rio de Janeiro, Brazil, 17–22 September 2006. [Google Scholar]
- Igwebike-Ossi, C.D. X-ray Techniques. In Failure Analysis and Prevention; IntechOpen: London, UK, 2017. [Google Scholar]
- Bish, D.L.; Reynolds, R.C. Sample Preparation for X-ray Diffraction. Mod. Powder Diffr. 2018, 20, 73–100. [Google Scholar]
- Rathnaweera, T.; Ranjith, P.; Gu, X.; Perera, S.; Kumari, W.; Wanniarachchi, A.; Haque, A.; Li, J. Experimental investigation of thermomechanical behaviour of clay-rich sandstone at extreme temperatures followed by cooling treatments. Int. J. Rock Mech. Min. Sci. 2018, 107, 208–223. [Google Scholar] [CrossRef]
- Garcia-Granada, G.; Montejo-Bernardo, J. X-ray Diffraction-Powder; Reference Module in Chemistry Molecular Sciences and Chemical Engineering; Elsevier: Amsterdam, The Netherlands, 2013. [Google Scholar]
- Sarrazin, P.C.; Blake, D.F.; Gailhanou, M.; Chen, J.; Dera, P.; Downs, R.T.; Bristow, T.F. New Developments In X-ray Diffraction For Planetary Exploration. In Proceedings of the 49th Lunar and Planetary Science Conference, The Woodlands, TX, USA, 19–30 March 2018. [Google Scholar]
- Černý, R. Crystal Structures from Powder Diffraction: Principles, Difficulties and Progress. Crystals 2017, 7, 142. [Google Scholar] [CrossRef] [Green Version]
- Bergmann, J.; Le Bail, A.; Shirley, R.; Zlokazov, V. Renewed interest in powder diffraction data indexing. Z. Krist.—Cryst. Mater. 2004, 219, 783–790. [Google Scholar] [CrossRef]
- Fitch, A.; Curfs, C. Ultrafast Powder Diffraction. In The Power of Powder Diffraction; Erice International School of Crystallography: Erice, Italy, 2011; pp. 103–112. [Google Scholar]
- Smrčok, L. Powder Diffraction + Computational Methods. In The Power of Powder Diffraction; Erice International School of Crystallography: Erice, Italy, 2011; pp. 231–238. [Google Scholar]
- Suzuki, Y.; Hino, H.; Hawai, T.; Saito, K.; Kotsugi, M.; Ono, K. Symmetry prediction and knowledge discovery from X-ray diffraction patterns using an interpretable machine learning approach. Sci. Rep. 2020, 10, 21790. [Google Scholar] [CrossRef]
- Lee, J.-W.; Park, W.B.; Singh, S.P.; Sohn, K.-S. A deep-learning technique for phase identification in multiphase inorganic compounds using synthetic XRD powder patterns. Nat. Commun. 2020, 11, 86. [Google Scholar] [CrossRef] [Green Version]
- Ziletti, A.; Kumar, D.; Scheffler, M.; Ghiringhelli, L.M. Insightful classification of crystal structures using deep learning. Nat. Commun. 2018, 9, 2775. [Google Scholar] [CrossRef] [Green Version]


| Techniques/Methods | Year | Minerals/Materials | Reference |
|---|---|---|---|
| XRD and Raman | 2021 | Ilmenite, pyrite, chromite, chalcopyrite | [74] |
| XRD, FTIR, SEM-EDX | 2021 | Quartz, illite, augite, kaolinite, calcite etc. | [75] |
| XRD, MLA | 2021 | Scheelite, fluorite, pyrrhotite, pyrite | [76] |
| XRD, XRF, EPMA | 2021 | Clay minerals | [77] |
| XRD, Raman Spectroscopy, HRTEM | 2021 | Coal, graphite | [78] |
| XRD, FTIR, SEM, TG-DTA, SEM-EDS | 2020 | Pulverized fuel ash, slag, magnesium oxysulfate cement | [79] |
| XRD, TG-DTA | 2020 | Fly ash with sand and glass powder | [80] |
| XRD, XRF, SEM-EDS | 2020 | Sandstones and their mineral components | [81] |
| XRD, FTIR, SEM, AFM, TGA, GC | 2020 | Raw coal and acid washing coal | [82] |
| XRD | 2020 | Upper Murray formation, Vera Rubin Ridge, Gale Crater | [83] |
| XRD, XPS, ICP-OES | 2020 | Ilmenite, titanaugite, olivine | [84] |
| XRD, XRF, SEM-EDS | 2019 | Manganese | [85] |
| XRD, SEM, SEM-EDX | 2019 | Certified reference materials including soil, dust, sediment, leaves, dates, and fish | [86] |
| XRD, FTIR | 2019 | Silica polymorphs | [87] |
| XRD, FTIR, TG-DTA, MIP, SEM | 2019 | Ground granulated blast-furnace slag, fly ash, cement mortars | [88] |
| XRD, FTIR, XPS | 2019 | Graphene oxide, nano alumina | [89] |
| XRD, XRF, SEM, PSA | 2018 | SiO2, Na2SiO3 | [90] |
| XRD, RIR, MIF, Rietveld, Full Pattern Summation | 2018 | Clay minerals | [91] |
| XRD, NMR, GNMD | 2018 | Clay minerals, hectorite | [92] |
| In-situ XRD, Isothermal Calorimetry | 2018 | Fly ash, metakaolin, slag | [93] |
| XRD, XRF | 2018 | Clay minerals, mica, mudrock | [94] |
| XRD, ICP-OES, HRTEM | 2017 | Clay minerals, bioapatite | [95] |
| XRD, conventional sintering, cold sintering | 2017 | Sillimanite | [96] |
Publisher’s Note: MDPI stays neutral with regard to jurisdictional claims in published maps and institutional affiliations. |
© 2022 by the authors. Licensee MDPI, Basel, Switzerland. This article is an open access article distributed under the terms and conditions of the Creative Commons Attribution (CC BY) license (https://creativecommons.org/licenses/by/4.0/).
Share and Cite
Ali, A.; Chiang, Y.W.; Santos, R.M. X-ray Diffraction Techniques for Mineral Characterization: A Review for Engineers of the Fundamentals, Applications, and Research Directions. Minerals 2022, 12, 205. https://doi.org/10.3390/min12020205
Ali A, Chiang YW, Santos RM. X-ray Diffraction Techniques for Mineral Characterization: A Review for Engineers of the Fundamentals, Applications, and Research Directions. Minerals. 2022; 12(2):205. https://doi.org/10.3390/min12020205
Chicago/Turabian StyleAli, Asif, Yi Wai Chiang, and Rafael M. Santos. 2022. "X-ray Diffraction Techniques for Mineral Characterization: A Review for Engineers of the Fundamentals, Applications, and Research Directions" Minerals 12, no. 2: 205. https://doi.org/10.3390/min12020205