
In Situ Raman Spectroscopy and DFT Studies of the Phase Transition from Zircon to Reidite at High P–T Conditions
 , , ,
, , ,
Abstract
:1. Introduction
2. Materials and Methods
3. Results and Discussion
4. Conclusions
Author Contributions
Funding
Data Availability Statement
Acknowledgments
Conflicts of Interest
References
- Finch, R.J.; Hanchar, J.M.; Hoskin, P.W.O.; Burns, P.C. Rare-earth elements in synthetic zircon: Part 2. A single-crystal X-ray study of xenotime substitution. Am. Miner. 2001, 86, 681–689. [Google Scholar] [CrossRef]
- Hawkesworth, C.; Kemp, A. Using hafnium and oxygen isotopes in zircons to unravel the record of crustal evolution. Chem. Geol. 2006, 226, 144–162. [Google Scholar] [CrossRef]
- Lissenberg, C.J.; Rioux, M.; Shimizu, N.; Bowring, S.A.; Mével, C. Zircon Dating of Oceanic Crustal Accretion. Science 2009, 323, 1048–1050. [Google Scholar] [CrossRef] [PubMed]
- Gao, Y.J.; Liu, Y.G.; Zhang, J.W.; Kong, H.L.; Chen, A.P.; Kou, S.L. Post-UHP tectonic evolution of the East Kunlun Orogenic Belt, northern Tibetan Plateau: Insight from the regional-scale crustal anatexis. Int. Geol. Rev. 2022, 2059707. [Google Scholar] [CrossRef]
- Rubatto, D.; Hermann, J. Zircon Behaviour in Deeply Subducted Rocks. Elements 2007, 3, 31–35. [Google Scholar] [CrossRef]
- Korhonen, F.J.; Clark, C.; Brown, M.; Taylor, R.J.M. Taking the temperature of Earth’s hottest crust. Earth Planet. Sci. Lett. 2014, 408, 341–354. [Google Scholar] [CrossRef]
- Liu, P.; Jin, Z. Metamorphic Evolution of a Tremolite Marble from the Dabie UHP Terrane, China: A Focus on Zircon. J. Earth Sci. 2022, 33, 493–506. [Google Scholar] [CrossRef]
- Wittmann, A.; Kenkmann, T.; Schmitt, R.T.; Stöffler, D. Shock-metamorphosed zircon in terrestrial impact craters. Meteorit. Planet. Sci. 2006, 41, 433–454. [Google Scholar] [CrossRef]
- Cavosie, A.J.; Erickson, T.M.; Timms, N.E. Nanoscale records of ancient shock deformation: Reidite (ZrSiO4) in sandstone at the Ordovician Rock Elm impact crater. Geology 2015, 43, 315–318. [Google Scholar] [CrossRef]
- Tomioka, N.; Miyahara, M. High-pressure minerals in shocked meteorites. Meteorit. Planet. Sci. 2017, 52, 2017–2039. [Google Scholar] [CrossRef]
- Thein, J. A Tektite Layer in Upper Eocene Sediments of the New Jersey Continental Slope (Site 612, Leg 95). Initial. Rep. Deep. Sea Drill. Proj. 1987, 95, 565–579. [Google Scholar] [CrossRef]
- Glass, B.P.; Liu, S.B. Discovery of high-pressure ZrSiO4 polymorph in naturally occurring shock-metamorphosed zircons. Geology 2001, 29, 371–373. [Google Scholar] [CrossRef]
- Glass, B.P.; Liu, S.; Leavens, P.B. Reidite: An impact-produced high-pressure polymorph of zircon found in marine sediments. Am. Miner. 2002, 87, 562–565. [Google Scholar] [CrossRef]
- Scott, H.P.; Williams, Q.; Knittle, E. Ultralow Compressibility Silicate without Highly Coordinated Silicon. Phys. Rev. Lett. 2002, 88, 015506. [Google Scholar] [CrossRef]
- Gucsik, A.; Zhang, M.; Koeberl, C.; Salje, E.K.H.; Redfern, S.A.T.; Pruneda, J.M. Infrared and Raman spectra of ZrSiO4 experimentally shocked at high pressures. Miner. Mag. 2004, 68, 801–811. [Google Scholar] [CrossRef]
- Ewing, R.C. Nuclear waste forms for actinides. Proc. Natl. Acad. Sci. USA 1999, 96, 3432–3439. [Google Scholar] [CrossRef] [Green Version]
- Knittle, E.; Williams, Q. High-pressure Raman spectroscopy of ZrSiO4: Observation of the zircon to scheelite transition at 300 K. Am. Mineral. 1993, 78, 245–252. [Google Scholar]
- Ono, S.; Funakoshi, K.; Nakajima, Y.; Tange, Y.; Katsura, T. Phase transition of zircon at high P-T conditions. Contrib. Miner. Pet. 2004, 147, 505–509. [Google Scholar] [CrossRef] [Green Version]
- Ono, S.; Tange, Y.; Katayama, I.; Kikegawa, T. Equations of state of ZrSiO4 phases in the upper mantle. Am. Miner. 2004, 89, 185–188. [Google Scholar] [CrossRef]
- Van Westrenen, W.; Frank, M.R.; Hanchar, J.M.; Fei, Y.W.; Finch, R.J.; Zha, C.-S. In situ determination of the compressibility of synthetic pure zircon (ZrSiO4) and the onset of the zircon-reidite phase transition. Am. Miner. 2004, 89, 197–203. [Google Scholar] [CrossRef]
- Akaogi, M.; Hashimoto, S.; Kojitani, H. Thermodynamic properties of ZrSiO4 zircon and reidite and of cotunnite-type ZrO2 with application to high-pressure high-temperature phase relations in ZrSiO4. Phys. Earth Planet. Inter. 2018, 281, 1–7. [Google Scholar] [CrossRef]
- Marqués, M.; Flórez, M.; Recio, J.M.; Gerward, L.; Olsen, J.S. Structure and stability of ZrSiO4 under hydrostatic pressure. Phys. Rev. B 2006, 74, 014104. [Google Scholar] [CrossRef] [Green Version]
- Marqués, M.; Contreras-García, J.; Flórez, M.; Recio, J.M. On the mechanism of the zircon-reidite pressure induced transformation. J. Phys. Chem. Solids 2008, 69, 2277–2280. [Google Scholar] [CrossRef] [Green Version]
- Du, J.C.; Devanathan, R.; Corrales, L.R.; Weber, W.J. First-principles calculations of the electronic structure, phase transition and properties of ZrSiO4 polymorphs. Comput. Theor. Chem. 2012, 987, 62–70. [Google Scholar] [CrossRef]
- Dutta, R.; Mandal, N. Structure, elasticity and stability of reidite (ZrSiO4) under hydrostatic pressure: A density functional study. Mater. Chem. Phys. 2012, 135, 322–329. [Google Scholar] [CrossRef]
- Kusaba, K.; Syono, Y.; Kikuchi, M.; Fukuoka, K. Shock behavior of zircon: Phase transition to scheelite structure and decomposition. Earth Planet. Sci. Lett. 1985, 72, 433–439. [Google Scholar] [CrossRef]
- Kusaba, K.; Yagi, T.; Kikuchi, M.; Syono, Y. Structural considerations on the mechanism of the shock-induced zircon-scheelite transition in ZrSiO4. J. Phys. Chem. Solids 1986, 47, 675–679. [Google Scholar] [CrossRef]
- Kantor, I.; Prakapenka, V.; Kantor, A.; Dera, P.; Kurnosov, A.; Sinogeikin, S.; Dubrovinskaia, N.; Dubrovinsky, L. BX90: A new diamond anvil cell design for X-ray diffraction and optical measurements. Rev. Sci. Instrum. 2012, 83, 125102. [Google Scholar] [CrossRef]
- Trots, D.M.; Kurnosov, A.; Ballaran, T.B.; Tkachev, S.; Zhuravlev, K.; Prakapenka, V.; Berkowski, M.; Frost, D.J. The Sm:YAG primary fluorescence pressure scale. J. Geophys. Res. Solid Earth 2013, 118, 5805–5813. [Google Scholar] [CrossRef]
- Zhao, X.; Zheng, Z.; Chen, J.Z.; Gao, Y.; Sun, J.H.; Hou, X.; Xiong, M.J.; Mei, S.H. High P-T Calcite-Aragonite Phase Transitions Under Hydrous and Anhydrous Conditions. Front. Earth Sci. 2022, 10, 907967. [Google Scholar] [CrossRef]
- Togo, A.; Chaput, L.; Tanaka, I.; Hug, G. First-principles phonon calculations of thermal expansion in Ti3SiC2, Ti3AlC2, and Ti3GeC2. Phys. Rev. B 2010, 81, 174301. [Google Scholar] [CrossRef]
- Togo, A.; Tanaka, I. First principles phonon calculations in materials science. Scr. Mater. 2015, 108, 1–5. [Google Scholar] [CrossRef] [Green Version]
- Kresse, G.; Furthmüller, J. Efficient iterative schemes forab initiototal-energy calculations using a plane-wave basis set. Phys. Rev. B 1996, 54, 11169–11186. [Google Scholar] [CrossRef]
- Kresse, G.; Joubert, D. From ultrasoft pseudopotentials to the projector augmented-wave method. Phys. Rev. B 1999, 59, 1758–1775. [Google Scholar] [CrossRef]
- Perdew, J.P.; Zunger, A. Self-interaction correction to density-functional approximations for many-electron systems. Phys. Rev. B 1981, 23, 5048–5079. [Google Scholar] [CrossRef] [Green Version]
- Blöchl, P.E. Projector augmented-wave method. Phys. Rev. B Condens. Matter Mater. Phys. 1994, 50, 17953–17979. [Google Scholar] [CrossRef] [Green Version]
- Baroni, S.; de Gironcoli, S.; Dal Corso, A.; Giannozzi, P. Phonons and related crystal properties from density-functional perturbation theory. Rev. Mod. Phys. 2001, 73, 515–562. [Google Scholar] [CrossRef] [Green Version]
- Vinet, P.; Rose, J.H.; Ferrante, J.; Smith, J.R. Universal features of the equation of state of solids. J. Phys. Condens. Matter 1989, 1, 1941–1963. [Google Scholar] [CrossRef]
- Binvignat, F.A.P.; Malcherek, T.; Angel, R.J.; Paulmann, C.; Schlüter, J.; Mihailova, B. Radiation-damaged zircon under high pressures. Phys. Chem. Miner. 2018, 45, 981–993. [Google Scholar] [CrossRef]
- Mihailova, B.; Waeselmann, N.; Stangarone, C.; Angel, R.J.; Prencipe, M.; Alvaro, M. The pressure-induced phase transition(s) of ZrSiO4: Revised. Phys. Chem. Miner. 2019, 46, 807–814. [Google Scholar] [CrossRef] [Green Version]
- Stangarone, C.; Angel, R.J.; Prencipe, M.; Mihailova, B.; Alvaro, M. New insights into the zircon-reidite phase transition. Am. Miner. 2019, 104, 830–837. [Google Scholar] [CrossRef]
- Smirnov, M.B.; Mirgorodsky, A.P.; Kazimirov, V.Y.; Guinebretière, R. Bond-switching mechanism for the zircon-scheelite phase transition. Phys. Rev. B 2008, 78, 094109. [Google Scholar] [CrossRef]
- Gucsik, A. Micro-Raman spectroscopy of reidite as an impact-induced high pressure polymorph of zircon: Experimental investigation and attempt to application. Acta Mineral. Petrogr. 2007, 47, 17–24. [Google Scholar]
- Zhang, J.; Li, B.; Utsumi, W.; Liebermann, R.C. In situ X-ray observations of the coesite-stishovite transition: Reversed phase boundary and kinetics. Phys. Chem. Miner. 1996, 23, 1–10. [Google Scholar] [CrossRef]


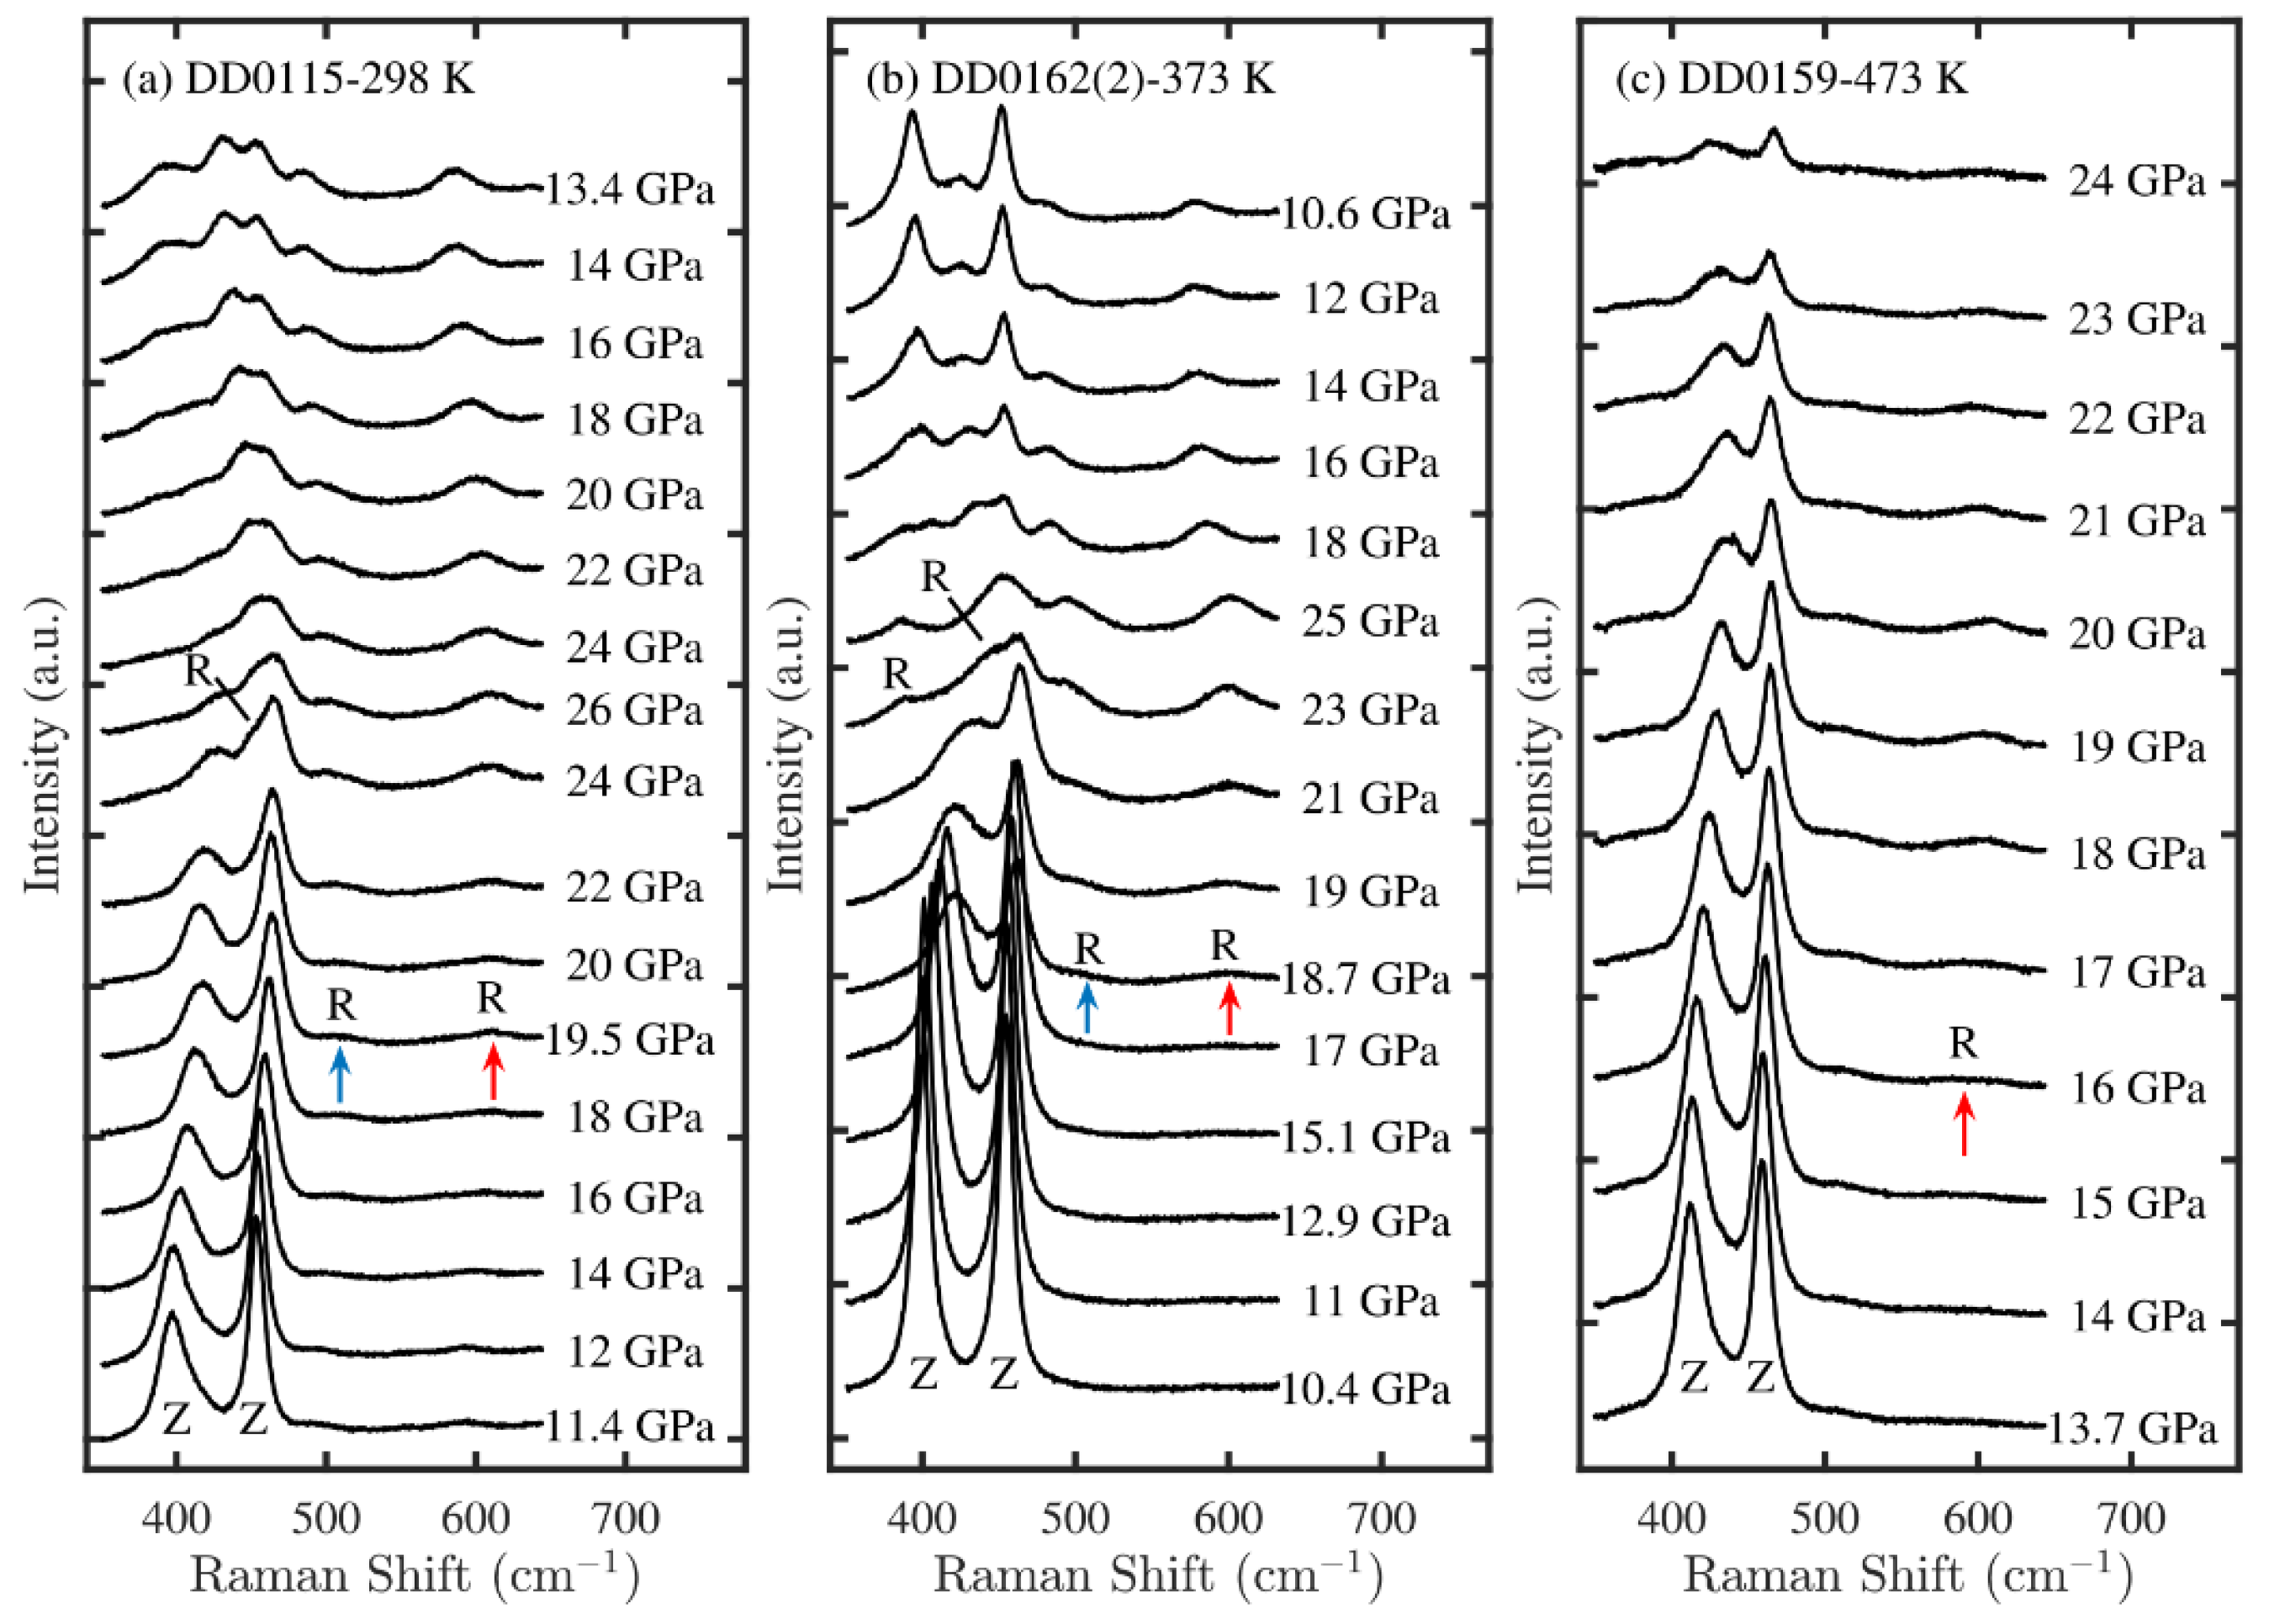
| Run | Temperature (K) | Pressure (GPa) | Zircon–Reidite Transition Pressure (GPa) |
| (In situ Raman observation at high temperature and high pressure) | |||
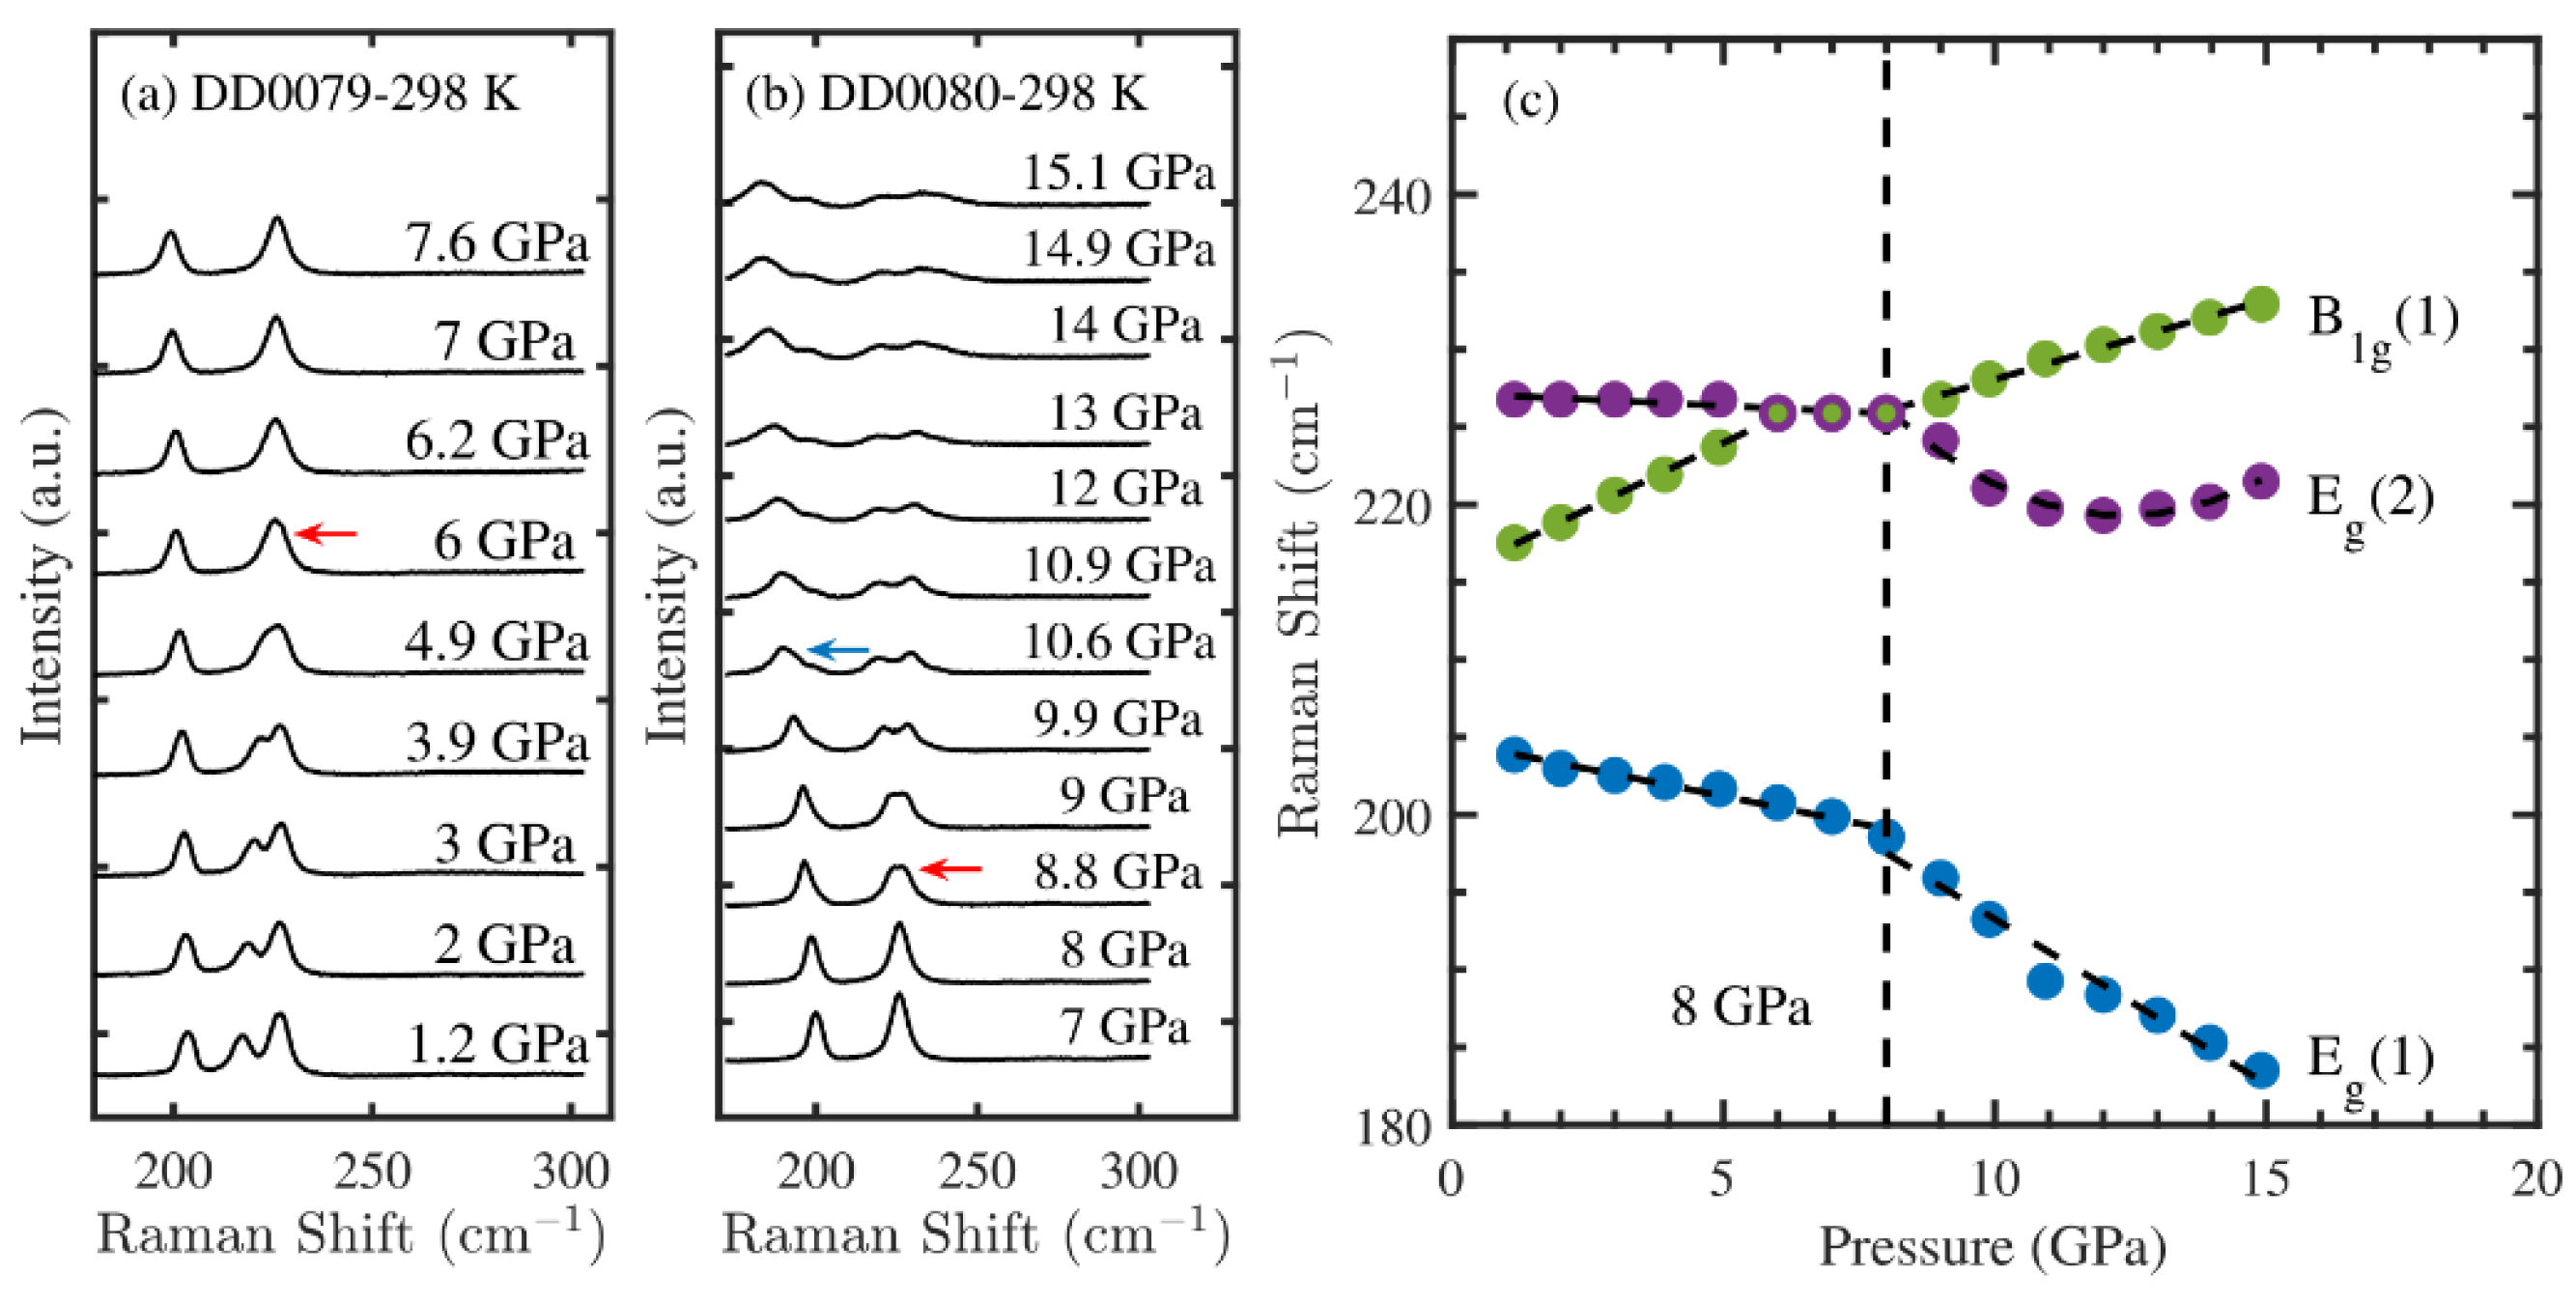
| DD0079 | 298 | 1.2–7.6 | — 1 |
| DD0080 2 | 298 | 6.6–15.1 | — |
| DD0091 | 298 | 9.2–19.5 | 19.1 |
| DD0114 | 298 | 4.4–18.4 | — |
| DD0115 | 298 | 11.4–26.0 | 19.5 |
| DD0123 | 298 | 13.6–25.0 | 21.0 |
| DD0214 | 298 | 0.6–21.8 | 20.0 |
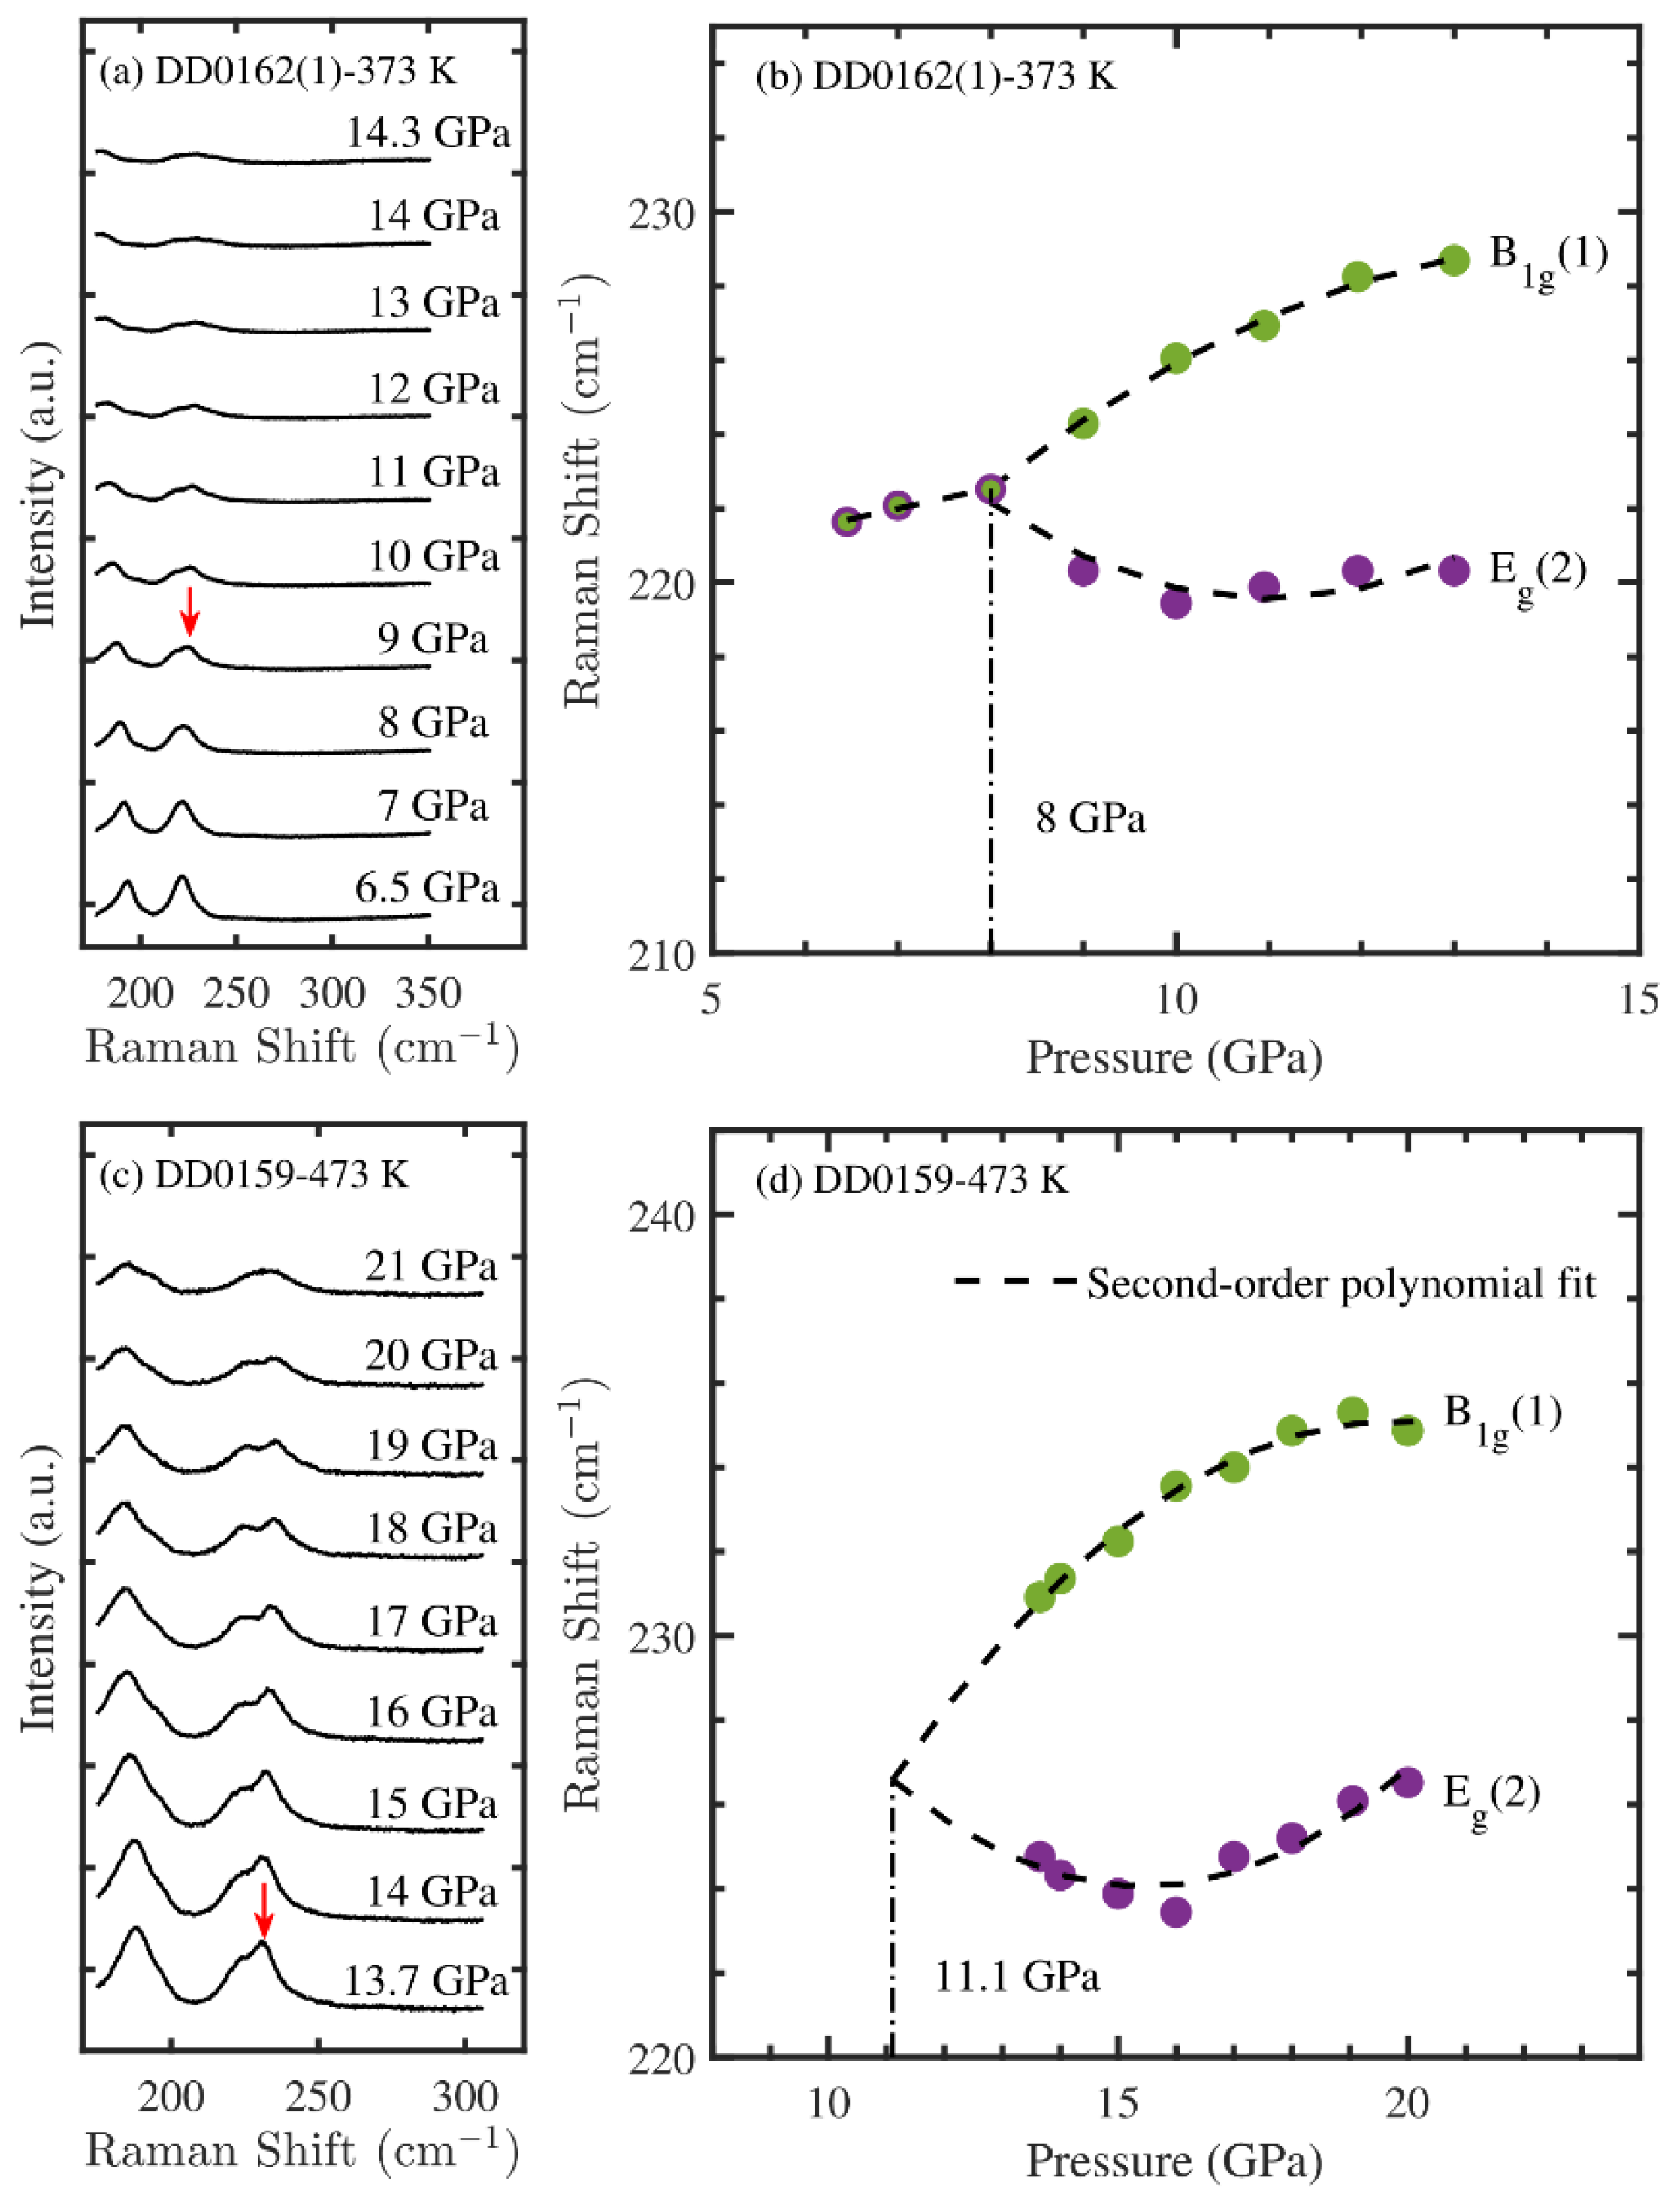
| DD0162(1) | 373 | 6.5–14.3 | — |
| DD0162(2) 3 | 373 | 10.4–25.0 | 18.7 |
| DD0159 | 473 | 13.7–25.0 | 16.0 |
| Run | Temperature (K) | Pressure (GPa) | Recovered Samples |
| (Ex situ Raman observation at room temperature and atmospheric pressure) | |||
| CD0155 | 298 | 24.0 | zircon + reidite |
| CD0031 | 373 | 8.7 | zircon |
| CD0039 | 373 | 13.2 | zircon |
| CD0032 | 473 | 9.4 | zircon |
| CD0154 | 500 | 16.1 | zircon + reidite |
| CD0033 | 573 | 8.7 | zircon |
| CD0172(1) 4 | 600 | 12.5 | zircon |
| CD0172(2) | 700 | 10.0 | zircon |
| CD0172(3) | 800 | 15.2 | zircon + reidite |
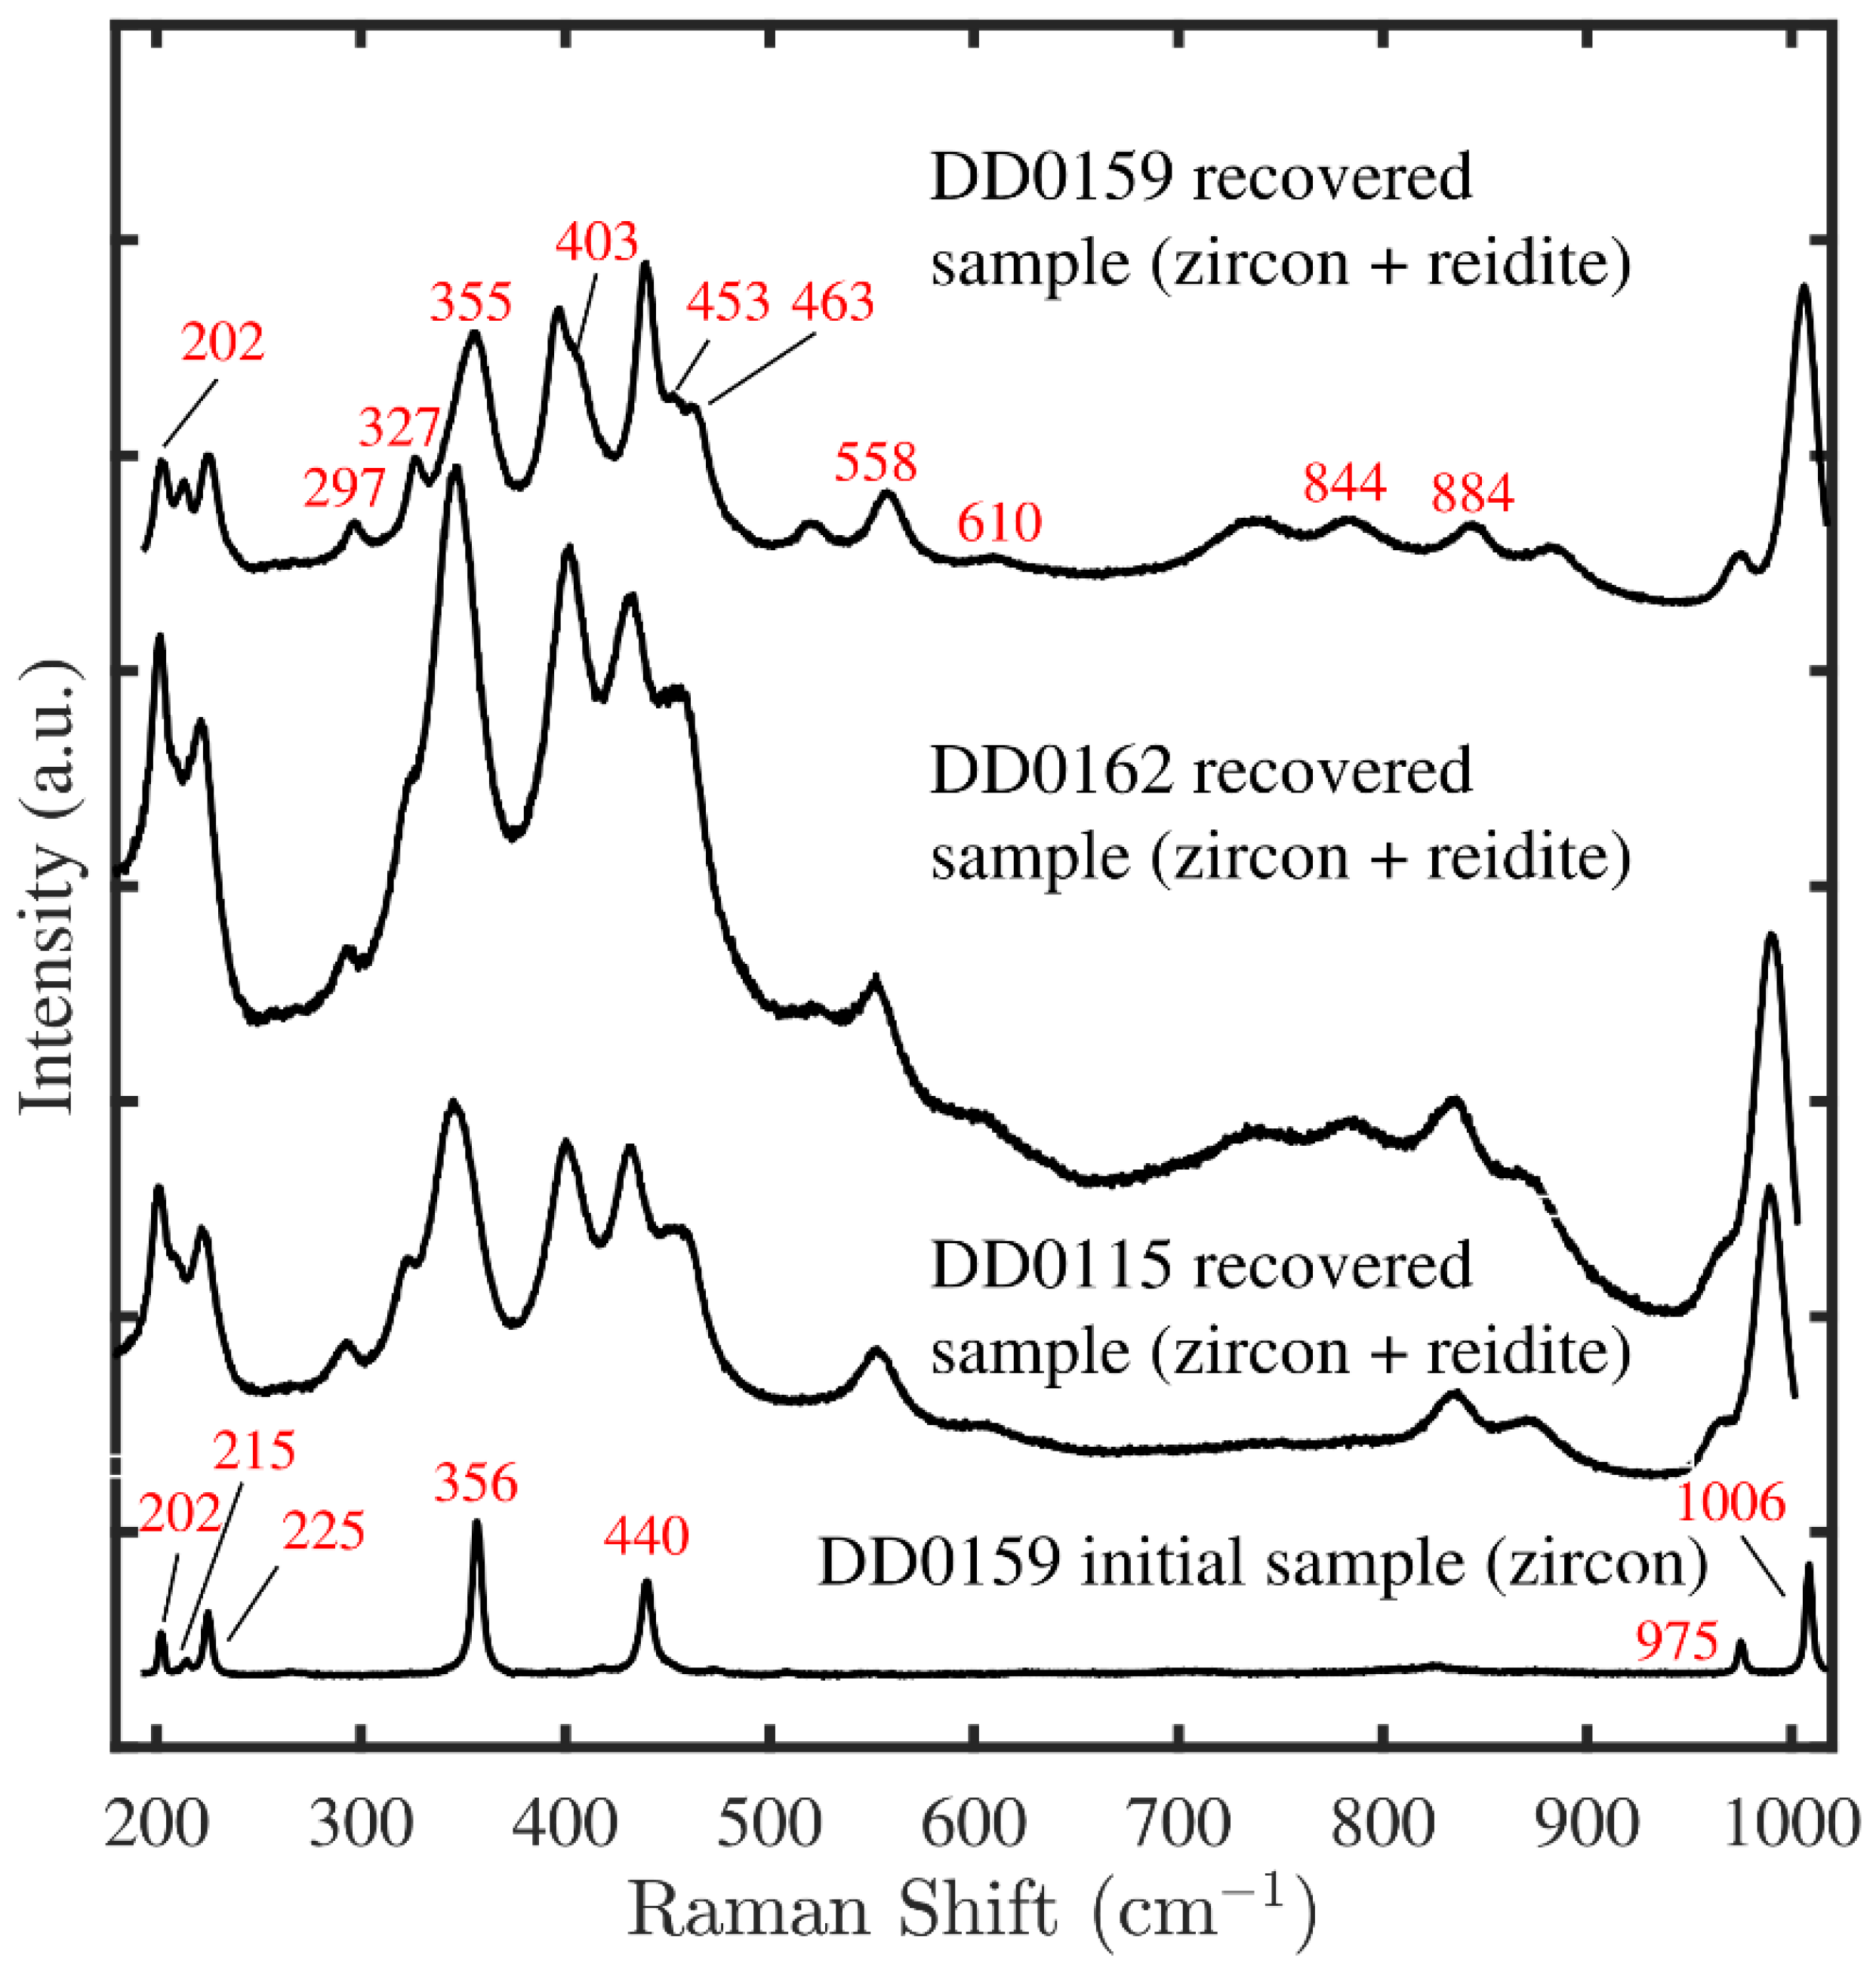
| Vibrational Modes | 1 (cm−1) | 2 (cm−1) | 3 (cm−1) | 4 (cm−1) | 5 (cm−1) |
|---|---|---|---|---|---|
| Eg (1) | 202 | 196 (+6) 6 | 204 (−2) | — | 209 (−7) |
| Bg (1) | — | — | 238 | 237.9 | 242 |
| Eg (2) | 297 | — | 297 (0) | 297.0 (0) | 300 (−3) |
| Ag (1) | 327 | 320 (+7) | 327 (0) | 326.4 (−0.6) | 326 (+1) |
| Bg (2) | 355 | 343 (+12) | 353 (+2) | 349 (+6) | 350 (+5) |
| Ag (2) | 403 | — | 406 (−3) | 406.1 (−3.1) | 409 (−6) |
| Eg (3) | 453 | — | — | — | 458 (−5) |
| Bg (3) | 463 | 456 (+7) | 464 (−1) | 465.8 (−2.8) | 465 (−2) |
| Eg (4) | 558 | 552 (+6) | 558 (0) | 558.4 (−0.4) | 558 (0) |
| Bg (4) | 610 | 604 | 610 (0) | 610.9 (−0.9) | 608 (+2) |
| Bg (5) | 844 | 842 (+2) | 847 (−3) | 847 (−3) | 852 (−8) |
| Ag (3) | — | — | — | — | 861 |
| Eg (5) | 884 | 880 (+4) | 887 (−3) | 886.4 (−2.4) | 891 (−7) |
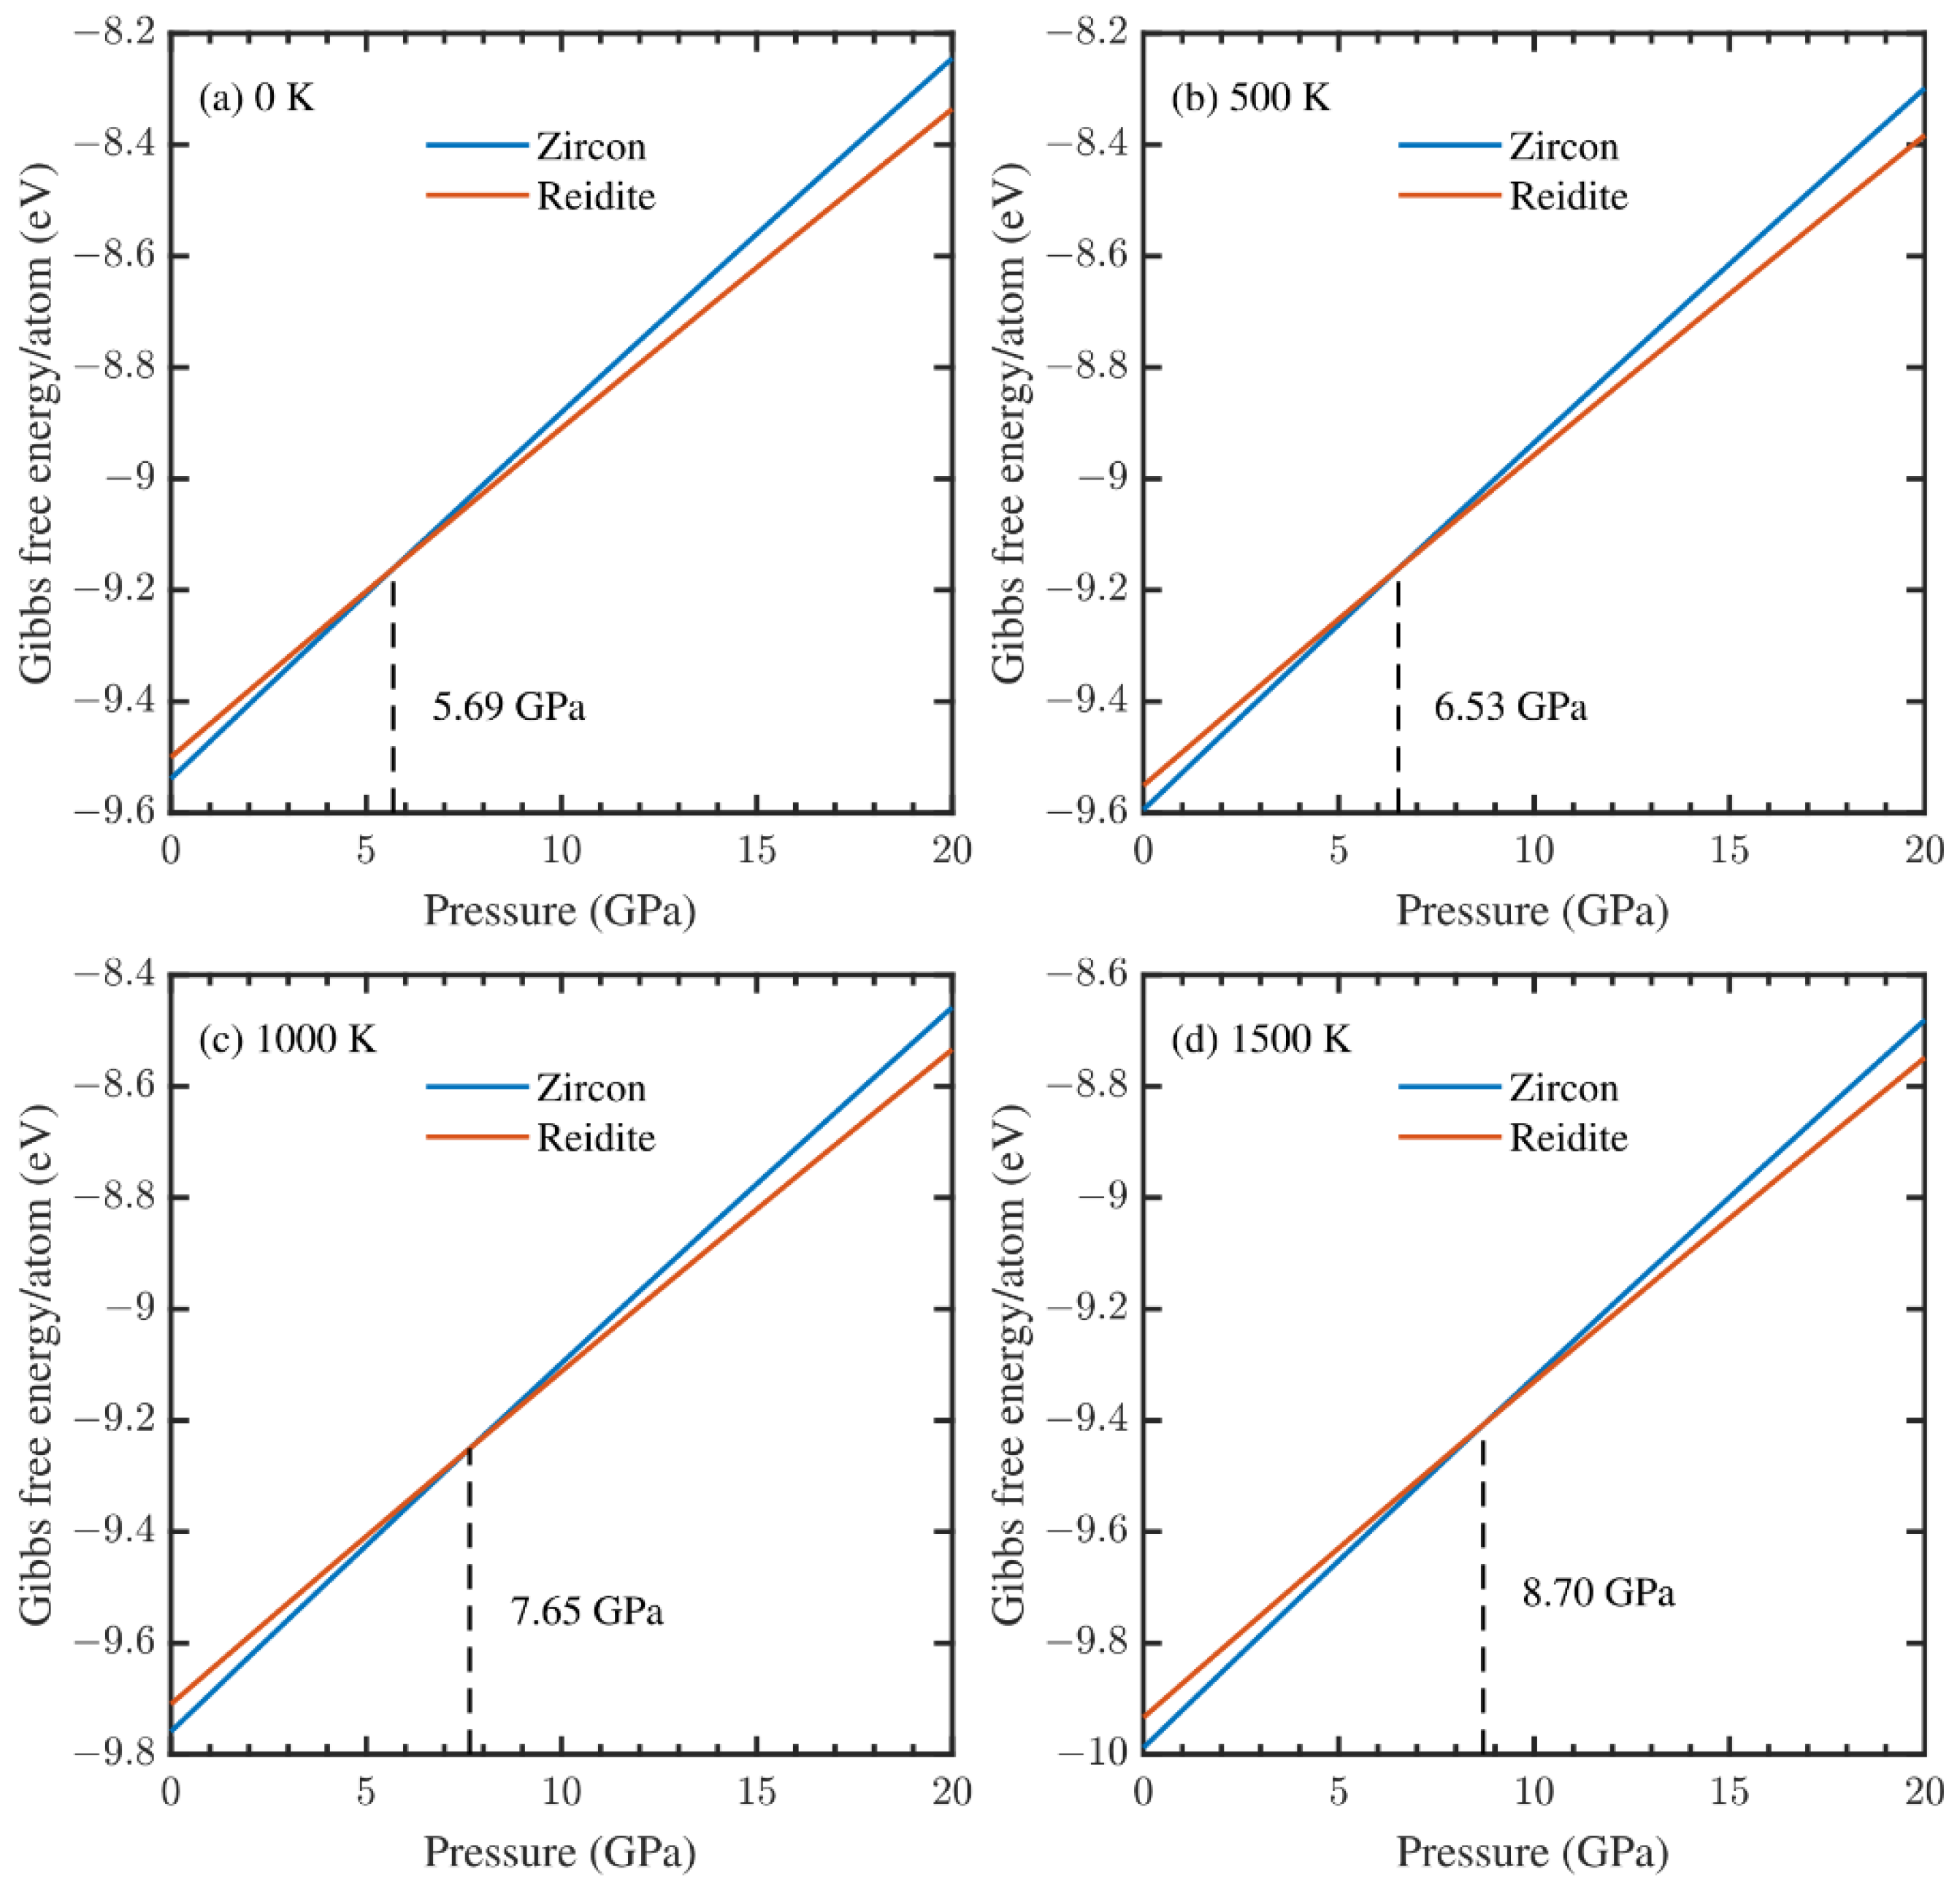
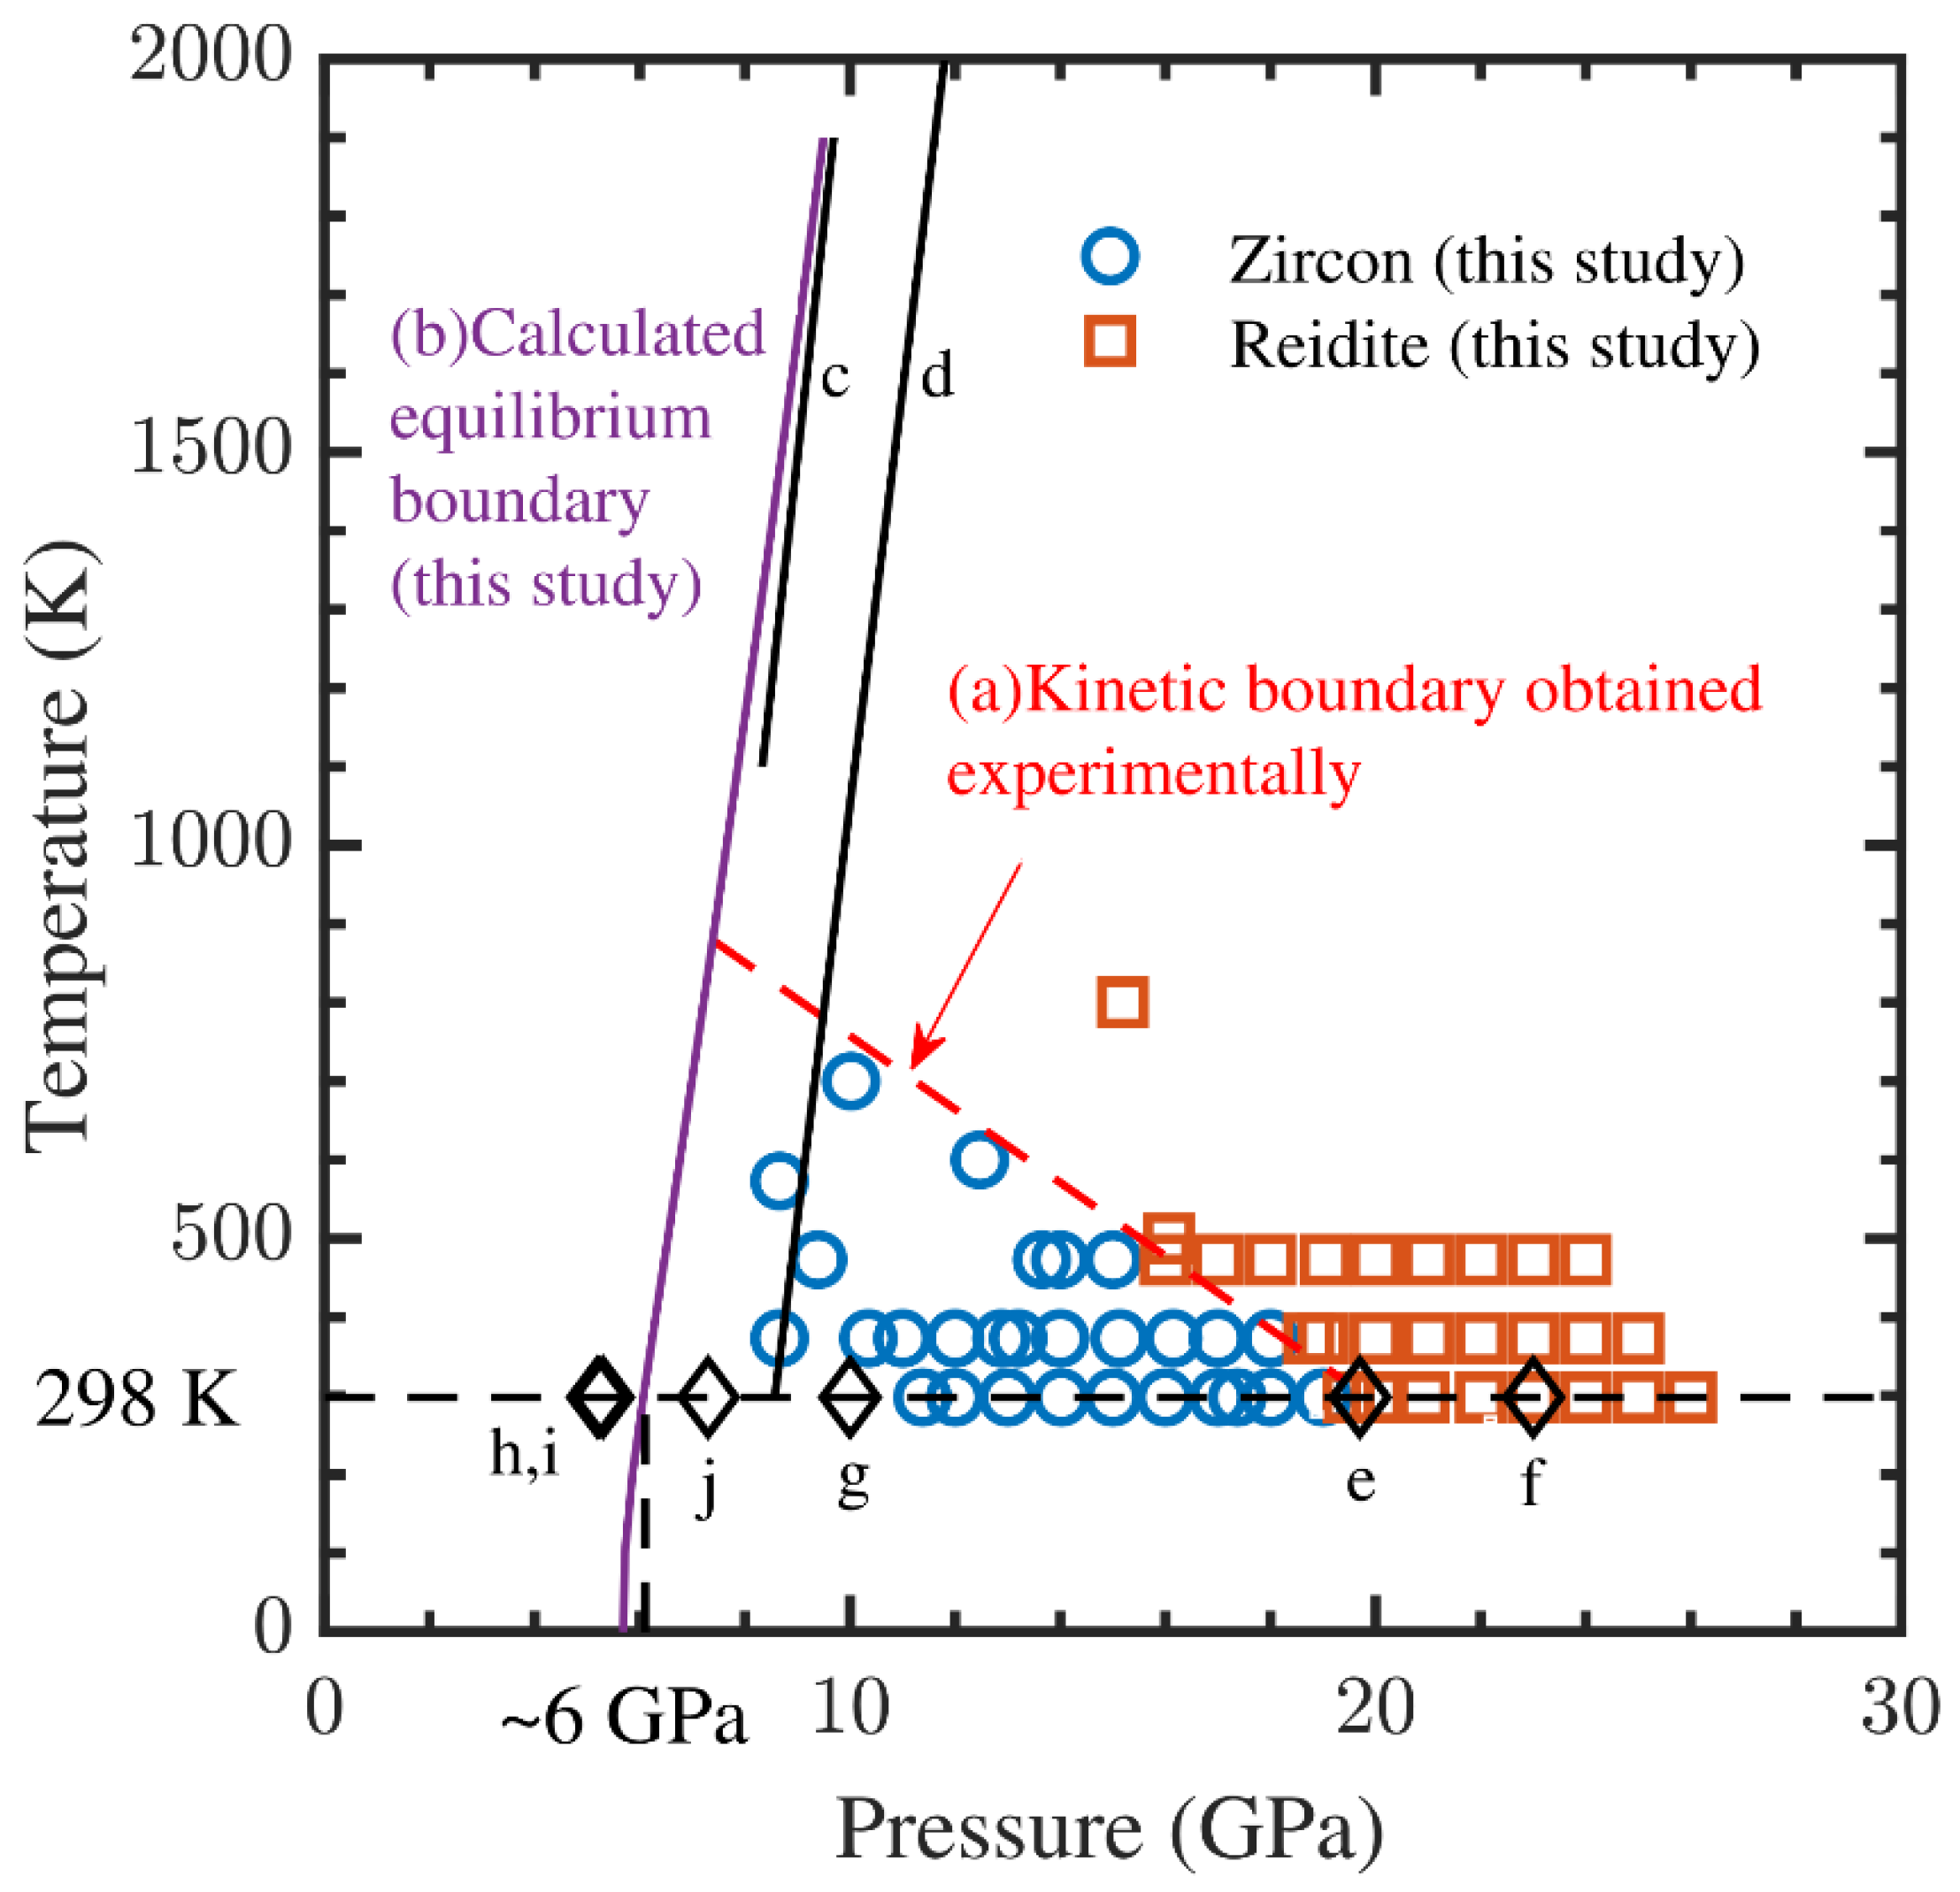
| Temperature T (K) | Kinetic Transition Pressure Pk (GPa) | Equilibrium Transition Pressure Pe (GPa) | Driving Force ΔGf (kJ/mol) | Activation Energy ΔG (kJ/mol) |
|---|---|---|---|---|
| 298 | 19.5 1 | 6.1 | 49.0 | 9.4 |
| 373 | 18.7 | 6.3 | 45.3 | 16.2 |
| 473 | 16.0 | 6.5 | 34.9 | 27.9 |
| 573 | 14.0 2 | 6.7 | 26.8 | 42.1 |
| 673 | 11.8 | 6.9 | 18.0 | 58.7 |
| 773 | 9.7 | 7.1 | 9.6 | 77.4 |
| 873 | 7.5 | 7.3 | 0.7 | 98.0 |
Publisher’s Note: MDPI stays neutral with regard to jurisdictional claims in published maps and institutional affiliations. |
© 2022 by the authors. Licensee MDPI, Basel, Switzerland. This article is an open access article distributed under the terms and conditions of the Creative Commons Attribution (CC BY) license (https://creativecommons.org/licenses/by/4.0/).
Share and Cite
Gao, Y.; Zheng, Z.; Zhao, X.; Liu, Y.; Chen, J.; Li, Y.; Xiong, M.; Zu, X.; Mei, S. In Situ Raman Spectroscopy and DFT Studies of the Phase Transition from Zircon to Reidite at High P–T Conditions. Minerals 2022, 12, 1618. https://doi.org/10.3390/min12121618
Gao Y, Zheng Z, Zhao X, Liu Y, Chen J, Li Y, Xiong M, Zu X, Mei S. In Situ Raman Spectroscopy and DFT Studies of the Phase Transition from Zircon to Reidite at High P–T Conditions. Minerals. 2022; 12(12):1618. https://doi.org/10.3390/min12121618
Chicago/Turabian StyleGao, Yue, Zhi Zheng, Xia Zhao, Yuegao Liu, Jiangzhi Chen, Yan Li, Mengjun Xiong, Xiaotao Zu, and Shenghua Mei. 2022. "In Situ Raman Spectroscopy and DFT Studies of the Phase Transition from Zircon to Reidite at High P–T Conditions" Minerals 12, no. 12: 1618. https://doi.org/10.3390/min12121618