
Paleostress Analysis in the Northern Birjand, East of Iran: Insights from Inversion of Fault-Slip Data

 ,
, 
Abstract
:1. Introduction
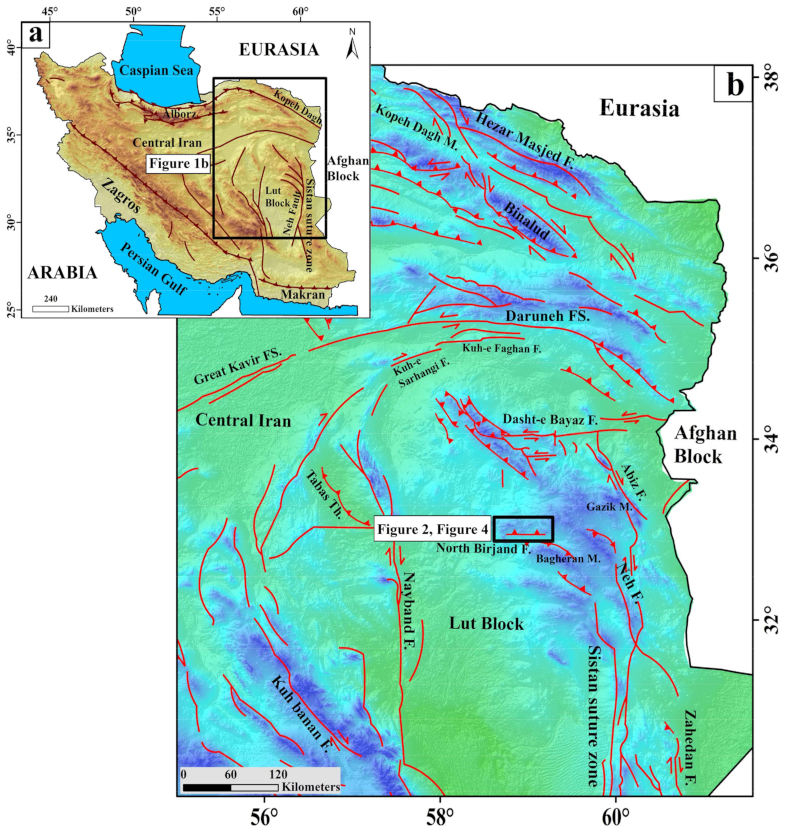
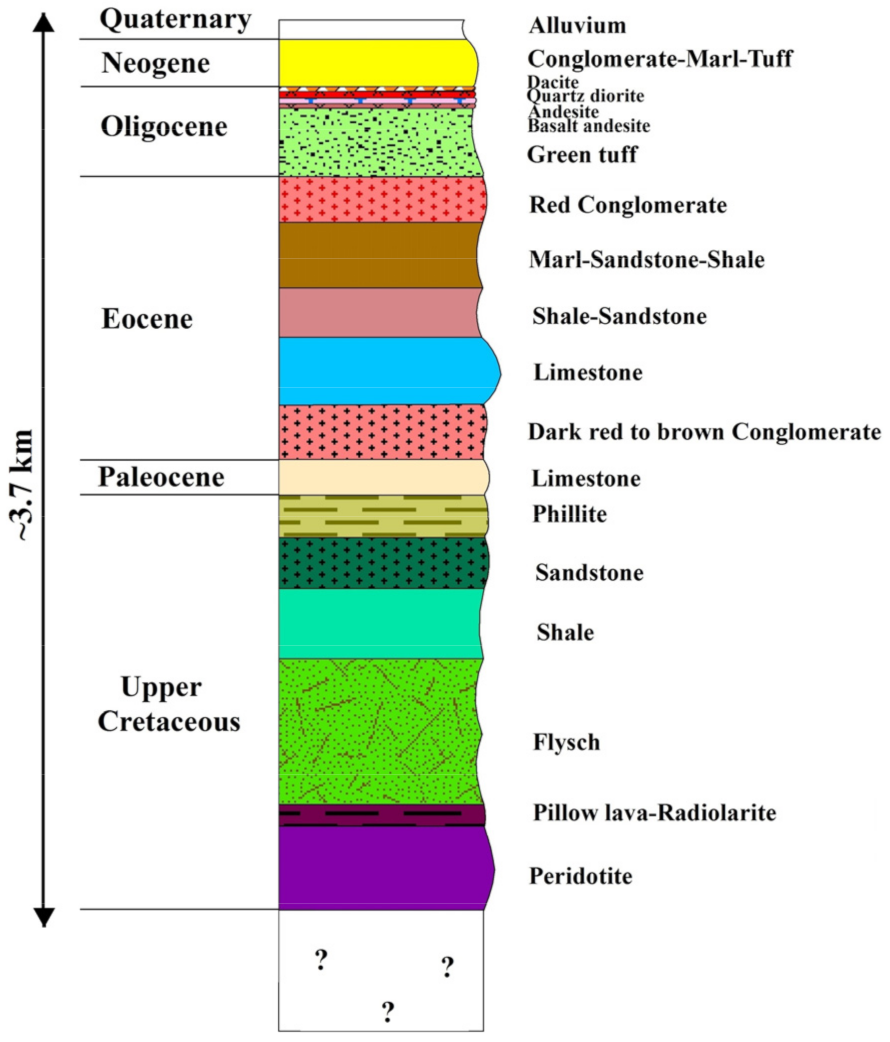
2. Tectonic Setting
3. Material and Methods
3.1. Analyses of Stress Regime Changes
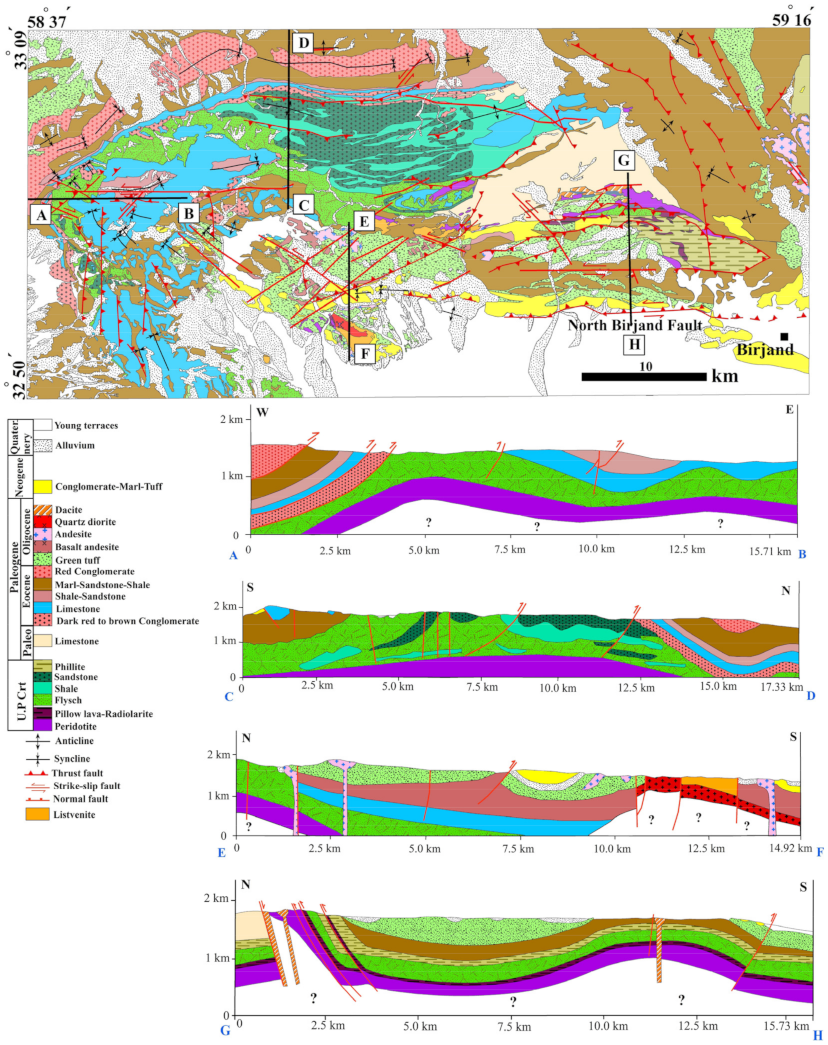
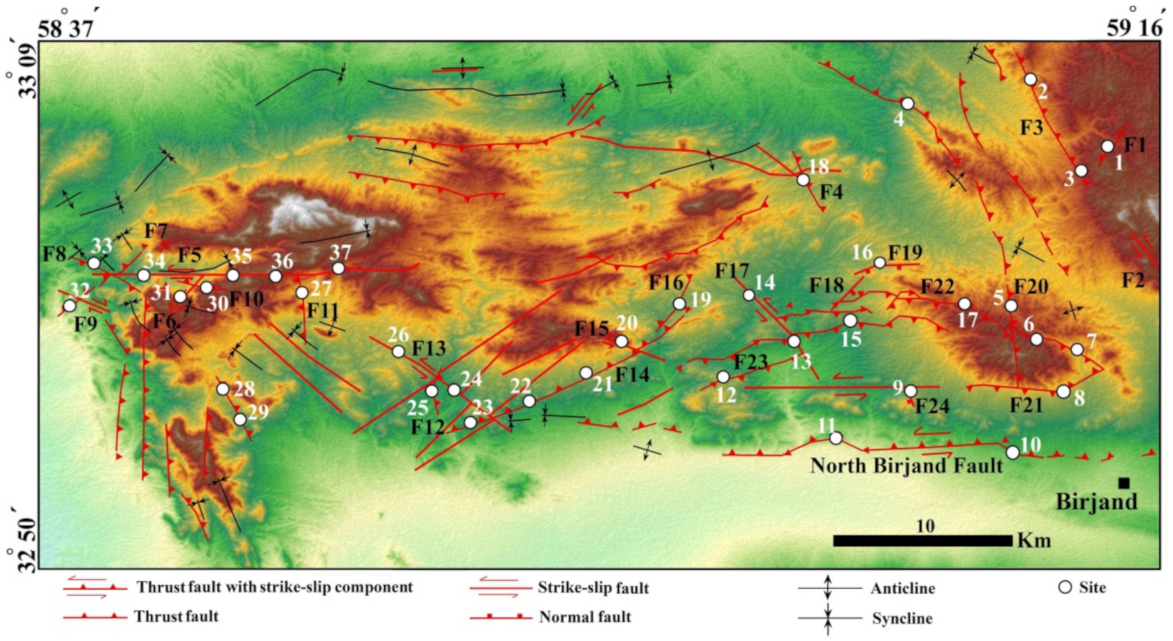
3.2. Structural Analysis and Tectonic Pattern
4. Discussion
5. Conclusions
Author Contributions
Funding
Institutional Review Board Statement
Informed Consent Statement
Acknowledgments
Conflicts of Interest
References
- Rashidi, A.; Derakhshani, R. Strain and Moment- Rates from GPS and Seismological Data in Northern Iran: Implications for an Evaluation of Stress Trajectories and Probabilistic Fault Rupture Hazard. Remote Sens. 2022, 14, 2219. [Google Scholar] [CrossRef]
- Rashidi, A.; Khatib, M.M.; Derakhshani, R. Structural Characteristics and Formation Mechanism of the Earth Fissures as a Geohazard in Birjand, Iran. Appl. Sci. 2022, 12, 4144. [Google Scholar] [CrossRef]
- Ghanbarian, M.A.; Derakhshani, R. The folds and faults kinematic association in Zagros. Sci. Rep. 2022, 12, 8350. [Google Scholar] [CrossRef] [PubMed]
- Saccani, E.; Delavari, M.; Dolati, A.; Pandolfi, L.; Barbero, E.; Brombin, V.; Marroni, M. Geochemistry of volcanic rocks and dykes from the Remeshk-Mokhtarabad and Fannuj-Maskutan Ophiolites (Makran Accretionary Prism, SE Iran): New constraints for magma generation in the Middle East Neo-Tethys. Geosyst. Geoenviron. 2022, 100140. [Google Scholar] [CrossRef]
- Ezati, M.; Gholami, E. Neotectonics of the Central Kopeh Dagh drainage basins, NE Iran. Arab. J. Geosci. 2022, 15, 992. [Google Scholar] [CrossRef]
- Vernant, P.; Nilforoushan, F.; Hatzfeld, D.; Abbassi, M.; Vigny, C.; Masson, F.; Nankali, H.; Martinod, J.; Ashtiani, A.; Bayer, R. Present-day crustal deformation and plate kinematics in the Middle East constrained by GPS measurements in Iran and northern Oman. Geophys. J. Int. 2004, 157, 381–398. [Google Scholar] [CrossRef] [Green Version]
- Tirrul, R.; Bell, I.; Griffis, R.; Camp, V. The Sistan suture zone of eastern Iran. Geol. Soc. Am. Bull. 1983, 94, 134–150. [Google Scholar] [CrossRef]
- Camp, V.; Griffis, R. Character, genesis and tectonic setting of igneous rocks in the Sistan suture zone, eastern Iran. Lithos 1982, 15, 221–239. [Google Scholar] [CrossRef]
- Jentzer, M.; Whitechurch, H.; Agard, P.; Ulrich, M.; Caron, B.; Zarrinkoub, M.H.; Kohansal, R.; Miguet, L.; Omrani, J.; Fournier, M. Late Cretaceous calc-alkaline and adakitic magmatism in the Sistan suture zone (Eastern Iran): Implications for subduction polarity and regional tectonics. J. Asian Earth Sci. 2020, 204, 104588. [Google Scholar] [CrossRef]
- Jackson, J.; McKenzie, D. Active tectonics of the Alpine—Himalayan Belt between western Turkey and Pakistan. Geophys. J. Int. 1984, 77, 185–264. [Google Scholar] [CrossRef]
- Meyer, B.; Le Dortz, K. Strike-slip kinematics in central and eastern Iran: Estimating fault slip-rates averaged over the Holocene. Tectonics 2007, 26, 1–20. [Google Scholar] [CrossRef]
- Walker, R.; Khatib, M. Active faulting in the Birjand region of NE Iran. Tectonics 2006, 25, 1–17. [Google Scholar] [CrossRef]
- Şengör, A.; Altıner, D.; Cin, A.; Ustaömer, T.; Hsü, K. Origin and assembly of the Tethyside orogenic collage at the expense of Gondwana Land. Geol. Soc. Lond. Spec. Publ. 1988, 37, 119–181. [Google Scholar] [CrossRef]
- Rashidi, A.; Abbassi, M.-R.; Nilfouroushan, F.; Shafiei, S.; Derakhshani, R.; Nemati, M. Morphotectonic and earthquake data analysis of interactional faults in Sabzevaran Area, SE Iran. J. Struct. Geol. 2020, 139, 104147. [Google Scholar] [CrossRef]
- Rashidi, A.; Khatib, M.M.; Nilfouroushan, F.; Derakhshani, R.; Mousavi, S.M.; Kianimehr, H.; Djamour, Y. Strain rate and stress fields in the West and South Lut block, Iran: Insights from the inversion of focal mechanism and geodetic data. Tectonophysics 2019, 766, 94–114. [Google Scholar] [CrossRef]
- Baniadam, F.; Shabanian, E.; Bellier, O. The kinematics of the Dasht-e Bayaz earthquake fault during Pliocene-Quaternary: Implications for the tectonics of eastern Central Iran. Tectonophysics 2019, 772, 228218. [Google Scholar] [CrossRef]
- Rashidi, A.; Kianimehr, H.; Shafieibafti, S.; Mehrabi, A.; Derakhshani, R. Active faults in the west of the Lut block (Central Iran). Geophys. Res. 2021, 22, 70–84. [Google Scholar] [CrossRef]
- Nemati, M.; Derakhshani, R. Short-term seismicity patterns along the most active faults in Iran. J. Iber. Geol. 2021, 47, 441–459. [Google Scholar] [CrossRef]
- Rahbar, R.; Shafiei Bafti, S.; Derakhshani, R. Investigation of the tectonic activity of Bazargan Mountain in Iran. Sustain. Dev. Mt. Territ. 2017, 9, 380–386. [Google Scholar] [CrossRef]
- Kermani, A.F.; Derakhshani, R.; Bafti, S.S. Data on morphotectonic indices of Dashtekhak district, Iran. Data Brief 2017, 14, 782–788. [Google Scholar] [CrossRef]
- Derakhshani, R.; Eslami, S. A new viewpoint for seismotectonic zoning. Am. J. Environ. Sci. 2011, 7, 212–218. [Google Scholar] [CrossRef]
- Tadayon, M.; Rossetti, F.; Zattin, M.; Nozaem, R.; Calzolari, G.; Madanipour, S.; Salvini, F. The post-eocene evolution of the Doruneh Fault region (central Iran): The intraplate response to the Reorganization of the Arabia-Eurasia collision zone. Tectonics 2017, 36, 3038–3064. [Google Scholar] [CrossRef] [Green Version]
- Jacques, A. Inversion of earthquake focal mechanisms to obtain the seismotectonic stress IV—A new method free of choice among nodal planes. Geophys. J. Int. 2002, 150, 588–609. [Google Scholar] [CrossRef] [Green Version]
- Diabat, A.A.; Atallah, M.; Salih, M.R. Paleostress analysis of the Cretaceous rocks in the eastern margin of the Dead Sea transform, Jordan. J. Afr. Earth Sci. 2004, 38, 449–460. [Google Scholar] [CrossRef]
- Baroň, I.; Kernstocková, M.; Faridi, M.; Bubík, M.; Milovský, R.; Melichar, R.; Sabouri, J.; Babůrek, J. Paleostress analysis of a gigantic gravitational mass movement in active tectonic setting: The Qoshadagh slope failure, Ahar, NW Iran. Tectonophysics 2013, 605, 70–87. [Google Scholar] [CrossRef]
- Ezati, M.; Azizzadeh, M.; Riahi, M.A.; Fattahpour, V.; Honarmand, J. Characterization of micro-fractures in carbonate Sarvak reservoir, using petrophysical and geological data, SW Iran. J. Pet. Sci. Eng. 2018, 170, 675–695. [Google Scholar] [CrossRef]
- Ezati, M.; Azizzadeh, M.; Riahi, M.A.; Fattahpour, V.; Honarmand, J. Application of DSI log in geomechanical and petrophysical evaluation of carbonate reservoirs: A case study in one of the SW Iranian oil fields. J. Pet. Res. 2019, 29, 37–50. [Google Scholar] [CrossRef]
- Li, D.; McGuire, J.J.; Liu, Y.; Hardebeck, J.L. Stress rotation across the Cascadia megathrust requires a weak subduction plate boundary at seismogenic depths. Earth Planet. Sci. Lett. 2018, 485, 55–64. [Google Scholar] [CrossRef]
- Van Nguyen, V.; Hoai, L.T.T. Cenozoic paleostress evolution in south central Vietnam: Implication for changing dynamics of faulting along the eastern Indochina continental margin. J. Asian Earth Sci. 2019, 185, 104006. [Google Scholar] [CrossRef]
- Żaba, J.; Gaidzik, K. Variscan stress regime rotation: Insights from the analysis of kink folds in the northern margin of the Bohemian Massif, South Poland. Comptes Rendus Geosci. 2019, 351, 395–405. [Google Scholar] [CrossRef]
- Xu, S.; Liu, R.; Hao, F.; Engelder, T.; Yi, J.; Zhang, B.; Shu, Z. Complex rotation of maximum horizontal stress in the Wufeng-Longmaxi Shale on the eastern margin of the Sichuan Basin, China: Implications for predicting natural fractures. Mar. Pet. Geol. 2019, 109, 519–529. [Google Scholar] [CrossRef]
- Tadayon, M.; Rashid, H.; Salehi, M.A.; Aslani, A. Post-Cretaceous structural reconstruction of the west Central Iranian micro-plate: Insights from structural and magnetic fabrics (AMS) constraints. J. Struct. Geol. 2022, 160, 104601. [Google Scholar] [CrossRef]
- Biswas, T.; Bose, N.; Dutta, D.; Mukherjee, S. Arc-parallel shears in collisional orogens: Global review and paleostress analyses from the NW Lesser Himalayan Sequence (Garhwal region, Uttarakhand, India). Mar. Pet. Geol. 2022, 105530. [Google Scholar] [CrossRef]
- Freund, R. Rotation of strike slip faults in Sistan, southeast Iran. J. Geol. 1970, 78, 188–200. [Google Scholar] [CrossRef]
- Berberian, M.; Yeats, R.S. Patterns of historical earthquake rupture in the Iranian Plateau. Bull. Seismol. Soc. Am. 1999, 89, 120–139. [Google Scholar] [CrossRef]
- Jackson, J.; Haines, J.; Holt, W. The accommodation of Arabia-Eurasia plate convergence in Iran. J. Geophys. Res. Solid Earth 1995, 100, 15205–15219. [Google Scholar] [CrossRef]
- Ezati, M.; Gholami, E.; Mousavi, S.M. Tectonic activity level evaluation using geomorphic indices in the Shekarab Mountains, Eastern Iran. Arab. J. Geosci. 2021, 14, 385. [Google Scholar] [CrossRef]
- Ezati, M.; Gholami, E.; Mousavi, S.M.; Rashidi, A.; Derakhshani, R. Active Deformation Patterns in the Northern Birjand Mountains of the Sistan Suture Zone, Iran. Appl. Sci. 2022, 12, 6625. [Google Scholar] [CrossRef]
- Khatib, M. Structural Analysis of Southern Birjand Mountains. Ph.D. Thesis, Shahid Beheshti University, Tehran, Iran, 1998. [Google Scholar]
- Angelier, J. Tectonic analysis of fault slip data sets. J. Geophys. Res. Solid Earth 1984, 89, 5835–5848. [Google Scholar] [CrossRef]
- Angelier, J. Inversion of field data in fault tectonics to obtain the regional stress—III. A new rapid direct inversion method by analytical means. Geophys. J. Int. 1990, 103, 363–376. [Google Scholar] [CrossRef]
- Angelier, J.T.; Mechler, P. Sur une methode graphique de recherche des contraintes principales egalement utilisables en tectonique et en seismologie: La methode des diedres droits. Bull. Soc. Géol. Fr. 1977, 7, 1309–1318. [Google Scholar] [CrossRef]
- Bott, M.H.P. The mechanics of oblique slip faulting. Geol. Mag. 1959, 96, 109–117. [Google Scholar] [CrossRef]
- Wallace, R.E. Geometry of shearing stress and relation to faulting. J. Geol. 1951, 59, 118–130. [Google Scholar] [CrossRef]
- Hippolyte, J.-C.; Bergerat, F.; Gordon, M.B.; Bellier, O.; Espurt, N. Keys and pitfalls in mesoscale fault analysis and paleostress reconstructions, the use of Angelier’s methods. Tectonophysics 2012, 581, 144–162. [Google Scholar] [CrossRef]
- Carey, E. Recherche des directions principales de contraintes associées au jeu d’une population de failles. Rev. Géogr. Phys. Géol. Dyn. 1979, 21. [Google Scholar]
- Jentzer, M.; Fournier, M.; Agard, P.; Omrani, J.; Khatib, M.M.; Whitechurch, H. Neogene to Present paleostress field in Eastern Iran (Sistan belt) and implications for regional geodynamics. Tectonics 2017, 36, 321–339. [Google Scholar] [CrossRef]
- Delvaux, D.; Sperner, B. Stress tensor inversion from fault kinematic indicators and focal mechanism data: The TENSOR program. New Insights Struct. Interpret. Model. 2003, 212, 75–100. [Google Scholar]
- Ron, H.; Nur, A.; Aydin, A. Stress field rotation or block rotation: An example from the Lake Mead fault system. Ann. Geophys. 1993, 36. [Google Scholar]
- Dziewonski, A.M.; Chou, T.A.; Woodhouse, J.H. Determination of earthquake source parameters from waveform data for studies of global and regional seismicity. J. Geophys. Res. Solid Earth 1981, 86, 2825–2852. [Google Scholar] [CrossRef]
- Shabanian, E.; Bellier, O.; Abbassi, M.R.; Siame, L.; Farbod, Y. Plio-quaternary stress states in NE Iran: Kopeh Dagh and Allah Dagh-Binalud mountain ranges. Tectonophysics 2010, 480, 280–304. [Google Scholar] [CrossRef]
- Masson, F.; Chéry, J.; Hatzfeld, D.; Martinod, J.; Vernant, P.; Tavakoli, F.; Ghafory-Ashtiani, M. Seismic versus aseismic deformation in Iran inferred from earthquakes and geodetic data. Geophys. J. Int. 2005, 160, 217–226. [Google Scholar] [CrossRef] [Green Version]
- Ezati, M.; Gholami, E.; Mousavi, S.M. Paleostress regime reconstruction based on brittle structure analysis in the Shekarab Mountain, Eastern Iran. Arab. J. Geosci. 2020, 13, 1232. [Google Scholar] [CrossRef]
- Burg, J.-P. Geology of the onshore Makran accretionary wedge: Synthesis and tectonic interpretation. Earth-Sci. Rev. 2018, 185, 1210–1231. [Google Scholar] [CrossRef]
- Terres, R.R.; Luyendyk, B.P. Neogene tectonic rotation of the San Gabriel region, California, suggested by paleomagnetic vectors. J. Geophys. Res. Solid Earth 1985, 90, 12467–12484. [Google Scholar] [CrossRef]
- Manton, W. Tectonic interpretation of the morphology of Honduras. Tectonics 1987, 6, 633–651. [Google Scholar] [CrossRef]
- Stamatakos, J.A.; Kodama, K.; Pavlis, T.L. Paleomagnetism of Eocene plutonic rocks, Matanuska Valley, Alaska. Geology 1988, 16, 618–622. [Google Scholar] [CrossRef]
- Pavlides, S.; Kilias, A. Neotectonic and active faults along the Serbomacedonian zone (SE Chalkidiki, northern Greece). Ann. Tecton. 1987, 1, 97–104. [Google Scholar]
- Nicholson, C.; Seeber, L.; Williams, P.; Sykes, L.R. Seismic evidence for conjugate slip and block rotation within the San Andreas fault system, southern California. Tectonics 1986, 5, 629–648. [Google Scholar] [CrossRef]


| Fault Name | Geometric Position (Trend/Plunge) | Slickenline Position (Trend/Plunge) | Fault Mechanism | Location | Latitude (N°) Longitude (E°) |
|---|---|---|---|---|---|
| F1 | N045, 72NW | N355, 60 | Reverse with dextral strike-slip component | Eastern section | 33°05′47.58″ 59°16′23.70″ |
| F2 | N120, 55NE | N300, 0 | Sinistral strike-slip | Eastern section | 33°02′30.06″ 59°17′55.98″ |
| F3 | N340, 67NE | N070, 67 | Reverse | Eastern section | 33°04′19.20″ 59°14′47.10″ |
| F4 | N353, 54NE | N129, 43 | Reverse with sinistral strike-slip component | Eastern section | 33°03′52.02″ 59°04′40.56″ |
| F5 | N085, 65SE | N247, 18 | Sinistral strike-slip with reverse component | Western section | 33°02′30.05″ 59°02′53.92″ |
| F6 | N210, 85NW | N034, 32 | Reverse with Sinistral strike-slip component | Western section | 33°01′38.34″ 58°41′19.44″ |
| F7 | N230, 30NW | N290, 25 | Reverse with dextral strike-slip component | Western section | 33°01′25.62″ 58°42′42.90″ |
| F8 | N130, 70SW | N192, 67 | Reverse with dextral strike-slip component | Western section | 33°01′16.56″ 58°41′07.92″ |
| F9 | N120, 70SW | N134, 37 | Dextral strike-slip with reverse component | Western section | 33°01′19.14″ 58°39′51.24″ |
| F10 | N290, 55NE | N059, 47 | Reverse with sinistral strike-slip component | Western section | 33°01′19.32″ 58°39′21.06″ |
| F11 | N180, 15W | N210, 64 | Reverse with dextral strike-slip component | Western section | 33°00′44.22″ 58°42′46.98″ |
| F12 | N355, 70NE | N148, 50 | Reverse with sinistral strike-slip component | Middle section | 32°59′15.24″ 58°46′46.98″ |
| F13 | N310, 32NE | N103, 15 | Sinistral strike-slip with reverse component | Middle section | 32°55′49.14″ 58°51′22.98″ |
| F14 | N070, 80NW | N045, 45 | Reverse with sinistral strike-slip component | Middle section | 32°56′17.28″ 58°51′08.46″ |
| F15 | N238, 50SE | N040, 8 | Sinistral strike-slip with reverse component | Middle section | 32°58′17.28″ 58°51′08.46″ |
| F16 | N035, 65NW | N223, 64 | Reverse with dextral strike-slip component | Middle section | 32°56′37.20″ 58°51′34.74″ |
| F17 | N165, 80SW | N310, 25 | dextral strike-slip with reverse component | Eastern section | 32°54′12.12″ 58°52′29.40″ |
| F18 | N030, 80SE | N105, 79 | Normal with dextral strike-slip component | Eastern section | 32°58′19.62″ 58°59′32.04″ |
| F19 | N090, 70S | N070, 65 | Normal with Sinistral strike-slip component | Eastern section | 32°58′45.66″ 58°59′24.30″ |
| F20 | N349, 50NE | N142, 45 | Reverse with sinistral strike-slip component | Eastern section | 33°00′04.80″ 59°00′00.18″ |
| F21 | N090, 70S | N133, 62 | Reverse with sinistral strike-slip component | Eastern section | 32°58′52.32″ 59°04′41.04″ |
| N.B.F | N80E, 65NW | N036, 55 | Reverse with sinistral strike-slip component | Eastern section | 33°05′47.58″ 59°16′23.70″ |
| F22 | N090, 50S | N092, 70 | Reverse with dextral strike-slip component | Eastern section | 33°02′30.06″ 59°17′55.98″ |
| F23 | N084, 50S | N152, 48 | Reverse with dextral strike-slip component | Eastern section | 33°04′19.20″ 59°14′47.10″ |
| F4 | N165, 75SW | N272, 65 | Normal with dextral strike-slip component | Eastern section | 33°03′52.02″ 59°04′40.56″ |
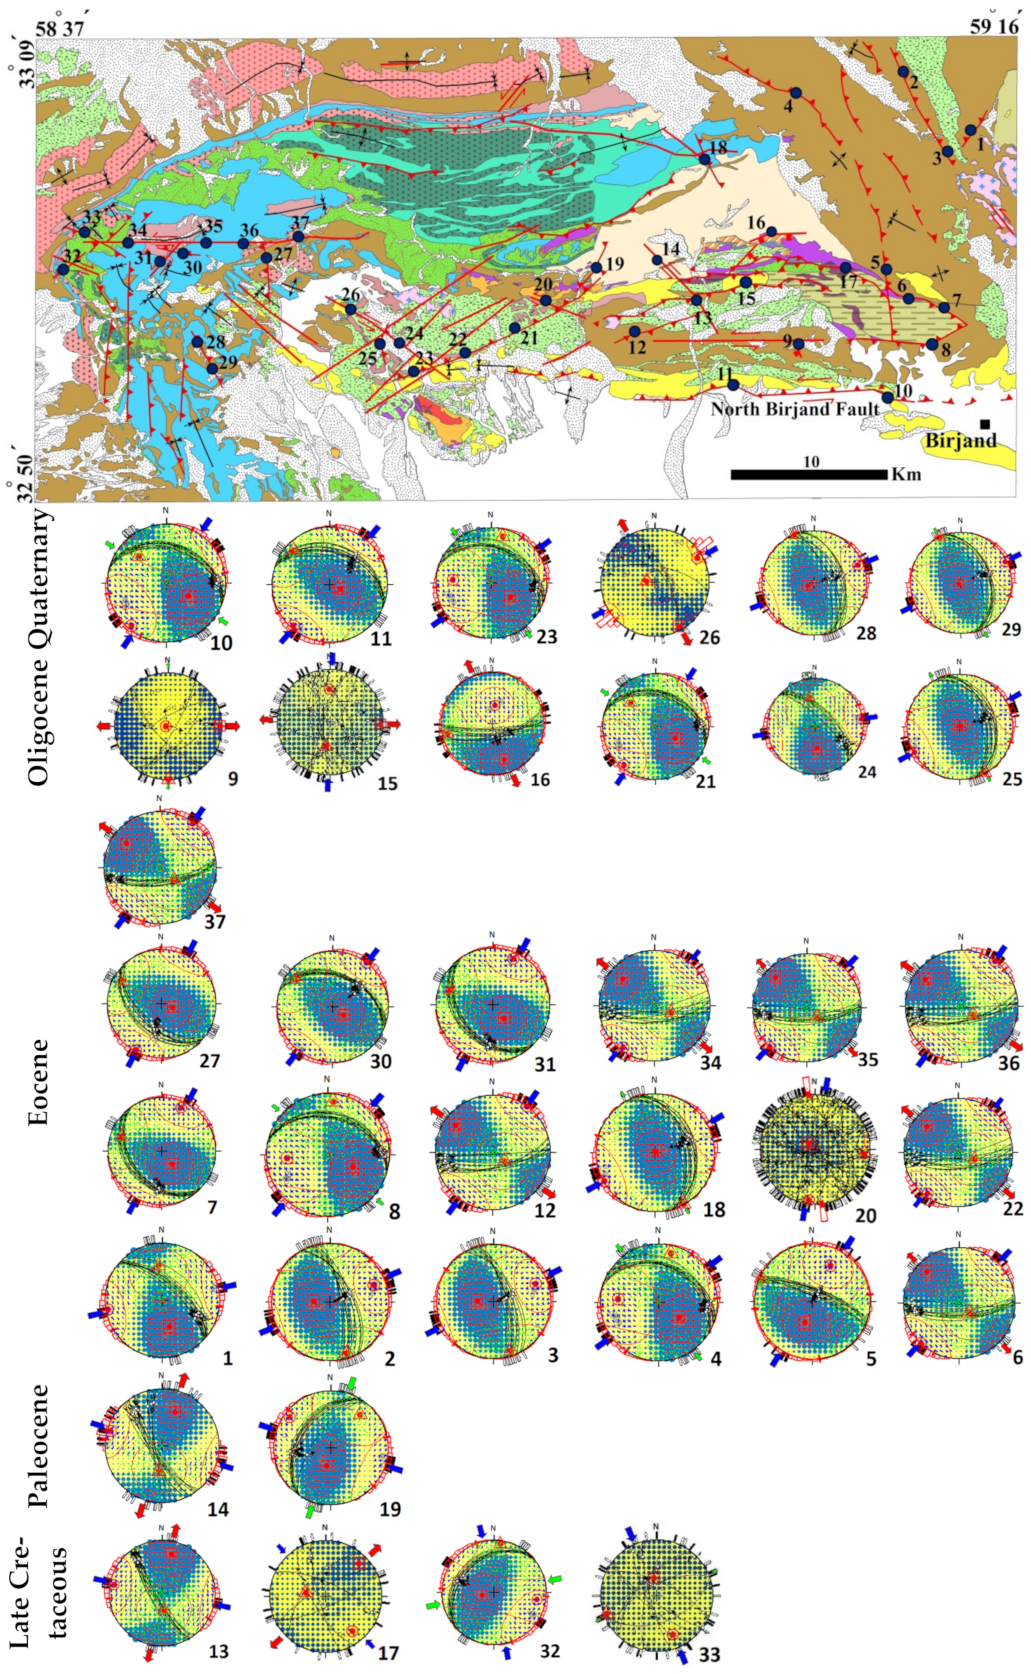
| Site | N | Stratigraphic Age | σ1 Trend, Plunge | σ2 Trend, Plunge | σ3 Trend, Plunge | Φ | α | Location |
|---|---|---|---|---|---|---|---|---|
| 1 | 9 | Eocene | 081, 23 | 378, 05 | 246, 64 | 0.5 | 18 | Eastern section |
| 2 | 11 | Eocene | 069, 21 | 162, 09 | 273, 67 | 0.45 | 10 | |
| 3 | 10 | Eocene | 067, 21 | 161, 09 | 272, 67 | 0.45 | 3 | |
| 4 | 12 | Eocene | 275, 31 | 014, 15 | 126, 55 | 0.79 | 12 | |
| 5 | 11 | Eocene | 028, 30 | 294, 04 | 198, 57 | 0.5 | 17 | |
| 6 | 10 | Eocene | 221, 00 | 131, 67 | 312, 18 | 0.4 | 12 | |
| 7 | 13 | Eocene | 024, 12 | 289, 22 | 141, 64 | 0.5 | 11 | |
| 8 | 13 | Eocene | 266, 34 | 005, 14 | 115, 52 | 0.77 | 7 | |
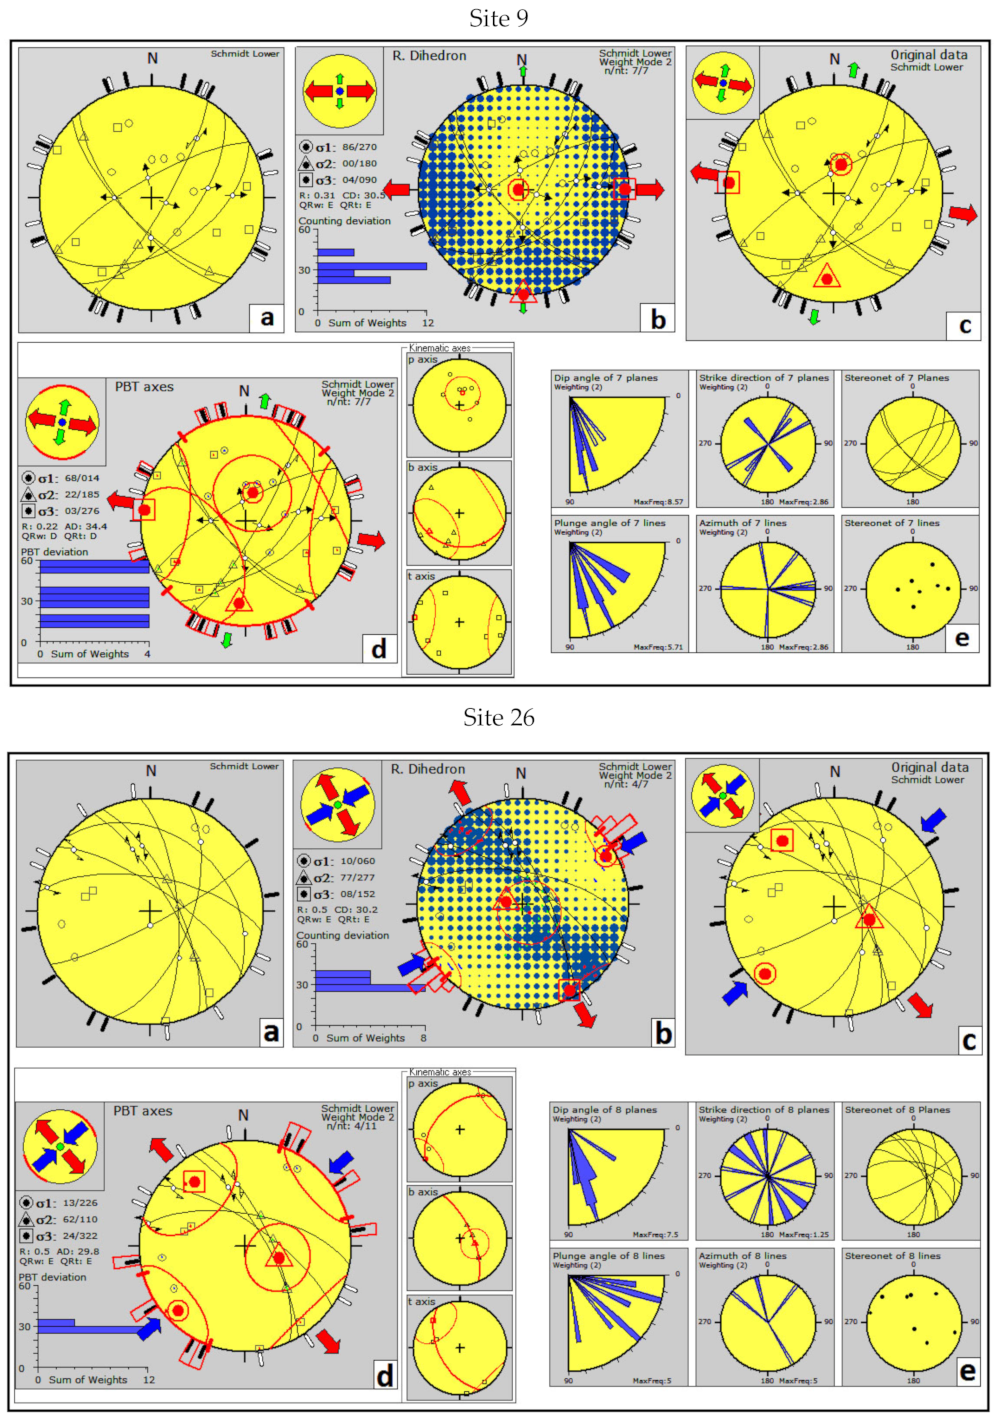
| 9 | 6 | Oligocene | 270, 86 | 180, 00 | 090, 04 | 0.31 | 11 | |
| 10 | 12 | Quaternary | 220, 07 | 314, 35 | 120, 55 | 0.83 | 15 | |
| 11 | 12 | Quaternary | 221, 06 | 313, 16 | 112, 73 | 0.5 | 11 | |
| 12 | 10 | Eocene | 034, 01 | 125, 67 | 304, 20 | 0.5 | 12 | |
| 13 | 12 | UP. Cret | 280, 08 | 173, 64 | 014, 25 | 0.5 | 6 | |
| 14 | 12 | Paleocene | 286, 07 | 187, 52 | 021, 37 | 0.54 | 4 | |
| 15 | 12 | Oligocene | 359, 8 | 189, 52 | 093, 05 | 0.52 | 8 | |
| 16 | 13 | Oligocene | 008, 60 | 257, 11 | 162, 27 | 0.65 | 20 | |
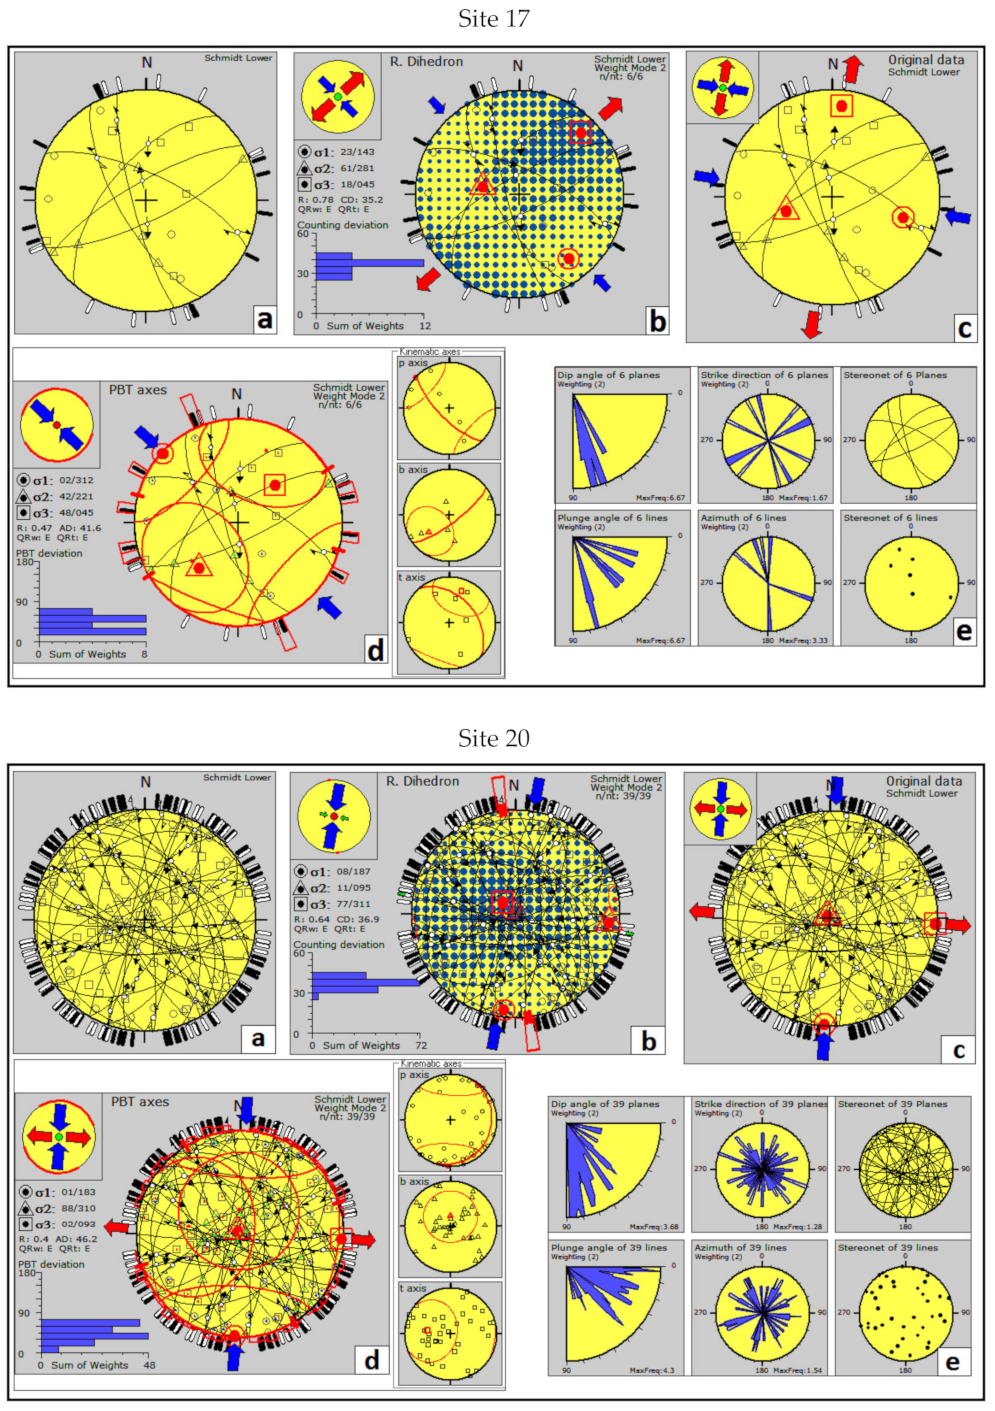
| 17 | 6 | UP. Cret | 143, 23 | 281, 61 | 045, 18 | 0.78 | 10 | |
| 18 | 12 | Eocene | 241, 01 | 151, 01 | 018, 88 | 0.71 | 22 | |
| 19 | 11 | Paleocene | 307, 11 | 042, 24 | 193, 64 | 0.95 | 17 | Middle section |
| 20 | 30 | Eocene | 187, 08 | 095, 11 | 311, 77 | 0.64 | 21 | |
| 21 | 14 | Oligocene | 218, 06 | 313, 34 | 118, 54 | 0.8 | 13 | |
| 22 | 10 | Eocene | 215, 06 | 112, 61 | 306, 24 | 0.64 | 5 | |
| 23 | 10 | Quaternary | 272, 31 | 015, 3 | 128, 54 | 0.69 | 8 | |
| 24 | 12 | Oligocene | 081, 03 | 348, 38 | 175, 52 | 0.21 | 3 | |
| 25 | 12 | Oligocene | 244, 05 | 155, 05 | 022, 90 | 0.68 | 9 | |
| 26 | 5 | Quaternary | 060, 10 | 277, 77 | 152, 08 | 0.5 | 13 | |
| 27 | 10 | Eocene | 207, 02 | 300, 16 | 107, 70 | 0.55 | 10 | western section |
| 28 | 10 | Quaternary | 068, 11 | 338, 00 | 246, 79 | 0.5 | 11 | |
| 29 | 10 | Quaternary | 064, 04 | 334, 01 | 237, 86 | 0.75 | 13 | |
| 30 | 13 | Eocene | 038, 00 | 308, 20 | 128, 70 | 0.5 | 19 | |
| 31 | 12 | Eocene | 221, 13 | 285, 20 | 139, 62 | 0.5 | 15 | |
| 32 | 12 | UP. Cret | 100, 18 | 007, 07 | 257, 71 | 1 | 23 | |
| 33 | 10 | UP. Cret | 157, 26 | 250, 06 | 352, 64 | 0.1 | 7 | |
| 34 | 9 | Eocene | 217, 07 | 113, 63 | 310, 26 | 0.67 | 6 | |
| 35 | 10 | Eocene | 224, 00 | 133, 70 | 314, 20 | 0.3 | 8 | |
| 36 | 9 | Eocene | 036, 00 | 127, 69 | 306, 21 | 0.5 | 5 | |
| 37 | 10 | Eocene | 037, 02 | 132, 63 | 306, 27 | 0.5 | 9 |
Publisher’s Note: MDPI stays neutral with regard to jurisdictional claims in published maps and institutional affiliations. |
© 2022 by the authors. Licensee MDPI, Basel, Switzerland. This article is an open access article distributed under the terms and conditions of the Creative Commons Attribution (CC BY) license (https://creativecommons.org/licenses/by/4.0/).
Share and Cite
Ezati, M.; Rashidi, A.; Gholami, E.; Mousavi, S.M.; Nemati, M.; Shafieibafti, S.; Derakhshani, R. Paleostress Analysis in the Northern Birjand, East of Iran: Insights from Inversion of Fault-Slip Data. Minerals 2022, 12, 1606. https://doi.org/10.3390/min12121606
Ezati M, Rashidi A, Gholami E, Mousavi SM, Nemati M, Shafieibafti S, Derakhshani R. Paleostress Analysis in the Northern Birjand, East of Iran: Insights from Inversion of Fault-Slip Data. Minerals. 2022; 12(12):1606. https://doi.org/10.3390/min12121606
Chicago/Turabian StyleEzati, Maryam, Ahmad Rashidi, Ebrahim Gholami, Seyed Morteza Mousavi, Majid Nemati, Shahram Shafieibafti, and Reza Derakhshani. 2022. "Paleostress Analysis in the Northern Birjand, East of Iran: Insights from Inversion of Fault-Slip Data" Minerals 12, no. 12: 1606. https://doi.org/10.3390/min12121606