
Exploring Platinum Speciation with X-ray Absorption Spectroscopy under High-Energy Resolution Fluorescence Detection Mode
 , , , and
Abstract
:1. Introduction
2. Materials and Methods
2.1. Experimental Samples
2.1.1. Origin of the Investigated Compounds and Solutions
2.1.2. Synthesis of PtS and PtS2
2.1.3. Commercial PtS2
2.1.4. Synthesis of (NH4)2PtIV(S5)3
2.2. X-ray Absorption Spectroscopy (XAS)
2.2.1. Acquisition Setup
2.2.2. EXAFS Spectra Modeling
3. Results
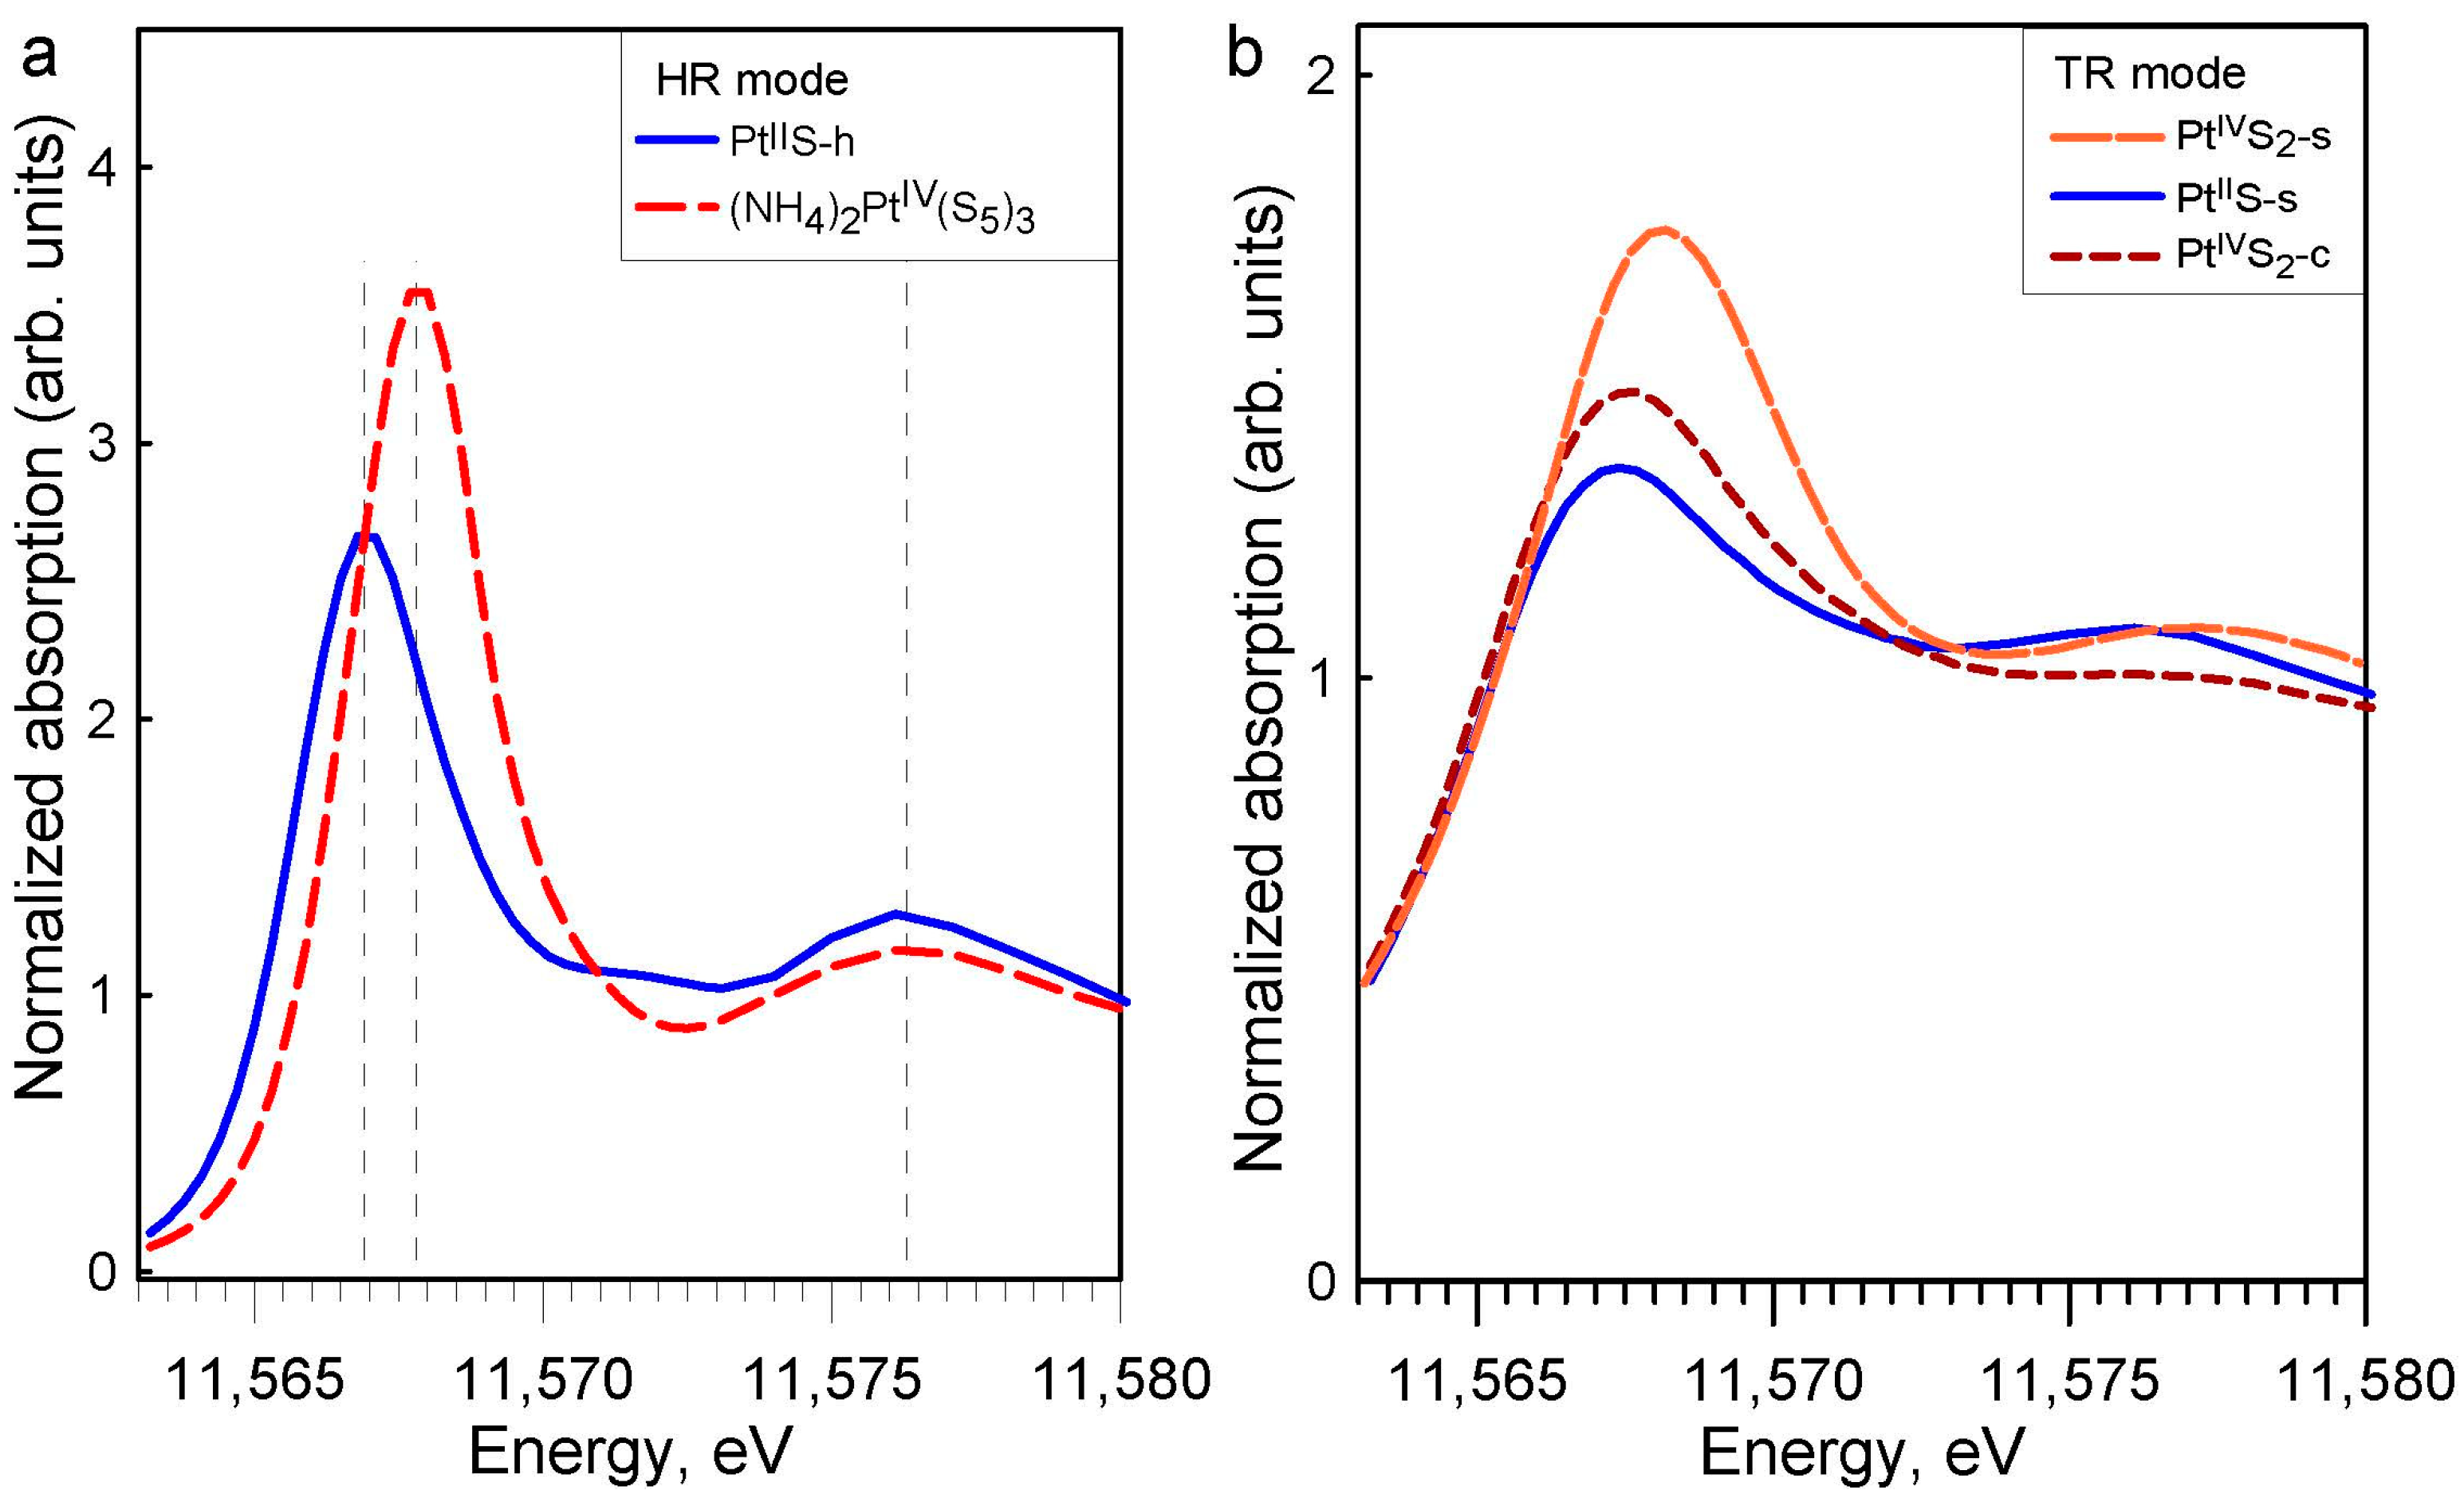
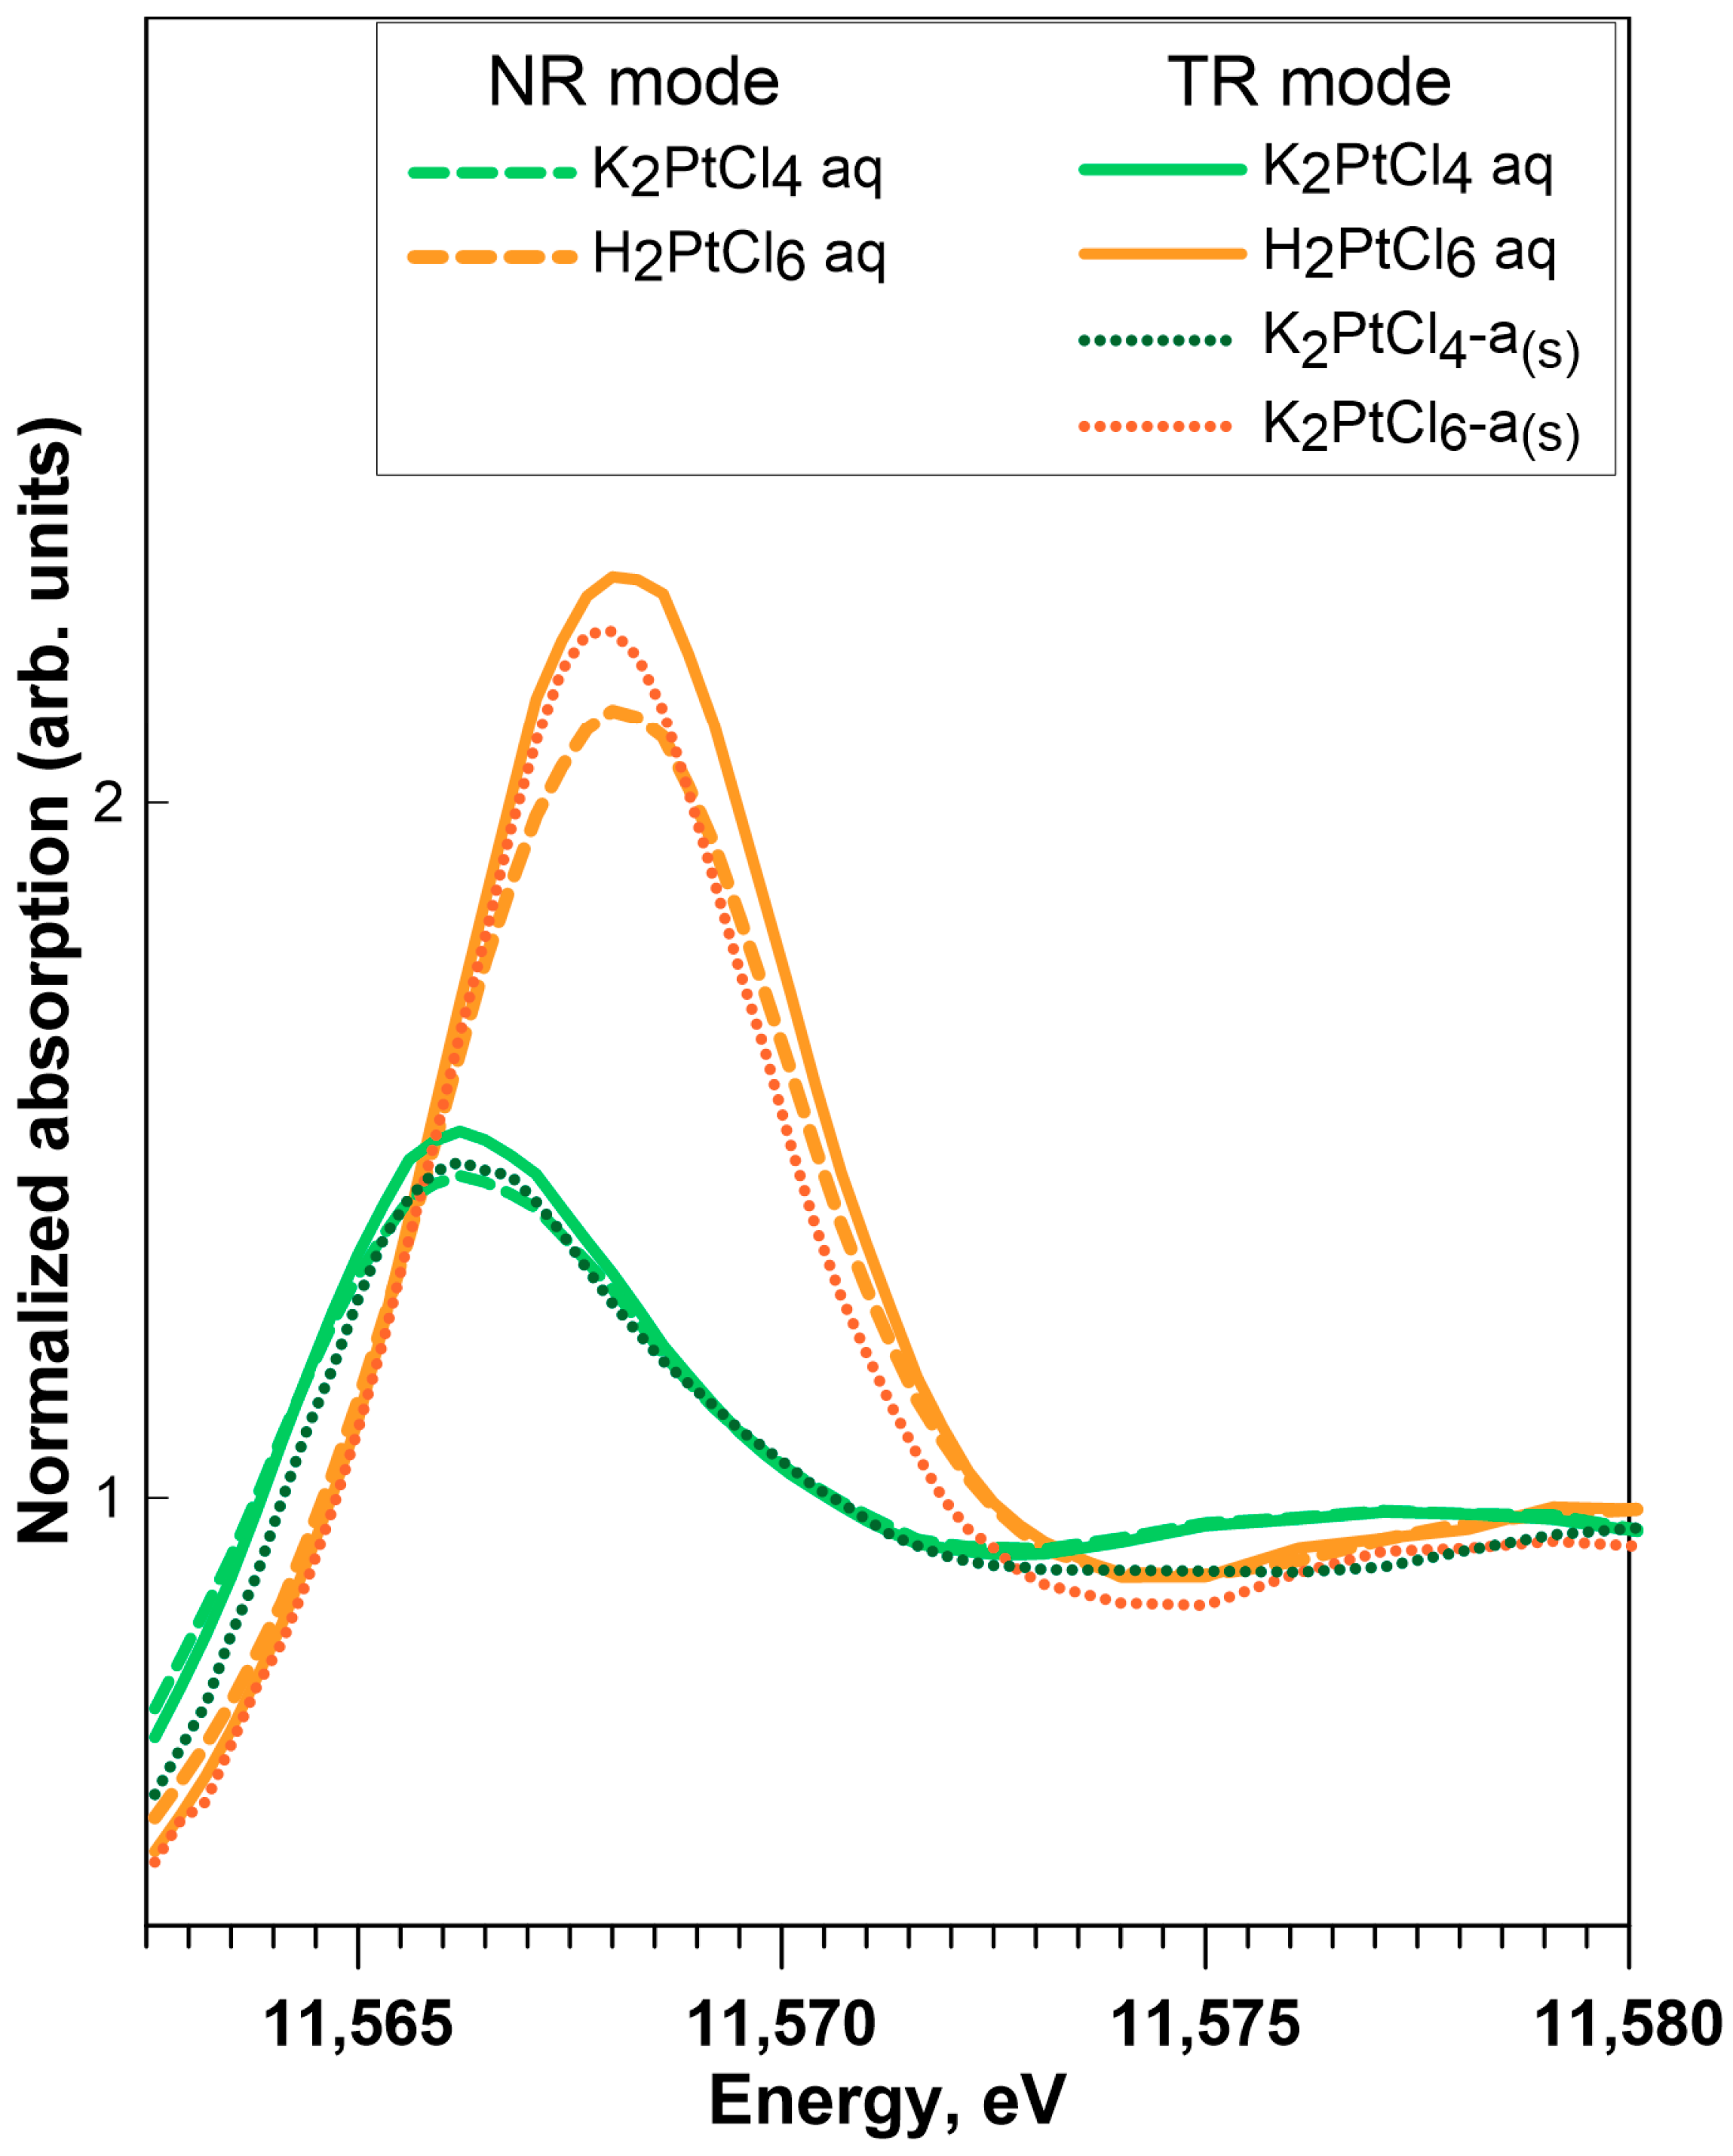
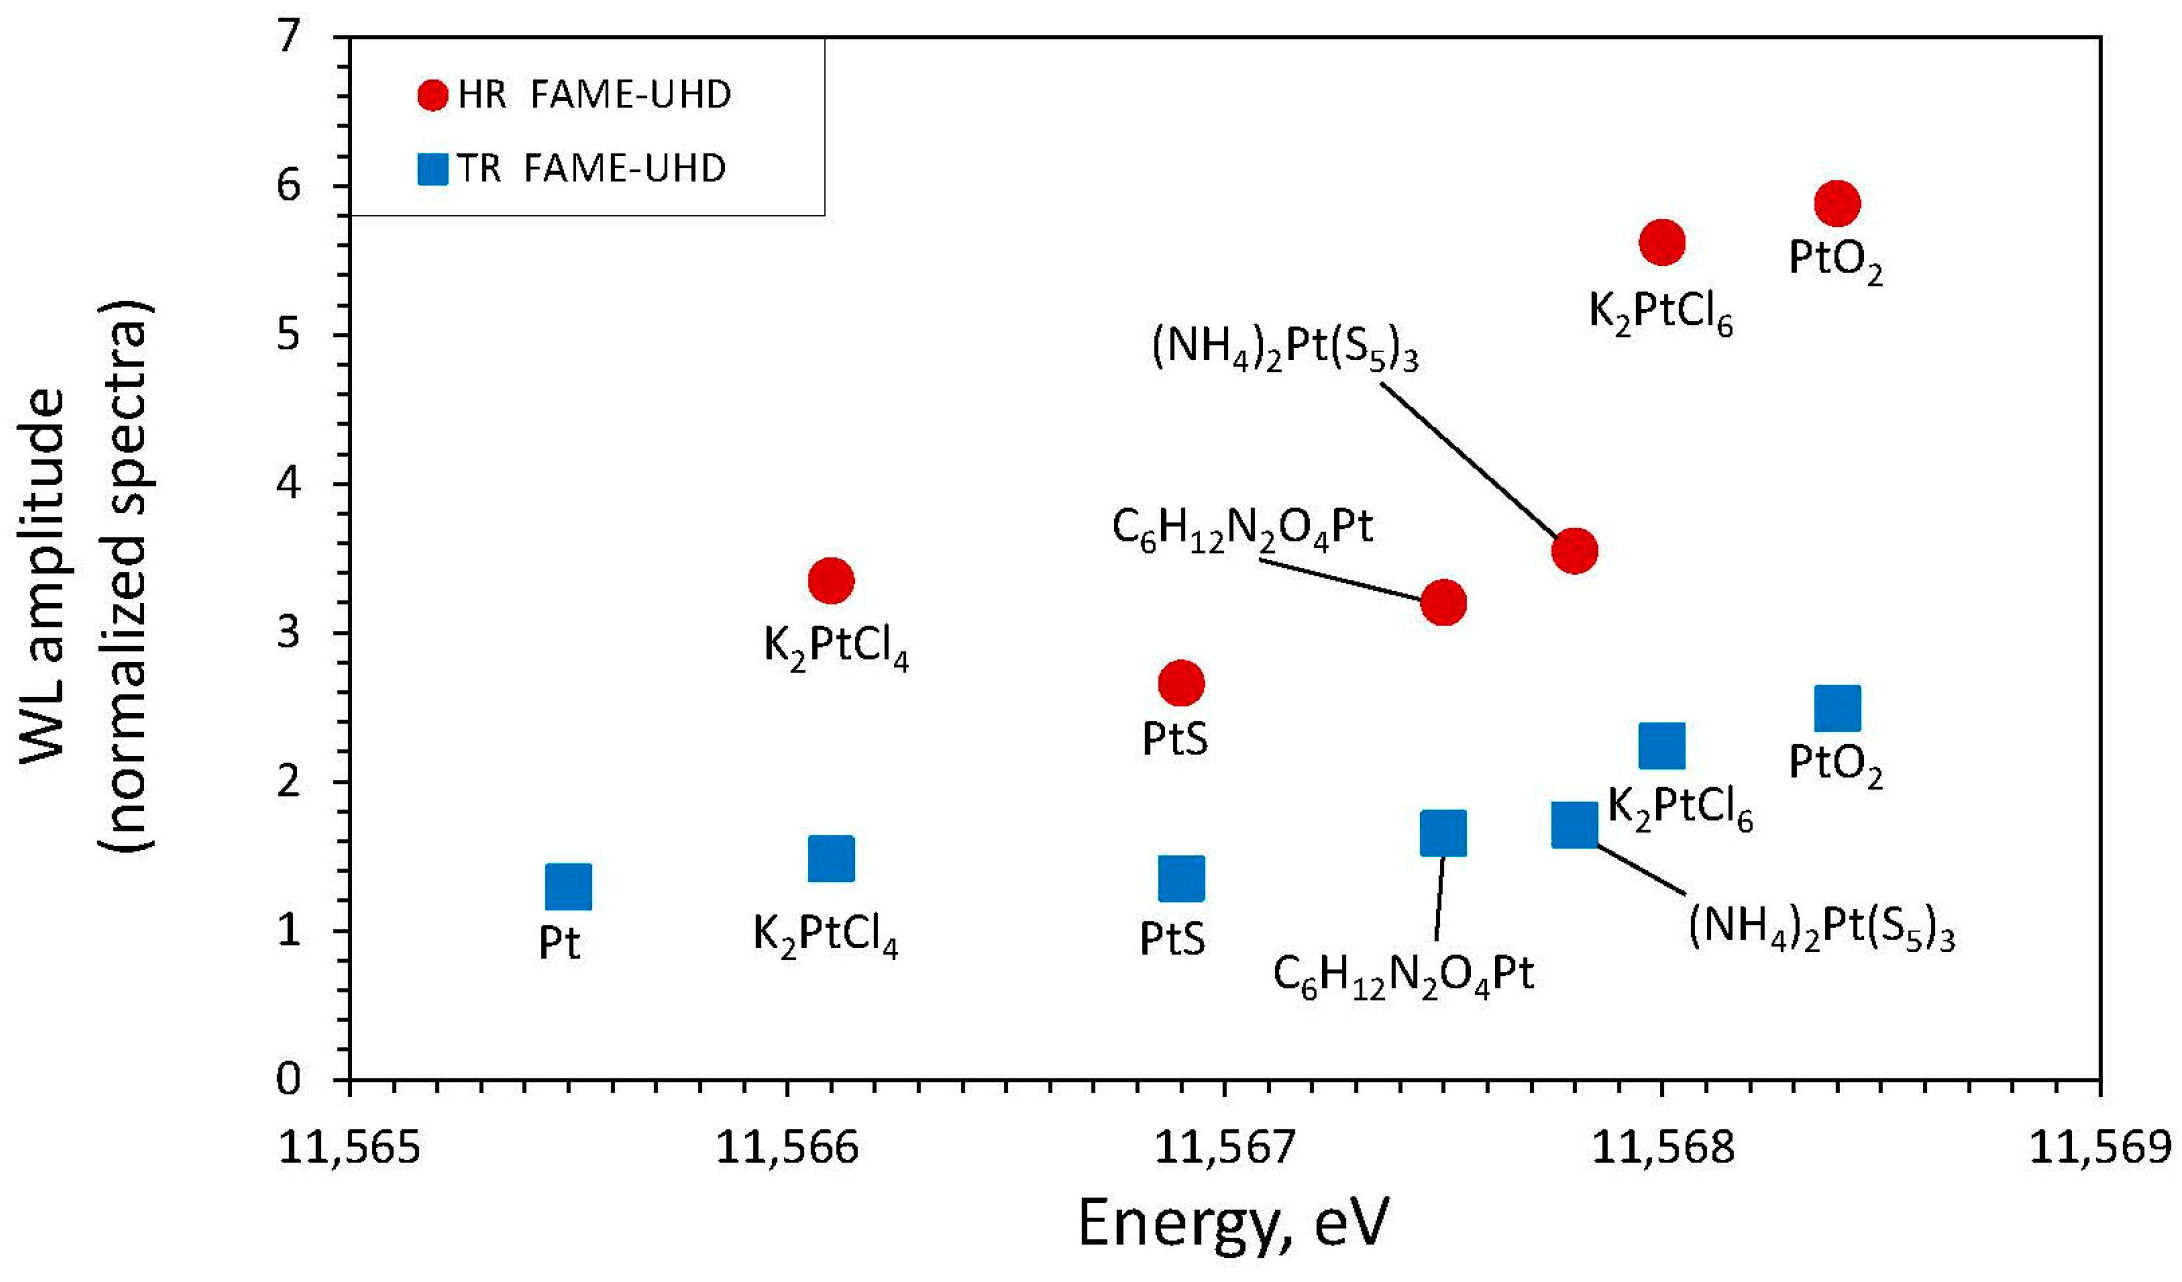
3.1. XANES Results
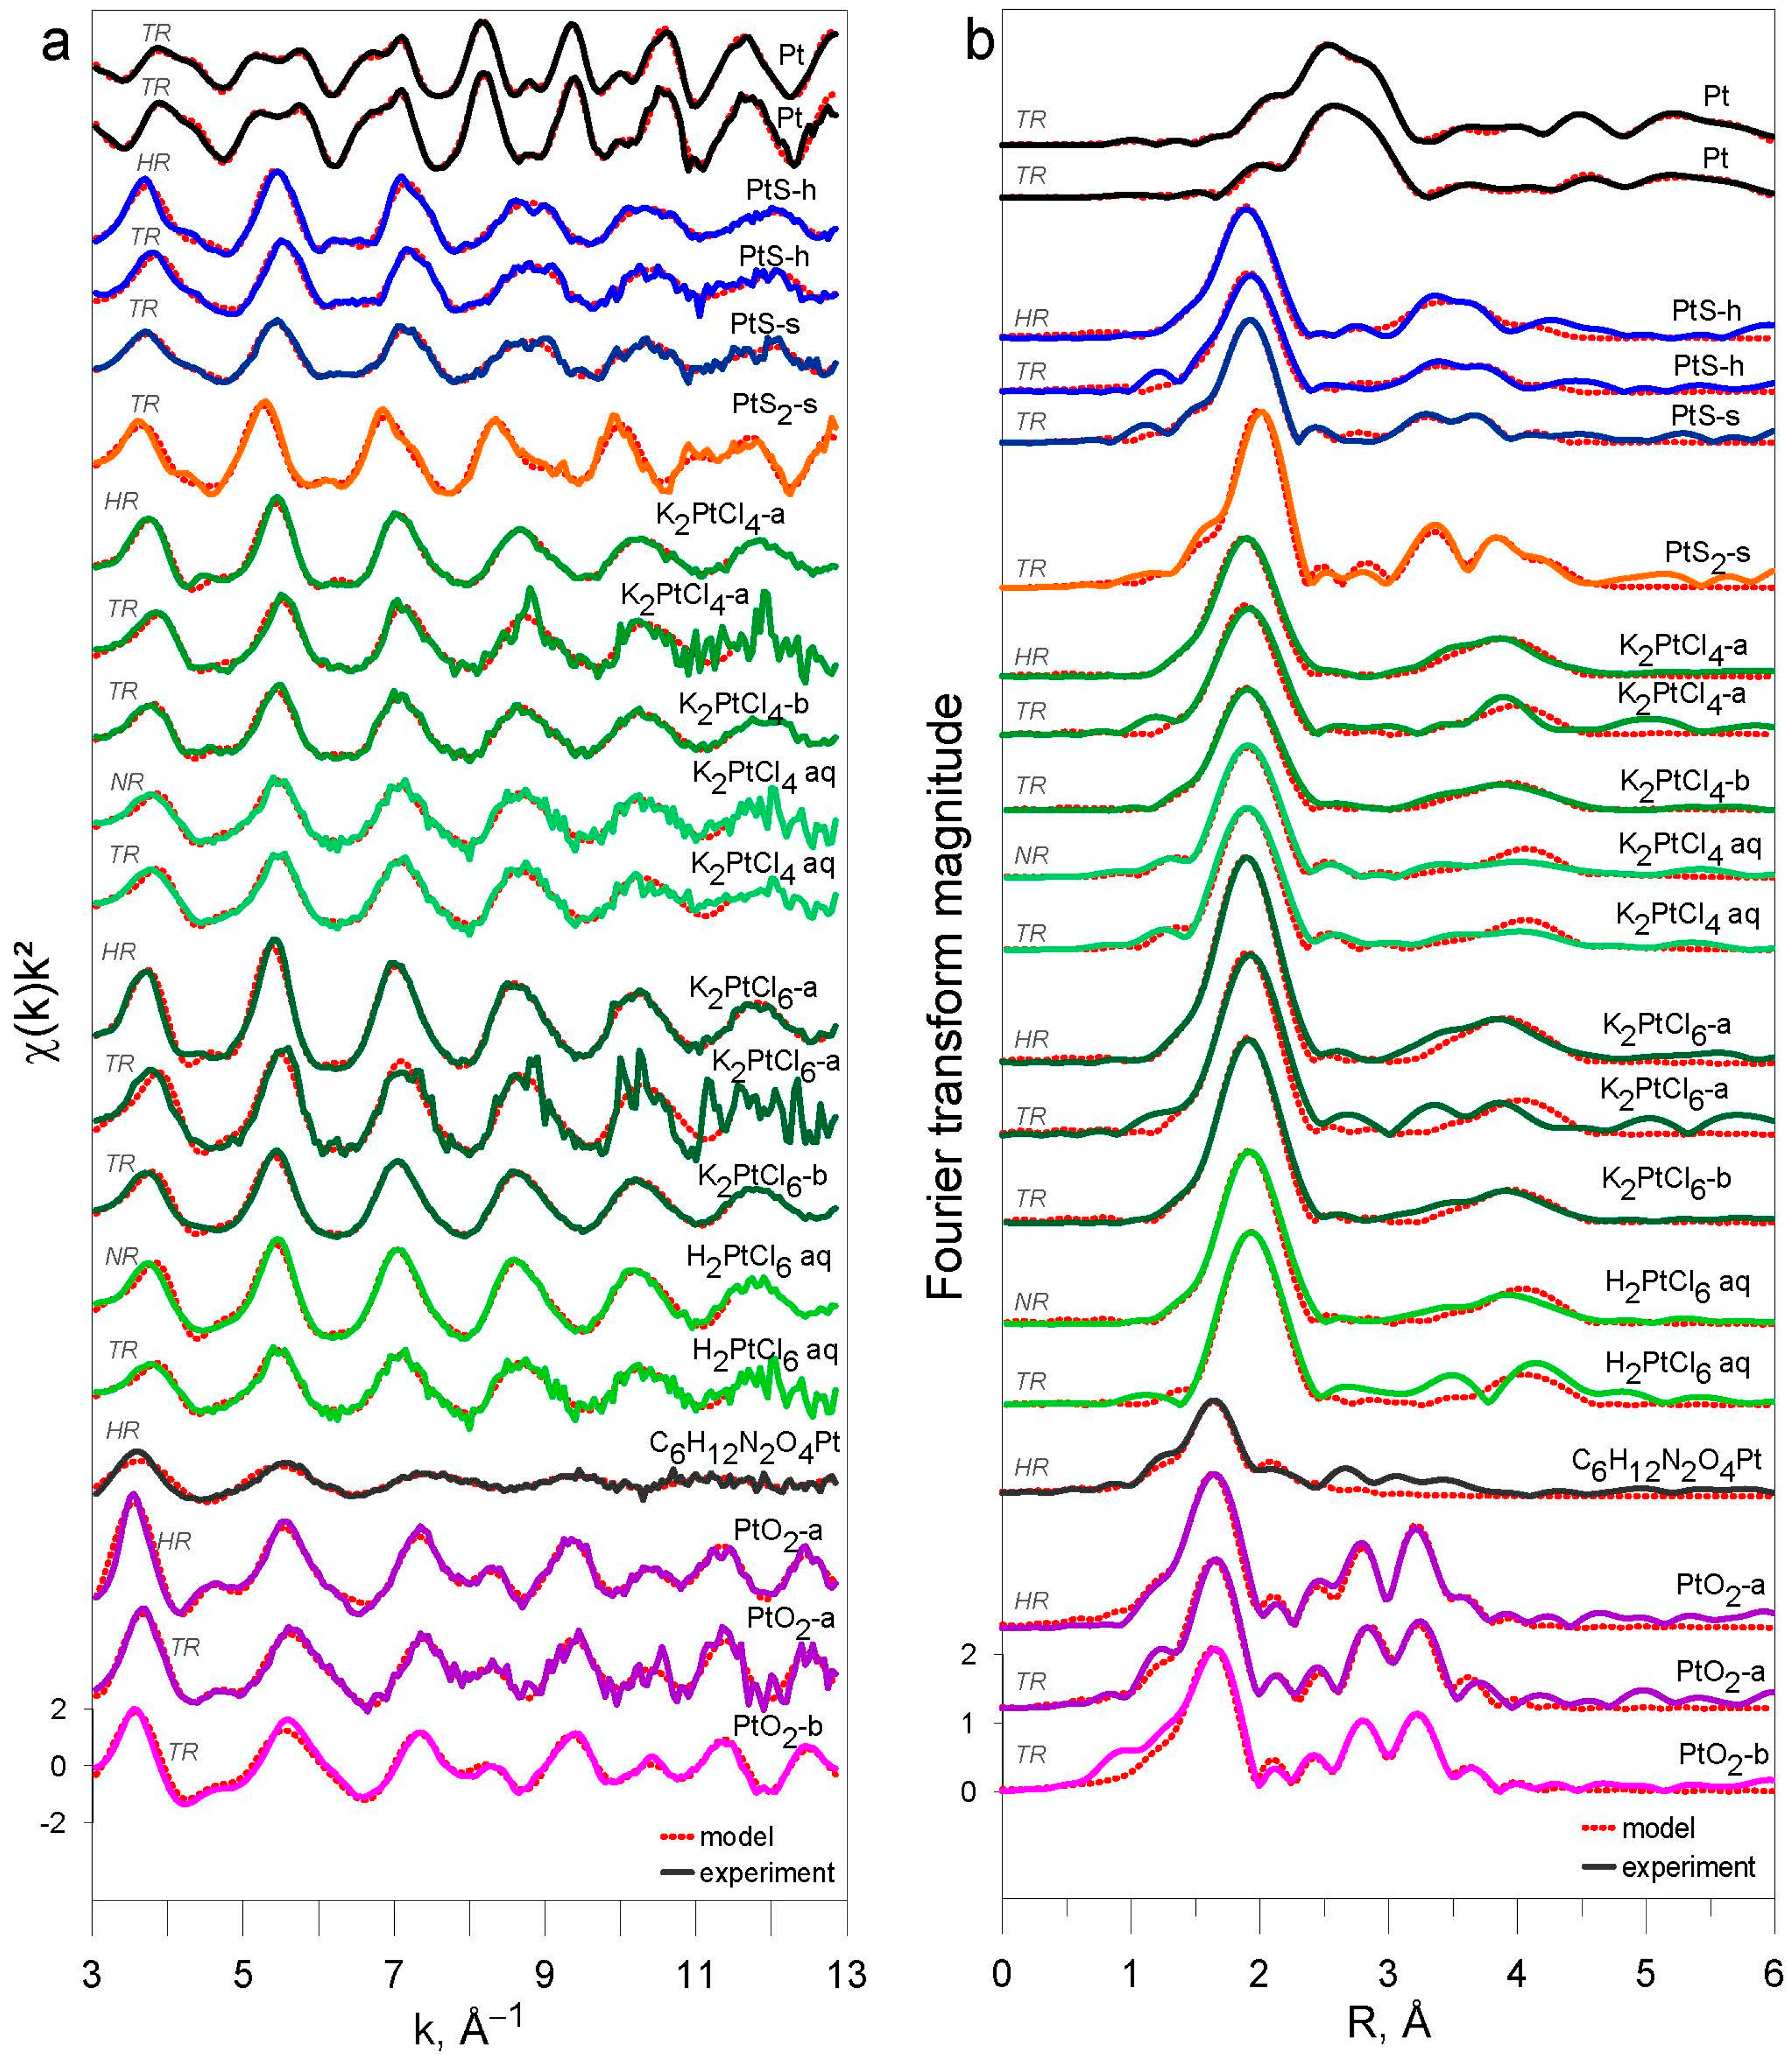
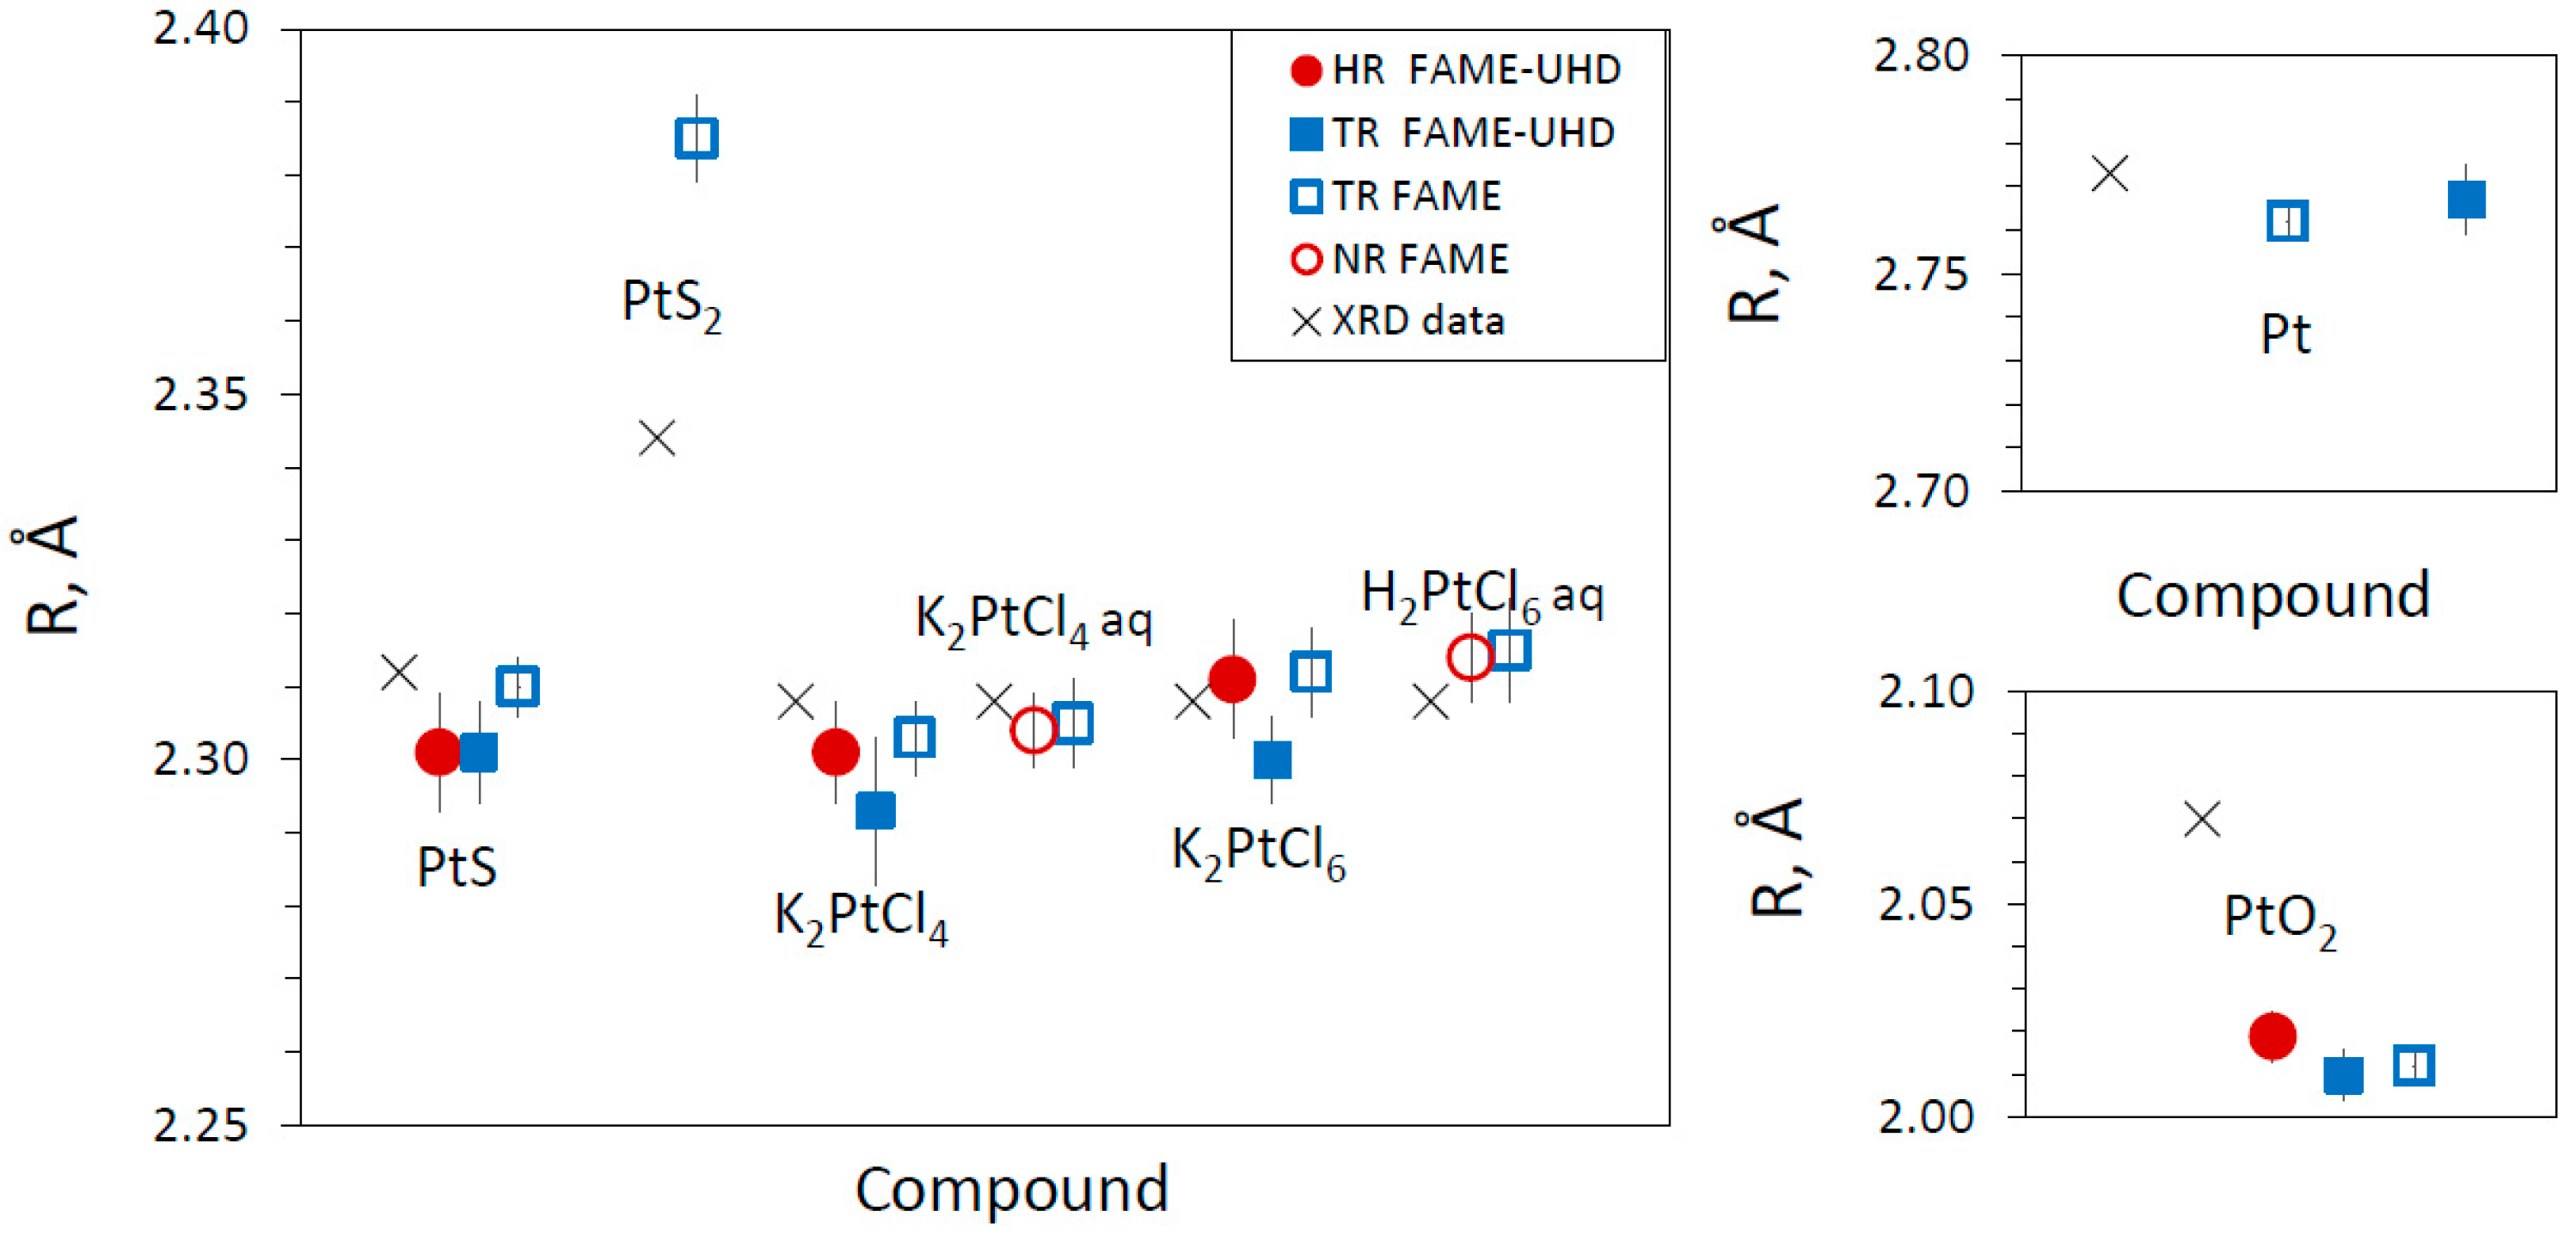
3.2. EXAFS Results
3.2.1. Reference Compounds
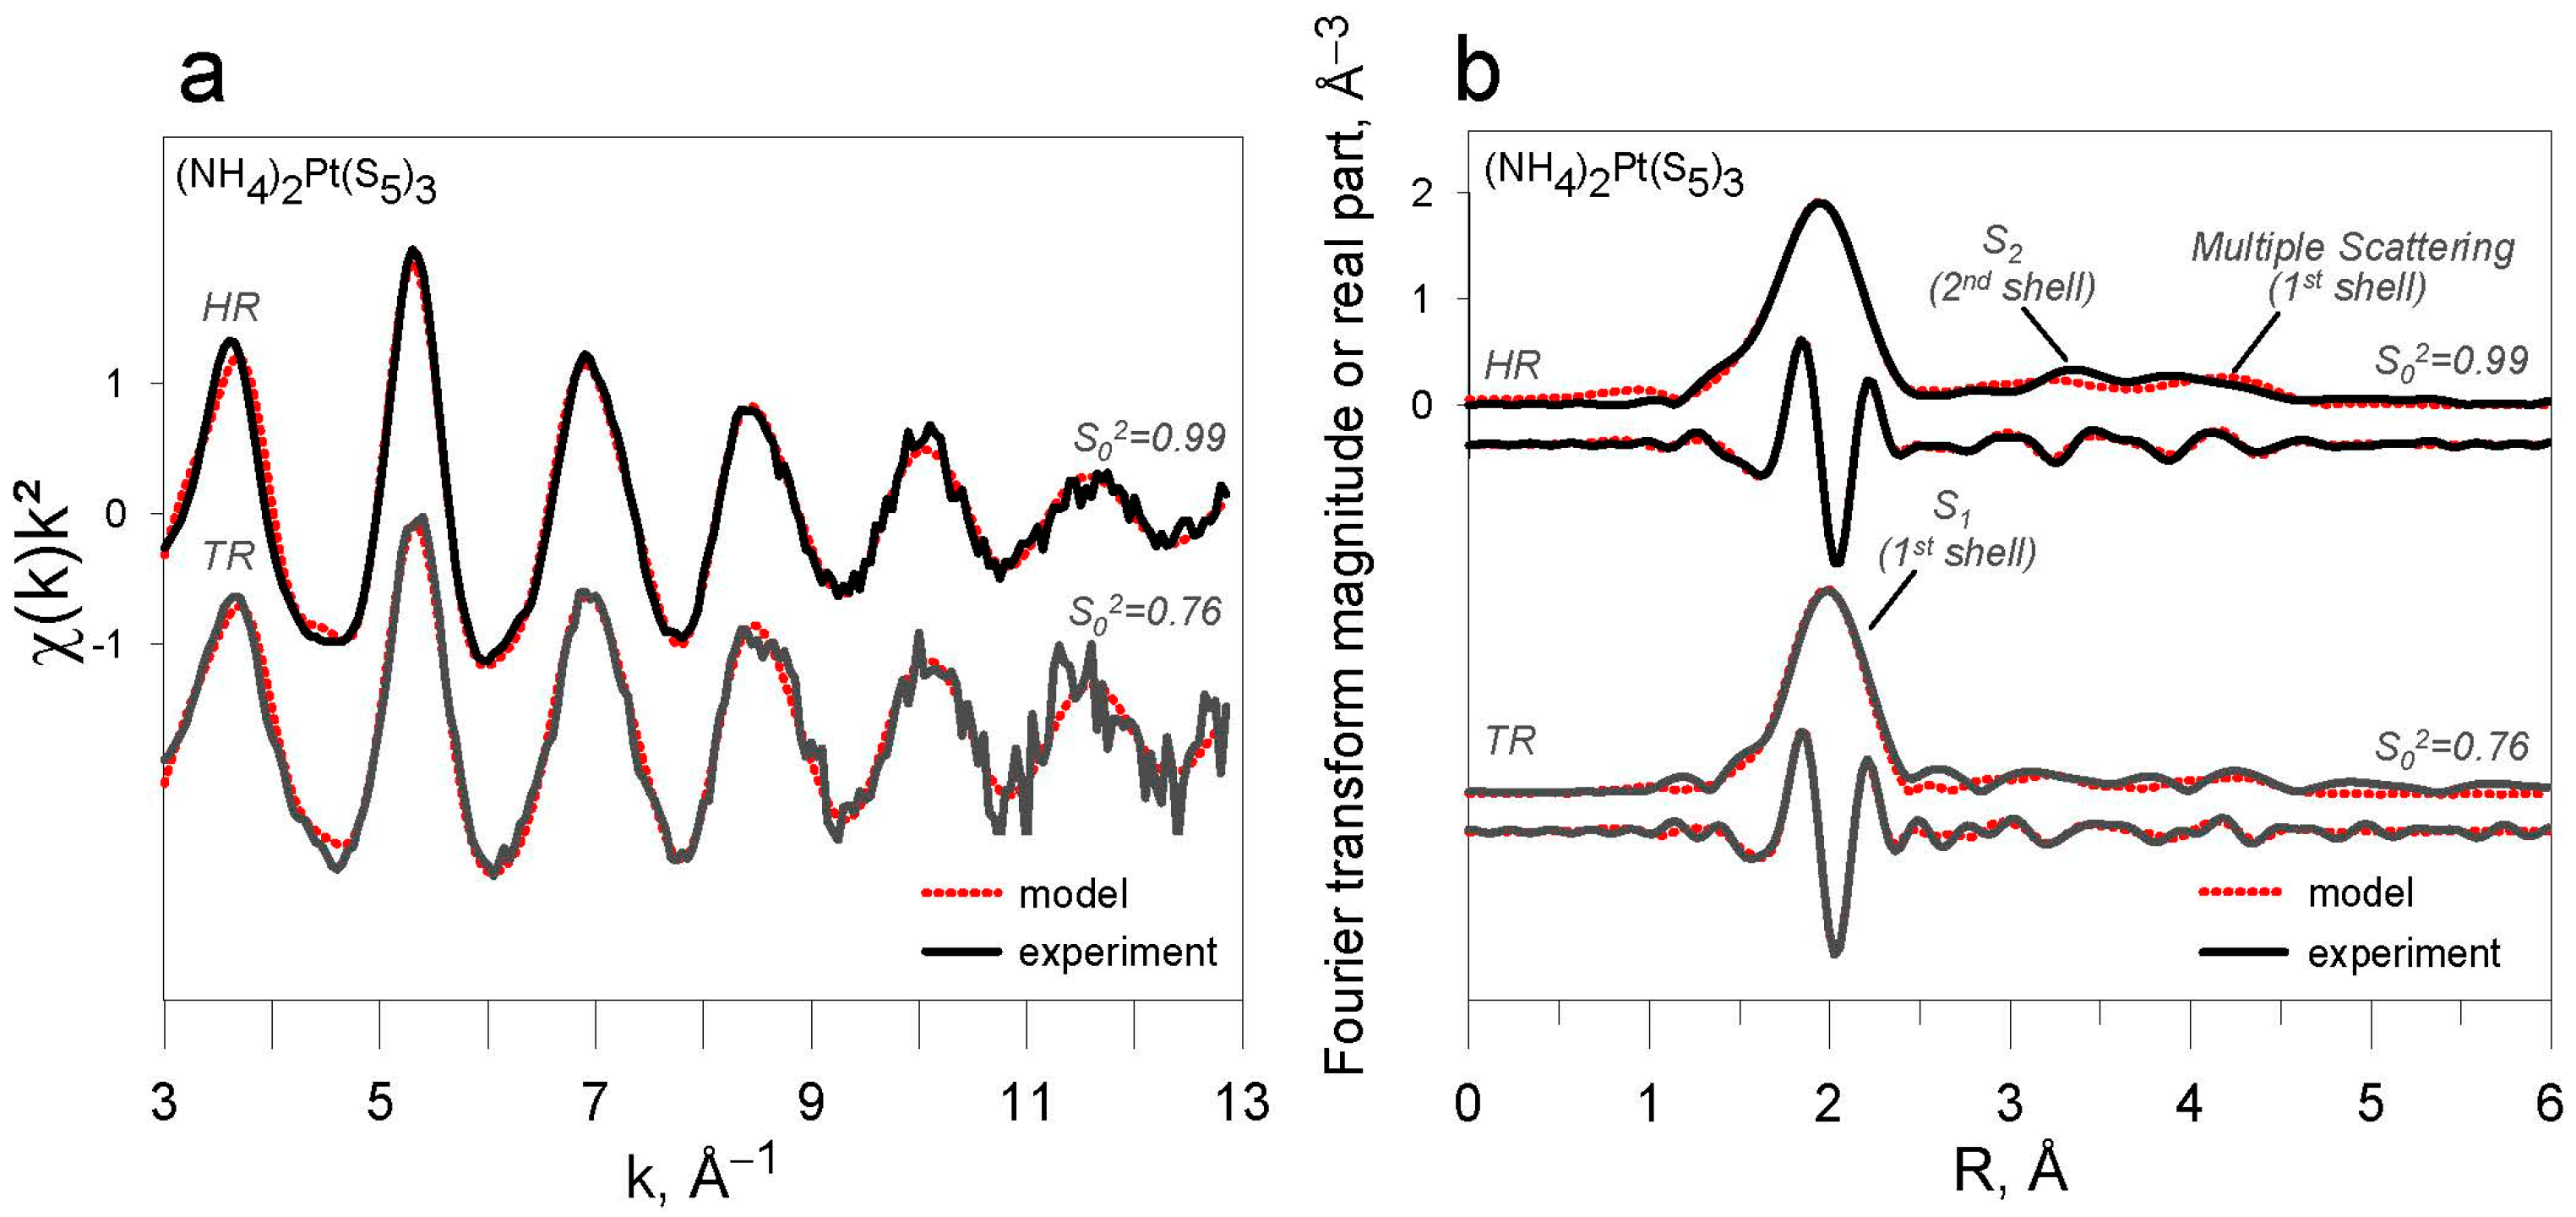
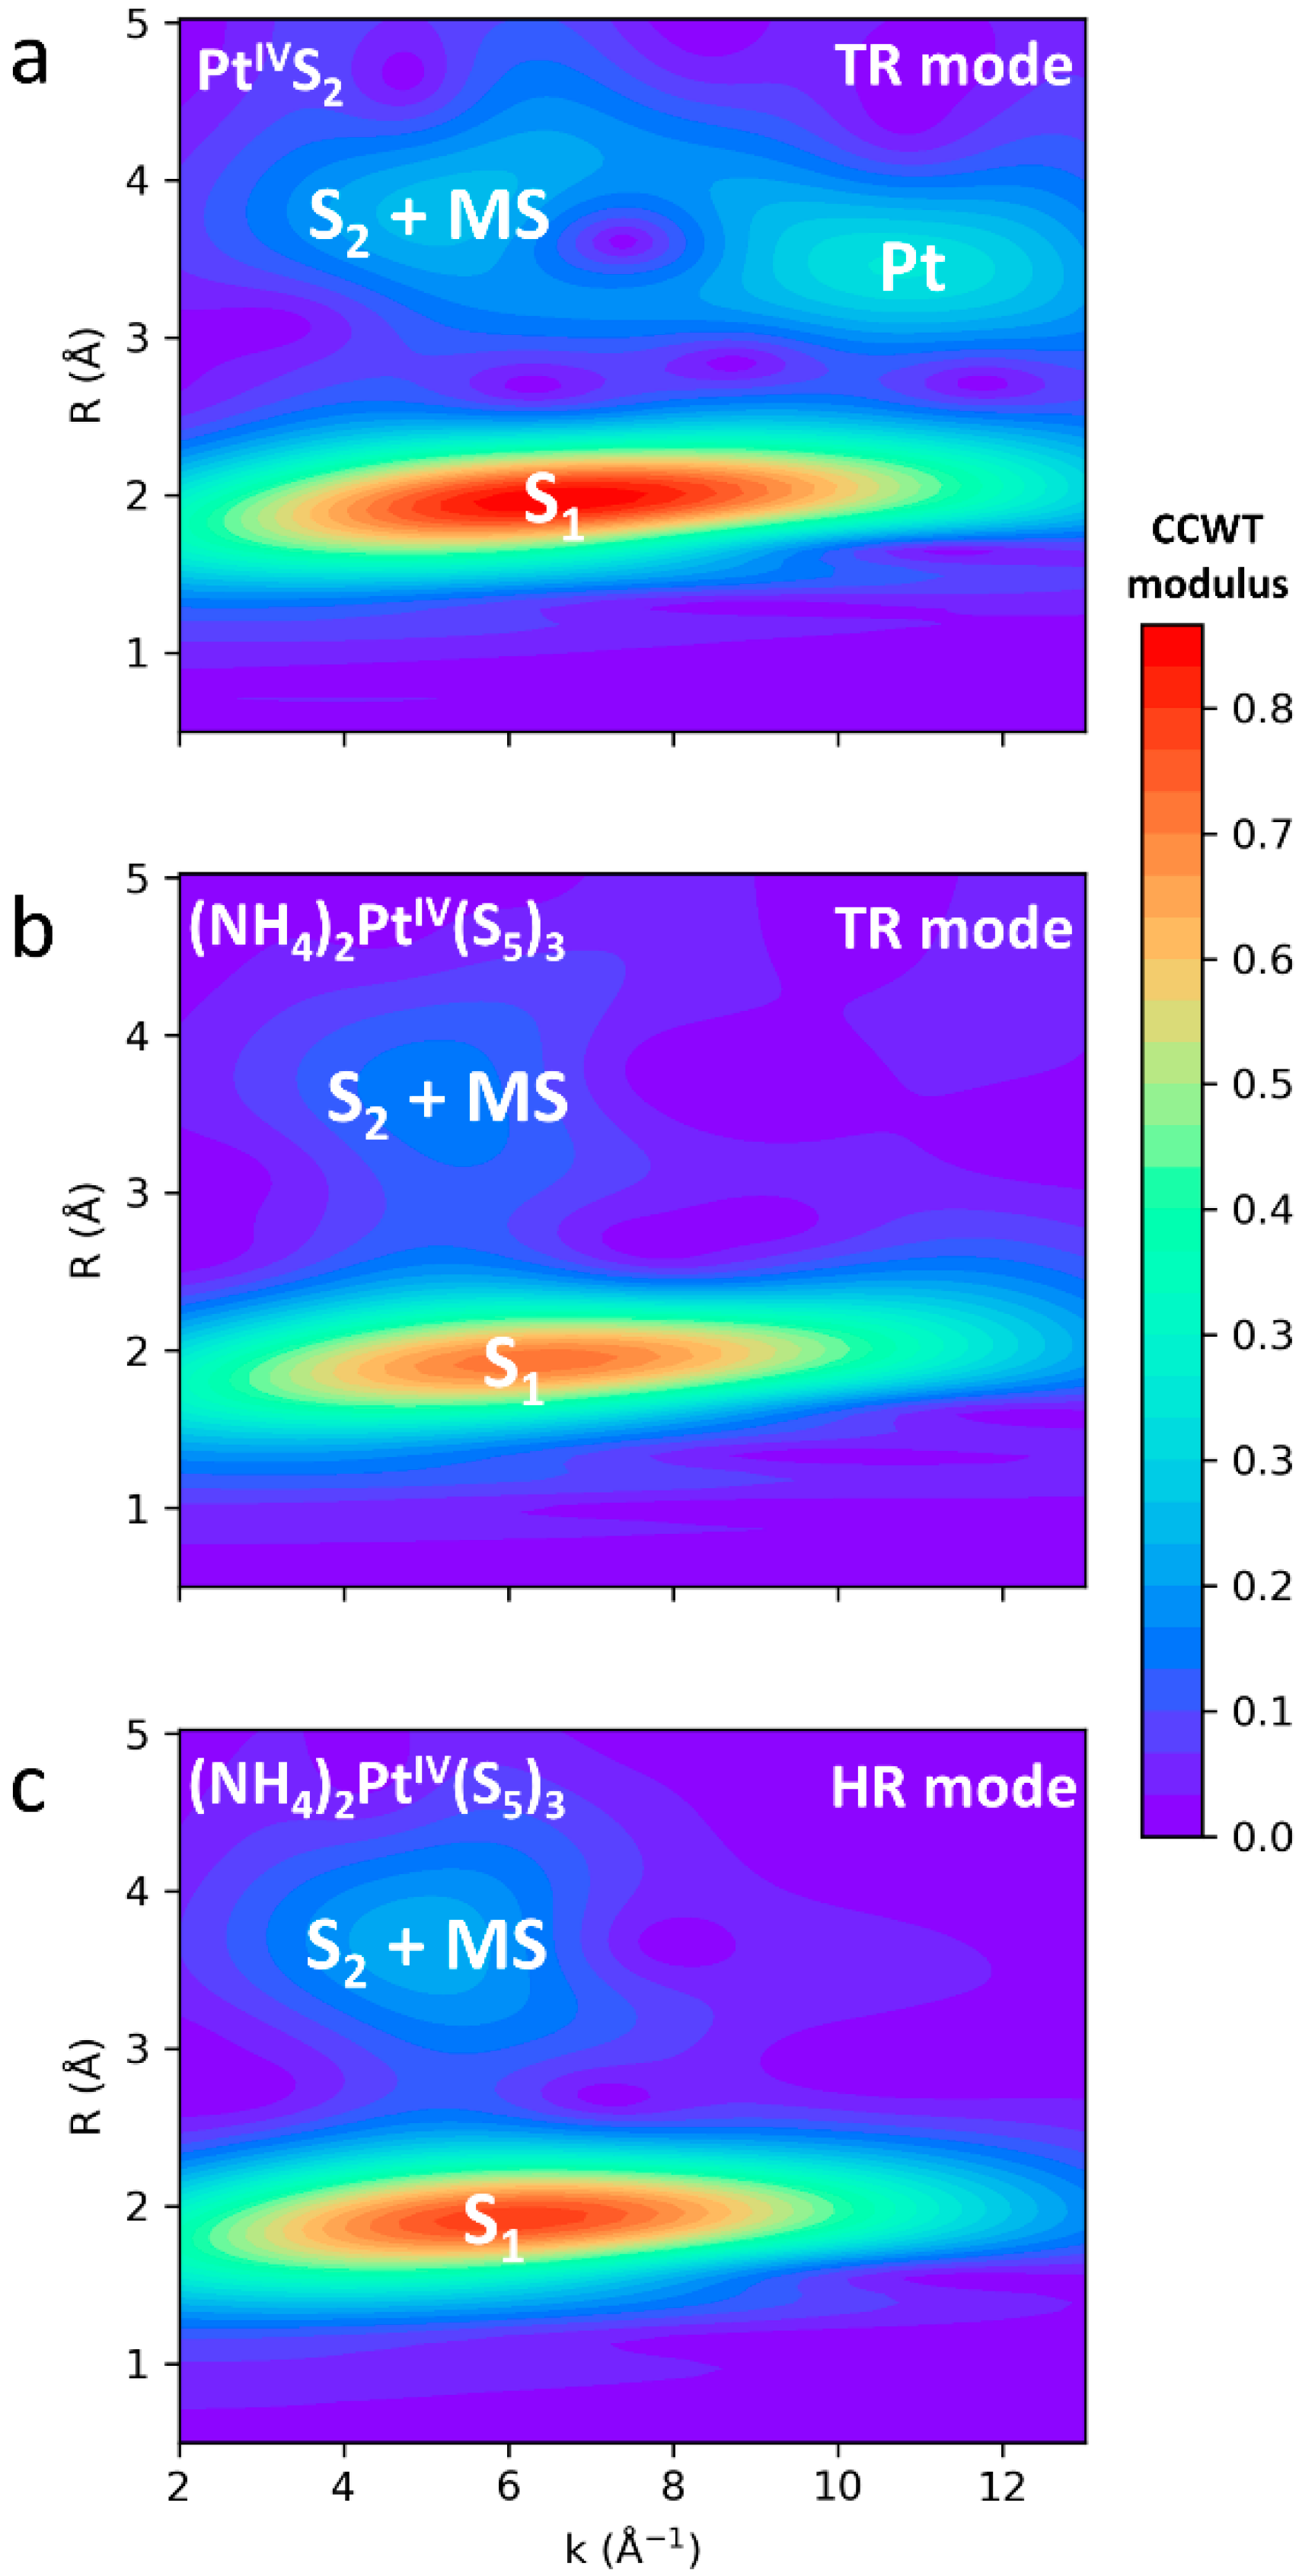
3.2.2. (NH4)2PtS5 Sample
4. Discussion
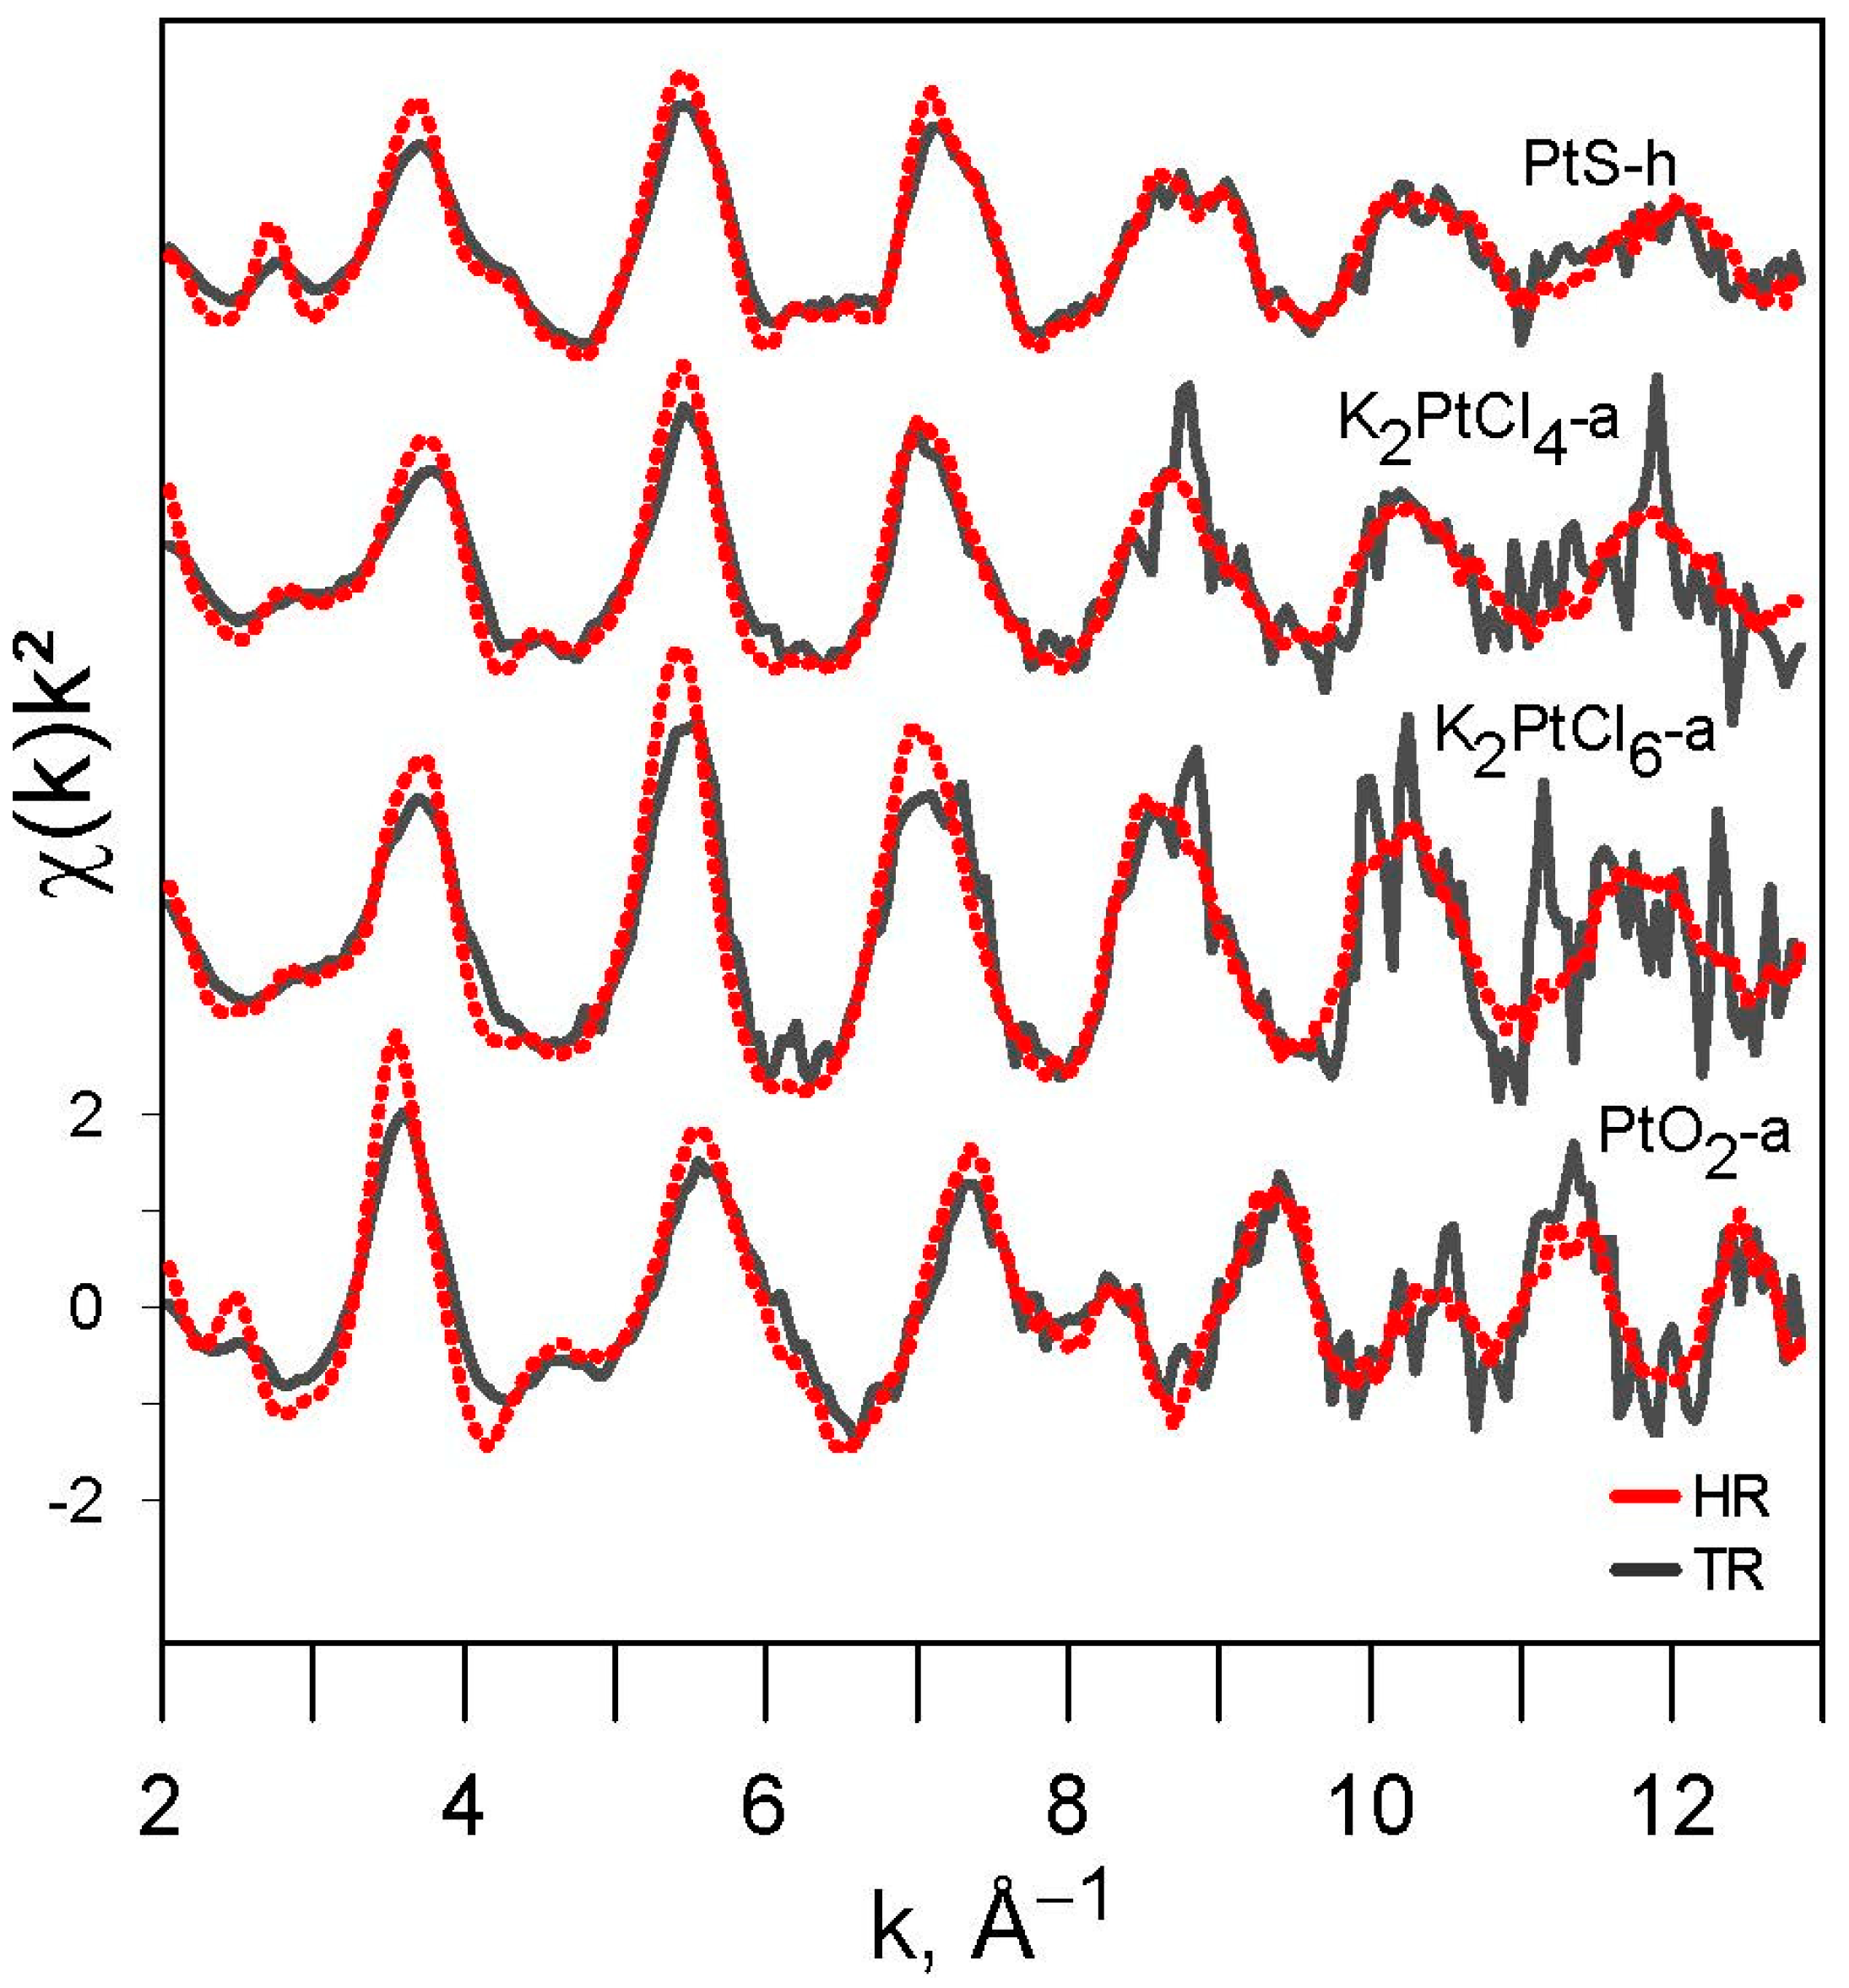
4.1. Resolution Improvement in HERFD Mode
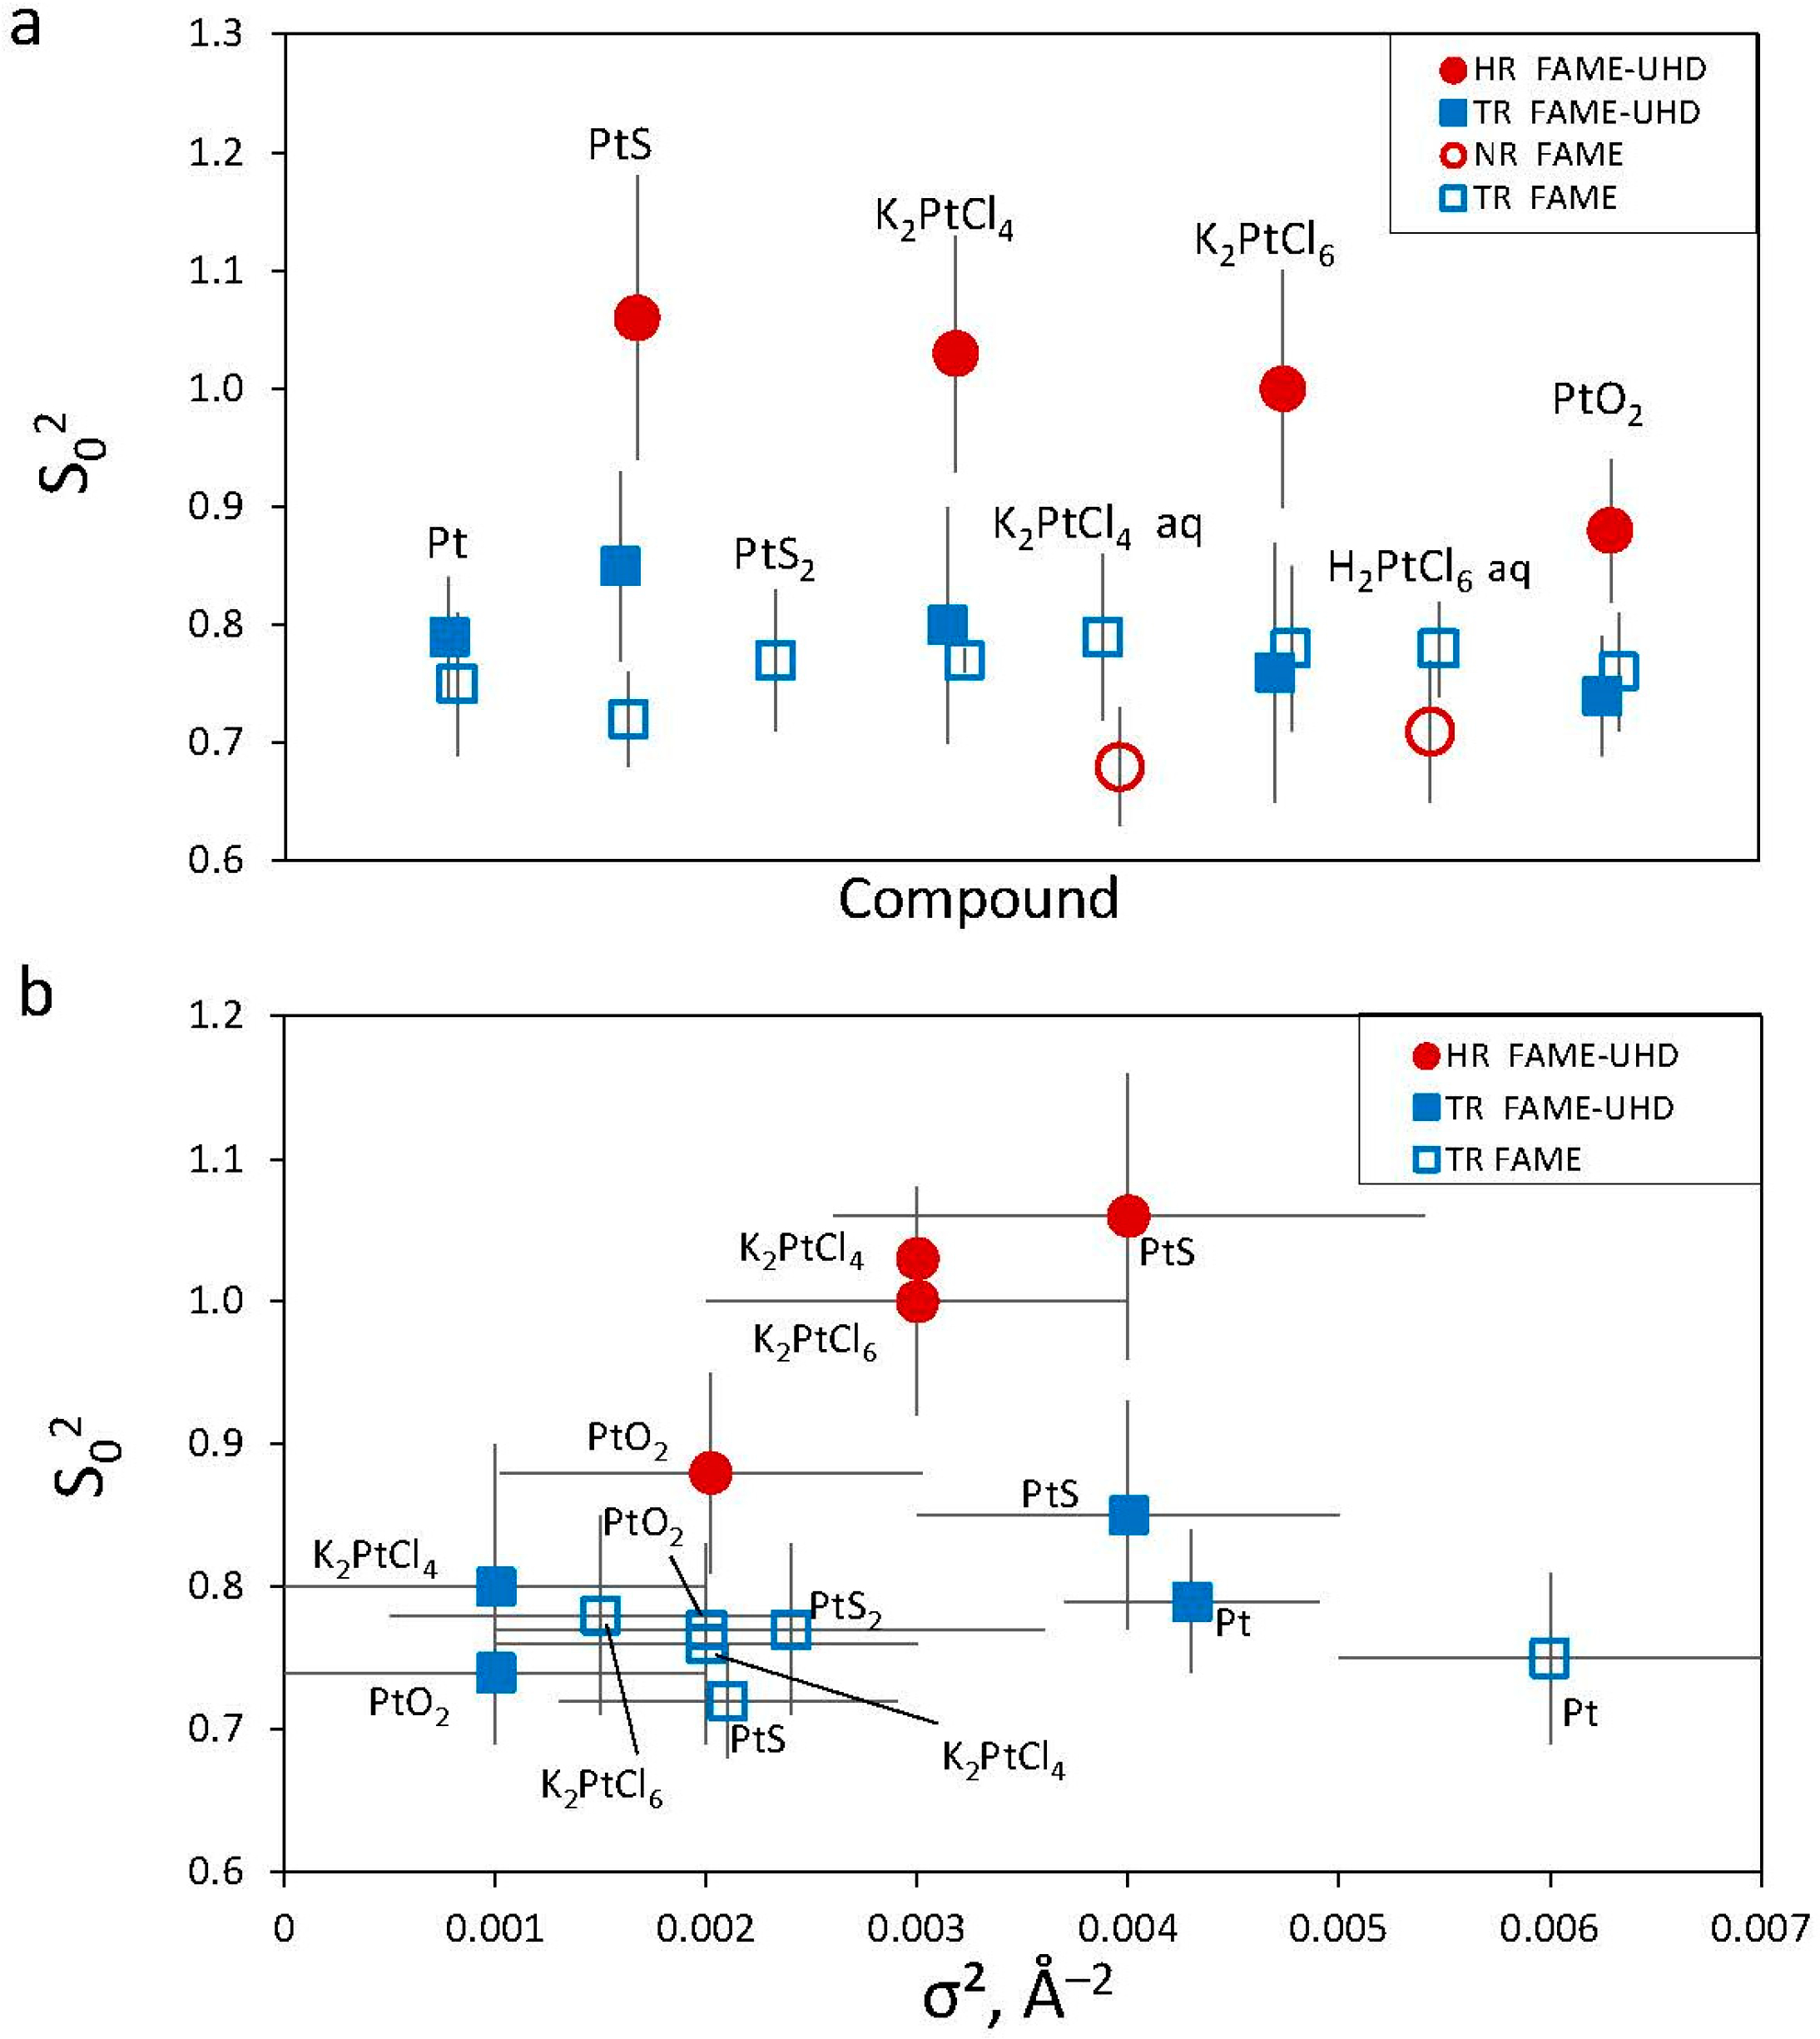
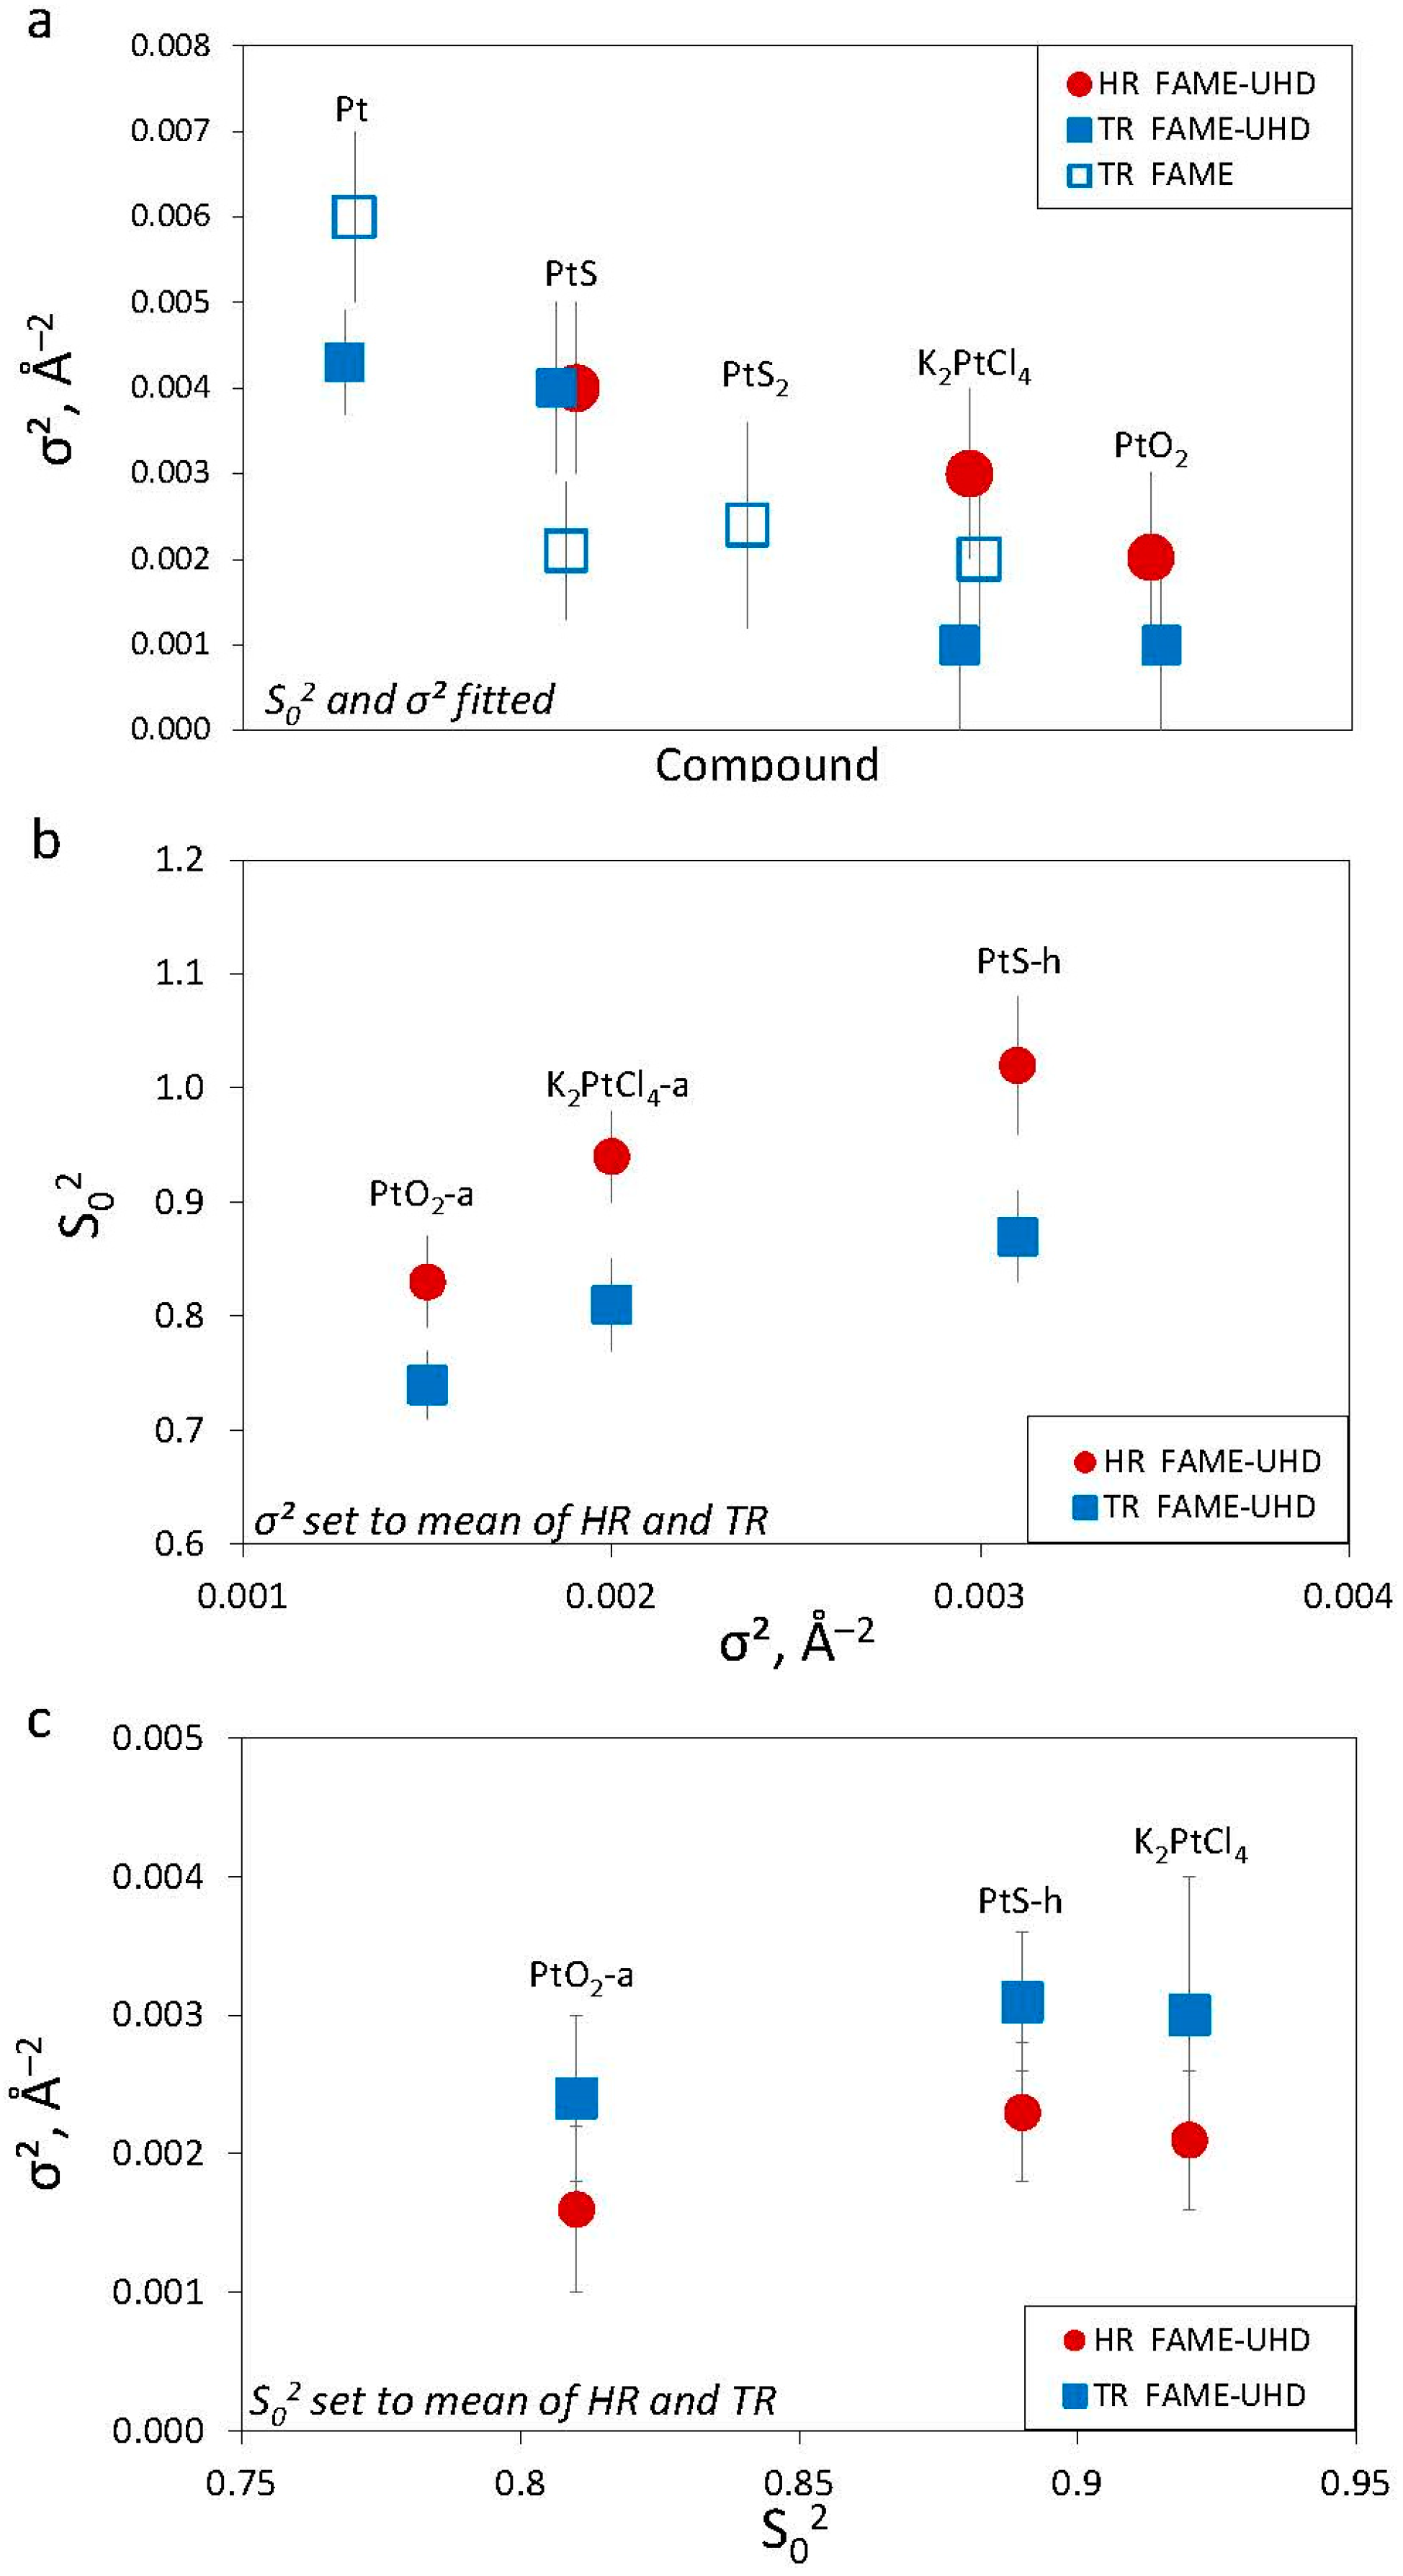
4.2. Amplitude Reduction Factor (S02)
4.3. Modeling Disorder Using Mean Square Relative Displacement, σ2
4.4. Implications
5. Concluding Remarks
Author Contributions
Funding
Data Availability Statement
Acknowledgments
Conflicts of Interest
Appendix A

| Sample/Standard | Feature | Position, eV | WL Amplitude (Normalized Spectra) | ||
|---|---|---|---|---|---|
| This Study | Literature | HR | TR or NR | ||
| Pt0 | EJ WL | 11,564.0 11,565.5 | 11,564.0 a 11,565.5 a | – | 1.29 |
| PtIIS-h | EJ WL | 11,565.6 11,566.9 | 11,564.5 a 11,567.5 a | 2.66 | 1.35 |
| (NH4)2PtIV(S5)3 | EJ WL | 11,566.7 11,567.8 | – – | 3.55 | 1.71 |
| K2PtIICl4-a | EJ WL | 11,565.0 11,566.1 | 11,563.5 b 11,566.0 b | 3.35 | 1.48 |
| K2PtIVCl6-a | EJ WL | 11,567.2 11,568.0 | 11,565.5 b 11,567.7 b | 5.62 | 2.24 |
| PtIVO2-a | EJ WL | 11,567.5 11,568.4 | 11,565.6 c 11,567.8 c | 5.88 | 2.49 |
| C6H12N2O4PtII | EJ WL | 11,566.2 11,567.5 | – – | 3.20 | 1.65 |
| PtIV-Cl/PtII-Cl | PtIV-S/PtII-S | PtII-Cl/PtII-S | PtIV-Cl/PtIV-S | |
|---|---|---|---|---|
| HR-XANES | 1.68 | 1.34 | 1.26 | 1.58 |
| TR-XANES | 1.52 | 1.28 | 1.10 | 1.31 |
| Compound | σ2 × 10³, Å−2 | Mode | S02 | Δe, eV | Pt-X a, Å | R-Factor × 103 |
|---|---|---|---|---|---|---|
| K2PtCl4-a | 2.0 | TR | 0.82 (4) | 9 (1) | 2.293 (7) | 43 |
| K2PtCl4-a | 2.0 | HR | 0.94 (4) | 7 (1) | 2.300 (6) | 23 |
| PtS-h | 3.1 | TR | 0.87 (4) | 10 (1) | 2.303 (6) | 39 |
| PtS-h | 3.1 | HR | 1.02 (6) | 6 (1) | 2.301 (7) | 34 |
| PtO2-a | 1.5 | TR | 0.74 (3) | 12 (1) | 2.009 (6) | 33 |
| PtO2-a | 1.5 | HR | 0.83 (4) | 9 (1) | 2.018 (6) | 28 |
| Compound | S02 | Mode | σ2 × 10³, Å−2 | Δe, eV | Pt-X a, Å | R-Factor × 103 |
|---|---|---|---|---|---|---|
| K2PtCl4-a | 0.92 | TR | 3 (1) | 9 (1) | 2.292 (8) | 49 |
| K2PtCl4-a | 0.92 | HR | 2.1 (5) | 7 (1) | 2.300 (7) | 22 |
| PtS-h | 0.89 | TR | 3.1 (5) | 10 (1) | 2.303 (6) | 30 |
| PtS-h | 0.89 | HR | 2.3 (5) | 6 (1) | 2.300 (8) | 39 |
| PtO2-a | 0.81 | TR | 2.4 (6) | 12 (1) | 2.010 (7) | 36 |
| PtO2-a | 0.81 | HR | 1.6 (6) | 9 (1) | 2.019 (6) | 27 |


References
- Jha, M.K.; Lee, J.; Kim, M.; Jeong, J.; Kim, B.-S.; Kumar, V. Hydrometallurgical Recovery/Recycling of Platinum by the Leaching of Spent Catalysts: A Review. Hydrometallurgy 2013, 133, 23–32. [Google Scholar] [CrossRef]
- Kawde, A.-N.; Aziz, M.; Baig, N.; Temerk, Y. A Facile Fabrication of Platinum Nanoparticle-Modified Graphite Pencil Electrode for Highly Sensitive Detection of Hydrogen Peroxide. J. Electroanal. Chem. 2015, 740, 68–74. [Google Scholar] [CrossRef]
- Bingwa, N.; Ndolomingo, M.J.; Noh, J.-H.; Antonels, N.; Carleschi, E.; Doyle, B.P.; Haumann, M.; Meijboom, R. Synergistic Effect of Mesoporous Metal Oxides and PtO2 Nanoparticles in Aerobic Oxidation of Ethanol and Ionic Liquid Induced Acetaldehyde Selectivity. Mol. Catal. 2020, 492, 110978. [Google Scholar] [CrossRef]
- Loibl, S.; O’Shaughnessy, J.; Untch, M.; Sikov, W.M.; Rugo, H.S.; McKee, M.D.; Huober, J.; Golshan, M.; von Minckwitz, G.; Maag, D.; et al. Addition of the PARP Inhibitor Veliparib plus Carboplatin or Carboplatin Alone to Standard Neoadjuvant Chemotherapy in Triple-Negative Breast Cancer (BrighTNess): A Randomised, Phase 3 Trial. Lancet Oncol. 2018, 19, 497–509. [Google Scholar] [CrossRef]
- Ghosh, S. Cisplatin: The First Metal Based Anticancer Drug. Bioorg. Chem. 2019, 88, 102925. [Google Scholar] [CrossRef]
- Tutt, A.; Tovey, H.; Cheang, M.C.U.; Kernaghan, S.; Kilburn, L.; Gazinska, P.; Owen, J.; Abraham, J.; Barrett, S.; Barrett-Lee, P.; et al. A Randomised Phase III Trial of Carboplatin Compared with Docetaxel in BRCA1/2 Mutated and Pre-Specified Triple Negative Breast Cancer “BRCAness” Subgroups: The TNT Trial. Nat. Med. 2019, 24, 628. [Google Scholar] [CrossRef] [Green Version]
- Cotton, F.A.; Wilkinson, G.; Murillo, C.A.; Bochmann, M. Advanced Inorganic Chemistry, 6th ed.; Wiley: New York, NY, USA, 1999. [Google Scholar]
- Chen, K.; Walker, R.J.; Rudnick, R.L.; Gao, S.; Gaschnig, R.M.; Puchtel, I.S.; Tang, M.; Hu, Z.-C. Platinum-Group Element Abundances and Re–Os Isotopic Systematics of the Upper Continental Crust through Time: Evidence from Glacial Diamictites. Geochim. Cosmochim. Acta 2016, 191, 1–16. [Google Scholar] [CrossRef] [Green Version]
- Ballhaus, C.G.; Stumpfl, E.F. Sulfide and Platinum Mineralization in the Merensky Reef: Evidence from Hydrous Silicates and Fluid Inclusions. Contrib. Miner. Pet. 1986, 94, 193–204. [Google Scholar] [CrossRef]
- Gammons, C.H.; Bloom, M.S. Experimental Investigation of the Hydrothermal Geochemistry of Platinum and Palladium: II. The Solubility of PtS and PdS in Aqueous Sulfide Solutions to 300 °C. Geochim. Cosmochim. Acta 1993, 57, 2451–2467. [Google Scholar] [CrossRef]
- Pan, P.; Wood, S.A. Solubility of Pt and Pd Sulfides and Au Metal in Aqueous Bisulfide Solutions: II. Results at 200° to 350 °C and Saturated Vapor Pressure. Miner. Depos. 1994, 29, 373–390. [Google Scholar] [CrossRef]
- Sassani, D.C.; Shock, E.L. Solubility and Transport of Platinum-Group Elements in Supercritical Fluids: Summary and Estimates of Thermodynamic Properties for Ruthenium, Rhodium, Palladium, and Platinum Solids, Aqueous Ions, and Complexes to 1000 °C and 5 Kbar. Geochim. Cosmochim. Acta 1998, 62, 2643–2671. [Google Scholar] [CrossRef]
- Fleet, M.E.; Liu, X. X-ray Absorption Spectroscopy of Ultramarine Pigments: A New Analytical Method for the Polysulfide Radical Anion S3− Chromophore. Spectrochim. Acta Part B At. Spectrosc. 2010, 65, 75–79. [Google Scholar] [CrossRef]
- Bazarkina, E.F.; Pokrovski, G.S.; Hazemann, J.-L. Structure, Stability and Geochemical Role of Palladium Chloride Complexes in Hydrothermal Fluids. Geochim. Cosmochim. Acta 2014, 146, 107–131. [Google Scholar] [CrossRef]
- Kokh, M.A.; Akinfiev, N.N.; Pokrovski, G.S.; Salvi, S.; Guillaume, D. The Role of Carbon Dioxide in the Transport and Fractionation of Metals by Geological Fluids. Geochim. Cosmochim. Acta 2017, 197, 433–466. [Google Scholar] [CrossRef]
- Tagirov, B.R.; Filimonova, O.N.; Trigub, A.L.; Akinfiev, N.N.; Nickolsky, M.S.; Kvashnina, K.O.; Chareev, D.A.; Zotov, A.V. Platinum Transport in Chloride-Bearing Fluids and Melts: Insights from in Situ X-ray Absorption Spectroscopy and Thermodynamic Modeling. Geochim. Cosmochim. Acta 2019, 254, 86–101. [Google Scholar] [CrossRef]
- Filimonova, O.N.; Tagirov, B.R.; Zotov, A.V.; Baranova, N.N.; Bychkova, Y.V.; Tyurin, D.A.; Chareev, D.A.; Nickolsky, M.S. The Solubility of Cooperite PtS(Cr) at 25–450 °C, Psat—1000 Bar and Hydrosulfide Complexing of Platinum in Hydrothermal Fluids. Chem. Geol. 2021, 559, 119968. [Google Scholar] [CrossRef]
- Pokrovski, G.S.; Kokh, M.A.; Desmaele, E.; Laskar, C.; Bazarkina, E.F.; Borisova, A.Y.; Testemale, D.; Hazemann, J.-L.; Vuilleumier, R.; Ferlat, G.; et al. The Trisulfur Radical Ion S3•− Controls Platinum Transport by Hydrothermal Fluids. Proc. Natl. Acad. Sci. USA 2021, 118, e2109768118. [Google Scholar] [CrossRef]
- Huang, H.; Liang, C.H.; Penner-Hahn, J.E. X-ray Absorption Spectroscopy of Dimethylcuprates: Evidence for Solvent-Dependent Aggregation. Angew. Chem. Int. Ed. 1998, 37, 1564–1566. [Google Scholar] [CrossRef]
- Ho, P.K.-H.; Chua, L.-L.; Dipankar, M.; Gao, X.Y.; Qi, D.C.; Wee, A.T.-S.; Chang, J.-F.; Friend, R.H. Solvent Effects on Chain Orientation and Interchain π-Interaction in Conjugated Polymer Thin Films: Direct Measurements of the Air and Substrate Interfaces by Near-Edge X-ray Absorption Spectroscopy. Adv. Mater. 2007, 19, 215–221. [Google Scholar] [CrossRef]
- Bokarev, S.I.; Dantz, M.; Suljoti, E.; Kühn, O.; Aziz, E.F. State-Dependent Electron Delocalization Dynamics at the Solute-Solvent Interface: Soft-X-ray Absorption Spectroscopy and Ab Initio Calculations. Phys. Rev. Lett. 2013, 111, 083002. [Google Scholar] [CrossRef]
- Penfold, T.J.; Karlsson, S.; Capano, G.; Lima, F.A.; Rittmann, J.; Reinhard, M.; Rittmann-Frank, M.H.; Braem, O.; Baranoff, E.; Abela, R.; et al. Solvent-Induced Luminescence Quenching: Static and Time-Resolved X-ray Absorption Spectroscopy of a Copper(I) Phenanthroline Complex. J. Phys. Chem. A 2013, 117, 4591–4601. [Google Scholar] [CrossRef]
- Asakura, H.; Tanaka, T. Recent Applications of X-ray Absorption Spectroscopy in Combination with High Energy Resolution Fluorescence Detection. Chem. Lett. 2021, 50, 1075–1085. [Google Scholar] [CrossRef]
- Peyrelade, E. Élaborations et Caractérisations Electrochimiques et Physiques de Matériaux D’anode de PEMFC peu Sensibles à L’empoisonnement par CO: Étude D’alliages et de Composites à Base de Platine-Molybdène et de Platine-Tungstène. Ph.D. Thesis, Institut National Polytechnique de Grenoble, Grenoble, France, 2005. [Google Scholar]
- Crowther, N. Catalyseurs à Base de Complexes de Platine Incorporés Dans Les Murs de Silices Mesoporeuses Périodiques; Réactivité En Hydrogénation. Ph.D. Thesis, Ecole Normale Supérieure de Lyon-ENS LYON, Lyon, France, 2007. [Google Scholar]
- Gorczyca, A.; Moizan, V.; Chizallet, C.; Proux, O.; Del Net, W.; Lahera, E.; Hazemann, J.-L.; Raybaud, P.; Joly, Y. Monitoring Morphology and Hydrogen Coverage of Nanometric Pt/γ-Al2O3 Particles by In Situ HERFD-XANES and Quantum Simulations. Angew. Chem. 2014, 126, 12634–12637. [Google Scholar] [CrossRef]
- Scholten, L.; Watenphul, A.; Beermann, O.; Testemale, D.; Ames, D.; Schmidt, C. Nickel and Platinum in High-Temperature H2O + HCl Fluids: Implications for Hydrothermal Mobilization. Geochim. Cosmochim. Acta 2018, 224, 187–199. [Google Scholar] [CrossRef]
- Filimonova, O.N.; Nickolsky, M.S.; Trigub, A.L.; Chareev, D.A.; Kvashnina, K.O.; Kovalchuk, E.V.; Vikentyev, I.V.; Tagirov, B.R. The State of Platinum in Pyrite Studied by X-ray Absorption Spectroscopy of Synthetic Crystals. Econ. Geol. 2019, 114, 1649–1663. [Google Scholar] [CrossRef]
- Filimonova, O.N.; Trigub, A.L.; Nickolsky, M.S.; Chareev, D.A.; Kvashnina, K.O.; Kovalchuk, E.V.; Vikentyev, I.V.; Reukov, V.L.; Tagirov, B.R. The State of Platinum in Pyrrhotite: X-ray Absorption Spectroscopy Study and Implications for the Role of Fe Sulphides as Platinum Carriers. Mineral. Mag. 2021, 85, 846–861. [Google Scholar] [CrossRef]
- Evstigneeva, P.V.; Trigub, A.L.; Chareev, D.A.; Nickolsky, M.S.; Tagirov, B.R. The Charge State of Pt in Binary Compounds and Synthetic Minerals Determined by X-ray Absorption Spectroscopy and Quantum Chemical Calculations. Minerals 2021, 11, 79. [Google Scholar] [CrossRef]
- Hämäläinen, K.; Siddons, D.P.; Hastings, J.B.; Berman, L.E. Elimination of the Inner-Shell Lifetime Broadening in X-ray-Absorption Spectroscopy. Phys. Rev. Lett. 1991, 67, 2850. [Google Scholar] [CrossRef]
- Galoisy, L.; Calas, G.; Arrio, M.A. High-Resolution XANES Spectra of Iron in Minerals and Glasses: Structural Information from the Pre-Edge Region. Chem. Geol. 2001, 174, 307–319. [Google Scholar] [CrossRef]
- Glatzel, P.; Sikora, M.; Smolentsev, G.; Fernández-García, M. Hard X-ray Photon-in Photon-out Spectroscopy. Catal. Today 2009, 145, 294–299. [Google Scholar] [CrossRef]
- Isaure, M.-P.; Albertelli, M.; Kieffer, I.; Tucoulou, R.; Petrel, M.; Gontier, E.; Tessier, E.; Monperrus, M.; Goñi-Urriza, M. Relationship Between Hg Speciation and Hg Methylation/Demethylation Processes in the Sulfate-Reducing Bacterium Pseudodesulfovibrio Hydrargyri: Evidences From HERFD-XANES and Nano-XRF. Front. Microbiol. 2020, 11, 584715. [Google Scholar] [CrossRef] [PubMed]
- Thomas, S.A.; Mishra, B.; Myneni, S.C.B. Cellular Mercury Coordination Environment, and Not Cell Surface Ligands, Influence Bacterial Methylmercury Production. Environ. Sci. Technol. 2020, 54, 3960–3968. [Google Scholar] [CrossRef]
- Pokrovski, G.S.; Escoda, C.; Blanchard, M.; Testemale, D.; Hazemann, J.-L.; Gouy, S.; Kokh, M.A.; Boiron, M.-C.; de Parseval, F.; Aigouy, T.; et al. An Arsenic-Driven Pump for Invisible Gold in Hydrothermal Systems. Geochem. Perspect. Lett. 2021, 17, 39–44. [Google Scholar] [CrossRef]
- Pokrovski, G.S.; Desmaele, E.; Laskar, C.; Bazarkina, E.F.; Testemale, D.; Hazemann, J.-L.; Vuilleumier, R.; Seitsonen, A.P.; Ferlat, G.; Saitta, A.M. Gold Speciation in Hydrothermal Fluids Revealed by in Situ High Energy Resolution X-ray Absorption Spectroscopy. Am. Miner. J. Earth Planet. Mater. 2022, 107, 369–376. [Google Scholar] [CrossRef]
- Proux, O.; Lahera, E.; Del Net, W.; Kieffer, I.; Rovezzi, M.; Testemale, D.; Irar, M.; Thomas, S.; Aguilar-Tapia, A.; Bazarkina, E.F.; et al. High-Energy Resolution Fluorescence Detected X-ray Absorption Spectroscopy: A Powerful New Structural Tool in Environmental Biogeochemistry Sciences. J. Environ. Qual. 2017, 46, 1146–1157. [Google Scholar] [CrossRef] [PubMed] [Green Version]
- De Groot, F.M.F.; Krisch, M.H.; Vogel, J. Spectral Sharpening of the Pt L Edges by High-Resolution x-Ray Emission. Phys. Rev. B 2002, 66, 195112. [Google Scholar] [CrossRef] [Green Version]
- Singh, J.; Tromp, M.; Safonova, O.V.; Glatzel, P.; van Bokhoven, J.A. In Situ XAS with High-Energy Resolution: The Changing Structure of Platinum during the Oxidation of Carbon Monoxide. Catal. Today 2009, 145, 300–306. [Google Scholar] [CrossRef]
- Iglesias-Juez, A.; Beale, A.M.; Maaijen, K.; Weng, T.C.; Glatzel, P.; Weckhuysen, B.M. A Combined in Situ Time-Resolved UV–Vis, Raman and High-Energy Resolution X-ray Absorption Spectroscopy Study on the Deactivation Behavior of Pt and PtSn Propane Dehydrogenation Catalysts under Industrial Reaction Conditions. J. Catal. 2010, 276, 268–279. [Google Scholar] [CrossRef]
- Friebel, D.; Miller, D.J.; Nordlund, D.; Ogasawara, H.; Nilsson, A. Degradation of Bimetallic Model Electrocatalysts: An In Situ X-ray Absorption Spectroscopy Study. Angew. Chem. Int. Ed. 2011, 50, 10190–10192. [Google Scholar] [CrossRef] [Green Version]
- Friebel, D.; Miller, D.J.; O’Grady, C.P.; Anniyev, T.; Bargar, J.; Bergmann, U.; Ogasawara, H.; Wikfeldt, K.T.; Pettersson, L.G.; Nilsson, A. In Situ X-ray Probing Reveals Fingerprints of Surface Platinum Oxide. Phys. Chem. Chem. Phys. 2011, 13, 262–266. [Google Scholar] [CrossRef]
- Merte, L.R.; Behafarid, F.; Miller, D.J.; Friebel, D.; Cho, S.; Mbuga, F.; Sokaras, D.; Alonso-Mori, R.; Weng, T.-C.; Nordlund, D. Electrochemical Oxidation of Size-Selected Pt Nanoparticles Studied Using in Situ High-Energy-Resolution X-ray Absorption Spectroscopy. ACS Catal. 2012, 2, 2371–2376. [Google Scholar] [CrossRef] [Green Version]
- Qureshi, M.; Garcia-Esparza, A.T.; Jeantelot, G.; Ould-Chikh, S.; Aguilar-Tapia, A.; Hazemann, J.-L.; Basset, J.-M.; Loffreda, D.; Le Bahers, T.; Takanabe, K. Catalytic Consequences of Ultrafine Pt Clusters Supported on SrTiO3 for Photocatalytic Overall Water Splitting. J. Catal. 2019, 376, 180–190. [Google Scholar] [CrossRef]
- Batista, A.T.F.; Baaziz, W.; Taleb, A.-L.; Chaniot, J.; Moreaud, M.; Legens, C.; Aguilar-Tapia, A.; Proux, O.; Hazemann, J.-L.; Diehl, F.; et al. Atomic Scale Insight into the Formation, Size, and Location of Platinum Nanoparticles Supported on γ-Alumina. ACS Catal. 2020, 10, 4193–4204. [Google Scholar] [CrossRef]
- Maurer, F.; Jelic, J.; Wang, J.; Gänzler, A.; Dolcet, P.; Wöll, C.; Wang, Y.; Studt, F.; Casapu, M.; Grunwaldt, J.-D. Tracking the Formation, Fate and Consequence for Catalytic Activity of Pt Single Sites on CeO2. Nat. Catal. 2020, 3, 824–833. [Google Scholar] [CrossRef]
- Piccolo, L.; Afanasiev, P.; Morfin, F.; Len, T.; Dessal, C.; Rousset, J.L.; Aouine, M.; Bourgain, F.; Aguilar-Tapia, A.; Proux, O.; et al. Operando X-ray Absorption Spectroscopy Investigation of Photocatalytic Hydrogen Evolution over Ultradispersed Pt/TiO2 Catalysts. ACS Catal. 2020, 10, 12696–12705. [Google Scholar] [CrossRef]
- Chen, J.; Finfrock, Y.Z.; Wang, Z.; Sham, T.-K. High Energy Resolution Fluorescence Detection of the Pt L3,2-Edge Whitelines of Pt-Based Bimetallic Systems: Implications for the Pt 5d5/2,3/2 Density of States. J. Phys. Chem. C 2021, 125, 2327–2333. [Google Scholar] [CrossRef]
- Srinath, N.V.; Poelman, H.; Buelens, L.; Dendooven, J.; Reyniers, M.-F.; Marin, G.B.; Galvita, V.V. Behaviour of Platinum-Tin during CO2-Assisted Propane Dehydrogenation: Insights from Quick X-ray Absorption Spectroscopy. J. Catal. 2022, 408, 356–371. [Google Scholar] [CrossRef]
- Laskar, C. Impact Du Soufre Sur Le Transport Des Platinoïdes Par Les Fluides Hydrothermaux. Ph.D. Thesis, University of Toulouse III, Toulouse, France, 2022. [Google Scholar]
- Pokrovski, G.S.; Tagirov, B.R.; Schott, J.; Hazemann, J.-L.; Proux, O. A New View on Gold Speciation in Sulfur-Bearing Hydrothermal Fluids from in Situ X-ray Absorption Spectroscopy and Quantum-Chemical Modeling. Geochim. Cosmochim. Acta 2009, 73, 5406–5427. [Google Scholar] [CrossRef] [Green Version]
- Mei, Y.; Sherman, D.M.; Liu, W.; Brugger, J. Complexation of Gold in S3−-Rich Hydrothermal Fluids: Evidence from Ab-Initio Molecular Dynamics Simulations. Chem. Geol. 2013, 347, 34–42. [Google Scholar] [CrossRef]
- Pokrovski, G.S.; Dubessy, J. Stability and Abundance of the Trisulfur Radical Ion S3− in Hydrothermal Fluids. Earth Planet. Sci. Lett. 2015, 411, 298–309. [Google Scholar] [CrossRef]
- Cawthorn, R.G. Stratiform Platinum-Group Element Deposits in Layered Intrusions. In Exploration for Platinum-Group Element Deposits; Mungall, J.E., Ed.; Mineralogical Association of Canada: Québec City, QC, Canada, 2005; pp. 57–73. [Google Scholar]
- Godel, B.; Barnes, S.-J.; Maier, W.D. Platinum-Group Elements in Sulphide Minerals, Platinum-Group Minerals, and Whole-Rocks of the Merensky Reef (Bushveld Complex, South Africa): Implications for the Formation of the Reef. J. Petrol. 2007, 48, 1569–1604. [Google Scholar] [CrossRef] [Green Version]
- Barnes, S.J.; Cruden, A.R.; Arndt, N.; Saumur, B.M. The Mineral System Approach Applied to Magmatic Ni–Cu–PGE Sulphide Deposits. Ore Geol. Rev. 2016, 76, 296–316. [Google Scholar] [CrossRef] [Green Version]
- Holwell, D.A.; Adeyemi, Z.; Ward, L.A.; Smith, D.J.; Graham, S.D.; McDonald, I.; Smith, J.W. Low Temperature Alteration of Magmatic Ni-Cu-PGE Sulfides as a Source for Hydrothermal Ni and PGE Ores: A Quantitative Approach Using Automated Mineralogy. Ore Geol. Rev. 2017, 91, 718–740. [Google Scholar] [CrossRef] [Green Version]
- Schmitt, B.; Bollard, P.; Damien, A.; Garenne, A.; Bonal, L.; Gorbacheva, M. The SSHADE Partner’s Consortium. SSHADE: Solid Spectroscopy Hosting Architecture of Databases and Expertise and Its Databases. Eur. Planet. Sci. Congr. 2018, 10. [Google Scholar] [CrossRef]
- Collins, R.; Kaner, R.; Russo, P.; Wold, A.; Avignant, D. High-Pressure Phase Transformation of Platinum Sulfide. Inorg. Chem. 1979, 18, 727–729. [Google Scholar] [CrossRef]
- Dembowski, J.; Marosi, L.; Essig, M. Platinum Disulfide by XPS. Surf. Sci. Spectra 1993, 2, 133–137. [Google Scholar] [CrossRef]
- Passaretti, J.D.; Kaner, R.B.; Kershaw, R.; Wold, A. Synthesis of Poorly Crystallized Platinum Metal Dichalcogenides. Inorg. Chem. 1981, 20, 501–503. [Google Scholar] [CrossRef]
- Rau, H.; Kutty, T.R.N.; Guedes de Carvalho, J.R.F. High Temperature Saturated Vapour Pressure of Sulphur and the Estimation of Its Critical Quantities. J. Chem. Thermodyn. 1973, 5, 291–302. [Google Scholar] [CrossRef]
- Zhang, L.; Ren, Y.; Liu, X.; Han, F.; Evans-Lutterodt, K.; Wang, H.; He, Y.; Wang, J.; Zhao, Y.; Yang, W. Chain Breakage in the Supercooled Liquid—Liquid Transition and Re-Entry of the λ-Transition in Sulfur. Sci. Rep. 2018, 8, 4558. [Google Scholar] [CrossRef]
- Wickenden, A.E.; Krause, R.A. Polysulfide Chelates. II. Desulfuration of PtS152− and the Synthesis of PtS102−. Inorg. Chem. 1969, 8, 779–783. [Google Scholar] [CrossRef]
- Schmidt, M.; Hoffmann, G.G. Zum nukleophilen Abbau von Tris(pentasulfido)platinat(IV), [Pt(S5)3]2−, und Bis(pentasulfido)platinat(II),[Pt(S5)2]2−. Z. Für Anorg. Allg. Chem. 1979, 452, 112–122. [Google Scholar] [CrossRef]
- Rybak, W.K.; Cymbaluk, A.; Siczek, M.; Skonieczny, J. Crystallization-Induced Asymmetric Synthesis of Nonracemic Platinum(IV) Polysulfide Tris(Chelate) Complexes. Eur. J. Inorg. Chem. 2012, 2012, 3675–3679. [Google Scholar] [CrossRef]
- Jeong, H.; Yoon, S.; Kim, J.H.; Kwak, D.-H.; Gu, D.H.; Heo, S.H.; Kim, H.; Park, S.; Ban, H.W.; Park, J.; et al. Transition Metal-Based Thiometallates as Surface Ligands for Functionalization of All-Inorganic Nanocrystals. Chem. Mater. 2017, 29, 10510–10517. [Google Scholar] [CrossRef]
- Steudel, R.; Chivers, T. The Role of Polysulfide Dianions and Radical Anions in the Chemical, Physical and Biological Sciences, Including Sulfur-Based Batteries. Chem. Soc. Rev. 2019, 48, 3279–3319. [Google Scholar] [CrossRef]
- Jeong, H. Synthesis of Transition Metal-Based Thiometallates for Surface Functionalization of All-Inorganic Nanocrystals. Master’s Thesis, Ulsan National Institute of Science and Technology, Ulsan, Republic of Korea, 2018. [Google Scholar]
- Proux, O.; Biquard, X.; Lahera, E.; Menthonnex, J.J.; Prat, A.; Ulrich, O.; Soldo, Y.; Trvisson, P.; Kapoujyan, G.; Perroux, G.; et al. FAME A New Beamline for XRay Absorption Investigations of VeryDiluted Systems of Environmental, Material and Biological Interests. Phys. Scr. 2005, 2005, 970. [Google Scholar] [CrossRef] [Green Version]
- Hazemann, J.-L.; Proux, O.; Nassif, V.; Palancher, H.; Lahera, E.; Da Silva, C.; Braillard, A.; Testemale, D.; Diot, M.-A.; Alliot, I.; et al. High-Resolution Spectroscopy on an X-ray Absorption Beamline. J. Synchrotron Radiat. 2009, 16, 283–292. [Google Scholar] [CrossRef] [Green Version]
- Llorens, I.; Lahera, E.; Delnet, W.; Proux, O.; Braillard, A.; Hazemann, J.-L.; Prat, A.; Testemale, D.; Dermigny, Q.; Gelebart, F.; et al. High Energy Resolution Five-Crystal Spectrometer for High Quality Fluorescence and Absorption Measurements on an x-Ray Absorption Spectroscopy Beamline. Rev. Sci. Instrum. 2012, 83, 063104. [Google Scholar] [CrossRef] [Green Version]
- Testemale, D.; Argoud, R.; Geaymond, O.; Hazemann, J.-L. High Pressure/High Temperature Cell for X-ray Absorption and Scattering Techniques. Rev. Sci. Instrum. 2005, 76, 043905. [Google Scholar] [CrossRef]
- Pokrovski, G.S.; Borisova, A.Y.; Roux, J.; Hazemann, J.-L.; Petdang, A.; Tella, M.; Testemale, D. Antimony Speciation in Saline Hydrothermal Fluids: A Combined X-ray Absorption Fine Structure Spectroscopy and Solubility Study. Geochim. Cosmochim. Acta 2006, 70, 4196–4214. [Google Scholar] [CrossRef]
- Ravel, B.; Newville, M. ATHENA, ARTEMIS, HEPHAESTUS: Data Analysis for X-ray Absorption Spectroscopy Using IFEFFIT. J. Synchrotron Radiat. 2005, 12, 537–541. [Google Scholar] [CrossRef]
- Newville, M. IFEFFIT: Interactive XAFS Analysis and FEFF Fitting. J. Synchrotron Radiat. 2001, 8, 322–324. [Google Scholar] [CrossRef]
- Pokrovski, G.S.; Roux, J.; Hazemann, J.-L.; Testemale, D. An X-ray Absorption Spectroscopy Study of Argutite Solubility and Aqueous Ge(IV) Speciation in Hydrothermal Fluids to 500 °C and 400 Bar. Chem. Geol. 2005, 217, 127–145. [Google Scholar] [CrossRef] [Green Version]
- Kelly, S.D.; Hesterberg, D.; Ravel, B. Analysis of Soils and Minerals Using X-ray Absorption Spectroscopy. Methods Soil Anal. Part 5 Miner. Methods 2008, 5, 387–464. [Google Scholar]
- Zabinsky, S.I.; Rehr, J.J.; Ankudinov, A.; Albers, R.C.; Eller, M.J. Multiple-Scattering Calculations of X-ray-Absorption Spectra. Phys. Rev. B 1995, 52, 2995. [Google Scholar] [CrossRef] [PubMed]
- Hall, M.D.; Foran, G.J.; Zhang, M.; Beale, P.J.; Hambley, T.W. XANES Determination of the Platinum Oxidation State Distribution in Cancer Cells Treated with Platinum(IV) Anticancer Agents. J. Am. Chem. Soc. 2003, 125, 7524–7525. [Google Scholar] [CrossRef]
- Grønvold, F.; Haraldsen, H.; Kjekshus, A. On the Sulfides, Selenides and Tellurides of Platinum. Acta Chem. Scand 1960, 14, 1879–1893. [Google Scholar] [CrossRef] [Green Version]
- Tanley, S.W.M.; Schreurs, A.M.M.; Kroon-Batenburg, L.M.J.; Meredith, J.; Prendergast, R.; Walsh, D.; Bryant, P.; Levy, C.; Helliwell, J.R. Structural Studies of the Effect That Dimethyl Sulfoxide (DMSO) Has on Cisplatin and Carboplatin Binding to Histidine in a Protein. Acta Crystallogr. D Biol. Crystallogr. 2012, 68, 601–612. [Google Scholar] [CrossRef]
- Williams, R.J.; Dillin, D.R.; Milligan, W.O. Structure Refinement of Potassium Chloroplatinate by Powder and Single-Crystal Methods. Acta Crystallogr. B 1973, 29, 1369–1372. [Google Scholar] [CrossRef]
- Ohba, S.; Sato, S.; Saito, Y.; Ohshima, K.-I.; Harada, J. Electron-Density Distribution in Crystals of Potassium Tetrachloroplatinate(LI) and Influence of X-ray Diffuse Scattering. Acta Crystallogr. B Struct. Sci. 1983, 39, 49–53. [Google Scholar] [CrossRef]
- Furuseth, S.; Selte, K.; Kjekshus, A. Redetermined Crystal Structures of NiTe2 PdTe2 PtS2 PtSe2 and PtTe2. Acta Chem. Scand 1965, 19, 257. [Google Scholar] [CrossRef]
- Rao, U.V. (Ed.) Platinum Group Metals and Compounds; Advances in Chemistry; American Chemical Society: Washington, DC, USA, 1971; Volume 98, ISBN 978-0-8412-0135-4. [Google Scholar]
- Ochi, M.; Yamada, I.; Ohgushi, K.; Kusano, Y.; Mizumaki, M.; Takahashi, R.; Yagi, S.; Nishiyama, N.; Inoue, T.; Irifune, T. B -Site Deficiencies in A -Site-Ordered Perovskite LaCu3Pt3.75O12. Inorg. Chem. 2013, 52, 3985–3989. [Google Scholar] [CrossRef] [PubMed]
- Milburn, G.H.W.; Truter, M.R. The Crystal Structures of Cis- and Trans-Dichlorodiammineplatinum(II). J. Chem. Soc. Inorg. Phys. Theor. 1966, 1609–1616. [Google Scholar] [CrossRef]
- Jones, P.E.; Katz, L. The Crystal Structure of Ammonium Tris(Pentasulfido)Platinum(IV) Dihydrate. Acta Crystallogr. B 1969, 25, 745–753. [Google Scholar] [CrossRef] [Green Version]
- Pokrovsky, O.S.; Pokrovski, G.S.; Feurtet-Mazel, A. A Structural Study of Cadmium Interaction with Aquatic Microorganisms. Environ. Sci. Technol. 2008, 42, 5527–5533. [Google Scholar] [CrossRef]
- Teo, B.K. EXAFS: Basic Principles and Data Analysis; Springer Science & Business Media: Berlin/Heidelberg, Germany, 1986; Volume 9. [Google Scholar]
- Munoz, M.; Argoul, P.; Farges, F. Continuous Cauchy Wavelet Transform Analyses of EXAFS Spectra: A Qualitative Approach. Am. Miner. 2003, 88, 694–700. [Google Scholar] [CrossRef] [Green Version]
- Zhihang, Y.; Liu, P. WtEXAFS [Code]. 2022. Available online: https://Github.Com/Himmelspol/WtEXAFS (accessed on 15 October 2022).
- Pryadchenko, V.V.; Srabionyan, V.V.; Avakyan, L.A.; van Bokhoven, J.A.; Bugaev, L.A. Electronic Structure of Pt and Au Compounds Measured by X-ray Emission and X-ray Absorption Spectroscopies. J. Phys. Chem. C 2012, 116, 25790–25796. [Google Scholar] [CrossRef]
- Laskar, C.; Bazarkina, E.F.; Kokh, M.A.; Hazemann, J.-L.; Vuilleumier, R.; Desmaele, E.; Pokrovski, G.S. Stability and Structure of Platinum Sulfide Complexes in Hydrothermal Fluids. Geochim. Cosmochim. Acta 2022, 336, 407–422. [Google Scholar] [CrossRef]
- Asakura, H.; Kawamura, N.; Mizumaki, M.; Nitta, K.; Ishii, K.; Hosokawa, S.; Teramura, K.; Tanaka, T. A Feasibility Study of “Range-Extended” EXAFS Measurement at the Pt L3 -Edge of Pt/Al2O3 in the Presence of Au2O3. J. Anal. Atomic Spectrom. 2018, 33, 84–89. [Google Scholar] [CrossRef]
- Kothari, M.; Jeon, Y.; Miller, D.N.; Pascui, A.E.; Kilmartin, J.; Wails, D.; Ramos, S.; Chadwick, A.; Irvine, J.T.S. Platinum Incorporation into Titanate Perovskites to Deliver Emergent Active and Stable Platinum Nanoparticles. Nat. Chem. 2021, 13, 677–682. [Google Scholar] [CrossRef] [PubMed]
- Roy, M.; Gurman, S.J.; van Dorssen, G. The Amplitude Reduction Factor in EXAFS. J. Phys. IV 1997, 7, C2-151–C2-152. [Google Scholar] [CrossRef]
- Kelly, S.D.; Bare, S.R.; Greenlay, N.; Azevedo, G.; Balasubramanian, M.; Barton, D.; Chattopadhyay, S.; Fakra, S.; Johannessen, B.; Newville, M.; et al. Comparison of EXAFS Foil Spectra from around the World. J. Phys. Conf. Ser. 2009, 190, 012032. [Google Scholar] [CrossRef]
- Glatzel, P.; de Groot, F.M.F.; Manoilova, O.; Grandjean, D.; Weckhuysen, B.M.; Bergmann, U.; Barrea, R. Range-Extended EXAFS at the L Edge of Rare Earths Using High-Energy-Resolution Fluorescence Detection: A Study of La in LaOCl. Phys. Rev. B 2005, 72, 014117. [Google Scholar] [CrossRef] [Green Version]
- Liu, W.; Etschmann, B.; Mei, Y.; Guan, Q.; Testemale, D.; Brugger, J. The Role of Sulfur in Molybdenum Transport in Hydrothermal Fluids: Insight from in Situ Synchrotron XAS Experiments and Molecular Dynamics Simulations. Geochim. Cosmochim. Acta 2020, 290, 162–179. [Google Scholar] [CrossRef]


| Solid | Origin | Beamline Used | Mode | Concentrations, wt% Pt |
|---|---|---|---|---|
| Pt metal | GoodFellow (10 µm thickness, 99.95%) | FAME FAME-UHD | TR TR | >99.9 >99.9 |
| PtS-h PtS-s | This study (hydrothermal) This study (solid-state) | FAME-UHD FAME | HR + TR TR | 1.1 3.6 |
| PtS2-s PtS2-c * | This study (solid-state) ThermoFisher (not pure) | FAME FAME-UHD | TR HR + TR | 3.5 1.5 |
| (NH4)2PtIV(S5)3 | This study | FAME-UHD | HR + TR | 1.4 |
| K2PtCl4-a | ThermoFisher (99.9%) | FAME-UHD | HR + TR | 0.9 |
| K2PtCl4-b | ThermoFisher (99.9%) | FAME | TR | 3.1 |
| K2PtCl4 aq | This study | FAME | NR + TR | 0.3 |
| K2PtCl6-a | ThermoFisher | FAME-UHD | HR + TR | 0.9 |
| K2PtCl6-b | ThermoFisher | FAME | TR | 3.0 |
| H2PtCl6 aq | This study | FAME | NR + TR | 0.1 |
| C6H12N2O4Pt | Cayman Chemical (≥95%) | FAME-UHD | HR + TR | 1.1 |
| PtO2-a | ThermoFisher (99.95%) | FAME-UHD | HR + TR | 1.1 |
| PtO2-b | ThermoFisher (99.95%) | FAME | TR | 3.7 |
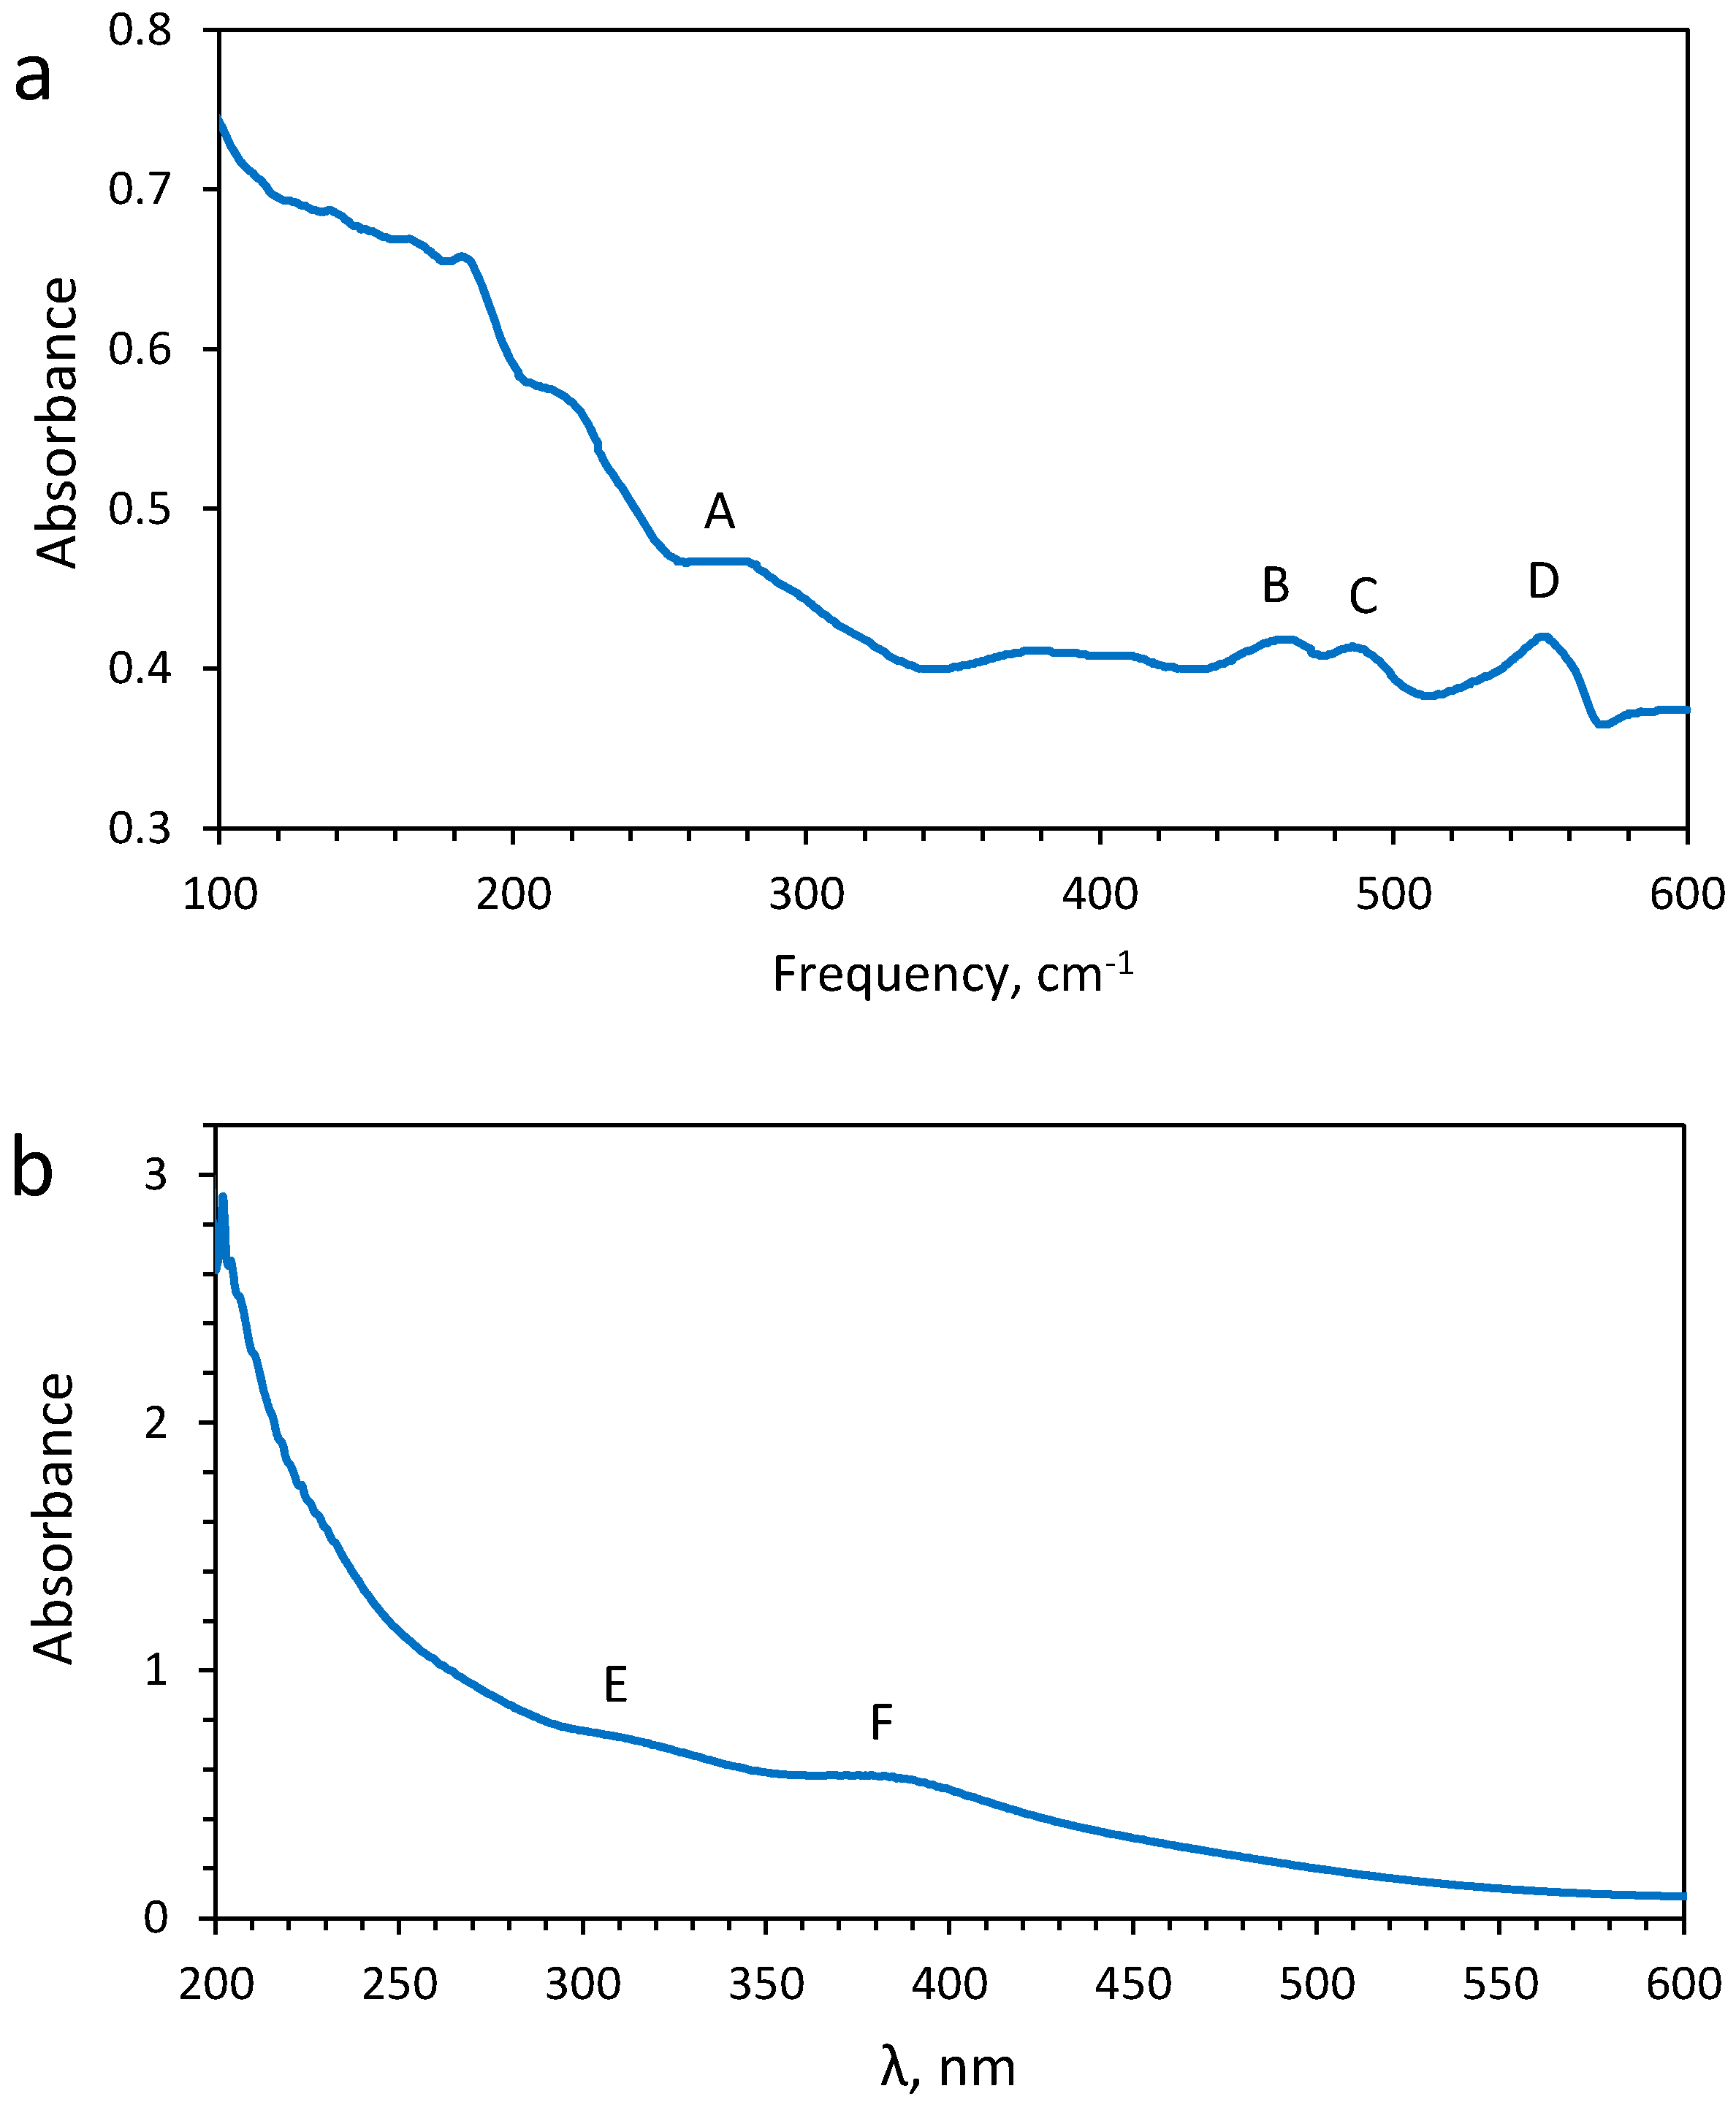
| Infrared | Frequency, cm−1 | ||||
| 278 | 461 w | 487 w | 551 s | This study | |
| 286 s 294 | 450 w | 490 w | 568 b | [65] | |
| UV-visible | Wavelength, nm | ||||
| <200 | 290 | 385 | This study | ||
| <190 | 290 | 390 | [65] | ||
| EXAFS Fit | Crystallographic Value a | ||||||||||
|---|---|---|---|---|---|---|---|---|---|---|---|
| Atom | N | R, Å | σ2 × 10³, Å−2 | Δe, eV | R-Factor × 103 | S02 | R-Range, Å | k-Range, Å−1 | Number of Scans | Mode | R, Å |
| Pt metal, FAME | |||||||||||
| Pt | 12 | 2.762 (4) | 6 (1) b | 8 (1) | 18 | 0.75 (6) | 1.2–6.0 | 3.0–12.0 | 7 | TR | 2.773 |
| Pt | 6 | 3.89 (2) | 10 (5) b | 3.922 | |||||||
| Pt | 24 | 4.8 (1) | 9 (2) b | 4.803 | |||||||
| Ptfs | 24 | 5.525 d | 24 (10) | ||||||||
| Ptdfs | 12 | 5.525 d | 13 (3) | ||||||||
| Ptot | 96 | 5.14 (4) | 13 (10) | ||||||||
| Pt metal, FAME-UHD | |||||||||||
| Pt | 12 | 2.767 (3) | 4.3 (6) b | 8 (1) | 9 | 0.79 (5) | 1.2–6.0 | 3.0–12.0 | 13 | TR | 2.773 |
| Pt | 6 | 3.91 (1) | 6 (2) b | 3.922 | |||||||
| Pt | 24 | 4.807 (7) | 7 (1) b | 4.803 | |||||||
| Ptfs | 24 | 5.525 d | 22 (6) | ||||||||
| Ptdfs | 12 | 5.525 d | 10 (2) | ||||||||
| Ptot | 96 | 5.14 (3) | 14 (10) | ||||||||
| PtS-h, FAME-UHD | |||||||||||
| S | 4 | 2.301 (8) | 4 (1) | 6 (1) | 33 | 1.06 (12) | 1.2–5.0 | 3.0–13.0 | 3 | HR | 2.312 |
| Pt | 4 | 3.47 (3) | 9 (5) | 3.470 | |||||||
| Pt | 8 | 3.89 (4) | 9 (5) | 3.918 | |||||||
| S | 8 | 4.10 (3) | 8 (7) | 4.169 | |||||||
| Sfwa | 4 | 4.61 c | 7 d | ||||||||
| PtS-h, FAME-UHD | |||||||||||
| S | 4 | 2.303 (7) | 3 (1) | 10 (1) | 29 | 0.85 (8) | 1.2–5.0 | 3.0–13.0 | 3 | TR | 2.312 |
| Pt | 4 | 3.47 (3) | 8 (5) | 3.470 | |||||||
| Pt | 8 | 3.93 (3) | 9 (5) | 3.918 | |||||||
| S | 8 | 4.12 (4) | 14 (10) | 4.169 | |||||||
| Sfwa | 4 | 4.61 c | 6 d | ||||||||
| PtS-s, FAME | |||||||||||
| S | 4 | 2.310 (4) | 2.1 (8) | 7 (1) | 15 | 0.72 (4) | 1.2–5.0 | 3.0–13.0 | 2 | TR | 2.312 |
| Pt | 4 | 3.47 (2) | 8 (3) | 3.470 | |||||||
| Pt | 8 | 3.92 (2) | 7 (3) | 3.918 | |||||||
| S | 8 | 4.13 (3) | 8 (6) | 4.169 | |||||||
| Sfwa | 4 | 4.62 c | 12 (10) | ||||||||
| PtS2-s, FAME | |||||||||||
| S | 6 | 2.385 (6) | 2.4 (1.2) | 9 (1) | 28 | 0.77 (6) | 1.2–5.0 | 3.0–13.0 | 2 | TR | 2.344 |
| Pt | 6 | 3.53 (1) | 3 (2) | 3.543 | |||||||
| S | 12 | 4.24 (2) | 9 (5) | 4.324 | |||||||
| Sfwa | 6 | 4.77 c | 7 (7) | ||||||||
| K2PtCl4-a, FAME-UHD | |||||||||||
| Cl | 4 | 2.301 (7) | 3 (1) | 7 (1) | 20 | 1.03 (10) | 1.2–5.0 | 3.0–11.0 | 2 | HR | 2.308 |
| K | 8 | 4.06 (4) | 6 (6) | 4.078 | |||||||
| Clfwa | 4 | 4.61 c | 5 (4) | ||||||||
| K2PtCl4-a, FAME-UHD | |||||||||||
| Cl | 4 | 2.293 (7) | 1 (1) | 9 (1) | 42 | 0.8 (1) | 1.2–5.0 | 3.0–11.0 | 2 | TR | 2.308 |
| K | 8 | 4.08 (3) | 3 (1) | 4.078 | |||||||
| Clfwa | 4 | 4.61 c | 2 d | ||||||||
| K2PtCl4-b, FAME | |||||||||||
| Cl | 4 | 2.303 (5) | 2 (1) | 8 (1) | 15 | 0.77 (1) | 1.2–5.0 | 3.0–11.0 | 1 | TR | 2.308 |
| K | 8 | 4.09 (4) | 23 (10) | 4.078 | |||||||
| Clfwa | 4 | 4.61 c | 5 (4) | ||||||||
| K2PtCl4 aq, FAME | |||||||||||
| Cl | 4 | 2.304 (5) | 1 (1) | 8 (1) | 20 | 0.68 (5) | 1.2–5.0 | 3.0–11.0 | 1 | NR | 2.308 |
| Clfwa | 4 | 4.61 c | 17 d | ||||||||
| K2PtCl4 aq, FAME | |||||||||||
| Cl | 4 | 2.305 (6) | 14 (14) | 8 (1) | 30 | 0.79 (7) | 1.2–5.0 | 3.0–11.0 | 1 | TR | 2.308 |
| Clfwa | 4 | 4.61 c | 28 d | ||||||||
| K2PtCl6-a, FAME-UHD | |||||||||||
| Cl | 6 | 2.311 (8) | 3 (1) | 6 (1) | 23 | 1.0 (1) | 1.2–5.0 | 3.0–11.0 | 2 | HR | 2.323 |
| K | 8 | 4.08 (6) | 20 (10) | 4.222 | |||||||
| Clfwa | 6 | 4.62 c | 7 (7) | ||||||||
| K2PtCl6-a, FAME-UHD | |||||||||||
| Cl | 6 | 2.30 (1) | 17 (15) | 10 (2) | 58 | 0.8 (1) | 1.2–5.0 | 3.0–11.0 | 2 | TR | 2.323 |
| K | 8 | 4.2 (2) | 40 (40) | 4.222 | |||||||
| Clfwa | 6 | 4.61 c | 33 d | ||||||||
| K2PtCl6-b, FAME | |||||||||||
| Cl | 6 | 2.312 (6) | 1.5 (1.0) | 8 (1) | 16 | 0.78 (7) | 1.2–5.0 | 3.0–11.0 | 1 | TR | 2.323 |
| K | 8 | 4.13 (6) | 20 (15) | 4.222 | |||||||
| Clfwa | 6 | 4.62 c | 7 (7) | ||||||||
| H2PtCl6 aq, FAME | |||||||||||
| Cl | 6 | 2.314 (6) | 1.2 (1.0) | 8 (1) | 20 | 0.71 (6) | 1.2–5.0 | 3.0–11.0 | 2 | NR | 2.323 |
| Clfwa | 6 | 4.63 c | 2 d | ||||||||
| H2PtCl6 aq, FAME | |||||||||||
| Cl | 6 | 2.315 (7) | 1.2 e | 9 (1) | 44 | 0.78 (4) | 1.2–5.0 | 3.0–11.0 | 2 | TR | 2.323 |
| Clfwa | 6 | 4.63 c | 2.4 d | ||||||||
| C6H12N2O4Pt, FAME-UHD | |||||||||||
| N | 2 | 2.03 (2) | 2 (1) | 8 (3) | 27 | 1.0 f | 1.2–2.5 | 3.0–13.0 | 1 | HR | 1.995 g |
| O | 2 | 2.36 (8) | 23 (11) | 2.317 g | |||||||
| PtO2-a, FAME-UHD | |||||||||||
| O | 6 | 2.019 (6) | 2 (1) | 9 (1) | 23 | 0.88 (6) | 1.2–5.0 | 3.0–13.0 | 1 | HR | 2.070 |
| Pt | 6 | 3.104 (6) | 2.4 (1.2) | 3.100 | |||||||
| O | 12 | 3.68 (3) | 9 (6) | 3.598 | |||||||
| Ofwa | 6 | 4.04 c | 5 d | ||||||||
| PtO2-a, FAME-UHD | |||||||||||
| O | 6 | 2.010 (6) | 1 (1) | 12 (1) | 27 | 0.74 (5) | 1.2–5.0 | 3.0–13.0 | 1 | TR | 2.070 |
| Pt | 6 | 3.106 (6) | 1.0 (8) | 3.100 | |||||||
| O | 12 | 3.82 (5) | 24 (15) | 3.598 | |||||||
| Ofwa | 6 | 4.02 c | 3 d | ||||||||
| PtO2-b, FAME | |||||||||||
| O | 6 | 2.012 (5) | 2 (1) | 9 (1) | 24 | 0.76 (5) | 1.2–5.0 | 3.0–13.0 | 2 | TR | 2.070 |
| Pt | 6 | 3.100 (5) | 3 (1) | 3.100 | |||||||
| O | 12 | 3.67 (5) | 10 (8) | 3.598 | |||||||
| Ofwa | 6 | 4.02 c | 4 d | ||||||||
| EXAFS Fit | Crystallographic Value a | ||||||||
|---|---|---|---|---|---|---|---|---|---|
| Atom | Mode | S02 | N | R, Å | σ2 × 10³, Å−2 | Δe, eV | R-Factor × 103 | N | R, Å |
| (NH4)2PtIV(S5)3, FAME-UHD | |||||||||
| S1 b | HR | 0.99 | 5.7 (4) | 2.370 (5) | 6 (1) | 8 (1) | 12 | 6 | 2.358–2.436 |
| S2 | 7 (3) | 3.56 (2) | 20 (10) | 6 | 3.39–3.81 | ||||
| SMS | 6 (3) | 4.78 (2) | 10 (10) | 6 | |||||
| S1 b | TR | 0.76 | 5.8 (3) | 2.366 (4) | 4 (1) | 9 (1) | 15 | 6 | 2.358–2.436 |
| S2 | 7 (2) | 3.56 (2) | 16 (9) | 6 | 3.39–3.81 | ||||
| SMS | 5 (1) | 4.76 (2) | 8 c | 6 | |||||
Publisher’s Note: MDPI stays neutral with regard to jurisdictional claims in published maps and institutional affiliations. |
© 2022 by the authors. Licensee MDPI, Basel, Switzerland. This article is an open access article distributed under the terms and conditions of the Creative Commons Attribution (CC BY) license (https://creativecommons.org/licenses/by/4.0/).
Share and Cite
Laskar, C.; Bazarkina, E.F.; Kokh, M.A.; Hazemann, J.-L.; Foulon, S.; Leynaud, O.; Desmaele, E.; Pokrovski, G.S. Exploring Platinum Speciation with X-ray Absorption Spectroscopy under High-Energy Resolution Fluorescence Detection Mode. Minerals 2022, 12, 1602. https://doi.org/10.3390/min12121602
Laskar C, Bazarkina EF, Kokh MA, Hazemann J-L, Foulon S, Leynaud O, Desmaele E, Pokrovski GS. Exploring Platinum Speciation with X-ray Absorption Spectroscopy under High-Energy Resolution Fluorescence Detection Mode. Minerals. 2022; 12(12):1602. https://doi.org/10.3390/min12121602
Chicago/Turabian StyleLaskar, Clément, Elena F. Bazarkina, Maria A. Kokh, Jean-Louis Hazemann, Stéphane Foulon, Olivier Leynaud, Elsa Desmaele, and Gleb S. Pokrovski. 2022. "Exploring Platinum Speciation with X-ray Absorption Spectroscopy under High-Energy Resolution Fluorescence Detection Mode" Minerals 12, no. 12: 1602. https://doi.org/10.3390/min12121602